for the year
Consolidatedfinancial statements
Selena Oil & Gas Holding ABCompany registration number 556643-6613
ended 31 December 2015
2
TABLE OF CONTENTS
Information on the Company 3
Director’s Report 5
Consolidated Statement of Financial Position as of 31 December 2015 9
Consolidated Income Statement for year ended 31 December 2015 10
Consolidated Statement of Comprehensive Income for year ended 31 December 2015 10
Consolidated Statement of Changes in Equity for year ended 31 December 2015 11
Consolidated Statement of Cash Flows for year ended 31 December 2015 12
Notes to Consolidated Financial Statements 13
Parent Company Statement of Financial Position as of 31 December 2015 34
Parent Company Statement of Comprehensive Income for year ended 31 December 2015 35
Parent Company Statement of Changes in Equity for year ended 31 December 2015 36
Parent Company Statement of Cash Flows for year ended 31 December 2015 37
Notes to Parent Company Financial Statements 38
Confirmation by the Board of Directors 44
Independent Auditor’s Report 45
3
INFORMATION ON THE COMPANY
Background information
Selena Oil & Gas Holding AB (publ) (“SOGH”, “Parent” or the “Company”,
and together with its subsidiaries the “Group”) is an independent
Swedish oil and gas holding company with proved and producing
assets located in the Russian Federation. The Group is engaged in
the exploration and production of oil in the Volga-Ural region of
the Russian Federation, including in Perm. The Volga-Ural region
has a well-developed infrastructure as well as a high concentration
of heavy industry. Several major oil and gas pipelines pass through
the region. 2,5 % of all Russian oil production originates from the
Perm Region. The Volga-Ural region is located in the European part
of Russia.
The Group was formed in H2 2010 with the purpose to consolidate
various oil and gas assets in the Volga-Ural region of the Russian
Federation, more specifically in Perm region.
The Group acquired its first energy assets in November 2010.
Subsequently, Selena Oil & Gas AB through the reverse acquisition
acquired a NASDAQ OMX First North listed company Emitor Holding
AB (publ), subsequently renamed to Selena Oil & Gas Holding AB
(publ), currently a legal parent company of the Group. The operations
of the Group involve the exploration and extraction of oil. The history
of the Group’s subsidiaries dates back to 1997, and it started oil
production in 2000. In 2011 the Group acquired Russian companies
OOO Georesurs and OOO KRT-OilGasTrans (renamed to OOO Selena-
Oil), together with its subsidiaries, all located in Perm region of
Russia. In 2013 oil production was temporarily discontinued due to
reorganization and was re-started again in Q2 2014.
The reporting year of the Company is 1 January 2015 – 31 December
2015.
Parent company information
Selena Oil & Gas Holding AB (publ) registration number is 556643-
6613 and the legal / postal address of the company is P.O. Box 7614,
103 94 Stockholm, Sweden.
The Swedish parent company Selena Oil & Gas Holding AB (publ)
is a holding company without significant operations. It supports
the subsidiary companies with financing and pursues the Group’s
strategy in terms of new acquisitions and M&A initiatives as well
as has the corporate headquarter and investor relations function.
Therefore, the parent had no income in 2015.
Board of Directors and CEO
Lars Bergström, Chairman of the Board of Directors
Mr. Lars Bergström has more than 20 years of experience working in
Russia. After his studies at the Stockholm School of Economics, he
joined the Swedish Ministry of Foreign Affairs where he served as a
Vice Consul in Leningrad in 1991 and as First Secretary in Stockholm
1992-93. In 1993, he was recruited by Harvard University to act as
advisor to the Government of Russia. In 1995 he established the
Russian investment banking operations of the Dutch bank ABN
Amro, and acted as its CEO until 1999 when he joined Swedish bank
SEB Enskilda to establish and manage its Russian operations. In 2006,
he joined Carnegie Investment Bank in Stockholm, to manage its
Russia/CIS related business. Mr Lars Bergström, is also in his capacity
as Board Member of the Swedish Camber of Commerce for Russia
and CIS, actively involved in promoting and facilitating trade and
investments between Scandinavia and Russia.
Jürgen Lamp, Member of the Board of Directors
Mr. Lamp (born in 1971) is an Estonian national, and holds M.Sc. in
Economics. His early work experience includes KPMG Estonia and
McKinsey’s Scandinavian office. In 1996 Mr. Lamp was invited to
join the Management Team of the Union Bank of Estonia. Mr. Lamp
started there as a Marketing Director moving on to become Head of
Strategy and Organization in 1998 and Head of Asset Management,
Life Insurance and Private Banking in 2000. He had a key role in
modernizing the bank and developing it into the 2nd largest bank in
the Baltics after Hansabank. In 2002 Union Bank of Estonia was sold
to one of the largest Swedish banking groups SEB.
Indrek Rahumaa, Member of the Board of Directors
Mr. Rahumaa (born in 1972) is an Estonian national. In 1995 Mr.
Rahumaa graduated from the Stockholm School of Economics. Mr.
Rahumaa was a founding member and a partner of Baltic Cresco
Investment Group AS, a founding member of Tallinn Stock Exchange
and served as the CFO for the Estonian national air carrier Estonian
Air. Mr. Rahumaa is the managing partner and chairman of the board
of the Alta Capital Partners, a Baltic and CEE investment group. For
seven years, Mr. Rahumaa has served as a member of the Listing
Committee of the OMX Tallinn Stock Exchange and has served on
the boards of Mieszko and Silvano Fashion Group, companies listed
on Tallinn and Warsaw stock exchanges.
4
INFORMATION ON THE COMPANY
Per Olof Sjöstedt, Member of the Board of Directors, member
independent from the management and major shareholders
Per Olof Sjöstedt (born 1953) is an experienced corporate manager.
Mr Sjöstedt graduated from the Royal Institute of Technology
(Stockholm) with a Master’s degree in electrical engineering and
Stockholm University with a Bachelor’s degree in Politics and
Russian language. Mr Sjöstedt joined Ericsson Group in 1978 where
he worked for 16 years (last position was the president of Ericsson
Russia) before he started to lead Emerson Electric (Moscow) in 2002
as the general director. In 2005 Mr Sjöstedt joined TeliaSonera where
he held the position of VP of Russian operations and in 2005 he was
also was elected as the board member of ZAO Megafon (Moscow). In
2008 Mr Sjöstedt continued to work as the Strategy Director at ZAO
MegaFon (Moscow).
Paul Waern, Member of the Board of Directors, member
independent from the management and major shareholders
(holding 1,654,560 (3.18%) shares in the Company as of 31
December 2015)
Mr. Paul Waern (born 1950, MSC in Mining) is an experienced oil
and gas engineer. Mr. Waern has served more than 30 years in the
international oil and gas industry. The addition of Mr. Waern as an
investor in Selena will add significant industry expertise to the
Company.
Magnus Stuart, CEO
Mr. Magnus Stuart (born 1954, MSC in Metallurgy and – MBA of
Stockholm School of Economics) is an experienced corporate
governor. His early work experience includes international
management positions in Scania Group, Swedish Match and as
manager and management consultant in Indevo. In 1997 Mr. Stuart
was invited to join Investment AB Öresund as CEO of Ven Capital
AB with focus on VC investments. Between 2000-2002 he led a
subsidiary of AB Custos with focus on VC investments. From 2004
and onwards Mr Stuart operates as an independent financial advisor,
turn-around CEO and investor. He has served as advisor to Baltic Sea
Foundation since 2004. Between 2008 and 2012, Mr Stuart served
as CEO of Ginger Oil AB, a junior upstream oil & gas company with
operations in USA.
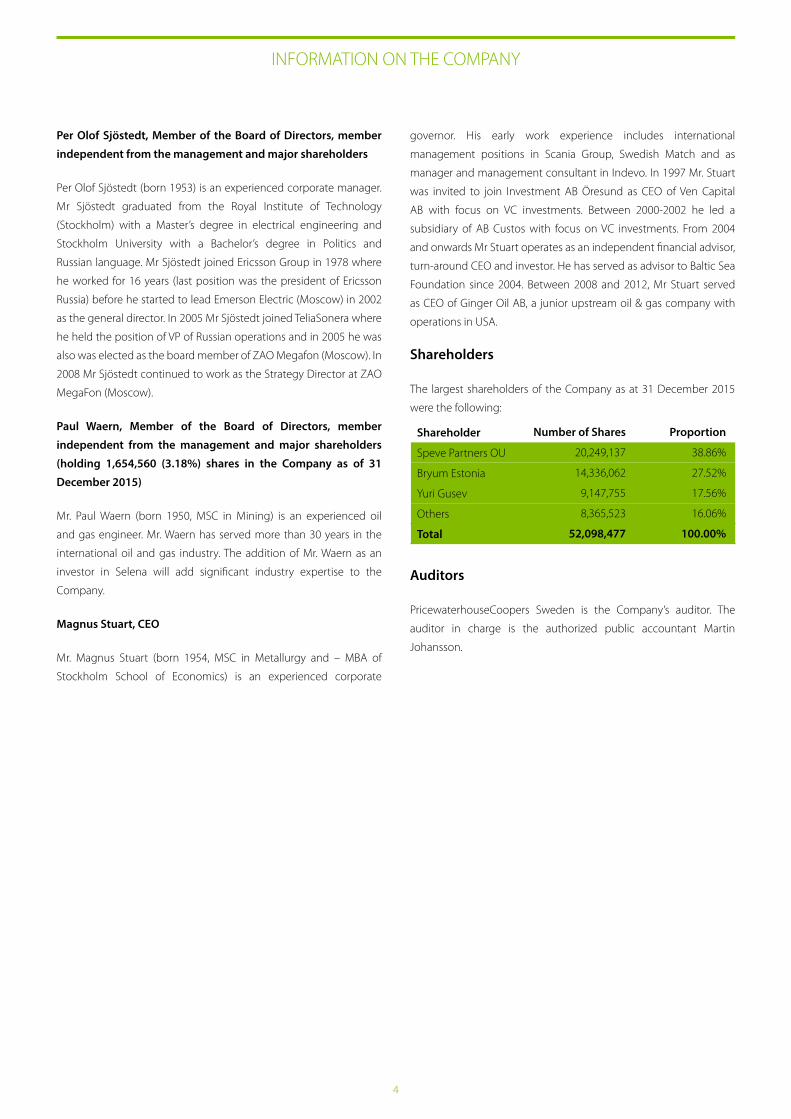
Shareholders
The largest shareholders of the Company as at 31 December 2015
were the following:
Auditors
PricewaterhouseCoopers Sweden is the Company’s auditor. The
auditor in charge is the authorized public accountant Martin
Johansson.
Shareholder
Speve Partners OU
Bryum Estonia
Yuri Gusev
Others
Total
Number of Shares
20,249,137
14,336,062
9,147,755
8,365,523
52,098,477
Proportion
38.86%
27.52%
17.56%
16.06%
100.00%
DIRECTORS’ REPORT
5
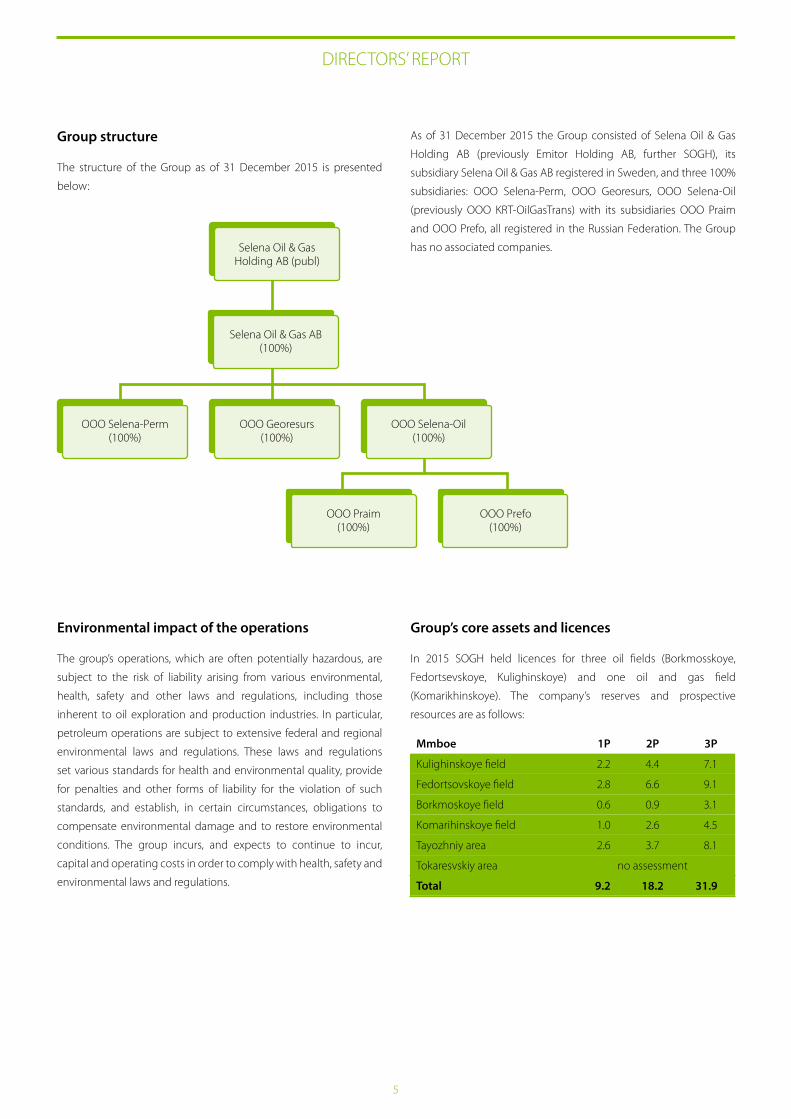
Group structure
The structure of the Group as of 31 December 2015 is presented
below:
As of 31 December 2015 the Group consisted of Selena Oil & Gas
Holding AB (previously Emitor Holding AB, further SOGH), its
subsidiary Selena Oil & Gas AB registered in Sweden, and three 100%
subsidiaries: OOO Selena-Perm, OOO Georesurs, OOO Selena-Oil
(previously OOO KRT-OilGasTrans) with its subsidiaries OOO Praim
and OOO Prefo, all registered in the Russian Federation. The Group
has no associated companies.
OOO Georesurs (100%)
OOO Selena-Perm(100%)
Selena Oil & Gas AB (100%)
Selena Oil & Gas Holding AB (publ)
OOO Selena-Oil(100%)
OOO Praim (100%)
OOO Prefo(100%)
Environmental impact of the operations
The group’s operations, which are often potentially hazardous, are
subject to the risk of liability arising from various environmental,
health, safety and other laws and regulations, including those
inherent to oil exploration and production industries. In particular,
petroleum operations are subject to extensive federal and regional
environmental laws and regulations. These laws and regulations
set various standards for health and environmental quality, provide
for penalties and other forms of liability for the violation of such
standards, and establish, in certain circumstances, obligations to
compensate environmental damage and to restore environmental
conditions. The group incurs, and expects to continue to incur,
capital and operating costs in order to comply with health, safety and
environmental laws and regulations.
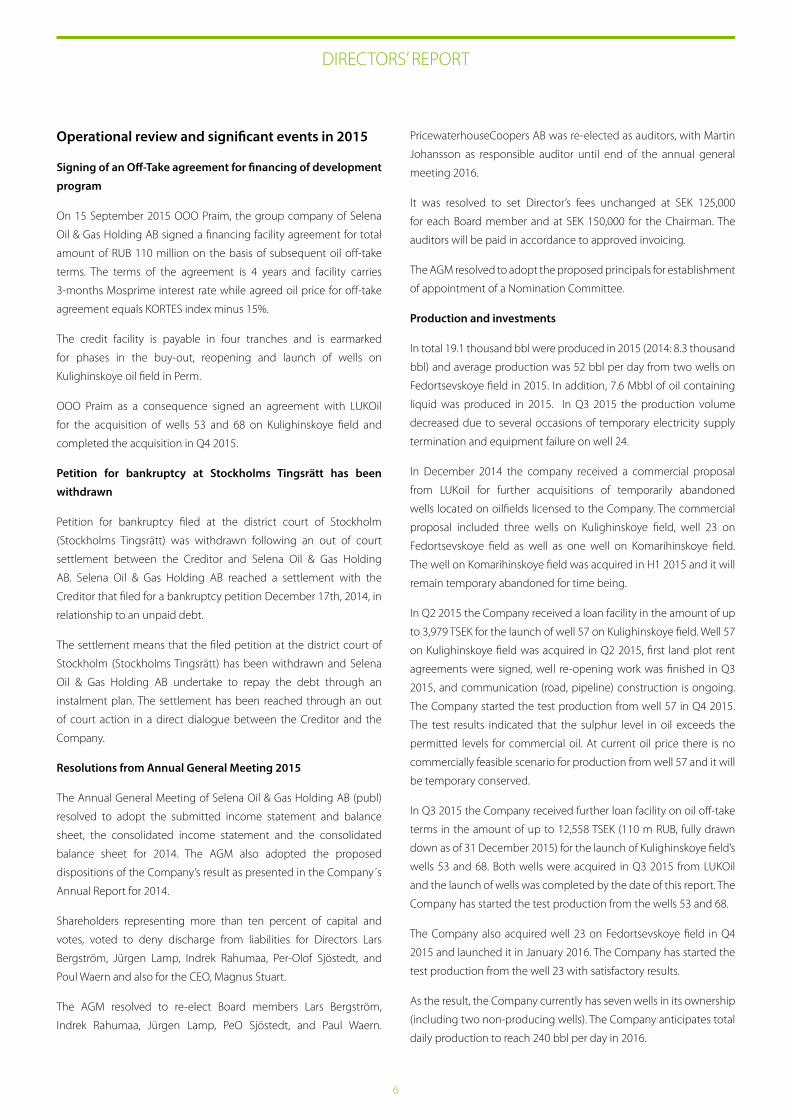
Group’s core assets and licences
In 2015 SOGH held licences for three oil fields (Borkmosskoye,
Fedortsevskoye, Kulighinskoye) and one oil and gas field
(Komarikhinskoye). The company’s reserves and prospective
resources are as follows:
Mmboe
Kulighinskoye field
Fedortsovskoye field
Borkmoskoye field
Komarihinskoye field
Tayozhniy area
Tokaresvskiy area
Total
1P
2.2
2.8
0.6
1.0
2.6
9.2
2P
4.4
6.6
0.9
2.6
3.7
no assessment
18.2
3P
7.1
9.1
3.1
4.5
8.1
31.9
DIRECTORS’ REPORT
Operational review and significant events in 2015
Signing of an Off-Take agreement for financing of development
program
On 15 September 2015 OOO Praim, the group company of Selena
Oil & Gas Holding AB signed a financing facility agreement for total
amount of RUB 110 million on the basis of subsequent oil off-take
terms. The terms of the agreement is 4 years and facility carries
3-months Mosprime interest rate while agreed oil price for off-take
agreement equals KORTES index minus 15%.
The credit facility is payable in four tranches and is earmarked
for phases in the buy-out, reopening and launch of wells on
Kulighinskoye oil field in Perm.
OOO Praim as a consequence signed an agreement with LUKOil
for the acquisition of wells 53 and 68 on Kulighinskoye field and
completed the acquisition in Q4 2015.
Petition for bankruptcy at Stockholms Tingsrätt has been
withdrawn
Petition for bankruptcy filed at the district court of Stockholm
(Stockholms Tingsrätt) was withdrawn following an out of court
settlement between the Creditor and Selena Oil & Gas Holding
AB. Selena Oil & Gas Holding AB reached a settlement with the
Creditor that filed for a bankruptcy petition December 17th, 2014, in
relationship to an unpaid debt.
The settlement means that the filed petition at the district court of
Stockholm (Stockholms Tingsrätt) has been withdrawn and Selena
Oil & Gas Holding AB undertake to repay the debt through an
instalment plan. The settlement has been reached through an out
of court action in a direct dialogue between the Creditor and the
Company.
Resolutions from Annual General Meeting 2015
The Annual General Meeting of Selena Oil & Gas Holding AB (publ)
resolved to adopt the submitted income statement and balance
sheet, the consolidated income statement and the consolidated
balance sheet for 2014. The AGM also adopted the proposed
dispositions of the Company’s result as presented in the Company´s
Annual Report for 2014.
Shareholders representing more than ten percent of capital and
votes, voted to deny discharge from liabilities for Directors Lars
Bergström, Jürgen Lamp, Indrek Rahumaa, Per-Olof Sjöstedt, and
Poul Waern and also for the CEO, Magnus Stuart.
The AGM resolved to re-elect Board members Lars Bergström,
Indrek Rahumaa, Jürgen Lamp, PeO Sjöstedt, and Paul Waern.
PricewaterhouseCoopers AB was re-elected as auditors, with Martin
Johansson as responsible auditor until end of the annual general
meeting 2016.
It was resolved to set Director’s fees unchanged at SEK 125,000
for each Board member and at SEK 150,000 for the Chairman. The
auditors will be paid in accordance to approved invoicing.
The AGM resolved to adopt the proposed principals for establishment
of appointment of a Nomination Committee.
Production and investments
In total 19.1 thousand bbl were produced in 2015 (2014: 8.3 thousand
bbl) and average production was 52 bbl per day from two wells on
Fedortsevskoye field in 2015. In addition, 7.6 Mbbl of oil containing
liquid was produced in 2015. In Q3 2015 the production volume
decreased due to several occasions of temporary electricity supply
termination and equipment failure on well 24.
In December 2014 the company received a commercial proposal
from LUKoil for further acquisitions of temporarily abandoned
wells located on oilfields licensed to the Company. The commercial
proposal included three wells on Kulighinskoye field, well 23 on
Fedortsevskoye field as well as one well on Komarihinskoye field.
The well on Komarihinskoye field was acquired in H1 2015 and it will
remain temporary abandoned for time being.
In Q2 2015 the Company received a loan facility in the amount of up
to 3,979 TSEK for the launch of well 57 on Kulighinskoye field. Well 57
on Kulighinskoye field was acquired in Q2 2015, first land plot rent
agreements were signed, well re-opening work was finished in Q3
2015, and communication (road, pipeline) construction is ongoing.
The Company started the test production from well 57 in Q4 2015.
The test results indicated that the sulphur level in oil exceeds the
permitted levels for commercial oil. At current oil price there is no
commercially feasible scenario for production from well 57 and it will
be temporary conserved.
In Q3 2015 the Company received further loan facility on oil off-take
terms in the amount of up to 12,558 TSEK (110 m RUB, fully drawn
down as of 31 December 2015) for the launch of Kulighinskoye field’s
wells 53 and 68. Both wells were acquired in Q3 2015 from LUKOil
and the launch of wells was completed by the date of this report. The
Company has started the test production from the wells 53 and 68.
The Company also acquired well 23 on Fedortsevskoye field in Q4
2015 and launched it in January 2016. The Company has started the
test production from the well 23 with satisfactory results.
As the result, the Company currently has seven wells in its ownership
(including two non-producing wells). The Company anticipates total
daily production to reach 240 bbl per day in 2016.
6
7
DIRECTORS’ REPORT
Investments amounted to 12,975 TSEK in 2015 and related to
acquisition of well, construction works related to Fedortsevskoye and
Kulighinskoye fields.
Employees
As of 31 December 2015 the Group employed 5 employees (31
December 2014: 5 employees) and average number of employees
in 2015 was 5 (2014: 5 employees), including 2 women (40%). The
Group outsources its geological activities as well as production and
logistics related operations.
The board consisted of 5 board members, all of whom are men (5
board members as of 31 December 2014).
Financial result
The sales amounted to 5,223 TSEK in 2015 (2014: 5,190 TSEK). EBITDA
amounted to a loss of 3,796 TSEK in 2015 as compared to a loss of
4,977 TSEK in respective period in 2014. Net result for 2015 was a loss
of 6,351 TSEK including net finance loss in the amount of 2,211 TSEK.
A negative EBITDA and net result was heavily impacted by the legal
fees that Company carries in relation to legal advisors in the ongoing
court cases with minority shareholder Y.Gusev.
Investments
Investments amounted to 12,975 TSEK in 2015 and related to
acquisition of well, construction works related to Fedortsevskoye and
Kulighinskoye fields.
Financial position
Total assets of the Group amounted to 94,375 TSEK and increased by
18.7% as compared to the position as of 31 December 2014.
The Group’s equity attributable to the equity holders of the Company
amounted to 31,277 TSEK as of 31 December 2015 and decreased
from 42,179 TSEK as of 31 December 2014.
Total loans and borrowings amounted to 32,859 TSEK and increased
by 107.8% as compared to the balance as of 31 December 2014
mainly due to investment loans received for Kulighinskoye field
launch. For further details of the borrowings please refer to note 15
of this report.
Cash and cash equivalents balance increased from 572 TSEK to 3,751
TSEK as of 31 December 2015.
Significant events after the balance sheet date
For information regarding significant events after the balance sheet
date, see note 32 in this annual report.
Corporate Governance Report
The Company has prepared a Corporate Governance Report which is
available on the Company’s web site www.selenaoil.com
Annual General Meeting 2016
Annual General Meeting will be held in Stockholm on 28 June 2016.
Proposed allocation of earnings
The statements of comprehensive income and financial position of
the Parent Company and the Group are subject to adoption by the
Annual General Meeting on 28 June 2016.
Funds in the Parent Company available for distribution, in TSEK:
Financial statements
The result of the Group’s operations and financial position at the end
of the financial year are shown in the following income statement,
statement of comprehensive income, statement of financial position,
statement of cash flows, statement of changes in equity and related
notes, which are presented in thousand SEK.
The Parent Company’s statement of comprehensive income,
statement of financial position, statement of cash flows, statement of
changes in equity and related notes are presented in thousand SEK
and can be found on pages 33-43.
Share premium
Retained loss
Loss for the year
Total
331,867
(334,173)
(3,970)
(6,276)
The Board of Directors propose the following distribution, in TSEK:
To be carried forward
Total
(6,276)
(6,276)

8
Financial calendar
The subsequent financial reports will be disclosed on the following dates:
28 June 2016 Annual General Meeting
31 August 2016 Interim Report for Q2 and H1 2016
30 November 2016 Interim Report for Q3 and 9M 2016
28 February 2017 Interim Report for Q4 and 12M 2016
DIRECTORS’ REPORT
Group
Total assets, TSEK
Total equity, TSEK
Equity ratio, %
Interest bearing debt, TSEK
Employees at the end of the period
Return on equity, %
Per share data
Earnings per share, SEK
Equity per share, SEK
Key ratios
2012
31.12.2012
147,858
83,258
56.31%
28,491
89
-11.14%
(0.19)
1.60
2013
31.12.2013
95,751
64,151
67.00%
13,187
5
-21.30%
(0.30)
1.23
2015
31.12.2015
94,375
31,277
33.14%
32,859
5
-17.29%
(0.12)
0.60
2014
31.12.2014
79,489
42,179
53.06%
15,811
5
-15.31%
(0.16)
0.81
Key ratio definitions
Total assets, TSEK Total assets at end of period
Total equity, TSEK Total equity at end of period
Equity ratio, % Total equity according to the above divided by total assets expressed as a percentage
Interest bearing debt, TSEK Total interest bearing debt at end of period
Earnings per share, SEK Net result after tax for the period divided by the average number of outstanding shares for the period before dilution
Equity per share, SEK Total equity according to the above divided by the total number of shares outstanding at end of period
Return on equity, % Net result after tax for the period divided by the average equity for the same period

9
ASSETS
Non-current assets
Property, plant and equipment
Intangible assets
Deferred tax asset
Total non-current assets
Current assets
Inventories
Accounts receivable and prepayments
Loans issued
Cash and cash equivalents
Total current assets
TOTAL ASSETS
EQUITY AND LIABILITIES
Equity
Share capital
Other equity
Translation reserve
Retained earnings
Equity attributable to equity holders of the company
Non-current liabilities
Deferred tax liabilities
Loans and borrowings
Asset retirement obligations
Total non-current liabilities
Current liabilities
Loans and borrowings
Accounts payable and accruals
Current income tax payable
Taxes payable
Total current liabilities
Total liabilities
TOTAL LIABILITIES AND EQUITY
Pledged assets
Contingent liabilities
31 December 2014
7,734
61,559
725
70,018
15
8,783
101
572
9,471
79,489
70,471
15,115
(24,996)
(18,411)
42,179
0
152
0
152
15,659
20,243
1
1,255
37,158
37,310
79,489
2,995
none
31 December 2015
18,049
58,077
4,453
80,579
52
9,978
15
3,751
13,796
94,375
70,471
15,115
(29,547)
(24,762)
31,277
3,941
11,092
895
15,928
21,767
24,258
1
1,144
47,170
63,098
94,375
12,572
none
Note
6
7
8
9
10, 26
11, 26
12, 26
13
8
15, 26
16,26
15, 26
17, 26
18
6, 25
25
Consolidated Statement of Financial Position as of 31 December 2015
In thousand SEK
ANNUAL REPORT 2015
The accompanying notes on pages 13-32 form an integral part of these financial statements.
10
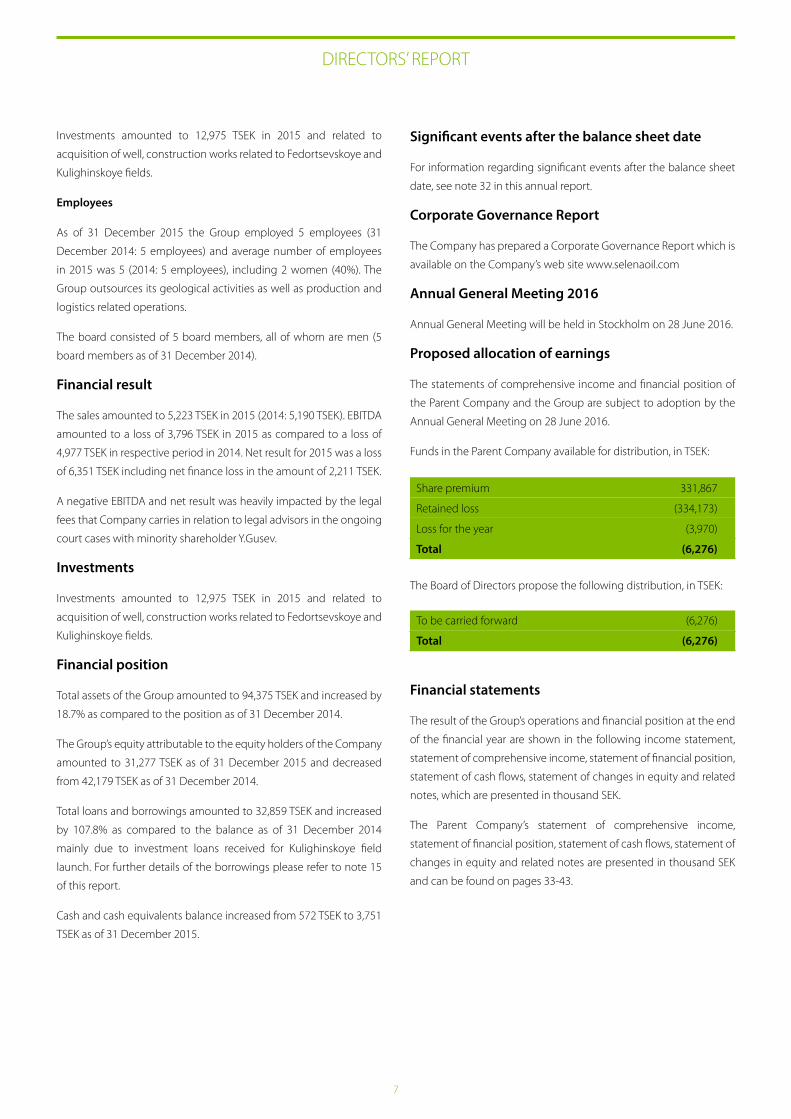
Sales revenue
Cost of goods sold
Gross profit
Selling, general and administrative expenses
Operating loss
Finance income
Finance expenses
Other income
Other expenses
Profit before income tax
Income tax
Net income / (loss)
Earnings per share
Basic earnings per share (SEK)
Diluted earnings per share (SEK)
Note
19
20
21, 30, 31
22
23
24
8
14
14
Consolidated Income Statement for year ended 31 December 2015
In thousand SEK
ANNUAL REPORT 2015
Net income
Other comprehenisve income
Currency translation
Currency translation loss on intragroup lending
Total comprehensive income / (loss), net of tax
Consolidated Statement of Comprehensive Income for year ended 31 December 2015
In thousand SEK 2014
(8,137)
7,992
(21,827)
(21,972)
2015
5,223
(3,291)
1,932
(5,558)
(3,626)
0
(2,211)
17
(361)
(6,181)
(170)
(6,351)
(0.12)
(0.12)
2014
5,190
(1,852)
3,338
(6,169)
(2,831)
0
(2,963)
2,519
(4,810)
(8,085)
(52)
(8,137)
(0.16)
(0.16)
2015
(6,351)
(461)
(4,090)
(10,902)
The accompanying notes on pages 13-32 form an integral part of these financial statements.
11
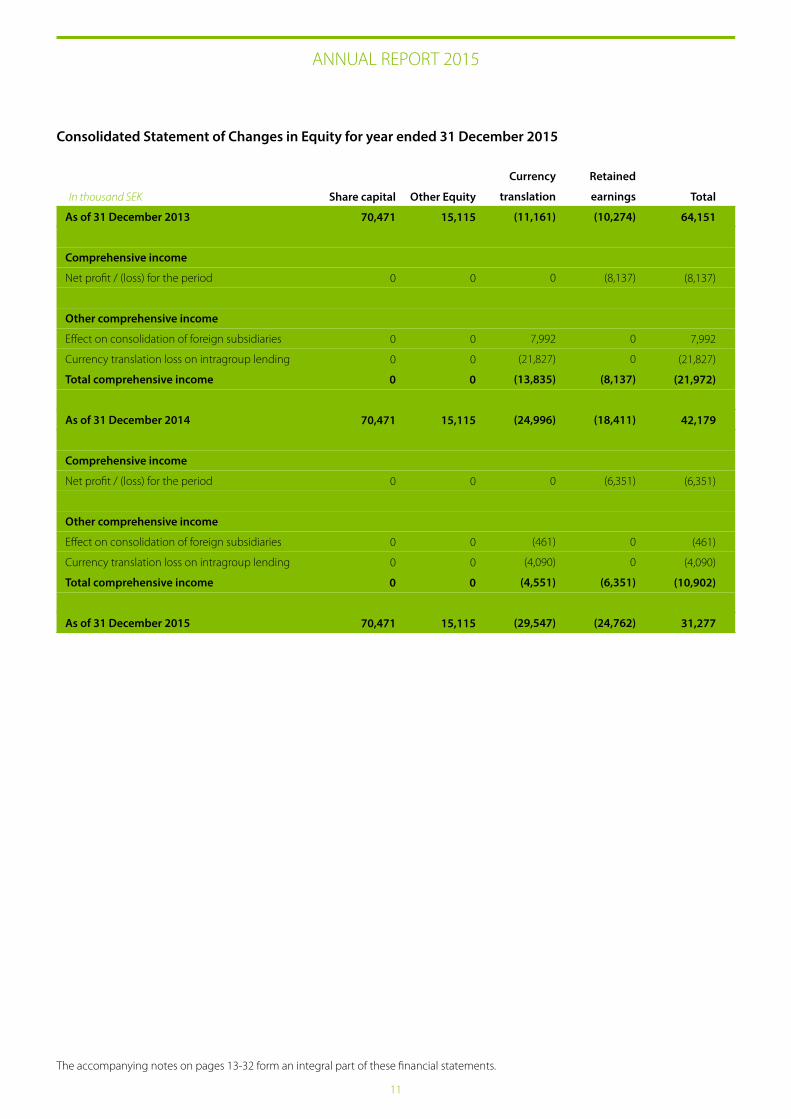
As of 31 December 2013
Comprehensive income
Net profit / (loss) for the period
Other comprehensive income
Effect on consolidation of foreign subsidiaries
Currency translation loss on intragroup lending
Total comprehensive income
As of 31 December 2014
Comprehensive income
Net profit / (loss) for the period
Other comprehensive income
Effect on consolidation of foreign subsidiaries
Currency translation loss on intragroup lending
Total comprehensive income
As of 31 December 2015
Currency
translation
(11,161)
0
7,992
(21,827)
(13,835)
(24,996)
0
(461)
(4,090)
(4,551)
(29,547)
Consolidated Statement of Changes in Equity for year ended 31 December 2015
In thousand SEK
ANNUAL REPORT 2015
Total
64,151
(8,137)
7,992
(21,827)
(21,972)
42,179
(6,351)
(461)
(4,090)
(10,902)
31,277
Retained
earnings
(10,274)
(8,137)
0
0
(8,137)
(18,411)
(6,351)
0
0
(6,351)
(24,762)
Share capital
70,471
0
0
0
0
70,471
0
0
0
0
70,471
Other Equity
15,115
0
0
0
0
15,115
0
0
0
0
15,115
The accompanying notes on pages 13-32 form an integral part of these financial statements.
12
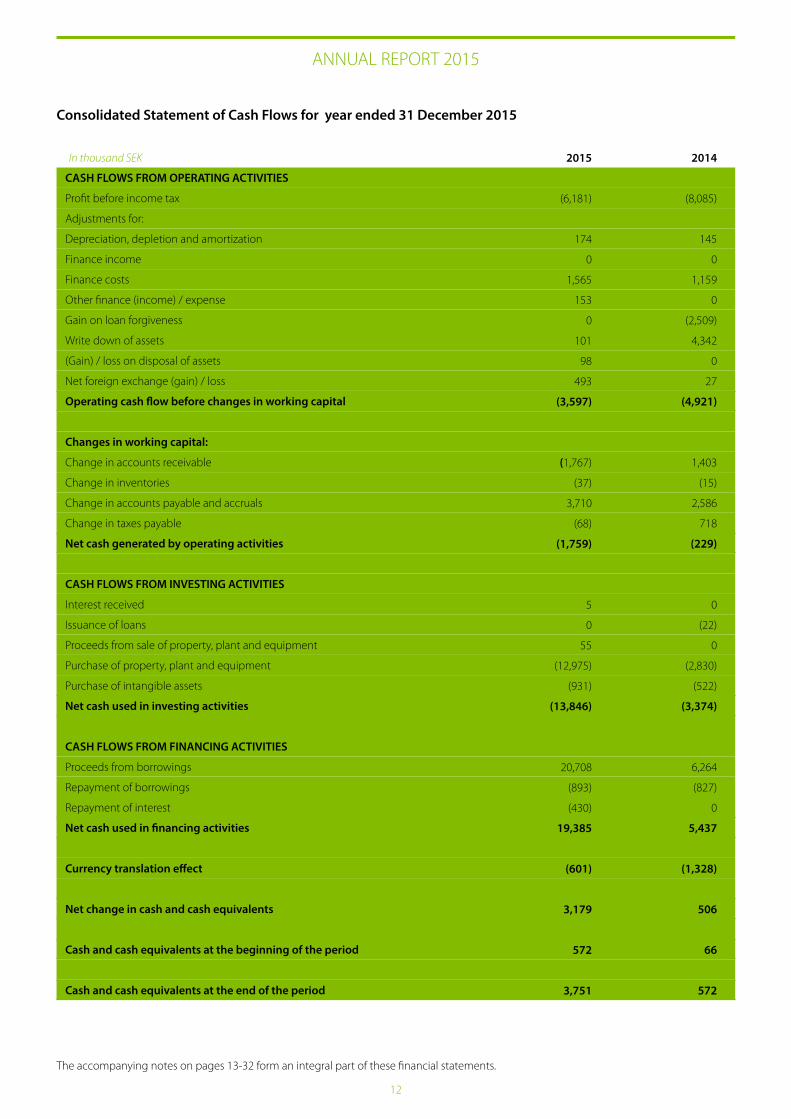
CASH FLOWS FROM OPERATING ACTIVITIES
Profit before income tax
Adjustments for:
Depreciation, depletion and amortization
Finance income
Finance costs
Other finance (income) / expense
Gain on loan forgiveness
Write down of assets
(Gain) / loss on disposal of assets
Net foreign exchange (gain) / loss
Operating cash flow before changes in working capital
Changes in working capital:
Change in accounts receivable
Change in inventories
Change in accounts payable and accruals
Change in taxes payable
Net cash generated by operating activities
CASH FLOWS FROM INVESTING ACTIVITIES
Interest received
Issuance of loans
Proceeds from sale of property, plant and equipment
Purchase of property, plant and equipment
Purchase of intangible assets
Net cash used in investing activities
CASH FLOWS FROM FINANCING ACTIVITIES
Proceeds from borrowings
Repayment of borrowings
Repayment of interest
Net cash used in financing activities
Currency translation effect
Net change in cash and cash equivalents
Cash and cash equivalents at the beginning of the period
Cash and cash equivalents at the end of the period
2014
(8,085)
145
0
1,159
0
(2,509)
4,342
0
27
(4,921)
1,403
(15)
2,586
718
(229)
0
(22)
0
(2,830)
(522)
(3,374)
6,264
(827)
0
5,437
(1,328)
506
66
572
2015
(6,181)
174
0
1,565
153
0
101
98
493
(3,597)
(1,767)
(37)
3,710
(68)
(1,759)
5
0
55
(12,975)
(931)
(13,846)
20,708
(893)
(430)
19,385
(601)
3,179
572
3,751
Consolidated Statement of Cash Flows for year ended 31 December 2015
In thousand SEK
ANNUAL REPORT 2015
The accompanying notes on pages 13-32 form an integral part of these financial statements.
13
ANNUAL REPORT 2015
1 Reporting Entity
Selena Oil & Gas Holding AB (the “Company”) is a company domiciled
in Sweden. The address of the Company’s registered office P.O. Box
7614, 103 94 Stockholm, Sweden, register code 556643-6613. The
consolidated financial statements of the Company as at and for
the year ended 31 December 2015 comprise the Company and its
subsidiaries (together referred to as the “Group” and individually as
“Group entities”).
As of 31 December 2015 the Company has one direct subsidiary
Selena Oil & Gas AB which in turn has three subsidiaries, which are
OOO Selena-Perm, OOO Georesurs and OOO Selena Oil which in turn
has its own 2 subsidiaries OOO Praim and OOO Prefo. The subsidiaries
are engaged in oil and gas exploration and production in the Russian
Federation.
2 Operating Environment of the Group
The Group, through its operations, has a significant exposure to
the economy and financial markets of the Russian Federation. The
Russian economy started stagnation in 2014, with continued lowered
domestic demand. The Russian ruble has fallen dramatically against
the USD and EUR, inflation has increased, and its economic growth
has slowed down.
Increased geopolitical risks and the new environment of policy
uncertainty and sanctions had an additional negative impact on
economic activities in 2014 and 2015. It hit the economy through
three channels: (1) increased volatility on the exchange rate market
and a significant depreciation of the national currency; (2) limited
access to international financial markets for banks and non-financial
corporations, and (3) suppressed business and consumer confidence
about future growth prospects.
The tax, currency and customs legislation within the Russian
Federation is subject to varying interpretations and frequent
changes. The future economic direction of the Russian Federation is
largely dependent upon the effectiveness of economic, financial and
monetary measures undertaken by the Government, together with
tax, legal, regulatory and political developments.
Management is unable to predict all developments which could have
an impact on the Russian economy and consequently what effect, if
any, they could have on the future financial position of the Group.
Management believes it is taking all the necessary measures to
support the sustainability and development of the Group’s business.
3 Summary of Significant Accounting Policies
Statement of compliance. These consolidated Financial Statements
have been prepared in accordance with International Financial
Reporting Standards (hereinafter referred to as “IFRS”) and related
interpretations adopted by the International Accounting Standards
Board (hereinafter referred to as “IASB”).
Each company of the Group individually maintains its own books
of accounts and prepares its statutory financial statements in
accordance with Russian standards of accounting (hereinafter
referred to as “RSA”) and Swedish GAAP. The accompanying financial
statements are based on the statutory records with adjustments
and reclassifications made for the purpose of fair presentation in
accordance with IFRS.
Functional and presentation currency. The Swedish Krona (“SEK”)
is the presentation currency for the Group’s operations. Financial
statements of the Russian subsidiaries are measured in Russian
Roubles (“RUB”), their functional currency. Financial statements of
Selena Oil & Gas Holding AB (publ) are measured in Swedish Kronas,
its functional currency (“SEK”).
Foreign currency. In preparing the financial statements of the
individual companies, transactions in currencies other than the
entities functional currency are recorded at the exchange rates
prevailing at the date of the transactions. At each reporting date
monetary assets and liabilities denominated in foreign currencies are
re-measured at the exchange rates prevailing at the reporting date.
Non-monetary items carried at historical cost are translated at the
exchange rate prevailing on the date of transaction.
Non-monetary items carried at fair value are translated at the
exchange rate prevailing at the date on which the most recent fair
value was determined.
Exchange differences arising on the settlement of monetary items,
and on the re-measurement of monetary items, are recognized in
consolidated income statement for the period.
Translation to presentation currency. The Group’s financial statements
are presented in SEK in accordance with IAS 21, The Effects of
Changes in Foreign Exchange Rates. The results and financial position
of each group entity having a functional currency different from the
presentation currency are translated into the presentation currency
as follows:
(i) Assets and liabilities for each statement of financial position
presented are translated at the closing rate at the date of that
statement of financial position.
(ii) Income and expenses are translated at average exchange
rates (unless this average is not a reasonable approximation of the
cumulative effect of the rates prevailing on the transaction dates, in
14
ANNUAL REPORT 2015
which case income and expenses are translated at the dates of the
transactions).
(iii) All resulting exchange differences are recognised as a separate
component of equity.
When a subsidiary is disposed of through sale, liquidation, repayment
of share capital or abandonment of all, or part of, that entity, the
exchange differences deferred in other comprehensive income are
reclassified to the profit and loss.
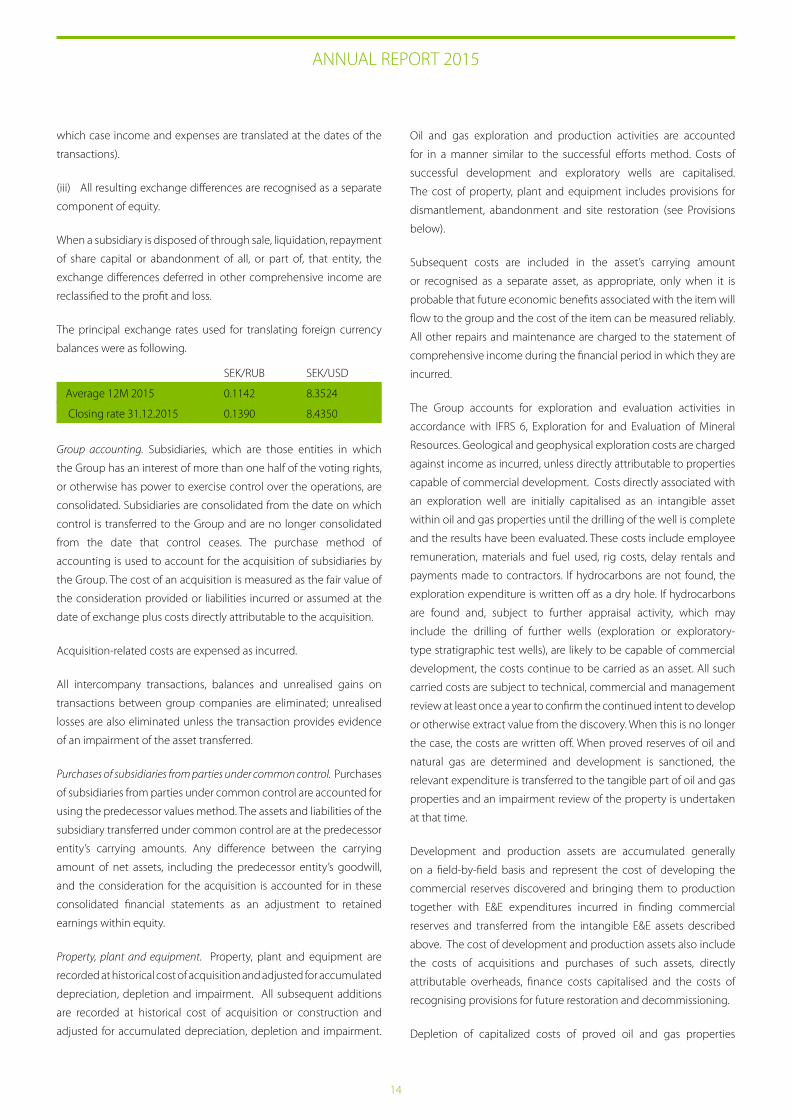
The principal exchange rates used for translating foreign currency
balances were as following.
Group accounting. Subsidiaries, which are those entities in which
the Group has an interest of more than one half of the voting rights,
or otherwise has power to exercise control over the operations, are
consolidated. Subsidiaries are consolidated from the date on which
control is transferred to the Group and are no longer consolidated
from the date that control ceases. The purchase method of
accounting is used to account for the acquisition of subsidiaries by
the Group. The cost of an acquisition is measured as the fair value of
the consideration provided or liabilities incurred or assumed at the
date of exchange plus costs directly attributable to the acquisition.
Acquisition-related costs are expensed as incurred.
All intercompany transactions, balances and unrealised gains on
transactions between group companies are eliminated; unrealised
losses are also eliminated unless the transaction provides evidence
of an impairment of the asset transferred.
Purchases of subsidiaries from parties under common control. Purchases
of subsidiaries from parties under common control are accounted for
using the predecessor values method. The assets and liabilities of the
subsidiary transferred under common control are at the predecessor
entity’s carrying amounts. Any difference between the carrying
amount of net assets, including the predecessor entity’s goodwill,
and the consideration for the acquisition is accounted for in these
consolidated financial statements as an adjustment to retained
earnings within equity.
Property, plant and equipment. Property, plant and equipment are
recorded at historical cost of acquisition and adjusted for accumulated
depreciation, depletion and impairment. All subsequent additions
are recorded at historical cost of acquisition or construction and
adjusted for accumulated depreciation, depletion and impairment.
Oil and gas exploration and production activities are accounted
for in a manner similar to the successful efforts method. Costs of
successful development and exploratory wells are capitalised.
The cost of property, plant and equipment includes provisions for
dismantlement, abandonment and site restoration (see Provisions
below).
Subsequent costs are included in the asset’s carrying amount
or recognised as a separate asset, as appropriate, only when it is
probable that future economic benefits associated with the item will
flow to the group and the cost of the item can be measured reliably.
All other repairs and maintenance are charged to the statement of
comprehensive income during the financial period in which they are
incurred.
The Group accounts for exploration and evaluation activities in
accordance with IFRS 6, Exploration for and Evaluation of Mineral
Resources. Geological and geophysical exploration costs are charged
against income as incurred, unless directly attributable to properties
capable of commercial development. Costs directly associated with
an exploration well are initially capitalised as an intangible asset
within oil and gas properties until the drilling of the well is complete
and the results have been evaluated. These costs include employee
remuneration, materials and fuel used, rig costs, delay rentals and
payments made to contractors. If hydrocarbons are not found, the
exploration expenditure is written off as a dry hole. If hydrocarbons
are found and, subject to further appraisal activity, which may
include the drilling of further wells (exploration or exploratory-
type stratigraphic test wells), are likely to be capable of commercial
development, the costs continue to be carried as an asset. All such
carried costs are subject to technical, commercial and management
review at least once a year to confirm the continued intent to develop
or otherwise extract value from the discovery. When this is no longer
the case, the costs are written off. When proved reserves of oil and
natural gas are determined and development is sanctioned, the
relevant expenditure is transferred to the tangible part of oil and gas
properties and an impairment review of the property is undertaken
at that time.
Development and production assets are accumulated generally
on a field-by-field basis and represent the cost of developing the
commercial reserves discovered and bringing them to production
together with E&E expenditures incurred in finding commercial
reserves and transferred from the intangible E&E assets described
above. The cost of development and production assets also include
the costs of acquisitions and purchases of such assets, directly
attributable overheads, finance costs capitalised and the costs of
recognising provisions for future restoration and decommissioning.
Depletion of capitalized costs of proved oil and gas properties
SEK/RUB SEK/USD
Average 12M 2015 0.1142 8.3524
Closing rate 31.12.2015 0.1390 8.4350
15
ANNUAL REPORT 2015
is calculated using the unit-of-production method for each field
based upon proved reserves for property acquisitions and proved
developed reserves for exploration and development costs. Oil and
gas reserves for this purpose are determined in accordance with
Society of Petroleum Engineers definitions and were last estimated
by DeGolyer and MacNaughton, the Group’s independent reservoir
engineers in 2011.
Depreciation of non oil and gas property, plant and equipment is
calculated using the straight-line method over their estimated
remaining useful lives. Useful lives for other property, plant and
equipment are in the range of 5-20 years.
The assets’ residual values and useful lives are reviewed, and adjusted
if appropriate, at each reporting date. Gains and losses on disposals
are determined by comparing the proceeds with the carrying
amount and are recognised within ‘Other (losses)/gains – net’ in the
consolidated statement of comprehensive income.
Intangible assets. The Group measures intangible assets at cost less
accumulated amortisation and impairment losses. Capitalized E&E
assets and license costs are initially carried as intangible assets and
reclassified to property, plant and equipment as described above
and are not amortized until production from the respective fields
have commenced. The Group assesses E&E assets for impairment
annually or when there are indicators that impairment exists. Such
indicators would include the fact that the rights to explore in an
area have expired or will expire in the near future without renewal;
no further exploration or evaluation is planned or budgeted or a
decision is taken to discontinue exploration and evaluation in an
area or an indication exists that the book value would not be fully
recovered from future development and production.
Provisions. Provisions are recognised when the Group has a present
legal or constructive obligation as a result of past events and when
it is probable that an outflow of resources embodying economic
benefits will be required to settle the obligation, and a reliable
estimate of the amount of the obligation can be made.
Provisions, including those related to dismantlement, abandonment
and site restoration, are evaluated and re-estimated annually, and are
included in the consolidated financial statements at each reporting
date at the present value of the expenditures expected to be required
to settle the obligation using pre – tax discount rates which reflect
the current market assessment of the time value of money and the
risks specific to the liability.
Changes in provisions resulting from the passage of time are
reflected in the consolidated statement of comprehensive income
each year under financial items. Other changes in provisions,
relating to a change in the expected pattern of settlement of the
obligation, changes in the discount rate or in the estimated amount
of the obligation, are treated as a change in accounting estimate
in the period of the change. Changes in provisions relating to
dismantlement, abandonment and site restoration are added to, or
deducted from, the cost of the related asset in the current period.
The amount deducted from the cost of the asset should not exceed
its carrying amount. If a decrease in the liability exceeds the carrying
amount of the asset, the excess is recognised immediately in profit
or loss.
The provision for dismantlement liability is recorded on the
consolidated statement of financial position, with a corresponding
amount being recorded as part of property, plant and equipment in
accordance with IAS 16.
Operating leases. Where the Group company is a lessee in a lease,
which does not transfer substantially all the risks and rewards
incidental to ownership from the lessor to the Group company, the
total lease payments including those on expected termination are
charged to profit or loss on straight-line basis over the period of the
lease.
A non-cancellable lease is a lease that is cancellable only:
• Upontheoccurrenceofsomeremotecontingency;
• Withpermissionofthelessor;
• If the lesseeenters intoanewleaseforthesameorequivalent
asset with the same lessor; or
• Uponapaymentbythelesseeofsuchanadditionalamountthat,
at inception of the lease, continuation of the lease is reasonably
certain.
Impairment of assets. Assets that are subject to depreciation and
depletion are reviewed for impairment annually or whenever events
or changes in circumstances indicate that the carrying amount may
not be recoverable. An impairment loss is recognised for the amount
by which the asset’s carrying amount exceeds its recoverable amount.
The recoverable amount is the higher of an asset’s fair value less costs
to sell or value in use. For the purposes of assessing impairment,
assets are grouped by license areas, which are the lowest levels for
which there are separately identifiable cash flows (cash-generating
units).
Inventories. Inventories of extracted crude oil, materials and supplies
and construction materials are valued at the lower of the weighted-
average cost and net realisable value. General and administrative
expenditure is excluded from inventory costs and expensed in the
period incurred.
Trade receivables. Trade receivables are recognised initially at fair value
16
ANNUAL REPORT 2015
and subsequently measured at amortised cost using the effective
interest method, net of provision for impairment. A provision for
impairment of trade receivables is established when there is objective
evidence that the Group will not be able to collect all amounts
due according to the original terms of receivables. Such objective
evidence may include significant financial difficulties of the debtor,
an increase in the probability that the debtor will enter bankruptcy
or financial reorganization, and actual default or delinquency in
payments. The amount of the provision is the difference between
the asset’s carrying amount and the present value of estimated
future cash flows, discounted at the original effective interest rate.
The change in the amount of the provision is recognised in the
consolidated statement of comprehensive income.
Financial assets. The group classifies all its financial assets in the
category loans and receivables. Classification depends on the
purpose for which the financial assets were acquired. Management
determines the classification of its financial assets at initial recognition.
Loans and receivables are non-derivative financial assets with fixed
or determinable payments that are not quoted in an active market.
They are included in current assets, except for maturities greater than
12 months after the end of the reporting period. These are classified
as non-current assets. The group’s loans and receivables comprise:
‘Accounts Receivable’, ‘Loans issued’ and ‘Cash and cash equivalents’
in the balance sheet.
Prepayments. Prepayments are carried at cost less provision for
impairment. A prepayment is classified as non-current when the
goods or services relating to the prepayment are expected to be
obtained after one year, or when the prepayment relates to an asset
which will itself be classified as non-current upon initial recognition.
Prepayments to acquire assets are transferred to the carrying amount
of the asset once the Group has obtained control of the asset and it
is probable that future economic benefits associated with the asset
will flow to the Group. Other prepayments are written off to profit
or loss when the goods or services relating to the prepayments are
received. If there is an indication that the assets, goods or services
relating to a prepayment will not be received, the carrying value of
the prepayment is written down accordingly and a corresponding
impairment loss is recognised in profit or loss.
Cash and cash equivalents. Cash and cash equivalents includes cash
in hand, deposits held at call with banks, and other short-term highly
liquid investments with original maturities of three months or less.
Cash and cash equivalents are carried at amortised cost using the
effective interest method. Restricted balances are excluded from
cash and cash equivalents for the purposes of the consolidated cash
flow statement. Balances restricted from being exchanged or used
to settle a liability for at least twelve months after the reporting date
are included in other non-current assets. Restricted cash balances
are segregated from cash available for the business to use until such
time as restrictions are removed.
Value added tax. Output value added tax related to sales is payable
to tax authorities on the earlier of (a) collection of receivables from
customers or (b) delivery of goods or services to customers. Input
VAT is generally recoverable against output VAT upon receipt of
the VAT invoice. The tax authorities permit the settlement of VAT
on a net basis. VAT related to sales and purchases is recognised in
the statement of financial position on a gross basis and disclosed
separately as an asset and liability. Where provision has been made
for impairment of receivables, impairment loss is recorded for the
gross amount of the debtor, including VAT.
Borrowings. Borrowings are recognised initially at the fair value of
the liability, net of transaction costs incurred. In subsequent periods,
borrowings are stated at amortised cost using the effective yield
method; any difference between amount at initial recognition and
the redemption amount is recognised as interest expense over
the period of the borrowings. Borrowings are classified as current
liabilities unless the Group has an unconditional right to defer
settlement of the liability for at least 12 months after the reporting
date. Interest costs on borrowings to finance the construction of
property, plant and equipment are capitalised during the period
of time that is required to complete and prepare the asset for its
intended use.
Loans receivable. The loans advanced by the Group are classified
as “loans and receivables” in accordance with IAS 39 and stated at
amortised cost using the effective interest method. These loans are
individually tested for impairment at each reporting date.
Income taxes. Income taxes related to the Group’s operations in
the Russian Federation have been provided for in the consolidated
financial statements in accordance with Russian legislation enacted
or substantively enacted by the reporting date. The income tax
charge or benefit comprises current tax and deferred tax and is
recognised in the consolidated statement of comprehensive income
unless it relates to transactions that are recognised, in the same or a
different period, directly in equity.
Current tax is the amount expected to be paid to or recovered from
the taxation authorities in respect of taxable profits or losses for the
current and prior periods. Taxes other than on income are recorded
within operating expenses.
Deferred income tax is calculated at rates enacted or substantively
enacted by the reporting date, using the balance sheet liability
method, for all temporary differences between the tax bases of
assets and liabilities and their carrying values for financial reporting
17
ANNUAL REPORT 2015
purposes. The principal temporary differences arise from depreciation
on property, plant and equipment, provisions and other fair value
adjustments to long-term items, and expenses which are charged to
the consolidated statement of comprehensive income before they
become deductible for tax purposes.
Deferred income tax assets attributable to deducible temporary
differences, unused tax losses and credits are recognised only to
the extent that it is probable that future taxable profit or taxable
temporary differences will be available against which they can be
utilised.
Deferred income tax assets and liabilities are offset when the Group
has a legally enforceable right to set off current tax assets against
current tax liabilities, when deferred tax balances relate to the same
regulatory body, and when they relate to the same taxable entity.
The Group’s uncertain tax positions are reassessed by management
at every reporting date. Liabilities are recorded for income tax
positions that are determined by management as more likely than
not to result in additional taxes being levied if the positions were to
be challenged by the tax authorities. The assessment is based on the
interpretation of tax laws that have been enacted or substantively
enacted by the reporting date and any known court or other rulings
on such issues. Liabilities for penalties, interest and taxes other than
on income are recognized based on management’s best estimate of
the expenditure required to settle the obligations at the reporting
date.
Employee benefits. Wages, salaries, social insurance funds, paid annual
leave and sick leave, bonuses, and non-monetary benefits (such as
health services and kindergarten services) are accrued in the year in
which the associated services are rendered by the employees of the
Group.
The Group makes required contributions to the Russian Federation
state pension scheme on behalf of its employees. Mandatory
contributions to the governmental pension scheme are expensed or
capitalized to properties on a basis consistent with the associated
salaries and wages. With exception of the above mandatory
contributions there are no defined benefit or contribution pension
plans in the Company.
Social costs. The Group incurs employee costs related to the provision
of benefits such as health insurance. These amounts principally
represent an implicit cost of employing production workers and,
accordingly, are included in the cost of inventory.
Revenue recognition. The Group recognises revenue when the
amount of revenue can be reliably measured and it is probable that
economic benefits will flow to the entity, typically when crude oil is
dispatched to customers and title has transferred.
Interest income is recognised on a time-proportion basis using
the effective interest method. When a receivable is impaired, the
Group reduces the carrying amount to its recoverable amount,
being the estimated future cash flow discounted at the original
effective interest rate of the instrument, and continues unwinding
the discount as interest income. Interest income on impaired loans
is recognised using the original effective interest rate.
Segments. The Group operates in one business segment which is
crude oil exploration and production. The Group assesses its results
of operations and makes its strategic and investment decisions based
on the analysis of its profitability as a whole. The Group operates
within one geographic segment, which is the Russian Federation.
4 Critical Accounting Estimates and Judgements in Applying Accounting Policies
The Group makes estimates and assumptions that affect the reported
amounts of assets and liabilities. Estimates and judgements are
continually evaluated and are based on management’s experience
and other factors, including expectations of future events that are
believed to be reasonable under the circumstances. Management
also makes certain judgements, apart from those involving
estimations, in the process of applying the accounting policies.
Judgements that have the most significant effect on the amounts
recognised in the financial statements and estimates that can cause a
significant adjustment to the carrying amount of assets and liabilities
are outlined below.
Estimation of oil and gas reserves. Engineering estimates of
hydrocarbon reserves are inherently uncertain and are subject
to future revisions. Accounting measures such as depreciation,
depletion and amortization charges, impairment assessments and
asset retirement obligations that are based on the estimates of
proved reserves are subject to change based on future changes to
estimates of oil and gas reserves.
Proved reserves are defined as the estimated quantities of
hydrocarbons which geological and engineering data demonstrate
with reasonable certainty to be recoverable in future years from
known reservoirs under existing economic conditions. Proved
reserves are estimated by reference to available reservoir and well
information, including production and pressure trends for producing
reservoirs. Furthermore, estimates of proved reserves only include
volumes for which access to market is assured with reasonable
certainty. All proved reserves estimates are subject to revision, either
upward or downward, based on new information, such as from
18
ANNUAL REPORT 2015
development drilling and production activities or from changes
in economic factors, including product prices, contract terms or
development plans. In some cases, substantial new investment in
additional wells and related support facilities and equipment will
be required to recover such proved reserves. Due to the inherent
uncertainties and the limited nature of reservoir data, estimates of
underground reserves are subject to change over time as additional
information becomes available.
In general, estimates of reserves for undeveloped or partially developed
fields are subject to greater uncertainty over their future life than
estimates of reserves for fields that are substantially developed and
depleted. As those fields are further developed, new information may
lead to further revisions in reserve estimates. Reserves have a direct
impact on certain amounts reported in the consolidated financial
statements, most notably depreciation, depletion and amortization
as well as impairment expenses. Depreciation rates on production
assets using the units-of-production method for each field are based
on proved developed reserves for development costs, and total
proved reserves for costs associated with the acquisition of proved
properties. Assuming all variables are held constant, an increase in
proved developed reserves for each field decreases depreciation,
depletion and amortization expenses. Conversely, a decrease in
the estimated proved developed reserves increases depreciation,
depletion and amortization expenses. Moreover, estimated proved
reserves are used to calculate future cash flows from oil and gas
properties, which serve as an indicator in determining whether or
not property impairment is present.
The possibility exists for changes or revisions in estimated reserves to
have a significant effect on depreciation, depletion and amortization
charges and, therefore, reported net profit for the year.
Asset retirement obligations. Management makes provision for the
future costs of decommissioning hydrocarbon production facilities,
pipelines and related support equipment based on the best estimates
of future cost and economic lives of those assets. Estimating future
asset retirement obligations is complex and requires management to
make estimates and judgments with respect to removal obligations
that will occur many years in the future. Changes in the measurement
of existing obligations can result from changes in estimated timing,
future costs or discount rates used in valuation.
Useful lives of non-oil and gas properties. Items of non-oil and gas
properties are stated at cost less accumulated depreciation. The
estimation of the useful life of an asset is a matter of management
judgement based upon experience with similar assets. In determining
the useful life of an asset, management considers the expected usage,
estimated technical obsolescence, physical wear and tear and the
physical environment in which the asset is operated. Changes in any
of these conditions or estimates may result in adjustments to future
depreciation rates. Useful lives applied to oil and gas properties may
exceed the licence term where management considers that licences
will be renewed. Assumptions related to renewal of licences can
involve significant judgment of management.
Going Concern. These consolidated financial statements have been
prepared on the basis that the Group will continue as a going
concern. Preparation of the consolidated financial statements on a
basis other than going concern can have a significant impact on the
balances recorded in respect of assets and liabilities.
5 New Accounting Pronouncements
i. Amendments to the existing standards and new interpretation
effective for current financial period
The following amendments to the existing standards and new
interpretation issued by the International Accounting Standards
Board (IASB) and adopted by the European Commission are effective
for current financial period:
• Amendmentstovariousstandards“ImprovementstoIFRSs(cycle
2011-2013)” resulting from the annual improvement project of
IFRS (IFRS 3, IFRS 13 and IAS 40) primarily with a view to removing
inconsistencies and clarifying wording - adopted by the European
Commission on 18 December 2014 (amendments are to be applied
for annual periods beginning on or after 1 January 2015).
• IFRIC 21“Levies” adopted by the European Commission on 13
June 2014 (effective for annual periods beginning on or after 17 June
2014).
The adoption of these amendments to the existing standards and
interpretation has not led to any material changes in the Group’s
financial statements.
ii. Amendments to the existing standards but not yet effective
The IASB has issued a number of new or amended accounting
standards and interpretations with effective date after 31 December
2015.
• IFRS15“Revenuefromcontractswithcustomers”, issuedinMay
2014, replaces all existing requirements (IAS 18 Revenue and IAS 11
Construction contracts and related interpretations). The standard is
effective for annual periods beginning on or after 1 January 2018.
• IFRS16Leases,issuedinJanuary2016,supersedesIAS17Leases
and IFRIC 4 Determining whether an arrangement contains a lease. It
is effective for annual periods beginning on or after 1 January 2019.
The Group expects to implement new or amended accounting
standards and interpretations when they become mandatory. The
Group has not yet analysed the impact of those new standards and
amendments on its accounting policies and financial statements.
19
ANNUAL REPORT 2015
Cost as of 31 December 2013
Movements in 2014
Additions
Transfers
Effect of movements in exchange rates
Cost as of 31 December 2014
Movements in 2015
Additions
Disposals
Effect of movements in exchange rates
Cost as of 31 December 2015
Accumumated depreciation as of 31 December 2013
Movements in 2014
Depreciation for period
Effect of movements in exchange rates
Accumumated depreciation as of 31 December 2014
Movements in 2015
Disposals
Depreciation for period
Effect of movements in exchange rates
Accumumated depreciation as of 31 December 2015
Net book value as of 31 December 2014
Net book value as of 31 December 2015
Total
8,279
2,830
0
(3,251)
7,858
14,439
(155)
(3,886)
18,256
(39)
(129)
44
(124)
2
(127)
42
(207)
7,734
18,049
Construction in
progress
7,800
2,830
(6,584)
(1,521)
2,525
12,450
0
(2,653)
12,322
0
0
0
0
0
0
0
0
2,525
12,322
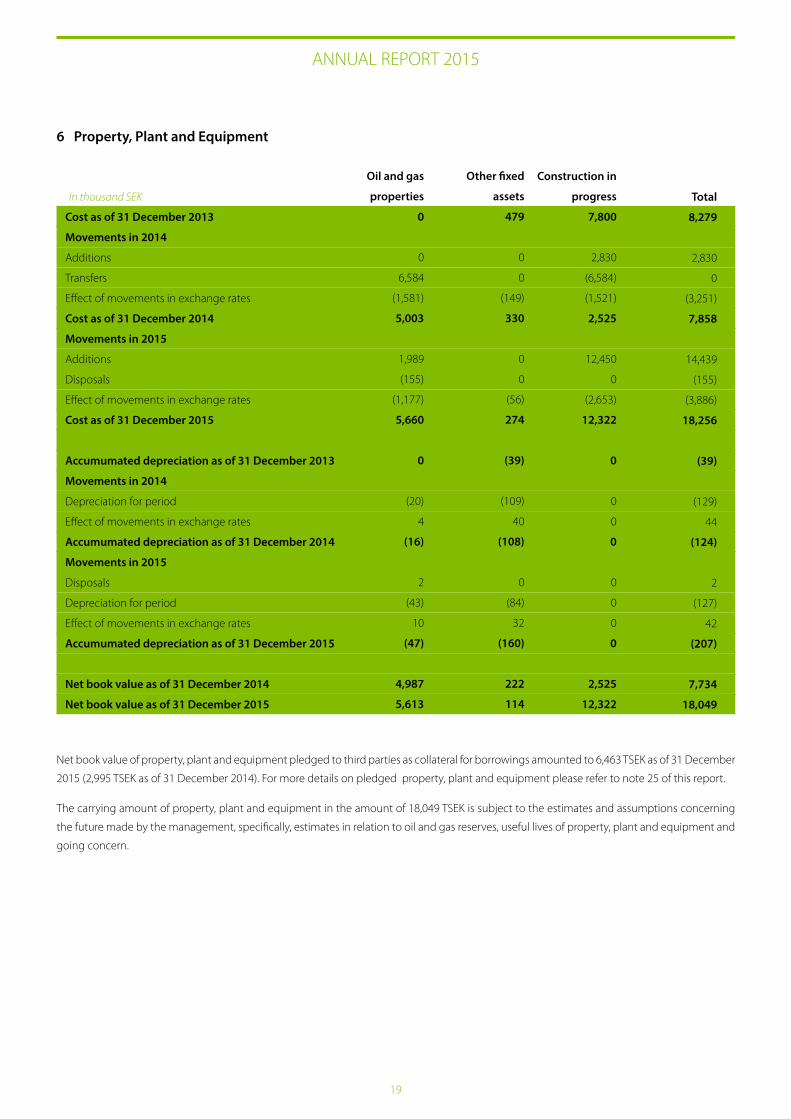
6 Property, Plant and Equipment
In thousand SEK
Other fixed
assets
479
0
0
(149)
330
0
0
(56)
274
(39)
(109)
40
(108)
0
(84)
32
(160)
222
114
Oil and gas
properties
0
0
6,584
(1,581)
5,003
1,989
(155)
(1,177)
5,660
0
(20)
4
(16)
2
(43)
10
(47)
4,987
5,613
Net book value of property, plant and equipment pledged to third parties as collateral for borrowings amounted to 6,463 TSEK as of 31 December
2015 (2,995 TSEK as of 31 December 2014). For more details on pledged property, plant and equipment please refer to note 25 of this report.
The carrying amount of property, plant and equipment in the amount of 18,049 TSEK is subject to the estimates and assumptions concerning
the future made by the management, specifically, estimates in relation to oil and gas reserves, useful lives of property, plant and equipment and
going concern.
20
Cost as of 31 December 2013
Movements in 2014
Additions
Disposals
Effect of movements in exchange rates
Cost as of 31 December 2014
Movements in 2015
Additions
Effect of movements in exchange rates
Cost as of 31 December 2015
Accumumated amortisation as of 31 December 2013
Movements in 2014
Amortization for period
Effect of movements in exchange rates
Accumumated amoisationr as of 31 December 2014
Movements in 2015
Amortization for period
Effect of movements in exchange rates
Accumumated depreciation as of 31 December 2015
Net book value as of 31 December 2014
Net book value as of 31 December 2015
Total
75,631
522
(3,437)
(11,140)
61,576
931
(4,382)
58,125
0
(22)
5
(17)
(42)
11
(48)
61,559
58,077
Other
intangible
assets
0
0
0
0
0
0
0
0
0
0
0
0
0
0
0
0
0
In thousand SEK
ANNUAL REPORT 2015
Exploration
and evaluation
assets
75,631
522
(3,437)
(11,140)
61,576
931
(4,382)
58,125
0
(22)
5
(17)
(42)
11
(48)
61,559
58,077
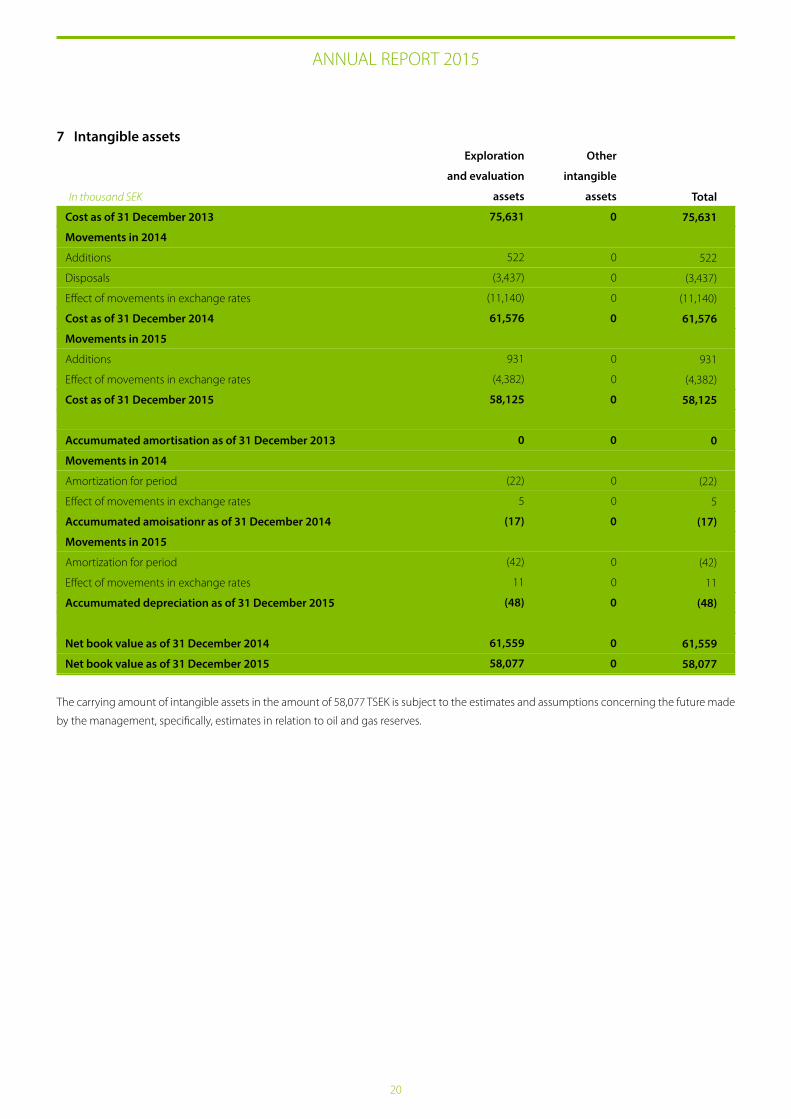
7 Intangible assets
The carrying amount of intangible assets in the amount of 58,077 TSEK is subject to the estimates and assumptions concerning the future made
by the management, specifically, estimates in relation to oil and gas reserves.
21
ANNUAL REPORT 2015
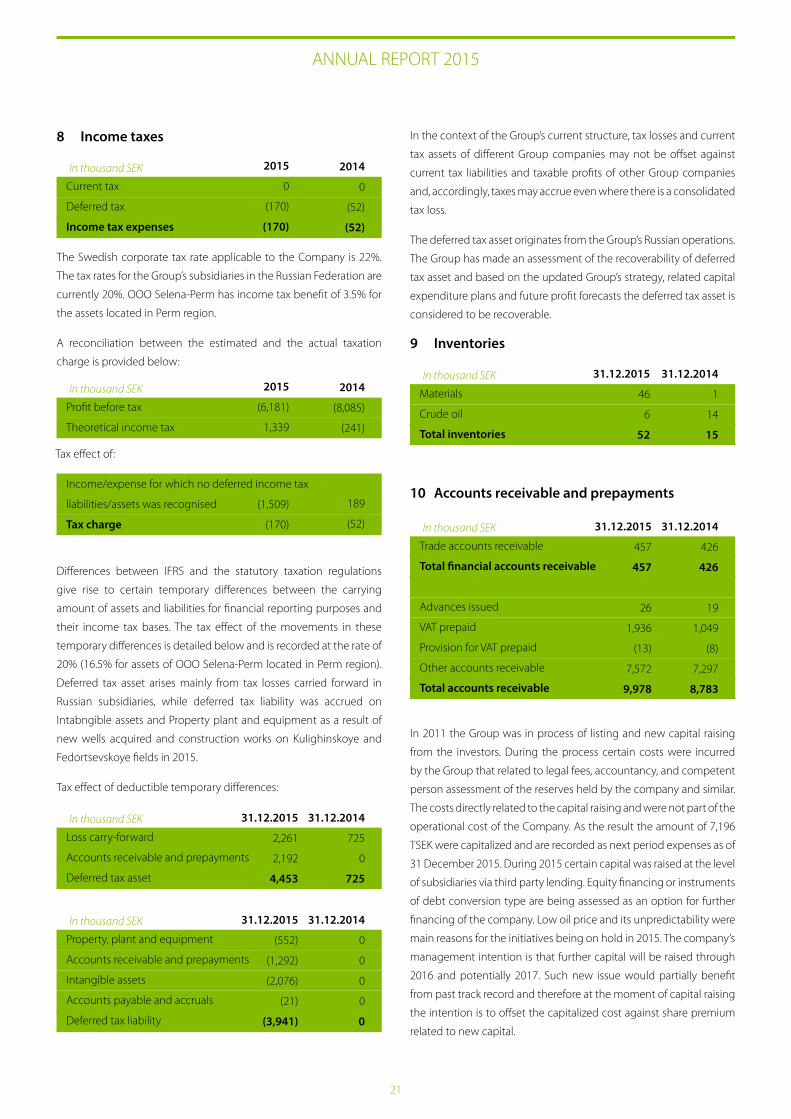
8 Income taxes
The Swedish corporate tax rate applicable to the Company is 22%.
The tax rates for the Group’s subsidiaries in the Russian Federation are
currently 20%. OOO Selena-Perm has income tax benefit of 3.5% for
the assets located in Perm region.
A reconciliation between the estimated and the actual taxation
charge is provided below:
Differences between IFRS and the statutory taxation regulations
give rise to certain temporary differences between the carrying
amount of assets and liabilities for financial reporting purposes and
their income tax bases. The tax effect of the movements in these
temporary differences is detailed below and is recorded at the rate of
20% (16.5% for assets of OOO Selena-Perm located in Perm region).
Deferred tax asset arises mainly from tax losses carried forward in
Russian subsidiaries, while deferred tax liability was accrued on
Intabngible assets and Property plant and equipment as a result of
new wells acquired and construction works on Kulighinskoye and
Fedortsevskoye fields in 2015.
Tax effect of deductible temporary differences:
In the context of the Group’s current structure, tax losses and current
tax assets of different Group companies may not be offset against
current tax liabilities and taxable profits of other Group companies
and, accordingly, taxes may accrue even where there is a consolidated
tax loss.
The deferred tax asset originates from the Group’s Russian operations.
The Group has made an assessment of the recoverability of deferred
tax asset and based on the updated Group’s strategy, related capital
expenditure plans and future profit forecasts the deferred tax asset is
considered to be recoverable.
9 Inventories
10 Accounts receivable and prepayments
In 2011 the Group was in process of listing and new capital raising
from the investors. During the process certain costs were incurred
by the Group that related to legal fees, accountancy, and competent
person assessment of the reserves held by the company and similar.
The costs directly related to the capital raising and were not part of the
operational cost of the Company. As the result the amount of 7,196
TSEK were capitalized and are recorded as next period expenses as of
31 December 2015. During 2015 certain capital was raised at the level
of subsidiaries via third party lending. Equity financing or instruments
of debt conversion type are being assessed as an option for further
financing of the company. Low oil price and its unpredictability were
main reasons for the initiatives being on hold in 2015. The company’s
management intention is that further capital will be raised through
2016 and potentially 2017. Such new issue would partially benefit
from past track record and therefore at the moment of capital raising
the intention is to offset the capitalized cost against share premium
related to new capital.
In thousand SEK
Current tax
Deferred tax
Income tax expenses
2015
0
(170)
(170)
2014
0
(52)
(52)
In thousand SEK
Profit before tax
Theoretical income tax
2015
(6,181)
1,339
2014
(8,085)
(241)
Income/expense for which no deferred income tax
liabilities/assets was recognised
Tax charge
189
(52)
(1,509)
(170)
Tax effect of:
In thousand SEK
Property, plant and equipment
Accounts receivable and prepayments
Intangible assets
Accounts payable and accruals
Deferred tax liability
31.12.2015
(552)
(1,292)
(2,076)
(21)
(3,941)
31.12.2014
0
0
0
0
0
In thousand SEK
Loss carry-forward
Accounts receivable and prepayments
Deferred tax asset
31.12.2015
2,261
2,192
4,453
31.12.2014
725
0
725
In thousand SEK
Materials
Crude oil
Total inventories
31.12.2015
46
6
52
31.12.2014
1
14
15
In thousand SEK
Trade accounts receivable
Total financial accounts receivable
Advances issued
VAT prepaid
Provision for VAT prepaid
Other accounts receivable
Total accounts receivable
31.12.2015
457
457
26
1,936
(13)
7,572
9,978
31.12.2014
426
426
19
1,049
(8)
7,297
8,783
22
ANNUAL REPORT 2015
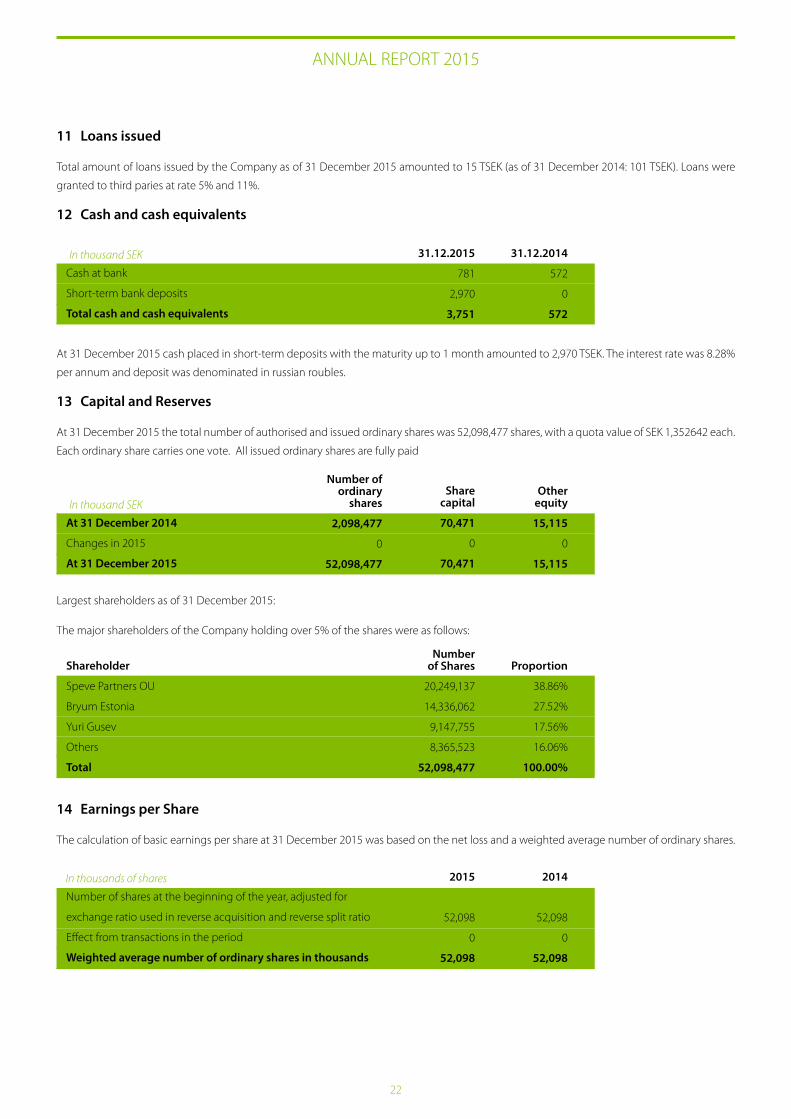
11 Loans issued
Total amount of loans issued by the Company as of 31 December 2015 amounted to 15 TSEK (as of 31 December 2014: 101 TSEK). Loans were
granted to third paries at rate 5% and 11%.
12 Cash and cash equivalents
At 31 December 2015 cash placed in short-term deposits with the maturity up to 1 month amounted to 2,970 TSEK. The interest rate was 8.28%
per annum and deposit was denominated in russian roubles.
13 Capital and Reserves
At 31 December 2015 the total number of authorised and issued ordinary shares was 52,098,477 shares, with a quota value of SEK 1,352642 each.
Each ordinary share carries one vote. All issued ordinary shares are fully paid
.
Largest shareholders as of 31 December 2015:
The major shareholders of the Company holding over 5% of the shares were as follows:
14 Earnings per Share
The calculation of basic earnings per share at 31 December 2015 was based on the net loss and a weighted average number of ordinary shares.
In thousand SEK
Cash at bank
Short-term bank deposits
Total cash and cash equivalents
31.12.2015
781
2,970
3,751
31.12.2014
572
0
572
In thousand SEK
At 31 December 2014
Changes in 2015
At 31 December 2015
Number of ordinary
shares
2,098,477
0
52,098,477
Share capital
70,471
0
70,471
Other equity
15,115
0
15,115
Shareholder
Speve Partners OU
Bryum Estonia
Yuri Gusev
Others
Total
Number of Shares
20,249,137
14,336,062
9,147,755
8,365,523
52,098,477
Proportion
38.86%
27.52%
17.56%
16.06%
100.00%
In thousands of shares
Number of shares at the beginning of the year, adjusted for
exchange ratio used in reverse acquisition and reverse split ratio
Effect from transactions in the period
Weighted average number of ordinary shares in thousands
2015
52,098
0
52,098
2014
52,098
0
52,098
23
ANNUAL REPORT 2015
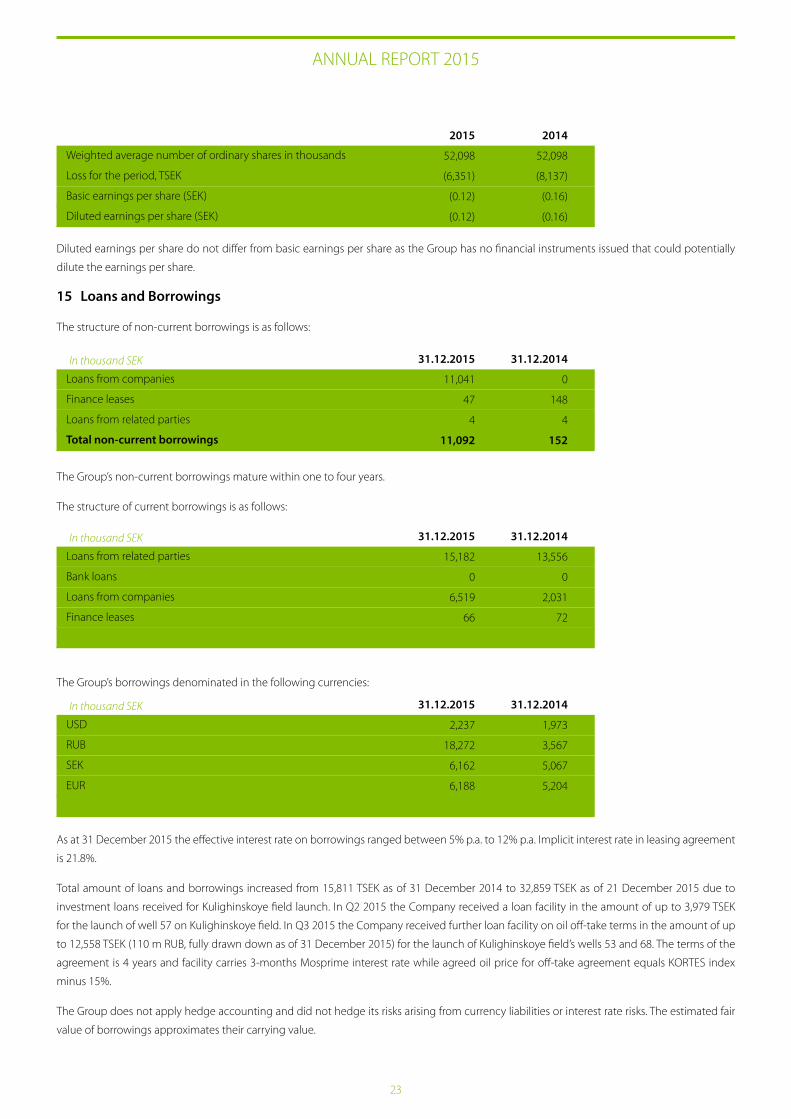
Diluted earnings per share do not differ from basic earnings per share as the Group has no financial instruments issued that could potentially
dilute the earnings per share.
15 Loans and Borrowings
The structure of non-current borrowings is as follows:
The Group’s non-current borrowings mature within one to four years.
The structure of current borrowings is as follows:
The Group’s borrowings denominated in the following currencies:
As at 31 December 2015 the effective interest rate on borrowings ranged between 5% p.a. to 12% p.a. Implicit interest rate in leasing agreement
is 21.8%.
Total amount of loans and borrowings increased from 15,811 TSEK as of 31 December 2014 to 32,859 TSEK as of 21 December 2015 due to
investment loans received for Kulighinskoye field launch. In Q2 2015 the Company received a loan facility in the amount of up to 3,979 TSEK
for the launch of well 57 on Kulighinskoye field. In Q3 2015 the Company received further loan facility on oil off-take terms in the amount of up
to 12,558 TSEK (110 m RUB, fully drawn down as of 31 December 2015) for the launch of Kulighinskoye field’s wells 53 and 68. The terms of the
agreement is 4 years and facility carries 3-months Mosprime interest rate while agreed oil price for off-take agreement equals KORTES index
minus 15%.
The Group does not apply hedge accounting and did not hedge its risks arising from currency liabilities or interest rate risks. The estimated fair
value of borrowings approximates their carrying value.
Weighted average number of ordinary shares in thousands
Loss for the period, TSEK
Basic earnings per share (SEK)
Diluted earnings per share (SEK)
2015
52,098
(6,351)
(0.12)
(0.12)
2014
52,098
(8,137)
(0.16)
(0.16)
In thousand SEK
Loans from companies
Finance leases
Loans from related parties
Total non-current borrowings
31.12.2015
11,041
47
4
11,092
31.12.2014
0
148
4
152
In thousand SEK
Loans from related parties
Bank loans
Loans from companies
Finance leases
Total current borrowings
31.12.2015
15,182
0
6,519
66
21,767
31.12.2014
13,556
0
2,031
72
15,659
In thousand SEK
USD
RUB
SEK
EUR
Total borrowings
31.12.2015
2,237
18,272
6,162
6,188
32,859
31.12.2014
1,973
3,567
5,067
5,204
15,811
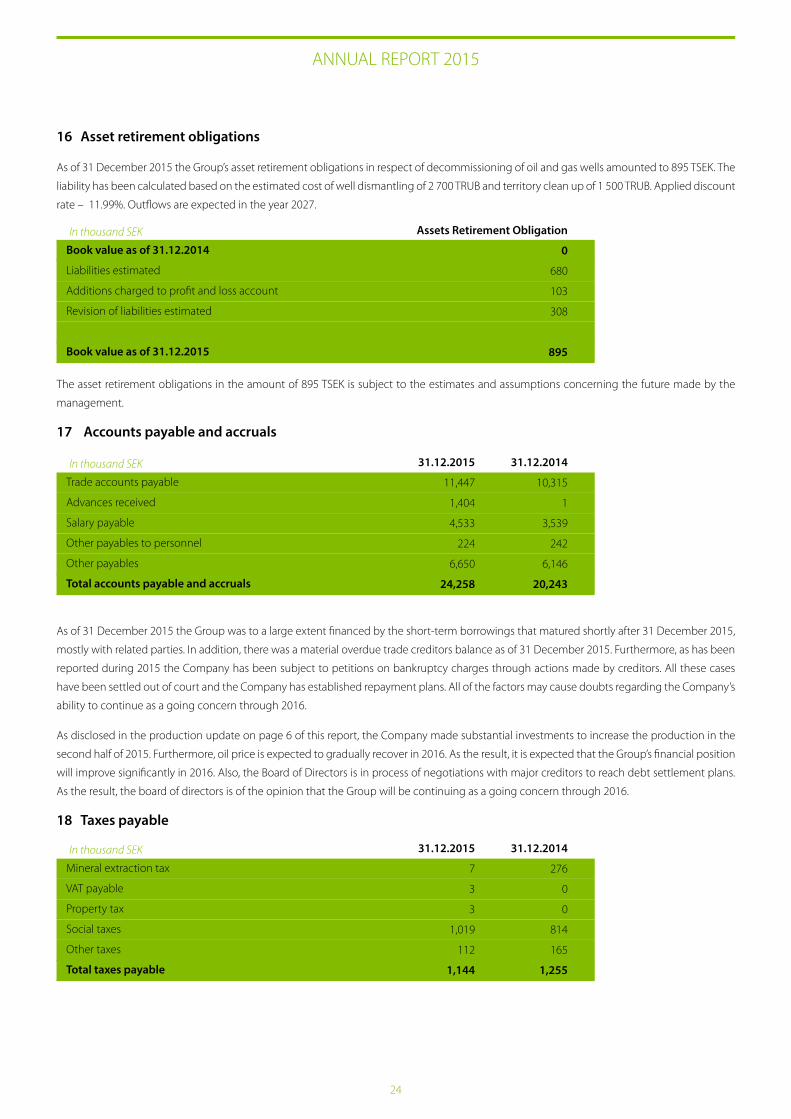
24
ANNUAL REPORT 2015
16 Asset retirement obligations
As of 31 December 2015 the Group’s asset retirement obligations in respect of decommissioning of oil and gas wells amounted to 895 TSEK. The
liability has been calculated based on the estimated cost of well dismantling of 2 700 TRUB and territory clean up of 1 500 TRUB. Applied discount
rate – 11.99%. Outflows are expected in the year 2027.
The asset retirement obligations in the amount of 895 TSEK is subject to the estimates and assumptions concerning the future made by the
management.
17 Accounts payable and accruals
As of 31 December 2015 the Group was to a large extent financed by the short-term borrowings that matured shortly after 31 December 2015,
mostly with related parties. In addition, there was a material overdue trade creditors balance as of 31 December 2015. Furthermore, as has been
reported during 2015 the Company has been subject to petitions on bankruptcy charges through actions made by creditors. All these cases
have been settled out of court and the Company has established repayment plans. All of the factors may cause doubts regarding the Company’s
ability to continue as a going concern through 2016.
As disclosed in the production update on page 6 of this report, the Company made substantial investments to increase the production in the
second half of 2015. Furthermore, oil price is expected to gradually recover in 2016. As the result, it is expected that the Group’s financial position
will improve significantly in 2016. Also, the Board of Directors is in process of negotiations with major creditors to reach debt settlement plans.
As the result, the board of directors is of the opinion that the Group will be continuing as a going concern through 2016.
18 Taxes payable
In thousand SEK
Book value as of 31.12.2014
Liabilities estimated
Additions charged to profit and loss account
Revision of liabilities estimated
Currency translation difference
Book value as of 31.12.2015
Assets Retirement Obligation
0
680
103
308
(196)
895
In thousand SEK
Trade accounts payable
Advances received
Salary payable
Other payables to personnel
Other payables
Total accounts payable and accruals
31.12.2015
11,447
1,404
4,533
224
6,650
24,258
31.12.2014
10,315
1
3,539
242
6,146
20,243
In thousand SEK
Mineral extraction tax
VAT payable
Property tax
Social taxes
Other taxes
Total taxes payable
31.12.2015
7
3
3
1,019
112
1,144
31.12.2014
276
0
0
814
165
1,255
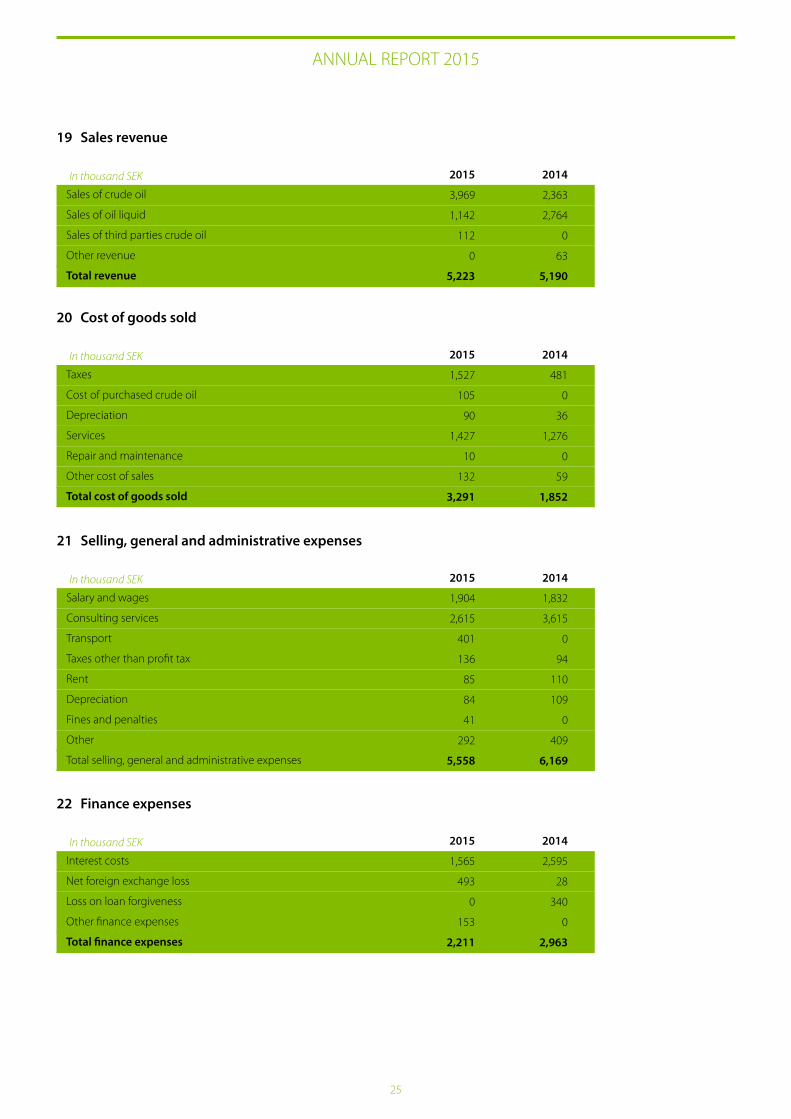
25
ANNUAL REPORT 2015
In thousand SEK
Sales of crude oil
Sales of oil liquid
Sales of third parties crude oil
Other revenue
Total revenue
2015
3,969
1,142
112
0
5,223
2014
2,363
2,764
0
63
5,190
19 Sales revenue
In thousand SEK
Taxes
Cost of purchased crude oil
Depreciation
Services
Repair and maintenance
Other cost of sales
Total cost of goods sold
2015
1,527
105
90
1,427
10
132
3,291
2014
481
0
36
1,276
0
59
1,852
20 Cost of goods sold
In thousand SEK
Salary and wages
Consulting services
Transport
Taxes other than profit tax
Rent
Depreciation
Fines and penalties
Other
Total selling, general and administrative expenses
2015
1,904
2,615
401
136
85
84
41
292
5,558
2014
1,832
3,615
0
94
110
109
0
409
6,169
21 Selling, general and administrative expenses
In thousand SEK
Interest costs
Net foreign exchange loss
Loss on loan forgiveness
Other finance expenses
Total finance expenses
2015
1,565
493
0
153
2,211
2014
2,595
28
340
0
2,963
22 Finance expenses
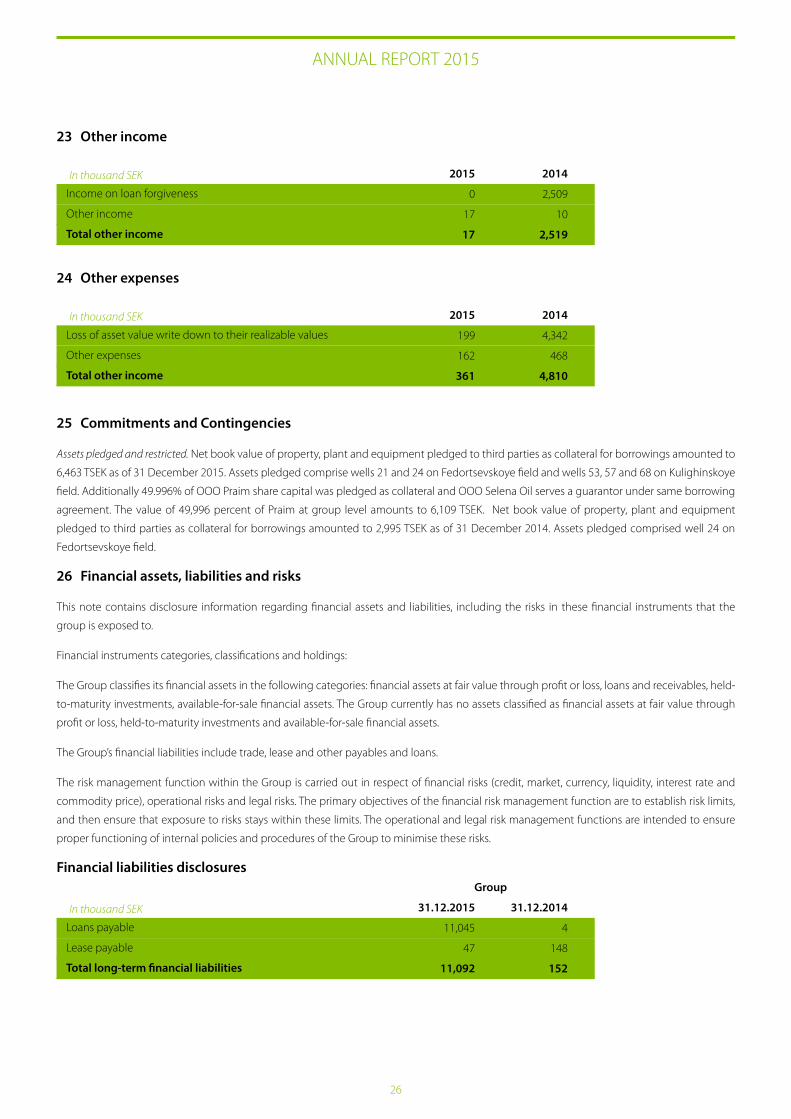
26
ANNUAL REPORT 2015
In thousand SEK
Income on loan forgiveness
Other income
Total other income
2015
0
17
17
2014
2,509
10
2,519
23 Other income
In thousand SEK
Loss of asset value write down to their realizable values
Other expenses
Total other income
2015
199
162
361
2014
4,342
468
4,810
24 Other expenses
25 Commitments and Contingencies
Assets pledged and restricted. Net book value of property, plant and equipment pledged to third parties as collateral for borrowings amounted to
6,463 TSEK as of 31 December 2015. Assets pledged comprise wells 21 and 24 on Fedortsevskoye field and wells 53, 57 and 68 on Kulighinskoye
field. Additionally 49.996% of OOO Praim share capital was pledged as collateral and OOO Selena Oil serves a guarantor under same borrowing
agreement. The value of 49,996 percent of Praim at group level amounts to 6,109 TSEK. Net book value of property, plant and equipment
pledged to third parties as collateral for borrowings amounted to 2,995 TSEK as of 31 December 2014. Assets pledged comprised well 24 on
Fedortsevskoye field.
26 Financial assets, liabilities and risks
This note contains disclosure information regarding financial assets and liabilities, including the risks in these financial instruments that the
group is exposed to.
Financial instruments categories, classifications and holdings:
The Group classifies its financial assets in the following categories: financial assets at fair value through profit or loss, loans and receivables, held-
to-maturity investments, available-for-sale financial assets. The Group currently has no assets classified as financial assets at fair value through
profit or loss, held-to-maturity investments and available-for-sale financial assets.
The Group’s financial liabilities include trade, lease and other payables and loans.
The risk management function within the Group is carried out in respect of financial risks (credit, market, currency, liquidity, interest rate and
commodity price), operational risks and legal risks. The primary objectives of the financial risk management function are to establish risk limits,
and then ensure that exposure to risks stays within these limits. The operational and legal risk management functions are intended to ensure
proper functioning of internal policies and procedures of the Group to minimise these risks.
Financial liabilities disclosures
In thousand SEK
Loans payable
Lease payable
Total long-term financial liabilities
31.12.2015
11,045
47
11,092
31.12.2014
4
148
152
Group
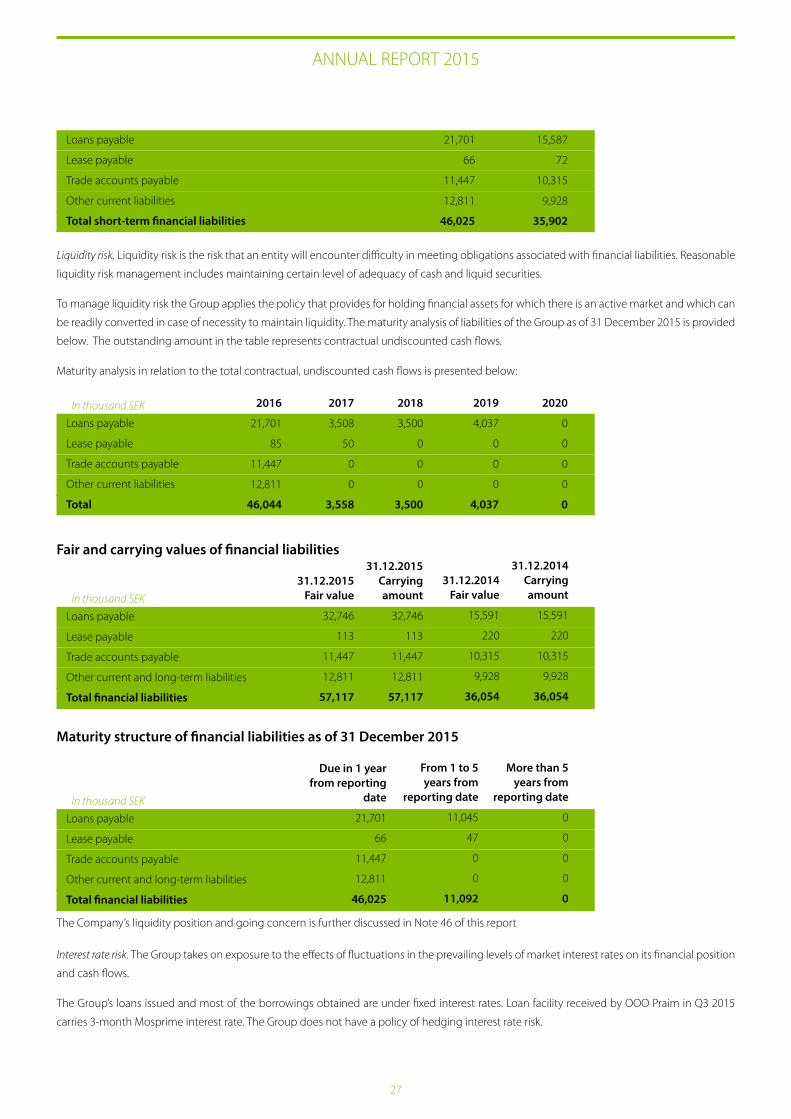
27
ANNUAL REPORT 2015
Liquidity risk. Liquidity risk is the risk that an entity will encounter difficulty in meeting obligations associated with financial liabilities. Reasonable
liquidity risk management includes maintaining certain level of adequacy of cash and liquid securities.
To manage liquidity risk the Group applies the policy that provides for holding financial assets for which there is an active market and which can
be readily converted in case of necessity to maintain liquidity. The maturity analysis of liabilities of the Group as of 31 December 2015 is provided
below. The outstanding amount in the table represents contractual undiscounted cash flows.
Maturity analysis in relation to the total contractual, undiscounted cash flows is presented below:
Fair and carrying values of financial liabilities
Maturity structure of financial liabilities as of 31 December 2015
Interest rate risk. The Group takes on exposure to the effects of fluctuations in the prevailing levels of market interest rates on its financial position
and cash flows.
The Group’s loans issued and most of the borrowings obtained are under fixed interest rates. Loan facility received by OOO Praim in Q3 2015
carries 3-month Mosprime interest rate. The Group does not have a policy of hedging interest rate risk.
Loans payable
Lease payable
Trade accounts payable
Other current liabilities
Total short-term financial liabilities
21,701
66
11,447
12,811
46,025
15,587
72
10,315
9,928
35,902
Loans payable
Lease payable
Trade accounts payable
Other current liabilities
Total
2019
4,037
0
0
0
4,037
2020
0
0
0
0
0
In thousand SEK 2017
3,508
50
0
0
3,558
2018
3,500
0
0
0
3,500
2016
21,701
85
11,447
12,811
46,044
Loans payable
Lease payable
Trade accounts payable
Other current and long-term liabilities
Total financial liabilities
In thousand SEK
31.12.2015 Fair value
32,746
113
11,447
12,811
57,117
31.12.2015 Carrying amount
32,746
113
11,447
12,811
57,117
31.12.2014 Fair value
15,591
220
10,315
9,928
36,054
31.12.2014 Carrying amount
15,591
220
10,315
9,928
36,054
Loans payable
Lease payable
Trade accounts payable
Other current and long-term liabilities
Total financial liabilities
In thousand SEK
Due in 1 year from reporting
date
21,701
66
11,447
12,811
46,025
More than 5 years from
reporting date
0
0
0
0
0
From 1 to 5 years from
reporting date
11,045
47
0
0
11,092
The Company’s liquidity position and going concern is further discussed in Note 46 of this report
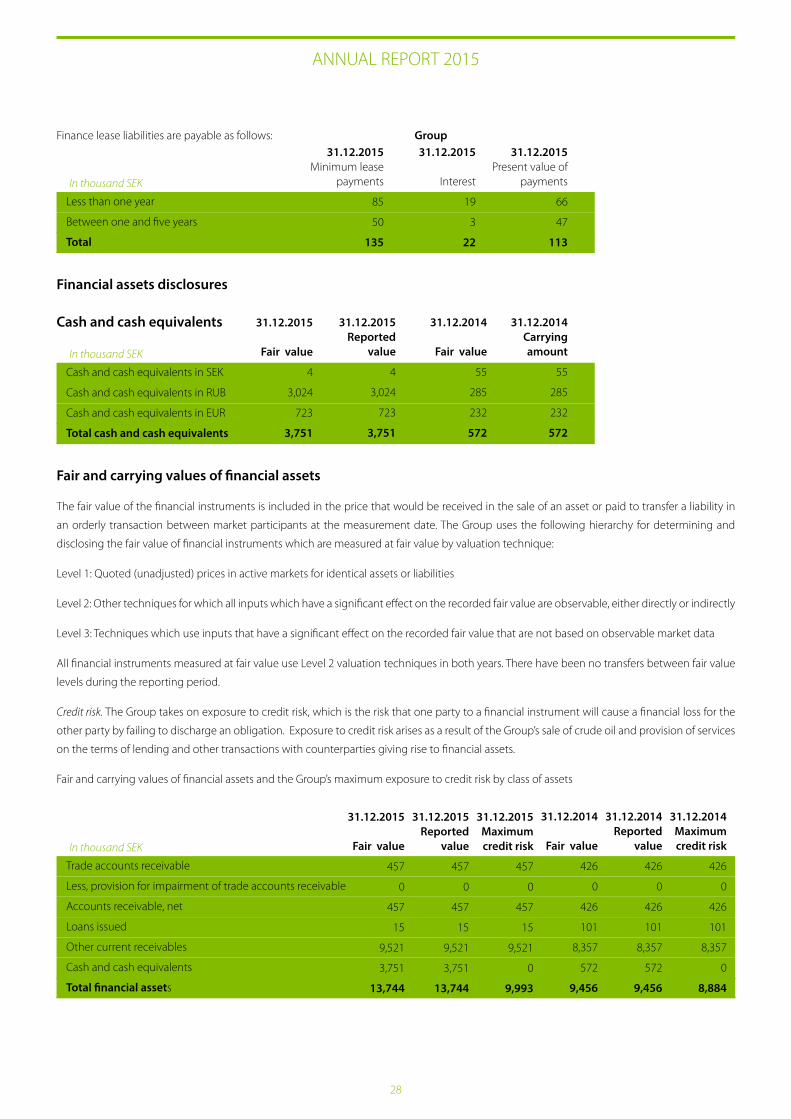
28
ANNUAL REPORT 2015
Finance lease liabilities are payable as follows:
Financial assets disclosures
Cash and cash equivalents
Fair and carrying values of financial assets
The fair value of the financial instruments is included in the price that would be received in the sale of an asset or paid to transfer a liability in
an orderly transaction between market participants at the measurement date. The Group uses the following hierarchy for determining and
disclosing the fair value of financial instruments which are measured at fair value by valuation technique:
Level 1: Quoted (unadjusted) prices in active markets for identical assets or liabilities
Level 2: Other techniques for which all inputs which have a significant effect on the recorded fair value are observable, either directly or indirectly
Level 3: Techniques which use inputs that have a significant effect on the recorded fair value that are not based on observable market data
All financial instruments measured at fair value use Level 2 valuation techniques in both years. There have been no transfers between fair value
levels during the reporting period.
Credit risk. The Group takes on exposure to credit risk, which is the risk that one party to a financial instrument will cause a financial loss for the
other party by failing to discharge an obligation. Exposure to credit risk arises as a result of the Group’s sale of crude oil and provision of services
on the terms of lending and other transactions with counterparties giving rise to financial assets.
Fair and carrying values of financial assets and the Group’s maximum exposure to credit risk by class of assets
In thousand SEK
Less than one year
Between one and five years
Total
31.12.2015Minimum lease
payments
85
50
135
Group31.12.2015
Present value of payments
66
47
113
31.12.2015
Interest
19
3
22
In thousand SEK
Cash and cash equivalents in SEK
Cash and cash equivalents in RUB
Cash and cash equivalents in EUR
Total cash and cash equivalents
31.12.2015
Fair value
4
3,024
723
3,751
31.12.2014Carrying amount
55
285
232
572
31.12.2015Reported
value
4
3,024
723
3,751
31.12.2014
Fair value
55
285
232
572
In thousand SEK
Trade accounts receivable
Less, provision for impairment of trade accounts receivable
Accounts receivable, net
Loans issued
Other current receivables
Cash and cash equivalents
Total financial assets
31.12.2015
Fair value
457
0
457
15
9,521
3,751
13,744
31.12.2015Reported
value
457
0
457
15
9,521
3,751
13,744
31.12.2015Maximum credit risk
457
0
457
15
9,521
0
9,993
31.12.2014
Fair value
426
0
426
101
8,357
572
9,456
31.12.2014Reported
value
426
0
426
101
8,357
572
9,456
31.12.2014Maximum credit risk
426
0
426
101
8,357
0
8,884
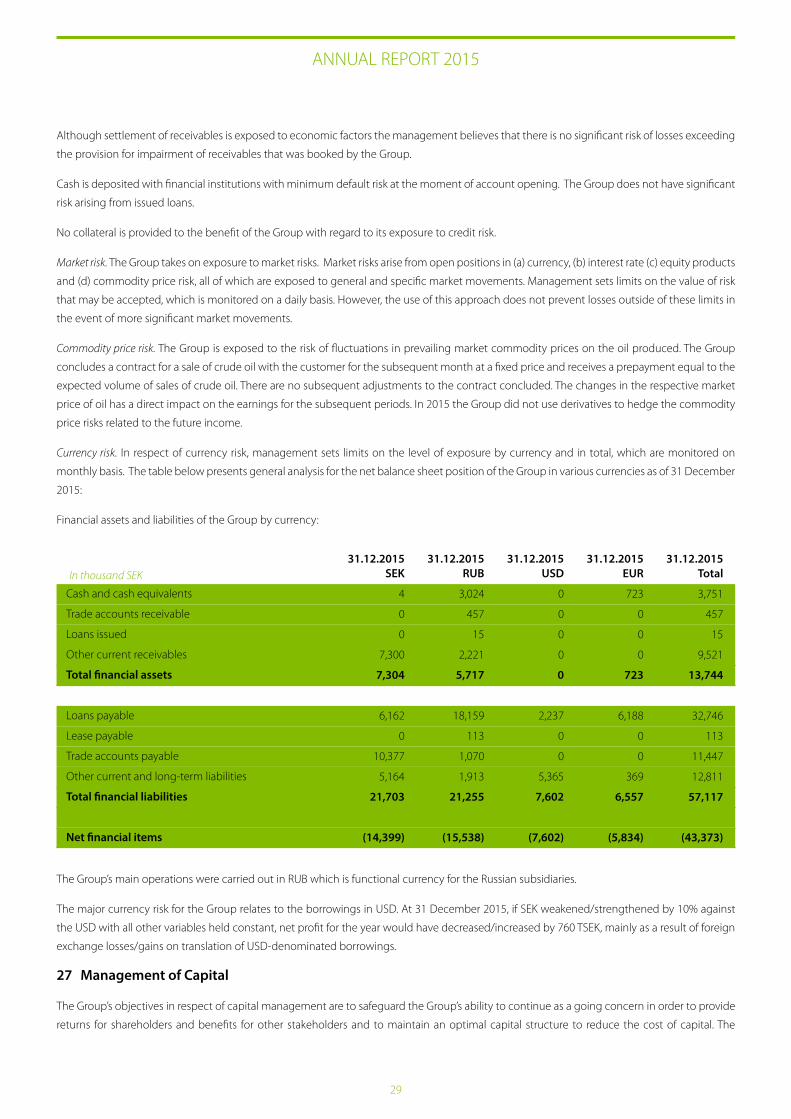
29
ANNUAL REPORT 2015
Although settlement of receivables is exposed to economic factors the management believes that there is no significant risk of losses exceeding
the provision for impairment of receivables that was booked by the Group.
Cash is deposited with financial institutions with minimum default risk at the moment of account opening. The Group does not have significant
risk arising from issued loans.
No collateral is provided to the benefit of the Group with regard to its exposure to credit risk.
Market risk. The Group takes on exposure to market risks. Market risks arise from open positions in (a) currency, (b) interest rate (c) equity products
and (d) commodity price risk, all of which are exposed to general and specific market movements. Management sets limits on the value of risk
that may be accepted, which is monitored on a daily basis. However, the use of this approach does not prevent losses outside of these limits in
the event of more significant market movements.
Commodity price risk. The Group is exposed to the risk of fluctuations in prevailing market commodity prices on the oil produced. The Group
concludes a contract for a sale of crude oil with the customer for the subsequent month at a fixed price and receives a prepayment equal to the
expected volume of sales of crude oil. There are no subsequent adjustments to the contract concluded. The changes in the respective market
price of oil has a direct impact on the earnings for the subsequent periods. In 2015 the Group did not use derivatives to hedge the commodity
price risks related to the future income.
Currency risk. In respect of currency risk, management sets limits on the level of exposure by currency and in total, which are monitored on
monthly basis. The table below presents general analysis for the net balance sheet position of the Group in various currencies as of 31 December
2015:
Financial assets and liabilities of the Group by currency:
The Group’s main operations were carried out in RUB which is functional currency for the Russian subsidiaries.
The major currency risk for the Group relates to the borrowings in USD. At 31 December 2015, if SEK weakened/strengthened by 10% against
the USD with all other variables held constant, net profit for the year would have decreased/increased by 760 TSEK, mainly as a result of foreign
exchange losses/gains on translation of USD-denominated borrowings.
27 Management of Capital
The Group’s objectives in respect of capital management are to safeguard the Group’s ability to continue as a going concern in order to provide
returns for shareholders and benefits for other stakeholders and to maintain an optimal capital structure to reduce the cost of capital. The
In thousand SEK
Cash and cash equivalents
Trade accounts receivable
Loans issued
Other current receivables
Total financial assets
Loans payable
Lease payable
Trade accounts payable
Other current and long-term liabilities
Total financial liabilities
Net financial items
31.12.2015SEK
4
0
0
7,300
7,304
6,162
0
10,377
5,164
21,703
(14,399)
31.12.2015RUB
3,024
457
15
2,221
5,717
18,159
113
1,070
1,913
21,255
(15,538)
31.12.2015USD
0
0
0
0
0
2,237
0
0
5,365
7,602
(7,602)
31.12.2015EUR
723
0
0
0
723
6,188
0
0
369
6,557
(5,834)
31.12.2015Total
3,751
457
15
9,521
13,744
32,746
113
11,447
12,811
57,117
(43,373)
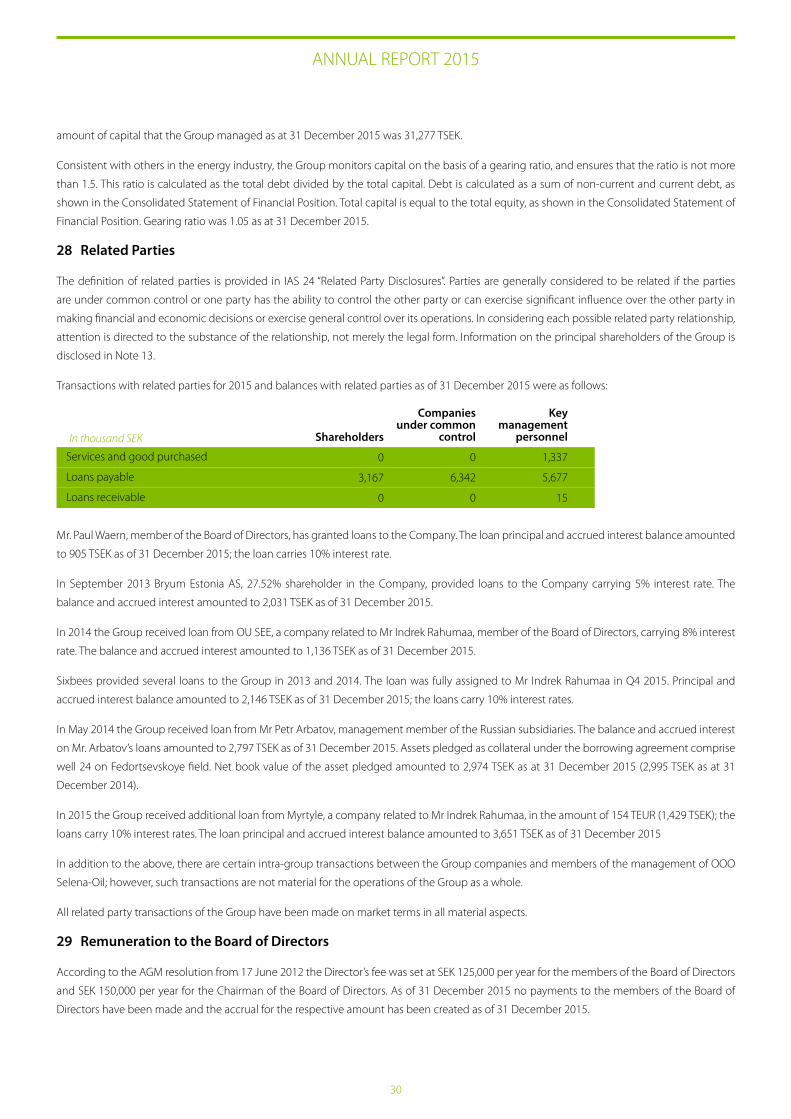
30
ANNUAL REPORT 2015
amount of capital that the Group managed as at 31 December 2015 was 31,277 TSEK.
Consistent with others in the energy industry, the Group monitors capital on the basis of a gearing ratio, and ensures that the ratio is not more
than 1.5. This ratio is calculated as the total debt divided by the total capital. Debt is calculated as a sum of non-current and current debt, as
shown in the Consolidated Statement of Financial Position. Total capital is equal to the total equity, as shown in the Consolidated Statement of
Financial Position. Gearing ratio was 1.05 as at 31 December 2015.
28 Related Parties
The definition of related parties is provided in IAS 24 “Related Party Disclosures”. Parties are generally considered to be related if the parties
are under common control or one party has the ability to control the other party or can exercise significant influence over the other party in
making financial and economic decisions or exercise general control over its operations. In considering each possible related party relationship,
attention is directed to the substance of the relationship, not merely the legal form. Information on the principal shareholders of the Group is
disclosed in Note 13.
Transactions with related parties for 2015 and balances with related parties as of 31 December 2015 were as follows:
Mr. Paul Waern, member of the Board of Directors, has granted loans to the Company. The loan principal and accrued interest balance amounted
to 905 TSEK as of 31 December 2015; the loan carries 10% interest rate.
In September 2013 Bryum Estonia AS, 27.52% shareholder in the Company, provided loans to the Company carrying 5% interest rate. The
balance and accrued interest amounted to 2,031 TSEK as of 31 December 2015.
In 2014 the Group received loan from OU SEE, a company related to Mr Indrek Rahumaa, member of the Board of Directors, carrying 8% interest
rate. The balance and accrued interest amounted to 1,136 TSEK as of 31 December 2015.
Sixbees provided several loans to the Group in 2013 and 2014. The loan was fully assigned to Mr Indrek Rahumaa in Q4 2015. Principal and
accrued interest balance amounted to 2,146 TSEK as of 31 December 2015; the loans carry 10% interest rates.
In May 2014 the Group received loan from Mr Petr Arbatov, management member of the Russian subsidiaries. The balance and accrued interest
on Mr. Arbatov’s loans amounted to 2,797 TSEK as of 31 December 2015. Assets pledged as collateral under the borrowing agreement comprise
well 24 on Fedortsevskoye field. Net book value of the asset pledged amounted to 2,974 TSEK as at 31 December 2015 (2,995 TSEK as at 31
December 2014).
In 2015 the Group received additional loan from Myrtyle, a company related to Mr Indrek Rahumaa, in the amount of 154 TEUR (1,429 TSEK); the
loans carry 10% interest rates. The loan principal and accrued interest balance amounted to 3,651 TSEK as of 31 December 2015
In addition to the above, there are certain intra-group transactions between the Group companies and members of the management of OOO
Selena-Oil; however, such transactions are not material for the operations of the Group as a whole.
All related party transactions of the Group have been made on market terms in all material aspects.
29 Remuneration to the Board of Directors
According to the AGM resolution from 17 June 2012 the Director’s fee was set at SEK 125,000 per year for the members of the Board of Directors
and SEK 150,000 per year for the Chairman of the Board of Directors. As of 31 December 2015 no payments to the members of the Board of
Directors have been made and the accrual for the respective amount has been created as of 31 December 2015.
In thousand SEK
Services and good purchased
Loans payable
Loans receivable
Key management
personnel
1,337
5,677
15
Companies under common
control
0
6,342
0
Shareholders
0
3,167
0
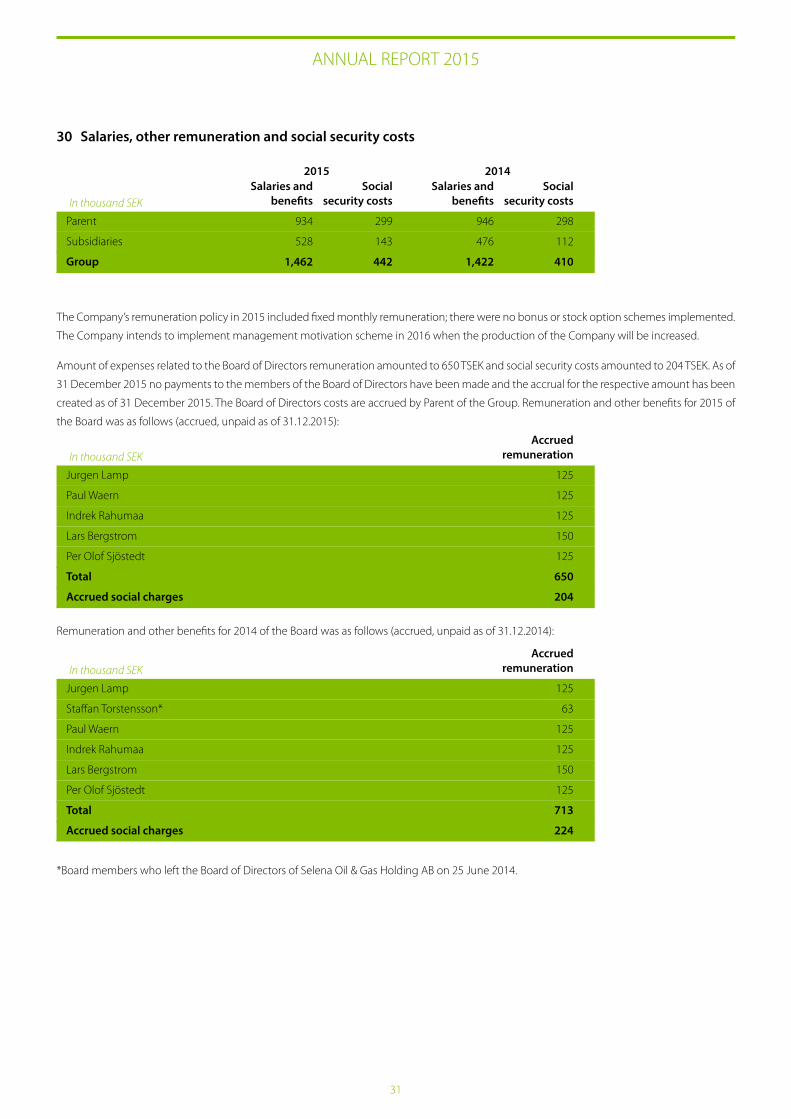
31
ANNUAL REPORT 2015
30 Salaries, other remuneration and social security costs
The Company’s remuneration policy in 2015 included fixed monthly remuneration; there were no bonus or stock option schemes implemented.
The Company intends to implement management motivation scheme in 2016 when the production of the Company will be increased.
Amount of expenses related to the Board of Directors remuneration amounted to 650 TSEK and social security costs amounted to 204 TSEK. As of
31 December 2015 no payments to the members of the Board of Directors have been made and the accrual for the respective amount has been
created as of 31 December 2015. The Board of Directors costs are accrued by Parent of the Group. Remuneration and other benefits for 2015 of
the Board was as follows (accrued, unpaid as of 31.12.2015):
Remuneration and other benefits for 2014 of the Board was as follows (accrued, unpaid as of 31.12.2014):
*Board members who left the Board of Directors of Selena Oil & Gas Holding AB on 25 June 2014.
In thousand SEK
Parent
Subsidiaries
Group
Salaries and benefits
934
528
1,462
Social security costs
299
143
442
2015Salaries and
benefits
946
476
1,422
Social security costs
298
112
410
2014
In thousand SEK
Jurgen Lamp
Paul Waern
Indrek Rahumaa
Lars Bergstrom
Per Olof Sjöstedt
Total
Accrued social charges
Accrued remuneration
125
125
125
150
125
650
204
In thousand SEK
Jurgen Lamp
Staffan Torstensson*
Paul Waern
Indrek Rahumaa
Lars Bergstrom
Per Olof Sjöstedt
Total
Accrued social charges
Accrued remuneration
125
63
125
125
150
125
713
224
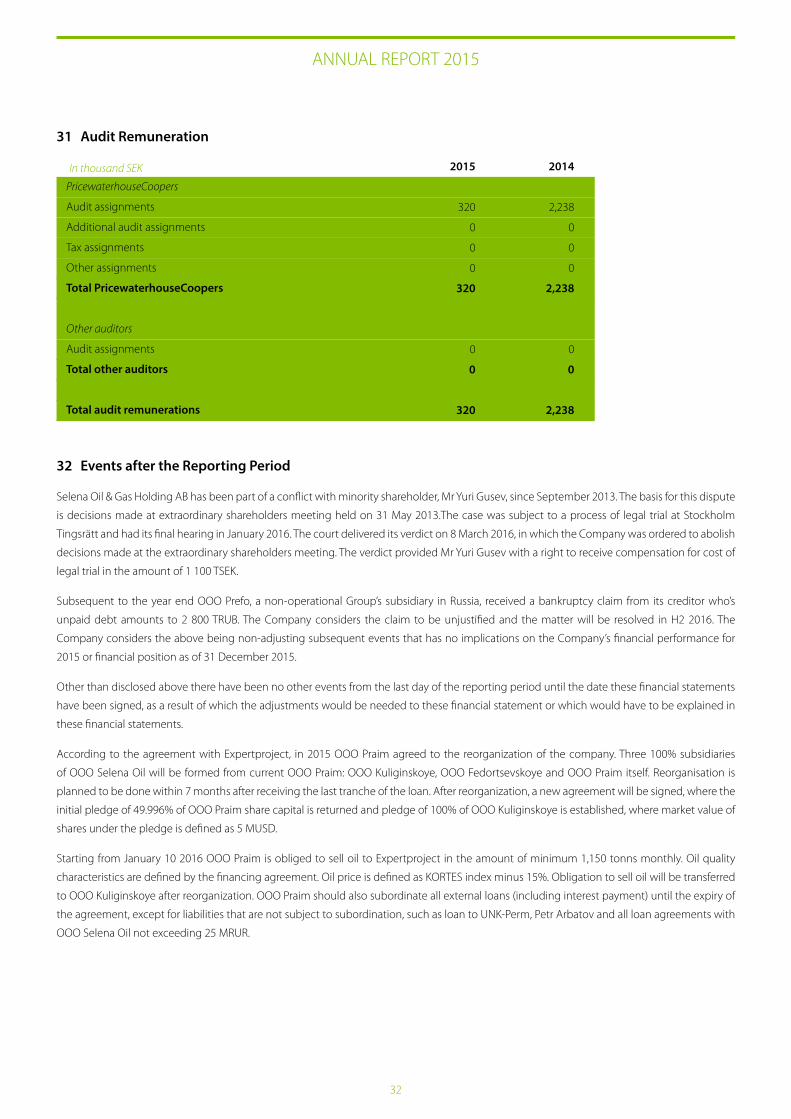
32
31 Audit Remuneration
32 Events after the Reporting Period
Selena Oil & Gas Holding AB has been part of a conflict with minority shareholder, Mr Yuri Gusev, since September 2013. The basis for this dispute
is decisions made at extraordinary shareholders meeting held on 31 May 2013.The case was subject to a process of legal trial at Stockholm
Tingsrätt and had its final hearing in January 2016. The court delivered its verdict on 8 March 2016, in which the Company was ordered to abolish
decisions made at the extraordinary shareholders meeting. The verdict provided Mr Yuri Gusev with a right to receive compensation for cost of
legal trial in the amount of 1 100 TSEK.
Subsequent to the year end OOO Prefo, a non-operational Group’s subsidiary in Russia, received a bankruptcy claim from its creditor who’s
unpaid debt amounts to 2 800 TRUB. The Company considers the claim to be unjustified and the matter will be resolved in H2 2016. The
Company considers the above being non-adjusting subsequent events that has no implications on the Company’s financial performance for
2015 or financial position as of 31 December 2015.
Other than disclosed above there have been no other events from the last day of the reporting period until the date these financial statements
have been signed, as a result of which the adjustments would be needed to these financial statement or which would have to be explained in
these financial statements.
According to the agreement with Expertproject, in 2015 OOO Praim agreed to the reorganization of the company. Three 100% subsidiaries
of OOO Selena Oil will be formed from current OOO Praim: OOO Kuliginskoye, OOO Fedortsevskoye and OOO Praim itself. Reorganisation is
planned to be done within 7 months after receiving the last tranche of the loan. After reorganization, a new agreement will be signed, where the
initial pledge of 49.996% of OOO Praim share capital is returned and pledge of 100% of OOO Kuliginskoye is established, where market value of
shares under the pledge is defined as 5 MUSD.
Starting from January 10 2016 OOO Praim is obliged to sell oil to Expertproject in the amount of minimum 1,150 tonns monthly. Oil quality
characteristics are defined by the financing agreement. Oil price is defined as KORTES index minus 15%. Obligation to sell oil will be transferred
to OOO Kuliginskoye after reorganization. OOO Praim should also subordinate all external loans (including interest payment) until the expiry of
the agreement, except for liabilities that are not subject to subordination, such as loan to UNK-Perm, Petr Arbatov and all loan agreements with
OOO Selena Oil not exceeding 25 MRUR.
ANNUAL REPORT 2015
In thousand SEK
PricewaterhouseCoopers
Audit assignments
Additional audit assignments
Tax assignments
Other assignments
Total PricewaterhouseCoopers
Other auditors
Audit assignments
Total other auditors
Total audit remunerations
2015
320
0
0
0
320
0
0
320
2014
2,238
0
0
0
2,238
0
0
2,238
33
ANNUAL REPORT 2015
Parent Company Financial Information
Comments on the Parent Company
The legal parent of the Group from 6 May 2011 is Selena Oil & Gas Holding AB (publ) (previously – Emitor Holding AB). The name of the Parent
company was changed in Q2 2011.
The business of the Parent company is now investment in and management of oil and gas assets.
The net assets of the Parent company amounted to 70,942 TSEK as of 31 December 2015 and net loss amounted to 3,970 TSEK for the year ended
31 December 2015.
Accounting Principles
The financial statements of the Parent Company are prepared in accordance with accounting principles generally accepted in Sweden, applying
RFR 2 issued by the Swedish Financial Reporting Board and the Annual Accounts Act (1995: 1554). RFR 2 requires the Parent Company to use
similar accounting principles as for the Group, i.e. IFRS to the extent allowed by RFR 2. The Parent Company’s accounting principles do not in any
material respect deviate from the Group principles, see pages 13-18.
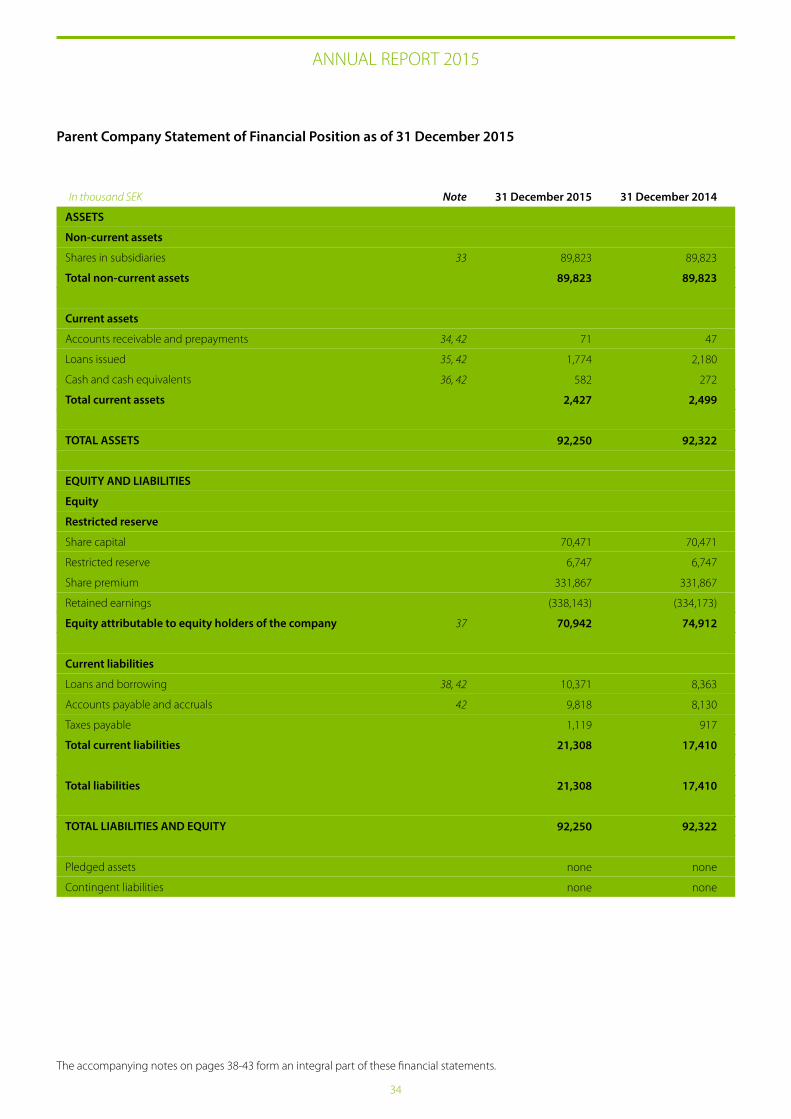
34
ANNUAL REPORT 2015
ASSETS
Non-current assets
Shares in subsidiaries
Total non-current assets
Current assets
Accounts receivable and prepayments
Loans issued
Cash and cash equivalents
Total current assets
TOTAL ASSETS
EQUITY AND LIABILITIES
Equity
Restricted reserve
Share capital
Restricted reserve
Share premium
Retained earnings
Equity attributable to equity holders of the company
Current liabilities
Loans and borrowing
Accounts payable and accruals
Taxes payable
Total current liabilities
Total liabilities
TOTAL LIABILITIES AND EQUITY
Pledged assets
Contingent liabilities
31 December 2014
89,823
89,823
47
2,180
272
2,499
92,322
70,471
6,747
331,867
(334,173)
74,912
8,363
8,130
917
17,410
17,410
92,322
none
none
31 December 2015
89,823
89,823
71
1,774
582
2,427
92,250
70,471
6,747
331,867
(338,143)
70,942
10,371
9,818
1,119
21,308
21,308
92,250
none
none
Parent Company Statement of Financial Position as of 31 December 2015
In thousand SEK Note
33
34, 42
35, 42
36, 42
37
38, 42
42
The accompanying notes on pages 38-43 form an integral part of these financial statements.
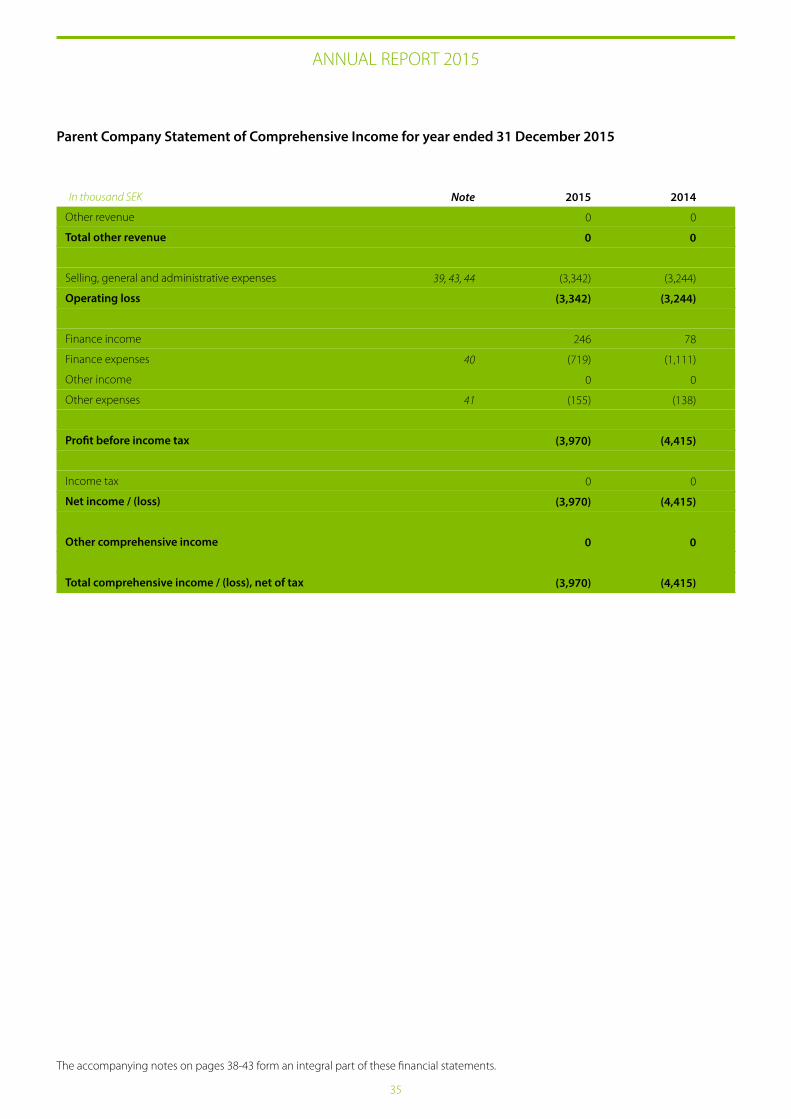
35
Other revenue
Total other revenue
Selling, general and administrative expenses
Operating loss
Finance income
Finance expenses
Other income
Other expenses
Profit before income tax
Income tax
Net income / (loss)
Other comprehensive income
Total comprehensive income / (loss), net of tax
Parent Company Statement of Comprehensive Income for year ended 31 December 2015
In thousand SEK
ANNUAL REPORT 2015
2015
0
0
(3,342)
(3,342)
246
(719)
0
(155)
(3,970)
0
(3,970)
0
(3,970)
2014
0
0
(3,244)
(3,244)
78
(1,111)
0
(138)
(4,415)
0
(4,415)
0
(4,415)
Note
39, 43, 44
40
41
The accompanying notes on pages 38-43 form an integral part of these financial statements.
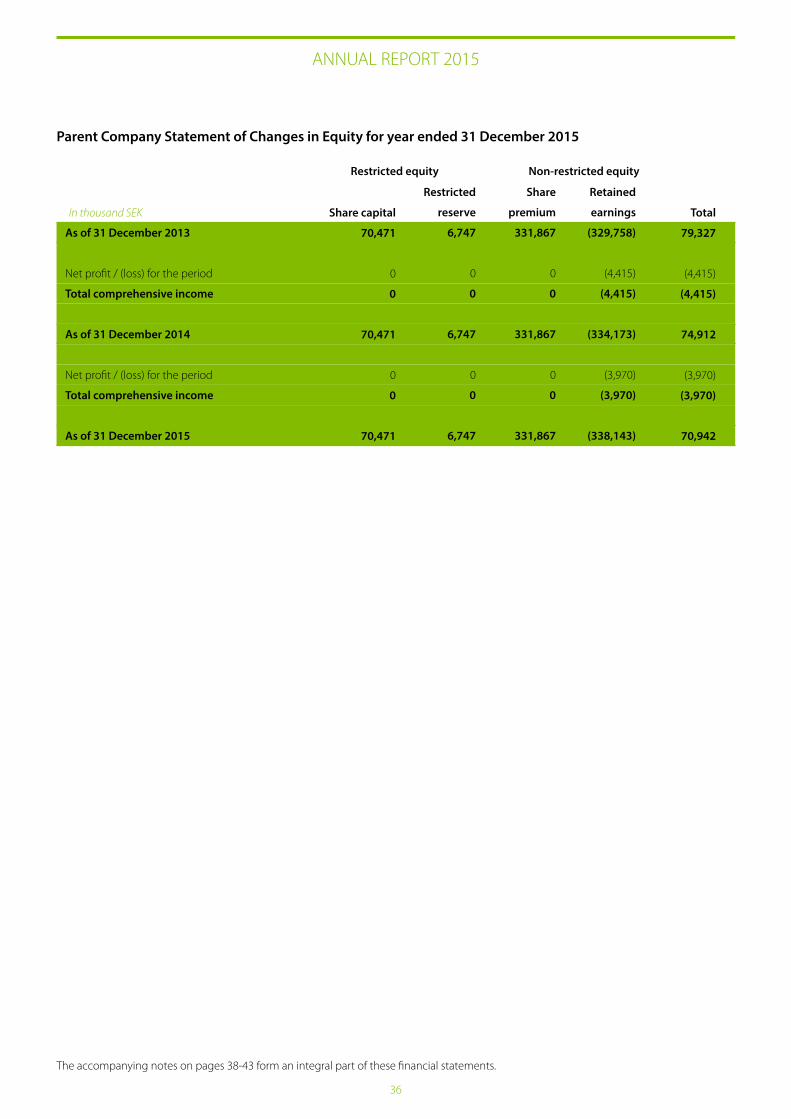
36
As of 31 December 2013
Net profit / (loss) for the period
Total comprehensive income
As of 31 December 2014
Net profit / (loss) for the period
Total comprehensive income
As of 31 December 2015
Share
premium
331,867
0
0
331,867
0
0
331,867
Parent Company Statement of Changes in Equity for year ended 31 December 2015
In thousand SEK
ANNUAL REPORT 2015
Total
79,327
(4,415)
(4,415)
74,912
(3,970)
(3,970)
70,942
Retained
earnings
(329,758)
(4,415)
(4,415)
(334,173)
(3,970)
(3,970)
(338,143)
Share capital
70,471
0
0
70,471
0
0
70,471
Restricted
reserve
6,747
0
0
6,747
0
0
6,747
Restricted equity Non-restricted equity
The accompanying notes on pages 38-43 form an integral part of these financial statements.
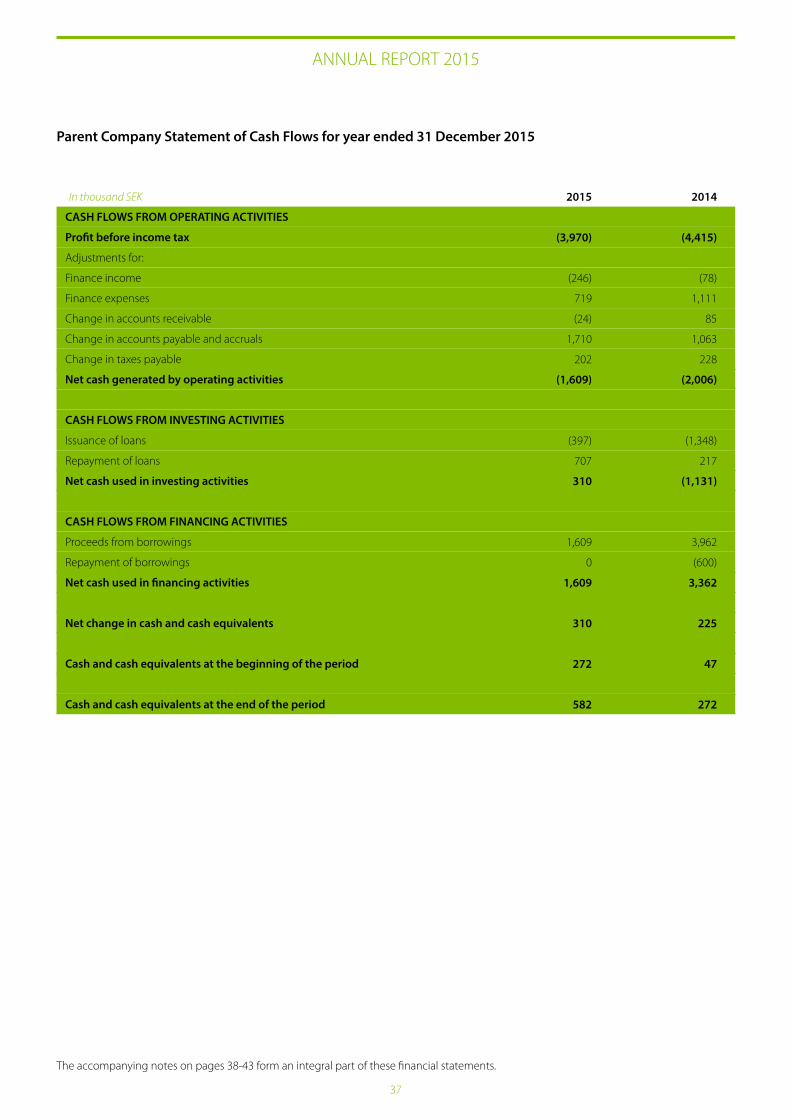
37
ANNUAL REPORT 2015
CASH FLOWS FROM OPERATING ACTIVITIES
Profit before income tax
Adjustments for:
Finance income
Finance expenses
Change in accounts receivable
Change in accounts payable and accruals
Change in taxes payable
Net cash generated by operating activities
CASH FLOWS FROM INVESTING ACTIVITIES
Issuance of loans
Repayment of loans
Net cash used in investing activities
CASH FLOWS FROM FINANCING ACTIVITIES
Proceeds from borrowings
Repayment of borrowings
Net cash used in financing activities
Net change in cash and cash equivalents
Cash and cash equivalents at the beginning of the period
Cash and cash equivalents at the end of the period
2014
(4,415)
(78)
1,111
85
1,063
228
(2,006)
(1,348)
217
(1,131)
3,962
(600)
3,362
225
47
272
2015
(3,970)
(246)
719
(24)
1,710
202
(1,609)
(397)
707
310
1,609
0
1,609
310
272
582
Parent Company Statement of Cash Flows for year ended 31 December 2015
In thousand SEK
The accompanying notes on pages 38-43 form an integral part of these financial statements.
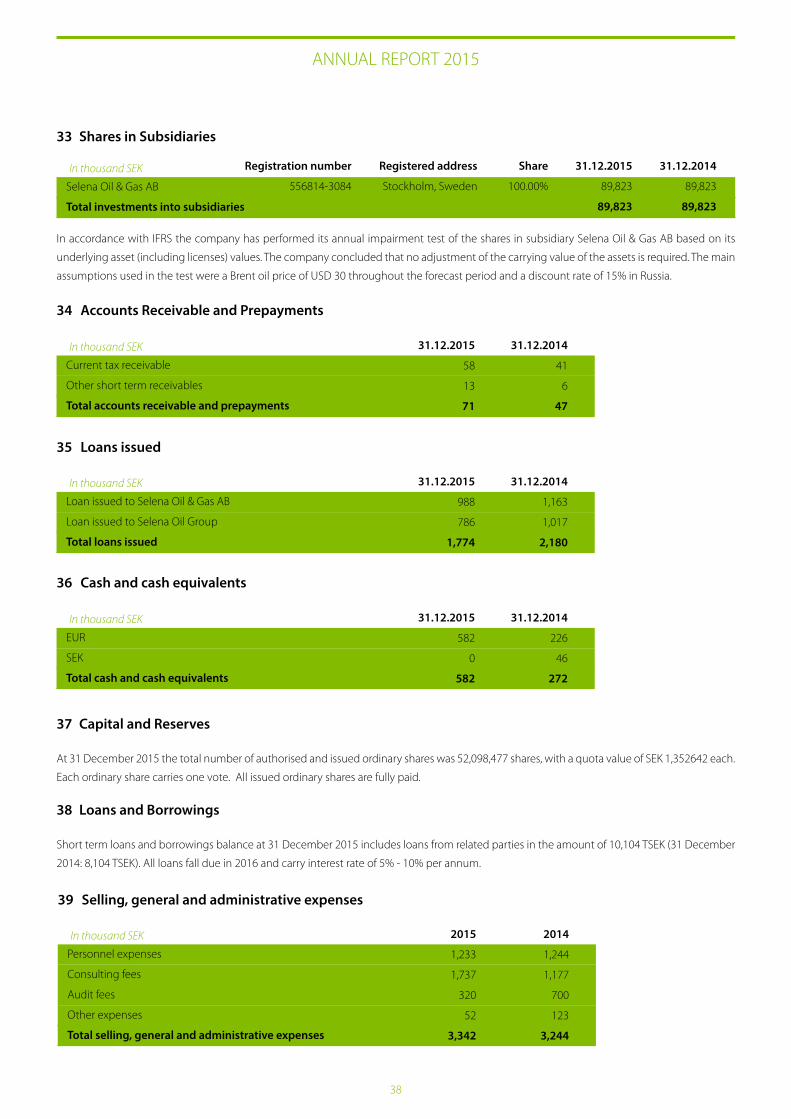
38
ANNUAL REPORT 2015
33 Shares in Subsidiaries
In accordance with IFRS the company has performed its annual impairment test of the shares in subsidiary Selena Oil & Gas AB based on its
underlying asset (including licenses) values. The company concluded that no adjustment of the carrying value of the assets is required. The main
assumptions used in the test were a Brent oil price of USD 30 throughout the forecast period and a discount rate of 15% in Russia.
In thousand SEK
Selena Oil & Gas AB
Total investments into subsidiaries
Registration number
556814-3084
Registered address
Stockholm, Sweden
Share
100.00%
31.12.2015
89,823
89,823
31.12.2014
89,823
89,823
In thousand SEK
Current tax receivable
Other short term receivables
Total accounts receivable and prepayments
31.12.2015
58
13
71
31.12.2014
41
6
47
34 Accounts Receivable and Prepayments
In thousand SEK
Loan issued to Selena Oil & Gas AB
Loan issued to Selena Oil Group
Total loans issued
31.12.2015
988
786
1,774
31.12.2014
1,163
1,017
2,180
35 Loans issued
In thousand SEK
EUR
SEK
Total cash and cash equivalents
31.12.2015
582
0
582
31.12.2014
226
46
272
36 Cash and cash equivalents
37 Capital and Reserves
At 31 December 2015 the total number of authorised and issued ordinary shares was 52,098,477 shares, with a quota value of SEK 1,352642 each.
Each ordinary share carries one vote. All issued ordinary shares are fully paid.
38 Loans and Borrowings
Short term loans and borrowings balance at 31 December 2015 includes loans from related parties in the amount of 10,104 TSEK (31 December
2014: 8,104 TSEK). All loans fall due in 2016 and carry interest rate of 5% - 10% per annum.
In thousand SEK
Personnel expenses
Consulting fees
Audit fees
Other expenses
Total selling, general and administrative expenses
2015
1,233
1,737
320
52
3,342
2014
1,244
1,177
700
123
3,244
39 Selling, general and administrative expenses
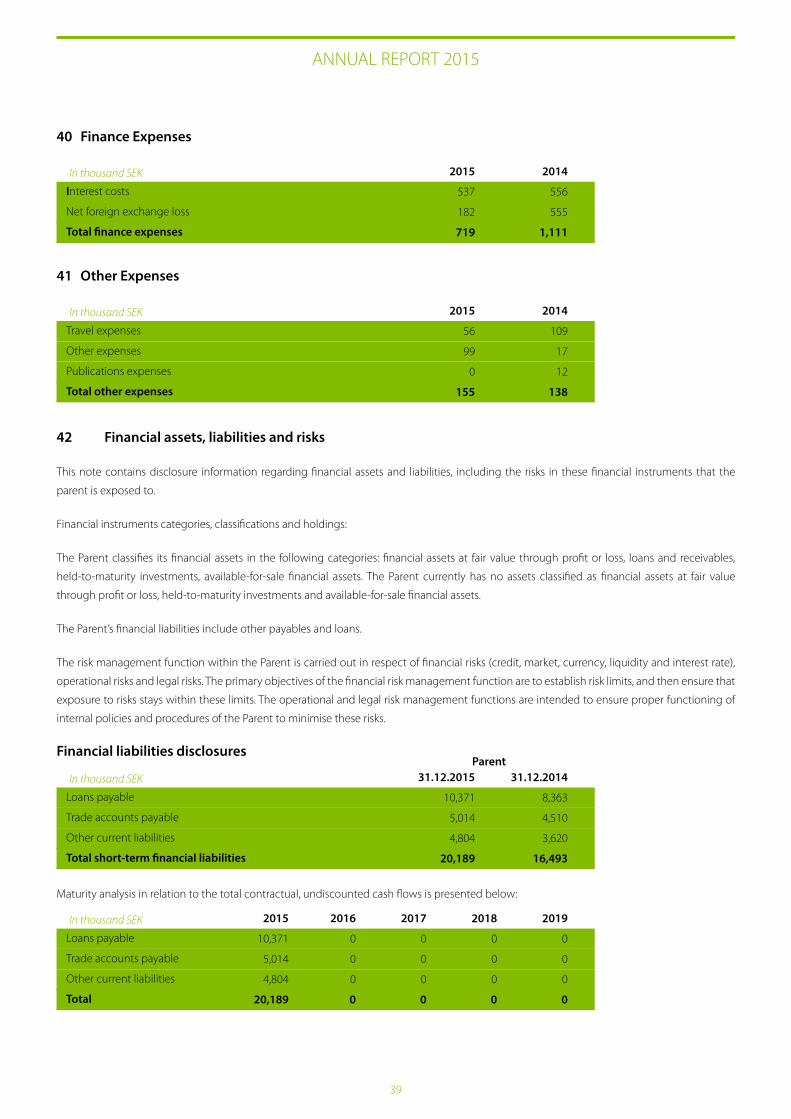
39
ANNUAL REPORT 2015
42 Financial assets, liabilities and risks
This note contains disclosure information regarding financial assets and liabilities, including the risks in these financial instruments that the
parent is exposed to.
Financial instruments categories, classifications and holdings:
The Parent classifies its financial assets in the following categories: financial assets at fair value through profit or loss, loans and receivables,
held-to-maturity investments, available-for-sale financial assets. The Parent currently has no assets classified as financial assets at fair value
through profit or loss, held-to-maturity investments and available-for-sale financial assets.
The Parent’s financial liabilities include other payables and loans.
The risk management function within the Parent is carried out in respect of financial risks (credit, market, currency, liquidity and interest rate),
operational risks and legal risks. The primary objectives of the financial risk management function are to establish risk limits, and then ensure that
exposure to risks stays within these limits. The operational and legal risk management functions are intended to ensure proper functioning of
internal policies and procedures of the Parent to minimise these risks.
Financial liabilities disclosures
In thousand SEK
Interest costs
Net foreign exchange loss
Total finance expenses
2015
537
182
719
2014
556
555
1,111
40 Finance Expenses
In thousand SEK
Travel expenses
Other expenses
Publications expenses
Total other expenses
2015
56
99
0
155
2014
109
17
12
138
41 Other Expenses
In thousand SEK
Loans payable
Trade accounts payable
Other current liabilities
Total short-term financial liabilities
31.12.2015
10,371
5,014
4,804
20,189
31.12.2014
8,363
4,510
3,620
16,493
Parent
Maturity analysis in relation to the total contractual, undiscounted cash flows is presented below:
In thousand SEK
Loans payable
Trade accounts payable
Other current liabilities
Total
2015
10,371
5,014
4,804
20,189
2016
0
0
0
0
2017
0
0
0
0
2018
0
0
0
0
2019
0
0
0
0
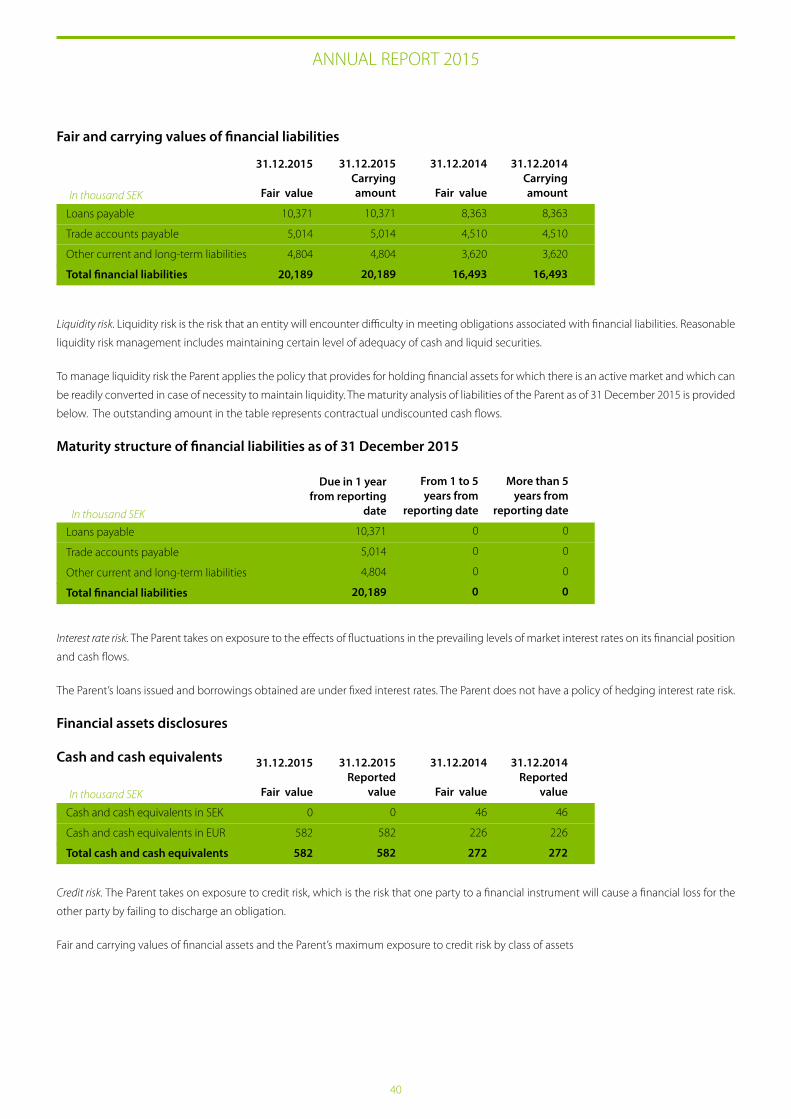
40
ANNUAL REPORT 2015
Liquidity risk. Liquidity risk is the risk that an entity will encounter difficulty in meeting obligations associated with financial liabilities. Reasonable
liquidity risk management includes maintaining certain level of adequacy of cash and liquid securities.
To manage liquidity risk the Parent applies the policy that provides for holding financial assets for which there is an active market and which can
be readily converted in case of necessity to maintain liquidity. The maturity analysis of liabilities of the Parent as of 31 December 2015 is provided
below. The outstanding amount in the table represents contractual undiscounted cash flows.
Maturity structure of financial liabilities as of 31 December 2015
Interest rate risk. The Parent takes on exposure to the effects of fluctuations in the prevailing levels of market interest rates on its financial position
and cash flows.
The Parent’s loans issued and borrowings obtained are under fixed interest rates. The Parent does not have a policy of hedging interest rate risk.
Financial assets disclosures
Cash and cash equivalents
Credit risk. The Parent takes on exposure to credit risk, which is the risk that one party to a financial instrument will cause a financial loss for the
other party by failing to discharge an obligation.
Fair and carrying values of financial assets and the Parent’s maximum exposure to credit risk by class of assets
Fair and carrying values of financial liabilities
In thousand SEK
Loans payable
Trade accounts payable
Other current and long-term liabilities
Total financial liabilities
31.12.2015
Fair value
10,371
5,014
4,804
20,189
31.12.2014Carrying amount
8,363
4,510
3,620
16,493
31.12.2015Carrying amount
10,371
5,014
4,804
20,189
31.12.2014
Fair value
8,363
4,510
3,620
16,493
Loans payable
Trade accounts payable
Other current and long-term liabilities
Total financial liabilities
In thousand SEK
Due in 1 year from reporting
date
10,371
5,014
4,804
20,189
More than 5 years from
reporting date
0
0
0
0
From 1 to 5 years from
reporting date
0
0
0
0
In thousand SEK
Cash and cash equivalents in SEK
Cash and cash equivalents in EUR
Total cash and cash equivalents
31.12.2015
Fair value
0
582
582
31.12.2014Reported
value
46
226
272
31.12.2015Reported
value
0
582
582
31.12.2014
Fair value
46
226
272
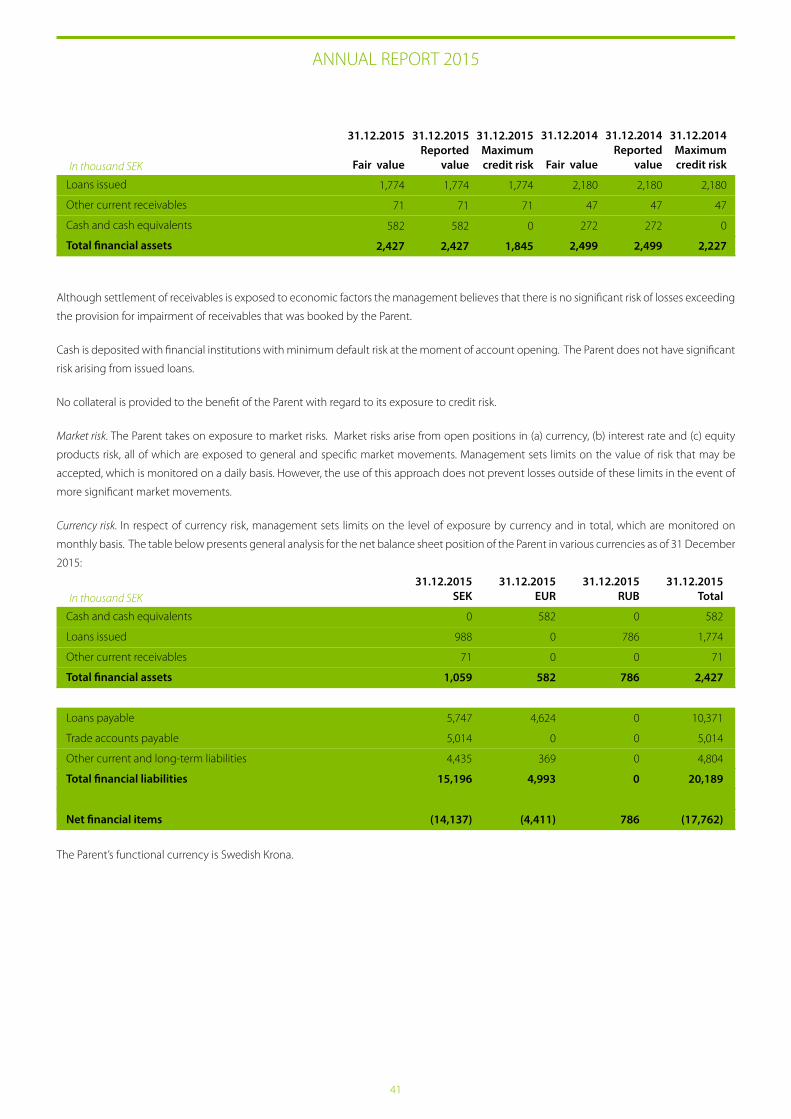
41
ANNUAL REPORT 2015
Although settlement of receivables is exposed to economic factors the management believes that there is no significant risk of losses exceeding
the provision for impairment of receivables that was booked by the Parent.
Cash is deposited with financial institutions with minimum default risk at the moment of account opening. The Parent does not have significant
risk arising from issued loans.
No collateral is provided to the benefit of the Parent with regard to its exposure to credit risk.
Market risk. The Parent takes on exposure to market risks. Market risks arise from open positions in (a) currency, (b) interest rate and (c) equity
products risk, all of which are exposed to general and specific market movements. Management sets limits on the value of risk that may be
accepted, which is monitored on a daily basis. However, the use of this approach does not prevent losses outside of these limits in the event of
more significant market movements.
Currency risk. In respect of currency risk, management sets limits on the level of exposure by currency and in total, which are monitored on
monthly basis. The table below presents general analysis for the net balance sheet position of the Parent in various currencies as of 31 December
2015:
The Parent’s functional currency is Swedish Krona.
In thousand SEK
Loans issued
Other current receivables
Cash and cash equivalents
Total financial assets
31.12.2015
Fair value
1,774
71
582
2,427
31.12.2015Reported
value
1,774
71
582
2,427
31.12.2015Maximum credit risk
1,774
71
0
1,845
31.12.2014
Fair value
2,180
47
272
2,499
31.12.2014Reported
value
2,180
47
272
2,499
31.12.2014Maximum credit risk
2,180
47
0
2,227
In thousand SEK
Cash and cash equivalents
Loans issued
Other current receivables
Total financial assets
Loans payable
Trade accounts payable
Other current and long-term liabilities
Total financial liabilities
Net financial items
31.12.2015SEK
0
988
71
1,059
5,747
5,014
4,435
15,196
(14,137)
31.12.2015RUB
0
786
0
786
0
0
0
0
786
31.12.2015EUR
582
0
0
582
4,624
0
369
4,993
(4,411)
31.12.2015Total
582
1,774
71
2,427
10,371
5,014
4,804
20,189
(17,762)
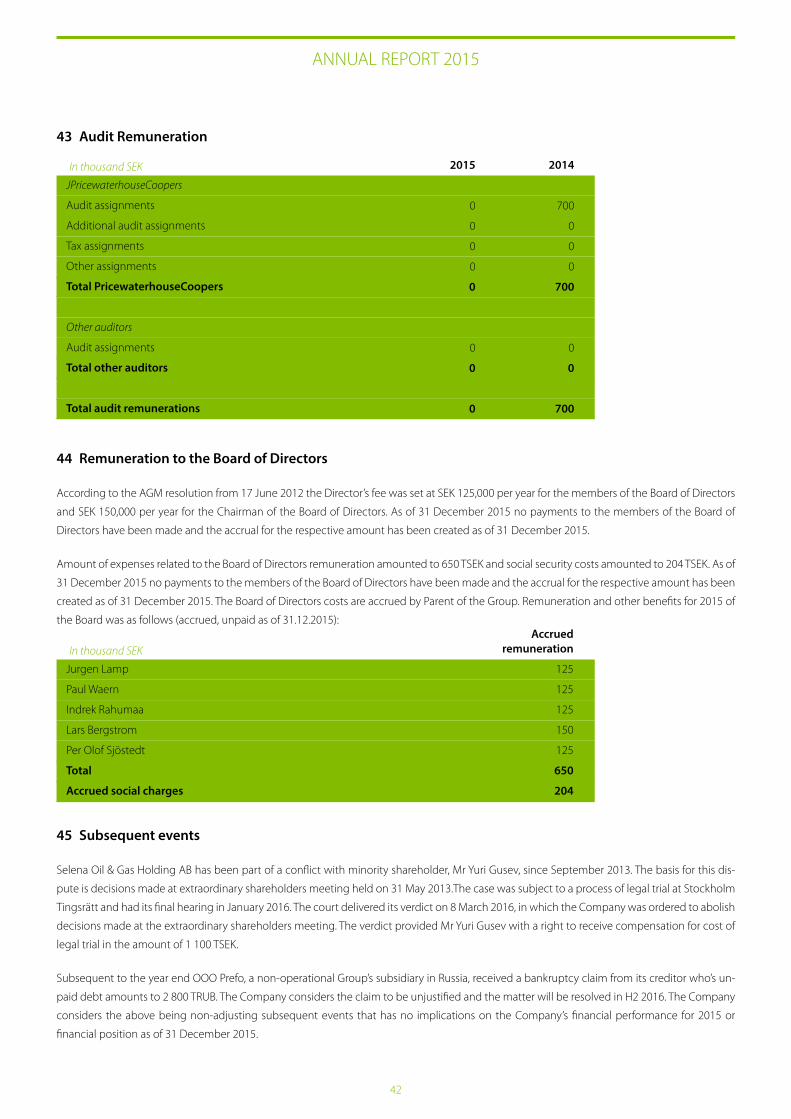
42
ANNUAL REPORT 2015
43 Audit Remuneration
44 Remuneration to the Board of Directors
According to the AGM resolution from 17 June 2012 the Director’s fee was set at SEK 125,000 per year for the members of the Board of Directors
and SEK 150,000 per year for the Chairman of the Board of Directors. As of 31 December 2015 no payments to the members of the Board of
Directors have been made and the accrual for the respective amount has been created as of 31 December 2015.
Amount of expenses related to the Board of Directors remuneration amounted to 650 TSEK and social security costs amounted to 204 TSEK. As of
31 December 2015 no payments to the members of the Board of Directors have been made and the accrual for the respective amount has been
created as of 31 December 2015. The Board of Directors costs are accrued by Parent of the Group. Remuneration and other benefits for 2015 of
the Board was as follows (accrued, unpaid as of 31.12.2015):
45 Subsequent events
Selena Oil & Gas Holding AB has been part of a conflict with minority shareholder, Mr Yuri Gusev, since September 2013. The basis for this dis-
pute is decisions made at extraordinary shareholders meeting held on 31 May 2013.The case was subject to a process of legal trial at Stockholm
Tingsrätt and had its final hearing in January 2016. The court delivered its verdict on 8 March 2016, in which the Company was ordered to abolish
decisions made at the extraordinary shareholders meeting. The verdict provided Mr Yuri Gusev with a right to receive compensation for cost of
legal trial in the amount of 1 100 TSEK.
Subsequent to the year end OOO Prefo, a non-operational Group’s subsidiary in Russia, received a bankruptcy claim from its creditor who’s un-
paid debt amounts to 2 800 TRUB. The Company considers the claim to be unjustified and the matter will be resolved in H2 2016. The Company
considers the above being non-adjusting subsequent events that has no implications on the Company’s financial performance for 2015 or
financial position as of 31 December 2015.
In thousand SEK
JPricewaterhouseCoopers
Audit assignments
Additional audit assignments
Tax assignments
Other assignments
Total PricewaterhouseCoopers
Other auditors
Audit assignments
Total other auditors
Total audit remunerations
2015
0
0
0
0
0
0
0
0
2014
700
0
0
0
700
0
0
700
In thousand SEK
Jurgen Lamp
Paul Waern
Indrek Rahumaa
Lars Bergstrom
Per Olof Sjöstedt
Total
Accrued social charges
Accrued remuneration
125
125
125
150
125
650
204
43
ANNUAL REPORT 2015
Other than disclosed above there have been no other events from the last day of the reporting period until the date these financial statements
have been signed, as a result of which the adjustments would be needed to these financial statement or which would have to be explained in
these financial statements.
46 Going concern
There was a material overdue trade creditors balance as of 31 December 2015. Furthermore, during 2015 the Company has been subject to peti-
tions on bankruptcy charges through actions made by creditors. All these cases have been settled out of court and the Company has established
repayment plans. These factors may cause doubts regarding the Company’s ability to continue as a going concern through 2016.
The Company’s subsidiary commenced production in 2014 and substantially increased it in 2015 followed by further increase in Q1 2016 and
anticipates further production increase in 2016. As the result, it is expected that the Company’s financial position will improve. Also, the Board
of Directors is in process of negotiations with major creditors to reach debt settlement plans. Furthermore, the Company has been successful to
agree payment schedules and to settle the bankruptcy charges in out of court process with the financial support of its Board of Directors and key
shareholders throughout 2015. Also, as announced by the Company on 31 May 2016 there is a share capital increase planned to be approved on
Annual General Meeting whereas share capital of the Company will be increased by 3,246 TSEK through a cash contribution. As the result, the
board of directors is of the opinion that the Group will be continuing as a going concern through 2016.
CONFIRMATION BY THE BOARD OF DIRECTORS
The Board of Directors declare that the consolidated financial statements have been prepared in accordance with IFRS as adopted by the EU
and give a true and fair view of the Group’s financial position and results of operations. The financial statements of the Parent Company have
been prepared in accordance with generally accepted accounting principles in Sweden and give a true and fair view of the Parent Company’s
financial position and results of operations. The statutory administration report of the Group and the Parent Company provides a fair review of
the development of the Group’s and the Parent Company’s operations, financial position and results of operations and describes material risks
and uncertainties facing the Parent Company and the companies included in the Group. The statements of income and financial position of the
Parent Company and the Group are subject to adoption by the Annual General Meeting on 28 June 2016.
Stockholm, 10 June 2016
Lars Bergström
Chairman
Indrek Rahumaa
Director
Paul Waern
Director
Per Olof Sjöstedt
Director
Jürgen Lamp
Director
Magnus Stuart
Managing Director
Our audit report with modifications has been submitted on June 10th, 2016
PricewaterhouseCoopers AB
Martin Johansson
Authorized Public Accountant
44
45
INDEPENDENT AUDITOR’S REPORT
Report on the annual accounts and consolidated accounts
We have audited the annual accounts and consolidated accounts of
Selena Oil & Gas Holding AB (publ) for the year 2015.
Responsibilities of the Board of Directors and the Managing
Director for the annual accounts and consolidated accounts
The Board of Directors and the Managing Director are responsible
for the preparation and fair presentation of these annual accounts in
accordance with the Annual Accounts Act and of the consolidated
accounts in accordance with International Financial Reporting
Standards, as adopted by the EU, and the Annual Accounts Act, and
for such internal control as the Board of Directors and the Managing
Director determine is necessary to enable the preparation of annual
accounts and consolidated accounts that are free from material
misstatement, whether due to fraud or error.
Auditor’s responsibility
Our responsibility is to express an opinion on these annual accounts
and consolidated accounts based on our audit. We conducted our
audit in accordance with International Standards on Auditing and
generally accepted auditing standards in Sweden. Those standards
require that we comply with ethical requirements and plan and
perform the audit to obtain reasonable assurance about whether the
annual accounts and consolidated accounts are free from material
misstatement.
An audit involves performing procedures to obtain audit evidence
about the amounts and disclosures in the annual accounts and
consolidated accounts. The procedures selected depend on the
auditor’s judgement, including the assessment of the risks of
material misstatement of the annual accounts and consolidated
accounts, whether due to fraud or error. In making those risk
assessments, the auditor considers internal control relevant to the
company’s preparation and fair presentation of the annual accounts
and consolidated accounts in order to design audit procedures that
are appropriate in the circumstances, but not for the purpose of
expressing an opinion on the effectiveness of the company’s internal
control. An audit also includes evaluating the appropriateness of
accounting policies used and the reasonableness of accounting
estimates made by the Board of Directors and the Managing Director,
as well as evaluating the overall presentation of the annual accounts
and consolidated accounts.
We believe that the audit evidence we have obtained is sufficient
and appropriate to provide a basis for our audit opinions.
Opinions
In our opinion, the annual accounts have been prepared in
accordance with the Annual Accounts Act and present fairly, in all
material respects, the financial position of the parent company as of
31 December 2015 and of its financial performance and its cash flows
for the year then ended in accordance with the Annual Accounts Act.
The consolidated accounts have been prepared in accordance with
the Annual Accounts Act and present fairly, in all material respects,
the financial position of the group as of 31 December 2015 and of
their financial performance and cash flows for the year then ended
in accordance with International Financial Reporting Standards,
as adopted by the EU, and the Annual Accounts Act. The statutory
administration report is consistent with the other parts of the annual
accounts and consolidated accounts.
We therefore recommend that the annual meeting of shareholders
adopt the income statement and balance sheet for the parent
company and the group.
Emphasis of matter
Without qualifying our opinion, we would like to draw attention to
Note 46 in the annual accounts and consolidated accounts, which
states that the company needs additional financing and implies that
there is an element of substantial uncertainty which could result
in significant doubt as to whether the company can continue as a
going concern.
Report on other legal and regulatory requirements
In addition to our audit of the annual accounts and consolidated
accounts, we have also audited the proposed appropriations of
the company’s profit or loss and the administration of the Board of
Directors and the Managing Director of Selena Oil & Gas Holding AB
(publ) for the year 2015.
Responsibilities of the Board of Directors and the Managing
Director
The Board of Directors is responsible for the proposal for appropriations
of the company’s profit or loss, and the Board of Directors and the
Managing Director are responsible for administration under the
Companies Act.
Auditor’s report
To the annual meeting of the shareholders of Selena Oil & Gas Holding AB (publ), corporate identity number 556643-6613
46
INDEPENDENT AUDITOR’S REPORT
Auditor’s responsibility
Our responsibility is to express an opinion with reasonable assurance
on the proposed appropriations of the company’s profit or loss and
on the administration based on our audit. We conducted the audit in
accordance with generally accepted auditing standards in Sweden.
As a basis for our opinion on the Board of Directors’ proposed
appropriations of the company’s profit or loss, we examined whether
the proposal is in accordance with the Companies Act.
As a basis for our opinion concerning discharge from liability, in
addition to our audit of the annual accounts and consolidated
accounts, we examined significant decisions, actions taken and
circumstances of the company in order to determine whether any
member of the Board of Directors or the Managing Director is liable
to the company. We also examined whether any member of the
Board of Directors or the Managing Director has, in any other way,
acted in contravention of the Companies Act, the Annual Accounts
Act or the Articles of Association.
We believe that the audit evidence we have obtained is sufficient
and appropriate to provide a basis for our opinions.
Opinions
We recommend to the annual meeting of shareholders that the
loss be dealt with in accordance with the proposal in the statutory
administration report and that the members of the Board of Directors
and the Managing Director be discharged from liability for the
financial year.
Remarks
Without impact on our conclusions from the audit, we emphasize
the fact that social security charges and taxes in some instances have
been paid late. This has not materially damaged the company apart
from interest charges.
Stockholm, 10 June 2016
PricewaterhouseCoopers AB
Martin Johansson
Authorized Public Accountant
OTHER INFORMATION
Certified Advisor
Mangold Fondkommission is the Company´s Certified Adviser and Liquidity Provider, telephone +46 8-503 015 50.
For further information, please contact:
Magnus Stuart, managing director
Tel: +46 706 211 350
47
Abbreviations
EBITDA Earnings Before Interest, Tax,
Depreciation and Amortisation
EUR Euro
RUR Russian rouble
SEK Swedish krona
USD US dollar
TSEK Thousand SEK
TUSD Thousand USD
TRUB Thousand RUB
Oil related terms and measurements
boe Barrels of oil equivalents
boepd Barrels of oil equivalents per day
bopd Barrels of oil per day
Mbbl Thousand barrels (in Latin mille)
Mmbbl Million barrels
Mmboe Million barrels of oil equivalents
Mboe Thousand barrels of oil equivalents
Mboepd Thousand barrels of oil equivalents per day
Mbopd Thousand barrels of oil per day

DISCLAIMER
Selena Oil & Gas Holding AB (publ) (former Emitor Holding AB) is engaged in the production and transportation of oil and gas in the Volga-Ural region in
the Russian Federation, including Perm and Udmurtia. The company was listed on NASDAQ OMX First North Premier in Stockholm under the ticker SOGH
until 9 May 2014. For further information on Selena Oil & Gas Holding AB (publ), see the website www.selenaoil.com
Disclaimer
The statement and assumptions made in the company’s information regarding current plans, forecasts, strategy and other statements that are
not historical facts are estimates or “forward looking statements” regarding future activities. Such future estimates comprise, but are not limited to,
statements that include words such as “may occur”, “plans”, “expects”, “estimates”, “believes”, “anticipates” or similar expressions. Such expressions reflect the
management’s expectations and assumptions made on the basis of information available at the date of this report. These statements and assumptions
are subject to a large number of risks and uncertainties. These, in their turn, comprise but are not limited to:
- changes in the financial, legal and political environment of the countries in which the Company operates
- changes in the available geological information concerning the Company’s operations and reserves
- the Company’s capacity to continuously guarantee sufficient financing for the expansion plans
- changes in currency exchange rates, in particular those relating to the RUR/USD rate
Due to the background of the risks and uncertainties that exist for any oil production company in an active development stage, SOGH’s actual future
development may significantly deviate from that indicated in the company’s informative statements. SOGH assumes no implicit liability to immediately
update any such future evaluations.
48


