
Consolidated Financial Statem
ents 2012-13
149
ConsolidatedFinancial Statements
2012-13
Indian Oil Corporation Limited

150

Consolidated Financial Statem
ents 2012-13
151
For B.M. CHATRATH & CO. For DASS GUPTA & ASSOCIATES For PARAKH & CO. Chartered Accountants Chartered Accountants Chartered Accountants (Firm Regn. No. 301011E) (Firm Regn. No. 000112N) (Firm Regn. No.001475C)
Sd/- Sd/- Sd/- (CA. P.R. Paul) (CA. Raaja Jindal) (CA. Thalendra Sharma) Partner Partner Partner M. No.051675 M. No. 504111 M. No. 079236
Place : New Delhi Date : 30th May, 2013
We have audited the accompanying consolidated financial statements of Indian Oil Corporation Ltd (“the Company”), its subsidiaries and its joint ventures (collectively referred to as “the Group”), which comprise the consolidated Balance Sheet as at March 31, 2013, the consolidated Statement of Profit and Loss and the consolidated Cash Flow Statement for the year then ended, and a summary of significant accounting policies and other explanatory information.
Management’s Responsibility for the Consolidated Financial Statements
Management is responsible for the preparation of these consolidated financial statements that give a true and fair view of the consolidated financial position, consolidated financial performance and consolidated cash flows of the Company in accordance with accounting principles generally accepted in India including accounting standards referred to in section 211 (3C) of the Companies Act, 1956. This responsibility includes the design, implementation and maintenance of internal control relevant to the preparation and presentation of the consolidated financial statements that give a true and fair view and are free from material misstatement, whether due to fraud or error.
Auditor’s Responsibility
Our responsibility is to express an opinion on these consolidated financial statements based on our audit. We conducted our audit in accordance with the Standards on Auditing issued by the Institute of Chartered Accountants of India. Those Standards require that we comply with ethical requirements and plan and perform the audit to obtain reasonable assurance about whether the consolidated financial statements are free from material misstatement.
An audit involves performing procedures to obtain audit evidence about the amounts and disclosures in the consolidated financial statements. The procedures selected depend on the auditor’s judgement, including the assessment of the risks of material misstatement of the consolidated financial statements, whether due to fraud or error. In making those risk assessments, the auditor considers internal control relevant to the Company’s preparation and presentation of the consolidated financial statements that give a true and fair view in order to design audit procedures that are appropriate in the circumstances. An audit also includes evaluating the appropriateness of
accounting policies used and the reasonableness of the accounting estimates made by management, as well as evaluating the overall presentation of the consolidated financial statements.
We believe that the audit evidence we have obtained is sufficient and appropriate to provide a basis for our audit opinion.
Opinion
In our opinion and to the best of our information and according to the explanations given to us and based on consideration of separate reports of the other auditors on financial statements/ consolidated financial statements of its subsidiaries and joint ventures, the consolidated financial statements give a true and fair view in conformity with the accounting principles generally accepted in India:
a) In the case of the Consolidated Balance Sheet, of the state of affairs of the Group as at 31st March, 2013;
b) In the case of the Consolidated Statement of Profit and Loss, of the profit of the Group for the year ended on that date, and
c) In the case of the Consolidated Cash Flow Statement, of the cash flows of the Group for the year ended on that date.
Other Matter
We did not audit the financial statements of subsidiary companies and joint ventures, whose financial statements reflect total assets of ` 22155.46 crore (net) as on 31st March 2013, total revenue of ̀ 54011.31 crore for the year then ended and net cash flows amounting to ` 201.57 crore for the year ended on that date as considered in the consolidated financial statements. These financial statements have been audited by other auditors whose reports have been furnished to us by the management (except in case of M/s IOT Infrastructure & Energy Services Ltd, total assets: ` 3057.18 crore (net), total revenue: ` 1368.61 crore and net cash flows: ` (21.00) crore) and in our opinion, in so far as it relates to the amount included in respect of the subsidiaries and joint ventures, is based solely on the reports of the other auditors. Our opinion is not qualified in respect of this matter.
Auditors’ Report to the Board of Directors of Indian Oil Corporation Ltd. on Consolidated Financial Statements of Indian Oil Corporation Limited, its Subsidiaries and Joint Ventures

152
(` in Crore)
Note Page Particulars March-13 March-12
EQUITY AND LIABILITIES
(1) Shareholders' Funds:
2 159 (a) Share Capital 2,427.95 2,427.95
3 160 (b) Reserves and Surplus 60,608.02 57,945.35
63,035.97 60,373.30
(2) Share application money pending allotment 1.20 0.06
(3) Minority Interest 1,261.76 1,943.74
(4) Non-current liabilities
4 161 (a) Long-term borrowings 24,712.27 18,310.40
5 162 (b) Deferred tax liabilities 6,332.92 5,970.20
6 163 (c) Other Long-term liabilities 11,528.19 9,907.33
7 164 (d) Long-term provisions 420.56 300.73
42,993.94 34,488.66
(5) Current liabilities
8 165 (a) Short-term borrowings 62,001.93 56,304.49
9 165 (b) Trade payables 33,589.56 32,209.99
6 163 (c) Other current liabilities 16,927.65 19,404.94
7 164 (d) Short-term provisions 17,888.92 15,102.04
130,408.06 123,021.46
TOTAL 237,700.93 219.827.22
ASSETS
(6) Non-current assets
(a) Fixed Assets
10 166 (i) Tangible assets 65,791.00 63,600.69
11 166 (ii) Intangible assets 895.91 960.82
12 168 (iii) Capital work-in-progress 18,992.06 15,172.38
13 169 (iv) Intangible assets under development 290.71 277.26
85,969.68 80,011.15
14 170 (b) Non-current investments 3,693.83 3,813.09
5 162 (c) Deferred tax assets 0.64 0.64
15 171 (d) Long-term loans and advances 12,229.51 10,705.44
16 173 (e) Other non-current assets 1,281.87 20.44
103,175.53 94,550.76
(7) Goodwill on Consolidation 86.95 24.39
BALANCE SHEET as at 31st March 2013
Contd...

Consolidated Financial Statem
ents 2012-13
153
(` in Crore)
Note Page Particulars March-13 March-12
Sd/- Sd/- Sd/- (R. S. Butola) (P. K. Goyal) (Raju Ranganathan) Chairman Director (Finance) Company Secretary
As per our attached Report of even date
For B.M. CHATRATH & CO. For DASS GUPTA & ASSOCIATES For PARAKH & CO. Chartered Accountants Chartered Accountants Chartered Accountants (Firm Regn. No. 301011E) (Firm Regn. No. 000112N) (Firm Regn. No.001475C)
Sd/- Sd/- Sd/- (CA. P.R. Paul) (CA. Raaja Jindal) (CA. Thalendra Sharma) Partner Partner Partner M. No. 051675 M. No. 504111 M. No. 079236
Place : New Delhi Date : 30th May, 2013
(8) Current assets
14 170 (a) Current investments 13,656.95 13,774.83
17 174 (b) Inventories 66,604.30 63,851.04
18 174 (c) Trade receivables 12,499.51 11,557.30
19 175 (d) Cash and Bank Balances 1,219.80 821.95
15 171 (e) Short-term loans and advances 37,324.97 32,914.70
16 173 (f) Other current assets 3,132.92 2,332.25
134,438.45 125,252.07
TOTAL 237,700.93 219,827.22
1 158 Principles of Consolidation and Significant Accounting Policies
2 - 37 159 Notes on Financial Statements

154
(` in Crore)
Note Page Particulars March-13 March-12
(1) Revenue:
20 175 (a) Revenue from operations (Gross) 489,389.86 438,022.73
Less: Excise Duty 27,610.19 29,099.73
Revenue from operations (Net) 461,779.67 408,923.00
21 176 (b) Other income 3,511.64 3,188.16
Total Revenue 465,291.31 412,111.16
(2) Expenses:
22 177 (a) Cost of materials consumed 264,597.02 243,660.28
(b) Purchase of Stock-in-Trade 155,528.62 121,219.90
23 177 (c) Changes in Inventory (5,515.07) (3,470.95)
24 177 (d) Employeebenefitexpenses 7,783.88 5,296.99
25 178 (e) Finance cost 7,083.52 5,894.65
(f) Depreciation, Depletion and Amortisation on :
a) Tangible Assets 5,536.96 5,156.48
b) Intangible Assets 154.54 152.78
5,691.50 5,309.26
26 178 (g) Other expenses 25,620.75 22,768.14
Total expenses 460,790.22 400,678.27
(3) ProfitbeforePriorPeriod,ExceptionalItemsandTax 4,501.09 11,432.89
27 180 (4) Income / (Expenses) pertaining to Prior Years (Net) 3.16 270.25
(5) ProfitbeforeExceptionalItemsandTax 4,504.25 11,703.14
(6) Exceptional Items - (7,707.82)
(7) ProfitbeforeTax 4,504.25 3,995.32
(8) Tax expense:
Current tax 969.35 790.36 [includes ` (25.71) crore (2012 : ` (507.08) crore) relating to prior years]
Mat Credit Entitlement (455.31) (1.03)
Deferred tax 362.91 (1,059.28) [includes `NIL(2012 : ` 150.53 crore) relating to prior years]
STaTEmENTofPRofITaNDLoSSfortheYearEnded31st March 2013
Contd...

Consolidated Financial Statem
ents 2012-13
155
(` in Crore)
Note Page Particulars March-13 March-12
(9) Profit/(loss)fortheperiod 3,627.30 4,265.27
(10) Less: Share of Minority (821.71) 39.29
(11) Profit/(loss)fortheGroup 4,449.01 4,225.98
33 188 (12) Earning per Equity Share (`):
(1) Basic 18.32 17.41
(2) Diluted 18.32 17.41
Face Value Per Equity Share (`) 10 10
1 158 Principles of Consolidation and Significant Accounting Policies
2 - 37 159 Notes on Financial Statements
Total Income includes ` 6,620.51 crore (2012: ` 4,600.40 crore) share of jointly controlled entities.
Total Expenditure includes ` 6,168.01 crore (2012: ` 4,151.07 crore) share of jointly controlled entities.
Sd/- Sd/- Sd/- (R. S. Butola) (P. K. Goyal) (Raju Ranganathan) Chairman Director (Finance) Company Secretary
As per our attached Report of even date
For B.M. CHATRATH & CO. For DASS GUPTA & ASSOCIATES For PARAKH & CO. Chartered Accountants Chartered Accountants Chartered Accountants (Firm Regn. No. 301011E) (Firm Regn. No. 000112N) (Firm Regn. No.001475C)
Sd/- Sd/- Sd/- (CA. P.R. Paul) (CA. Raaja Jindal) (CA. Thalendra Sharma) Partner Partner Partner M. No. 051675 M. No. 504111 M. No. 079236
Place : New Delhi Date : 30th May, 2013

156
CASH FLOW STATEMENT for the year ended 31st March 2013 (` in Crore)
Particulars March-13 March-12
A Cash Flow from Operating Activities
1 Profit Before Tax 4,504.25 3,995.32
2 Adjustments for :
Depreciation 5,710.31 4,983.87
Loss/(Profit) on sale of Assets (net) 28.66 5.08
Loss/(Profit) on Sale of Investments (net) (28.01) 18.87
Amortisation of Capital Grants (1.46) (1.19)
Amortisation of Premium on Forward Contracts 19.72 89.66
Provision for Probable Contingencies (net) 413.73 37.78
Provision for Loss on Investments (net) (634.15) 418.15
Provision for Doubtful Debts, Advances, Claims and Obsolescence of Stores (net) 21.83 (229.51)
Provision for Dimunition in 'Receivable from trust' (net) (110.15) (513.21)
Provision for MTM loss on interest rate swap 10.81 110.26
Interest Income on Investments (1,118.85) (1,171.94)
Dividend Income on Investments (967.80) (780.53)
Interest Expenditure 7,083.16 5,901.61
10,427.80 8,868.90
3 Operating Profit before Working Capital 14,932.05 12,864.22 Changes (1+2)
4 Change in Working Capital: (Excluding Cash & Bank Balances)
Trade & Other Receivables (6,751.99) (16,271.63)
Inventories (2,774.62) (8,962.51)
Trade and Other Payables 5,143.01 12,013.48
(4,383.60) (13,220.66)
5 Cash Generated From Operations (3+4) 10,548.45 (356.44)
6 Less : Taxes Paid 1,168.97 406.37
7 Net Cash Flow from Operating Activities (5-6) 9,379.48 (762.81)
B Cash Flow from Investing Activities:
Sale/Transfer of Assets 511.00 1,370.17
Sale / Maturity of Investments 784.01 790.74
Interest Income on Investments 1,127.85 1,189.94
Dividend Income on Investments 967.80 780.53
Purchase of Assets (4,178.38) (3,482.98)
Investments in Long Term Investments / Others 115.29 (168.76)
Expenditure on Construction Work in Progress (8,621.15) (13,535.42)
Net Cash Generated/(Used) in Investing Activities: (9,293.58) (13,055.78)
Contd...

Consolidated Financial Statem
ents 2012-13
157
(` in Crore)
Particulars March-13 March-12
C Net Cash Flow from Financing Activities:
Proceeds from/(Repayments of) Long-Term Borrowings 3,883.11 3,654.53
Proceeds from/(Repayments of) Short-Term Borrowings 5,709.72 18,618.27
Interest paid (7,788.72) (6,364.30)
Dividend/Dividend Tax paid (1,492.16) (2,805.12)
Net Cash Generated/(Used) from Financing Activities: 311.95 13,103.38
D Net Change in Cash & Bank Balances 397.85 (715.21) (A+B+C)
E - 1 Cash & Bank Balances as at end of the year 1,219.80 821.95
Add: Impact of Exchange variation taken to Reserves - 0.67
1,219.80 822.62
Less:
2 Cash & Bank Balances as at the 821.95 1,537.83 beginning of Period
NET CHANGE IN CASH & BANK BALANCE (E 1-2) 397.85 (715.21)
Notes:
1. Cash & Bank Balances as at end of the year 1,219.80 821.95
Less: Other Bank Balances 116.59 145.26
Total Cash and Cash Equivalents 1,103.21 676.69
2. Figures for previous periods have been regrouped wherever necessary for uniformity in presentation.
Sd/- Sd/- Sd/- (R. S. Butola) (P. K. Goyal) (Raju Ranganathan) Chairman Director (Finance) Company Secretary
As per our attached Report of even date
For B.M. CHATRATH & CO. For DASS GUPTA & ASSOCIATES For PARAKH & CO. Chartered Accountants Chartered Accountants Chartered Accountants (Firm Regn. No. 301011E) (Firm Regn. No. 000112N) (Firm Regn. No.001475C)
Sd/- Sd/- Sd/- (CA. P.R. Paul) (CA. Raaja Jindal) (CA. Thalendra Sharma) Partner Partner Partner M. No. 051675 M. No. 504111 M. No. 079236
Place : New Delhi Date : 30th May, 2013

158
NOTE – 1: PRINCIPLES OF CONSOLIDATION & SIGNIFICANT ACCOUNTING POLICIES
A. Principles of Consolidation
A.1. The consolidated financial statements relate to Indian Oil Corporation Limited (Parent Company), its subsidiaries and Joint Venture entities. The consolidated financial statements have been prepared on the following basis:
A.1.1. The financial statements of the Parent Company and its Subsidiary Companies have been combined on a line-by-line basis by adding together the book values of like items of assets, liabilities, income and expenses, after eliminating the intra-group balances, intra-group transactions and unrealized profits or losses in accordance with Accounting Standard -21 on “Consolidated Financial Statements”. The share of Minority Interest in the Subsidiaries has been disclosed separately in the “Consolidated Financial Statements”.
A.1.2. The financial statements of Joint Ventures have been combined by applying propor tionate consolidation method on a line-by-line basis on items of assets, liabilities, income and expenses after eliminating proportionate share of unrealized profits or losses in accordance with Accounting Standard –27 on “Financial Reporting of Interests in Joint Ventures”.
A.1.3. The consolidated financial statements have been prepared using uniform accounting policies for like transactions and events in similar circumstances and are presented to the extent possible, in the same manner as the Parent Company’s separate financial statements.
A.1.4. The excess/shortfall of cost to the Parent Company of its investment in the respective subsidiary companies and joint venture companies is recognized in the financial statements as goodwill/capital reserve respectively as per the equity method of valuation.
A.2. The Consolidated Financial Statements include the results of the following entities:
Sl. Name of Country of Relation Ownership No. Company incorporation Interest
1. Chennai Petroleum India Subsidiary 51.89% Corporation Ltd
2. Lanka IOC PLC Sri Lanka Subsidiary 75.12%
3. Indian Oil (Mauritius) Ltd. Mauritius Subsidiary 100%
4. IOC Middle East FZE Dubai- UAE Subsidiary 100%
5. IndianOil CREDA India Subsidiary 74% Bio-Fuels Ltd.
6. IOC Sweden AB Sweden Subsidiary 100%
7. IOCL(USA) INC. USA Subsidiary 100%
8. IOT Infrastructure & India Joint Venture 47.91% Energy Services Ltd
9. Lubrizol India Pvt. Ltd India Joint Venture 50%
10. AVI-OIL India Pvt. Ltd India Joint Venture 25%
11. Petronet LNG Ltd India Joint Venture 12.5%
12. Indian Oil Petronas India Joint Venture 50% Pvt.Ltd.
13. Green Gas Ltd India Joint Venture 22.50%
14. IndianOil Skytanking Ltd. India Joint Venture 33.33%
15. Indo Cat Pvt.Ltd. India Joint Venture 50%
16. Suntera Nigeria 205 Ltd. Nigeria Joint Venture 25%
17. Delhi Aviation Fuel Facility India Joint Venture 37% (Private) Limited
18. Indian Oil Ruchi India Joint Venture 50% Biofuels LLP
19. Indian Synthetic India Joint Venture 50% Rubber Limited
20. NPCIL IndianOil Nuclear India Joint Venture 26% Energy Corporation Limited
21. GSPL India Transco Ltd. India Joint Venture 20.65%
22. GSPL India Gasnet Ltd. India Joint Venture 22.16%
Note: Propor tionate consolidation in respect of Investments in the Joint Venture Companies M/s Petronet CI Ltd., Petronet VK Ltd; Petronet India Ltd and Indianoil Panipat Power Consortium Ltd. have not been incorporated in the preparation of consolidated financial statements as the Management has decided to exit from these Joint Ventures and provided for full diminution in the value of investment.
B. SignificantAccountingPolicies
B.1. Significant accounting policies of parent company are enclosed as Annexure-I.
B.2. For certain items, the Company and its subsidiaries and Joint ventures have followed different accounting policies. However impact of the same is not material.
C. Financial statements of IOML, LIOC, IOC Middle East FZE, IOC Sweden AB, IOCL (USA) INC. and Suntera Nigeria are drawn in Mauritius Rupees, Sri Lankan Rupees, UAE Dirhams, Euro and USD, respectively. The transactions with these foreign subsidiaries/Joint Ventures are considered as non integral operation as per Accounting Standard-11 on “The Effects of Changes in Foreign Exchange Rates” and accordingly, the Financial Statements have been translated in Indian Rupees for the purpose of Consolidated Financial Statements.
(Refer Page No. 153)

Consolidated Financial Statem
ents 2012-13
159
NOTE - 2: SHARE CAPITAL (` in Crore) Particulars March-13 March-12
Authorised: 600,00,00,000 Equity Shares of ` 10 each 6,000.00 6,000.00
Issued, Subscribed and Paid Up: 2,42,79,52,482 (2012 : 2,42,79,52,482) Equity 2,427.95 2,427.95 Shares of ` 10 each
TOTAL 2,427.95 2,427.95
A. Above Includes Shares allotted as fully paid without payment being received in Cash:
a) Pursuant to the Petroleum Companies Amalgamation Order, 1964 : 3,76,49,700 Shares of ` 10 each.
b) Pursuant to Gujarat Refinery Project Undertaking (Transfer), (Amendment) Order, 1965 :1,00,00,000 Shares of ` 10 each.
c) 2,43,62,106 no. of equity shares of ` 10 each issued in June 2007 as fully paid up to the shareholers of erstwhile IBP Co. Ltd as per the Scheme of amalgamation.
d) 2,16,01,935 no. of equity shares of ` 10 each issued in May 2009 as fully paid up to the shareholers of erstwhile BRPL as per the Scheme of amalgamation.
e) Aggregate shares allotted as fully paid up Bonus Shares by Capitalisation of General Reserve / Securities Premium: 2,28,02,71,241 Shares of ` 10 each, out of these 1,21,39,76,241 no. of equity shares of ` 10 each were issued during preceeding five years (in November 2009).
B. Reconciliation of No. of Equity Shares
Opening Balance 2,42,79,52,482 2,42,79,52,482
Shares Issued - -
Shares bought back - -
Closing Balance 2,42,79,52,482 2,42,79,52,482
C. Terms/Rightsattachedtoequityshares
The company has only one class of equity shares having par value of ` 10 each and is entitled to one vote per share. The dividend proposed by Board of Directors is subject to the approval of the shareholders in the ensuing Annual General Meeting.
D. Details of shareholders holdings more than 5% shares
Name of Shareholder March-13 March-12
Number of Percentage of Number of Percentage of shares held Holding shares held Holding
PRESIDENT OF INDIA 1,91,61,55,710 78.92 1,91,61,55,710 78.92
OIL AND NATURAL GAS CORPORATION LIMITED 21,29,06,190 8.77 21,29,06,190 8.77
[Item No. 1(a), Page No. 152]

160
NOTE - 3: RESERVES AND SURPLUS(` in Crore)
Particulars March-13 March-12
Capital Reserve:
As per Last Account 383.08 375.94 On Consolidation 6.77 7.14 389.85 383.08Securities Premium: As per Last Account 128.55 86.46 Addition during the year - 42.09 128.55 128.55General Reserve: As per Last Account 54,637.39 52,719.17 Less: Transfer to Corporate Social Responsibility Reserve 15.56 - Add: Appropriation from Profit and Loss 618.71 1,918.22 55,240.54 54,637.39Insurance Reserve: As per Last Account 104.40 84.40 Less : Recoupment of uninsured fire loss 0.30 - Add: Appropriation from Profit and Loss 20.00 20.00 124.10 104.40 ExportProfitReserve 53.72 53.72Capital Grants: As per Last Account 13.49 14.65 Add: Received/ (Written Back) during the year 5.06 0.03 Less: Amortised during the year 1.46 1.19 17.09 13.49 Bond Redemption Reserve: As per Last Account 1,971.45 1,344.93 Add: Provision during the year 1,228.00 741.92 Less: Write-back of provision on redemption of bonds 699.93 115.40 2,499.52 1,971.45Corporate Social Responsibility Reserve: As per Last Account - - Add: Transferred from General Reserve 15.56 - Add: Appropriation from Profit and Loss 100.89 - Less: Utilised during the year 78.97 - 37.48 -Balance of ProfitandLoss: Balance Brought Forward from Last Year's Account 656.23 484.01 Add: Opening Balance Adjustment 29.32 - Add: Profit for the Year 4,449.01 4,225.98 Less: Appropriations: Final Dividend (Proposed) 1,596.15 1,275.90 Corporate Dividend Tax on: Interim Dividend - 0.70 Final Dividend (Proposed) 274.18 212.42
Insurance Reserve (Net) 19.70 20.00 Bond Redemption Reserve (Net) 528.07 626.52 Corporate Social Responsibility Reserve (Net) 21.92 - General Reserve 618.71 1,918.22 Balance carried forward to next year 2,075.83 656.23
Contd...
[Item No. 1(b), Page No. 152]

Consolidated Financial Statem
ents 2012-13
161
(` in Crore)
Particulars March-13 March-12
Devaluation Exch. Difference Reserve:
As per Last Account - 0.67
Less: Exchange variation on revaluation - 0.67
- -
Translation Reserve on Consolidation
As per Last Account (2.96) (16.69)
Add : Translation difference 44.30 13.73
(41.34) (2.96)
TOTAL 60,608.02 57,945.35
Share of jointly controlled entities 1,118.99 909.47
NOTE - 4: LONG TERM BORROWINGS(` in Crore)
Particulars Long Term Current Maturities March-13 March-12 March-13 March-12
SECURED LOANS
Bonds:
Non-Convertible Redeemable Bonds-Series-VIII B 1,070.00 1,070.00 - -
Non-Convertible Redeemable Bonds-Series-XII 1,295.00 - - -
Non-Convertible Redeemable Bonds-Series-IX 1,600.00 1,600.00 - -
Non-Convertible Redeemable Bonds-Series-VII B 500.00 500.00 - -
Non-Convertible Redeemable Bonds-Series-XI - 1,415.00 1,415.00 -
Non-Convertible Redeemable Bonds-Series-X - - - 2,000.00
Non-Convertible Redeemable Bonds-Series-VI - - - 768.10
Non-Convertible Redeemable Bonds-Series-V 94.80 126.40 31.60 31.60
4,559.80 4,711.40 1,446.60 2,799.70
Debentures:
Non-Convertible Debentures 1,000.00 - - -
Convertible Debentures (Issued by Subsidiary/JV entities) 95.82 - - -
1,095.82 - - -
Term Loans:
From banks 1,496.14 652.00 204.39 112.63
From other parties
Oil Industry Development Board (OIDB) 1,385.00 1,107.50 772.50 1,847.50
Others 203.72 233.41 29.50 20.09
3,084.86 1,992.91 1,006.39 1,980.22
Total Secured Loans 8,740.48 6,704.31 2,452.99 4,779.92
Contd...
[Item No. 4(a), Page No. 152]

162
(` in Crore)
Particulars Long Term Current Maturities March-13 March-12 March-13 March-12
UNSECURED LOANS
Bonds:
Foreign Currency Bonds 7,196.54 5,088.00 - -
Term Loans:
i) From Banks/Financial Institutions:
In Foreign Currency 6,758.42 3,949.62 30.82 31.67
Senior Notes (Bank of America) 1,628.70 1,526.40 - -
In Rupees - 300.00 - -
ii) From Others
In Rupees 388.13 741.88 397.87 588.85
8,775.25 6,517.90 428.69 620.52
Deferred payment liabilities - 0.19 - -
Total Unsecured Loans 15,971.79 11,606.09 428.69 620.52
TOTAL LONG-TERM BORROWINGS 24,712.27 18,310.40 2,881.68 5,400.44
Share of jointly controlled entities 2,155.29 649.09 174.18 79.55
NOTE - 5: DEFERRED TAX[Item No. 4(b) & 6(c), Page No. 152]
In compliance of Accounting Standard – 22 on “Accounting for Taxes on Income, the item wise details of Deferred Tax Liability (net) are as under: (` in Crore)
As on Provided during Balance as on 01.04.2012 the year* 31.03.2013
Deferred Tax Liability:
Depreciation and other fixed Assets of the group 9,414.45 888.69 10,303.14
Total Deferred Tax Liability (A) 9,414.45 888.69 10,303.14
Deferred Tax Assets:
Provision on Inventories, Trade Receivables, Loans and advances, Investments etc. 642.17 (223.53) 418.64
Compensation for Voluntary Retirement Scheme 6.83 17.69 24.52
43B Disallowances etc. 2,361.82 597.79 2,959.61
Capital Grants 4.37 (0.28) 4.09
Provision for Leave Encashment/Retirement Benefits 429.70 131.30 561.00
Others - 3.00 3.00
Total Deferred Tax Assets (B) 3,444.89 525.97 3,970.86
Deferred Tax Liability (Net) (A – B) 5,969.56 362.72 6,332.28
Previous Year 7,028.20 (1,058.64) 5,969.56
Share of jointly controlled entities 83.01 104.27
As per Balance Sheet
Deferred Tax Liability 5,970.20 6,332.92
Deferred Tax Asset 0.64 0.64
Deferred Tax Liability (Net) 5,969.56 6,332.28
* Includes ` 0.19 crore (2012: 0.64 crore) due to translation of Opening Balance at closing exchange rate considered in Translation Reserve.

Consolidated Financial Statem
ents 2012-13
163
NOTE - 6: OTHER LIABILITIES(` in Crore)
Particulars Non Current Current
March-13 March-12 March-13 March-12
Current maturities of long-term debt (Refer Note 4) - - 2,881.68 5,400.44
Interest accrued but not due on borrowings - - 693.09 632.61
Interest accrued and due on borrowings - - 64.40 52.12
Income received in advance - - - 0.17
Liability for Captial Expenditure - - 2,757.81 4,790.24
Liability for Trusts and Other Funds - - 755.46 19.46
Employee Liabilities 0.03 0.03 1,176.18 888.79
Statutory Liabilities - - 5,080.78 4,813.74
Advances from Customers - - 1,482.75 1,178.26
Investor Education & Protection Fund to be credited on the due dates :
- Unpaid Dividend - - 46.12 41.85
- Unpaid Matured Deposits - - 0.01 0.01
- - 46.13 41.86
Liability on Foreign Currency Contracts - - 10.72 391.21
Less: Foreign Currency Receivables - - 10.69 379.69
- - 0.03 11.52
Security Deposits 11,440.34 9,834.76 716.87 596.21
Discount on Forward Contract (Refer Note - 16) - - - 0.38
Long Term Trade Payables 6.30 0.29 - -
Other Liabilities 81.52 72.25 1,272.47 979.14
TOTAL 11,528.19 9,907.33 16,927.65 19,404.94
Share of jointly controlled entities 86.74 70.64 533.92 248.11
[Item No. 4(c) & 5(c), Page No. 152]
164
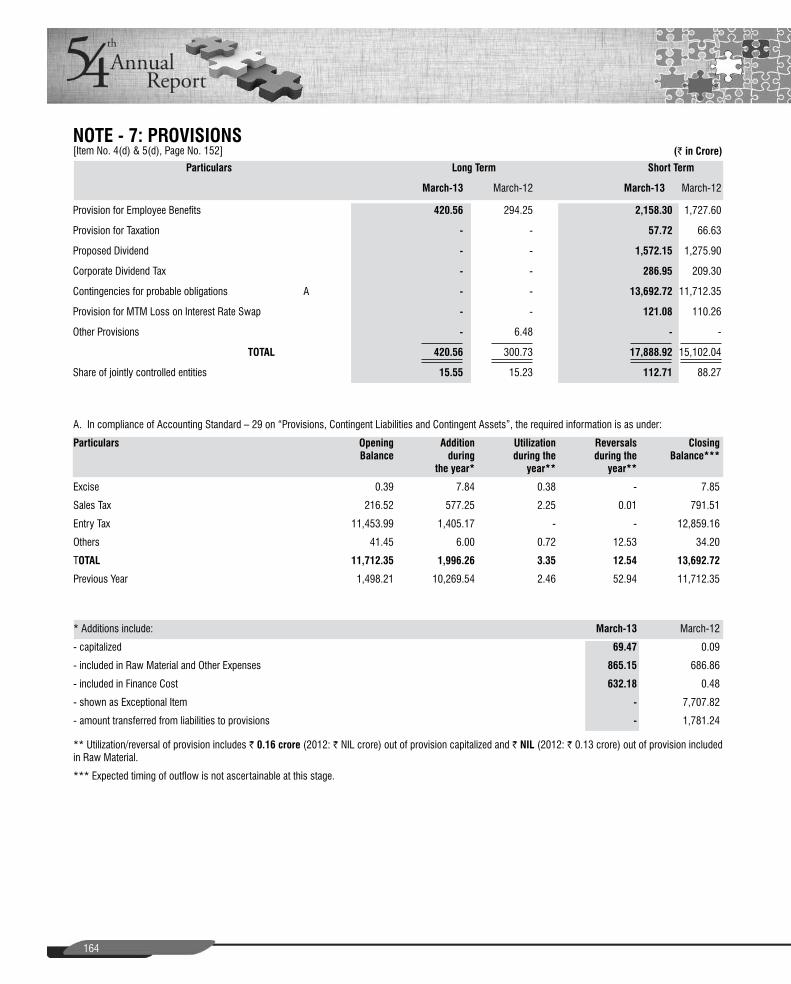
NOTE - 7: PROVISIONS(` in Crore)
Particulars Long Term Short Term
March-13 March-12 March-13 March-12
Provision for Employee Benefits 420.56 294.25 2,158.30 1,727.60
Provision for Taxation - - 57.72 66.63
Proposed Dividend - - 1,572.15 1,275.90
Corporate Dividend Tax - - 286.95 209.30
Contingencies for probable obligations A - - 13,692.72 11,712.35
Provision for MTM Loss on Interest Rate Swap - - 121.08 110.26
Other Provisions - 6.48 - -
TOTAL 420.56 300.73 17,888.92 15,102.04
Share of jointly controlled entities 15.55 15.23 112.71 88.27
A. In compliance of Accounting Standard – 29 on “Provisions, Contingent Liabilities and Contingent Assets”, the required information is as under:
Particulars Opening Addition Utilization Reversals Closing Balance during during the during the Balance*** the year* year** year**
Excise 0.39 7.84 0.38 - 7.85
Sales Tax 216.52 577.25 2.25 0.01 791.51
Entry Tax 11,453.99 1,405.17 - - 12,859.16
Others 41.45 6.00 0.72 12.53 34.20
TOTAL 11,712.35 1,996.26 3.35 12.54 13,692.72
Previous Year 1,498.21 10,269.54 2.46 52.94 11,712.35
* Additions include: March-13 March-12
- capitalized 69.47 0.09
- included in Raw Material and Other Expenses 865.15 686.86
- included in Finance Cost 632.18 0.48
- shown as Exceptional Item - 7,707.82
- amount transferred from liabilities to provisions - 1,781.24
** Utilization/reversal of provision includes ` 0.16 crore (2012: ` NIL crore) out of provision capitalized and ` NIL (2012: ` 0.13 crore) out of provision included in Raw Material.
*** Expected timing of outflow is not ascertainable at this stage.
[Item No. 4(d) & 5(d), Page No. 152]

Consolidated Financial Statem
ents 2012-13
165
NOTE - 8: SHORT TERM BORROWINGS(` in Crore)
Particulars March-13 March-12
SECURED LOANS
Loans Repayable on Demand
From Banks:
Working Capital Demand Loan 4,722.23 5,712.67
Cash Credit 2,239.05 230.96
Foreign Currency Loans 651.48 46.53
7,612.76 5,990.16
From Others:
Loans through Collaterised Borrowings and Lending Obligation (CBLO) of Clearing Corporation of India Ltd. (CCIL) 2,630.00 1,827.00
Loans and advances from related parties 0.02 0.08
Total Secured Loans 10,242.78 7,817.24
UNSECURED LOANS
Loans Repayable on Demand
FromBanks/FinancialInstitutions:
In Foreign Currency 32,441.09 22,413.65
In Rupees 16,904.37 19,284.75
From Others
Commercial Paper 2,330.00 4,760.00
Inter-Corporate Deposits - 2,000.00
51,675.46 48,458.40
Other Loans and Advances 83.69 28.85
Total Unsecured Loans 51,759.15 48,487.25
TOTAL SHORT-TERM BORROWINGS 62,001.93 56,304.49
Share of jointly controlled entities 339.19 43.42
NOTE - 9: TRADE PAYABLES(` in Crore)
Particulars March-13 March-12
Dues of Micro, Small and Medium Enterprises 12.42 12.24
Dues to Related Parties 878.55 665.90
Dues to others 32,698.59 31,531.85
33,589.56 32,209.99
TOTAL 33,589.56 32,209.99
Share of jointly controlled entities 890.48 543.91
[Item No. 5(a), Page No. 152]
[Item No. 5(b), Page No. 152]

166
NOTE - 10: TANGIBLE ASSETS(` in Crore)
AT COST DEPRECIATION, DEPLETION, AMORTISATION AND IMPAIRMENT NET BLOCK
Gross Additions Transfersfrom Disposals/ Gross Depreciation, Depreciation Disposals/ Total Total Impairment Impairment Total ASAT ASAT Block during Construction Deductions/ Block Depletion& Depletionand Deductions/ Depreciation, Impairment Loss lossreversed Impairment 31.03.13 31.03.12 asat theyear Work-in- Transfers/ asat Amortisation Amortisation Transfers/ Depletionand Lossasat during duringthe Lossupto 1.04.12 Progress Reclassifications 31.03.13 asat during Reclassifications Amortisation 1.04.12 theyear theyear 31.03.13 1.04.12 the year upto
31.03.13
(Refer A)
Land - Freehold 1250.39 74.80 0.01 (14.87) 1310.33 0.00 0.00 0.00 0.00 0.00 0.00 0.00 0.00 1310.33 1250.39
- Leasehold 515.84 226.91 1.66 (0.16) 744.25 96.76 19.06 0.56 116.38 0.00 0.00 0.00 0.00 627.87 419.08
Buildings, Roads etc. 9071.62 102.12 635.40 (30.62) 9778.52 1566.04 190.25 2.66 1758.95 0.00 0.00 0.00 0.00 8019.57 7505.58
Plant and Equipment 92024.40 3446.89 3485.65 (828.07) 98128.87 39026.75 5168.41 (290.93) 43904.23 34.32 0.00 (34.32) 0.00 54224.64 52963.33
Office Equipments 1824.00 143.39 76.58 (80.51) 1963.46 860.74 137.41 (49.35) 948.80 0.00 0.00 0.00 0.00 1014.66 963.26
Transport Equipments 419.90 29.66 2.35 (5.52) 446.39 324.71 17.93 (4.91) 337.73 0.00 0.00 0.00 0.00 108.66 95.19
Furnitures and Fixtures 320.80 39.30 7.93 (7.80) 360.23 169.21 19.26 (6.95) 181.52 0.00 0.00 0.00 0.00 178.71 151.59
Railway Sidings 211.80 0.74 0.02 (3.47) 209.09 128.79 8.55 (2.48) 134.86 0.00 0.00 0.00 0.00 74.23 83.01
Drainage, Sewage and
Water Supply System 384.12 7.43 1.29 (4.51) 388.33 214.86 12.14 (4.34) 222.66 0.00 0.00 0.00 0.00 165.67 169.26
E&P Producing Properties 0.00 71.55 0.00 0.00 71.55 0.00 4.89 0.00 4.89 0.00 0.00 0.00 0.00 66.66 0.00
Total 106022.87 4142.79 4210.89 (975.53) 113401.02 42387.86 5577.90 (355.74) 47610.02 34.32 0.00 (34.32) 0.00 65791.00 63600.69
Previous Year 99332.83 3390.91 4824.16 (1525.03) 106022.87 37715.96 4847.72 (175.82) 42387.86 34.32 0.00 0.00 34.32 63600.69
A Considering the Government policies and modalities of compensating the oil marketing companies towards under-recoveries, future cash flows have been worked out based on desired margins for deciding on impairment of related Cash Generating Units. In view of the assumption being technical, peculiar to the industry and policy matter, the auditors have relied on the same.
B Land & Buildings include ` 63.87 crore (2012: ` 95.12 crore) in respect of which Title / Lease Deeds are pending for execution or renewal. Net Tangible Assets include ` 1095.64 crore (2012 : ` 741.24 crore) share of jointly controlled entities.
NOTE - 11: INTANGIBLE ASSETS(` in Crore)
AT COST DEPRECIATION, DEPLETION, AMORTISATION AND IMPAIRMENT NET BLOCK
Gross Additions Transfersfrom Disposals/ Gross Total Amortisation Disposals/ Total Total Impairment Total ASAT ASAT Block during Construction Deductions/ Block Amortisation during Deductions/ Amortisation Impairment Lossduring Impairment 31.03.13 31.03.12 asat theyear Work-in- Transfers/ asat asat theyear Transfers/ upto Lossasat theyear Lossupto 1.04.12 Progress Reclassifications 31.03.13 1.04.12 Reclassifications 31.03.13 1.04.12 31.03.13
Right of Way 135.97 13.61 0.00 (0.16) 149.42 0.23 8.59 (0.01) 8.81 0.00 0.00 0.00 140.61 135.74
Licenses 1257.23 14.31 0.29 17.85 1289.68 489.72 128.27 (0.29) 617.70 1.65 (1.65) 0.00 671.98 765.86
Computer Software 163.13 17.26 5.23 3.66 189.28 130.91 22.68 1.71 155.30 0.00 0.00 0.00 33.98 32.22
Goodwill A 27.00 0.00 0.00 34.64 61.64 0.00 1.37 11.83 13.20 0.00 0.00 0.00 48.44 27.00
Other Intangible Assets 0.00 0.47 0.00 8.70 9.17 0.00 0.98 7.29 8.27 0.00 0.00 0.00 0.90 0.00
Total 1583.33 45.65 5.52 64.69 1699.19 620.86 161.89 20.53 803.28 1.65 (1.65) 0.00 895.91 960.82
Previous Year 1517.04 89.01 3.32 (26.04) 1583.33 467.36 153.50 0.00 620.86 1.65 0.00 1.65 960.82
A. Goodwill is due to the excess of purchase consideration paid to the Government of Sri Lanka and Ceylon Petroleum Corporation over the net assets value representating applicable shares alloted in the acquisition of retail outlets.
Net Intangible Assets include ` 46.99 crore (2012: ` 3.99 crore) share of jointly controlled entities.
[Item No. 6(a)(i), Page No. 152]
[Item No. 6(a)(ii), Page No. 152]

Consolidated Financial Statem
ents 2012-13
167
NOTE - 10: TANGIBLE ASSETS(` in Crore)
AT COST DEPRECIATION, DEPLETION, AMORTISATION AND IMPAIRMENT NET BLOCK
Gross Additions Transfersfrom Disposals/ Gross Depreciation, Depreciation Disposals/ Total Total Impairment Impairment Total ASAT ASAT Block during Construction Deductions/ Block Depletion& Depletionand Deductions/ Depreciation, Impairment Loss lossreversed Impairment 31.03.13 31.03.12 asat theyear Work-in- Transfers/ asat Amortisation Amortisation Transfers/ Depletionand Lossasat during duringthe Lossupto 1.04.12 Progress Reclassifications 31.03.13 asat during Reclassifications Amortisation 1.04.12 theyear theyear 31.03.13 1.04.12 the year upto
31.03.13
(Refer A)
Land - Freehold 1250.39 74.80 0.01 (14.87) 1310.33 0.00 0.00 0.00 0.00 0.00 0.00 0.00 0.00 1310.33 1250.39
- Leasehold 515.84 226.91 1.66 (0.16) 744.25 96.76 19.06 0.56 116.38 0.00 0.00 0.00 0.00 627.87 419.08
Buildings, Roads etc. 9071.62 102.12 635.40 (30.62) 9778.52 1566.04 190.25 2.66 1758.95 0.00 0.00 0.00 0.00 8019.57 7505.58
Plant and Equipment 92024.40 3446.89 3485.65 (828.07) 98128.87 39026.75 5168.41 (290.93) 43904.23 34.32 0.00 (34.32) 0.00 54224.64 52963.33
Office Equipments 1824.00 143.39 76.58 (80.51) 1963.46 860.74 137.41 (49.35) 948.80 0.00 0.00 0.00 0.00 1014.66 963.26
Transport Equipments 419.90 29.66 2.35 (5.52) 446.39 324.71 17.93 (4.91) 337.73 0.00 0.00 0.00 0.00 108.66 95.19
Furnitures and Fixtures 320.80 39.30 7.93 (7.80) 360.23 169.21 19.26 (6.95) 181.52 0.00 0.00 0.00 0.00 178.71 151.59
Railway Sidings 211.80 0.74 0.02 (3.47) 209.09 128.79 8.55 (2.48) 134.86 0.00 0.00 0.00 0.00 74.23 83.01
Drainage, Sewage and
Water Supply System 384.12 7.43 1.29 (4.51) 388.33 214.86 12.14 (4.34) 222.66 0.00 0.00 0.00 0.00 165.67 169.26
E&P Producing Properties 0.00 71.55 0.00 0.00 71.55 0.00 4.89 0.00 4.89 0.00 0.00 0.00 0.00 66.66 0.00
Total 106022.87 4142.79 4210.89 (975.53) 113401.02 42387.86 5577.90 (355.74) 47610.02 34.32 0.00 (34.32) 0.00 65791.00 63600.69
Previous Year 99332.83 3390.91 4824.16 (1525.03) 106022.87 37715.96 4847.72 (175.82) 42387.86 34.32 0.00 0.00 34.32 63600.69
NOTE - 11: INTANGIBLE ASSETS(` in Crore)
AT COST DEPRECIATION, DEPLETION, AMORTISATION AND IMPAIRMENT NET BLOCK
Gross Additions Transfersfrom Disposals/ Gross Total Amortisation Disposals/ Total Total Impairment Total ASAT ASAT Block during Construction Deductions/ Block Amortisation during Deductions/ Amortisation Impairment Lossduring Impairment 31.03.13 31.03.12 asat theyear Work-in- Transfers/ asat asat theyear Transfers/ upto Lossasat theyear Lossupto 1.04.12 Progress Reclassifications 31.03.13 1.04.12 Reclassifications 31.03.13 1.04.12 31.03.13
Right of Way 135.97 13.61 0.00 (0.16) 149.42 0.23 8.59 (0.01) 8.81 0.00 0.00 0.00 140.61 135.74
Licenses 1257.23 14.31 0.29 17.85 1289.68 489.72 128.27 (0.29) 617.70 1.65 (1.65) 0.00 671.98 765.86
Computer Software 163.13 17.26 5.23 3.66 189.28 130.91 22.68 1.71 155.30 0.00 0.00 0.00 33.98 32.22
Goodwill A 27.00 0.00 0.00 34.64 61.64 0.00 1.37 11.83 13.20 0.00 0.00 0.00 48.44 27.00
Other Intangible Assets 0.00 0.47 0.00 8.70 9.17 0.00 0.98 7.29 8.27 0.00 0.00 0.00 0.90 0.00
Total 1583.33 45.65 5.52 64.69 1699.19 620.86 161.89 20.53 803.28 1.65 (1.65) 0.00 895.91 960.82
Previous Year 1517.04 89.01 3.32 (26.04) 1583.33 467.36 153.50 0.00 620.86 1.65 0.00 1.65 960.82

168
NOTE - 12: CAPITAL WORK IN PROGRESS(` in Crore)
Particulars March-13 March-12
Construction Work in Progress - Tangible Assets A 10,533.07 9,068.65 (Including unallocated capital expenditure, materials at site)
Less: Provision for Capital Losses 138.89 143.86
10,394.18 8,924.79
Capital stores 4,786.77 2,379.40
Less: Provision for Capital Losses 0.03 0.20
4,786.74 2,379.20
Capital Goods in Transit 324.47 1,889.37
Construction Period Expenses pending allocation:
Balance as at beginning of the year 1,979.02 926.15
Add: Net expenditure during the year (Note -"12.1") 1,807.87 1,506.62
3,786.89 2,432.77
Less: Allocated to Assets during the year 300.22 453.75
3,486.67 1,979.02
TOTAL 18,992.06 15,172.38
Share of jointly controlled entities 769.14 730.84
A. Includes Capital Expenditure amounting to ` 342.91 crore (2012 : ` 176.83 crore) relating to ongoing Oil & Gas Exploration activities.
[Item No. 6(a)(iii), Page No. 152]

Consolidated Financial Statem
ents 2012-13
169
Note - 12.1: CONSTRUCTION PERIOD EXPENSES (NET) DURING THE YEAR(` in Crore)
Particulars March-13 March-12
Employee Benefit Expenses 263.87 191.36
Repairs and Maintenance 10.79 7.08
Consumption of Stores and Spares 3.60 0.05
Power & Fuel 53.31 48.34
Rent 7.55 4.82
Insurance 39.09 40.92
Rates and Taxes 0.36 0.84
Travelling Expenses 35.35 27.16
Communication Expenses 1.72 1.43
Printing and Stationery 1.00 0.94
Electricity and Water Charges 11.16 11.44
Bank Charges 0.84 0.68
Technical Assistance Fees 0.11 0.54
Exchange Fluctuation 593.99 544.43
Finance Cost 766.04 617.64
Depreciation, Depletion and Amortisation on
Tangible Assets 29.27 17.29
Intangible Assets 0.21 0.06
Start Up/ Trial Run Expenses - 2.92
Others 50.17 47.21
Total Expenses 1,868.43 1,565.15
Less : Recoveries 60.56 58.53
Net Expenditure during the year 1,807.87 1,506.62
NOTE - 13: INTANGIBLE ASSETS UNDER DEVELOPMENT(` in Crore)
Particulars March-13 March-12
Work in Progress - Intangible Asset 290.71 277.26 (Including Unallocated Capital Expenditure)
TOTAL 290.71 277.26
Share of jointly controlled entities - 0.01
[Item No. 6(a)(iv), Page No. 152]

170
Note - 14: INVESTMENTS(` in Crore)
Particulars March-13 March-12
NON CURRENT INVESTMENTS: (AT COST)
QUOTED: 3,026.16 3,028.15 (Market Value of ` 22,828.81 crore (2012: ` 20,174.50 crore)
UNQUOTED:
In Government - Securities 6.24 6.25
In Petroleum India International (AOP by Oil Companies)
- Capital Fund 20.00 20.00
- Share in accumulated surlpus 27.21 24.85
47.21 44.85
In Others 614.22 733.84
667.67 784.94
CURRENT INVESTMENTS (UNQUOTED): (AT LOWER OF COST OR MARKET PRICE)
Oil Companies GOI SPL Bonds 14,469.04 15,354.68
Less: Provision for Diminution 830.44 1,594.23
13,638.60 13,760.45
In Others 18.35 14.38
13,656.95 13,774.83
Total 17,350.78 17,587.92
Share of jointly controlled entities 35.91 226.84
[Item No. 6(b) & 8(a), Page No. 152 & 153]

Consolidated Financial Statem
ents 2012-13
171
NOTE - 15: LOANS AND ADVANCES(` in Crore)
Particulars Long Term Short Term
March-13 March-12 March-13 March-12
Advance for Capital Expenditure
Secured, Considered Good 129.60 199.91 - -
Unsecured, Considered Good 9,451.10 8,012.87 - -
Unsecured, Considered Doubtful 0.10 0.20 - -
9,580.80 8,212.98 - -
Less: Provision for Doubtful Advance 0.10 0.20 - -
9,580.70 8,212.78 - -
Advances for Investments
Joint Ventures 12.67 12.67 - -
Advance recoverable in cash or in kind or for value to be received:
From Related Parties
Secured, Considered Good 0.08 0.05 0.04 0.01
Unsecured, Considered Good 75.62 68.21 27.43 16.54
Unsecured, Considered Doubtful - - 2.25 2.22
75.70 68.26 29.72 18.77
Less : Provision for Doubtful Advances - - 2.25 2.22
75.70 68.26 27.47 16.55
From Others
Secured, Considered Good 826.22 829.67 80.98 89.79
Unsecured, Considered Good 1,400.60 1,345.93 2,742.91 3,141.96
Unsecured, Considered Doubtful 0.33 0.33 5.44 4.98
2,227.15 2,175.93 2,829.33 3,236.73
Less : Provision for Doubtful Advances 0.33 0.33 5.44 4.98
2,226.82 2,175.60 2,823.89 3,231.75
2,302.52 2,243.86 2,851.36 3,248.30
AmountRecoverablefromCentral/StateGovt.:
Unsecured, Considered Good - - 23,843.23 20,926.89
Finance Lease Receivables 7.34 8.89 1.54 1.40
Claims Recoverable:
From Related Parties
Unsecured, Considered Good - - 1.39 17.16
Unsecured, Considered Doubtful - - 17.01 17.01
- - 18.40 34.17
From Others
Secured, Considered Good - - 8.12 -
Unsecured, Considered Good - - 1,562.65 1,107.29
Unsecured, Considered Doubtful 0.12 0.12 81.49 49.41
0.12 0.12 1,652.26 1,156.70
Less : Provision for Doubtful Claims 0.12 0.12 98.50 66.42
- - 1,553.76 1,090.28
- - 1,572.16 1,124.45
Contd...
[Item No. 6(d) & 8(e), Page No. 152 & 153]

172
NOTE - 15: LOANS AND ADVANCES (Contd.)(` in Crore)
Particulars Long Term Short Term
March-13 March-12 March-13 March-12
Balance with Customs, Port Trust and
Excise Authorities:
Unsecured, Considered Good - - 51.60 38.25
Deposits for Leave Encashment Fund - - 1,955.06 1,784.69
Advance Tax - - 657.48 469.20
Mat Credit Receivable - - 1,149.54 691.99
Materials given on loan:
To Related Parties
Secured, Considered Good - - 0.08 -
Less: Deposits received - - 0.08 -
- - - -
Sundry Deposits
a) To Related Parties
Unsecured, Considered Good 57.86 - - -
57.86 - - -
b) To Others
Secured, Considered Good 9.23 9.04 - 0.10
Unsecured, Considered Good 259.19 218.20 5,243.00 4,629.43
Unsecured, Considered Doubtful 0.04 0.04 0.31 0.32
268.46 227.28 5,243.31 4,629.85
326.32 227.28 5,243.31 4,629.85
Less : Provision for Doubtful Deposits 0.04 0.04 0.31 0.32
326.28 227.24 5,243.00 4,629.53
TOTAL 12,229.51 10,705.44 37,324.97 32,914.70
Share of jointly controlled entities 521.86 219.41 193.46 102.71

Consolidated Financial Statem
ents 2012-13
173
NOTE - 16: OTHER ASSETS (` in Crore)
Particulars Non Current Current
March-13 March-12 March-13 March-12
InterestAccruedonInvestments/BankDeposits - - 159.16 168.16
Gold Coins in Hand (at Cost) - - 5.66 4.40
Receivable from IOC Shares Trust - - 1,989.78 1,989.78
Less : Provision for Diminution - - 348.63 458.78
- - 1,641.15 1,531.00
Premium on Forward Contract (Refer Note 6):
As per Last account 3.57 21.19
Add:-Expenditure during the year 16.15 111.11
19.72 132.30
Less:Amortised during the year 19.72 128.73
Less:Current Portion - 3.95
- - - 3.95
Discount on Issue of Bonds:
As per Last account 20.16 5.41
Add:-Expenditure during the year - 17.32
20.16 22.73
Less:Amortised during the year 3.15 2.57
Less:Current Portion 3.15 3.15
13.86 17.01 3.15 3.15
Dismantled Capital Assets Held for Disposal - - 23.86 19.41
Others 1,268.01 3.43 1,299.94 602.18
TOTAL 1,281.87 20.44 3,132.92 2,332.25
Share of jointly controlled entities 1,268.01 3.43 732.73 256.61
[Item No. 6(e) & 8(f), Page No. 152 & 153]

174
NOTE - 17: INVENTORIES(` in Crore)
Particulars March-13 March-12
In Hand: Stores, Spares etc. 3,224.30 2,709.33 Less : Provision for Losses 153.93 132.57 3,070.37 2,576.76 Raw Materials 18,437.13 18,167.63 Finished Products 22,342.24 19,923.28 Stock in Trade 6,857.79 4,845.86 Stock in Process 6,107.28 5,737.68 WIP - Construction Contracts 37.63 17.12 Barrels and Tins 35.52 32.14 56,887.96 51,300.47In Transit: Stores & Spares etc. 130.23 145.36 Raw Materials 8,464.70 11,998.38 Finished Products 1.14 2.21 Stock in Trade 1,120.27 404.62 9,716.34 12,550.57
TOTAL 66,604.30 63,851.04
Share of jointly controlled entities 365.85 207.30
NOTE - 18: TRADE RECEIVABLES(` in Crore)
Particulars March-13 March-12
Over Six Months: From Others Unsecured, Considered Good 1,386.88 1,495.32 Unsecured, Considered Doubtful 134.19 140.63 1,521.07 1,635.95Other Debts: From Related Parties Unsecured, Considered Good 95.05 38.91 From Others Secured Considered Good 145.48 49.87 Unsecured, Considered Good 10,872.10 9,973.20 Unsecured, Considered Doubtful 55.55 74.12 11,073.13 10,097.19 11168.18 10,136.10 TOTAL 12,689.25 11,772.05 Less : Provision for Doubtful Debts 189.74 214.75 TOTAL 12,499.51 11,557.30
Share of jointly controlled entities 578.76 406.53
[Item No. 8(b), Page No. 153]
[Item No. 8(c), Page No. 153]

Consolidated Financial Statem
ents 2012-13
175
NOTE - 19: CASH AND BANK BALANCES(` in Crore)
Particulars March-13 March-12
Cash and Cash Equivalents Bank Balances with Scheduled Banks: Current Account 263.08 317.63 Fixed Deposit - Maturing within 3 months 625.38 155.48 Earmarked Balances A 46.24 43.48 934.70 516.59 Bank Balances with Non-Scheduled Banks: Bank of Commerce & Development, Libya 0.53 0.50 Myanmar Economic Bank Branch(5), Rangoon B 0.01 0.01 Others - 3.06 0.54 3.57 Cheques, Drafts in hand 159.76 152.87 Cash Balances, Including Imprest 8.21 3.66
Other Bank Balances Fixed Deposit 113.36 144.22 Blocked Account 3.23 1.04 116.59 145.26 TOTAL 1,219.80 821.95
Share of jointly controlled entities 458.53 319.49A) Mainly Pertains to Unpaid Dividend/Fractional Share Warrants.B) There exists restrictions on repatriation of said amount from Myanmar.
NOTE - 20: REVENUE FROM OPERATIONS(` in Crore)
Particulars March-13 March-12
Sale of Products 4,36,997.82 3,92,478.69
Less: Discounts 5,057.82 4,434.77
Sales (Net of Discounts) 4,31,940.00 3,88,043.92
Sale of Services 1,664.37 981.12
Other Operating Revenues (Note - “20.1”) 1,029.96 1,691.57
4,34,634.33 3,90,716.61
Net Claim/(Surrender) of SSC (304.78) -
Subsidy From Central/State Govt. A 1,782.24 1,820.28
Grant from Government of India B 53,278.07 45,485.84
TOTAL 4,89,389.86 4,38,022.73
A. Subsidies on sales of SKO (PDS) and LPG (Domestic) in India amounting to ` 1,729.72 crore (2012: ` 1,770.98 crore) and subsidies on sales of SKO & LPG to customers in Bhutan amounting to ` 52.52 crore (2012: ` 49.30 crore) have been reckoned as per the schemes notified by Government of India.
B1. The Group has accounted for Budgetary Support of ` 53,278.07 crore towards under-recovery on sale of regulated products viz HSD, SKO (PDS) and LPG (Domestic) for the current year [2012: ` 45,485.84 crore] in the Statement of Profit and Loss as Revenue Grants.
B2. In line with the scheme formulated by Petroleum Planning and Analysis Cell (PPAC), the Group has received during the year, discounts of ` 31,966.84 crore (2012: ` 29,619.23 crore) on Crude Oil/Products purchased from ONGC/GAIL/OIL and the same has been adjusted against the purchase cost. In addition an amount of ` NIL (2012: ` 341.50 crore) received from OIL has been accounted as other Operating Revenue.
[Item No. 8(d), Page No. 153]
[Item No. 1(a), Page No. 154]
176
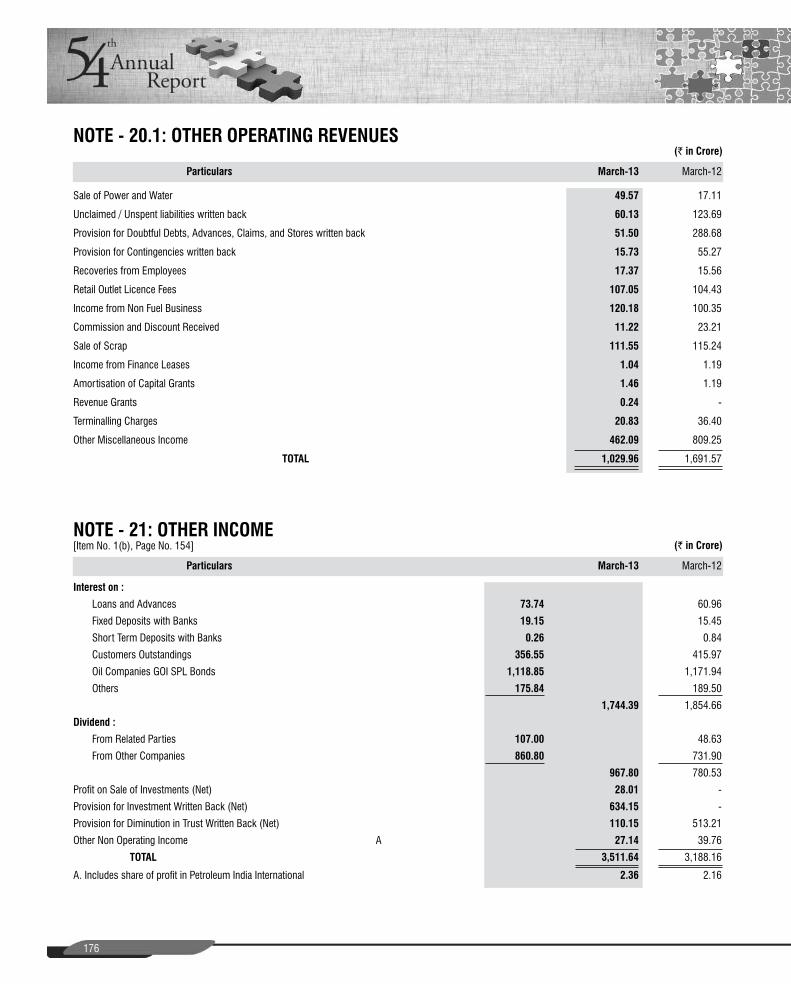
NOTE - 20.1: OTHER OPERATING REVENUES(` in Crore)
Particulars March-13 March-12
Sale of Power and Water 49.57 17.11
Unclaimed / Unspent liabilities written back 60.13 123.69
Provision for Doubtful Debts, Advances, Claims, and Stores written back 51.50 288.68
Provision for Contingencies written back 15.73 55.27
Recoveries from Employees 17.37 15.56
Retail Outlet Licence Fees 107.05 104.43
Income from Non Fuel Business 120.18 100.35
Commission and Discount Received 11.22 23.21
Sale of Scrap 111.55 115.24
Income from Finance Leases 1.04 1.19
Amortisation of Capital Grants 1.46 1.19
Revenue Grants 0.24 -
Terminalling Charges 20.83 36.40
Other Miscellaneous Income 462.09 809.25
TOTAL 1,029.96 1,691.57
NOTE - 21: OTHER INCOME(` in Crore)
Particulars March-13 March-12
Interest on :
Loans and Advances 73.74 60.96
Fixed Deposits with Banks 19.15 15.45
Short Term Deposits with Banks 0.26 0.84
Customers Outstandings 356.55 415.97
Oil Companies GOI SPL Bonds 1,118.85 1,171.94
Others 175.84 189.50
1,744.39 1,854.66
Dividend :
From Related Parties 107.00 48.63
From Other Companies 860.80 731.90
967.80 780.53
Profit on Sale of Investments (Net) 28.01 -
Provision for Investment Written Back (Net) 634.15 -
Provision for Diminution in Trust Written Back (Net) 110.15 513.21
Other Non Operating Income A 27.14 39.76
TOTAL 3,511.64 3,188.16
A. Includes share of profit in Petroleum India International 2.36 2.16
[Item No. 1(b), Page No. 154]

Consolidated Financial Statem
ents 2012-13
177
NOTE - 22: COST OF MATERIAL CONSUMED(` in Crore)
Particulars March-13 March-12
Raw Material Consumed:
Opening Balance 30,166.01 25,214.53
Add: Purchases 261,332.84 248,611.76
291,498.85 273,826.29
Less: Closing Stock 26,901.83 30,166.01
TOTAL 264,597.02 243,660.28
NOTE - 23: CHANGE IN INVENTORY(` in Crore)
Particulars March-13 March-12
Closing Stock
Finished Products 22,343.38 19,925.49
Stock in Process 6,107.28 5,737.68
Stock- in - trade 7,978.06 5,250.48
36,428.72 30,913.65
Less:
Opening Stock
Finished Products 19,925.49 17,618.95
Stock in Process 5,737.68 4,531.60
Stock - in - Trade 5,250.48 5,292.15
30,913.65 27,442.70
NetIncrease/(Decrease) 5,515.07 3,470.95
NOTE - 24: EMPLOYEE BENEFIT EXPENSES(` in Crore)
Particulars March-13 March-12
Salaries, Wages, Bonus etc. 4,740.08 3,796.05
Contribution to Provident & Other Funds 1,895.85 822.66
Voluntary Retirement Compensation 81.47 13.13
Staff Welfare Expenses 1,066.48 665.15
TOTAL 7,783.88 5,296.99
A. Disclosure in compliance with Accounting Standard-15 (Revised 2005) on “Employee Benefits” is given in Note - 29.
[Item No. 2(a), Page No. 154]
[Item No. 2(c), Page No. 154]
[Item No. 2(d), Page No. 154]

178
NOTE - 25: FINANCE COST(` in Crore)
Particulars March-13 March-12
Interest Payments on:
Fixed period loans from Banks/Financial Institutions/Others 562.47 611.13
Bonds/Debentures 403.22 482.99
Short Term loans from Banks 2,264.80 2,125.70
Others 2,741.80 1,718.59
5,972.29 4,938.41
Other Borrowing Cost 61.32 38.81
Applicable Net (Gain)/Loss on Foreign Currency Transactions and Translation 1,049.91 917.43
TOTAL 7,083.52 5,894.65
NOTE - 26: OTHER EXPENSES(` in Crore)
Particulars March-13 March-12
Consumption:
a) Stores, Spares and Consumables 1,135.56 953.44
b) Packages & Drum Sheets 440.56 382.06
1,576.12 1,335.50
Power & Fuel 25,198.48 22,879.50
Less : Fuel from own production 19,755.86 18,997.71
5,442.62 3,881.79
Throughput, Processing & Blending Fees, Royalty and Other Charges 491.66 490.29
Octroi, Other Levies and Irrecoverable taxes 955.45 976.57
Repairs and Maintenance
i) Plant & Machinery 1,937.31 1,587.83
ii) Buildings 172.05 159.21
iii) Others 159.34 126.19
2,268.70 1,873.23
Freight, Transportation Charges and Demurrage 8,694.51 7,508.52
Office Administration, Selling and Other Expenses (Note - 26.1) 7,005.88 8,166.13
TOTAL 26,434.94 24,232.03
Less: Company's use of own Products and Crude 902.15 880.87
25,532.79 23,351.16
Duties (Net) 87.96 (583.02)
TOTAL (Net) 25,620.75 22,768.14
[Item No. 2(e), Page No. 154]
[Item No. 2(g), Page No. 154]

Consolidated Financial Statem
ents 2012-13
179
NOTE - 26.1: OFFICE, ADMINISTRATION, SELLING AND OTHER EXPENSES(` in Crore)
Particulars March-13 March-12
Rent 379.42 358.95
Insurance 131.72 110.27
Rates & Taxes 146.92 75.08
Donations 5.07 9.05
Payment to auditors
a) Audit Fees 1.90 1.54
b) Tax Audit Fees 0.14 0.13
c) Other Services(for issuing certificates etc.) 0.43 0.36
d) Out of Pocket Expenses 0.70 0.42
3.17 2.45
Travelling & Conveyance 489.66 371.43
Communication Expenses 59.63 50.35
Printing & Stationery 32.52 31.79
Electricity & Water 233.71 201.45
Bank Charges 48.08 53.68
Bad Debts, Advances & Claims written off 3.45 49.21
Provision/ Loss on Assets sold or written off (Net) 28.66 5.08
Technical Assistance Fees 23.29 29.58
Exchange Fluctuation (net) 1,838.63 3,182.86
Provision for Doubtful Debts, Advances, Claims, CWIP, Stores etc. 73.33 59.17
Provision for Dimunition in Investments - 418.15
Security Force Expenses 301.38 268.03
Sales Promotion Expenses (Incl. Commission) 622.94 494.19
Handling Expenses 261.91 214.47
Expenses on Enabling Facilities 60.81 24.00
Commodity Hedging Losses (Net) 0.34 328.13
Terminalling Charges 22.51 20.06
Provision for Probable Contingencies 429.46 93.05
Exploration & Production Cost 213.33 180.23
Amortisation of Premium on Forward Contracts 19.72 89.66
MTM Loss on Interest Rate Swap 10.81 110.26
Loss on Sale of Investments (Net) - 18.87
Expenses on CSR Activities 82.88 78.47
Miscellaneous Expenses 1,482.53 1,238.16
TOTAL 7,005.88 8,166.13
A. In respect of Oil and Gas Exploration activities, Revenue Expenditure amounting to ` 213.33 crore (2012 : ` 180.23 crore) and Capital Expenditure amounting to ` 166.08 crore (2012 : ` (51.41) crore) of Oil and Gas Exploration Projects have been incorporated in these accounts on the basis of unaudited statements provided by respective operators of Production Sharing Contracts to the Company.

180
NOTE - 27: INCOME / EXPENSES RELATING TO PREVIOUS YEARS(` in Crore)
Particulars March-13 March-12
Income:
Miscellaneous Income (43.44) 40.91
Total Income (43.44) 40.91
Expenditure:
Purchase of Products and Crude (40.76) 0.16
Depreciation and Amortization on:
Tangible Assets 11.67 (326.05)
Intangible Assets 7.14 0.66
Consumption of Stores, Spares and Consumables (27.04) (1.27)
Technical fees 0.70 1.30
Power and Fuel (7.34) (1.22)
Repairs and Maintenance 2.72 7.93
Interest (0.36) 6.96
Rent - 0.08
Rates & Taxes 0.20 1.45
Employee Benefit Expenses 0.45 16.38
Other Expenses 6.02 64.28
Total Expediture (46.60) (229.34)
NET INCOME /(EXPENDITURE) 3.16 270.25
NOTE - 28: CONTINGENT LIABILITIES & COMMITMENTSA. Contingent Liabilities
A.1 Contingent Liabilities amounting to ` 12,104.56 crore (2012: ` 9,784.10 crore) are as under :
A.1.1 ` 5,164.02 crore (2012: ` 4,880.81 crore) being the demands raised by the Central Excise /Customs/ VAT/ Sales Tax Authorities including interest of `1,654.32 crore (2012 : ` 1,696.33 crore) .
A.1.2 ` 1,294.80 crore (2012: ` 1,244.75 crore) in respect of demands for Entry Tax from State Governments including interest of ` 44.94 crore (2012: ` 63.69 crore).
A.1.3 ` 3,019.53 crore (2012: ` 2,126.71 crore) in respect of Income Tax demands including interest of ` 268.22 crore (2012 : ` 302.24 crore).
A.1.4 ` 1,943.37crore (2012: ` 912.69 crore) including ` 1,613.23 crore (2012: ` 609.89 crore) on account of Projects for which suits have been filed in the Cour ts or cases are lying with Arbitrator.This includes interest of `37.81 crore (2012: `29.68 crore).
A.1.5 ` 682.84 crore (2012: `619.14 crore) in respect of other claims including interest of ` 98.73 crore (2012 : ` 70.91 crore).
The Company has not considered those disputed demands/claims as contingent liabilities, the outflow of resources for which would be remote.
A.2 Pending decision of the Government, no liability could be determined and provided for in respect of additional compensation, if any, payable to the land owners and the Government for certain lands acquired.
B. Commitments
B.1 Capital Commitments
Estimated amount of contracts remaining to be executed on Capital Account not provided for ` 15,428.30 crore (2012: ` 19,115.10 crore).
B.2 Other Commitments
The Group has an export obligation to the extent of ̀ 3,200.51 crore (2012: ̀ 3,226.10 crore) on account of concessional rate of customs duty availed under EPCG license scheme on import of capital goods.
[Item No. 4, Page No. 154]

Consolidated Financial Statem
ents 2012-13
181
NOTE - 29: EMPLOYEE BENEFITS
The Group has adopted Accounting Standard 15 (AS15) on “Employee Benefits”. These consolidated financial statements include the obligations as per the requirements of this standard except for those subsidiaries which are incorporated outside India who have determined the valuation/provision for employee benefits as per requirements of their respective countries. The disclosure in compliance with the Standard is as under:
(a) Provident Fund
During the year, the Group has recognised ` 312.99 crore (2011-12 : ` 280.43 crore) as Employer's contribution to Provident Fund in the Statement of Profit and Loss (included in Contribution to Provident and Other Funds in Note - 24).
(b) Pension Scheme
During the year, the Group has recognised ` 243.91 crore (2011-12 : ` 348.65 crore) towards Defined Contributory Employees Pension Scheme in the Statement of Profit and Loss (included in Contribution to Provident and Other Funds in Note - 24).
(c) ReconciliationofbalanceofDefinedBenefitObligation(` in Crore)
Gratuity Leave Encashment PRMS Resettlement Long Service Staff Allowance Award Pension Fund at AOD
Funded Non-Funded Funded Non-Funded Funded Non-Funded Non-Funded Non-Funded Funded
Defined Obligation at the 1,451.03 1.58 4.59 1,683.22 882.94 31.49 79.36 219.53 7.97 beginning of the year 1,445.66 1.65 4.29 1,631.50 829.99 20.56 83.00 112.29 9.28
Transalation Difference - 0.11 - - - - - - - - - - - - - - - -
Current Service Cost 14.40 0.15 0.25 116.55 61.85 0.47 7.55 34.27 0.21 18.28 0.06 0.22 53.56 52.90 0.43 3.45 20.19 0.24
Interest Cost 124.90 0.17 0.37 143.80 76.20 2.58 7.33 20.34 0.64 116.88 0.15 0.30 130.76 70.00 2.42 7.06 10.23 0.68
Past Service Cost - - - - 708.90 - - - - - - (0.08) - - 9.06 - - -
Benefits paid (131.52) (0.12) (0.70) (258.31) (100.15) (1.13) (3.97) (34.98) (1.17) (108.14) (0.23) (1.14) (213.30) (70.39) (0.86) (2.66) (17.59) (2.07)
Actuarial (gain)/ loss on obligations 61.46 (0.10) 0.99 407.18 55.98 2.37 (7.44) 0.50 (0.04) (21.65) (0.05) 1.00 80.70 0.44 (0.12) (11.49) 94.41 (0.16)
Defined Benefit Obligation at the 1,520.27 1.79 5.50 2,092.44 1,685.72 35.78 82.83 239.66 7.61 end of the year 1,451.03 1.58 4.59 1,683.22 882.94 31.49 79.36 219.53 7.97
(d) Reconciliation of balance of Fair Value of Plan Assets(` in Crore)
Gratuity Leave Encashment PRMS Resettlement Long Service Staff Allowance Award Pension Fund at AOD
Funded Non-Funded Funded Non-Funded Funded Non-Funded Non-Funded Non-Funded Funded
Fair Value of Plan Assets at the 1,697.85 - 4.31 - 882.94 - - - 7.74 beginning of the year 1,554.96 - 3.87 - - - - - 8.17
Expected return on plan assets 145.87 - 0.39 - 75.93 - - - 0.64 128.64 - 0.33 - - - - - 0.68
Contribution by employer 130.05 - 1.11 - 71.05 - - - - 103.77 - 1.14 - 901.37 - - - 0.76
Benefit paid (131.52) - (0.70) - (100.15) - - - (1.17) (108.14) - (1.14) - (70.39) - - - (2.07)
Actuarial gain / (losses) 15.52 - 0.02 - 13.45 - - - (0.07) 18.62 - 0.11 - 51.96 - - - 0.20
Fair value of plan assets at the 1,857.77 - 5.13 - 943.22 - - - 7.14 end of the year 1,697.85 - 4.31 - 882.94 - - - 7.74
Contd...

182
(e) ReconciliationofFairValueofPlanAssetsandDefinedBenefitObligation(` in Crore)
Gratuity Leave Encashment PRMS Resettlement Long Service Staff Allowance Award Pension Fund at AOD
Funded Non-Funded Funded Non-Funded Funded Non-Funded Non-Funded Non-Funded Funded
Fair Value of Plan Assets 1,857.77 - 5.13 - 943.22 - - - 7.14
at the end of the year 1,697.85 - 4.31 - 882.94 - - - 7.74
Defined Benefit Obligation 1,520.27 1.79 5.50 2,092.44 1,685.72 35.78 82.83 239.66 7.61
at the end of the year 1,451.03 1.58 4.59 1,683.22 882.94 31.49 79.36 219.53 7.97
Amount recognised in the Balance Sheet (337.50) 1.79 0.37 2,092.44 742.50 35.78 82.83 239.66 0.47
(246.82) 1.58 0.28 1,683.22 - 31.49 79.36 219.53 0.23
(f) AmountrecognisedinCWIP/StatementofProfitandLoss(` in Crore)
Gratuity Leave Encashment PRMS Resettlement Long Service Staff Allowance Award Pension Fund at AOD
Funded Non-Funded Funded Non-Funded Funded Non-Funded Non-Funded Non-Funded Funded
Current Service Cost 14.40 0.15 0.25 116.55 61.85 0.47 7.55 34.27 0.21
18.28 0.06 0.22 53.56 52.90 0.43 3.45 20.19 0.24
Interest Cost 124.90 0.17 0.37 143.80 76.20 2.58 7.33 20.34 0.64
116.88 0.15 0.30 130.76 70.00 2.42 7.06 10.23 0.68
Expected (return) / loss on plan asset (145.87) - (0.39) - (75.93) - - - (0.64)
(128.64) - (0.33) - - - - - (0.68)
Past Service Cost - - - - 708.90 - - - -
- - (0.08) - - 9.06 - - -
Actuarial (gain)/ loss 45.94 (0.10) 0.97 407.18 42.53 2.37 (7.44) 0.50 0.03
(40.27) (0.05) 0.89 80.70 (51.52) (0.12) (11.49) 94.41 (0.36)
Expenses for the year 39.37 0.22 1.20 667.53 813.55 5.42 7.44 55.11 0.24
(33.75) 0.16 1.00 265.02 71.38 11.79 (0.98) 124.83 (0.12)
(g) Major Actuarial Assumptions
Gratuity Leave Encashment PRMS Resettlement Long Service Staff Allowance Award Pension Fund at AOD
Funded* Non-Funded Funded Non-Funded* Funded* Non-Funded Non-Funded* Non-Funded* Funded*
Discount rate 8.25% 11.75% 8.00% 8.25% 8.25% 8.16% 8.25% 8.25% 8.25%
8.63% 10.63% 8.60% 8.63% 8.63% 8.30% 8.63% 8.63% 8.63%
Expected return on plan assets 8.70% - 8.50% - 8.70% - - - 9.00%
8.60% - 8.50% - 8.60% - - - 9.00%
Salary escalation 8.00% 4.00% 8.00% 8.00% - - - - 8.00%
8.00% 4.00% 8.00% 8.00% - - - - 8.00%
Inflation - - - - 7.00% 7.00% 6.00% - -
- - - - 7.00% 7.00% 6.00% - -
*Assumptions considered in acturial valuation of defined benefit obligations of Parent company.

Consolidated Financial Statem
ents 2012-13
183
NOTE - 30: SEGMENT INFORMATIONInformation regarding Primary Segment Reporting as per AS-17 for the year ended March 31, 2013 is as under:
(` in Crore)
March-13 March-12
Petroleum Petro- Other Eliminations Total Petroleum Petro- Other Eliminations Total Products chemicals Businesses Products chemicals Businesses
Revenue External Revenue 435,649.07 15,596.49 10,534.11 - 461,779.67 390,542.92 11,174.09 7,205.99 - 408,923.00 Inter-segment Revenue 10,114.16 39.55 5,092.29 (15,246.00) - 7,506.24 48.72 3,617.94 (11,172.90) -
Total Revenue 445,763.23 15,636.04 15,626.40 (15,246.00) 461,779.67 398,049.16 11,222.81 10,823.93 (11,172.90) 408,923.00
ResultSegment Results 9,213.76 528.93 197.57 - 9,940.26 17,665.72 (209.94) 308.56 - 17,764.34 Less: Finance Cost 7,083.52 5,894.65 Loss on Sale of Investments (Net) - 18.87 Provision for diminution in Investments (Net) - 418.15 Loss on sale and disposal of Assets 28.66 5.08 Exchange Loss (Net) 1,838.63 3,182.86 Add: Interest/Dividend Income 2,712.19 2,635.19 Profit on Sale of Investments (Net) 28.01 - Provision for diminution in Investments written back (Net) 634.15 - Provision for diminution in Trust written back (Net) 110.15 513.21 Other non operating income 27.14 39.76 Prior year income/(expenses) -net 3.16 270.25
ProfitbeforeExceptionalitemsandTax 4,504.25 11703.14Exceptional Items - (7,707.82)
ProfitBeforeTax 4,504.25 3,995.32 Less: Income Tax (including deferred tax) 876.95 (269.95)
ProfitAfterTax 3,627.30 4,265.27
Other InformationSegment Assets 197,113.39 18,358.95 2,953.52 - 218,425.86 180,562.94 18,242.32 2,211.42 - 201,016.68 Corporate Assets 19,187.48 18,785.51
Total Assets 237,613.34 219,802.19
Segment Liabilities 73,338.27 437.60 1,716.11 - 75,491.98 68,066.41 828.66 1,025.57 - 69,920.64 Corporate Liabilities 97,909.38 87,588.84
Total Liabilities 173,401.36 157,509.48
Capital Employed Segment Wise 123,775.12 17,921.35 1,237.41 142,933.88 112,496.53 17,413.66 1,185.85 131,096.04 Corporate (78,721.90) (68,803.33)
64,211.98 62,292.71
Capital Expenditure 13,452.17 317.54 569.49 14,339.20 14,690.62 196.88 429.56 15,317.06 Depreciation and Amortization 4,629.27 996.07 66.16 5,691.50 4,282.17 952.54 74.55 5,309.26
Notes:1. The Group is engaged in the following business segments: a) Sale of Petroleum Products b) Sale of Petrochemicals c) Other Businesses, which comprises Sale of Gas, Explosives & Cryogenics, Wind Mill & Solar Power Generation and Oil & Gas Exploration Activities. Segments have been identified and reported, taking into account, the nature of products and services and differing risks and returns. 2. Segment Revenue comprises of the following: a) Turnover (Net of Excise Duties) b) Net Claim/(Surrender) of SSC c) Subsidy / Grants received from Government of India d) Other Operating Income3. There are no reportable geographical segments.
184
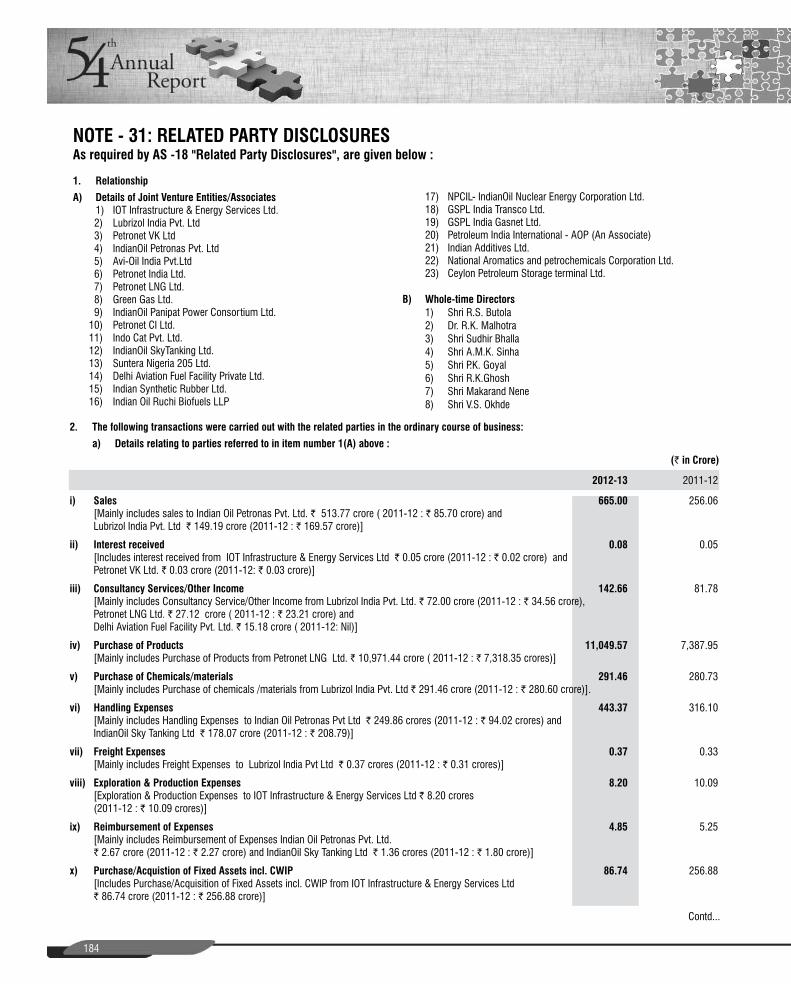
NOTE - 31: RELATED PARTY DISCLOSURES
1. Relationship
A) DetailsofJointVentureEntities/Associates 1) IOT Infrastructure & Energy Services Ltd. 2) Lubrizol India Pvt. Ltd 3) Petronet VK Ltd 4) IndianOil Petronas Pvt. Ltd 5) Avi-Oil India Pvt.Ltd 6) Petronet India Ltd. 7) Petronet LNG Ltd. 8) Green Gas Ltd. 9) IndianOil Panipat Power Consortium Ltd. 10) Petronet CI Ltd. 11) Indo Cat Pvt. Ltd. 12) IndianOil SkyTanking Ltd. 13) Suntera Nigeria 205 Ltd. 14) Delhi Aviation Fuel Facility Private Ltd. 15) Indian Synthetic Rubber Ltd. 16) Indian Oil Ruchi Biofuels LLP
As required by AS -18 "Related Party Disclosures", are given below :
17) NPCIL- IndianOil Nuclear Energy Corporation Ltd. 18) GSPL India Transco Ltd. 19) GSPL India Gasnet Ltd. 20) Petroleum India International - AOP (An Associate) 21) Indian Additives Ltd. 22) National Aromatics and petrochemicals Corporation Ltd. 23) Ceylon Petroleum Storage terminal Ltd.
B) Whole-time Directors 1) Shri R.S. Butola 2) Dr. R.K. Malhotra 3) Shri Sudhir Bhalla 4) Shri A.M.K. Sinha 5) Shri P.K. Goyal 6) Shri R.K.Ghosh 7) Shri Makarand Nene 8) Shri V.S. Okhde
2. The following transactions were carried out with the related parties in the ordinary course of business:
a) Details relating to parties referred to in item number 1(A) above :
(` in Crore)
2012-13 2011-12
i) Sales 665.00 256.06 [Mainly includes sales to Indian Oil Petronas Pvt. Ltd. ` 513.77 crore ( 2011-12 : ` 85.70 crore) and
Lubrizol India Pvt. Ltd ` 149.19 crore (2011-12 : ` 169.57 crore)]
ii) Interest received 0.08 0.05 [Includes interest received from IOT Infrastructure & Energy Services Ltd ` 0.05 crore (2011-12 : ` 0.02 crore) and
Petronet VK Ltd. ` 0.03 crore (2011-12: ` 0.03 crore)]
iii) ConsultancyServices/OtherIncome 142.66 81.78 [Mainly includes Consultancy Service/Other Income from Lubrizol India Pvt. Ltd. ` 72.00 crore (2011-12 : ` 34.56 crore),
Petronet LNG Ltd. ` 27.12 crore ( 2011-12 : ` 23.21 crore) and Delhi Aviation Fuel Facility Pvt. Ltd. ` 15.18 crore ( 2011-12: Nil)]
iv) Purchase of Products 11,049.57 7,387.95 [Mainly includes Purchase of Products from Petronet LNG Ltd. ` 10,971.44 crore ( 2011-12 : ` 7,318.35 crores)]
v) PurchaseofChemicals/materials 291.46 280.73 [Mainly includes Purchase of chemicals /materials from Lubrizol India Pvt. Ltd ` 291.46 crore (2011-12 : ` 280.60 crore)].
vi) Handling Expenses 443.37 316.10 [Mainly includes Handling Expenses to Indian Oil Petronas Pvt Ltd ` 249.86 crores (2011-12 : ` 94.02 crores) and
IndianOil Sky Tanking Ltd ` 178.07 crore (2011-12 : ` 208.79)]
vii) Freight Expenses 0.37 0.33 [Mainly includes Freight Expenses to Lubrizol India Pvt Ltd ` 0.37 crores (2011-12 : ` 0.31 crores)]
viii) Exploration & Production Expenses 8.20 10.09 [Exploration & Production Expenses to IOT Infrastructure & Energy Services Ltd ` 8.20 crores
(2011-12 : ` 10.09 crores)]
ix) Reimbursement of Expenses 4.85 5.25 [Mainly includes Reimbursement of Expenses Indian Oil Petronas Pvt. Ltd.
` 2.67 crore (2011-12 : ` 2.27 crore) and IndianOil Sky Tanking Ltd ` 1.36 crores (2011-12 : ` 1.80 crore)]
x) Purchase/AcquistionofFixedAssetsincl.CWIP 86.74 256.88 [Includes Purchase/Acquisition of Fixed Assets incl. CWIP from IOT Infrastructure & Energy Services Ltd ` 86.74 crore (2011-12 : ` 256.88 crore)]
Contd...

Consolidated Financial Statem
ents 2012-13
185
b) Details relating to the parties referred to in Item No.1 (B) above :
(` in Crore)
FY 2012-13
Details of Whole-time Directors Remuneration Interest & Outstanding FurnitureHireCharges loans/advances receivables
1) Shri R.S. Butola 0.54 - - 2) Dr. R.K. Malhotra 0.54 - - 3) Shri Sudhir Bhalla 1.37 - 0.05 4) Shri A.M.K. Sinha 0.46 - - 5) Shri P.K. Goyal 0.46 - 0.02 6) Shri R.K. Ghosh 0.41 - 0.06 7) Shri Makarand Nene 0.44 - - 8) Shri V.S. Okhade 0.34 - - TOTAL 4.56 - 0.13
FY 2011-12
Details of Whole-time Directors Remuneration Interest & Outstanding FurnitureHireCharges loans/advances receivables
1) Shri R.S. Butola 0.37 - - 2) Shri S.V. Narasimhan (upto 30.04.2011) 0.57 - - 3) Shri B.N. Bankapur (upto 31.08.2011) 0.54 - - 4) Shri G.C. Daga (upto 30.09.2011) 0.63 - 0.01 5) Shri K.K. Jha (upto 31.01.2012) 0.41 0.01 - 6) Dr. R.K. Malhotra 0.37 - - 7) Shri Sudhir Bhalla 0.40 - 0.05 8) Shri A.M.K. Sinha 0.31 - - 9) Shri P.K. Goyal 0.42 - 0.02 10) Shri R.K. Ghosh 0.29 - 0.08 11) Shri Makarand Nene 0.20 - - 12) Shri V.S. Okhade 0.06 - 0.01 TOTAL 4.57 0.01 0.17
(` in Crore)
2012-13 2011-12
xi) Provisionsmade/(writtenoff)duringtheyear 0.03 (40.38) [Mainly includes provision made against advance given to Petronet VK Ltd. ` 0.03 crore(2011-12: ` 0.15 crore)]
xii) OutstandingReceivables/LoansRecoverable 244.11 278.05 [Mainly includes Outstanding Receivables from IOT Infrastructure & Energy Services Ltd
` 83.94 crore (2011-12 : ` 169.12 crore), Suntera Nigeria 205 Ltd ` 75.58 crores (2011-12 : ` 68.11 Crore) and IndianOil Petronas Pvt. Ltd ` 58.42 crore (2011-12: ` 20.92 crore)]
xiii) Outstanding Payables 809.46 642.86 [Mainly includes Outstanding payable to Petronet LNG. Ltd. ` 684.07 crore (2011-12 : ` 429.99 crore)]
xiv) Claims Recoverable 14.40 14.40 (Claims recoverable from National Aromatics and Petrochemicals Corporation Ltd.
` 14.40 crore (2011-12 : ` 14.40 crore)
xv) Provision for Doubful Claims 14.40 14.40 (Provision for Doubful Claims in respect of National Aromatics and Petrochemicals Corporation Ltd.
` 14.40 crore (2011-12 : ` 14.40 crore)

186
Notes:
1) This does not include the impact of provision made on acturial valuation of retirement benefit Schemes and provision made during the period towards Post Retirement Benefits as the same are not separately ascertainable for individual directors.
2) In addition, whole - time Directors are also allowed the use of Corporation’s car for private purposes upto 12,000 kms per annum on a payment of ̀ 520/- per mensem for car less than 16 hp or `780/- per mensem for car of above 16 hp as specified in the terms of appointment.
3) No disclosure is required for Subsidiary Companies which can be treated as state controlled enterprises (i.e. ownership by Central/State Govt., directly or indirectly, of more than 50% of voting rights, shall be treated as state controlled enterprise).
4) In case of Joint Venture Companies constituted/acquired during the period, transactions w.e.f. date of constitution/acquisition is disclosed.
5) In case of Joint Venture Companies which have been closed/divested during the period, transactions upto the date of closure/disinvestment only are disclosed.

Consolidated Financial Statem
ents 2012-13
187
Finance Leases on Tank Wagons:
Company has entered into Lease Agreement with Indian Railways in respect of BTPN Tank Wagons for a minimum period of 20 years. The lease rentals from the date of formation of rake are @ 16% for the first 10 years and thereafter at the nominal rate of 1% of the cost.
(` in Crore)
Particulars March-13 March-12
A. Gross Investments in Finance Lease 415.64 415.64 Less: Unearned Finance Income 3.01 4.05 Less: Finance Income Received 168.14 167.10 Less: Minimum Lease payment received 235.61 234.20 Net Investment in Finance Lease as on Date 8.88 10.29 B. Unearned finance Income 3.01 4.05 C. Present Value of Minimum Lease Payments Receivable Not Later than one year 1.54 1.41 Later than one year and not later than five years 6.71 7.13 Later than Five years 0.63 1.75 Total 8.88 10.29 D. Break-up of un-earned income Not Later than one year 0.90 1.04 Later than one year and not later than five years 2.02 2.75 Later than Five years 0.09 0.26 Total 3.01 4.05
Operating leases:a) As Lessees Lease Rentals charged to the profit and loss account and maximum obligations on long term non-cancellable operating leases payable as per the rentals stated in the respective lease agreements:
(` in Crore)
Particulars March-13 March-12
A. Lease rentals recognized during the period 76.64 50.48
B. Lease Obligations
- Not later than One Year 65.95 47.57
- Later than one year and not later than five years 230.42 160.61
- Later than five years 671.78 556.14
b) As Lessors
The lease rentals recognized as income in these statements as per the rentals stated in the respective agreements:(` in Crore)
Particulars March-13 March-12
A. Lease rentals recognized as income during the period 1.62 1.51
B. Lease Rentals (Category of assets – Plant & Equipment)
- Gross Carrying Amount 1.98 2.05
- Accumulated Depreciation 1.27 1.19
- Depreciation recognized in Profit and Loss Account 0.09 0.09
These relate to storage tankage facilities for petroleum products given on lease at mutually agreed lease rent.
NOTE - 32: LEASESDisclosure as required under Accounting Standard – 19 on “Leases”:

188
NOTE - 33: EARNINGS PER SHARE (EPS)
In compliance of Accounting Standard – 20 on “Earning Per Share”, the calculation of Earning Per Share (Basic and Diluted) is as under:
March-13 March-12
Profit for the Group (` in Crore) 4,449.01 4,225.98
Total Weighted Average number of equity shares used for computing Earning Per Share (Basic & Diluted) 2427952482 2427952482
Earning Per Share (Basic and Diluted) (`) 18.32 17.41
Face value per share (`) 10/- 10/-
In compliance of AS-27, "Financial Reporting of Interest in Joint Ventures", the required information is as under:1) Disclosure of Interest in the following categories of Joint Ventures:
(a) Jointly Controlled Operations:-
The Corporation has entered into production sharing agreements for oil and gas exploration blocks with the Govt. of India and other body corporates.These joint ventures are:
Name Participating Interest of IOC (%)
31.03.2013 31.03.2012
IN INDIA Under NELP Block MN-OSN-2000/2 20.00 20.00 AA-ONN-2001/2 20.00 20.00 MB-OSN-2004/1 20.00 20.00 MB-OSN-2004/2 20.00 20.00 KG-DWN-2005/1 20.00 20.00 GK-OSN-2009/1 20.00 20.00 GK-OSN-2009/2 30.00 30.00 CB-ONN-2010/6 20.00 20.00 Others AAP-ON-94/1 43.55 43.55 BK-CBM-2001/1 20.00 20.00 NK-CBM-2001/1 20.00 20.00 OUTSIDE INDIA FARSI BLOCK IRAN 40.00 40.00 LIBYA BLOCK 86 50.00 50.00 LIBYA BLOCK 102/4 50.00 50.00 SHAKTHI GABON* 50.00 50.00 YEMEN 82 15.00 15.00 YEMEN 83 15.00 15.00 AREA 95-96 25.00 25.00 * Participating Interest will come down to 45% after Exploration phase.
NOTE - 34: INTEREST IN JOINT VENTURES
[Item No. 12, Page No. 155]

Consolidated Financial Statem
ents 2012-13
189
(b) Jointly Controlled Assets:- Details of Group's share of Jointly Owned Assets:
(` in Crore)
Assets Name of Joint Original Accumulated W.D.V. as at Particulars Owner Cost Depreciation & 31.03.13 Amortisation
Land - Freehold HPC/BPC 3.10 0.00 3.10
Land - Leasehold HPC/BPC/BALMER LAWRIE 0.18 0.07 0.11
Buildings HPC/BPC/BALMER LAWRIE 17.97 6.55 11.42
Plant and Equipment HPC/BPC/GSFC/IPCL/GNRE 127.31 66.24 61.07
Transport Equipment RAILWAYS 183.58 174.40 9.18
Railway Sidings HPC/BPC 55.94 40.28 15.66
Drainage,Sewage & Water Supply GSFC 0.99 0.94 0.05
Furniture HPC/BPC 0.00 0.00 0.00
Total 389.07 288.48 100.59
Previous year 389.05 278.16 110.89
(c) Jointly Controlled Entities:-
Name Country of Ownership Interest of IOC(%) Incorporation 31.03.2013 31.03.2012
(i) IOT Infrastructure & Energy Services Ltd India 47.91 47.92 (ii) Lubrizol India Pvt. Ltd. India 50.00 50.00 (iii) Petronet VK Ltd. India 26.00 26.00 (iv) Petronet CI Ltd. India 26.00 26.00 (v) IndianOil SkyTanking Ltd. India 33.33 33.33 (vi) Indo Cat Pvt. Ltd. India 50.00 50.00 (vii) Delhi Aviation Fuel Facility Pvt. Ltd. India 37.00 37.00 (viii) IndianOil Petronas Pvt.Ltd. India 50.00 50.00 (ix) Suntera Nigeria 205 Ltd Nigeria 25.00 25.00 (x) IndianOil Panipat Power Consortium Ltd. India 50.00 50.00 (xi) Avi-Oil India Pvt. Ltd. India 25.00 25.00 (xii) Petronet India Ltd. India 18.00 18.00 (xiii) Petronet LNG Ltd. India 12.50 12.50 (xiv) Indian Synthetic Rubber Limited India 50.00 50.00 (xv) Indian Oil Ruchi Biofuels LLP India 50.00 50.00 (xvi) Green Gas Ltd. India 22.50 22.50 (xvii) NPCIL IndianOil Nuclear Energy Corporation Limited India 26.00 26.00 (xviIi) GSPL India Transco Ltd.* India 20.65 - (xix) GSPL India Gasnet Ltd.* India 22.16 -
* Ownership interest has been computed on the basis of actual cash contribution in equity as on 31.03.2013. However, share of IOCL is 26% as per JV agreement.
2) IOC's Share in aggregate of Contingent Liabilities and Capital Commitments of Jointly Controlled Operations and Assets :
(` in Crore)
31.03.2013 31.03.2012
(a) Jointly Controlled Operations
(i) Contingent Liabilities 19.22 0.20
(ii) Capital Commitments 1,007.68 1,214.86
(b) Jointly Controlled Assets
(i) Contingent Liabilities - -
(ii) Capital Commitments - -

190
3) IOC's Share in assets, liabilities, income, expenses, contingent liabilities and capital commitments of Jointly Controlled Entities:
(` in Crore)
31.03.2013 31.03.2012
(i) Assets - Long Term Assets 3746.38 1938.55 - Current Assets 2347.67 1306.98 (ii) Liabilities - Current Liabilities and Provisions 1891.86 938.95 - Other Liabilities 2346.30 802.74 (iii) Income 6636.48 4602.13 (iv) Expenses 6183.98 4152.87 (v) Contingent Liabilities 193.25 89.47 (vi) Capital Commitments 386.97 497.75
Financial and Derivative Instruments:
1. All derivative contracts entered into by the Company are for hedging its foreign currency, interest rate and commodity exposures relating to underlying transactions and firm commitments and not for any speculative or trading purposes.
2. The Derivative contracts entered into by the Company and outstanding as on 31st March 2013 are as below:
(a) For Hedging Currency Risks
Nominal amounts of derivative contracts entered into by the Company and outstanding as on 31st March 2013 is given below:(` in Crore)
S. No. Particulars Unit of Currency As on 31.03.2013 As on 31.03.2012
No of Aggregate No of Aggregate contracts amount contracts amount
1. Forward Contracts USD 4 217.26 16 379.80
(b) For Hedging Commodity Related Risks:
Category–wise quantitative data about commodity derivative transactions that are outstanding as on 31st March 2013 is given below:
Quantity ( in ‘000 bbls)
S. No. Particulars As at 31st March 2013 As at 31st March 2012
1. Swaps on Crude oil 50 500
2. Margin Hedging 200 250
(c) For Hedging Interest Rate Related Risks:
Interest rate swap for ̀ 2,714.50 crore (2011-12: ̀ 2,544.00 crore) - (USD 500 million) syndicated loan (swap from 1/3/6 month USD LIBOR till maturity to 2.222% Fixed)
S. No. Particulars Number of Contracts
As at 31st March 2013 As at 31st March 2012
1 Swaps of Interest Rates 1 1
Mark to market losses as at the Balance Sheet date are recognised in the Statement of Profit and Loss
3. Foreign currency exposure that are not hedged by a derivative instrument as on 31st March 2013 is given below:
(` in Crore)
S. No. Particulars As on 31.03.2013 As on 31.03.2012
Aggregate amount Aggregate amount
1 Unhedged* 66,744.72 53,204.66
* Including cross currency swaps amounting to ` 1768 crore (2012:` Nil )
NOTE - 35: EXPOSURE TO FINANCIAL AND COMMODITY DERIVATIVES

Consolidated Financial Statem
ents 2012-13
191
NOTE - 36: ADDITIONAL DISCLOSURES BY GROUP COMPANIES
Lanka IOC PLC
a) Goodwill represents the excess of purchase consideration paid in 2003 to the Government of Sri Lanka over the net assets value representing applicable shares allotted in the acquisition of the retail outlet, which were vested with Independent Petroleum Marketers Limited (IPML). The IPML was subsequently amalgamated in 2004 with Lanka IOC PLC and dissolved.
Goodwill represents future economic benefits arising from other assets which were acquired from the above business combination that were not able to individually identified and separately recognized. Accumulated amortization as at the balance sheet date amounting to ` 342,21,776/- which were amortized up to 2007 based on 20 years useful life. However, as per the revised accounting standards goodwill is tested annually for impairment and carried at cost less accumulated impairment losses.
b) Lanka IOC Ltd owns 1/3rd share of Ceylon Petroleum Storage Terminal Limited (CPSTL), also known as the “Common User Facility” (CUF). The Company paid US$ 45 million to Ceylon Petroleum Corporation on 22 January 2004 to obtain 1/3rd share of CPSTL. Investment is recorded at cost and details are as under :
(` in Crore)
2012-13 2011-12
At the beginning of the year 176.03 177.52
Translation Difference 12.50 (1.49)
Closing Net book amount 188.53 176.03
c) In terms of the agreement entered into with the Board of Investment of Sri Lanka under section 17 of the Board of Investment Law No. 4 of 1978, the Company is exempt from income tax for a period of 10 years commencing from 14.02.2003. Company’s tax exempt period has been expired on 19 February 2013 and accordingly 40 days of the financial year ended 31st March 2013 is liable for income tax at a rate of 15%.
Previous year tax charge wholly consists of tax on non-exempt interest income.
Petronet LNG Ltd.
a) In terms of the provisions contained in the Dahej LNG Port Terminal Concession Agreement, the Company has to develop a Solid Cargo Port along with LNG Terminal. A Joint Venture Company “ Adani Petronet (Dahej) Port Pvt Ltd (APPPL)” has been formed for development of Solid Cargo Port. The Company has acquired 26% equity in APPPL.
b) Customs Duty on import of Project material/equipment has been assessed provisionally (current and previous years) and additional liability, if, any, on this account will be provided on final assessment.

192
NOTE - 37: OTHER DISCLOSURES
1 Purchase of crude oil from Oil India Limited and Panna Mukta Tapti JV and some other oilfields has been accounted for provisionally, pending finalization of agreements with respective parties. Adjustments, if any, will be made on finalization of agreements.
2 Transactions with other Oil Marketing Companies are jointly reconciled on an ongoing basis.
3 In the absence of relevant notification by the Government of India specifying the period and applicable rate at which cess on turnover is payable under section 441A of the Companies Act, 1956, the same is not determinable and hence, not provided for.
4 Previous year’s comparative figures have been regrouped wherever necessary. Figures in brackets indicate deductions.
Sd/- Sd/- Sd/- (R. S. Butola) (P. K. Goyal) (Raju Ranganathan) Chairman Director (Finance) Company Secretary
As per our attached Report of even date
For B.M. CHATRATH & CO. For DASS GUPTA & ASSOCIATES For PARAKH & CO. Chartered Accountants Chartered Accountants Chartered Accountants (Firm Regn. No. 301011E) (Firm Regn. No. 000112N) (Firm Regn. No.001475C)
Sd/- Sd/- Sd/- (CA. P.R. Paul) (CA. Raaja Jindal) (CA. Thalendra Sharma) Partner Partner Partner M. No. 051675 M. No. 504111 M. No. 079236
Place : New Delhi Date : 30th May, 2013

Consolidated Financial Statem
ents 2012-13
193
1. BASIS OF PREPARATION
1.1 The financial statements are prepared under historical cost convention in accordance with the mandatory accounting standards notified by the Companies (Accounting Standards) Rules, 2006 and the provisions of the Companies Act, 1956.
1.2 The preparation of financial statements requires the man-agement to make estimates and assumptions that affect the reported amount of assets, liabilities and disclosure of contingent liabilities as at the date of the financial statements. Management believes that these estimates and assumptions are reasonable and prudent. However, actual results could differ from estimates.
2. FIXED ASSETS
2.1 Tangible Assets
2.1.1 Fixed Assets are stated at acquisition cost less accumulated depreciation / amortization and cumulative impairment.
2.1.2 Land acquired on perpetual lease as well as on lease for over 99 years is treated as free hold land.
2.1.3 Land acquired on lease for 99 years or less is treated as leasehold land.
2.1.4 Technical know-how / license fee relating to plants/facilities are capitalised as part of cost of the underlying asset.
2.2 Construction Period Expenses on Projects
2.2.1 Revenue expenses exclusively attributable to projects incurred during construction period are capitalised. However, such expenses in respect of capital facilities being executed along with the production/operations simultaneously are charged to revenue.
2.2.2 Financing cost incurred during construction period on loans specifically borrowed and utilised for projects is capitalised on quarterly basis up to the date of capitalisation.
2.2.3 Financing cost, if any, incurred on General Borrowings used for projects is capitalised at the weighted average cost. The amount of such borrowings is determined on quarterly basis after setting off the amount of internal accruals.
2.3 Capital Stores
2.3.1 Capital stores are valued at cost. Specific provision is made for likely diminution in value, wherever required.
2.4 Depreciation/Amortisation
2.4.1 Cost of leasehold land for 99 years or less is amortised over the lease period.
2.4.2 Depreciation on fixed assets is provided in accordance with the rates as specified in Schedule XIV to The Companies Act, 1956, on straight line method, upto 95% of the cost of the asset other than Insurance spares which are depreciated upto 100%. Depreciation is charged pro-rata on quarterly basis on assets, from/upto the quarter of capitalisation/ sale, disposal/dismantle or earmarking for disposal/dismantling during the year.
2.4.3 Assets, other than LPG Cylinders and Pressure Regulators, costing upto ` 5,000/- per item are depreciated fully in the year of capitalisation.
SIGNIFICANT ACCOUNTING POLICIES 2.4.4 Expenditure on the items, ownership of which is not with the
Company are charged off to revenue in the year of incurrence of such expenditure.
2.5 Impairment of Assets
As at each balance sheet date, the carrying amount of cash generating units / assets is tested for impairment so as to determine:
(a) the provision for impairment loss, if any, required; or
(b) the reversal, if any, required of impairment loss recognized in previous periods.
Impairment loss is recognized when the carrying amount of an asset exceeds recoverable amount.
3. INTANGIBLE ASSETS
3.1 Technical know-how / license fee relating to production process and process design are recognised as Intangible Assets and amortised on a straight line basis over a period of ten years or life of the underlying plant/ facility, whichever is earlier.
3.2 Expenditure incurred on Research & Development, other than on capital account, is charged to revenue.
3.3 Costs incurred on computer software purchased/devel-oped resulting in future economic benefits, are capitalised as Intangible Asset and amortised over a period of three years beginning from the quarter in which such software is capitalised. However, where such computer software is still in development stage, costs incurred during the development stage of such software are accounted as “Intangible Assets Under Development”.
3.4 Cost of Right of Way for laying pipelines is capitalised and amortised on a straight line basis over the period of such Right of Way or 99 years whichever is less.
4. BORROWING COST
Borrowing costs that are attributable to the acquisition and construction of the qualifying asset are capitalized as part of the cost of such assets. A qualifying asset is one that necessarily takes substantial period of time to get ready for intended use. All other borrowing costs are charged to revenue.
5. FOREIGN CURRENCY TRANSLATION
5.1 Transactions in foreign currency are initially recorded at exchange rates prevailing on the date of transactions.
5.2 Monetary items denominated in foreign currencies (such as cash, receivables, payables etc) outstanding at the end of reporting period, are translated at exchange rates prevailing as at the end of reporting period.
5.3 Non-monetary items denominated in foreign currency, (such as investments, fixed assets etc.) are valued at the exchange rate prevailing on the date of the transaction.
5.4.1 (a) Any gains or losses arising due to differences in exchange rates at the time of translation or settlement are accounted for in the Statement of Profit & Loss either under the head foreign exchange fluctuation or interest cost, as the case may be, except those relating to long-term foreign currency monetary items.
Annexure-I

194
(b) Exchange differences on long-term foreign currency monetary items relating to acquisition of depreciable assets are adjusted to the carrying cost of the assets and depreci-ated over the balance life of the assets in line with para 46A of Accounting Standard -11. In other cases, exchange dif-ferences are accumulated in a “Foreign Currency Monetary Item Translation Difference Account” and amortised over the balance period of such long-term foreign currency monetary item by recognition as income or expense in each of such periods.
5.4.2 Premium/discount arising at the inception of the forward contracts entered into to hedge foreign currency risks are amortised as expense/income over the life of the contract. Outstanding forward contracts as at the reporting date are restated at the exchange rate prevailing on that date.
6. INVESTMENTS
6.1 Long term investments are valued at cost and provision for diminution in value, thereof is made, wherever such diminution is other than temporary.
6.2 Current investments are valued at lower of cost or fair market value.
7. INVENTORIES
7.1 Raw Materials
7.1.1 Raw materials including crude oil are valued at cost determined on weighted average basis or net realizable value, whichever is lower.
7.1.2 Stock in Process is valued at raw material cost plus conver-sion costs as applicable or net realizable value, whichever is lower.
7.1.3 Crude oil in Transit is valued at cost or net realizable value, whichever is lower.
7.2 Finished Products and Stock-in-Trade
7.2.1 Finished products and stock in trade, other than lubricants, are valued at cost determined on ‘First in First Out’ basis or net realizable value, whichever is lower. Cost of Finished Products produced is determined based on raw material cost and processing cost.
7.2.2 Lubricants are valued at cost on weighted average basis or net realizable value, whichever is lower. Cost of lubricants internally produced is determined based on cost of inputs and processing cost.
7.2.3 Imported products in transit are valued at CIF cost or net realisable value whichever is lower.
7.3 Stores and Spares
7.3.1 Stores and Spares (including Barrels & Tins) are valued at weighted average cost. Specific provision is made in respect of identified obsolete stores & spares and chemicals for likely diminution in value. Further, an adhoc provision @ 5% is also made on the balance stores and spares (excluding barrels, tins, stores in transit, chemicals, crude oil and own products) towards likely diminution in the value.
7.3.2 Stores & Spares in transit are valued at cost.
8. TRADE RECEIVABLES
In addition to the specific provision made, an Adhoc provision @ 1%
is also made in respect of Trade Receivables, other than those relating to Oil Marketing companies, Subsidiary & Joint Venture companies, Export Customers, DGS&D group of customers (i.e. DGS&D, Railway, Army, Air Force and Defence) and Retail Outlets enjoying temporary credit to recognize the element of uncertainty.
9. CONTINGENT LIABILITIES AND CAPITAL COMMITMENTS
9.1 Contingent Liabilities
9.1.1 Show Cause Notices issued by various Government Authorities are not considered as Obligation.
9.1.2 When the demand notices are raised against such show cause notices and are disputed by the Company, these are classified as disputed obligations.
9.1.3 The treatment in respect of disputed obligations, in each case above `5 lakh, are as under:
a) a provision is recognized in respect of present obligations where the outflow of resources is probable;
b) all other cases are disclosed as contingent liabilities unless the possibility of outflow of resources is remote.
9.2 Capital Commitments
Estimated amount of contracts remaining to be executed on capital account above ̀ 5 lakhs, in each case, are considered for disclosure.
10. REVENUE RECOGNITION
10.1 Revenue from sale of goods is recognised when sufficient risks and rewards are transferred to customers, which is generally on dispatch of goods.
10.2 Dividend income is recognized when the company’s right to receive dividend is established.
10.3 Claims (including interest on outstandings) are accounted:
a) When there is certainty that the claims are realizable
b) Generally at cost
10.4 Income and expenditure upto Rupees five lakhs in each case pertaining to previous years are accounted for in the current year.
10.5 Pre-paid expenses upto Rupees five lakhs in each case are charged to revenue.
11. EXCISE DUTY
Excise duty is accounted on the basis of both, payments made in respect of goods cleared as also provision made for goods lying in stock. Closing stock value includes excise duty payable / paid on finished goods.
12. TAXES ON INCOME
Provision for current tax is made as per the provisions of the Income Tax Act, 1961. Deferred Tax Liability / Asset resulting from ‘timing dif-ference’ between book and taxable profit is accounted for considering the tax rate and laws that have been enacted or substantively enacted as on the Balance Sheet date. Deferred Tax Asset is recognized and carried forward only to the extent that there is virtual certainty that the asset will be realized in future.
13. EMPLOYEES BENEFITS
13.1 ShortTermBenefits:
Short Term Employee Benefits are accounted for in the period during which the services have been rendered.

Consolidated Financial Statem
ents 2012-13
195
13.2 Post-EmploymentBenefitsandOtherLongTermEmployeeBenefits:
a) The Company’s contribution to the Provident Fund is remitted to separate trusts established for this purpose based on a fixed percentage of the eligible employee’s salary and charged to Statement of Profit and Loss. Shortfall, if any, in the fund assets, based on the Government specified minimum rate of return, will be made good by the Company and charged to Statement of Profit and Loss.
b) The Company operates defined benefit plans for Gratuity and Post Retirement Medical Benefits. The cost of providing such defined benefits is determined using the projected unit credit method of actuarial valuation made at the end of the year and are administered through respective Trusts. Actuarial gains/losses are charged to Statement of Profit and Loss.
c) Obligations on Compensated Absences, Resettlement and Long Service Awards are provided using the projected unit credit method of actuarial valuation made at the end of the year.
d) The Company operates a defined contribution scheme for Pension benefits for its employees and the contribution is remitted to a separate Trust.
13.3 TerminationBenefits:
Payments made under Voluntary Retirement Scheme are charged to Statement of Profit and Loss.
14. GRANTS
14.1 Capital Grants
In case of depreciable assets, the cost of the asset is shown at gross value and grant thereon is treated as Capital Grants which are recognised as income in the Statement of Profit and Loss over the period and in the proportion in which depreciation is charged.
14.2 Revenue Grants
Revenue grants are reckoned as per the respective schemes notified by Government from time to time, subject to final adjustments as per separate audit wherever applicable.
15. OIL & GAS EXPLORATION ACTIVITIES
15.1 The Company is following the “Successful Efforts Method” of accounting for Oil & Gas exploration and production activities as explained below:
a) Survey costs are expensed in the year of incurrence.
b) Acquisition cost, cost of incomplete / undecided exploratory wells and development costs are carried as capital work in progress till the time these are either transferred to producing properties on completion or expensed in the year when determined to be dry, as the case may be.
c) Expenditure towards unfinished Minimum Work Programme with and without extension of time is expensed in the year of incurrence.
15.2 Company’s share of proved reserves of oil and gas are disclosed when notified by the Operator of the relevant block.
15.3 The Company’s proportionate share in the assets, liabilities, income and expenditure of joint venture operations are accounted as per the participating interest in such joint venture operations.
16. COMMODITY HEDGING
The realised gain or loss in respect of commodity hedging contracts, the pricing period of which has expired during the year, are recognised in the Statement of Profit & Loss. However, in respect of contracts, the pricing period of which extends beyond the balance sheet date, suitable provision for likely loss, if any, is made.


