
Condensed Consolidated Interim Statements of Financial PositionStated in thousand of dollars(Unaudited)As at September 30, December 31,
2014 2013AssetsCurrent Assets
Accounts receivable $ 65,558 $ 36,036Fair value of financial contracts (note 6) 763 —Prepaid expenses and deposits 5,627 3,258
71,948 39,294
Exploration and evaluation assets (note 4) 27,171 25,149Petroleum and natural gas properties (note 5) 1,964,749 1,312,282
$ 2,063,868 $ 1,376,725
LiabilitiesCurrent liabilities
Accounts payable and accrued liabilities $ 110,209 $ 57,808Dividends payable 10,886 7,216Fair value of financial contracts (note 6) 3,841 12,604Current portion of other long term obligations 3,046 1,915
127,982 79,543
Fair value of financial contracts (note 6) 2,478 982Bank debt (note 7) 453,094 279,619Decommissioning obligations (note 8) 195,561 85,172Other long term obligations 3,444 4,303Deferred income taxes 79,556 72,912
Shareholders' equityShare capital 1,236,957 884,676Contributed surplus 30,543 27,123Warrants 5,907 7,284Deficit (71,654) (64,889)
1,201,753 854,194
Commitments (note 11)$ 2,063,868 $ 1,376,725
The accompanying notes are an integral part of these condensed consolidated interim financial statements.
2014 Third Quarter Condensed Consolidated Interim Financial Statements
1

Condensed Consolidated Interim Statements of Income (Loss) and Comprehensive Income (Loss)Stated in thousands of dollars, except per share amounts(Unaudited)
Three Months Ended September 30,
Nine Months Ended September 30,
2014 2013 2014 2013
RevenuesPetroleum and natural gas $ 143,709 $ 86,828 $ 379,424 $ 198,414Royalties (25,458) (16,070) (65,980) (36,262)Realized loss on financial contracts (4,621) (4,775) (19,705) (6,984)Unrealized gain (loss) on financial contracts (note 6) 18,896 (190) 8,030 (7,946)
132,526 65,793 301,769 147,222Expenses
Operating 29,950 14,292 72,803 35,417Transportation 3,409 2,220 8,563 6,270General and administrative 3,713 2,829 9,688 9,763Legal settlement — — — 3,550Bad debt provision — — — 317Transaction costs (note 3) 454 4,751 7,048 4,890Stock-based compensation (note 9) 2,175 2,454 7,318 7,645Depletion and depreciation (note 5) 44,573 23,104 116,077 53,842Impairment — — — 24,000Finance expense 6,708 2,687 15,621 7,932Gain on disposal of petroleum and natural gasproperties and farm-outs (note 5) (8,629) — (9,468) (1,531)
Gain on investment (note 10) — — (23,622) —
82,353 52,337 204,028 152,095Income (loss) before income taxes 50,173 13,456 97,741 (4,873)
Current tax expense on disposal — — — 1,439Deferred income tax expense 15,518 4,137 21,737 727Total tax expense 15,518 4,137 21,737 2,166Net income (loss) for the period $ 34,655 $ 9,319 $ 76,004 $ (7,039)
Other comprehensive income:Currency translation adjustment — — — 1,359Gain on investment (note 10) — — 20,669 (1,316)
Transfer of gain on investment to earnings — — (20,669) —
Other comprehensive income for the period — — — 43Total comprehensive income (loss) for the period $ 34,655 $ 9,319 $ 76,004 $ (6,996)
Income (loss) per share (note 9)Basic $ 0.16 $ 0.08 $ 0.39 $ (0.08)Diluted $ 0.16 $ 0.08 $ 0.39 $ (0.08)
The accompanying notes are an integral part of these condensed consolidated interim financial statements.
2014 Third Quarter Condensed Consolidated Interim Financial Statements
2

Condensed Consolidated Interim Statements of Changes in Shareholders' EquityStated in thousands of dollars, except share amounts
(Unaudited)
Number ofcommon
sharesSharecapital
Contributedsurplus
Performancewarrants
Accumulatedother
comprehensiveincome (loss) Deficit Total equity
Balance at December 31, 2012 71,217,345 $ 351,957 $ 20,495 $ 7,059 $ (43) $ (28,469) $ 350,999
Net loss for the period — — — — — (7,039) (7,039)
Other comprehensive income — — — — 1,359 — 1,359
Transfer of cumulativetranslation adjustment toearnings — — — — (1,316) — (1,316)
Stock-based compensation — — 6,209 — — — 6,209
Transfer on exercise of options& warrants — 1,574 (609) (965) — — —
Issued pursuant to privateplacement 700,280 2,500 — 3,522 — — 6,022
Share issue costs, net of tax of$3.75 million — (9,750) — — — — (9,750)
Options exercised 166,476 640 — — — — 640
Warrants exercised 279,549 1,445 — — — — 1,445
Issued pursuant to short formprospectus 49,500,000 247,500 — — — — 247,500
Dividends — — — — — (8,517) (8,517)
Balance at September 30, 2013 121,863,650 $ 595,866 $ 26,095 $ 9,616 $ — $ (44,025) $ 587,552
Balance at December 31, 2013 166,543,309 $ 884,676 $ 27,123 $ 7,284 $ — $ (64,889) $ 854,194
Net income for the period — — — — — 76,004 76,004
Other comprehensive income — — — — 20,669 20,669
Issued pursuant to acquisition 37,975,332 271,904 — — — — 271,904
Transfer of gain on investmentto earnings — — — — (20,669) (20,669)
Stock-based compensation — — 3,450 — — — 3,450
Transfer on exercise of options& warrants — 1,407 (30) (1,377) — — —
Warrants exercised 399,116 2,071 — — — — 2,071
Options exercised 16,666 46 — — — — 46
Issued pursuant to short formprospectus 12,778,800 80,506 — — — — 80,506
Share issue costs, net of tax of$1.2 million — (3,653) — — — — (3,653)
Dividends — — — — — (82,769) (82,769)
Balance at September 30,2014 217,713,223 $1,236,957 $ 30,543 $ 5,907 $ — $ (71,654) $ 1,201,753
The accompanying notes are an integral part of these condensed consolidated interim financial statements.
2014 Third Quarter Condensed Consolidated Interim Financial Statements
3
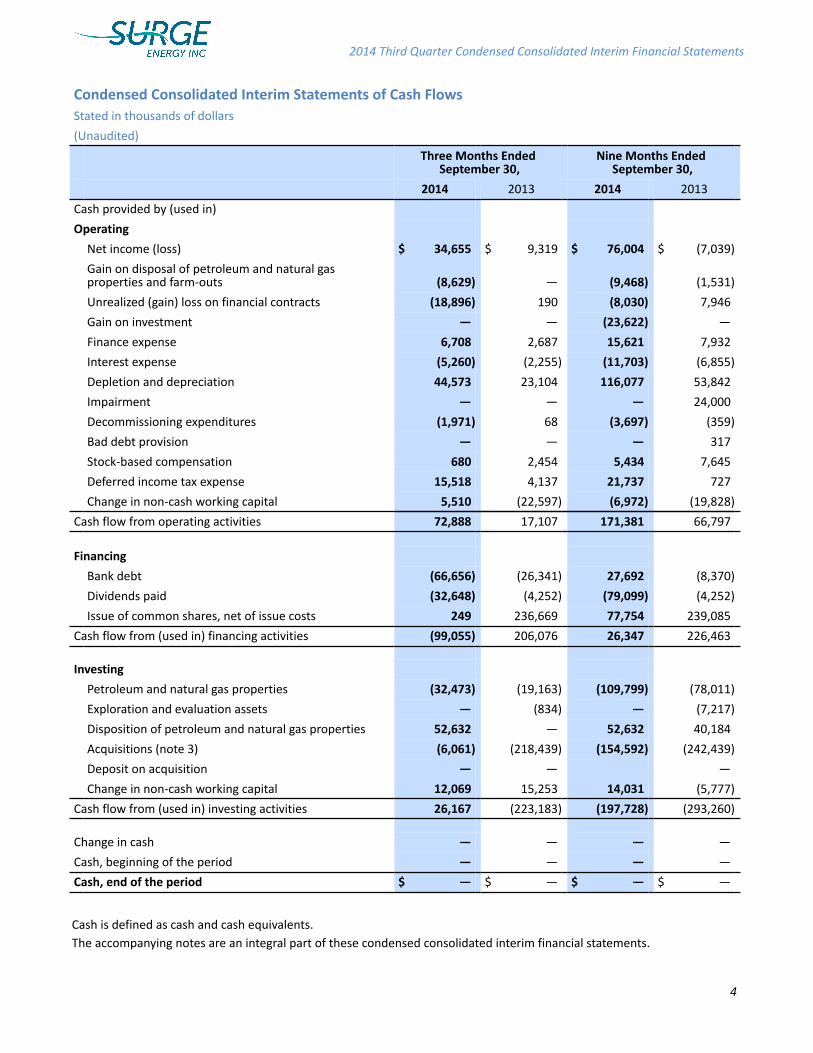
Condensed Consolidated Interim Statements of Cash FlowsStated in thousands of dollars
(Unaudited)
Three Months Ended September 30,
Nine Months Ended September 30,
2014 2013 2014 2013
Cash provided by (used in)
Operating
Net income (loss) $ 34,655 $ 9,319 $ 76,004 $ (7,039)
Gain on disposal of petroleum and natural gasproperties and farm-outs (8,629) — (9,468) (1,531)
Unrealized (gain) loss on financial contracts (18,896) 190 (8,030) 7,946
Gain on investment — — (23,622) —
Finance expense 6,708 2,687 15,621 7,932
Interest expense (5,260) (2,255) (11,703) (6,855)
Depletion and depreciation 44,573 23,104 116,077 53,842
Impairment — — — 24,000
Decommissioning expenditures (1,971) 68 (3,697) (359)
Bad debt provision — — — 317
Stock-based compensation 680 2,454 5,434 7,645
Deferred income tax expense 15,518 4,137 21,737 727
Change in non-cash working capital 5,510 (22,597) (6,972) (19,828)
Cash flow from operating activities 72,888 17,107 171,381 66,797
Financing
Bank debt (66,656) (26,341) 27,692 (8,370)
Dividends paid (32,648) (4,252) (79,099) (4,252)
Issue of common shares, net of issue costs 249 236,669 77,754 239,085
Cash flow from (used in) financing activities (99,055) 206,076 26,347 226,463
Investing
Petroleum and natural gas properties (32,473) (19,163) (109,799) (78,011)
Exploration and evaluation assets — (834) — (7,217)
Disposition of petroleum and natural gas properties 52,632 — 52,632 40,184
Acquisitions (note 3) (6,061) (218,439) (154,592) (242,439)
Deposit on acquisition — — —
Change in non-cash working capital 12,069 15,253 14,031 (5,777)
Cash flow from (used in) investing activities 26,167 (223,183) (197,728) (293,260)
Change in cash — — — —
Cash, beginning of the period — — — —
Cash, end of the period $ — $ — $ — $ —
Cash is defined as cash and cash equivalents. The accompanying notes are an integral part of these condensed consolidated interim financial statements.
2014 Third Quarter Condensed Consolidated Interim Financial Statements
4

NOTES TO CONDENSED CONSOLIDATED INTERIM FINANCIAL STATEMENTS
Tabular amounts are in thousands of dollars, except share and per share data
2014 Third Quarter Condensed Consolidated Interim Financial Statements
Notes to the Consolidated Financial Statements 5
1. REPORTING ENTITY
Surge Energy Inc.’s (the “Corporation” or “Surge”) business consists of the exploration, development and production of oil andgas from properties in western Canada. The Corporation transitioned in the third quarter of 2013 to a dividend paying entity.The condensed consolidated interim financial statements include the accounts of the Corporation, its wholly-owned subsidiariesand partnerships.
2. BASIS OF PREPARATION
Statement of compliance
These condensed consolidated interim financial statements have been prepared in accordance with International AccountingStandard 34, “Interim Financial Reporting” and using the accounting policies outlined by the Corporation in its annualconsolidated financial statements for the year ended December 31, 2013, except as identified below. These condensedconsolidated interim financial statements do not include all of the information required for full annual financial statements.
On January 1, 2014, the Corporation adopted IFRIC 21 which provides guidance with respect to recognition of liabilities resultingfrom government levies. The Company also adopted IAS 32 that clarifies the the requirements for offsetting financial assetsand liabilities. The adoption of these standards had no impact on the amounts recorded in the consolidated financial statementsas at September 30, 2014 or on the comparative periods.
The condensed consolidated interim financial statements were authorized for issuance by the Board of Directors onNovember 5, 2014.
3. ACQUISITIONS
(a) Longview Oil Corp.
Effective June 5, 2014, the Corporation acquired all of the issued and outstanding common shares of Longview Oil Corp.("Longview") in exchange for 37,975,332 common shares of Surge with an assigned value of $271.9 million. The common shareshave been ascribed a fair value of $7.16 per common share issued, as determined based on the Corporation's closing shareprice at the date of closing, being June 5, 2014. In addition, the Corporation, in the first quarter of 2014, had acquired 9.3million (19.8 percent) Longview common shares, paying cash of $41.4 million. These common shares were revalued on thedate of closing to $65.0 million, based on Longview's closing share price at the date of closing, being June 5, 2014 of $6.99 percommon share, reflecting a $23.6 million gain on the initial investment that has been recognized in income. The Longviewacquisition fit within Surge's dividend-paying growth business model and defined operating strategy of investing capital toacquire high quality, operated, light and medium gravity crude oil reservoirs. The operations from the acquisition have beenincluded in the results of Surge commencing June 5, 2014.
Surge incurred transaction costs of $6.6 million on the acquisition which were expensed through the statement of income.
The transaction was accounted for by the purchase method. This is a preliminary purchase equation and is subject to change.
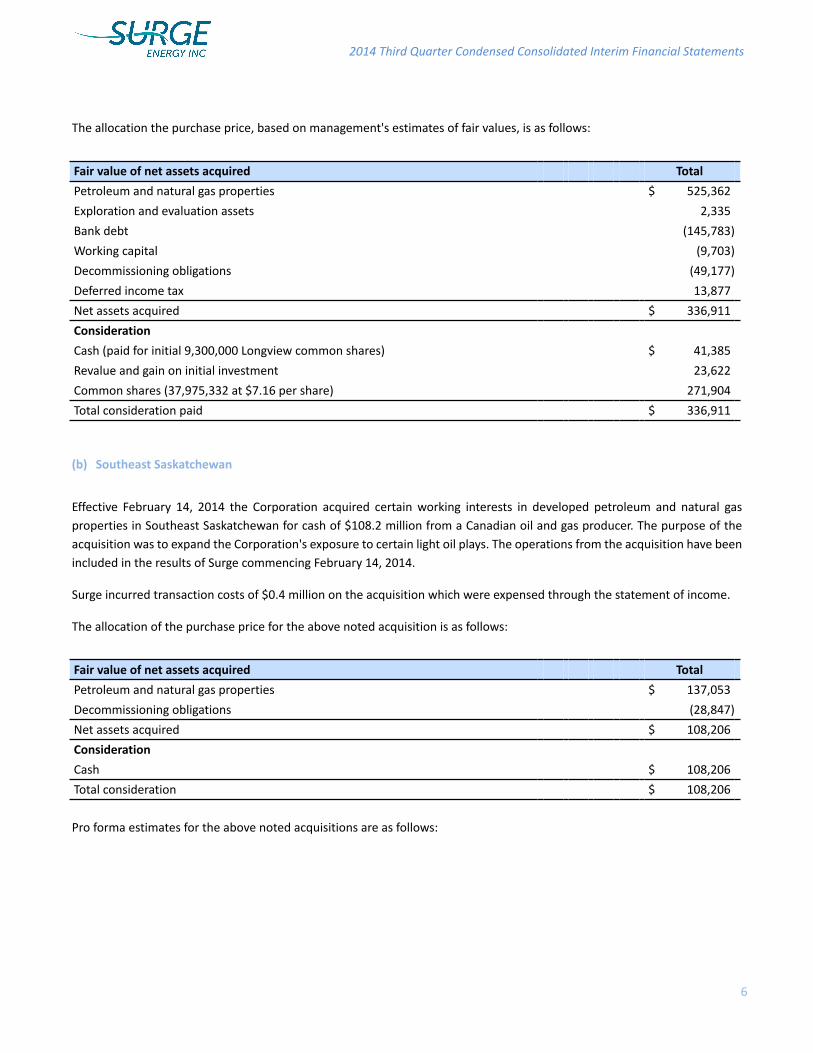
The allocation the purchase price, based on management's estimates of fair values, is as follows:
Fair value of net assets acquired Total
Petroleum and natural gas properties $ 525,362
Exploration and evaluation assets 2,335
Bank debt (145,783)
Working capital (9,703)
Decommissioning obligations (49,177)
Deferred income tax 13,877
Net assets acquired $ 336,911
Consideration
Cash (paid for initial 9,300,000 Longview common shares) $ 41,385
Revalue and gain on initial investment 23,622
Common shares (37,975,332 at $7.16 per share) 271,904
Total consideration paid $ 336,911
(b) Southeast Saskatchewan
Effective February 14, 2014 the Corporation acquired certain working interests in developed petroleum and natural gasproperties in Southeast Saskatchewan for cash of $108.2 million from a Canadian oil and gas producer. The purpose of theacquisition was to expand the Corporation's exposure to certain light oil plays. The operations from the acquisition have beenincluded in the results of Surge commencing February 14, 2014.
Surge incurred transaction costs of $0.4 million on the acquisition which were expensed through the statement of income.
The allocation of the purchase price for the above noted acquisition is as follows:
Fair value of net assets acquired Total
Petroleum and natural gas properties $ 137,053
Decommissioning obligations (28,847)
Net assets acquired $ 108,206
Consideration
Cash $ 108,206
Total consideration $ 108,206
Pro forma estimates for the above noted acquisitions are as follows:
2014 Third Quarter Condensed Consolidated Interim Financial Statements
6

For the period ended September 30, 2014 As stated
SoutheastSaskatchewan
prior toFebruary 14,
2014
Longview OilCorp. prior toJune 5, 2014 Pro Forma
Revenue $ 379,424 5,363 70,744 $ 455,531
Income $ 76,004 1,303 16,302 $ 93,609
Amounts since acquisitionSoutheast
SaskatchewanLongview Oil
Corp.
Revenue $ 20,625 $ 43,848
Income $ 6,658 $ 4,326
The fair value of petroleum and natural gas properties recognized on an acquisition is based on market values. The marketvalue of petroleum and natural gas properties is the estimated amount for which petroleum and natural gas properties couldbe exchanged on the acquisition date between a willing buyer and a willing seller in an arm’s length transaction after propermarketing wherein the parties had each acted knowledgeably, prudently and without compulsion. The market value of oil andnatural gas interests is estimated with reference to the discounted cash flows expected to be derived from oil and natural gasproduction based on externally prepared reserve reports which apply forward looking price decks as at the date of acquisition.Undeveloped land is valued using recent, third-party landsale prices in corresponding areas.
The market value of other items of petroleum and natural gas properties is based on the quoted market prices for similar items.
The above amounts are estimates, which were made by management at the time of the preparation of the financial statements,based on the information available. Amendments may be made to these amounts as values subject to estimates.
2014 Third Quarter Condensed Consolidated Interim Financial Statements
7
4. EXPLORATION AND EVALUATION ASSETS
Exploration and evaluation (E&E) assets consist of the Corporation’s exploration projects which are pending the determinationof proven or probable reserves. Additions represent the Corporation’s share of costs incurred on E&E assets during the period.
Exploration & Evaluation AssetsTotal
Balance at December 31, 2012 $ 70,726Additions 8,051Disposals (11,831)Change in foreign exchange rate 391Transfer to petroleum and natural gas properties (42,188)
Balance at December 31, 2013 $ 25,149Acquisitions 2,335Transfer to petroleum and natural gas properties (313)
Balance at September 30, 2014 $ 27,171

5. PETROLEUM AND NATURAL GAS PROPERTIES
Petroleum and Natural Gas Properties Total
Balance at December 31, 2012 $ 803,883Acquisitions 729,719Additions 117,495Transfer from exploration and evaluation assets 42,188Change in decommissioning obligations 6,357Capitalized stock-based compensation 3,810Change in foreign exchange rate 968Dispositions (35,524)
Balance at December 31, 2013 $ 1,668,896Acquisitions 667,416Dispositions (51,502)Additions - including non-monetary exchange value of $2.4 million 112,244Transfer from exploration and evaluation assets 313Change in decommissioning obligations 35,031Capitalized stock-based compensation 1,764
Balance at September 30, 2014 $ 2,434,162
TotalAccumulated depletion and depreciationBalance at December 31, 2012 $ (228,400)Depletion and depreciation expense (82,410)Impairment (51,189)Dispositions 5,385Balance at December 31, 2013 $ (356,614)Depletion and depreciation expense (116,077)Dispositions 3,278Balance at September 30, 2014 $ (469,413)
TotalCarrying amountsAt December 31, 2013 $ 1,312,282At September 30, 2014 $ 1,964,749
The calculation of depletion and depreciation expense for the period ended September 30, 2014 included an estimated $685.3million (December 31, 2013 - $453.6 million) for future development costs associated with proved plus probable reserves anddeducted $151.8 million (December 31, 2013 - $86.4 million) for the estimated salvage value of production equipment andfacilities.
During the nine months ended September 30, 2014 the Company completed a farm-out agreement. In this non-monetaryexchange the Company received a well value of $3.5 million less a value of $1.1 million that was given up resulting in a gain onthe farm-out of $2.4 million that has been included in petroleum and natural gas properties.
During the nine months ended September 30, 2014 the Company disposed of non-core assets and facilities in SouthwestSaskatchewan and Alberta for cash proceeds of $52.6 million. The assets had a carrying value of $48.2 million at the time ofdisposition and an associated decommissioning liability of $2.6 million, resulting in a gain on disposal of $7.0 million.
2014 Third Quarter Condensed Consolidated Interim Financial Statements
Notes to the Consolidated Financial Statements 8
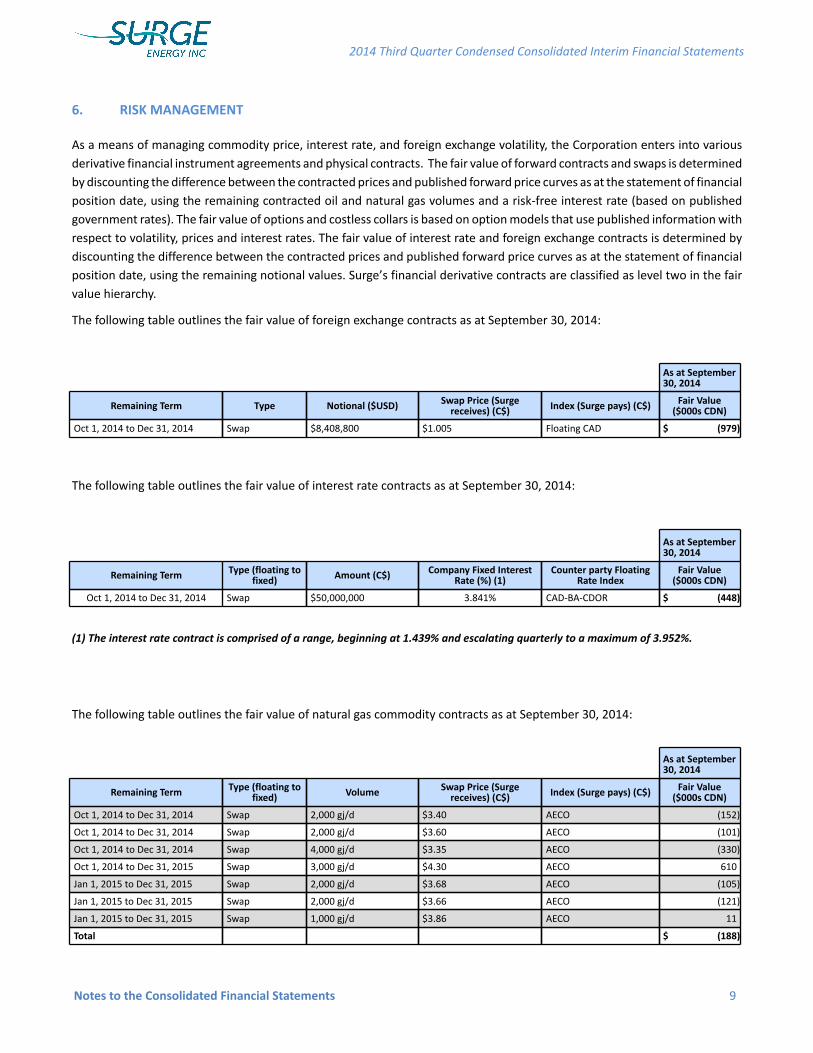
6. RISK MANAGEMENT
As a means of managing commodity price, interest rate, and foreign exchange volatility, the Corporation enters into variousderivative financial instrument agreements and physical contracts. The fair value of forward contracts and swaps is determinedby discounting the difference between the contracted prices and published forward price curves as at the statement of financialposition date, using the remaining contracted oil and natural gas volumes and a risk-free interest rate (based on publishedgovernment rates). The fair value of options and costless collars is based on option models that use published information withrespect to volatility, prices and interest rates. The fair value of interest rate and foreign exchange contracts is determined bydiscounting the difference between the contracted prices and published forward price curves as at the statement of financialposition date, using the remaining notional values. Surge’s financial derivative contracts are classified as level two in the fairvalue hierarchy.
The following table outlines the fair value of foreign exchange contracts as at September 30, 2014:
As at September30, 2014
Remaining Term Type Notional ($USD) Swap Price (Surgereceives) (C$) Index (Surge pays) (C$) Fair Value
($000s CDN)
Oct 1, 2014 to Dec 31, 2014 Swap $8,408,800 $1.005 Floating CAD $ (979)
The following table outlines the fair value of interest rate contracts as at September 30, 2014:
As at September30, 2014
Remaining Term Type (floating tofixed) Amount (C$) Company Fixed Interest
Rate (%) (1)Counter party Floating
Rate IndexFair Value
($000s CDN)
Oct 1, 2014 to Dec 31, 2014 Swap $50,000,000 3.841% CAD-BA-CDOR $ (448)
(1) The interest rate contract is comprised of a range, beginning at 1.439% and escalating quarterly to a maximum of 3.952%.
The following table outlines the fair value of natural gas commodity contracts as at September 30, 2014:
As at September30, 2014
Remaining Term Type (floating tofixed) Volume Swap Price (Surge
receives) (C$) Index (Surge pays) (C$) Fair Value($000s CDN)
Oct 1, 2014 to Dec 31, 2014 Swap 2,000 gj/d $3.40 AECO (152)
Oct 1, 2014 to Dec 31, 2014 Swap 2,000 gj/d $3.60 AECO (101)
Oct 1, 2014 to Dec 31, 2014 Swap 4,000 gj/d $3.35 AECO (330)
Oct 1, 2014 to Dec 31, 2015 Swap 3,000 gj/d $4.30 AECO 610
Jan 1, 2015 to Dec 31, 2015 Swap 2,000 gj/d $3.68 AECO (105)
Jan 1, 2015 to Dec 31, 2015 Swap 2,000 gj/d $3.66 AECO (121)
Jan 1, 2015 to Dec 31, 2015 Swap 1,000 gj/d $3.86 AECO 11
Total $ (188)
2014 Third Quarter Condensed Consolidated Interim Financial Statements
Notes to the Consolidated Financial Statements 9
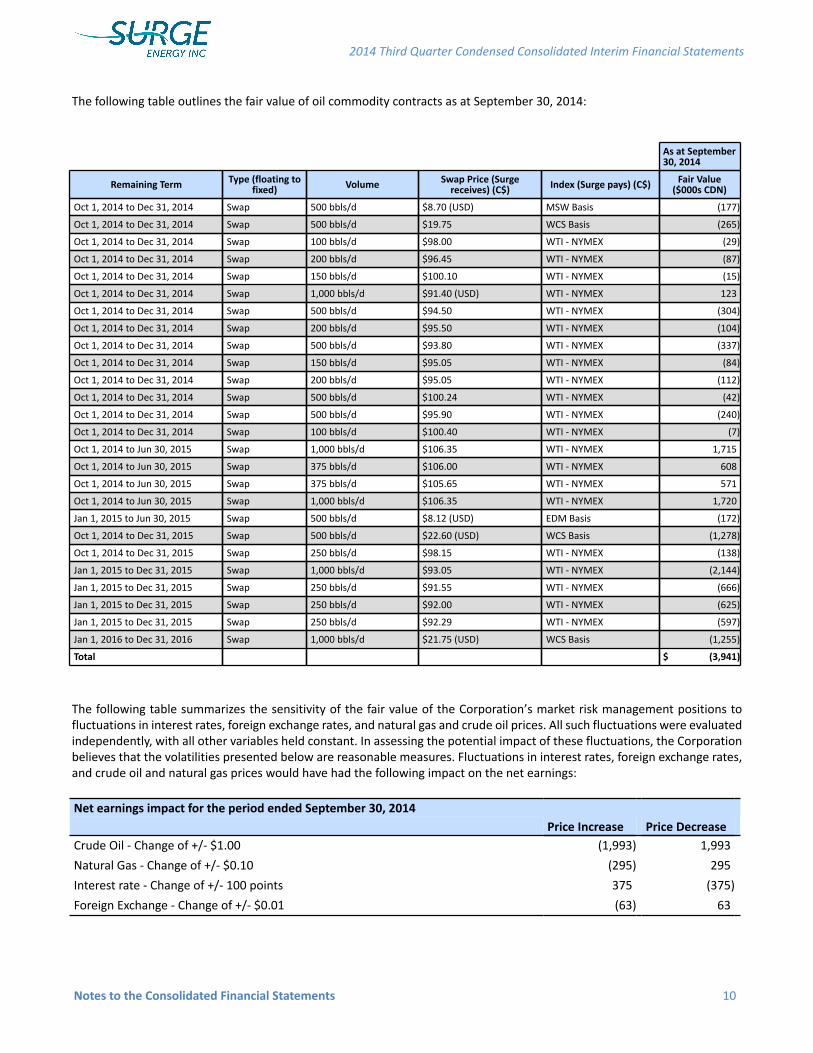
The following table outlines the fair value of oil commodity contracts as at September 30, 2014:
As at September30, 2014
Remaining Term Type (floating tofixed) Volume Swap Price (Surge
receives) (C$) Index (Surge pays) (C$) Fair Value($000s CDN)
Oct 1, 2014 to Dec 31, 2014 Swap 500 bbls/d $8.70 (USD) MSW Basis (177)
Oct 1, 2014 to Dec 31, 2014 Swap 500 bbls/d $19.75 WCS Basis (265)
Oct 1, 2014 to Dec 31, 2014 Swap 100 bbls/d $98.00 WTI - NYMEX (29)
Oct 1, 2014 to Dec 31, 2014 Swap 200 bbls/d $96.45 WTI - NYMEX (87)
Oct 1, 2014 to Dec 31, 2014 Swap 150 bbls/d $100.10 WTI - NYMEX (15)
Oct 1, 2014 to Dec 31, 2014 Swap 1,000 bbls/d $91.40 (USD) WTI - NYMEX 123
Oct 1, 2014 to Dec 31, 2014 Swap 500 bbls/d $94.50 WTI - NYMEX (304)
Oct 1, 2014 to Dec 31, 2014 Swap 200 bbls/d $95.50 WTI - NYMEX (104)
Oct 1, 2014 to Dec 31, 2014 Swap 500 bbls/d $93.80 WTI - NYMEX (337)
Oct 1, 2014 to Dec 31, 2014 Swap 150 bbls/d $95.05 WTI - NYMEX (84)
Oct 1, 2014 to Dec 31, 2014 Swap 200 bbls/d $95.05 WTI - NYMEX (112)
Oct 1, 2014 to Dec 31, 2014 Swap 500 bbls/d $100.24 WTI - NYMEX (42)
Oct 1, 2014 to Dec 31, 2014 Swap 500 bbls/d $95.90 WTI - NYMEX (240)
Oct 1, 2014 to Dec 31, 2014 Swap 100 bbls/d $100.40 WTI - NYMEX (7)
Oct 1, 2014 to Jun 30, 2015 Swap 1,000 bbls/d $106.35 WTI - NYMEX 1,715
Oct 1, 2014 to Jun 30, 2015 Swap 375 bbls/d $106.00 WTI - NYMEX 608
Oct 1, 2014 to Jun 30, 2015 Swap 375 bbls/d $105.65 WTI - NYMEX 571
Oct 1, 2014 to Jun 30, 2015 Swap 1,000 bbls/d $106.35 WTI - NYMEX 1,720
Jan 1, 2015 to Jun 30, 2015 Swap 500 bbls/d $8.12 (USD) EDM Basis (172)
Oct 1, 2014 to Dec 31, 2015 Swap 500 bbls/d $22.60 (USD) WCS Basis (1,278)
Oct 1, 2014 to Dec 31, 2015 Swap 250 bbls/d $98.15 WTI - NYMEX (138)
Jan 1, 2015 to Dec 31, 2015 Swap 1,000 bbls/d $93.05 WTI - NYMEX (2,144)
Jan 1, 2015 to Dec 31, 2015 Swap 250 bbls/d $91.55 WTI - NYMEX (666)
Jan 1, 2015 to Dec 31, 2015 Swap 250 bbls/d $92.00 WTI - NYMEX (625)
Jan 1, 2015 to Dec 31, 2015 Swap 250 bbls/d $92.29 WTI - NYMEX (597)
Jan 1, 2016 to Dec 31, 2016 Swap 1,000 bbls/d $21.75 (USD) WCS Basis (1,255)
Total $ (3,941)
The following table summarizes the sensitivity of the fair value of the Corporation’s market risk management positions tofluctuations in interest rates, foreign exchange rates, and natural gas and crude oil prices. All such fluctuations were evaluatedindependently, with all other variables held constant. In assessing the potential impact of these fluctuations, the Corporationbelieves that the volatilities presented below are reasonable measures. Fluctuations in interest rates, foreign exchange rates,and crude oil and natural gas prices would have had the following impact on the net earnings:
Net earnings impact for the period ended September 30, 2014Price Increase Price Decrease
Crude Oil - Change of +/- $1.00 (1,993) 1,993
Natural Gas - Change of +/- $0.10 (295) 295
Interest rate - Change of +/- 100 points 375 (375)
Foreign Exchange - Change of +/- $0.01 (63) 63
2014 Third Quarter Condensed Consolidated Interim Financial Statements
Notes to the Consolidated Financial Statements 10
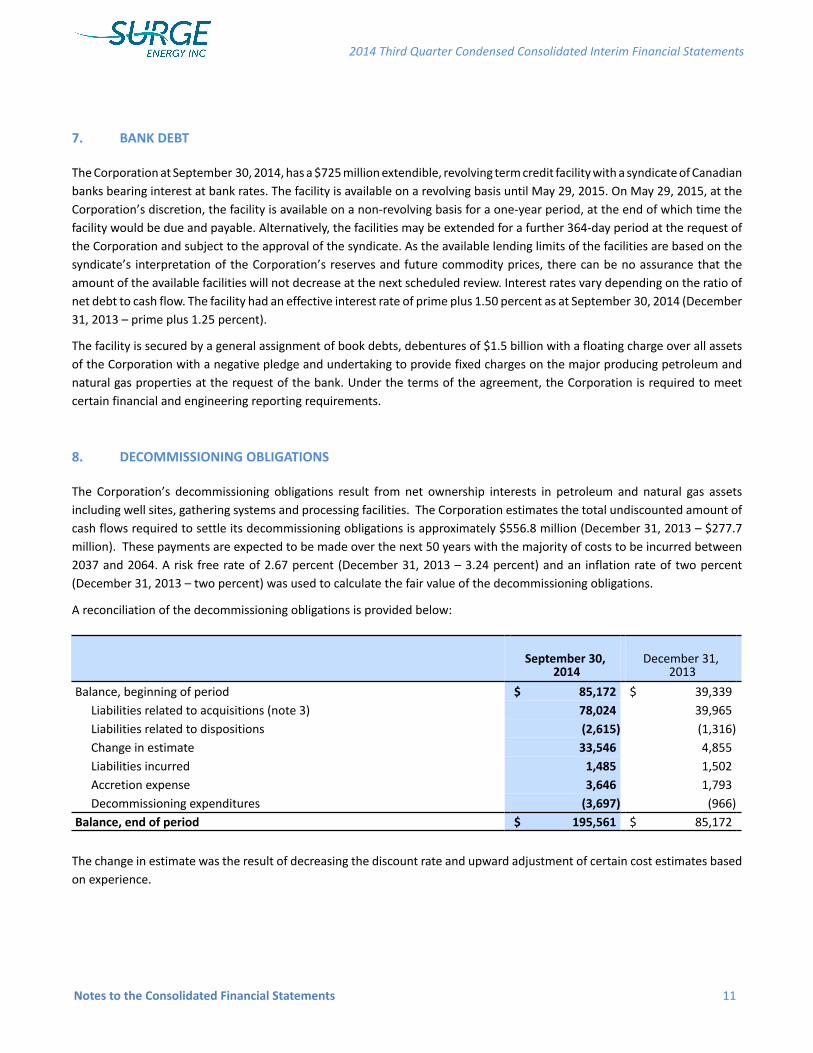
7. BANK DEBT
The Corporation at September 30, 2014, has a $725 million extendible, revolving term credit facility with a syndicate of Canadianbanks bearing interest at bank rates. The facility is available on a revolving basis until May 29, 2015. On May 29, 2015, at theCorporation’s discretion, the facility is available on a non-revolving basis for a one-year period, at the end of which time thefacility would be due and payable. Alternatively, the facilities may be extended for a further 364-day period at the request ofthe Corporation and subject to the approval of the syndicate. As the available lending limits of the facilities are based on thesyndicate’s interpretation of the Corporation’s reserves and future commodity prices, there can be no assurance that theamount of the available facilities will not decrease at the next scheduled review. Interest rates vary depending on the ratio ofnet debt to cash flow. The facility had an effective interest rate of prime plus 1.50 percent as at September 30, 2014 (December31, 2013 – prime plus 1.25 percent).
The facility is secured by a general assignment of book debts, debentures of $1.5 billion with a floating charge over all assetsof the Corporation with a negative pledge and undertaking to provide fixed charges on the major producing petroleum andnatural gas properties at the request of the bank. Under the terms of the agreement, the Corporation is required to meetcertain financial and engineering reporting requirements.
2014 Third Quarter Condensed Consolidated Interim Financial Statements
Notes to the Consolidated Financial Statements 11
8. DECOMMISSIONING OBLIGATIONS
The Corporation’s decommissioning obligations result from net ownership interests in petroleum and natural gas assetsincluding well sites, gathering systems and processing facilities. The Corporation estimates the total undiscounted amount ofcash flows required to settle its decommissioning obligations is approximately $556.8 million (December 31, 2013 – $277.7million). These payments are expected to be made over the next 50 years with the majority of costs to be incurred between2037 and 2064. A risk free rate of 2.67 percent (December 31, 2013 – 3.24 percent) and an inflation rate of two percent(December 31, 2013 – two percent) was used to calculate the fair value of the decommissioning obligations.
A reconciliation of the decommissioning obligations is provided below:
September 30, 2014
December 31, 2013
Balance, beginning of period $ 85,172 $ 39,339Liabilities related to acquisitions (note 3) 78,024 39,965Liabilities related to dispositions (2,615) (1,316)Change in estimate 33,546 4,855Liabilities incurred 1,485 1,502Accretion expense 3,646 1,793Decommissioning expenditures (3,697) (966)
Balance, end of period $ 195,561 $ 85,172
The change in estimate was the result of decreasing the discount rate and upward adjustment of certain cost estimates basedon experience.

9. SHARE CAPITAL
(a) Authorized
Unlimited number of voting common shares.
Unlimited number of preferred shares, issuable in series.
(b) Short Form Prospectus
In February 2014, the Corporation completed a short form prospectus for 12.8 million common shares for gross proceeds of$80.5 million.
(c) Stock Options
The Company has granted options to certain officers, directors, employees and consultants under the Corporation’s stockoption plan. The exercise price of each option equals the market price of the Corporation’s common shares at the date of grant.Options granted have a term of five years to maturity and vest as to one-third on each of the first, second and third anniversariesfrom the date of grant.
September 30, 2014
December 31, 2013
Number ofOptions
Weightedaverage
exercise priceNumber of
Options
Weightedaverage
exercise priceStock options outstanding, beginning of period 249,199 $ 6.49 6,580,701 $ 7.53Granted — $ — 74,500 $ 4.05Exercised (16,666) $ 2.74 (251,667) $ 5.19Forfeited — $ — (1,529,608) $ 8.00Cancelled — $ — (4,624,727) $ 7.50Stock options outstanding, end of period 232,533 $ 6.76 249,199 $ 6.49Exercisable at period-end 189,367 $ 7.35 159,632 $ 7.03
The following table summarizes stock options outstanding and exercisable at September 30, 2014:
Options Outstanding Options Exercisable
Range of exercise pricesNumber
outstanding
Weightedaverage
exercise price
Weightedaverage
contractuallife (years)
Numberexercisable
Weightedaverage
exercise price
$3 to $4.99 42,500 $3.44 3.56 7,500 $3.48$5 to $6.99 103,333 $6.40 0.60 103,333 $6.40$7 to $8.99 24,500 $7.34 2.86 16,334 $7.34$9 to $11.15 62,200 $9.39 1.74 62,200 $9.39$3 to $11.15 232,533 $6.76 1.69 189,367 $7.35
2014 Third Quarter Condensed Consolidated Interim Financial Statements
Notes to the Consolidated Financial Statements 12
(d) Warrants
The Corporation has 692,718 performance warrants outstanding (December 31, 2013 – 1,091,833) that expire on April 13,2015. As at September 30, 2014, all 692,718 outstanding performance warrants were vested and exercisable at a price of $5.17.During the period ended September 30, 2014 399,116 performance warrants were exercised (December 31, 2013 - 955,439).
The Corporation has 1,400,560 warrants exercisable at a price of $4.46. The warrants become exercisable based on certaintime based and performance based conditions. Specifically with respect to time they are exercisable up to one third on eachanniversary from the date of the grant, and with respect to performance up to one half when the market price of the Corporationreaches $6.30 and the other half when it reaches $8.40. The warrants expire in June 2018. As at September 30, 2014, 466,853warrants were vested and exercisable.
(e) Stock Appreciation Rights
For the period ended September 30, 2014, the Corporation had 2.0 million SAR’s outstanding. The SARs vest up to one thirdon each anniversary from the date of grant and expire in June 2018. The exercise price is downward adjusted for dividendspaid. As such the exercise price at September 30, 2014 is $2.63 (December 31, 2013 - $3.05) and 666,667 SARs were vestedand exercisable. The SARs when exercised are to be cash settled based on the difference between the Corporation’s commonshare price on the date of exercise and the adjusted exercise price. The Corporation has valued the SARs using a Black Scholesvaluation model and will continue to revalue at each reporting period until ultimate cash settlement. During the period, theCorporation realized an increase to the liability within accounts payable and an offsetting increase to stock-based compensationof $3.7 million (2013 - $3.0 million). There is $6.7 million included in accounts payable at September 30, 2014 (December 31,2013 - $3.0 million).
(f) Restricted and Performance Share Award Incentive Plan
The Corporation has a Stock Incentive Plan which authorizes the Board of Directors to grant restricted share awards (“RSAs”)and performance share awards (“PSAs”) to directors, officers, employees and certain consultants of Surge.
Subject to the terms and conditions of the plan, each RSA entitles the holder to an award value to be typically paid as to one-third on each of the first, second and third anniversaries from the date of grant. Each PSA entitles the holder to an award valueto be typically paid on the third anniversary of the date of grant. For the purpose of calculating share-based compensation,the fair value of each award is determined at the grant date using the closing price of the common shares. An estimatedforfeiture rate of 15% was used to value all awards granted for the period ended September 30, 2014. The weighted averagefair value of awards granted for the period ended September 30, 2014 is $7.06 per PSA and $7.38 per RSA. In the case of PSAs,the award value is adjusted for a payout multiplier which can range from 0.0 to 2.0 and is dependent on the performance ofthe Corporation relative to pre-defined corporate performance measures for a particular period. On the vesting dates, theCorporation has the option of settling the award value in cash or common shares of the Corporation. For purposes of stock-based compensation a payout multiple of 1.0 was assumed for the PSAs.
The total number of RSA and PSA units granted cannot exceed five percent of the issued and outstanding shares of theCorporation.
All share issuances under the plan were approved by the Toronto Stock Exchange and the Corporation's shareholders in May2014.
2014 Third Quarter Condensed Consolidated Interim Financial Statements
Notes to the Consolidated Financial Statements 13

The number of restricted and performance share awards outstanding are as follows:
Number of restrictedshare awards
Number of performanceshare awards
Balance at January 1, 2013 854,425 908,625
Granted 1,193,288 668,580
Exercised (9,100) —
Forfeited (143,525) (56,625)
Balance at September 30, 2014 1,895,088 1,520,580
(g) Stock-based compensation
A reconciliation of the stock-based compensation expense is provided below:
Three Months EndedSeptember 30,
Nine Months EndedSeptember 30,
2014 2013 2014 2013Stock-based compensation on options $ 16 $ 3,140 $ 57 $ 6,210
Stock-based compensation on SARs 9 1,193 3,748 1,193
Stock-based compensation on warrants — — — 3,522
Stock-based compensation on PSAs and RSAs (1) 2,945 — 5,277 —
Capitalized stock-based compensation (795) (1,879) (1,764) (3,280)
Total stock-based compensation expense $ 2,175 $ 2,454 $ 7,318 $ 7,645
The Corporation’s stock-based compensation expense for the period ended September 30, 2014 was $7.3 million(September 30, 2013 - $7.6 million).
(1) Included in stock-based compensation is cash expenditures of $1.9 million paid to acquire shares offered to employees andservice providers.
(h) Per share amounts
The following table summarizes the shares used in calculating the income (loss) per share:
Three Months Ended September 30,
Nine Months Ended September 30,
2014 2013 2014 2013Weighted average number of shares - basic 217,689,253 119,878,292 193,739,379 87,662,847Effect of dilutive instruments 1,718,354 248,162 1,278,964 —Weighted average number of shares - diluted 219,407,607 120,126,454 195,018,343 87,662,847
In computing diluted per share amounts at September 30, 2014, 86,700 options (September 30, 2013 – 60,666), nil performancewarrants (September 30, 2013 – 1,767,723), nil warrants (September 30, 2013 – nil), 1,149,763 RSAs (September 30, 2013 –nil) and 662,705 PSAs (September 30, 2013 – nil) were excluded from the calculation as their effect was anti-dilutive.
2014 Third Quarter Condensed Consolidated Interim Financial Statements
Notes to the Consolidated Financial Statements 14

(i) Dividends
The Board of Directors declared for the months of January through September dividends of $0.42166 per share. Dividends of$0.050 per share are declared and outstanding at September 30, 2014 and were paid in October 2014. Dividends for the monthof October have also been declared at $0.050 per share per month.
2014 Third Quarter Condensed Consolidated Interim Financial Statements
Notes to the Consolidated Financial Statements 15
10. INVESTMENT
On February 28, 2014, the Company acquired 9,300,000 common shares of Longview, representing 19.8 percent of theoutstanding common shares, at a purchase price of $4.45 per Common Share for a total cost of $41,385,000.
The investment was initially accounted for as available for sale, which results in the investment being fair valued at the end ofeach reporting period, with any gains or losses recorded in accumulated other comprehensive income. On June 5, 2014 Surgeannounced the completion of the arrangement with Longview and purchased all the remaining issued and outstanding commonshares of Longview. As such, the 9,300,000 common shares were revalued using the Longview common share closing price onJune 5, 2014 with a final gain of $23,622,000 ($20,669,250 net of tax) determined. In conjunction with the closing, this gainwas transferred from accumulated other comprehensive income to earnings. The total investment fair value of $65,007,000at June 5, 2014 has been included as consideration in note 3.
11. COMMITMENTS
Future minimum payments relating to operating lease and firm transport commitments are as follows:
($000s)
2014 $ 1,483
2015 5,647
2016 5,493
2017 5,171
2018 4,410
2019+ 9,628
Total $ 31,832


