Characterization of Alata Horticultural Research Station Tomato Core Collection for
Quality Parameters
Dr.Davut KELEŞ
İhsan CANAN C.Aylin OLUK Mustafa ÜNLÜ Atilla ATA Zafer KARAŞAHİN Çağlar EROĞLU Ebru ÇOKSEVER Seyfeddin FARUK Rasim ARSLAN Prof. Dr. Yüksel ÖZDEMİR Alata Bahçe Kültürleri Araştırma İstasyon Müdürlüğü
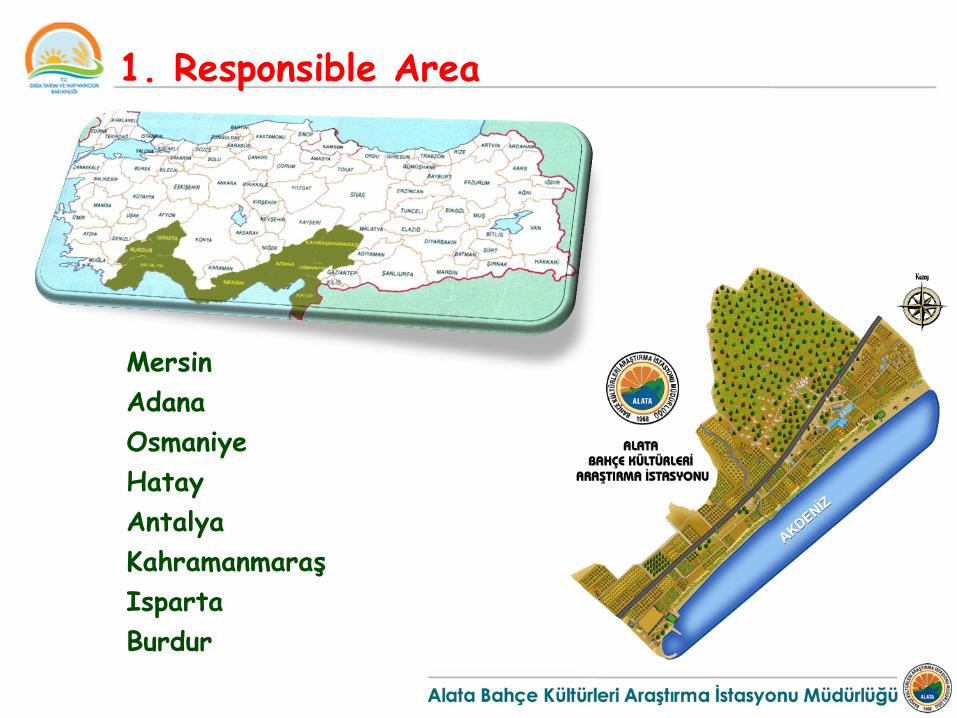
Mersin
Adana
Osmaniye
Hatay
Antalya
Kahramanmaraş
Isparta
Burdur
1. Responsible Area
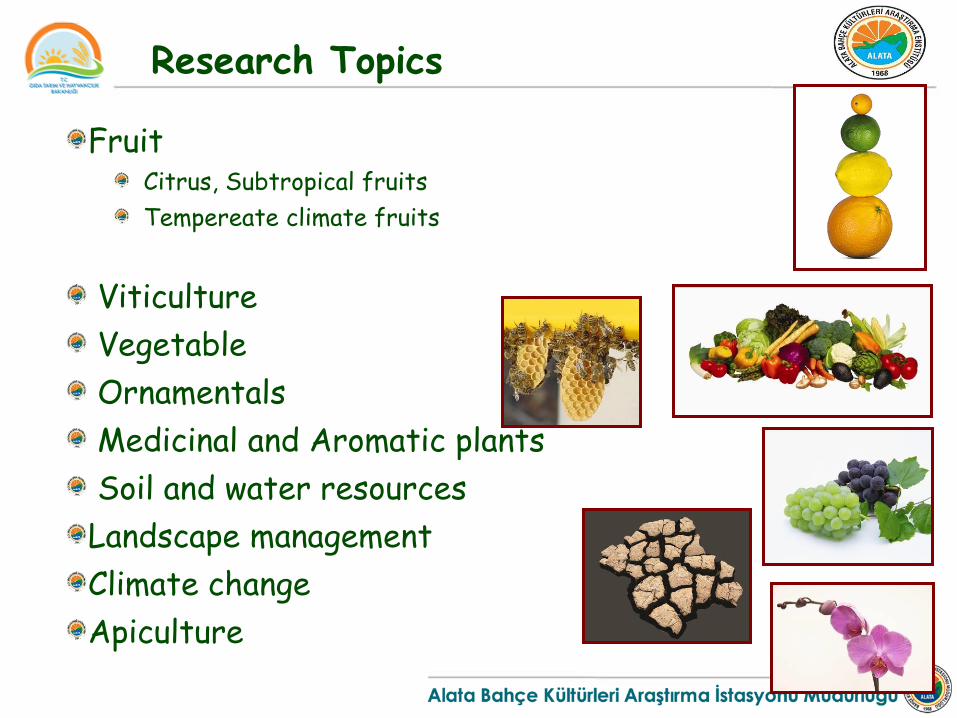
Fruit Citrus, Subtropical fruits
Tempereate climate fruits
Viticulture
Vegetable
Ornamentals
Medicinal and Aromatic plants
Soil and water resources
Landscape management
Climate change
Apiculture
Research Topics
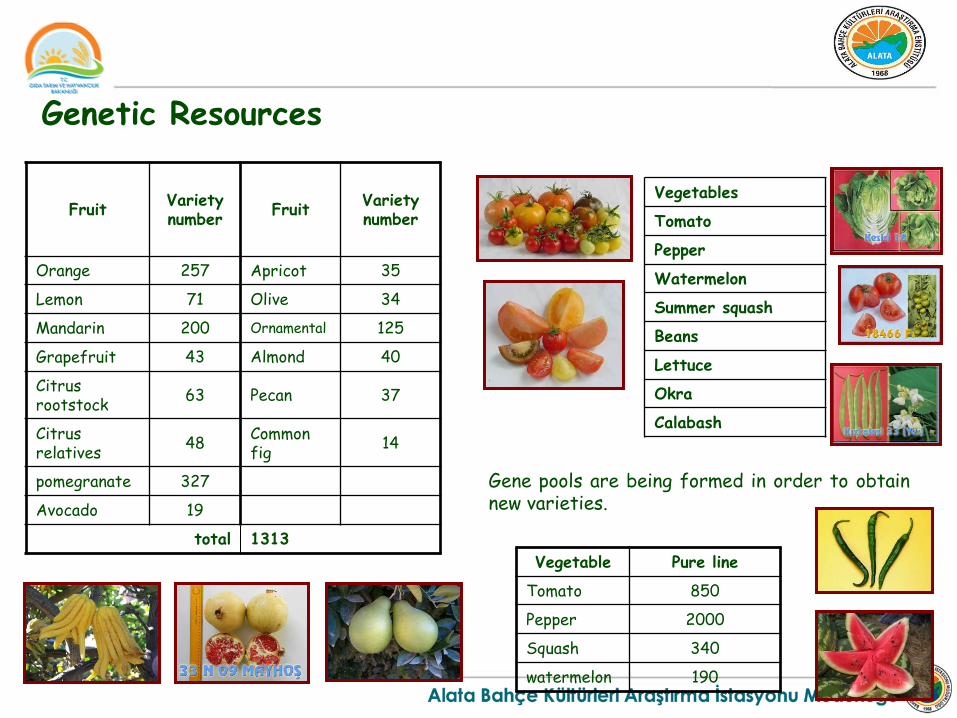
Genetic Resources
Gene pools are being formed in order to obtain new varieties.
Vegetables
Tomato
Pepper
Watermelon
Summer squash
Beans
Lettuce
Okra
Calabash
Vegetable Pure line
Tomato 850
Pepper 2000
Squash 340
watermelon 190
Fruit Variety number
Fruit Variety number
Orange 257 Apricot 35
Lemon 71 Olive 34
Mandarin 200 Ornamental 125
Grapefruit 43 Almond 40
Citrus rootstock
63 Pecan 37
Citrus relatives
48 Common fig
14
pomegranate 327
Avocado 19
total 1313
Development from Alata Tomato Core Collection
Significant variations for cold tolerance among tomato genotypes
Valuable for breeding cultivars for unheated greenhouses
It was selected 4 pure lines for use tomoto rootstock breeding
8
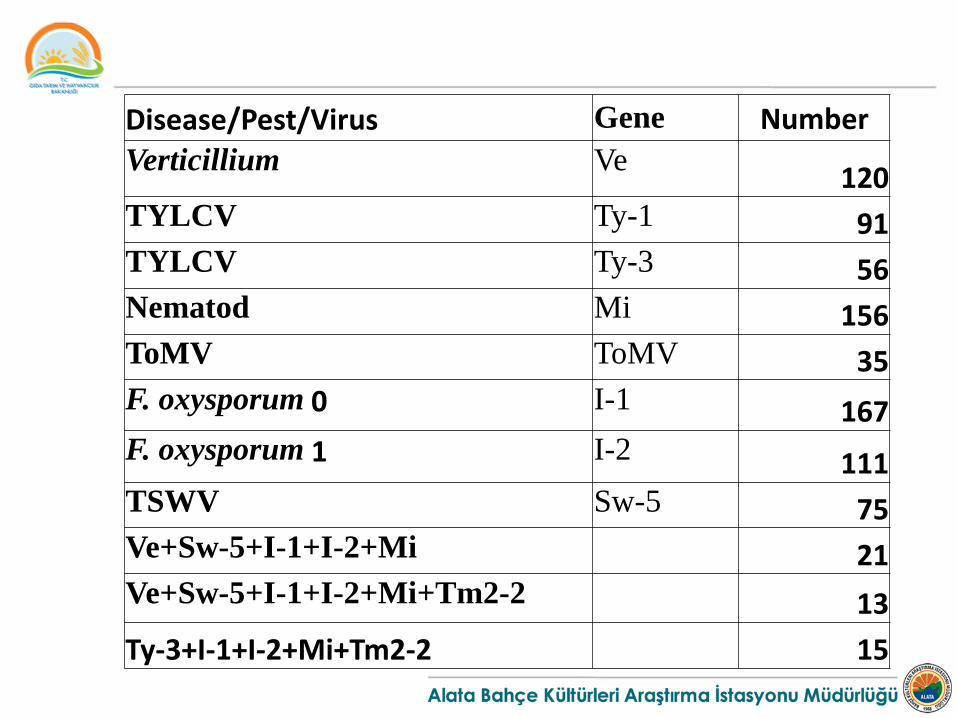
Disease/Pest/Virus Gene Number
Verticillium Ve 120 TYLCV Ty-1 91 TYLCV Ty-3 56 Nematod Mi 156 ToMV ToMV 35 F. oxysporum 0 I-1 167 F. oxysporum 1 I-2 111 TSWV Sw-5 75 Ve+Sw-5+I-1+I-2+Mi 21 Ve+Sw-5+I-1+I-2+Mi+Tm2-2 13
Ty-3+I-1+I-2+Mi+Tm2-2 15
Characterization of Alata Horticultural Research Station Tomato Core Collection for Quality Parameters
AIM:
1. Changes in consumers preferences
a- Preservation on the basis of amount and visual quality
b- Preservation on the basis of nutrition worth
2. Comparison of hopeful pure line with commercial lines and determining
bioactive features
3. Research and development support to Tomato Sector
10
Characterization of Alata Horticultural Research Station Tomato Core Collection for Quality Parameters
Cooperated Organizations
University of MERSIN. Department of Food Enginnering MEİTAM : Universtiy of Mersin (Center of Advanced Technology, Education, Research and Aplication) CUKUROVA UNIVERSITY Department of Food Engineering Directorate of Food Control Laboratory MERSIN
11
T.C.
GIDA, TARIM VE HAYVANCILIK BAKANLIĞI
Bahçe Kültürleri Araştırma İstasyonu Müdürlüğü
Alata /MERSİN
PROTOKOL
“İleri Islah Programlarında Değerlendirmek Üzere Bazı Meyve-
Sebze Türleri ile Saf Hatlarının Ve Çeşitlerinin Hasat Sonrası
Biyoaktif Özelliklerinin Karakterizasyonu”
PROJESİ
İŞBİRLİĞİ PROTOKOLÜ
MATERIAL
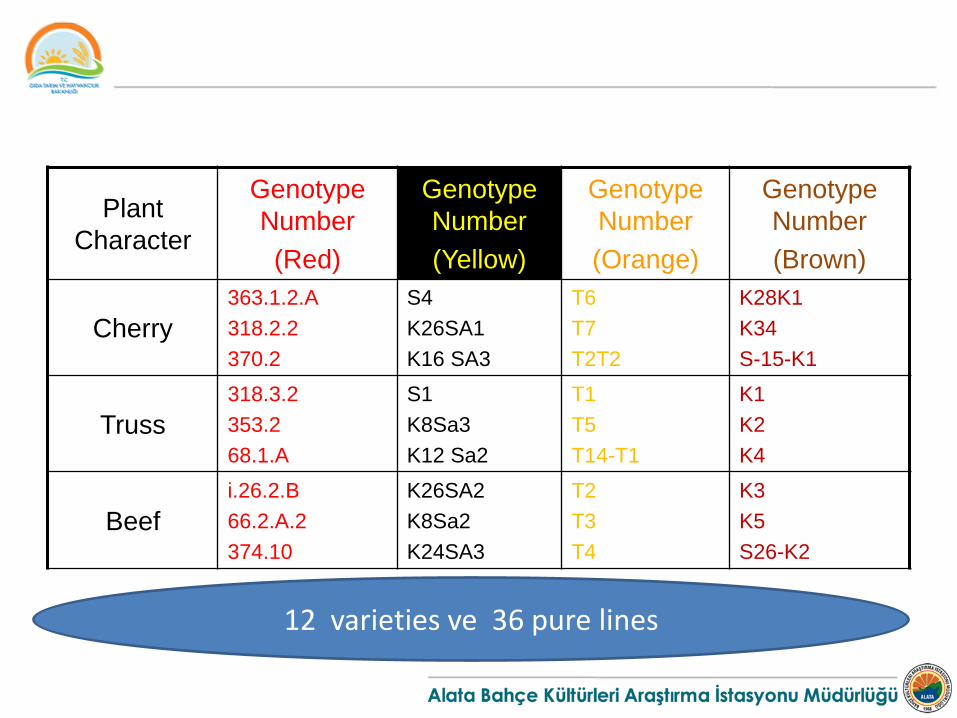
Plant
Character
Genotype
Number
(Red)
Genotype
Number
(Yellow)
Genotype
Number
(Orange)
Genotype
Number
(Brown)
Cherry
363.1.2.A
318.2.2
370.2
S4
K26SA1
K16 SA3
T6
T7
T2T2
K28K1
K34
S-15-K1
Truss
318.3.2
353.2
68.1.A
S1
K8Sa3
K12 Sa2
T1
T5
T14-T1
K1
K2
K4
Beef
i.26.2.B
66.2.A.2
374.10
K26SA2
K8Sa2
K24SA3
T2
T3
T4
K3
K5
S26-K2
12 varieties ve 36 pure lines
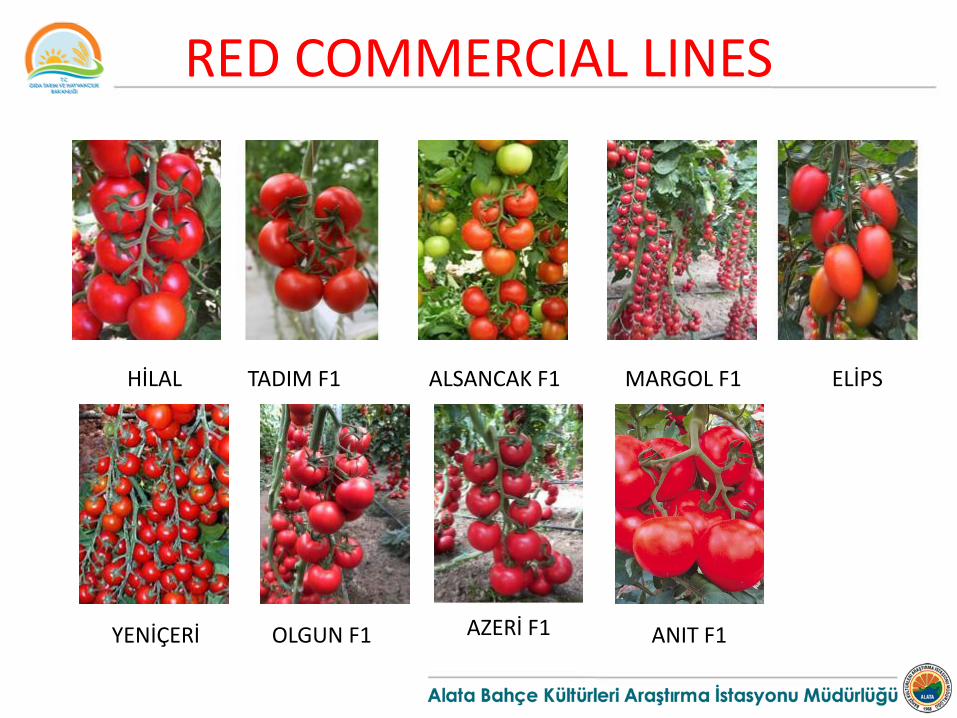
RED COMMERCIAL LINES
HİLAL TADIM F1 ELİPS MARGOL F1
YENİÇERİ
ALSANCAK F1
OLGUN F1 AZERİ F1 ANIT F1
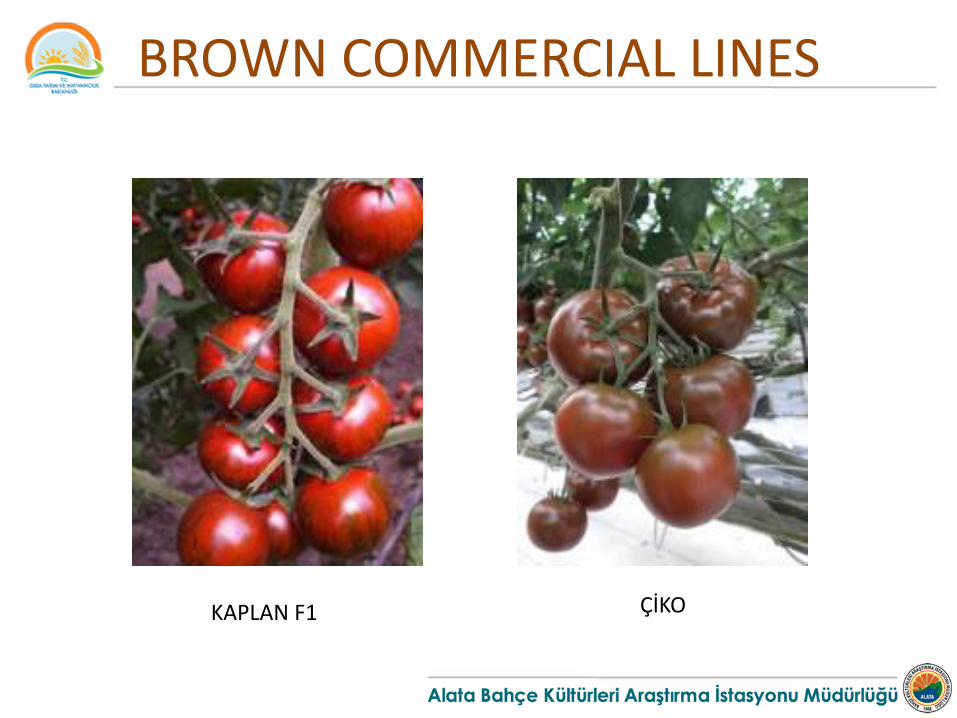
BROWN COMMERCIAL LINES
KAPLAN F1 ÇİKO
METHOD
17
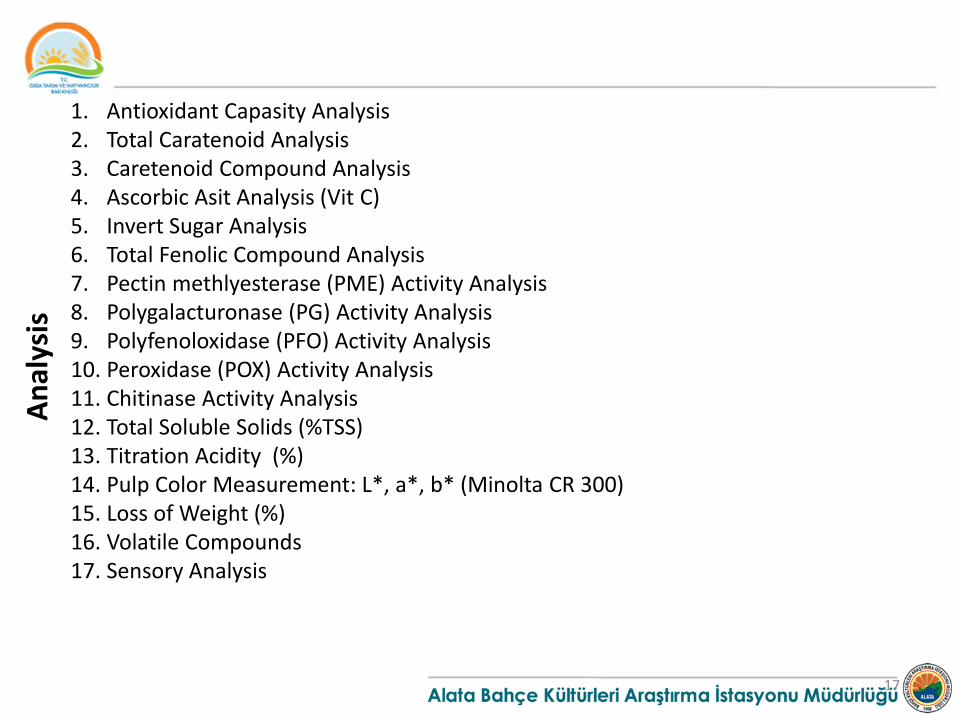
1. Antioxidant Capasity Analysis 2. Total Caratenoid Analysis 3. Caretenoid Compound Analysis 4. Ascorbic Asit Analysis (Vit C) 5. Invert Sugar Analysis 6. Total Fenolic Compound Analysis 7. Pectin methlyesterase (PME) Activity Analysis 8. Polygalacturonase (PG) Activity Analysis 9. Polyfenoloxidase (PFO) Activity Analysis 10. Peroxidase (POX) Activity Analysis 11. Chitinase Activity Analysis 12. Total Soluble Solids (%TSS) 13. Titration Acidity (%) 14. Pulp Color Measurement: L*, a*, b* (Minolta CR 300) 15. Loss of Weight (%) 16. Volatile Compounds 17. Sensory Analysis
An
alys
is

RESULTS
• Red Lines
• The least loss of weight in chery tomato lines during shelf life
• Better TSS and acidity values in chery lines
• Less changes in acidity in truss lines
• Better color features in chery 370-2 line
• Higher caretonoid content and hue value in 370-2, 318-3-2 and 374-10 lines
• In Yellow Lines,
• The least loss of weight in truss lines during shelf life
• Better TSS and acidity in cherry lines
• More changes of acidity in truss lines
• Truss K8Sa line is better in term of colour features
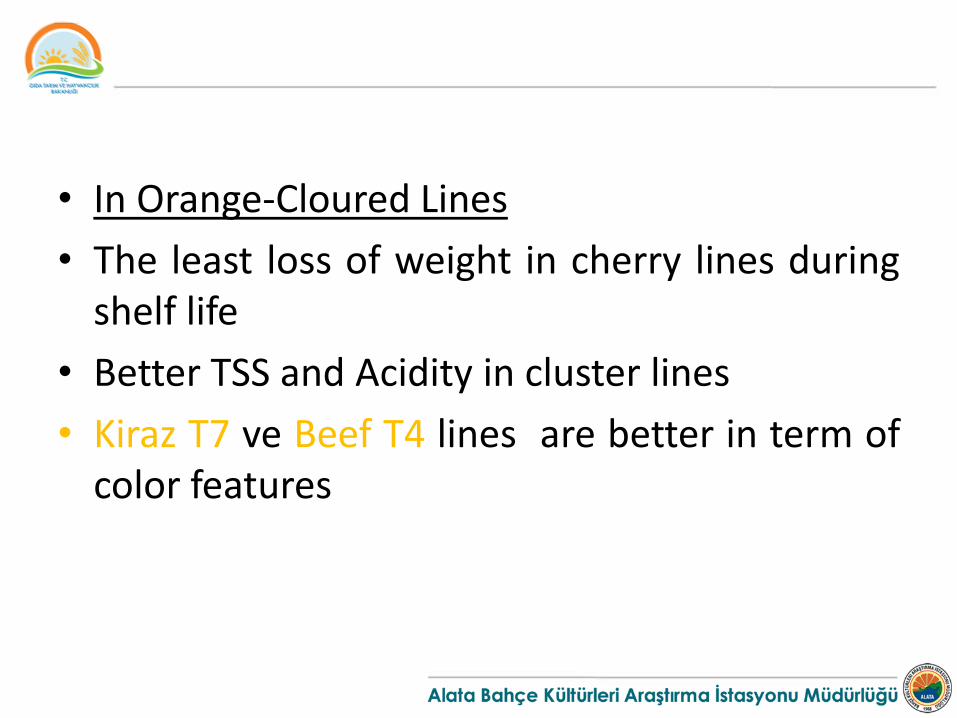
• In Orange-Cloured Lines
• The least loss of weight in cherry lines during shelf life
• Better TSS and Acidity in cluster lines
• Kiraz T7 ve Beef T4 lines are better in term of color features
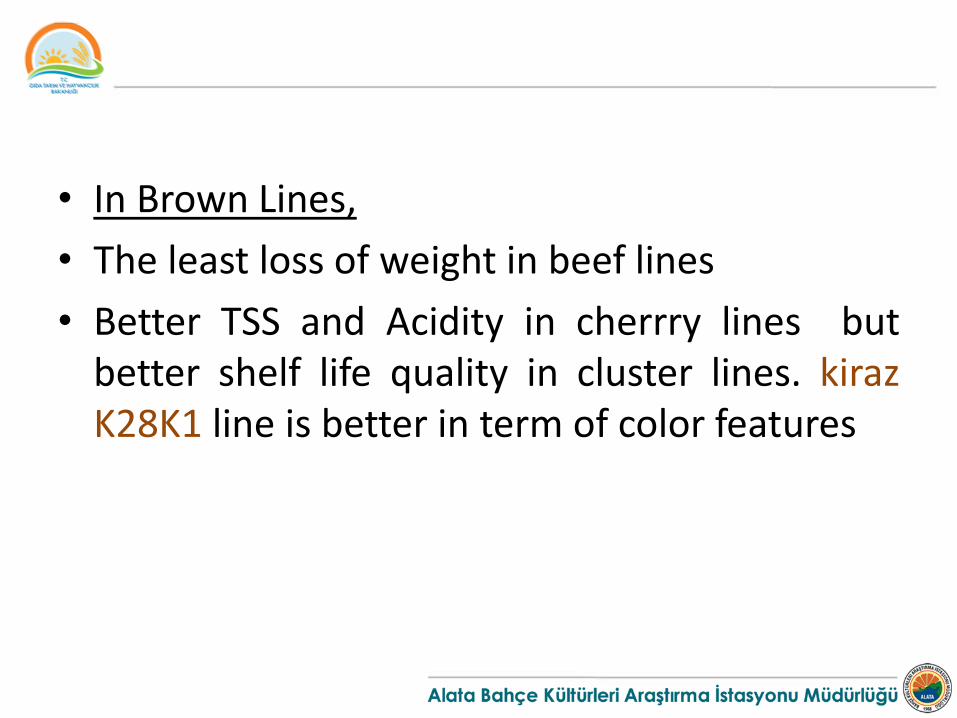
• In Brown Lines,
• The least loss of weight in beef lines
• Better TSS and Acidity in cherrry lines but better shelf life quality in cluster lines. kiraz K28K1 line is better in term of color features
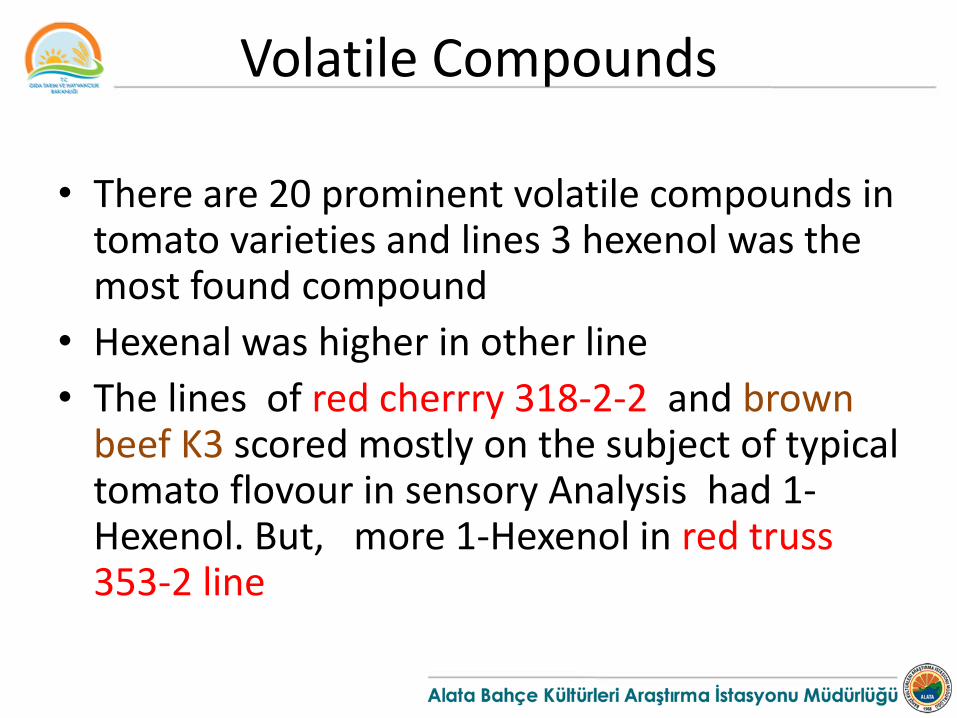
Volatile Compounds
• There are 20 prominent volatile compounds in tomato varieties and lines 3 hexenol was the most found compound
• Hexenal was higher in other line
• The lines of red cherrry 318-2-2 and brown beef K3 scored mostly on the subject of typical tomato flovour in sensory Analysis had 1-Hexenol. But, more 1-Hexenol in red truss 353-2 line
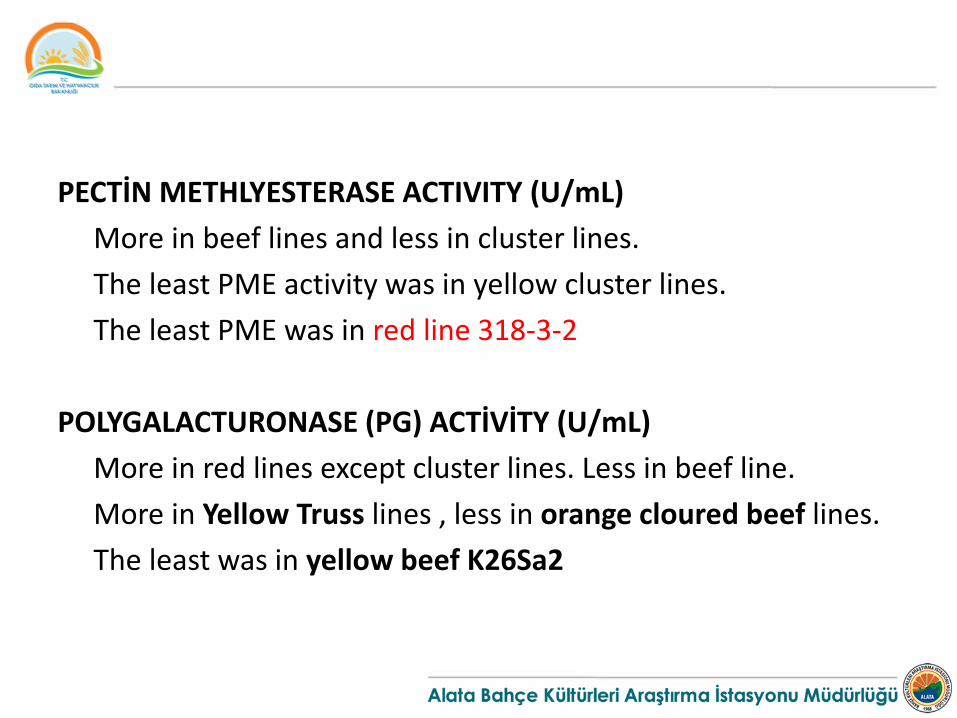
PECTİN METHLYESTERASE ACTIVITY (U/mL)
More in beef lines and less in cluster lines.
The least PME activity was in yellow cluster lines.
The least PME was in red line 318-3-2
POLYGALACTURONASE (PG) ACTİVİTY (U/mL)
More in red lines except cluster lines. Less in beef line.
More in Yellow Truss lines , less in orange cloured beef lines.
The least was in yellow beef K26Sa2
POLYFENOLOXİDASE (PFO) ACTİVİTY(U/mL) More in all brown cloured lines , less in truss lines except orange
colured lines. The least was in orange colured beef lines PEROXİDASE (POX) ACTİVİTY (U/mL) The least in red and yellow lines, the most was in brown colured
lines The least in yellow beef K26Sa2 lines CHITINASE ACTIVITY (U/mL) More in red and brown truss lines, More in orange colured and yellow beef lines. The most in red truss 318-3-2
• The BESTs:
• Cherry lines in terms of Total Phenol Content
• Red- Brown truss and Orange- yellow in terms of ascorbic acid
• Red- Brown truss in terms of antioxidant capacity
• Red –brown truss in terms of total carotenoid, β-caroten, and licopen
• Red cherry lines and other colours in truss in terms of Fructose content
• Red cherry lines and brown and yellow beef lines in terms of Glucose content
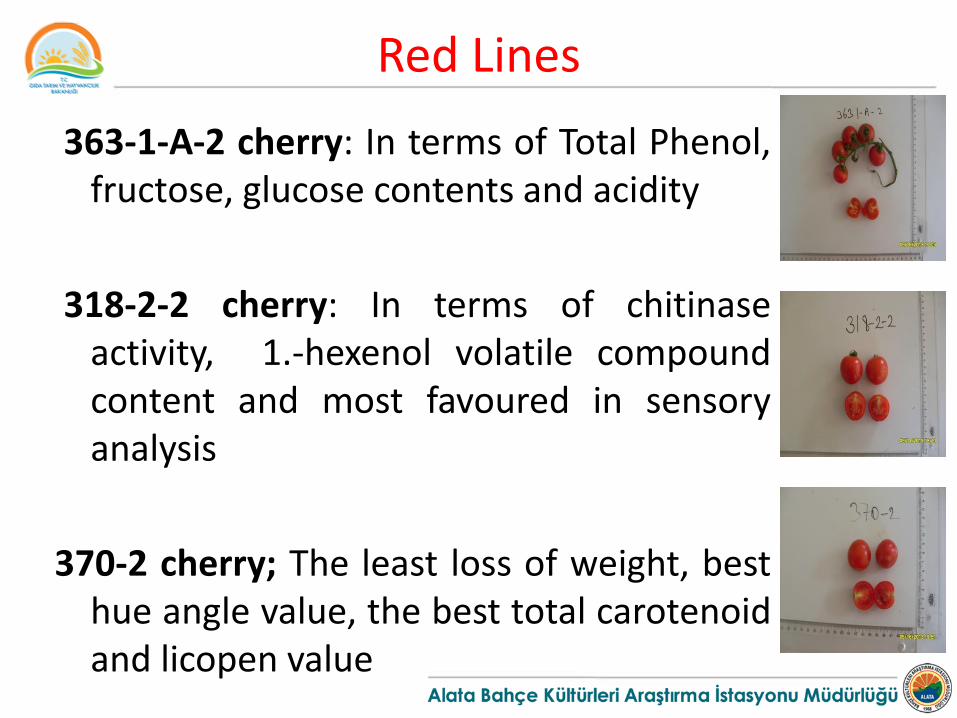
Red Lines
363-1-A-2 cherry: In terms of Total Phenol, fructose, glucose contents and acidity
318-2-2 cherry: In terms of chitinase activity, 1.-hexenol volatile compound content and most favoured in sensory analysis
370-2 cherry; The least loss of weight, best hue angle value, the best total carotenoid and licopen value
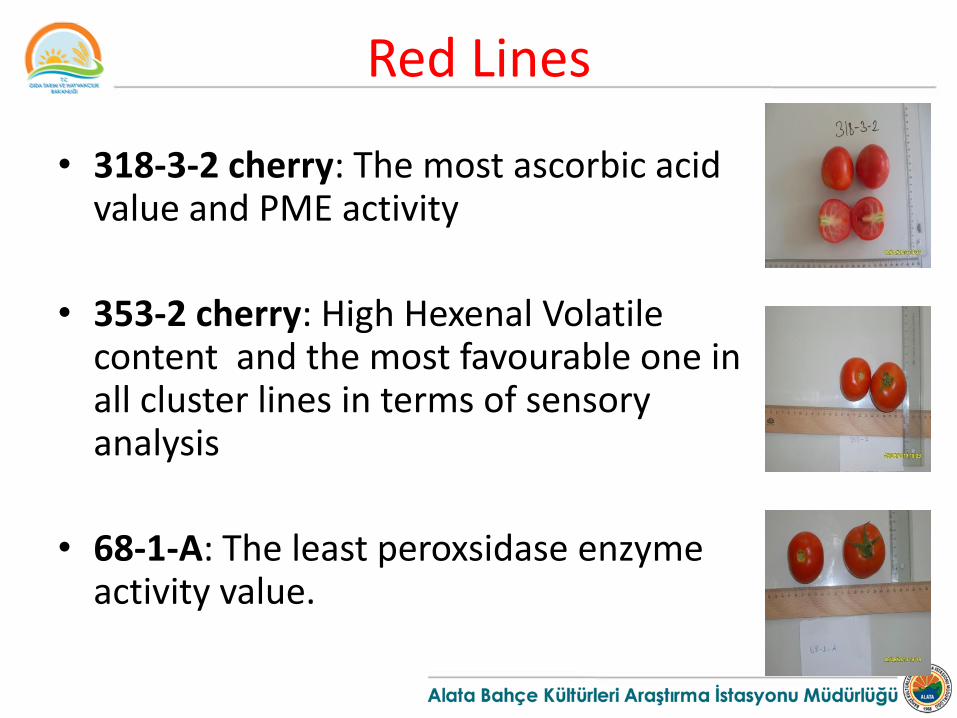
Red Lines
• 318-3-2 cherry: The most ascorbic acid value and PME activity
• 353-2 cherry: High Hexenal Volatile content and the most favourable one in all cluster lines in terms of sensory analysis
• 68-1-A: The least peroxsidase enzyme activity value.
Red Lines
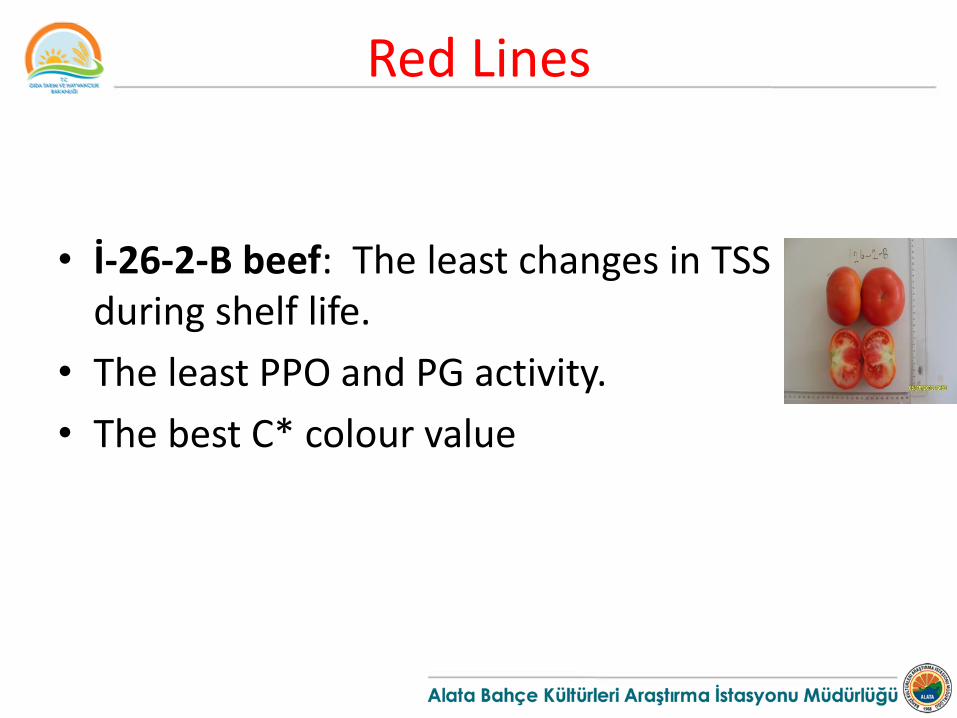
• İ-26-2-B beef: The least changes in TSS during shelf life.
• The least PPO and PG activity.
• The best C* colour value
Yellow Lines
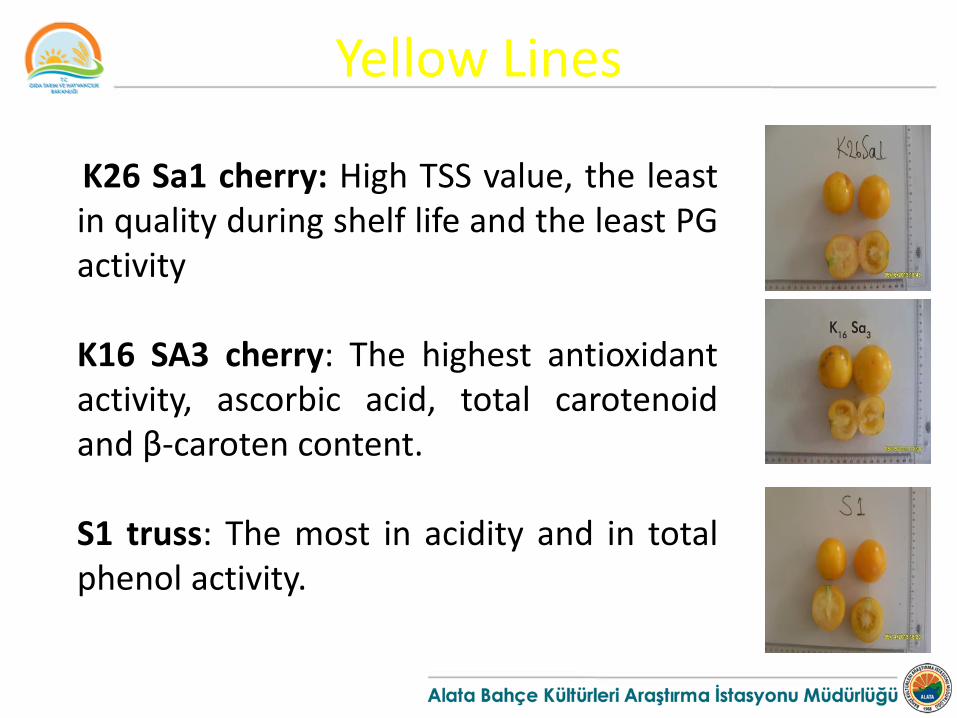
K26 Sa1 cherry: High TSS value, the least in quality during shelf life and the least PG activity K16 SA3 cherry: The highest antioxidant activity, ascorbic acid, total carotenoid and β-caroten content. S1 truss: The most in acidity and in total phenol activity.
Yellow Lines
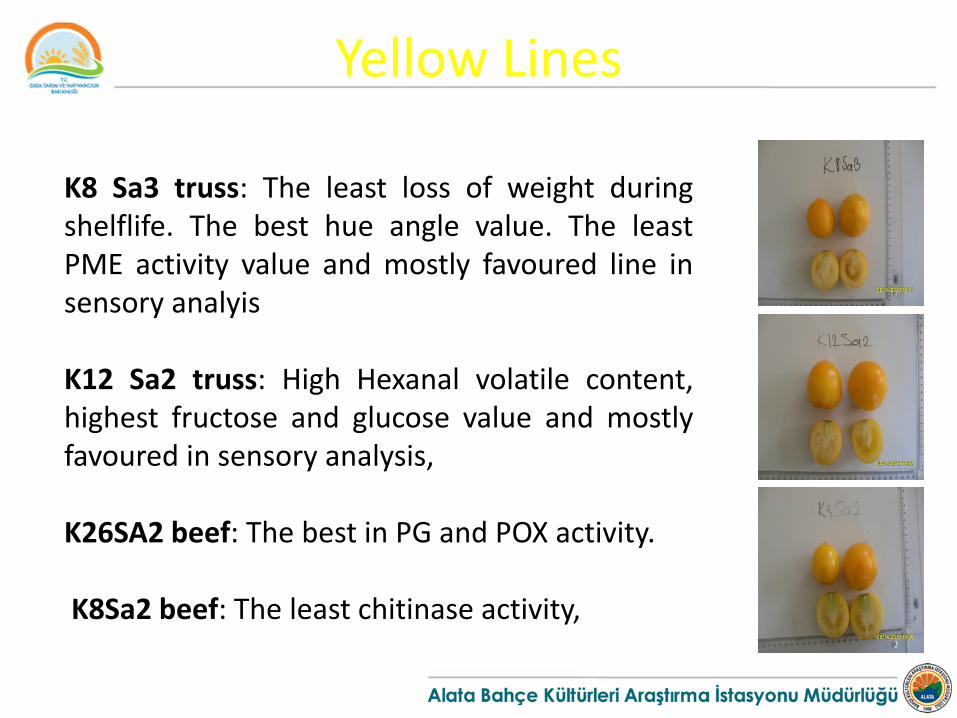
K8 Sa3 truss: The least loss of weight during shelflife. The best hue angle value. The least PME activity value and mostly favoured line in sensory analyis K12 Sa2 truss: High Hexanal volatile content, highest fructose and glucose value and mostly favoured in sensory analysis, K26SA2 beef: The best in PG and POX activity. K8Sa2 beef: The least chitinase activity,
Orange Coloured Lines
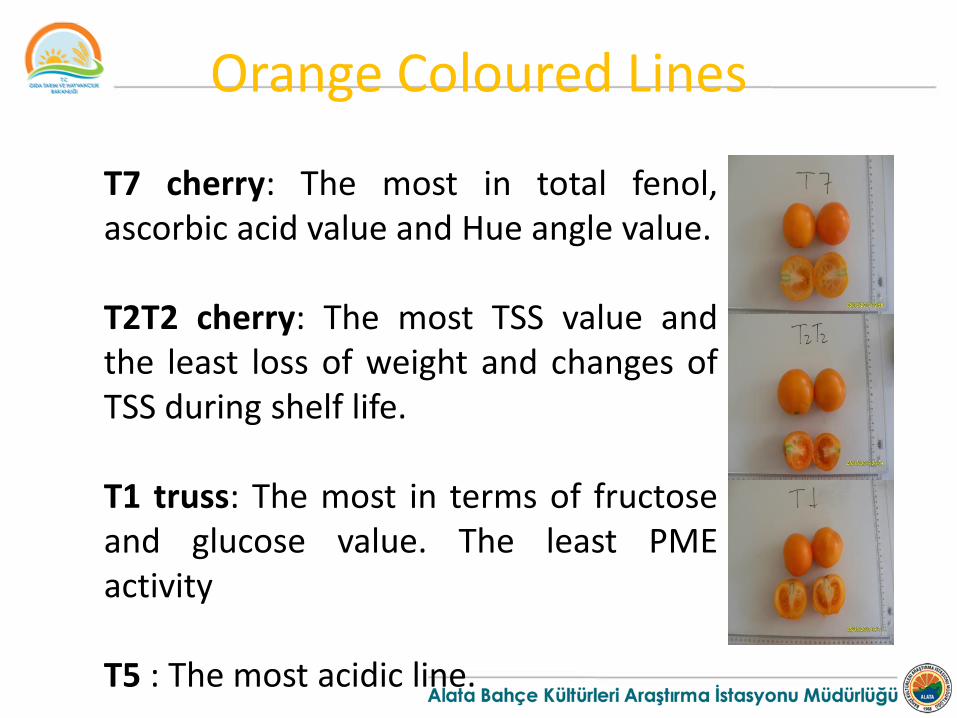
T7 cherry: The most in total fenol, ascorbic acid value and Hue angle value. T2T2 cherry: The most TSS value and the least loss of weight and changes of TSS during shelf life. T1 truss: The most in terms of fructose and glucose value. The least PME activity T5 : The most acidic line.
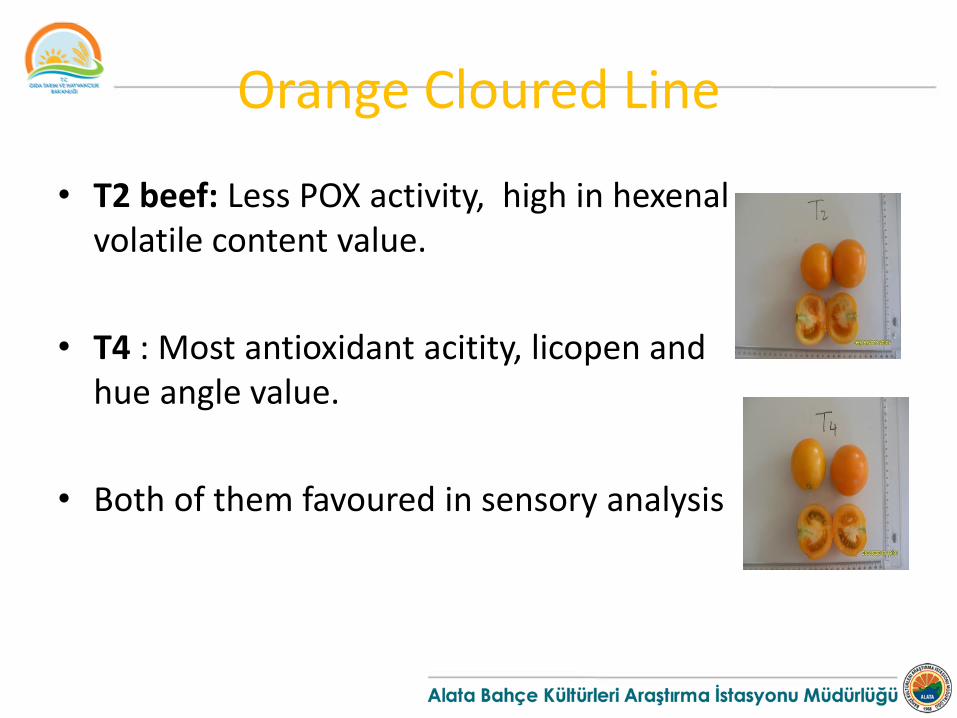
Orange Cloured Line
• T2 beef: Less POX activity, high in hexenal volatile content value.
• T4 : Most antioxidant acitity, licopen and hue angle value.
• Both of them favoured in sensory analysis
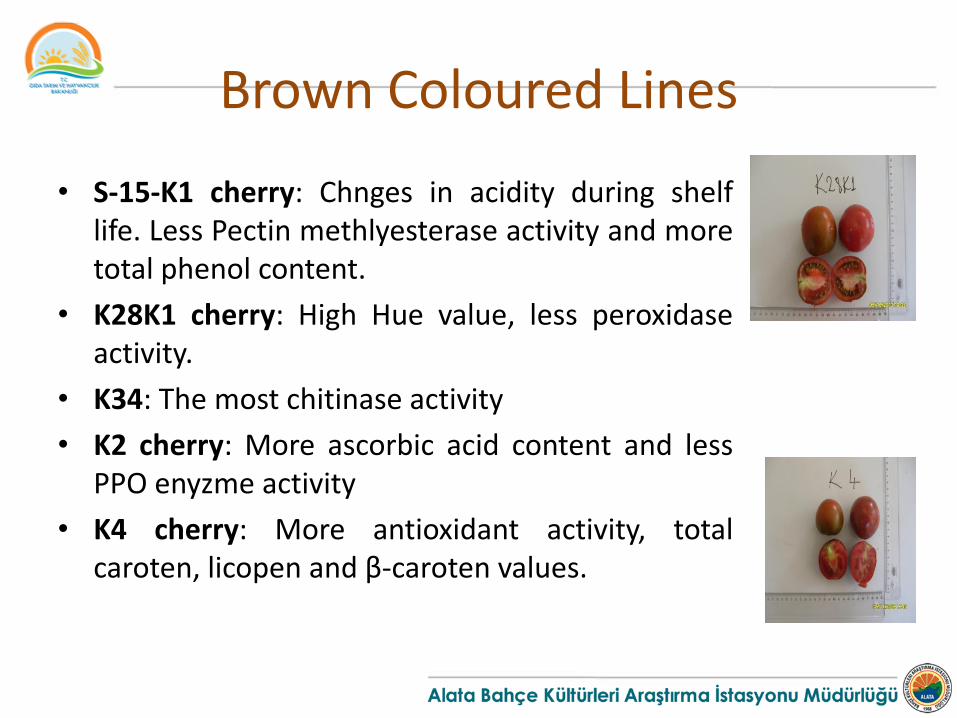
Brown Coloured Lines
• S-15-K1 cherry: Chnges in acidity during shelf life. Less Pectin methlyesterase activity and more total phenol content.
• K28K1 cherry: High Hue value, less peroxidase activity.
• K34: The most chitinase activity
• K2 cherry: More ascorbic acid content and less PPO enyzme activity
• K4 cherry: More antioxidant activity, total caroten, licopen and β-caroten values.
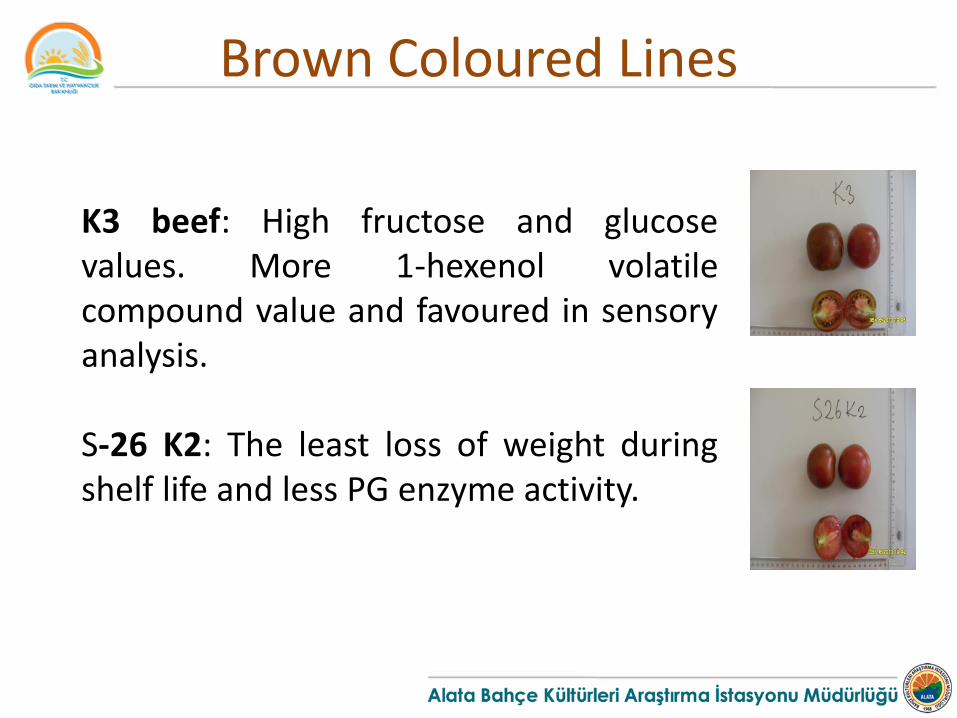
Brown Coloured Lines
K3 beef: High fructose and glucose values. More 1-hexenol volatile compound value and favoured in sensory analysis. S-26 K2: The least loss of weight during shelf life and less PG enzyme activity.
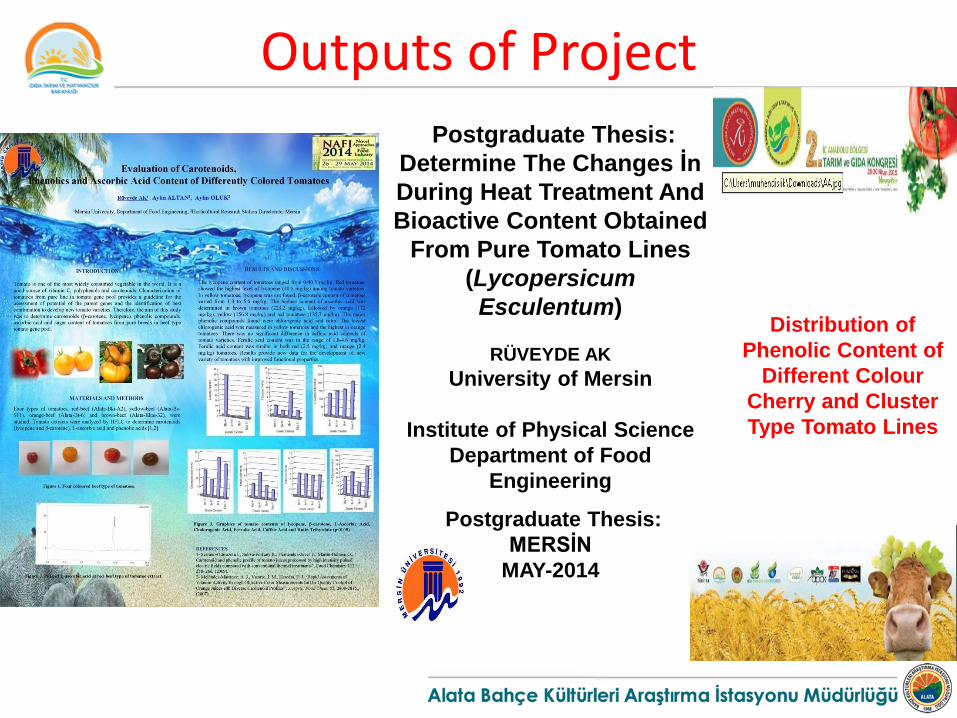
Outputs of Project Postgraduate Thesis:
Determine The Changes İn
During Heat Treatment And
Bioactive Content Obtained
From Pure Tomato Lines
(Lycopersicum
Esculentum)
RÜVEYDE AK
University of Mersin
Institute of Physical Science
Department of Food
Engineering
Postgraduate Thesis:
MERSİN
MAY-2014
Distribution of
Phenolic Content of
Different Colour
Cherry and Cluster
Type Tomato Lines
Thank you for your attention [email protected] Alata Bahçe Kültürleri Araştırma İstasyonu Müdürlüğü http://arastirma.tarim.gov.tr/alata [email protected]
Is t a n b u l
a w a i t s you!
XXX.INTERNATIONAL HORTICULTURAL CONGRESS
12 - 16 AUGUST 2018 ISTANBUL - TURKEY
www.ihc2018.org


