Download - Chapter 2 quality management

Quality Management
Beni AsllaniUniversity of Tennessee at Chattanooga
Operations Management - 6th EditionOperations Management - 6th Edition
Chapter 2Chapter 2
Roberta Russell & Bernard W. Taylor, III
Lecture outline What is quality? Evolution of quality
management Quality tools TQM and QMS Focus of quality
management—customers
Role of employees in quality improvement
Quality in service companies
Six sigma Cost of quality Effect of quality
management on productivity
Quality awards Iso 9000
2-2-22
What Is Quality?
Oxford American Dictionary a degree or level of excellence
American Society for Quality totality of features and characteristics that
satisfy needs without deficiencies
Consumer’s and producer’s perspective
2-2-33

What Is Quality:Customer’s Perspective Fitness for use
how well product or service does what it is supposed to
Quality of design designing quality
characteristics into a product or service
A Mercedes and a Ford are equally “fit for use,” but with different design dimensions.
2-2-44

Dimensions of Quality:Manufactured Products Performance
basic operating characteristics of a product; how well a car handles or its gas mileage
Features “extra” items added to basic features, such as a
stereo CD or a leather interior in a car
Reliability probability that a product will operate properly within
an expected time frame; that is, a TV will work without repair for about seven years
2-2-55
Dimensions of Quality:Manufactured Products (cont.) Conformance
degree to which a product meets pre–established standards
Durability how long product lasts before replacement;
with care
Serviceability ease of getting repairs, speed of repairs,
courtesy and competence of repair person
2-2-66

Dimensions of Quality:Manufactured Products (cont.) Aesthetics
how a product looks, feels, sounds, smells, or tastes
Safety assurance that customer will not suffer injury or
harm from a product; an especially important consideration for automobiles
Perceptions subjective perceptions based on brand name,
advertising, and like
2-2-77

Dimensions of Quality: Services
Time and timeliness how long must a customer wait for service,
and is it completed on time? is an overnight package delivered overnight?
Completeness: is everything customer asked for provided? is a mail order from a catalogue company
complete when delivered?
2-2-88

Dimensions of Quality:Services (cont.) Courtesy:
how are customers treated by employees? are catalogue phone operators nice and are
their voices pleasant?
Consistency is same level of service provided to each
customer each time? is your newspaper delivered on time every
morning?
2-2-99

Dimensions of Quality:Services (cont.) Accessibility and convenience
how easy is it to obtain service? does service representative answer you calls quickly?
Accuracy is service performed right every time? is your bank or credit card statement correct every month?
Responsiveness how well does company react to unusual situations? how well is a telephone operator able to respond to a
customer’s questions?
2-2-1010

What Is Quality:Producer’s Perspective Quality of conformance
making sure product or service is produced according to design if new tires do not conform to specifications, they
wobble if a hotel room is not clean when a guest checks
in, hotel is not functioning according to specifications of its design
2-2-1111

Meaning of Quality
2-2-1212

What Is Quality:A Final Perspective Customer’s and producer’s perspectives
depend on each other Producer’s perspective:
production process and COST
Customer’s perspective: fitness for use and PRICE
Customer’s view must dominate
2-2-1313

Evolution of Quality Management: Quality Gurus
Walter Shewart In 1920s, developed control charts Introduced term “quality assurance” was an American physicist, engineer and statistician,
sometimes known as the father of statistical quality control
2-2-1414
W. Edwards Deming Developed courses during World War II to teach statistical
quality-control techniques to engineers and executives of companies that were military suppliers
After war, began teaching statistical quality control to Japanese companies
was an American statistician, professor, author, lecturer, and consultant. He is perhaps best known for the"Plan-Do-Check-Act" cycle popularly named after him. In Japan, from 1950 onward, he taught top business managers how to improve design (and thus service), product quality, testing, and sales (the last through global markets)[1] by various means, including the application of statistical methods
2-2-1515

Joseph M. Juran Followed Deming to Japan in 1954 Focused on strategic quality planning Quality improvement achieved by focusing on projects to
solve problems and securing breakthrough solutions was a Romanian-born American management consultant and
engineer. He is principally remembered as an evangelist for quality and quality management, having written several influential books on those subjects
2-2-1616

Evolution of Quality Management: Quality Gurus Armand V. Feigenbaum
In 1951, introduced concepts of total quality control and continuous quality improvement
an American quality control expert and businessman. He devised the concept of Total Quality Control, later known as Total Quality Management.
Philip Crosby In 1979, emphasized that costs of poor quality far outweigh
cost of preventing poor quality In 1984, defined absolutes of quality management—
conformance to requirements, prevention, and “zero defects” was a businessman and author who contributed to
management theory and quality management practices.
2-2-1717

Kaoru Ishikawa Promoted use of quality circles Developed “fishbone” diagram Emphasized importance of internal customer was a Japanese organizational theorist, Professor at the
Faculty of Engineering at The University of Tokyo, noted for his quality management innovations.
2-2-1818

Deming’s 14 Points
2-2-1919
1. Create constancy of purpose
2. Adopt philosophy of prevention
3. Stop mass inspection
4. Select a few suppliers based on quality
5. Constantly improve system and workers

Deming’s 14 Points (cont.)
6. Institute worker training
7. Instill leadership among supervisors
8. Eliminate fear among employees
9. Eliminate barriers between departments
10. Eliminate slogans and exhortations
2-2-2020

Deming’s 14 Points (cont.)
11. Remove numerical quotas
12. Enhance worker pride
13. Institute vigorous training and education programs
14. Develop a commitment from top management to implement above 13 points
2-2-2121
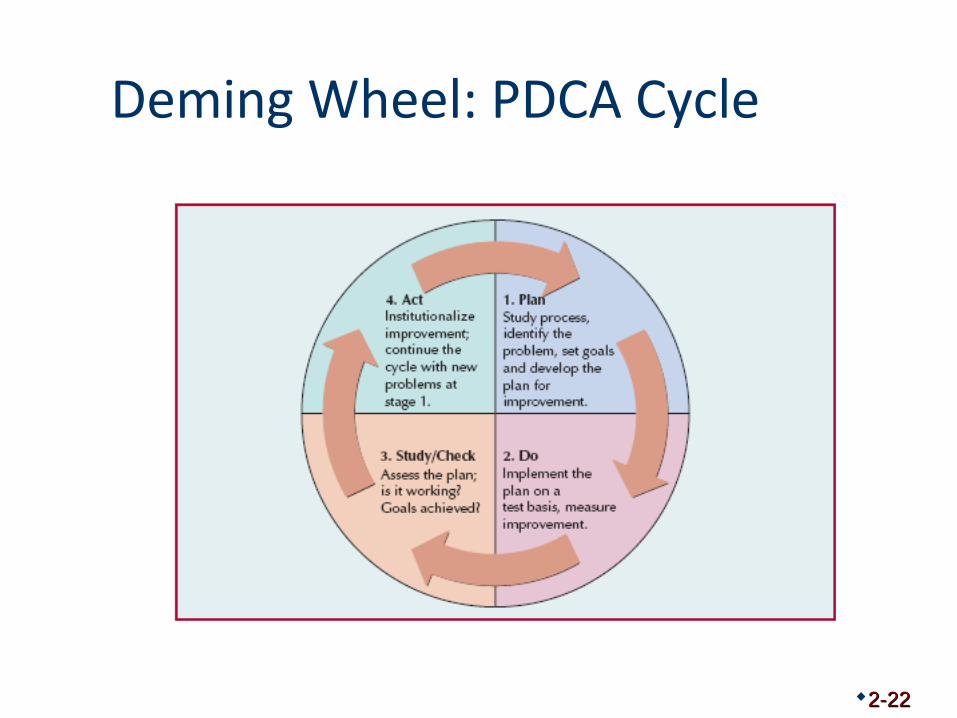
Deming Wheel: PDCA Cycle
2-2-2222

Quality tools
Process Flow Chart Cause-and-Effect
Diagram Check Sheet Pareto Analysis
Histogram Scatter Diagram Statistical Process
Control Chart
2-2-2323

Flow chart
2-2-2424

Cause-and-effect diagram
Cause-and-effect diagram (“fishbone” diagram) chart showing different categories of
problem causes
2-2-2525

Cause-and-effect matrix
Cause-and-effect matrix grid used to prioritize causes of quality
problems
2-2-2626

Check sheets and histograms
2-2-2727

Pareto analysis
Pareto analysis most quality problems result from a few
causes
2-2-2828

Pareto chart
2-2-2929

Scatter diagram
2-2-3030

Control Chart
2-2-3131

TQM and QMS
Total Quality Management (TQM) customer-oriented, leadership, strategic
planning, employee responsibility, continuous improvement, cooperation, statistical methods, and training and education
Quality Management System (QMS) system to achieve customer satisfaction that
complements other company systems
2-2-3232

Focus of Quality Management— Customers TQM and QMSs
serve to achieve customer satisfaction
Partnering a relationship between a company and its
supplier based on mutual quality standards
Measuring customer satisfaction important component of any QMS customer surveys, telephone interviews
2-2-3333

Role of Employees in Quality Improvement Participative problem solving
employees involved in quality-management
every employee has undergone extensive training to provide quality service to Disney’s guests
Kaizen involves everyone in process of
continuous improvement
2-2-3434

Quality Circles and QITs Quality circle
group of workers and supervisors from same area who address quality problems
Process/Quality improvement teams (QITs)
focus attention on business processes rather than separate company functions
2-2-3535
PresentationImplementation
Monitoring
SolutionProblem results
Problem AnalysisCause and
effectData collection
and analysis
Problem Identificatio
nList
alternativesConsensus
Brainstorming
TrainingGroup
processesData collection
Problem analysis
Organization8-10 members
Same areaSupervisor/moderat
or

Quality in Services
Service defects are not always easy to measure because service output is not usually a tangible item
Services tend to be labor intensive Services and manufacturing companies
have similar inputs but different processes and outputs
2-2-3636

Quality Attributes in Services
Principles of TQM apply equally well to services and manufacturing
Timeliness how quickly a service is
provided?
Benchmark “best” level of quality
achievement in one company that other companies seek to achieve
2-2-3737
“quickest, friendliest, most accurate service
available.”

Six Sigma
A process for developing and delivering virtually perfect products and services
Measure of how much a process deviates from perfection
3.4 defects per million opportunities Six Sigma Process
four basic steps of Six Sigma—align, mobilize, accelerate, and govern
Champion an executive responsible for project success
2-2-3838

Six Sigma:Breakthrough Strategy—DMAIC
2-2-3939
3.4 DPMO3.4 DPMO
67,000 DPMOcost = 25% of
sales
67,000 DPMOcost = 25% of
sales
DEFINEDEFINE CONTROLCONTROLIMPROVEIMPROVEANALYZEANALYZEMEASUREMEASURE

Six Sigma:Black Belts and Green Belts Black Belt
project leader
Master Black Belt a teacher and
mentor for Black Belts
Green Belts project team
members2-2-4040

Six Sigma
Design for Six Sigma (DFSS) a systematic approach to designing products and
processes that will achieve Six Sigma
Profitability typical criterion for selection Six Sigma project one of the factors distinguishing Six Sigma from
TQM “Quality is not only free, it is an honest-to-everything profit maker.”
2-2-4141

Cost of Quality
Cost of Achieving Good Quality Prevention costs
costs incurred during product design Appraisal costs
costs of measuring, testing, and analyzing
Cost of Poor Quality Internal failure costs
include scrap, rework, process failure, downtime, and price reductions
External failure costs include complaints, returns, warranty claims, liability, and
lost sales2-2-4242

Prevention Costs Quality planning costs
costs of developing and implementing quality management program
Product-design costs costs of designing
products with quality characteristics
Process costs costs expended to make
sure productive process conforms to quality specifications
Training costs costs of developing and
putting on quality training programs for employees and management
Information costs costs of acquiring
and maintaining data related to quality, and development and analysis of reports on quality performance
2-2-4343

Appraisal Costs
Inspection and testing costs of testing and inspecting materials, parts, and
product at various stages and at end of process
Test equipment costs costs of maintaining equipment used in testing
quality characteristics of products
Operator costs costs of time spent by operators to gather data for
testing product quality, to make equipment adjustments to maintain quality, and to stop work to assess quality
2-2-4444

Internal Failure Costs Scrap costs
costs of poor-quality products that must be discarded, including labor, material, and indirect costs
Rework costs costs of fixing defective
products to conform to quality specifications
Process failure costs costs of determining why
production process is producing poor-quality products
Process downtime costs costs of shutting down
productive process to fix problem
Price-downgrading costs costs of discounting poor-
quality products—that is, selling products as “seconds”
2-2-4545

External Failure Costs Customer complaint
costs costs of investigating and
satisfactorily responding to a customer complaint resulting from a poor-quality product
Product return costs costs of handling and
replacing poor-quality products returned by customer
Warranty claims costs costs of complying with
product warranties
Product liability costs litigation costs resulting
from product liability and customer injury
Lost sales costs costs incurred because
customers are dissatisfied with poor-quality products and do not make additional purchases

Measuring and Reporting Quality Costs Index numbers
ratios that measure quality costs against a base value
labor index ratio of quality cost to labor hours
cost index ratio of quality cost to manufacturing cost
sales index ratio of quality cost to sales
production index ratio of quality cost to units of final product
2-2-4747

Quality–Cost Relationship
Cost of quality difference between price of nonconformance
and conformance cost of doing things wrong
20 to 35% of revenues cost of doing things right
3 to 4% of revenues
2-2-4848

Effect of Quality Management on Productivity Productivity
ratio of output to input Quality impact on productivity
fewer defects increase output, and quality improvement reduces inputs
Yield- a measure of productivity
2-2-4949
Yield=(total input)(% good units) + (total input)(1-%good units)(% reworked)Yield=(total input)(% good units) + (total input)(1-%good units)(% reworked)
or
Y=(I)(%G)+(I)(1-%G)(%R)Y=(I)(%G)+(I)(1-%G)(%R)
or
Y=(I)(%G)+(I)(1-%G)(%R)Y=(I)(%G)+(I)(1-%G)(%R)

Computing ProductCost per Unit
2-2-5050
Y
RKIK rd ))(())(( +=Product Cost
where:Kd = direct manufacturing cost per unitI = inputKr = rework cost per unitR = reworked unitsY = yield
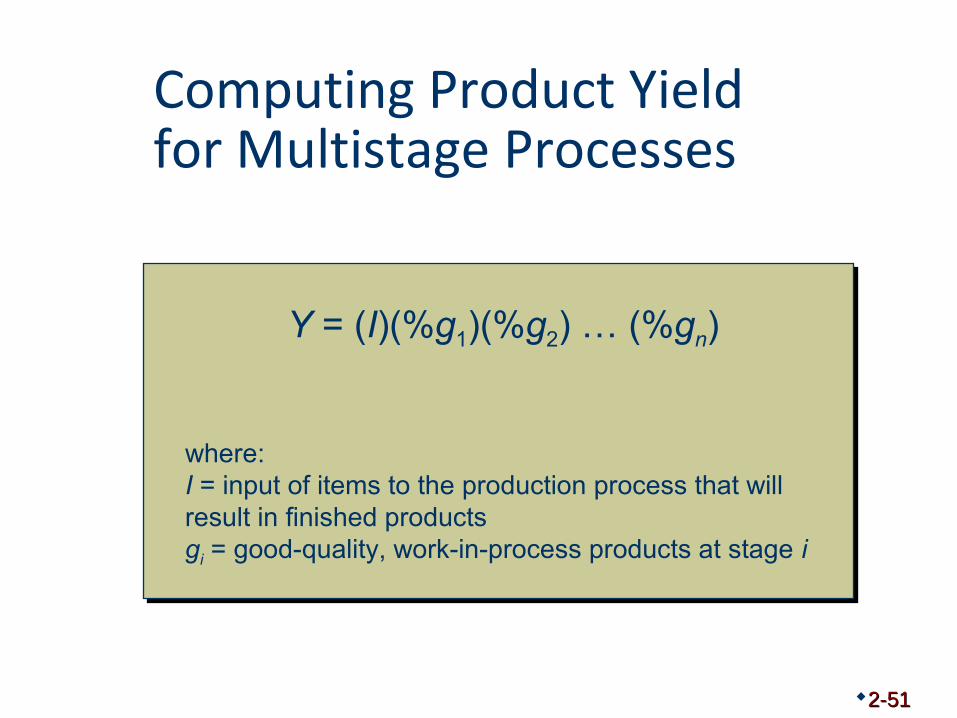
Computing Product Yieldfor Multistage Processes
2-2-5151
Y = (I)(%g1)(%g2) … (%gn)
where:I = input of items to the production process that will result in finished productsgi = good-quality, work-in-process products at stage i

Quality–Productivity Ratio
QPR productivity index that includes productivity and
quality costs
2-2-5252
QPR =(good-quality units)
(input) (processing cost) + (reworked units) (rework cost)(100)(100)

Malcolm Baldrige Award
Created in 1987 to stimulate growth of quality management in United States
Categories Leadership Information and analysis Strategic planning Human resource focus Process management Business results Customer and market focus
2-2-5353

Other Awards for Quality National individual
awards Armand V. Feigenbaum
Medal Deming Medal E. Jack Lancaster Medal Edwards Medal Shewart Medal Ishikawa Medal
International awards European Quality Award Canadian Quality Award Australian Business
Excellence Award Deming Prize from Japan
2-2-5454

ISO 9000
A set of procedures and policies for international quality certification of suppliers
Standards ISO 9000:2000
Quality Management Systems—Fundamentals and Vocabulary
defines fundamental terms and definitions used in ISO 9000 family
ISO 9001:2000 Quality Management Systems
—Requirements standard to assess ability to
achieve customer satisfaction ISO 9004:2000
Quality Management Systems—Guidelines for Performance Improvements
guidance to a company for continual improvement of its quality-management system
2-2-5555

ISO 9000 Certification,Implications, and Registrars
ISO 9001:2000—only standard that carries third-party certification
Many overseas companies will not do business with a supplier unless it has ISO 9000 certification
ISO 9000 accreditation ISO registrars
2-2-5656

2-2-5757
Copyright 2009 John Wiley & Sons, Inc.Copyright 2009 John Wiley & Sons, Inc.All rights reserved. Reproduction or translation of this work beyond that All rights reserved. Reproduction or translation of this work beyond that permitted in section 117 of the 1976 United States Copyright Act without permitted in section 117 of the 1976 United States Copyright Act without express permission of the copyright owner is unlawful. Request for further express permission of the copyright owner is unlawful. Request for further information should be addressed to the Permission Department, John Wiley & information should be addressed to the Permission Department, John Wiley & Sons, Inc. The purchaser may make back-up copies for his/her own use only and Sons, Inc. The purchaser may make back-up copies for his/her own use only and not for distribution or resale. The Publisher assumes no responsibility for not for distribution or resale. The Publisher assumes no responsibility for errors, omissions, or damages caused by the use of these programs or from the errors, omissions, or damages caused by the use of these programs or from the use of the information herein. use of the information herein.


