
Canterbury Procurement ForumThe forward pipeline – fifth edition – November 2013
Content
• National Pipeline – initial results• Auckland Pipeline – making the two regional reports look similar• Canterbury Pipeline – next iteration of the data and commentary on
how this data compares with the National Pipeline
• See previous versions of the Canterbury pipeline for a description of the method and major assumptions for the data presented here.

National Pipeline
National Pipeline
Two pronged approach in analysis:
Bottom up – Pacifecon “known” projects based on leads detected from a national network of analysts (and corroborated with Auckland and Christchurch pipeline data sets)
Top down BRANZ “economic forecast” based on modelling of historic building consents and economic data for residential construction and their approach to modelling gross fixed capital formation
High level results:
Forecasting an unprecedented level of building and construction activity
Peaking in 2016 nationally – 2016 in Canterbury
Forecast rate of growth in construction also very high in comparison with historic rates – haven’t seen rate of growth for as long in past 40 years.
Auckland the largest and fastest growing region – 150% increase in residential building over the forecast period
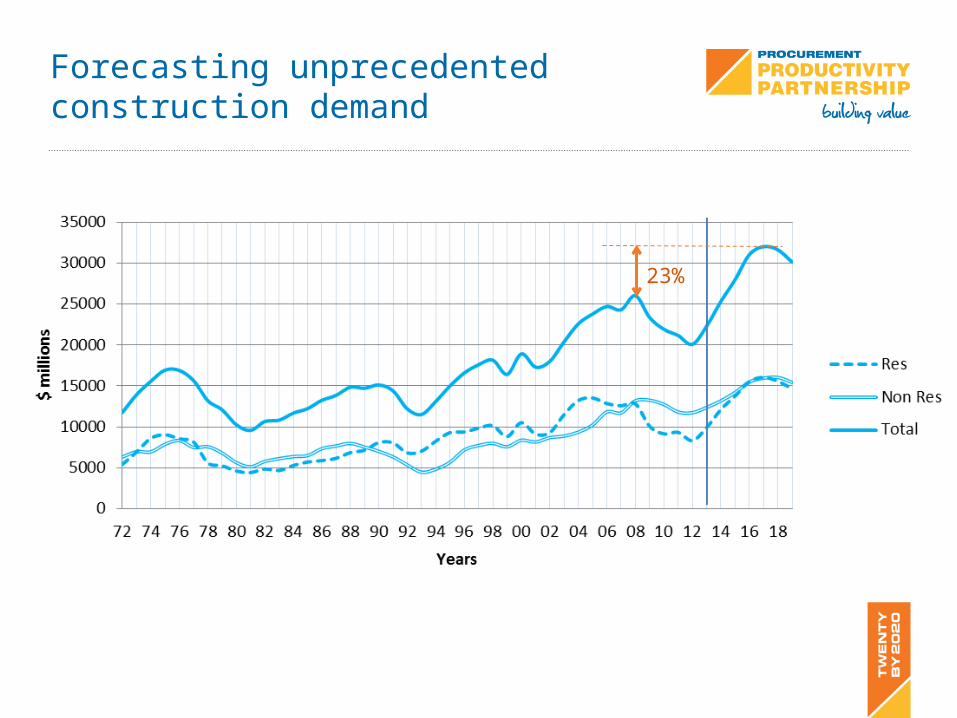
Forecasting unprecedented construction demand
23%
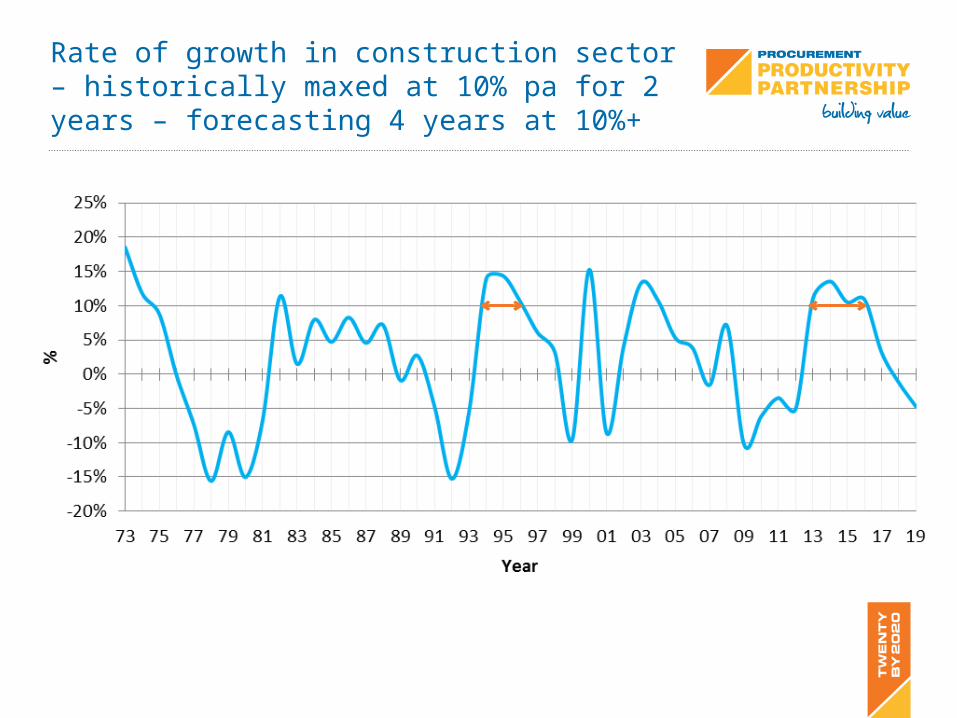
Rate of growth in construction sector – historically maxed at 10% pa for 2 years – forecasting 4 years at 10%+
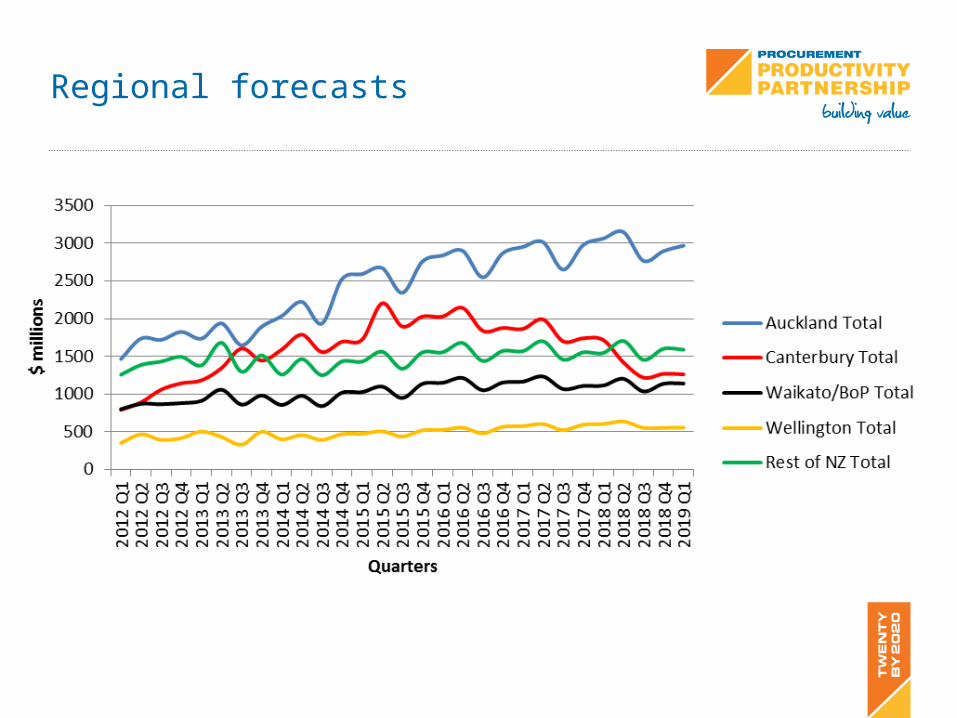
Regional forecasts
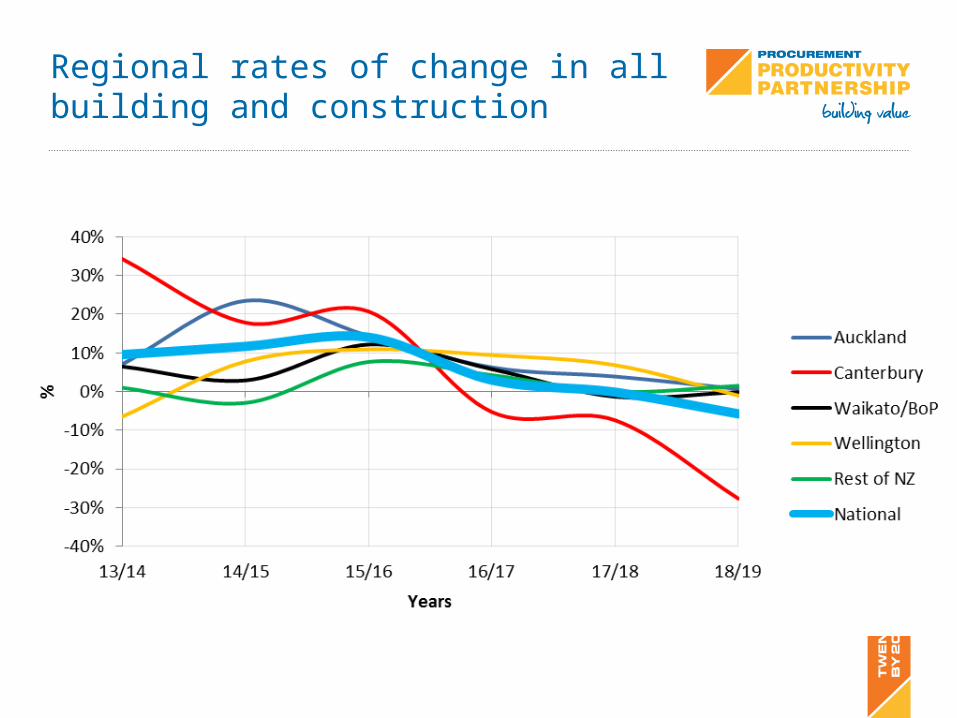
Regional rates of change in all building and construction

Auckland Pipeline
Connections between the two procurement fora
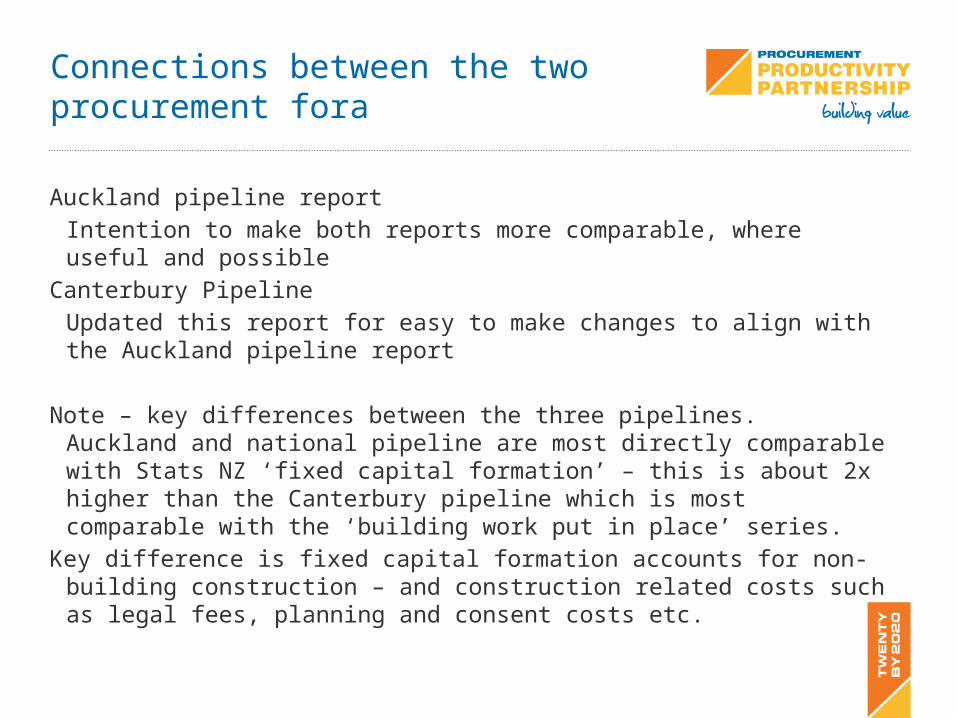
Auckland pipeline report
Intention to make both reports more comparable, where useful and possible
Canterbury Pipeline
Updated this report for easy to make changes to align with the Auckland pipeline report
Note – key differences between the three pipelines. Auckland and national pipeline are most directly comparable with Stats NZ ‘fixed capital formation’ – this is about 2x higher than the Canterbury pipeline which is most comparable with the ‘building work put in place’ series.
Key difference is fixed capital formation accounts for non-building construction – and construction related costs such as legal fees, planning and consent costs etc.

Canterbury Pipeline
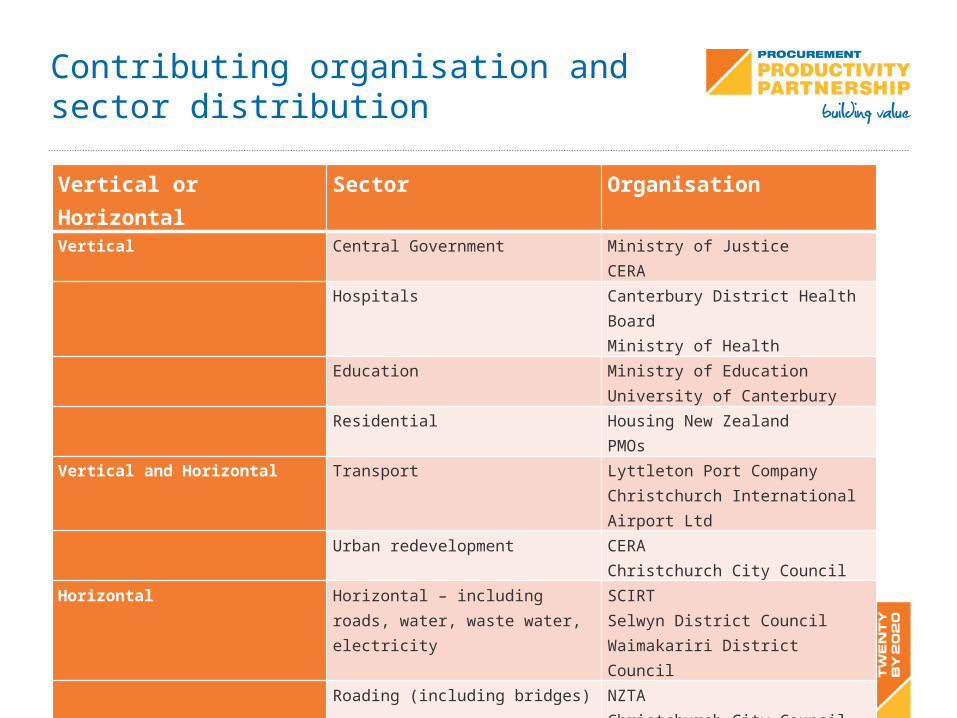
Contributing organisation and sector distribution
Vertical or Horizontal Sector OrganisationVertical Central Government Ministry of Justice
CERA
Hospitals Canterbury District Health BoardMinistry of Health
Education Ministry of EducationUniversity of Canterbury
Residential Housing New ZealandPMOs
Vertical and Horizontal Transport Lyttleton Port CompanyChristchurch International Airport Ltd
Urban redevelopment
CERAChristchurch City Council
Horizontal Horizontal – including roads, water, waste water, electricity
SCIRTSelwyn District CouncilWaimakariri District Council
Roading (including bridges) NZTAChristchurch City CouncilSelwyn District CouncilWaimakariri District Council
Construction Intentions
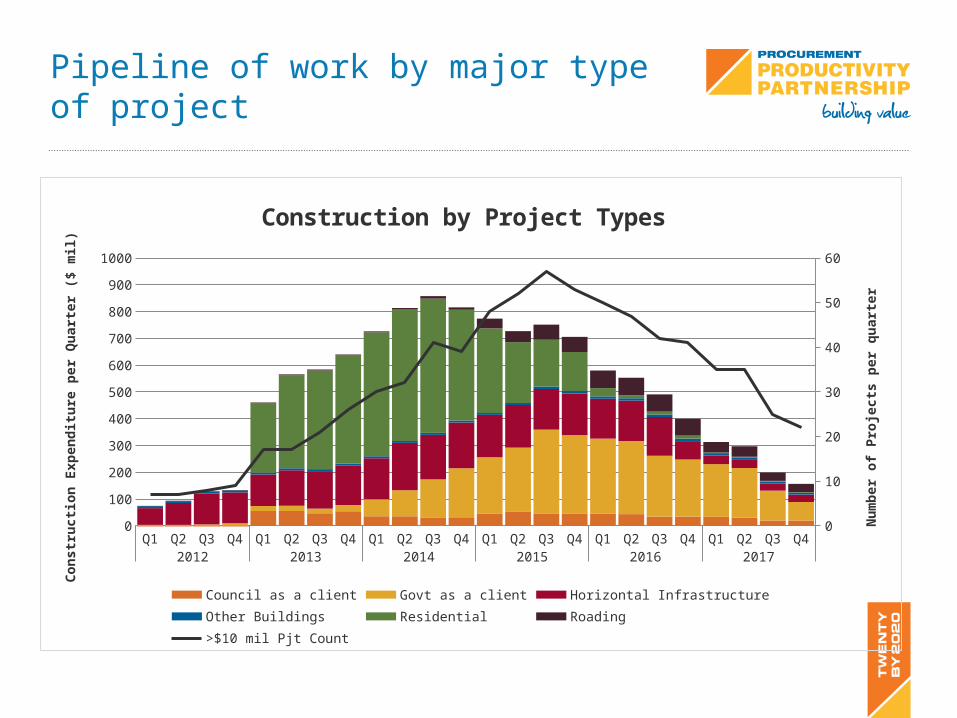
Pipeline of work by major type of project
Q1 Q2 Q3 Q4 Q1 Q2 Q3 Q4 Q1 Q2 Q3 Q4 Q1 Q2 Q3 Q4 Q1 Q2 Q3 Q4 Q1 Q2 Q3 Q42012 2013 2014 2015 2016 2017
0
100
200
300
400
500
600
700
800
900
1000
0
10
20
30
40
50
60
Construction by Project Types
Council as a client Govt as a client Horizontal Infrastructure Other BuildingsResidential Roading >$10 mil Pjt Count
Cons
truc
tion
Expe
nditu
re p
er Q
uart
er ($
mil)
Num
ber o
f Pro
ject
s per
qua
rter
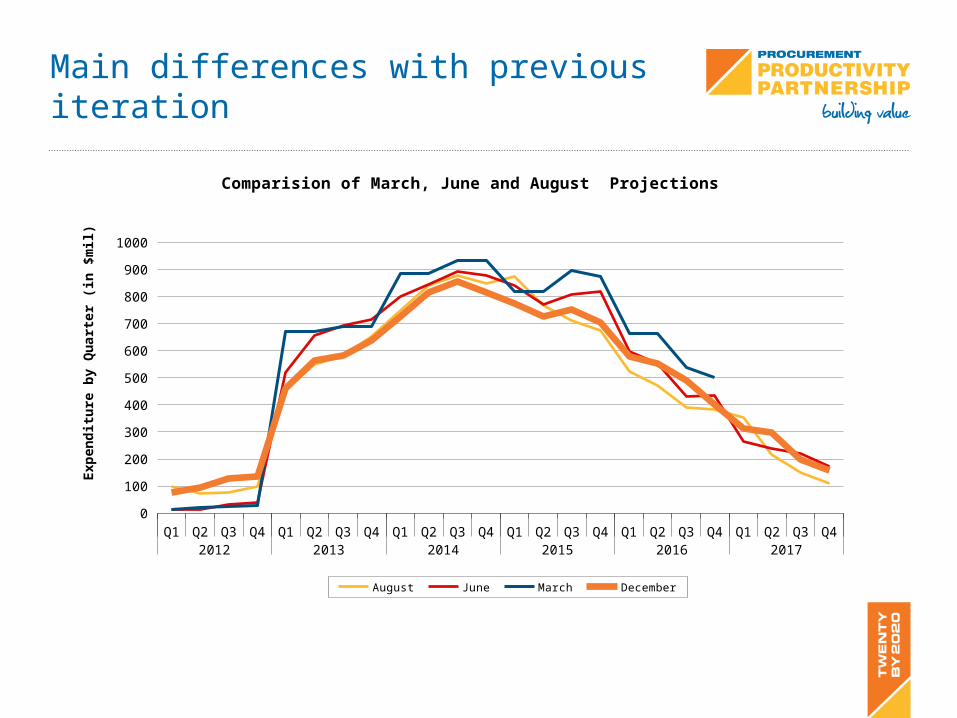
Main differences with previous iteration
Q1 Q2 Q3 Q4 Q1 Q2 Q3 Q4 Q1 Q2 Q3 Q4 Q1 Q2 Q3 Q4 Q1 Q2 Q3 Q4 Q1 Q2 Q3 Q42012 2013 2014 2015 2016 2017
0
100
200
300
400
500
600
700
800
900
1000
Comparision of March, June and August Projections
August June March December
Exp
end
itu
re b
y Q
uar
ter
(in
$m
il)
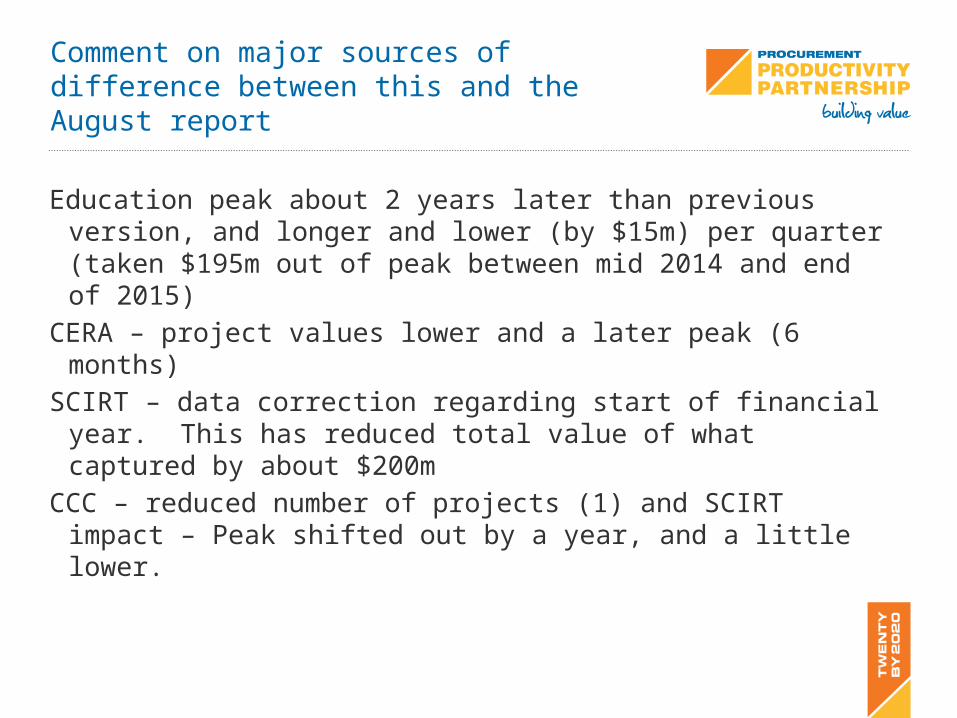
Comment on major sources of difference between this and the August report
Education peak about 2 years later than previous version, and longer and lower (by $15m) per quarter (taken $195m out of peak between mid 2014 and end of 2015)
CERA – project values lower and a later peak (6 months)
SCIRT – data correction regarding start of financial year. This has reduced total value of what captured by about $200m
CCC – reduced number of projects (1) and SCIRT impact – Peak shifted out by a year, and a little lower.
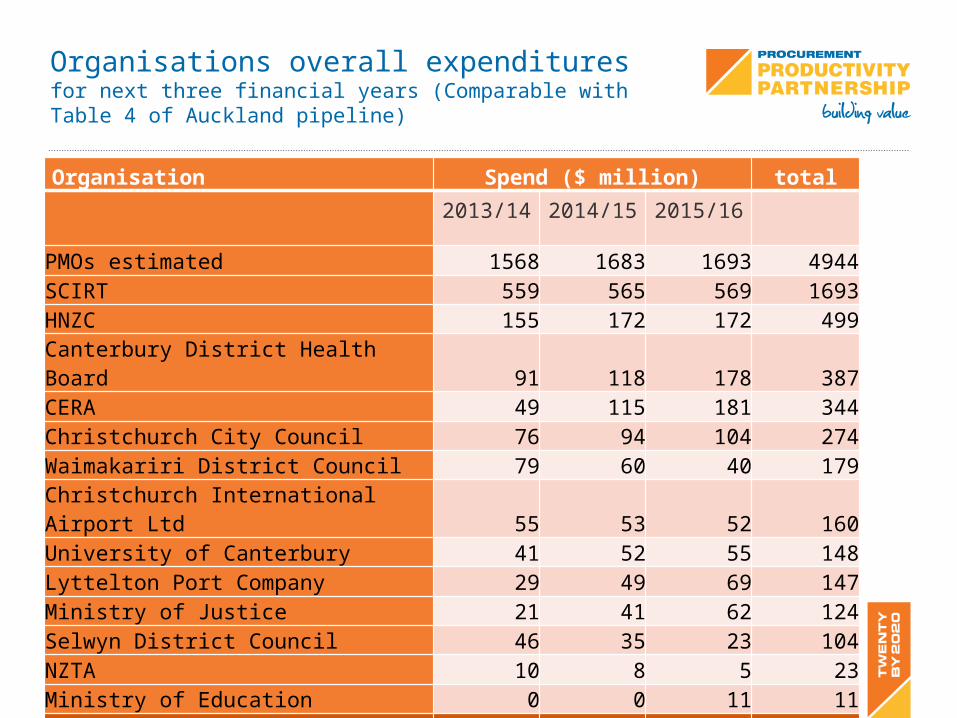
Organisations overall expenditures for next three financial years (Comparable with Table 4 of Auckland pipeline)
Organisation Spend ($ million) total2013/14 2014/15 2015/16
PMOs estimated 1568 1683 1693 4944SCIRT 559 565 569 1693HNZC 155 172 172 499Canterbury District Health Board 91 118 178 387CERA 49 115 181 344Christchurch City Council 76 94 104 274Waimakariri District Council 79 60 40 179Christchurch International Airport Ltd 55 53 52 160University of Canterbury 41 52 55 148Lyttelton Port Company 29 49 69 147Ministry of Justice 21 41 62 124Selwyn District Council 46 35 23 104NZTA 10 8 5 23Ministry of Education 0 0 11 11Total Industry Spend 2763 3037 3213 9013
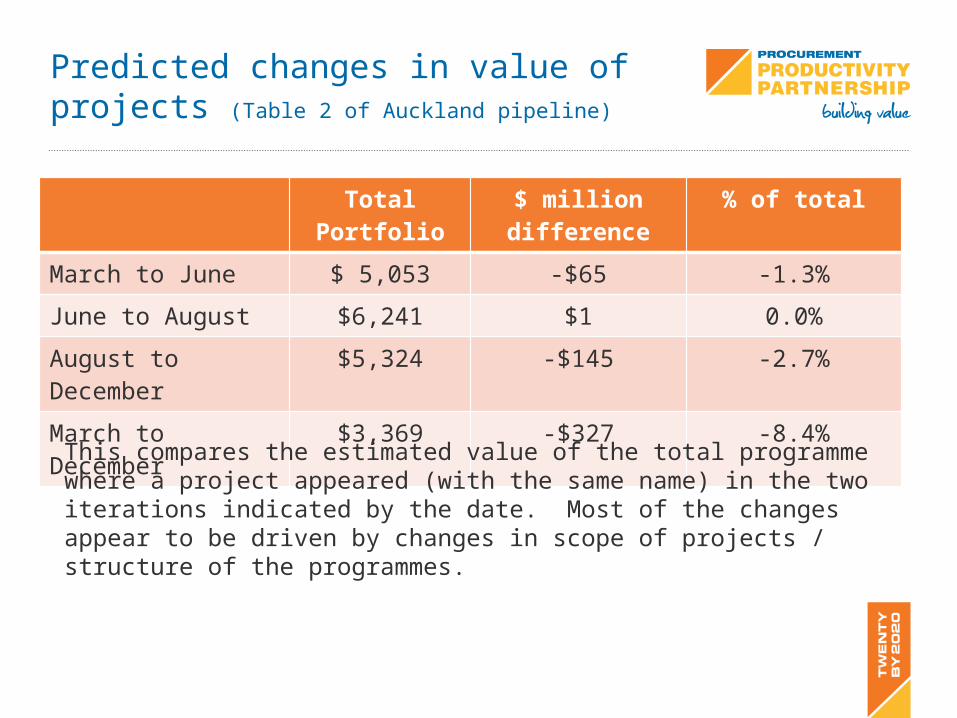
Predicted changes in value of projects (Table 2 of Auckland pipeline)
Total Portfolio $ million difference % of total
March to June $ 5,053 -$65 -1.3%
June to August $6,241 $1 0.0%
August to December $5,324 -$145 -2.7%
March to December $3,369 -$327 -8.4%
This compares the estimated value of the total programme where a project appeared (with the same name) in the two iterations indicated by the date. Most of the changes appear to be driven by changes in scope of projects / structure of the programmes.
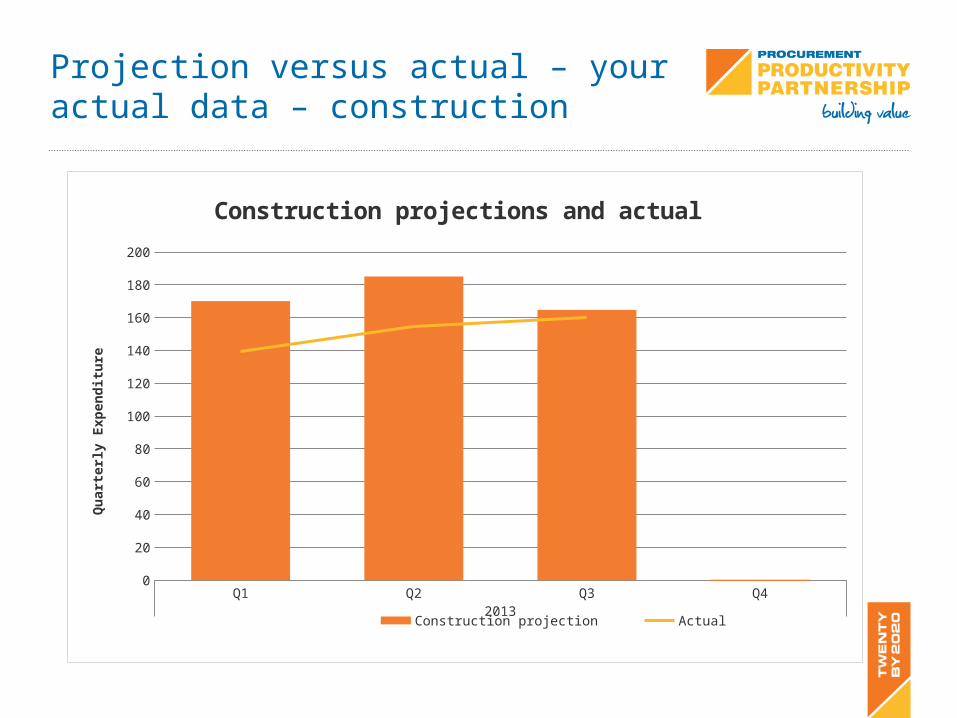
Projection versus actual – your actual data – construction
Q1 Q2 Q3 Q42013
0
20
40
60
80
100
120
140
160
180
200
Construction projections and actual
Construction projection Actual
Qua
rter
ly E
xpen
ditu
re
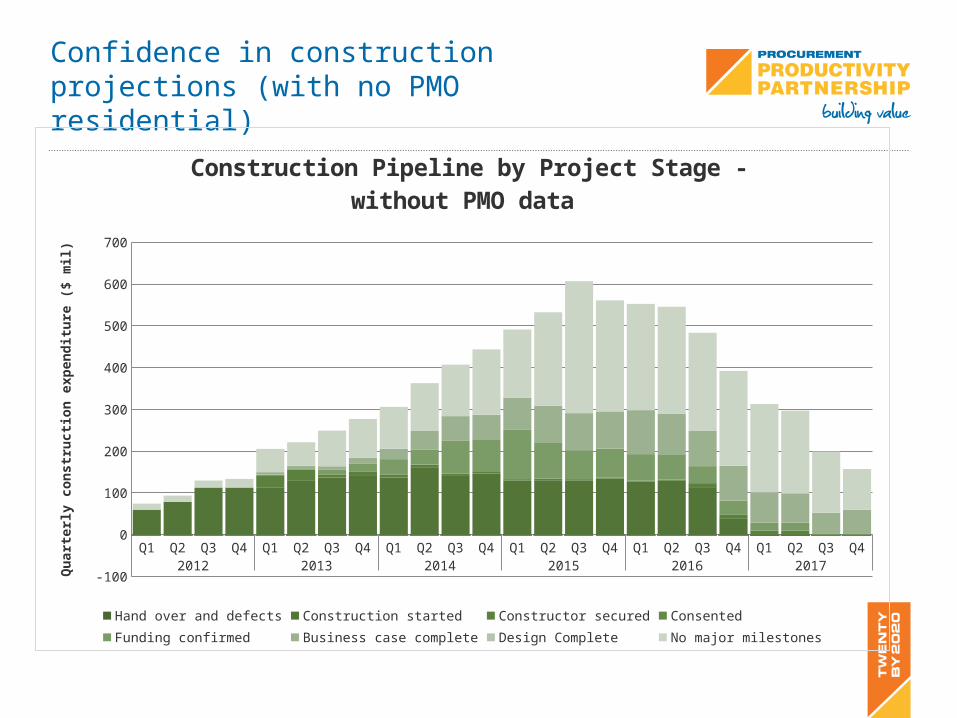
Confidence in construction projections (with no PMO residential)
Q1 Q2 Q3 Q4 Q1 Q2 Q3 Q4 Q1 Q2 Q3 Q4 Q1 Q2 Q3 Q4 Q1 Q2 Q3 Q4 Q1 Q2 Q3 Q42012 2013 2014 2015 2016 2017
-100
0
100
200
300
400
500
600
700
Construction Pipeline by Project Stage - without PMO data
Hand over and defects Construction started Constructor secured ConsentedFunding confirmed Business case complete Design Complete No major milestones
Qua
rter
ly co
nstr
uctio
n ex
pend
iture
($ m
il)
Comparison between this pipeline and the national pipeline forecast for Canterbury
Note different scales – fixed capital formation – so will be higher (by at least 2x)
Also this is annual data so need to multiply this pipeline scales by x4.
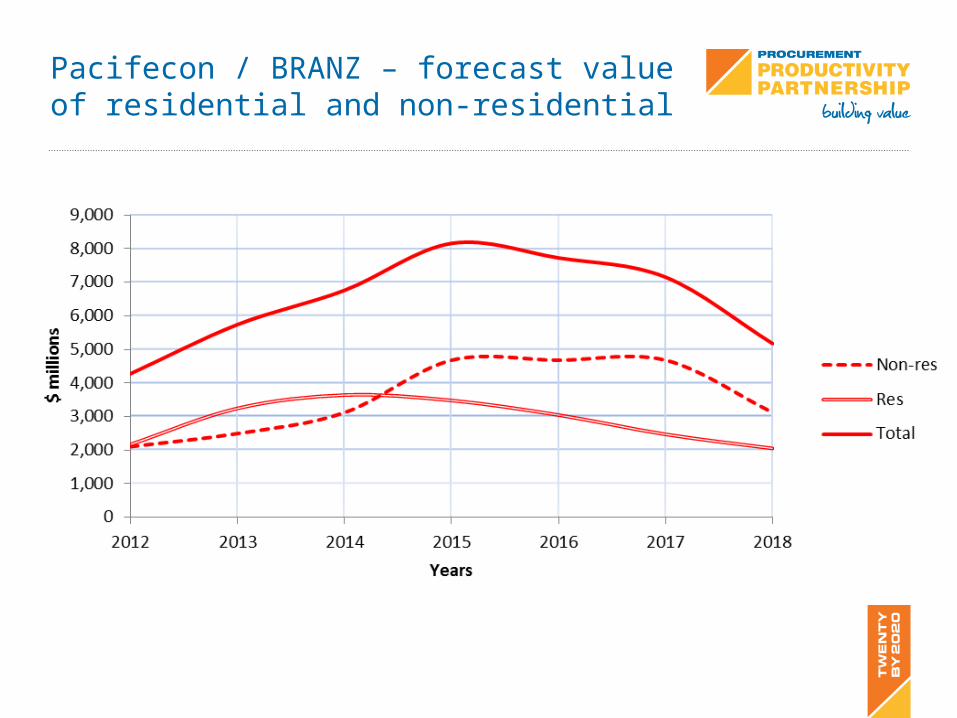
Pacifecon / BRANZ – forecast value of residential and non-residential
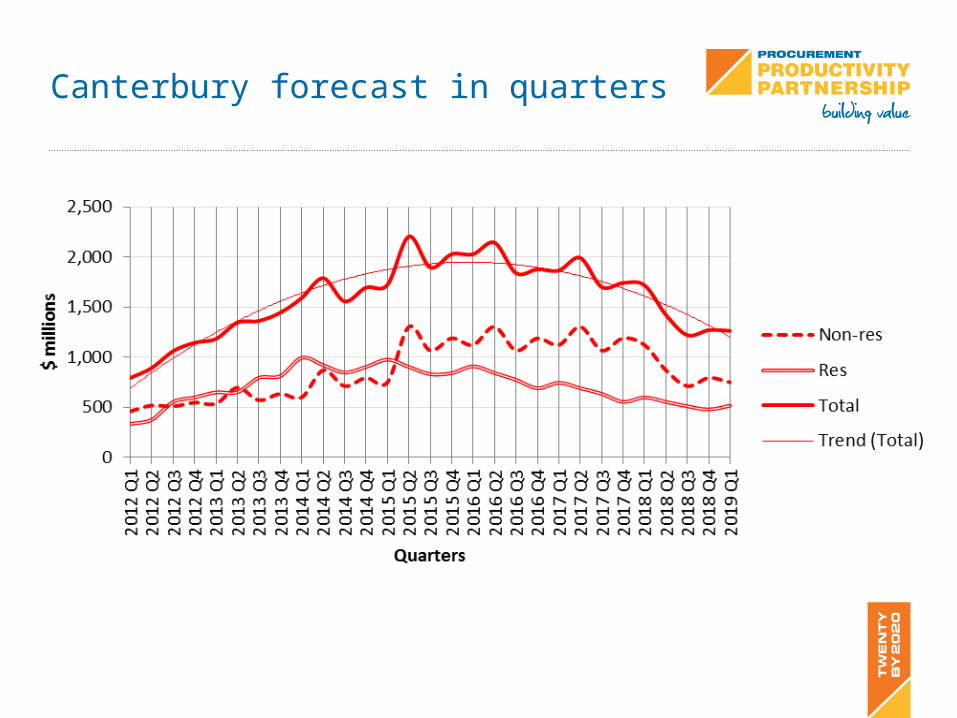
Canterbury forecast in quarters
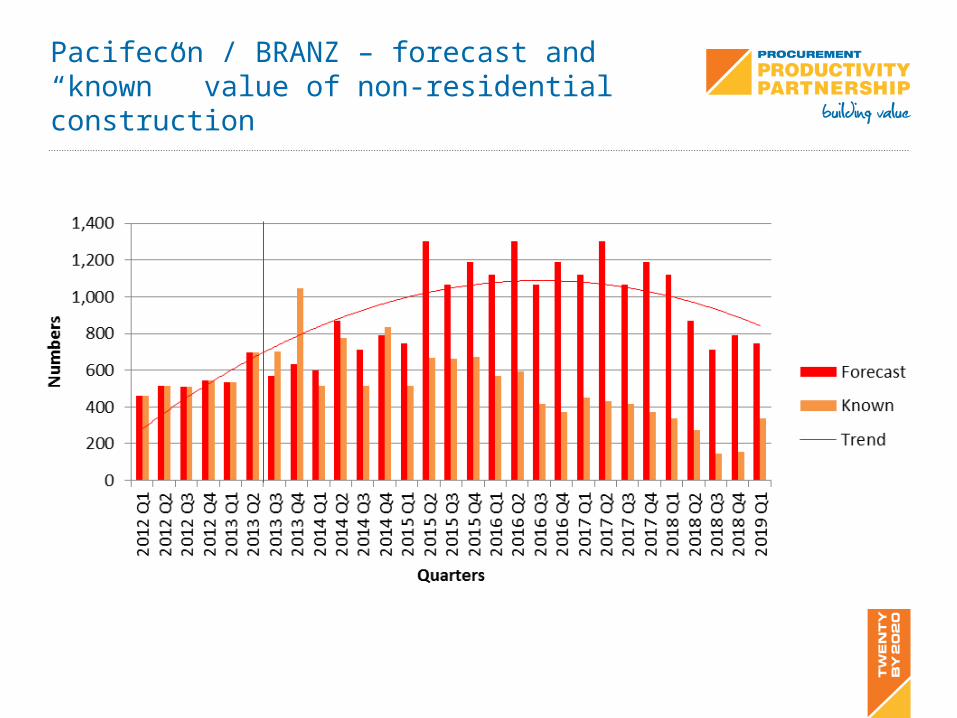
Pacifecon / BRANZ – forecast and “known” value of non-residential construction
Comparison of pipeline with building work put in place
Significant step up in building work put in place for Q3 2013.
Have yet to understand any cost increases on the measured level of activity.
On average the pipeline is explaining about 80% of residential construction observed and about 1/3rd of non-residential building being done.
See previous pipelines for commentary on method for the following two slides.
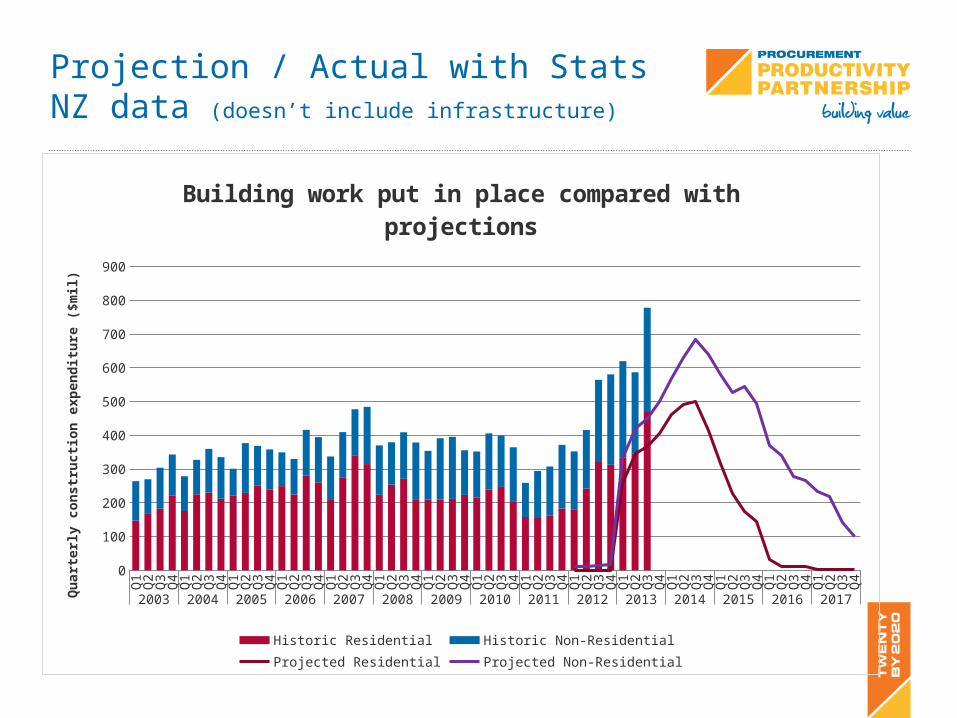
Projection / Actual with Stats NZ data (doesn’t include infrastructure)
Q1
Q2
Q3
Q4
Q1
Q2
Q3
Q4
Q1
Q2
Q3
Q4
Q1
Q2
Q3
Q4
Q1
Q2
Q3
Q4
Q1
Q2
Q3
Q4
Q1
Q2
Q3
Q4
Q1
Q2
Q3
Q4
Q1
Q2
Q3
Q4
Q1
Q2
Q3
Q4
Q1
Q2
Q3
Q4
Q1
Q2
Q3
Q4
Q1
Q2
Q3
Q4
Q1
Q2
Q3
Q4
Q1
Q2
Q3
Q4
2003 2004 2005 2006 2007 2008 2009 2010 2011 2012 2013 2014 2015 2016 2017
0
100
200
300
400
500
600
700
800
900
Building work put in place compared with projections
Historic Residential Historic Non-Residential Projected Residential Projected Non-Residential
Qua
rter
ly co
nstr
uctio
n ex
pend
iture
($m
il)
Implications of this for total pipelineQ
1Q
2Q
3Q
4Q
1Q
2Q
3Q
4Q
1Q
2Q
3Q
4Q
1Q
2Q
3Q
4Q
1Q
2Q
3Q
4Q
1Q
2Q
3Q
4Q
1Q
2Q
3Q
4Q
1Q
2Q
3Q
4Q
1Q
2Q
3Q
4Q
1Q
2Q
3Q
4Q
1Q
2Q
3Q
4Q
1Q
2Q
3Q
4Q
1Q
2Q
3Q
4Q
1Q
2Q
3Q
4Q
1Q
2Q
3Q
4
2003 2004 2005 2006 2007 2008 2009 2010 2011 2012 2013 2014 2015 2016 2017
0
200
400
600
800
1000
1200
1400
1600
1800
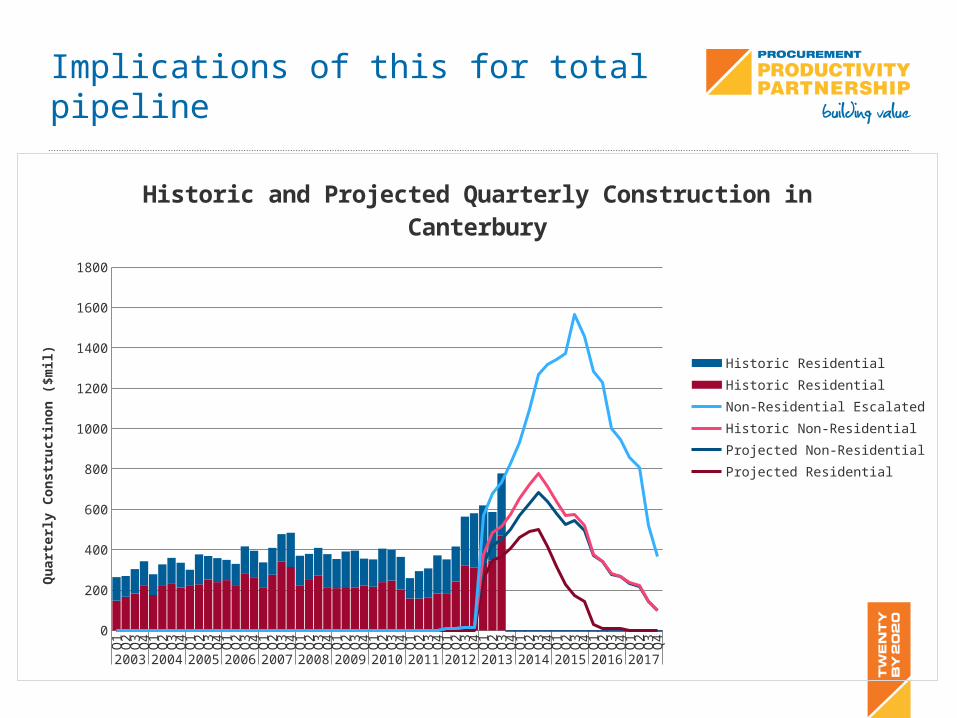
Historic and Projected Quarterly Construction in Canterbury
Historic Non-ResidentialHistoric ResidentialNon-Residential EscalatedResidential ExcalatedProjected Non-ResidentialProjected Residential
Qua
rter
ly C
onst
ructi
non
($m
il)
Understanding the implications of S curve analysis
Previously noted that S curve analysis would affect the shape of the pipeline.
S curve would tend to generate a lower costs at beginning and end of projects and a higher peak in the middle period of a project
Following graph has ‘s curved’ every project – in reality programmes of small projects – eg SCIRT / Residential repairs by PMOs / council programmes of <$10 million may be better represented with straight line analysis
An area for further work
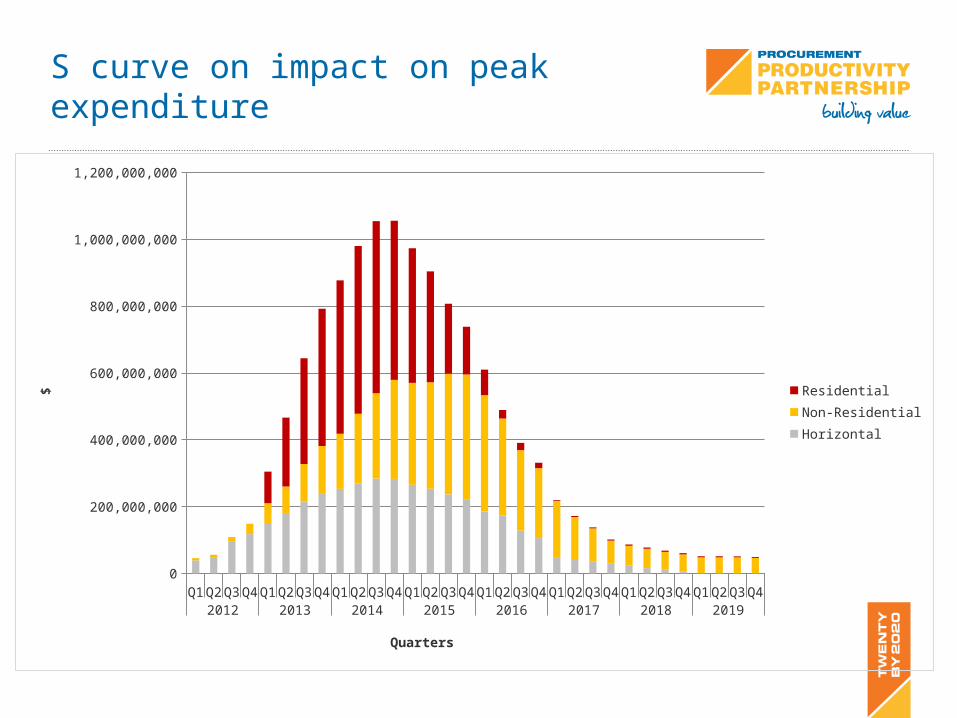
S curve on impact on peak expenditure
Q1 Q2 Q3 Q4 Q1 Q2 Q3 Q4 Q1 Q2 Q3 Q4 Q1 Q2 Q3 Q4 Q1 Q2 Q3 Q4 Q1 Q2 Q3 Q4 Q1 Q2 Q3 Q4 Q1 Q2 Q3 Q42012 2013 2014 2015 2016 2017 2018 2019
0
200,000,000
400,000,000
600,000,000
800,000,000
1,000,000,000
1,200,000,000
ResidentialNon-ResidentialHorizontal
Quarters
$
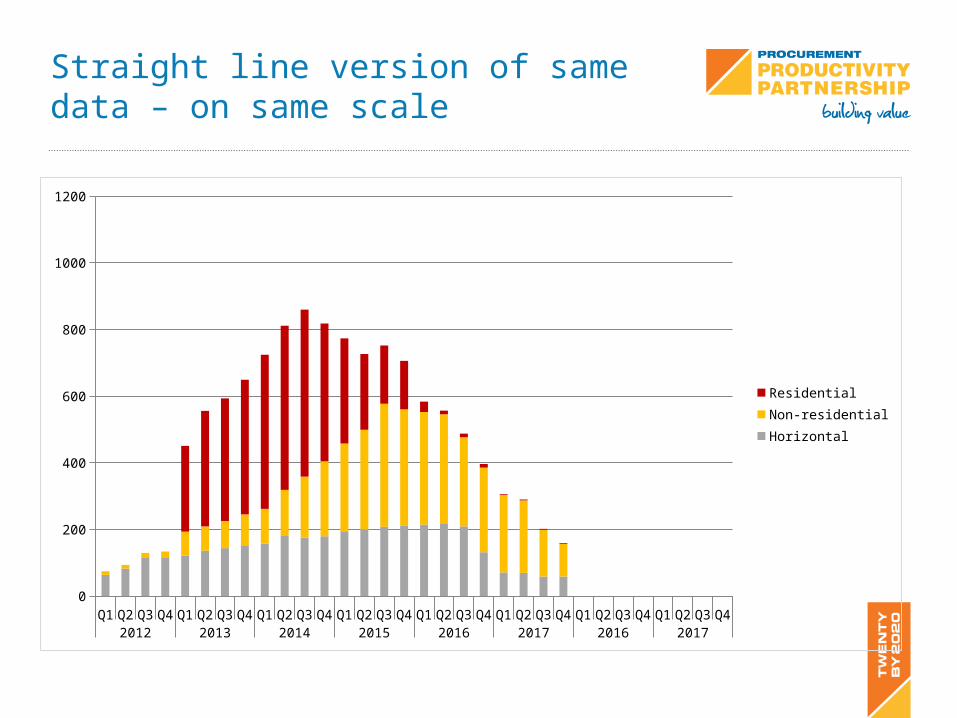
Straight line version of same data – on same scale
Q1 Q2 Q3 Q4 Q1 Q2 Q3 Q4 Q1 Q2 Q3 Q4 Q1 Q2 Q3 Q4 Q1 Q2 Q3 Q4 Q1 Q2 Q3 Q4 Q1 Q2 Q3 Q4 Q1 Q2 Q3 Q42012 2013 2014 2015 2016 2017 2016 2017
0
200
400
600
800
1000
1200
ResidentialNon-residentialHorizontal
Structure of the programme based on value of projects
The following graphs are comparable with the Auckland pipeline
They are designed to demonstrate what value of work falls within low / medium and high price bands
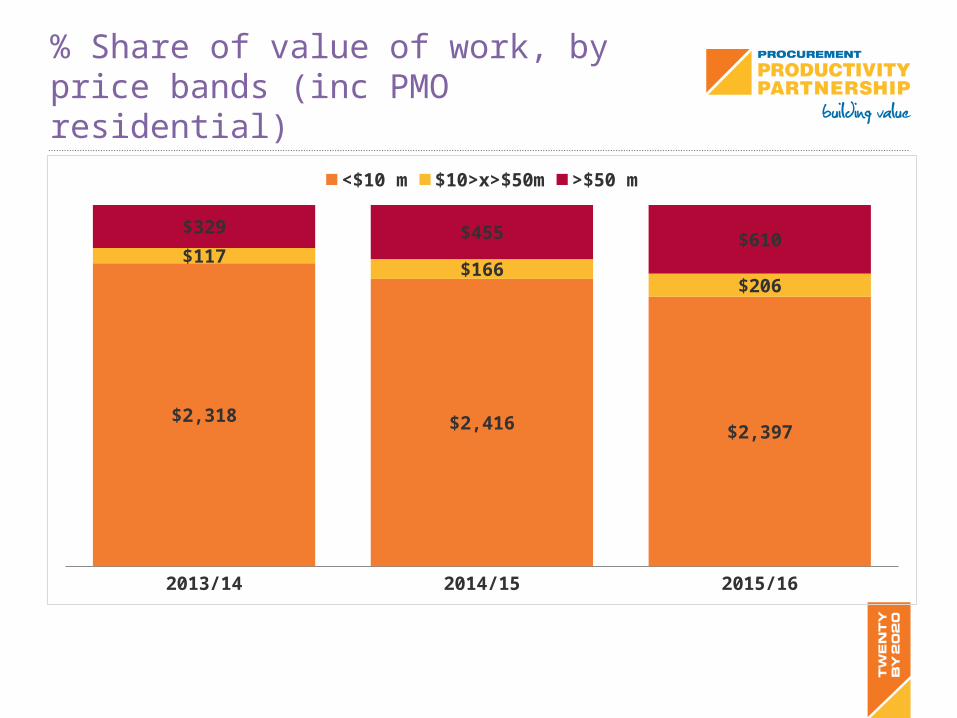
% Share of value of work, by price bands (inc PMO residential)
2013/14 2014/15 2015/16
$2,318 $2,416 $2,397
$117 $166
$206
$329 $455 $610
<$10 m $10>x>$50m >$50 m
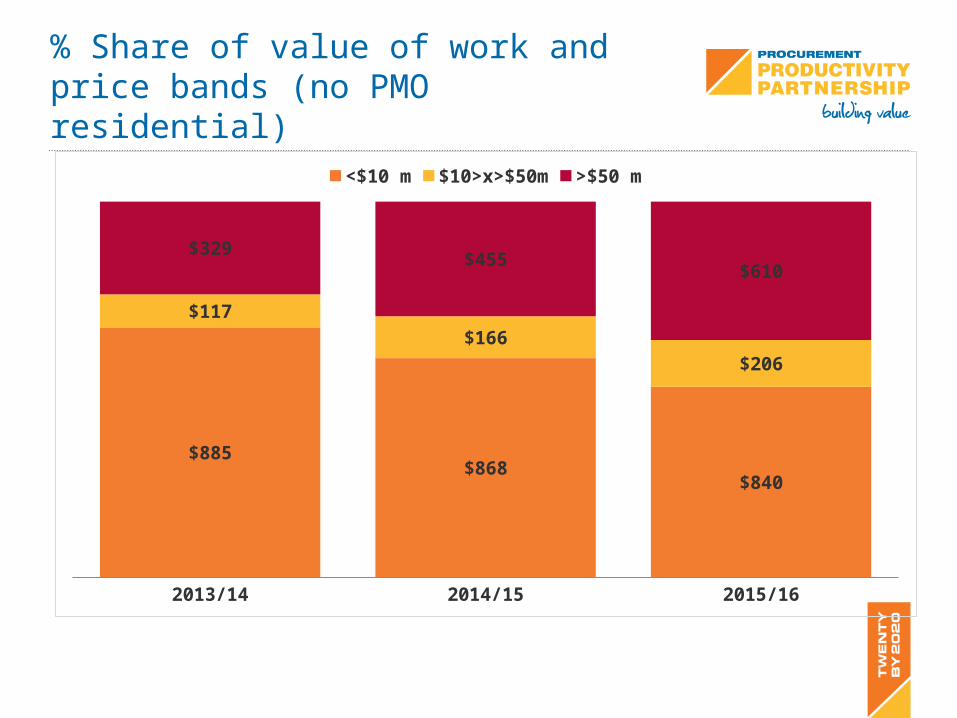
% Share of value of work and price bands (no PMO residential)
2013/14 2014/15 2015/16
$885 $868
$840
$117 $166
$206
$329 $455
$610
<$10 m $10>x>$50m >$50 m
Gantt chart analysis
These slides represent how project start dates / durations have changed across the programme.
The first slide sorts the projects by start date for construction and shows whether / how the start date has changed (and associated value in the project has changed)
Red = previous construction phase
Blue = new construction phase
Purple = construction phases overlap / no change
Interpretation
More red to the left - the more the projects have been delayed (if matched by blue – construction deferred – if not construction time contracted
The more purple – the more the project specifications haven’t changed
More blue to the left – projects start have been brought forward.
Left had column -
Darker blue = more increase in estimated cost of project
Darker red = more decrease in estimated cost of project
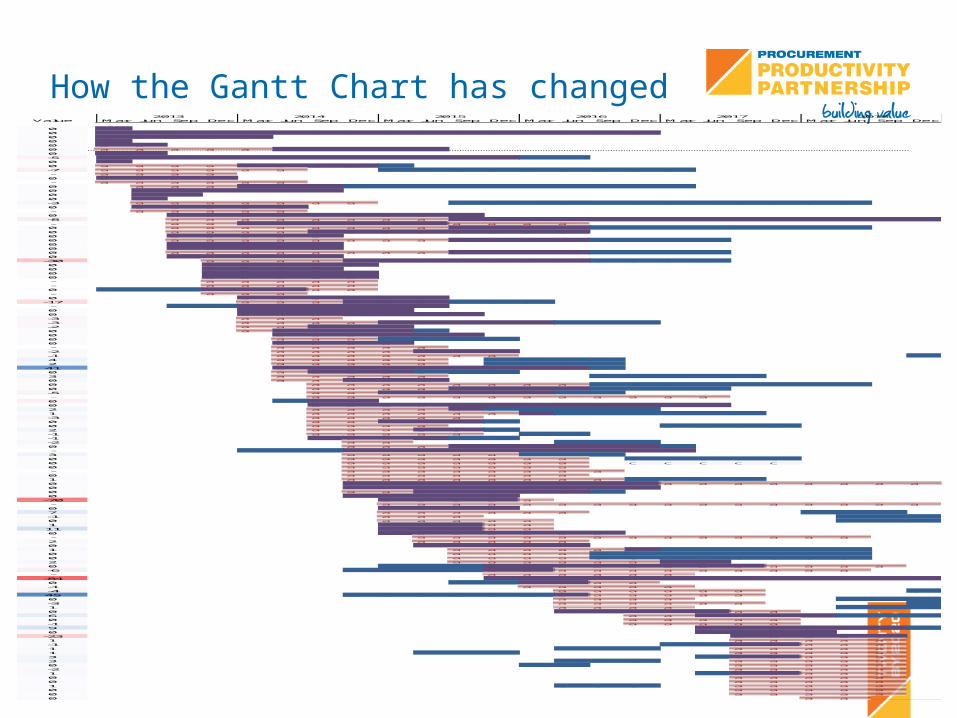
How the Gantt Chart has changedValue Mar Jun Sep Dec Mar Jun Sep Dec Mar Jun Sep Dec Mar Jun Sep Dec Mar Jun Sep Dec Mar Jun Sep Dec
0 bb0 bb b b b b b b b b b b b b b b b0 bb b b b b0 bb0 bb b0 aa a a a a b b b b b0 bb b-5 b b b b b b b b b b b b c c0 b0 a a a a b b b b c-7 a a a a a a c c c c c c c c c- a a a a0 b b b b- a a a a a a0 a a a b b b c c c c c c c c c c0 b b b b b b0 b b0 b-3 a a a a a a a c c c c c c c c c c c c0 b b b b b- a a a a a0 b b b b b b b b b-8 a a a a a a a a b b b b b b b b b b b b b b- a a b b b b b b a a a a0 a a a a a a a a b b b b c c c c c c c c0 a a a a b b b b b b b b0 b b b b b0 a a a a a a a a b b b b c c c c0 b b b b b0 b b b b b0 a a a a a a a a b b b b c c c c0 b b b b b
-30 a a a a b b b b b b b c c c c0 b b b b b0 b b b b0 b b b b b0 b b b b b- a a a a a- a a a a a0 c c c b b b a a- a a a0 b b b b b b
-17 a a a b b b c c c- c c b b b b b b0 b b b b b0 b b b b b b b-3 a a a-3 a a a a b b b b b c c c-2 a a b b b0 a b b b b c0 b b b b b b0 a a a c c c c0 b b b b- a a a a a-2 a a a a b b b-1 a a a a a a a c4 a a a a a c c c c2 a a a a a c c c c41 b b b b b b b b b c0 a b b b c c c3 a a a a a c c c c c0 a a b b b0 a a a a a a a a c c c c c c c c0 a a a a b b b b c c c c-5 a a b b b b b c c- a a a a a a a a a a a a0 c b b0 b b b b b b b b b b b b2 a a a a b c c c c c1 a a a a a a b c c c c c c-3 a a a a a0 a a b b b c0 a a a a c c c c2 a a a b b c-1 a a a a a c c-1 c b b b c c-2 a a c c c0 a a a b b b b b b c- c c c b b b b b b b b b b3 a a a a a c c c0 a a a a a a a c c c c c0 a a a a a a a c c c c c0 a a a a a a a- a a a a a a a a0 a a a a a a a1 a a a a a a a a c c c c0 b b b b b b b b b a a a a a a a a0 b b b b b b b b b0 a a b b b b b c0 b b b b b
-70 b b b b a- a a a a a a a a a a a a a a a a0 b b b b7 a a a a a a c c c-1 a a a c c c0 a a a a a c c c1 b b b a a11 b b b a a0 b b b b b b b- a a a a a a a a a a a a a2 a a a a a0 b b b b b1 a a a a a b c c c c c c0 a a a a c c c c c c c c0 a a a a c c c c c c c c2 a a a a a a b b0 c c c b b b b b b b b a a a a-6 c c c c b b a a a a a a a a a- a a a a a a
-84 b b b b b b b b b b b b b0 c c b b a a-1 a a a a a-4 a a a a a a c45 c c c c c c b a a a a a0 a a a a c c c-3 a a a a a a c1 a a a a c c c0 b b b b b a a6 a a b b b b c c c0 a a a a a-1 a a a a a9 b b b b b b c0 b b b b
-23 b b b b b1 a a a a a-1 c c b b a a a1 c c c a a a a a1 c c c a a a a a3 c b b a a a3 c c c a a a a a0 c c a a a a a-2 a a a a a1 c b b a a a0 a a a a a0 a a a a a1 c c c a a a a a0 a a a a a0 a a a a a0 a a
2013 2014 2015 2016 2017 2018
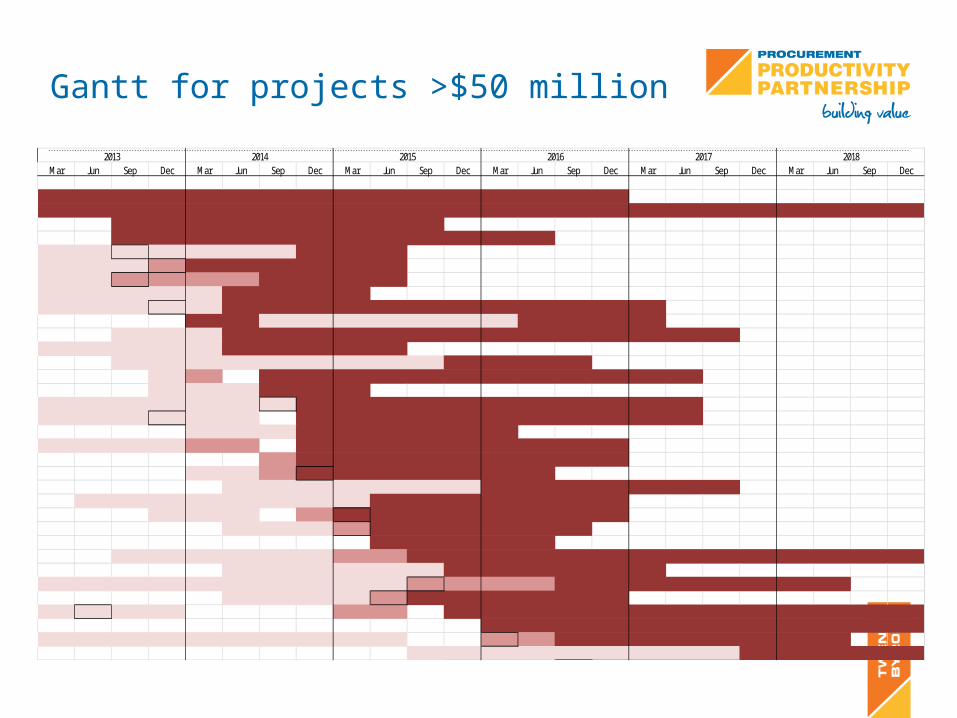
Gantt for projects >$50 million
Mar Jun Sep Dec Mar Jun Sep Dec Mar Jun Sep Dec Mar Jun Sep Dec Mar Jun Sep Dec Mar Jun Sep Dec
C C C C C C C C C C C C C C C CC C C C C C C C C C C C C C C C C C C C C C C C
C C C C C C C C CC C C C C C C C C C C C
D D DA D D D D C C CD D D TA C C C C C CD D TA T T T C C C CD D D D D C C C CD D D DA D C C C C C C C C C C C C
C C D D D D D D D C C C CD D D C C C C C C C C C C C C C C
D D D D D C C C C CD D D D D D D D D C C C C
D T C C C C C C C C C C C CD D D C C C
D D D D D D DA C C C C C C C C C C CD D D DA D D C C C C C C C C C C C
D D D C C C C C CD D D D T T C C C C C C C C C
T C C C C C C C C CD D T CA C C C C C C
D D D D D D D C C C C C C CD D D D D D D D C C C C C C C
D D D T CA C C C C C C CD D D TA C C C C C C
C C C C CD D D D D D T T C C C C C C C C C C C C C C
D D D D D D C C C C C CD D D D D D D D D D TA T T T C C C C C C C C
D D D D TA C C C C C CD DA D D T T C C C C C C C C C C C C C
C C C C C C C C C C C CD D D D D D D D D D TA T C C C C C C C C
D D D D D D D D D C C C C C
20182013 2014 2015 2016 2017
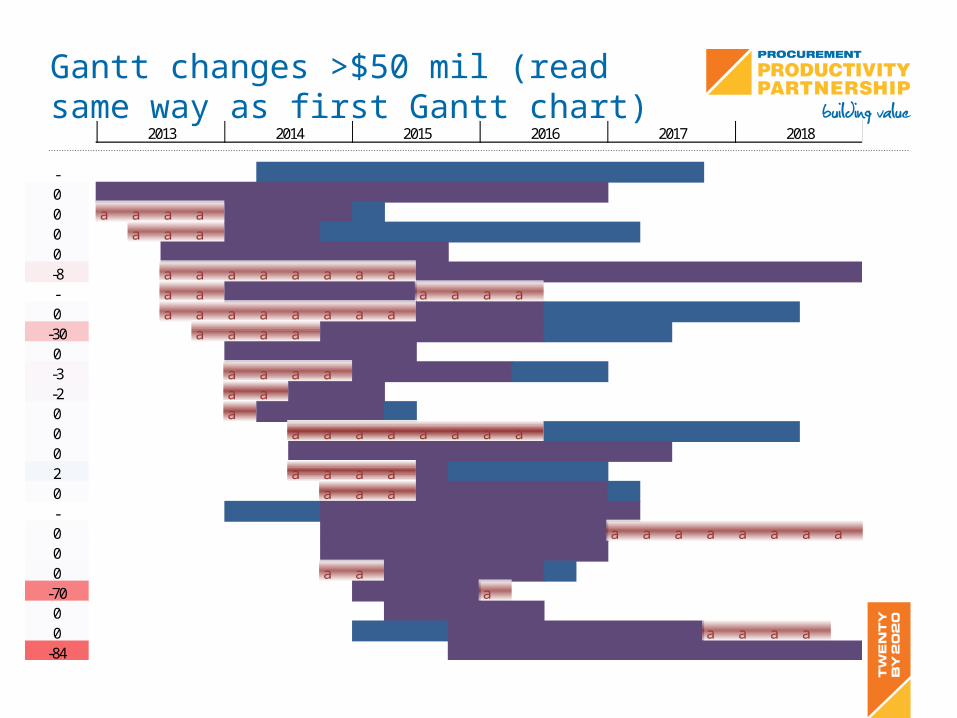
Gantt changes >$50 mil (read same way as first Gantt chart)
Value Mar Jun Sep Dec Mar Jun Sep Dec Mar Jun Sep Dec Mar Jun Sep Dec Mar Jun Sep Dec Mar Jun Sep Dec
- c c c c c c c c c c c c c c0 bb b b b b b b b b b b b b b b b0 a a a a b b b b c0 a a a b b b c c c c c c c c c c0 b b b b b b b b b-8 a a a a a a a a b b b b b b b b b b b b b b- a a b b b b b b a a a a0 a a a a a a a a b b b b c c c c c c c c
-30 a a a a b b b b b b b c c c c0 b b b b b b-3 a a a a b b b b b c c c-2 a a b b b0 a b b b b c0 a a a a a a a a c c c c c c c c0 b b b b b b b b b b b b2 a a a a b c c c c c0 a a a b b b b b b c- c c c b b b b b b b b b b0 b b b b b b b b b a a a a a a a a0 b b b b b b b b b0 a a b b b b b c
-70 b b b b a0 b b b b b0 c c c b b b b b b b b a a a a
-84 b b b b b b b b b b b b b
2013 2014 2015 2016 2017 2018
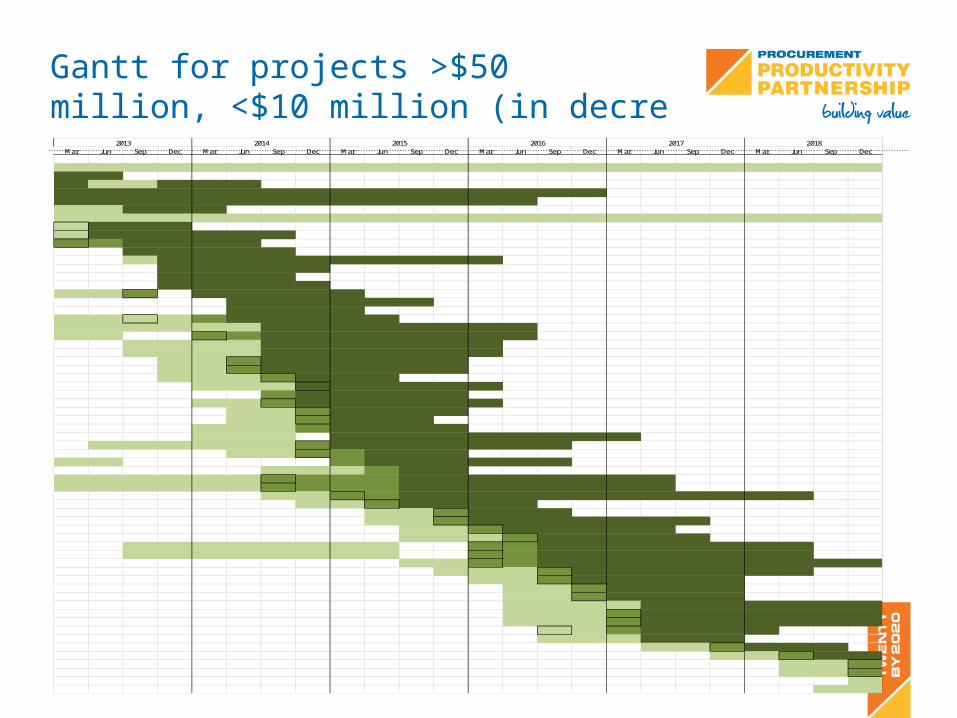
Gantt for projects >$50 million, <$10 million (in decre
Mar Jun Sep Dec Mar Jun Sep Dec Mar Jun Sep Dec Mar Jun Sep Dec Mar Jun Sep Dec Mar Jun Sep Dec
D D D D D D D D D D D D D D D D D D D D D D D DC CC D D C C CC C C C C C C C C C C C C C C CC C C C C C C C C C C C C CD D C C CD D D D D D D D D D D D D D D D D D D D D D D DDA C C CDA C C C C C CTA T C C C C
C C C C CD C C C C C C C C C C
C C C C CC C C CC C C C C
D D TA C C C C CC C C C C CC C C C
D D DA D T C C C C CD D D D D D C C C C C C C CD D TA T C C C C C C C C
D D D D C C C C C C CD D D D C C C C C C C
D D TA C C C C C CD D TA C C C C C CD D D TA C C C
D D D CA C C C C CT C C C C C
D D TA C C C C C CD D TA C C C CD D TA C C C
D D D T C C C CD D D C C C C C C C C C
D D D D D D TA C C C C C C CD D TA T C C C
D D T C C C C C CD D D T C C
D D D D D D TA T T T C C C C C C C CD D D D D D TA T T T C C C C C C C C
D D TA T C C C C C C C C C C C CD D TA C C C C
D D TA C C CD D TA C C C C C C C
D D TA C C C C CD D D TA C C C C C
D D D D D D D D TA T C C C C C C C CD D D D D D D D TA T C C C C C C C C
D D TA T C C C C C C C C C CD D D TA C C C C C C C
D D TA C C C C CD D TA C C C CD D TA C C C CD D D D C C C C C C CD D D TA C C C C C C CD D D TA C C C C C C C
DA D T C C C CD D D C C C
D D TA C C CD D TA C C
D D TAD D TA
DD D
20182013 2014 2015 2016 2017
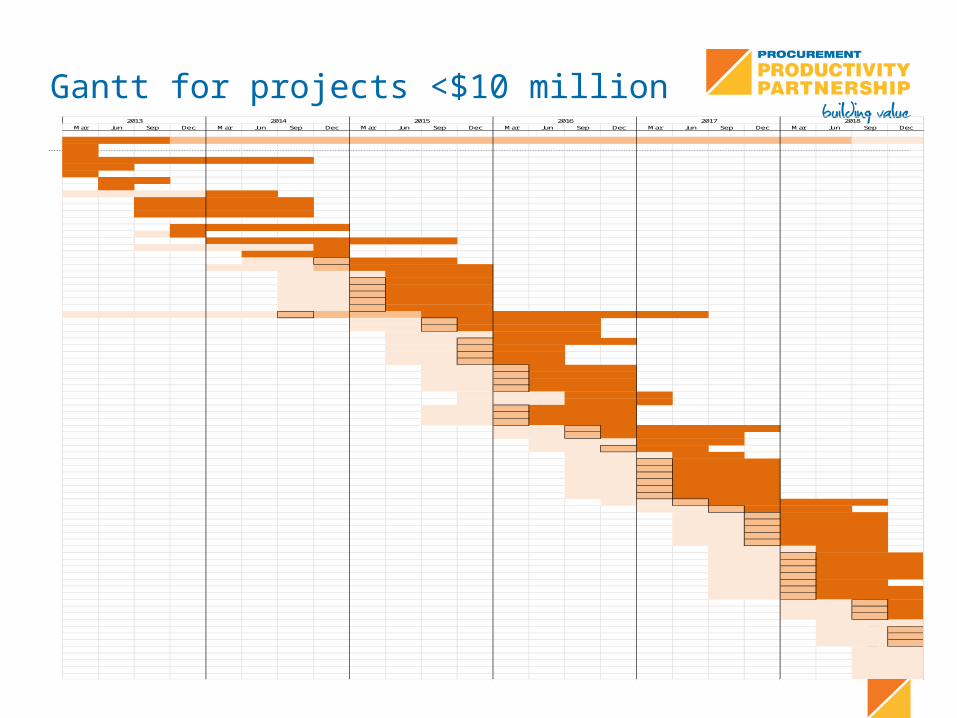
Gantt for projects <$10 millionMar Jun Sep Dec Mar Jun Sep Dec Mar Jun Sep Dec Mar Jun Sep Dec Mar Jun Sep Dec Mar Jun Sep Dec
C C C T T T T T T T T T T T T T T T T T T T D DCCC C C C C C CC CC
C CC
D D D D C CC C C C CC C C C CC C C C C
C C C C CD C
C C C C C C CD D D D D C
C C CD D TA C C C
D D D T C C C CD D D C C CD D TA C C CD D TA C C CD D TA C C CD D TA C C CD D TA C C C
D D D D D D TA T T T C C C C C C C CD D TA C C C CD D TA C C C C
D D D C C CD D TA C C C CD D TA C CD D TA C CD D TA C C
D D TA C C CD D TA C C CD D TA C C CD D TA C C C
D D D C C CD D D C C C
D D TA C C CD D TA C C CD D TA C C C
D D TA C C C C CD D TA C C C C
D D D C C CD D TA C C
D D D C CD D TA C C CD D TA C C CD D TA C C CD D TA C C CD D TA C C CD D TA C C C
D D TA C C C C CD D TA C C C
D D TA C C CD D TA C C CD D TA C C CD D TA C C CD D TA C C C
D D D C CD D TA C C CD D TA C C CD D TA C C CD D TA C C CD D TA C CD D TA C C CD D TA C C C
D D TA CD D TA CD D TA C
D D DD D TAD D TAD D TA
D DD DD DD DD D
20182013 2014 2015 2016 2017

Design Intentions
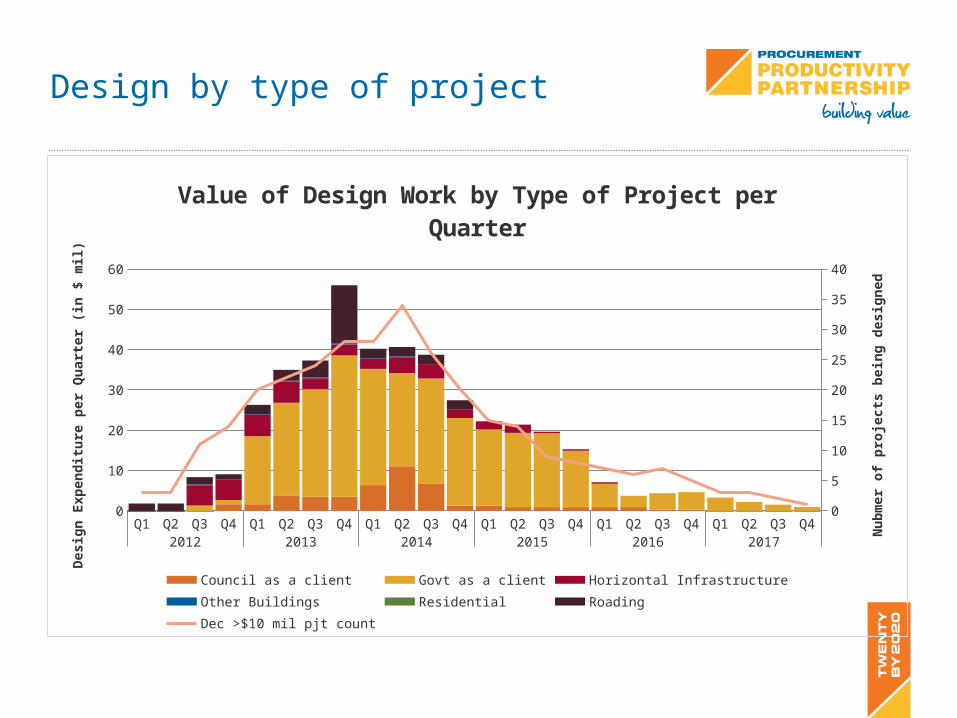
Design by type of project
Q1 Q2 Q3 Q4 Q1 Q2 Q3 Q4 Q1 Q2 Q3 Q4 Q1 Q2 Q3 Q4 Q1 Q2 Q3 Q4 Q1 Q2 Q3 Q42012 2013 2014 2015 2016 2017
0
10
20
30
40
50
60
0
5
10
15
20
25
30
35
40
Value of Design Work by Type of Project per Quarter
Council as a client Govt as a client Horizontal Infrastructure Other BuildingsResidential Roading Dec >$10 mil pjt count
Desig
n Ex
pend
iture
per
Qua
rter
(in
$ m
il)
Nub
mer
of p
roje
cts b
eing
des
igne
d
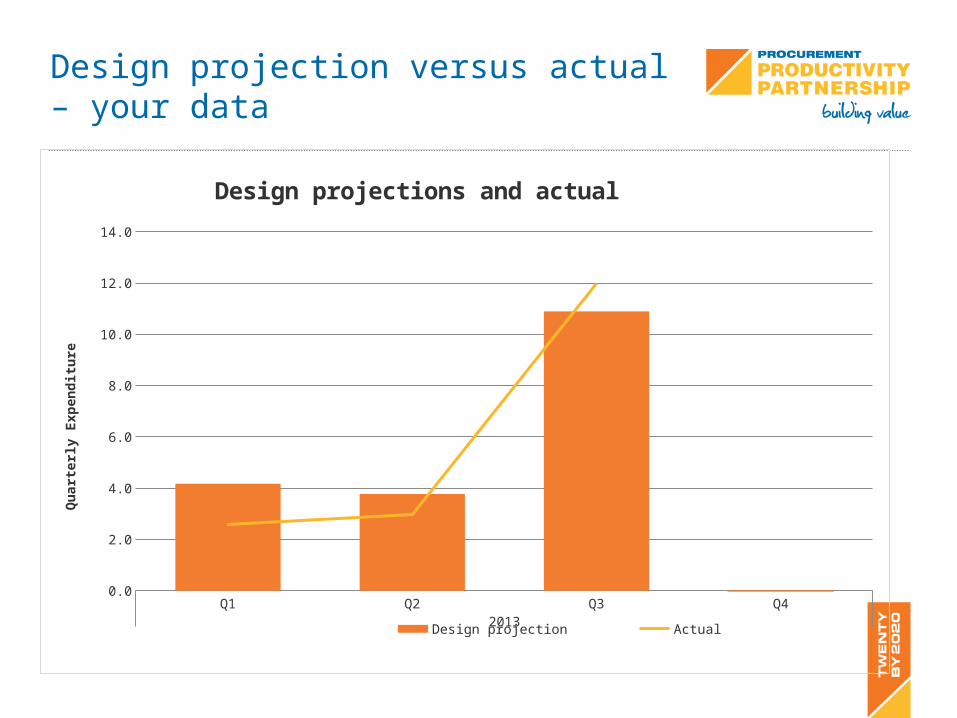
Design projection versus actual – your data
Q1 Q2 Q3 Q42013
0.0
2.0
4.0
6.0
8.0
10.0
12.0
14.0
Design projections and actual
Design projection Actual
Qua
rter
ly E
xpen
ditu
re
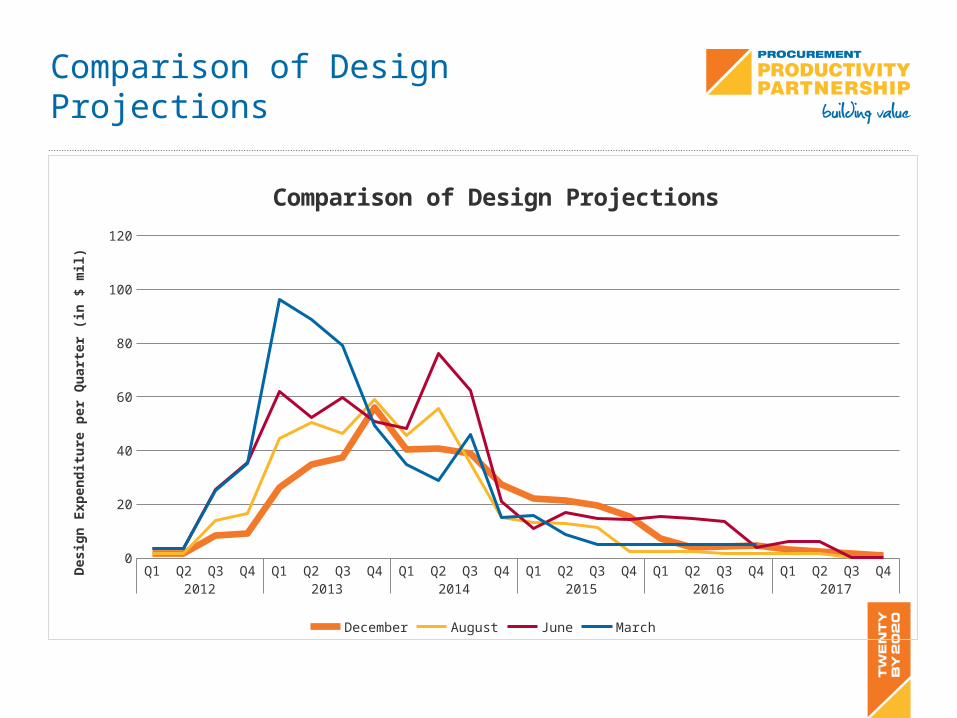
Comparison of Design Projections
Q1 Q2 Q3 Q4 Q1 Q2 Q3 Q4 Q1 Q2 Q3 Q4 Q1 Q2 Q3 Q4 Q1 Q2 Q3 Q4 Q1 Q2 Q3 Q42012 2013 2014 2015 2016 2017
0
20
40
60
80
100
120
Comparison of Design Projections
December August June March
Desig
n Ex
pend
iture
per
Qua
rter
(in
$ m
il)
Comment on differences in design pipeline
‘Design peak’ remains about the same in terms of value and timing
Design peak continues to be at about the same time as reporting the data
Design has a higher value and longer “tail” than previous versions
Over all value of design work declined – consistent with the reduction in construction work.
Some of reduction in the design pipeline due to • reduction in scope / total value of projects (as seen in the construction
pipeline)• reduction in design intention data provided by some clients
But actual indicates that even this revised pipeline looks optimistic – although more consistent than the first version of this data

Tender / Procurement Intentions
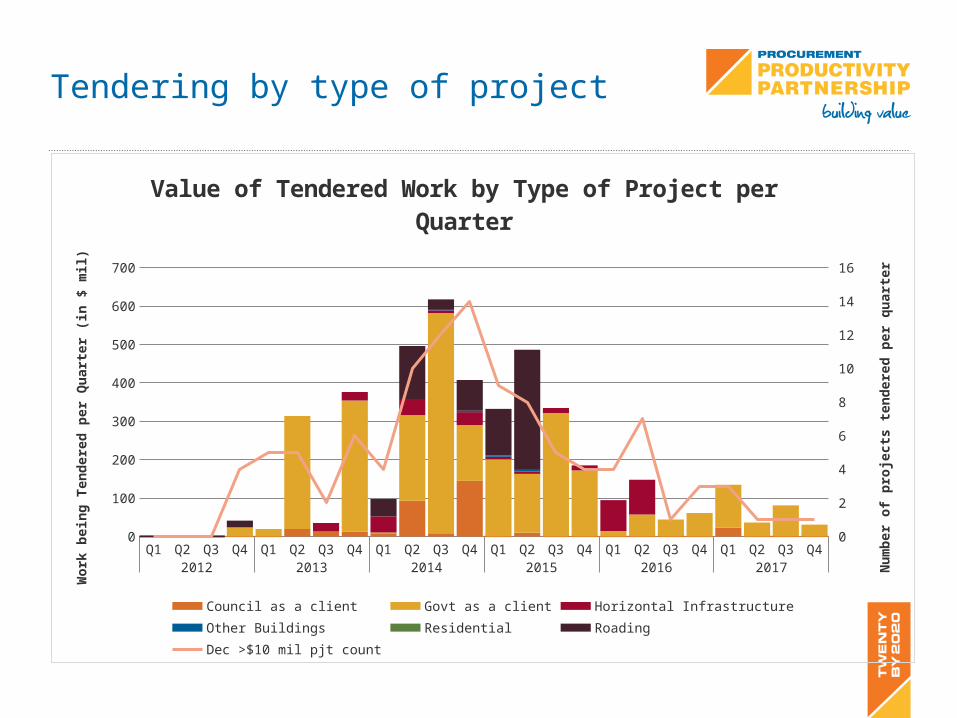
Tendering by type of project
Q1 Q2 Q3 Q4 Q1 Q2 Q3 Q4 Q1 Q2 Q3 Q4 Q1 Q2 Q3 Q4 Q1 Q2 Q3 Q4 Q1 Q2 Q3 Q42012 2013 2014 2015 2016 2017
0
100
200
300
400
500
600
700
0
2
4
6
8
10
12
14
16
Value of Tendered Work by Type of Project per Quarter
Council as a client Govt as a client Horizontal Infrastructure Other BuildingsResidential Roading Dec >$10 mil pjt count
Wor
k be
ing
Tend
ered
per
Qua
rter
(in
$ m
il)
Num
ber o
f pro
ject
s ten
dere
d pe
r qua
rter
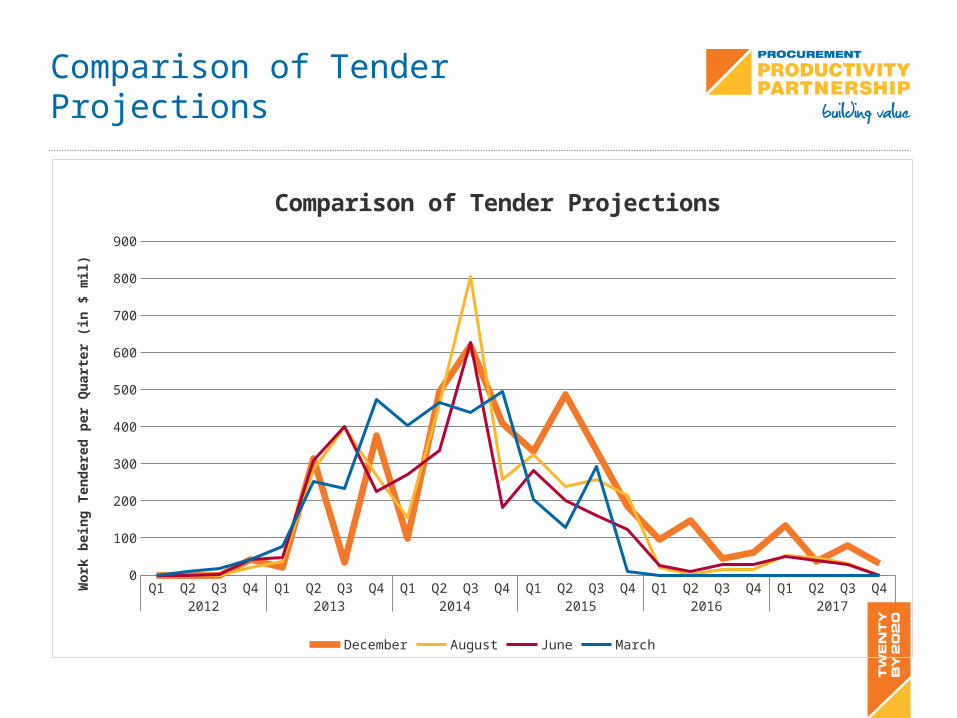
Comparison of Tender Projections
Q1 Q2 Q3 Q4 Q1 Q2 Q3 Q4 Q1 Q2 Q3 Q4 Q1 Q2 Q3 Q4 Q1 Q2 Q3 Q4 Q1 Q2 Q3 Q42012 2013 2014 2015 2016 2017
0
100
200
300
400
500
600
700
800
900
Comparison of Tender Projections
December August June March
Wor
k be
ing
Tend
ered
per
Qua
rter
(in
$ m
il)
Comments on tender / procurement pipeline
This pipeline will always be lumpy because concentrates value of projects into shorter timeframes
Peak in mid June 2014 in part driven by a small number of very high value projects
Been some redistribution of procurement activity from late 2013 to early 2015 over the year of data – consistent with the delays in completing design work


