Canola Oil and Meal Applications
Australian Oilseeds Federation Forum
Eden on the Park HotelOctober 11, 2006. Melbourne
Dr. Dave HicklingVice President, Canola Utilization
Canola Council of Canada
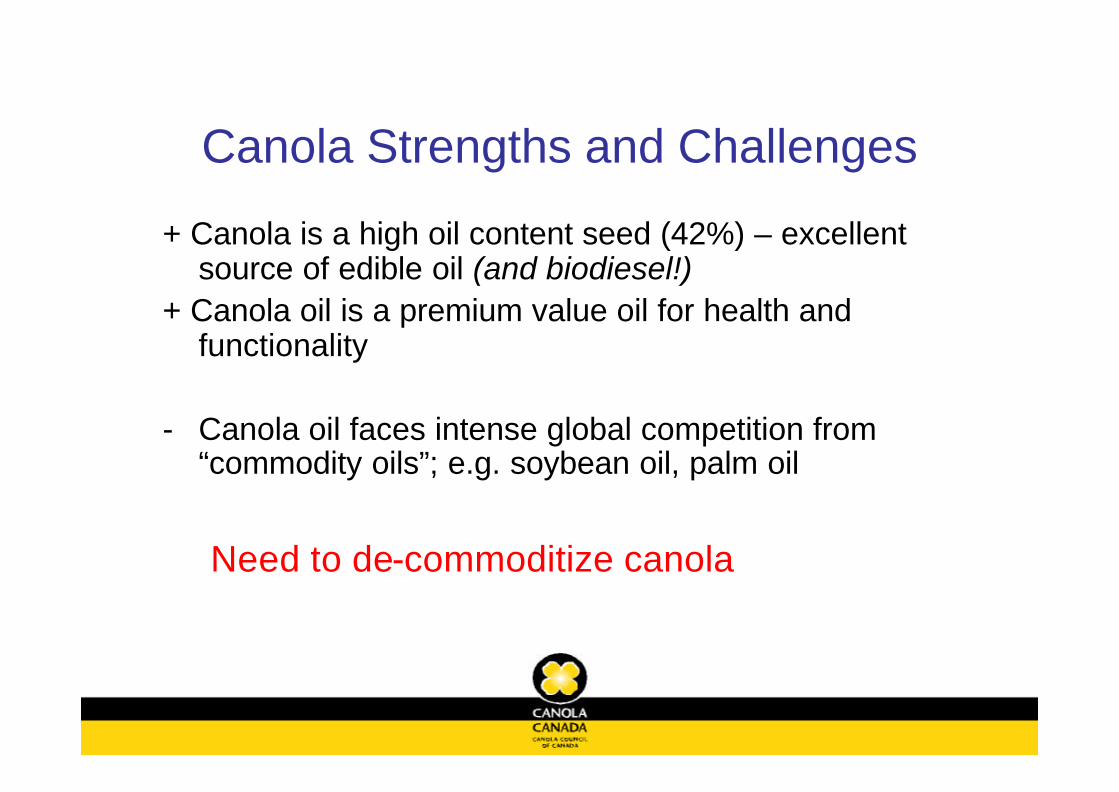
Canola Strengths and Challenges
+ Canola is a high oil content seed (42%) – excellent source of edible oil (and biodiesel!)
+ Canola oil is a premium value oil for health and functionality
- Canola oil faces intense global competition from “commodity oils”; e.g. soybean oil, palm oil
Need to de-commoditize canola
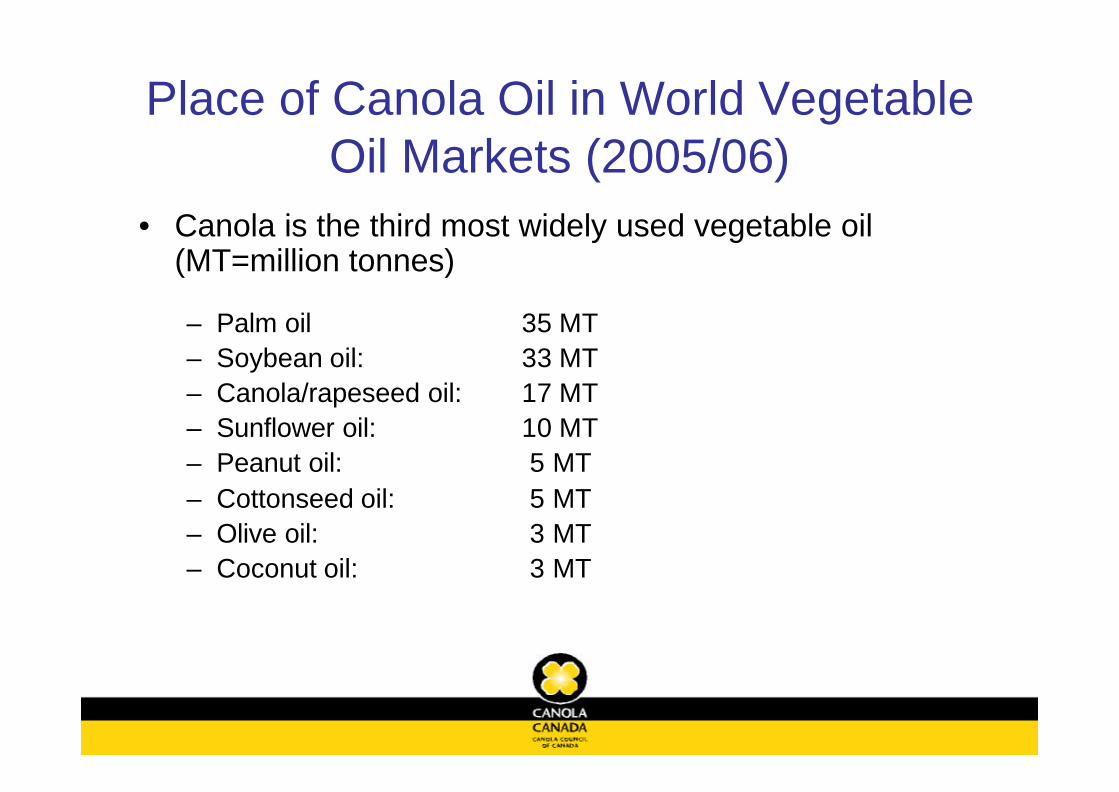
Place of Canola Oil in World Vegetable Oil Markets (2005/06)
• Canola is the third most widely used vegetable oil (MT=million tonnes)
– Palm oil 35 MT– Soybean oil: 33 MT– Canola/rapeseed oil: 17 MT– Sunflower oil: 10 MT– Peanut oil: 5 MT– Cottonseed oil: 5 MT– Olive oil: 3 MT– Coconut oil: 3 MT
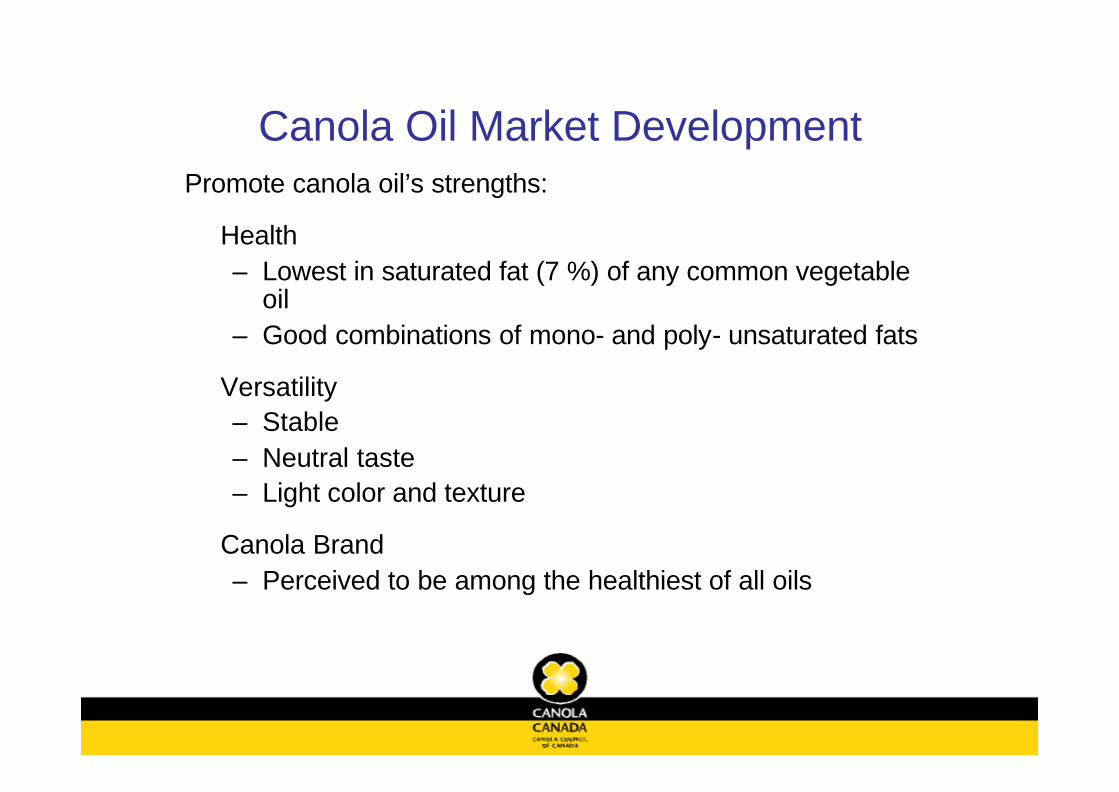
Canola Oil Market DevelopmentPromote canola oil’s strengths:
Health – Lowest in saturated fat (7 %) of any common vegetable
oil– Good combinations of mono- and poly- unsaturated fats
Versatility– Stable– Neutral taste– Light color and texture
Canola Brand– Perceived to be among the healthiest of all oils
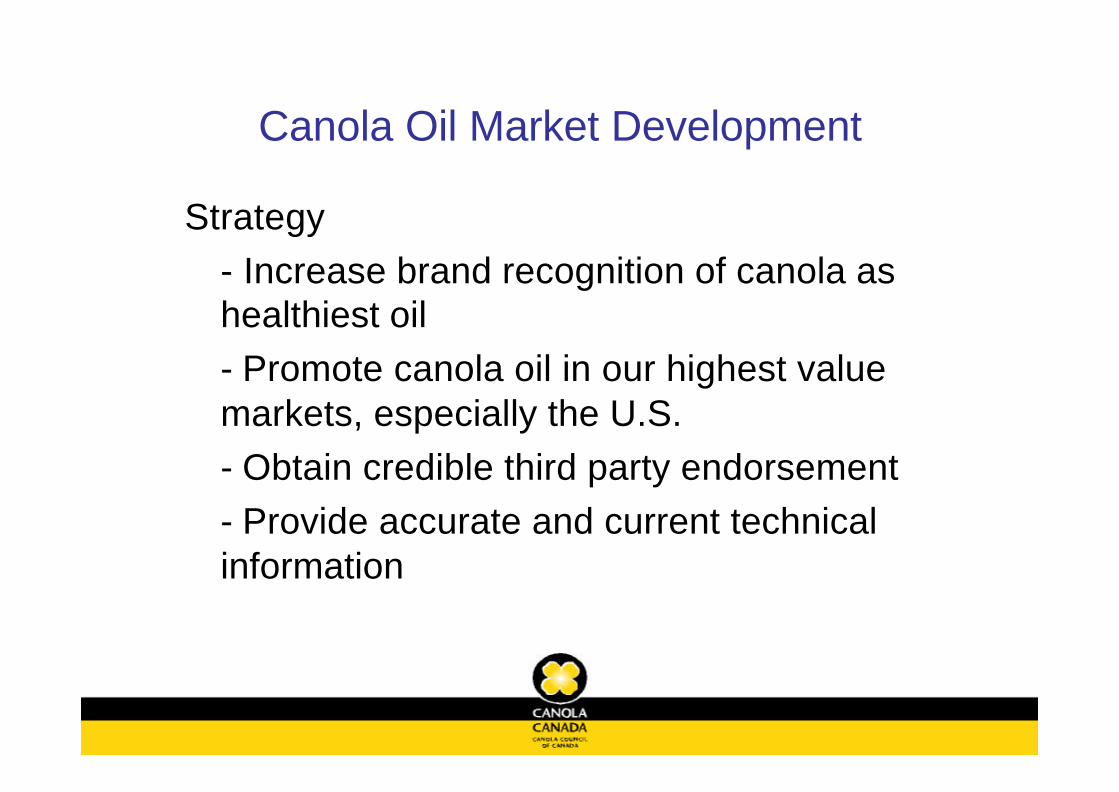
Canola Oil Market Development
Strategy- Increase brand recognition of canola as healthiest oil- Promote canola oil in our highest value markets, especially the U.S.- Obtain credible third party endorsement- Provide accurate and current technical information
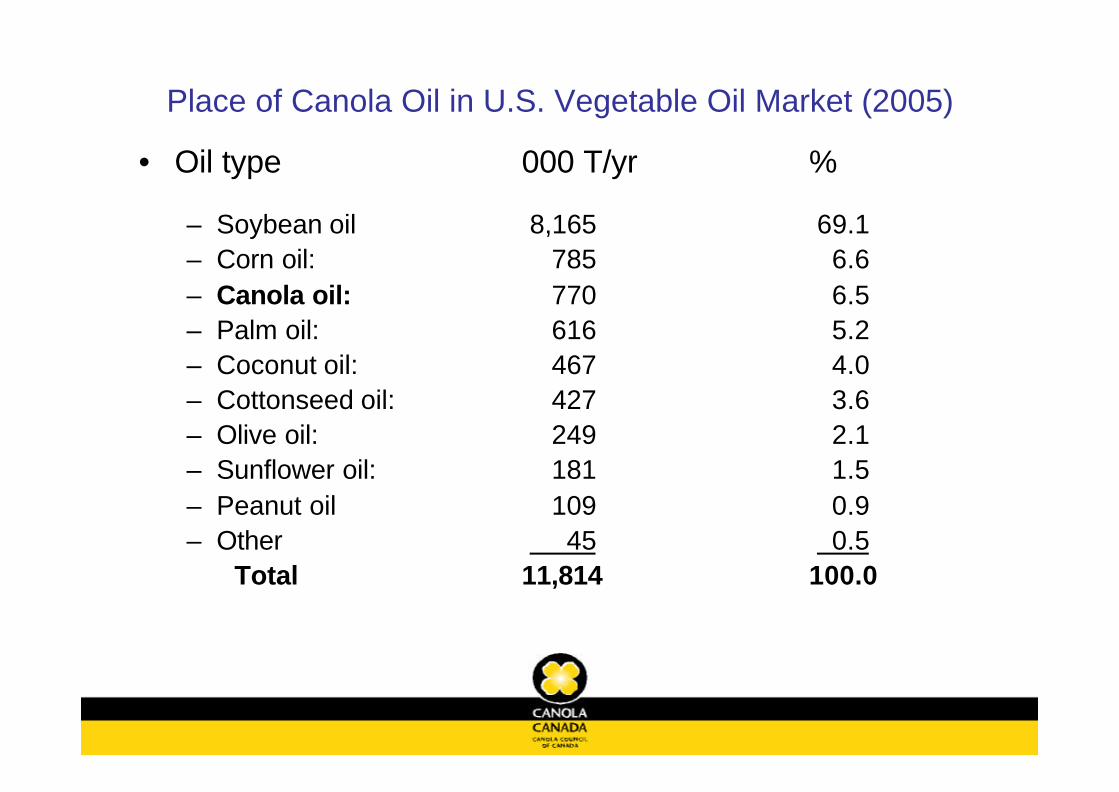
Place of Canola Oil in U.S. Vegetable Oil Market (2005)
• Oil type 000 T/yr %
– Soybean oil 8,165 69.1– Corn oil: 785 6.6– Canola oil: 770 6.5– Palm oil: 616 5.2– Coconut oil: 467 4.0– Cottonseed oil: 427 3.6– Olive oil: 249 2.1– Sunflower oil: 181 1.5– Peanut oil 109 0.9– Other 45 0.5
Total 11,814 100.0
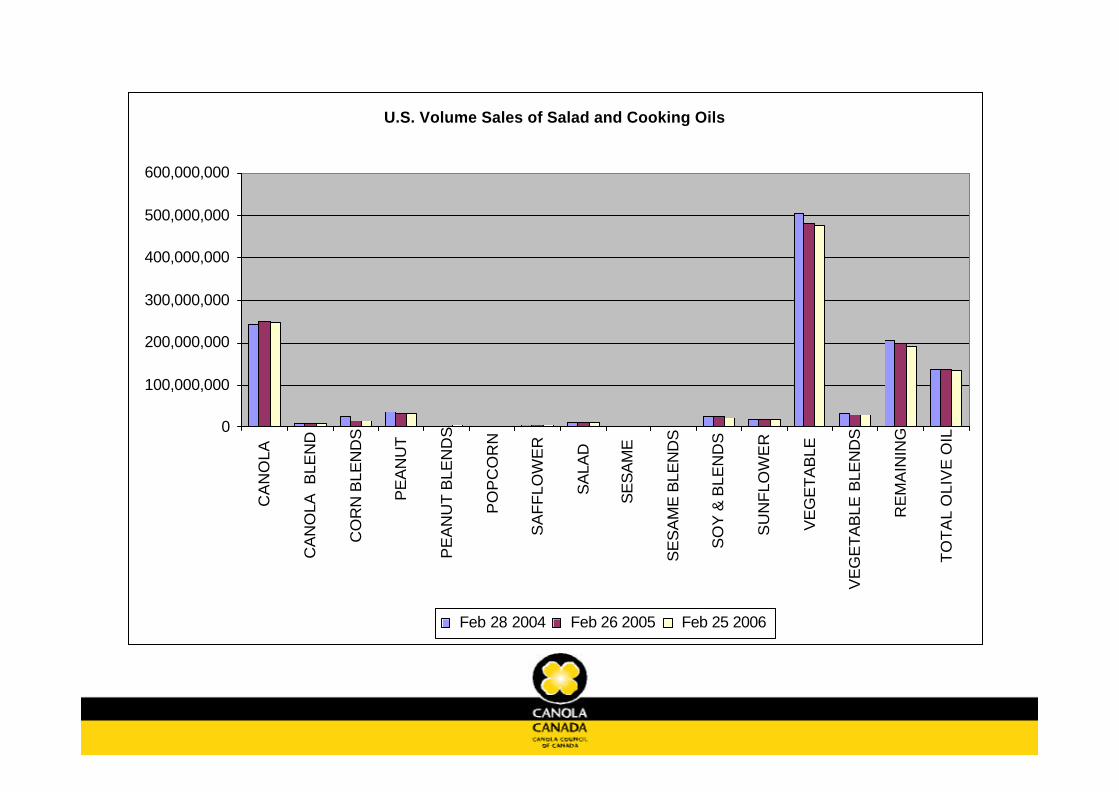
U.S. Volume Sales of Salad and Cooking Oils
0
100,000,000
200,000,000
300,000,000
400,000,000
500,000,000
600,000,000
CA
NO
LA
CA
NO
LA B
LEN
D
CO
RN
BLE
ND
S
PE
AN
UT
PE
AN
UT
BLE
ND
S
PO
PC
OR
N
SA
FF
LOW
ER
SA
LAD
SE
SA
ME
SE
SA
ME
BLE
ND
S
SO
Y &
BLE
ND
S
SU
NF
LOW
ER
VE
GE
TA
BLE
VE
GE
TA
BLE
BLE
ND
S
RE
MA
ININ
G
TO
TA
L O
LIV
E O
IL
Feb 28 2004 Feb 26 2005 Feb 25 2006
Promoting Canola Oil in the U.S.
• Joint project of U.S. and Canadian canola industries• Support original clinical research on canola oil health benefits• Targeted information on canola oil’s health and versatility
benefits to consumers, health professionals, culinary professionals, food service and food manufacturing customers: “Low in saturated fats” is key message
• Work with U.S. government regulators (via U.S. Canola Association) on canola oil recognition in food recommendations and regulations, eg. food labelling, health claims, food pyramid
• Promote both conventional and high-stability canola oils• Priority: increased emphasis on food service and food
manufacturing industries– Trans fats, “obesity crisis”, providing opportunities for canola oil
blending and replacement of partially hydrogenated fats• Promotion and research budget: > $ 2.0 million in 2006
Health and Nutrition Issues
• Healthy oils– US Nutrition Guidelines
• Reduce intake of saturated fats• Increase intake of mono- and poly-unsaturated
fatty acids (omega-3’s)? Good for liquid vegetable oils, especially
canola oil (mentioned as a “healthy oil”)
FDA Health Claim Approved October 6, 2006
“Limited and not conclusive scientific evidence suggests that eating about 1 1/2 tablespoons (19 grams) of canola oil daily may reduce the risk of coronary heart disease due to the unsaturated fat content in canola oil. To achieve this possible benefit, canola oil is to replace a similar amount of saturated fat and not increase the total number of calories you eat in a day. One serving of this product contains [x] grams of canola oil.”
FDA Health Claim Approved October 6, 2006
Criteria for foods eligible to bear the claim include containing at least 4.75 grams of canola oil per reference amount customarily consumed, no more than one gram of trans fat and low levels of saturated fat and cholesterol.
Strategy to leverage FDA Health Claim
• Publicize health claim to consumers
• Encourage food industry to use health claim and to develop products using canola oil as replacement for unhealthy oils
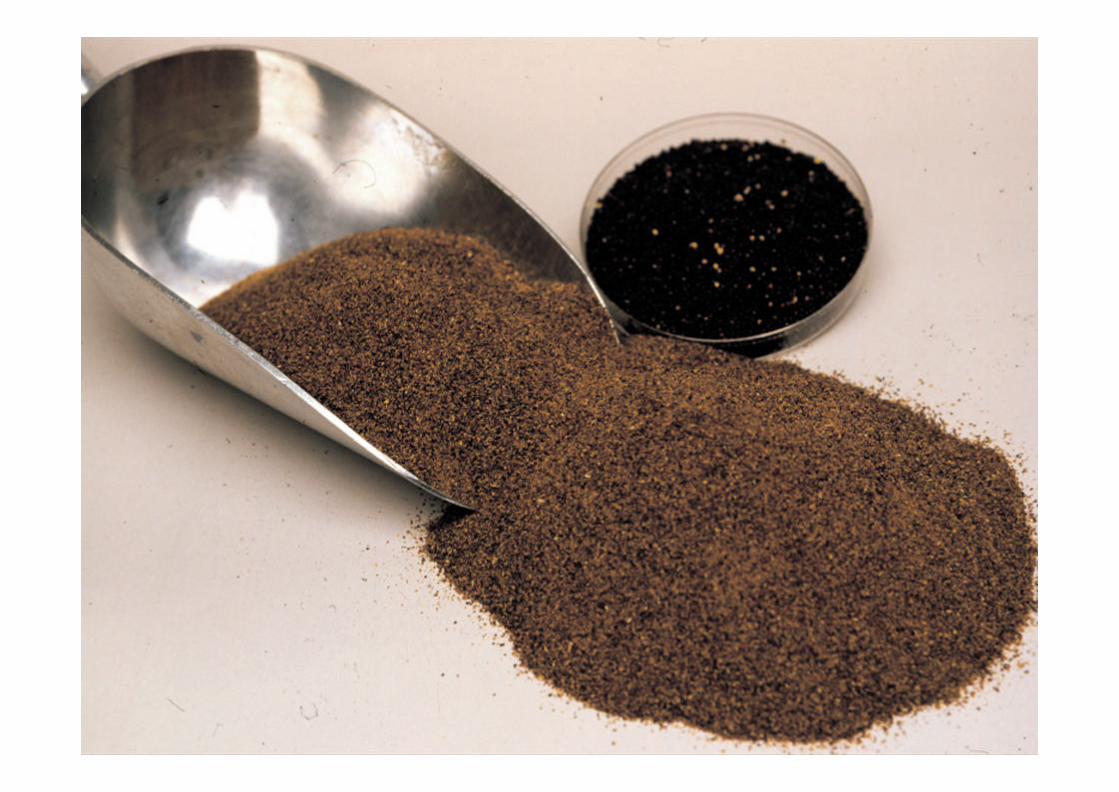
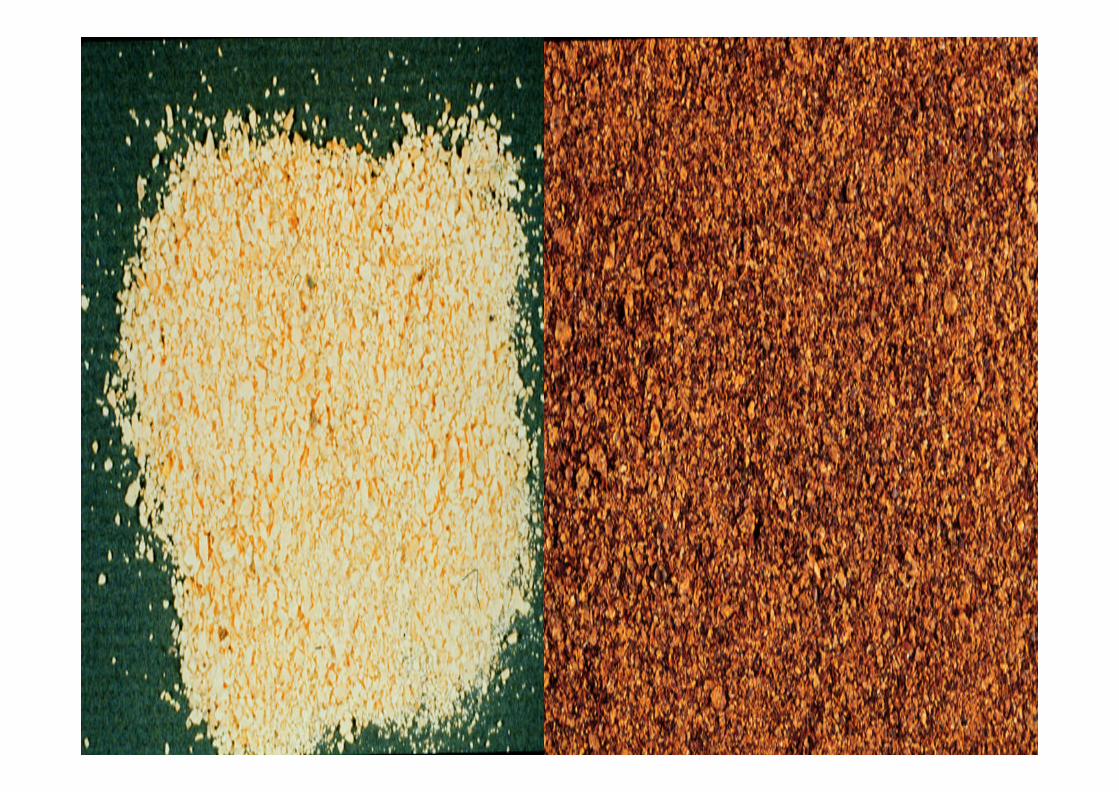
Canola meal value
Canola meal is the second most popular protein meal in world. Value is related to soybean meal- Canola meal has 75% the protein of 47% protein soybean meal- Canola meal has 80% - 90% the energy value of dehulled soybean meal- The price of canola meal usually ranges between 60% and 70% the price of soybean meal
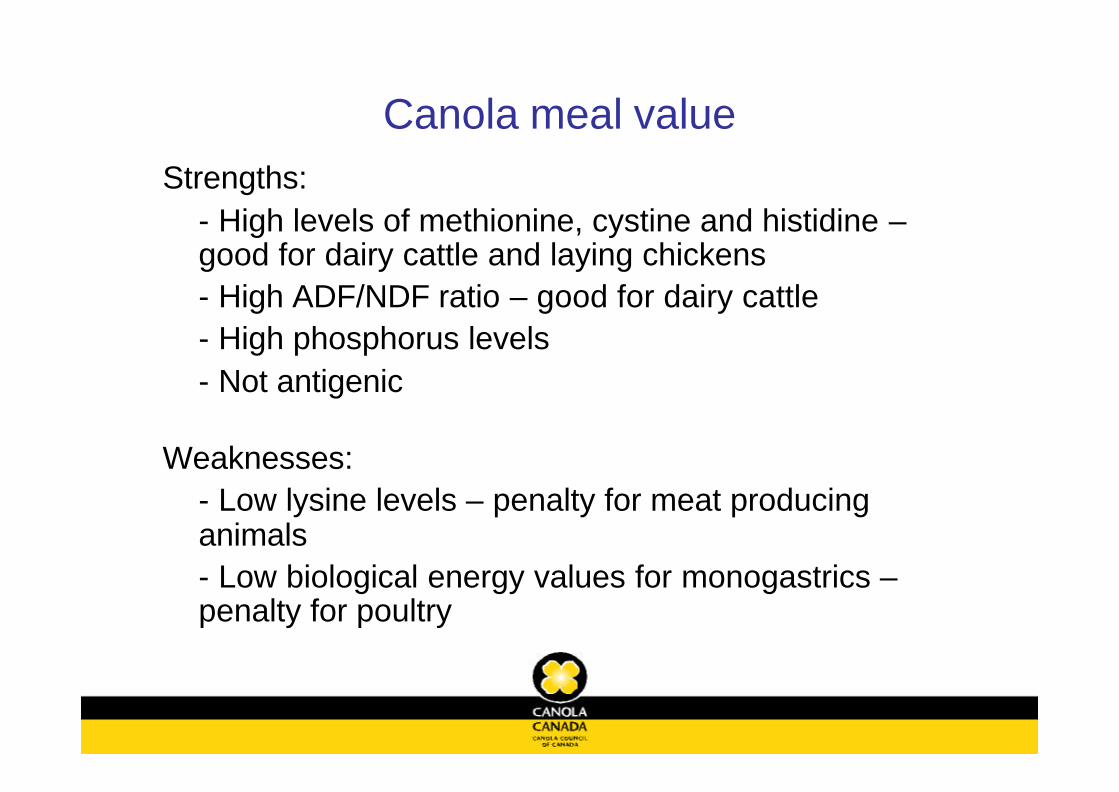
Canola meal valueStrengths:
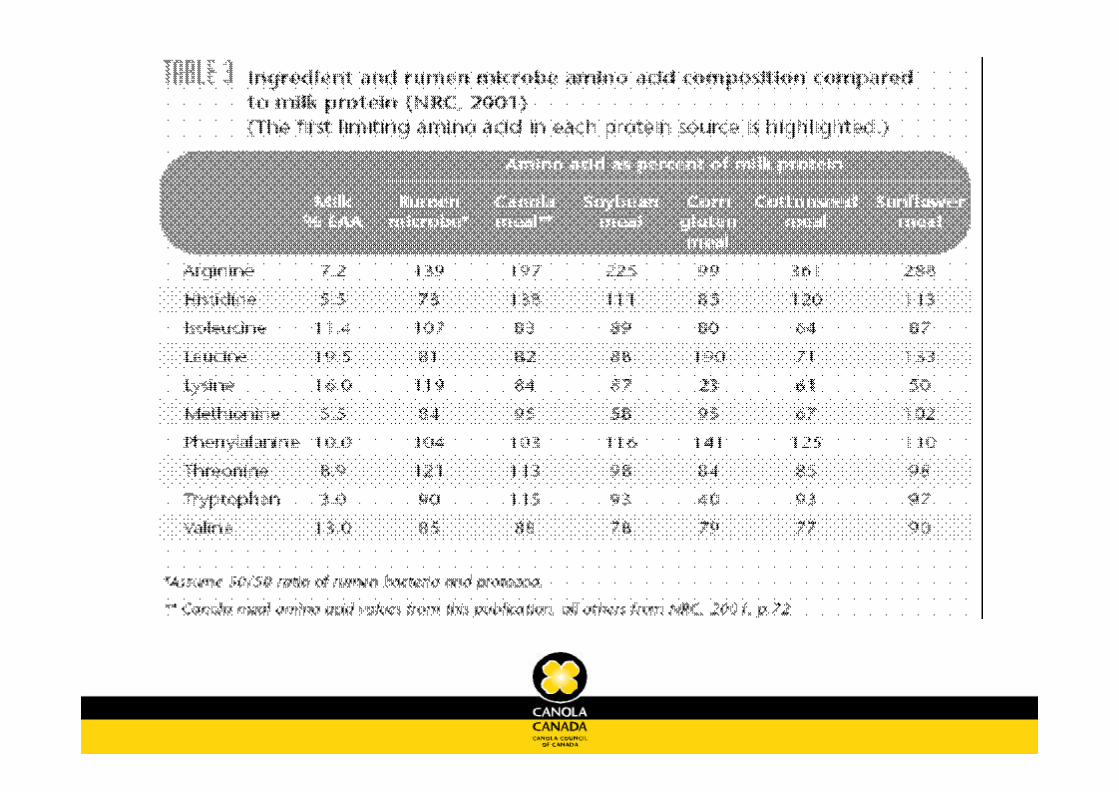
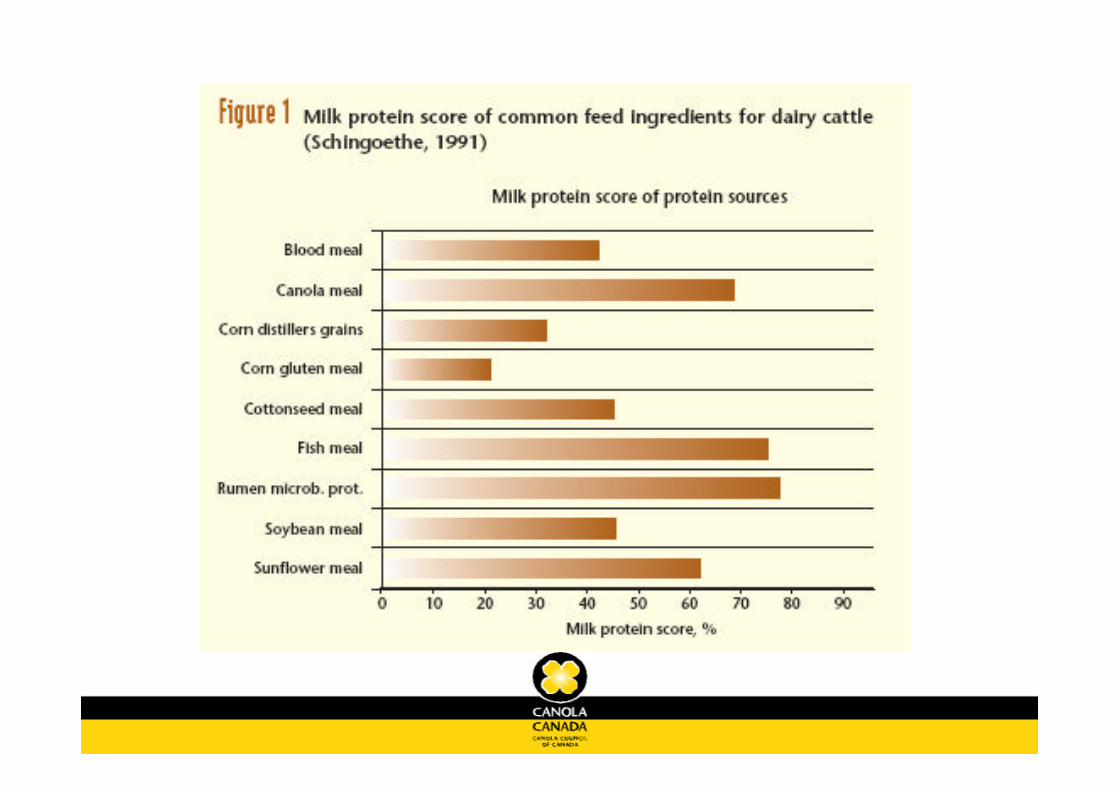
- High levels of methionine, cystine and histidine –good for dairy cattle and laying chickens- High ADF/NDF ratio – good for dairy cattle- High phosphorus levels- Not antigenic
Weaknesses:- Low lysine levels – penalty for meat producing animals- Low biological energy values for monogastrics –penalty for poultry
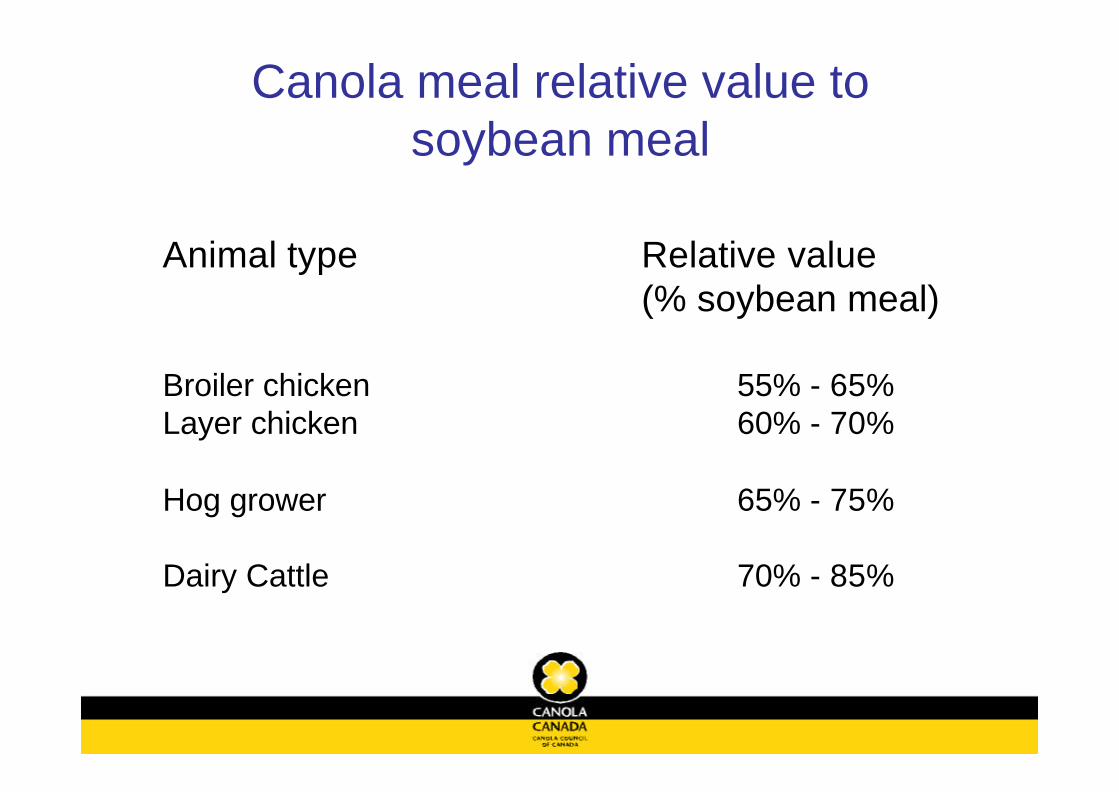
Canola meal relative value to soybean meal
Animal type Relative value(% soybean meal)
Broiler chicken 55% - 65%Layer chicken 60% - 70%
Hog grower 65% - 75%
Dairy Cattle 70% - 85%
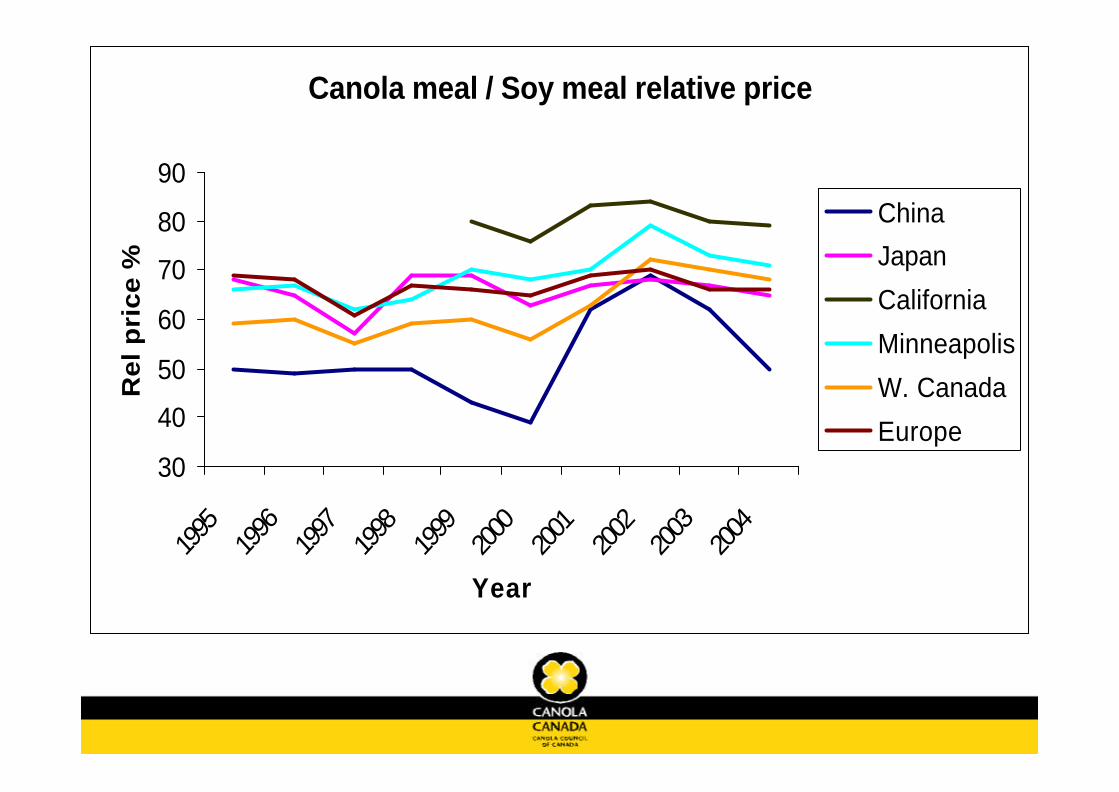
Canola meal / Soy meal relative price
30
40
50
60
70
80
90
1995
1996
1997
1998
1999
2000
2001
2002
2003
2004
Year
Re
l p
ric
e %
China
Japan
California
Minneapolis
W. Canada
Europe
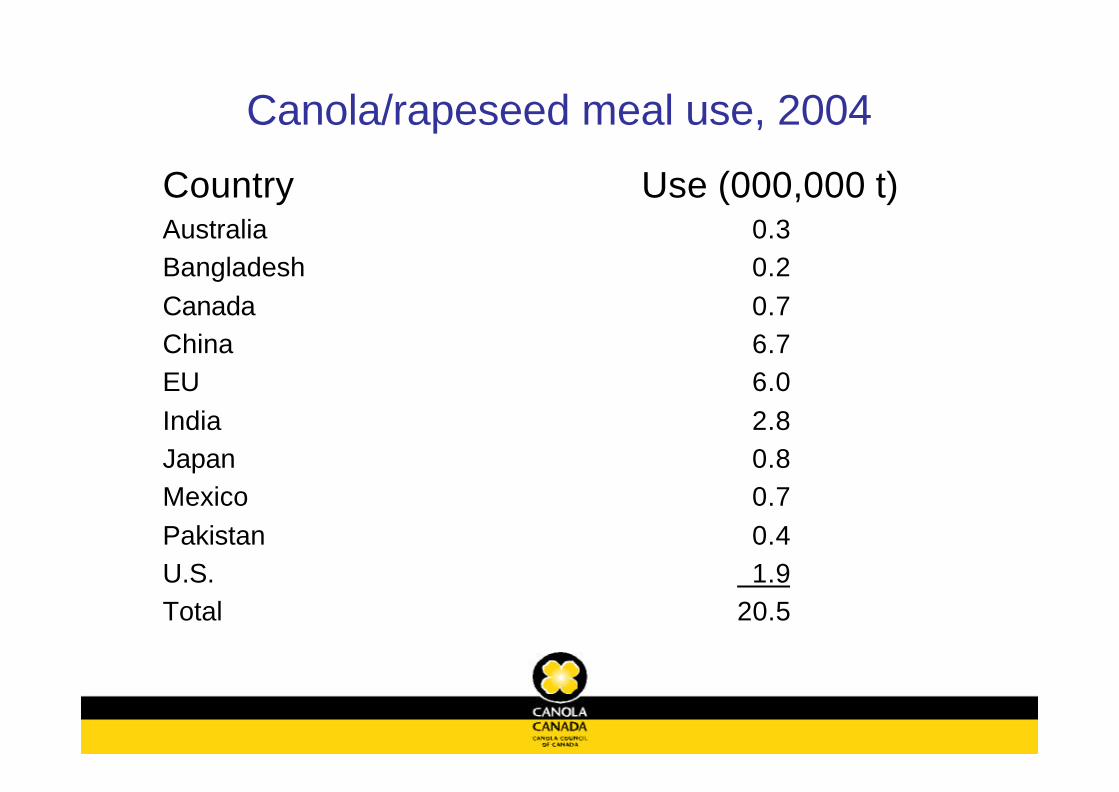
Canola/rapeseed meal use, 2004
Country Use (000,000 t)Australia 0.3Bangladesh 0.2Canada 0.7China 6.7EU 6.0India 2.8Japan 0.8Mexico 0.7Pakistan 0.4U.S. 1.9Total 20.5

Misconceptions about canola meal
It is unpalatable. Not true - it has a neutral taste to most animals
It will result in lower animal performance. Not true - when diets are balanced properly, performance is excellent.
It must be priced at a discount. Not true - it is a premium ingredient for some animals, e.g. dairy cattle
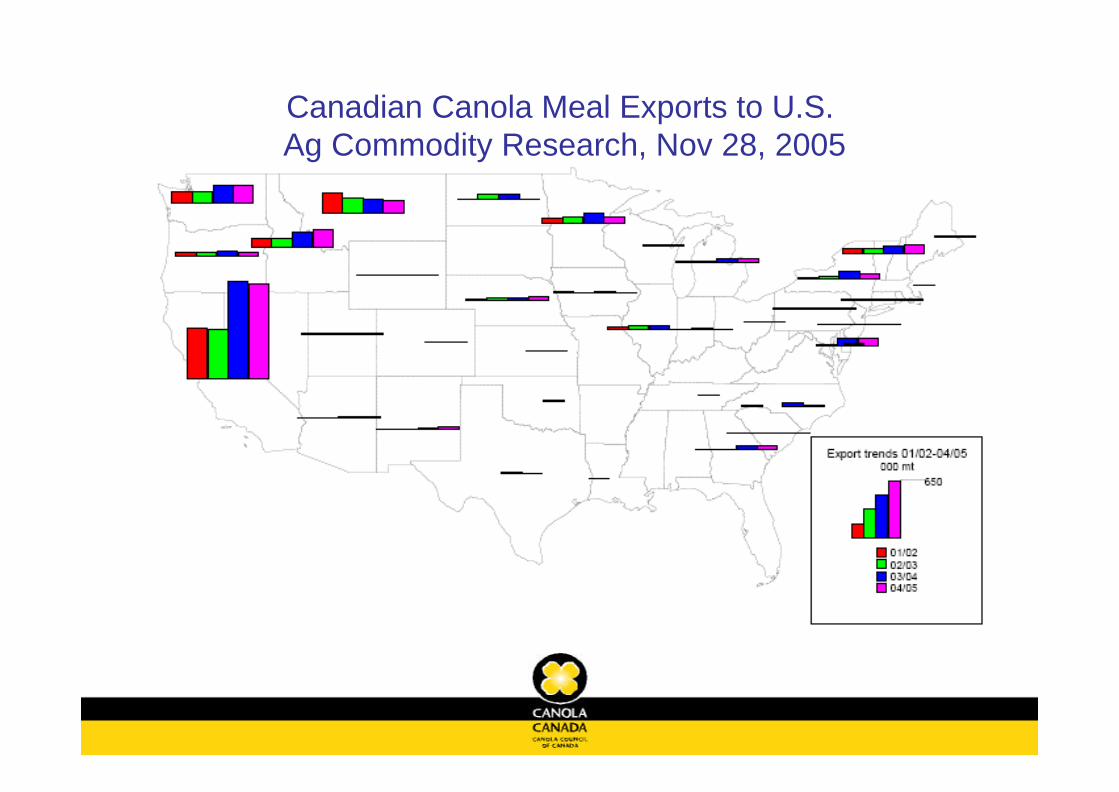
Canadian Canola Meal Exports to U.S.Ag Commodity Research, Nov 28, 2005
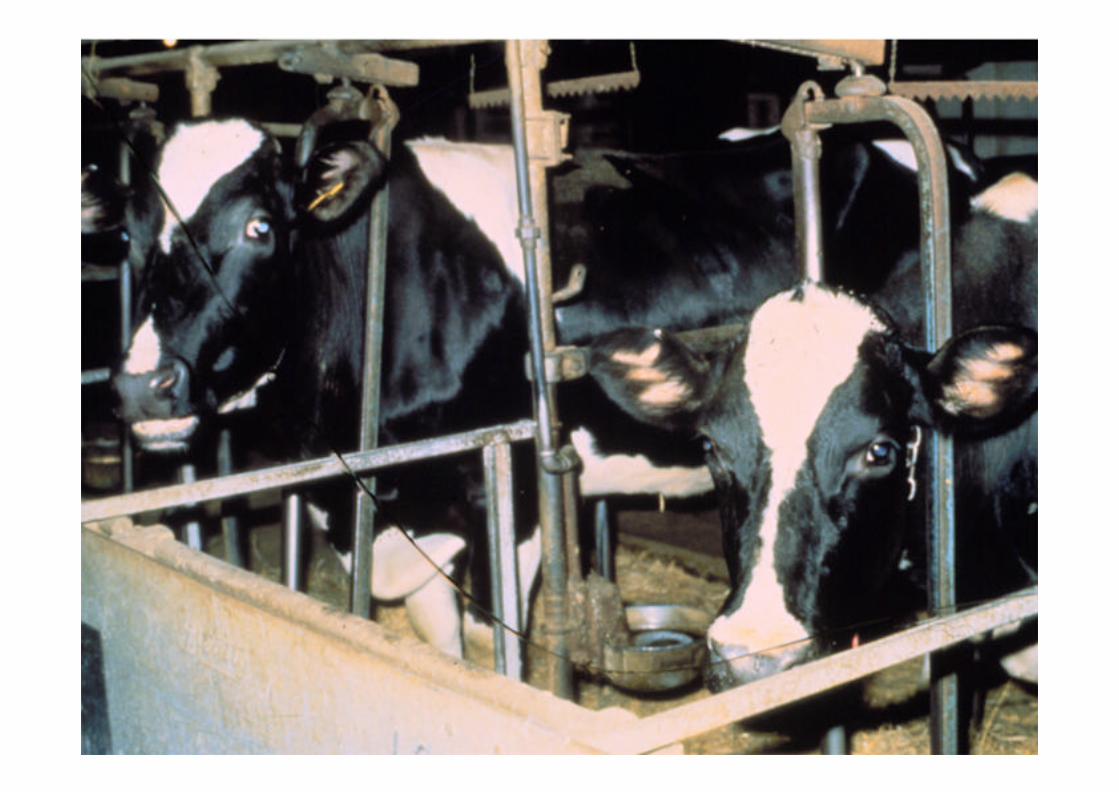
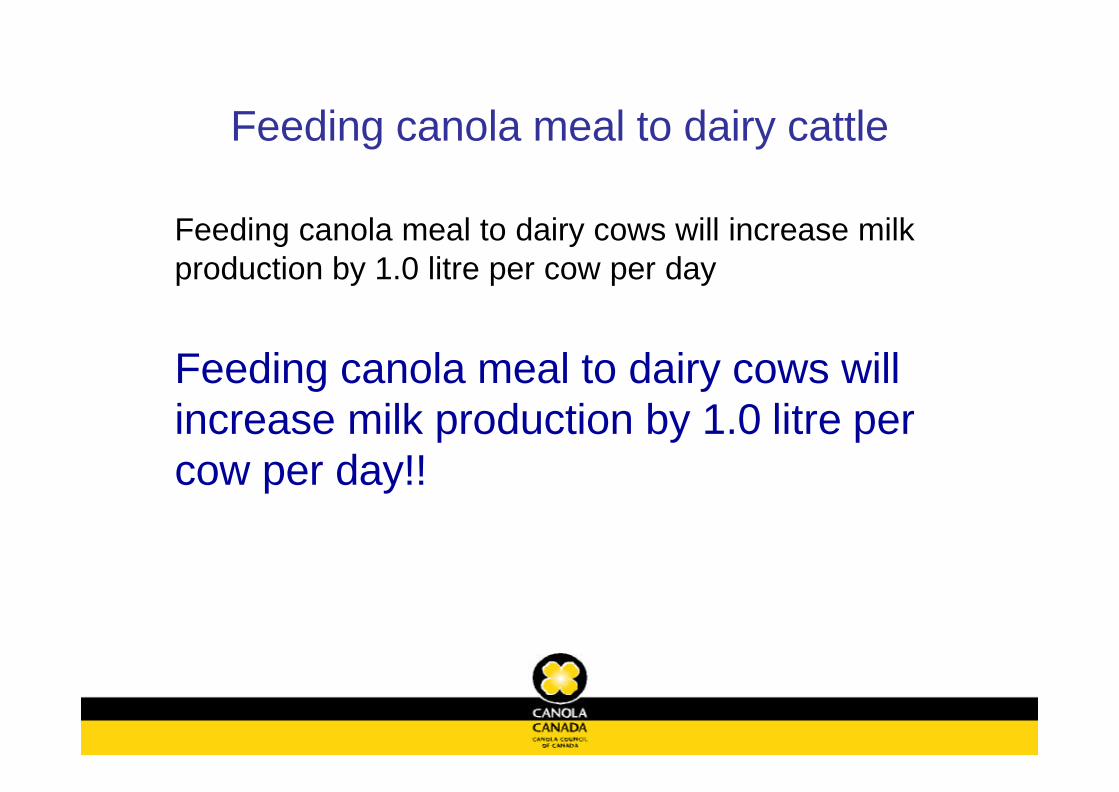
Feeding canola meal to dairy cattle
Feeding canola meal to dairy cows will increase milk production by 1.0 litre per cow per day
Feeding canola meal to dairy cows will increase milk production by 1.0 litre per cow per day!!

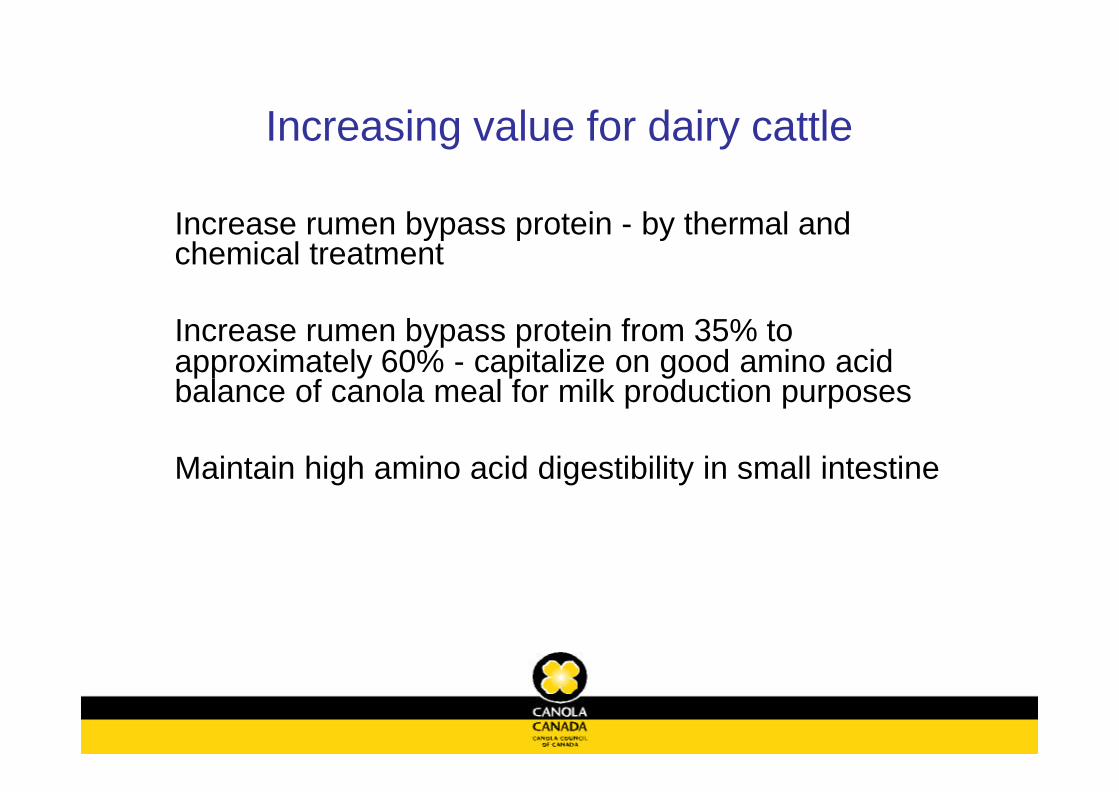
Increasing value for dairy cattle
Increase rumen bypass protein - by thermal and chemical treatment
Increase rumen bypass protein from 35% to approximately 60% - capitalize on good amino acid balance of canola meal for milk production purposes
Maintain high amino acid digestibility in small intestine
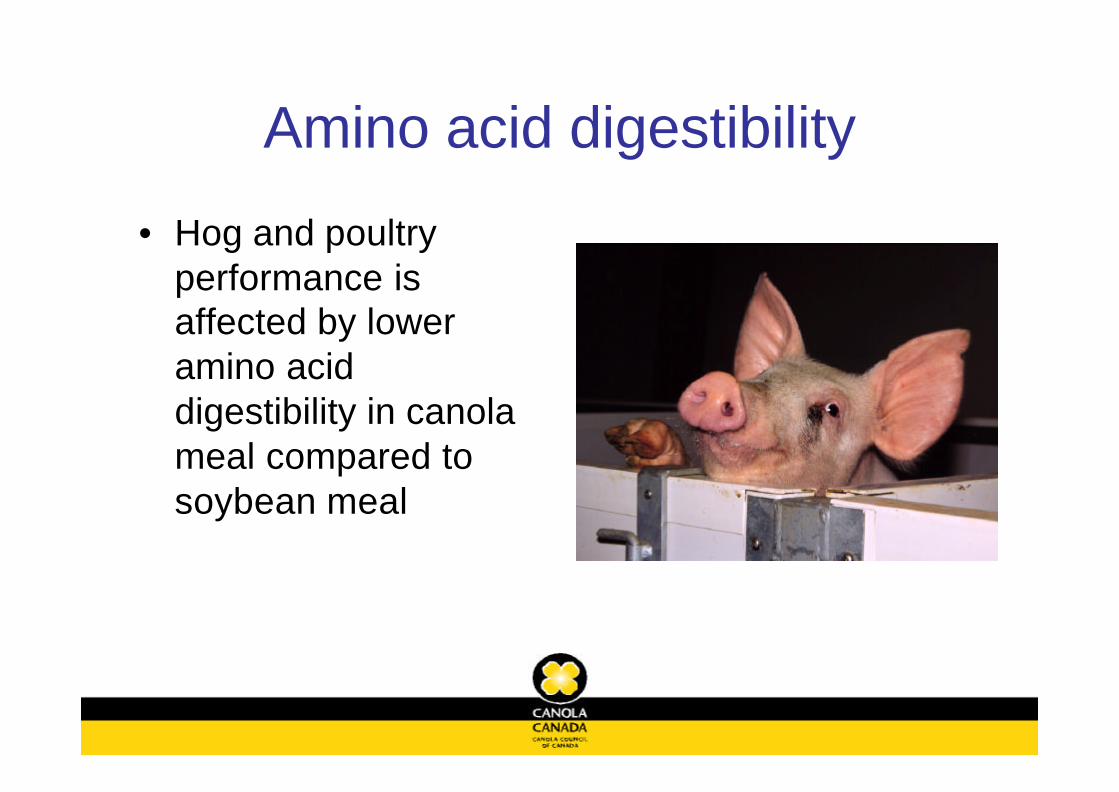
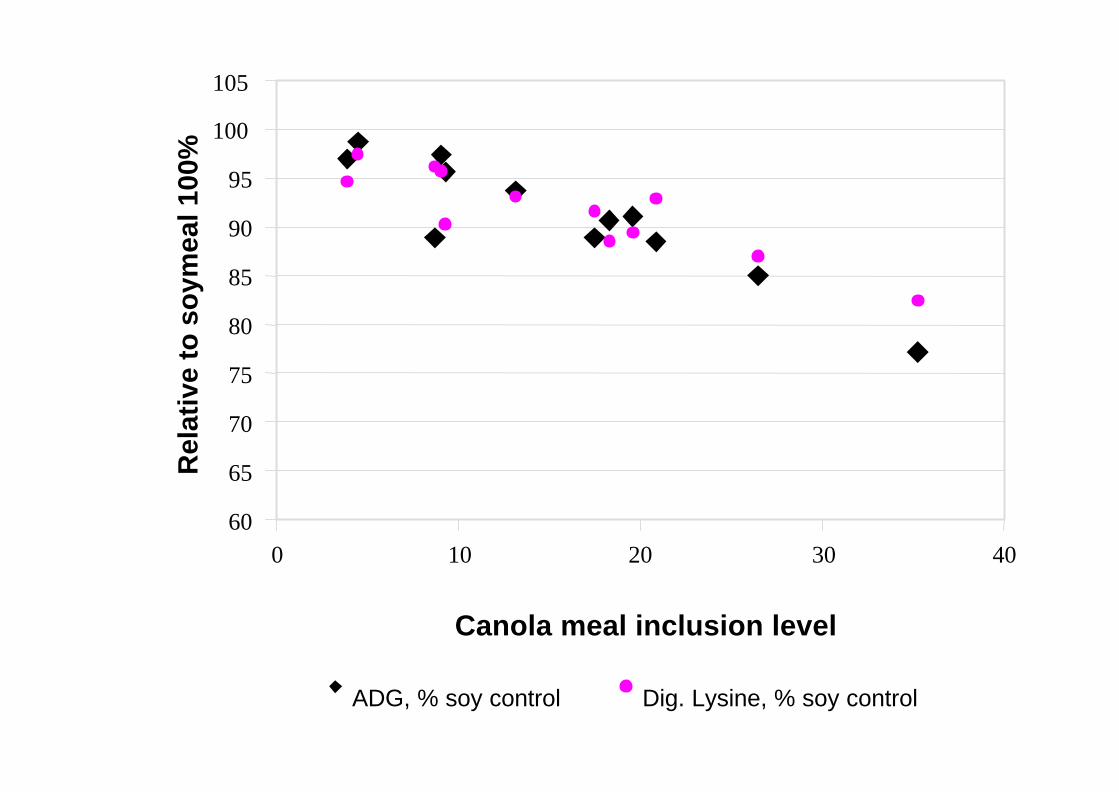
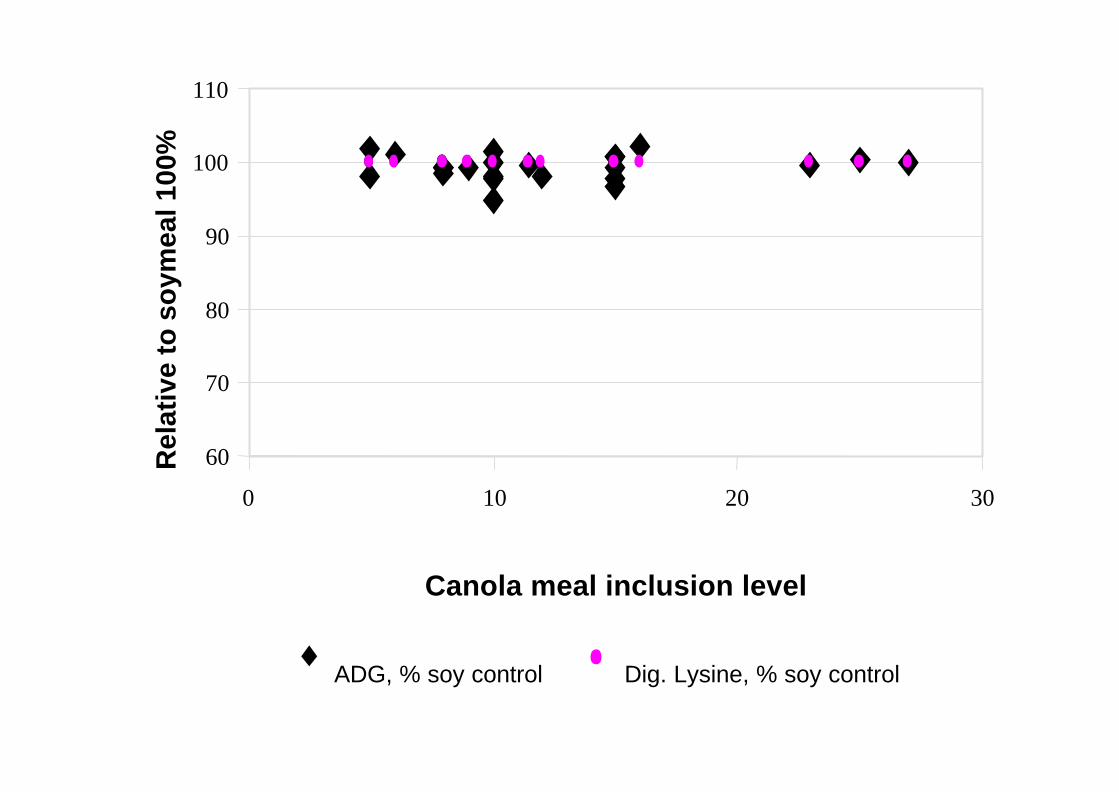
Amino acid digestibility
• Hog and poultry performance is affected by lower amino acid digestibility in canola meal compared to soybean meal
60
65
70
75
80
85
90
95
100
105
0 10 20 30 40
Canola meal inclusion level
Rel
ativ
e to
so
ymea
l 100
%
ADG, % soy control Dig. Lysine, % soy control
60
70
80
90
100
110
0 10 20 30
Canola meal inclusion level
Rel
ativ
e to
so
ymea
l 100
%
ADG, % soy control Dig. Lysine, % soy control
Amino acid digestibility
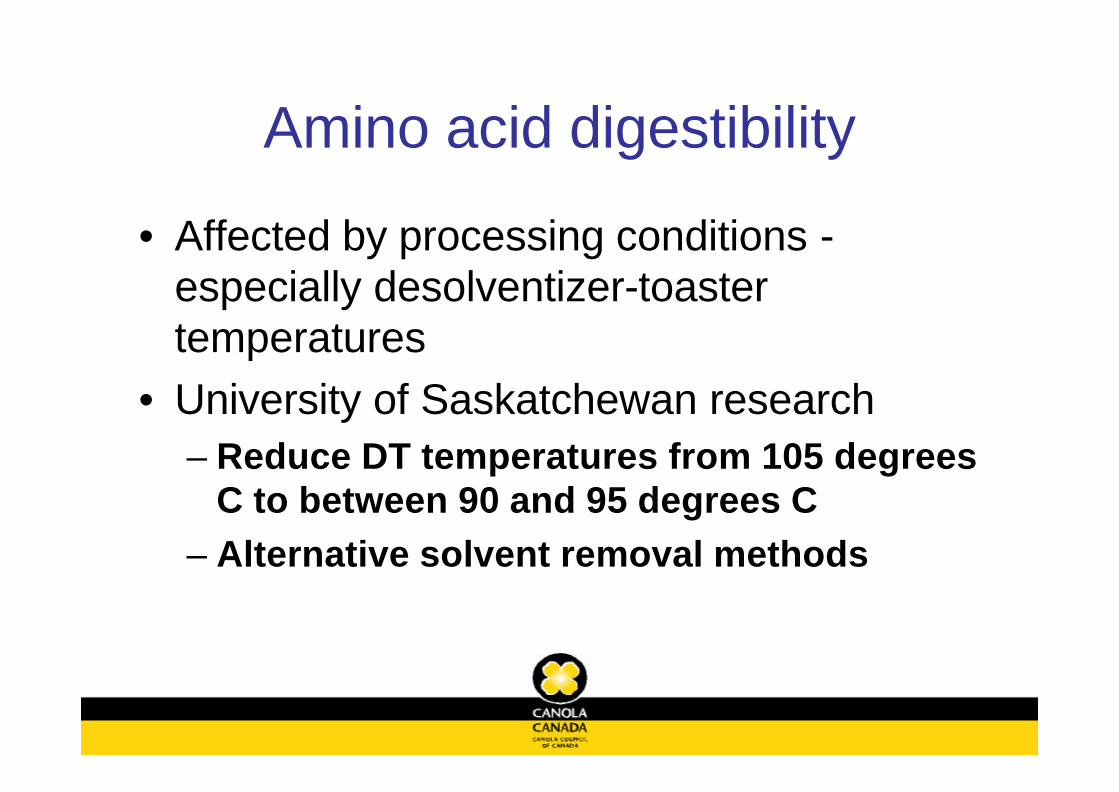
• Affected by processing conditions -especially desolventizer-toaster temperatures
• University of Saskatchewan research– Reduce DT temperatures from 105 degrees
C to between 90 and 95 degrees C– Alternative solvent removal methods
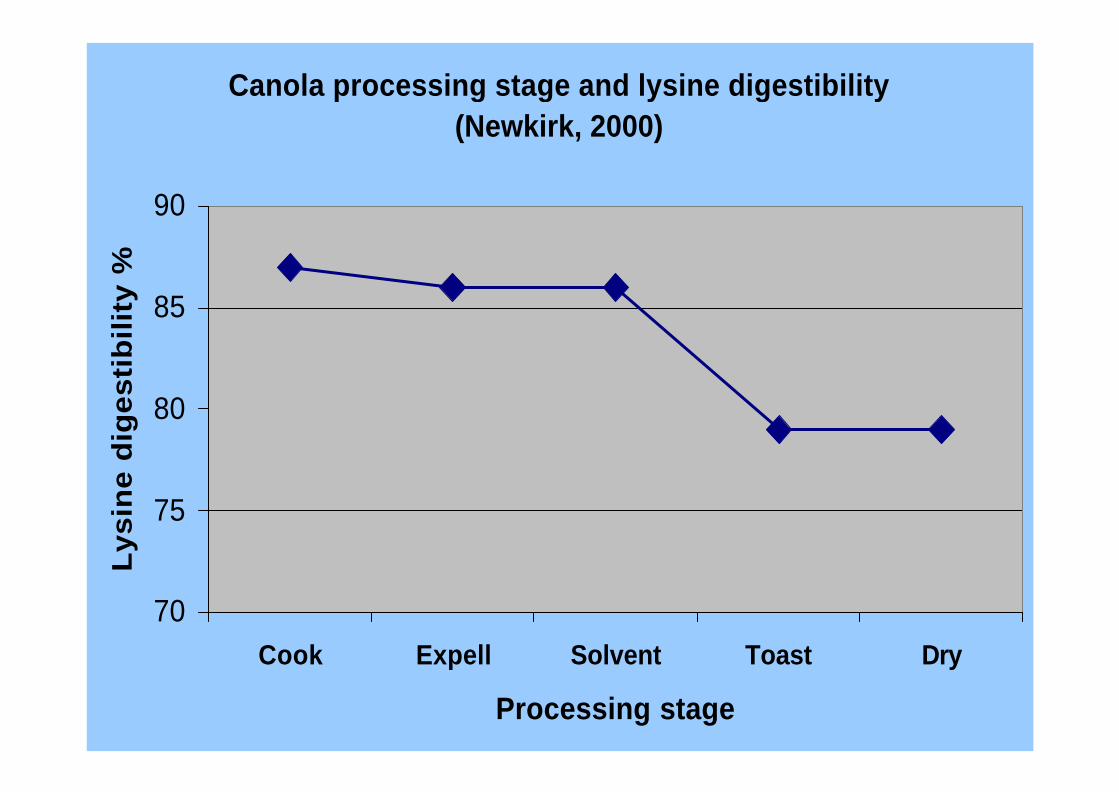
Canola processing stage and lysine digestibility (Newkirk, 2000)
70
75
80
85
90
Cook Expell Solvent Toast Dry
Processing stage
Ly
sin
e d
ige
sti
bil
ity
%
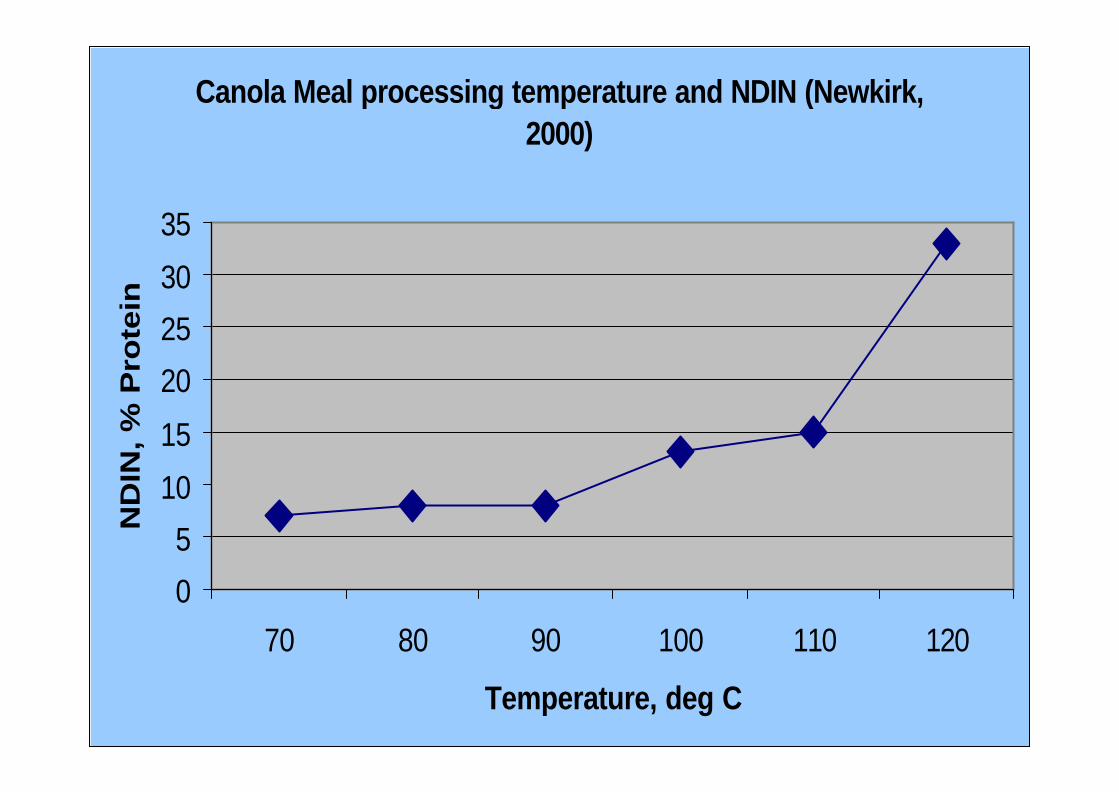
Canola Meal processing temperature and NDIN (Newkirk, 2000)
0
5
10
15
20
25
30
35
70 80 90 100 110 120
Temperature, deg C
ND
IN,
% P
rote
in
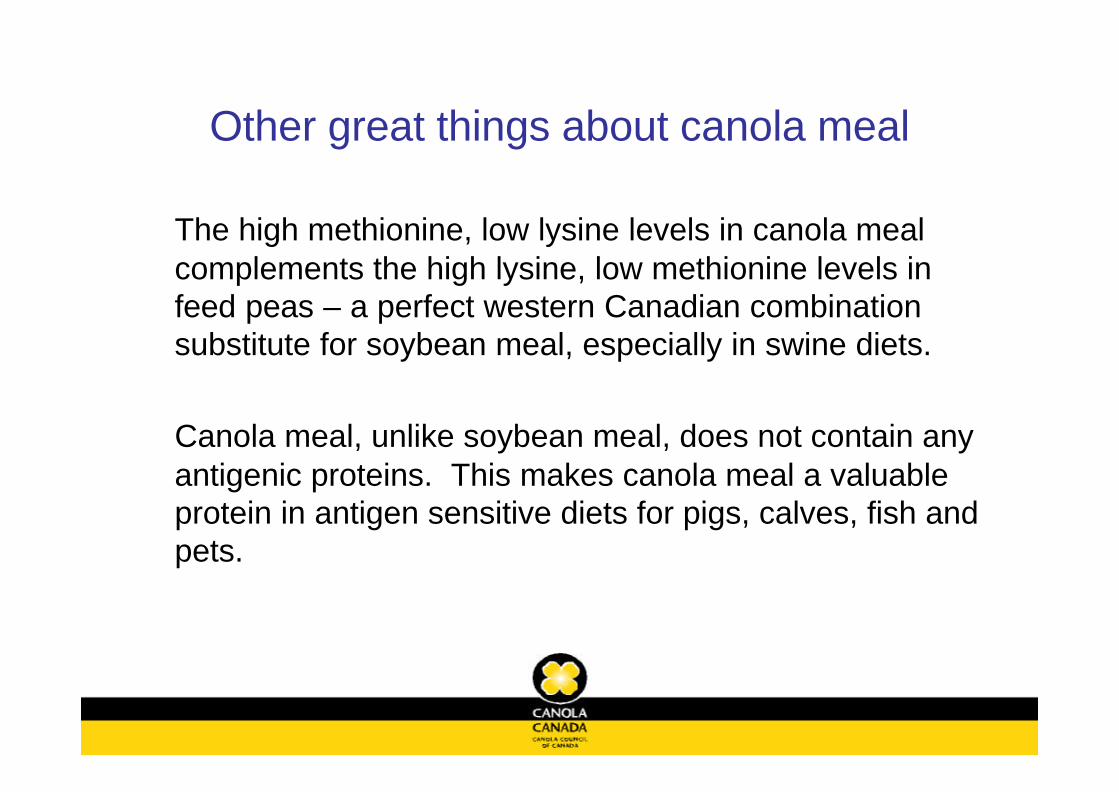
Other great things about canola meal
The high methionine, low lysine levels in canola meal complements the high lysine, low methionine levels in feed peas – a perfect western Canadian combination substitute for soybean meal, especially in swine diets.
Canola meal, unlike soybean meal, does not contain any antigenic proteins. This makes canola meal a valuable protein in antigen sensitive diets for pigs, calves, fish and pets.

Bio-diesel
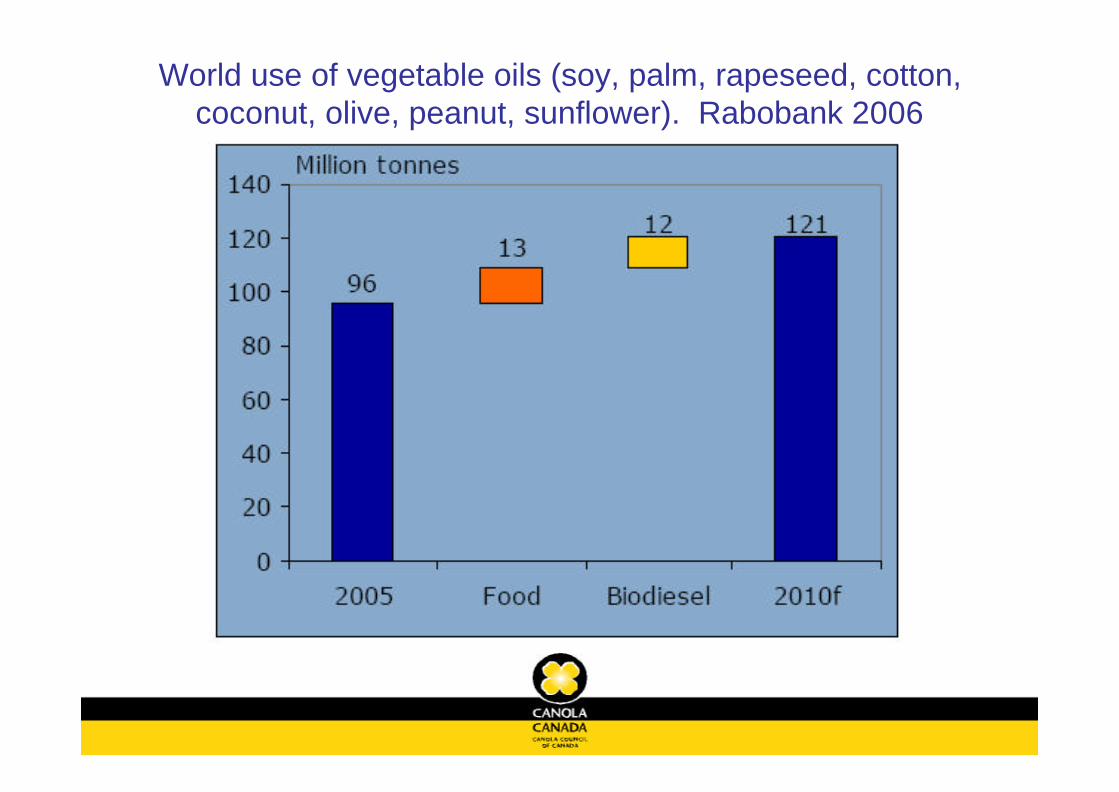
World use of vegetable oils (soy, palm, rapeseed, cotton, coconut, olive, peanut, sunflower). Rabobank 2006
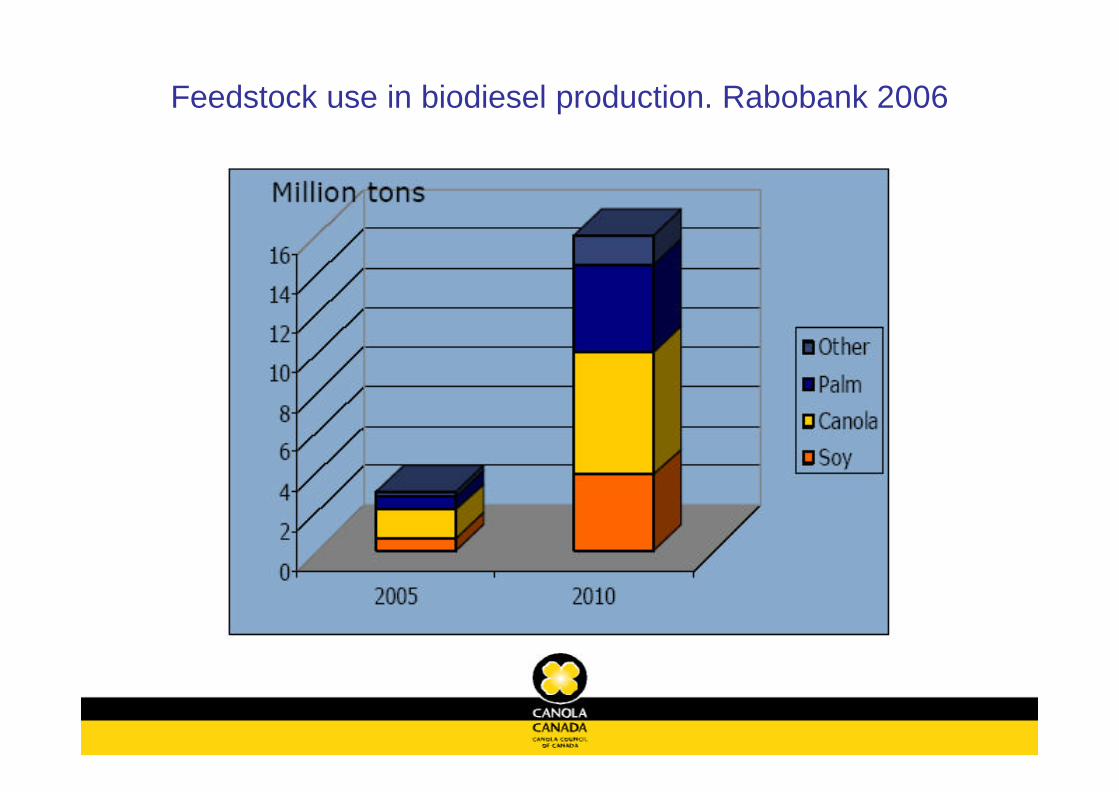
Feedstock use in biodiesel production. Rabobank 2006
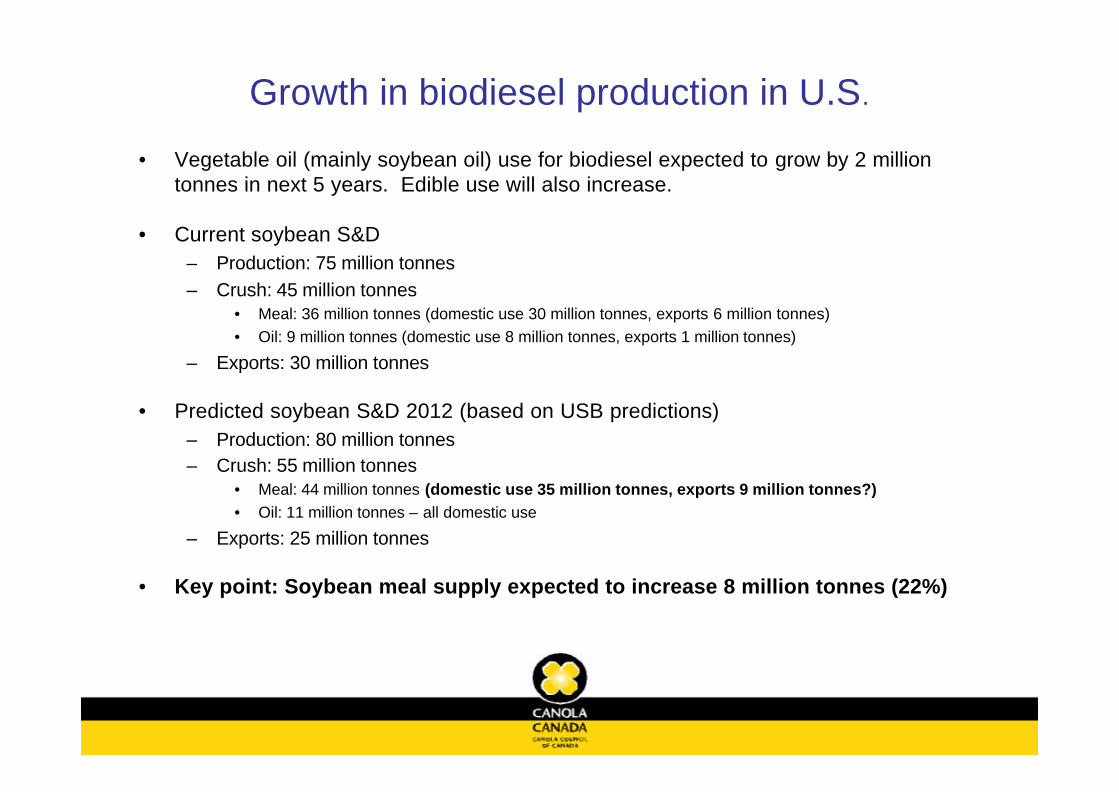
Growth in biodiesel production in U.S.
• Vegetable oil (mainly soybean oil) use for biodiesel expected to grow by 2 million tonnes in next 5 years. Edible use will also increase.
• Current soybean S&D– Production: 75 million tonnes– Crush: 45 million tonnes
• Meal: 36 million tonnes (domestic use 30 million tonnes, exports 6 million tonnes)• Oil: 9 million tonnes (domestic use 8 million tonnes, exports 1 million tonnes)
– Exports: 30 million tonnes
• Predicted soybean S&D 2012 (based on USB predictions)– Production: 80 million tonnes– Crush: 55 million tonnes
• Meal: 44 million tonnes (domestic use 35 million tonnes, exports 9 million tonnes?)• Oil: 11 million tonnes – all domestic use
– Exports: 25 million tonnes
• Key point: Soybean meal supply expected to increase 8 million tonnes (22%)
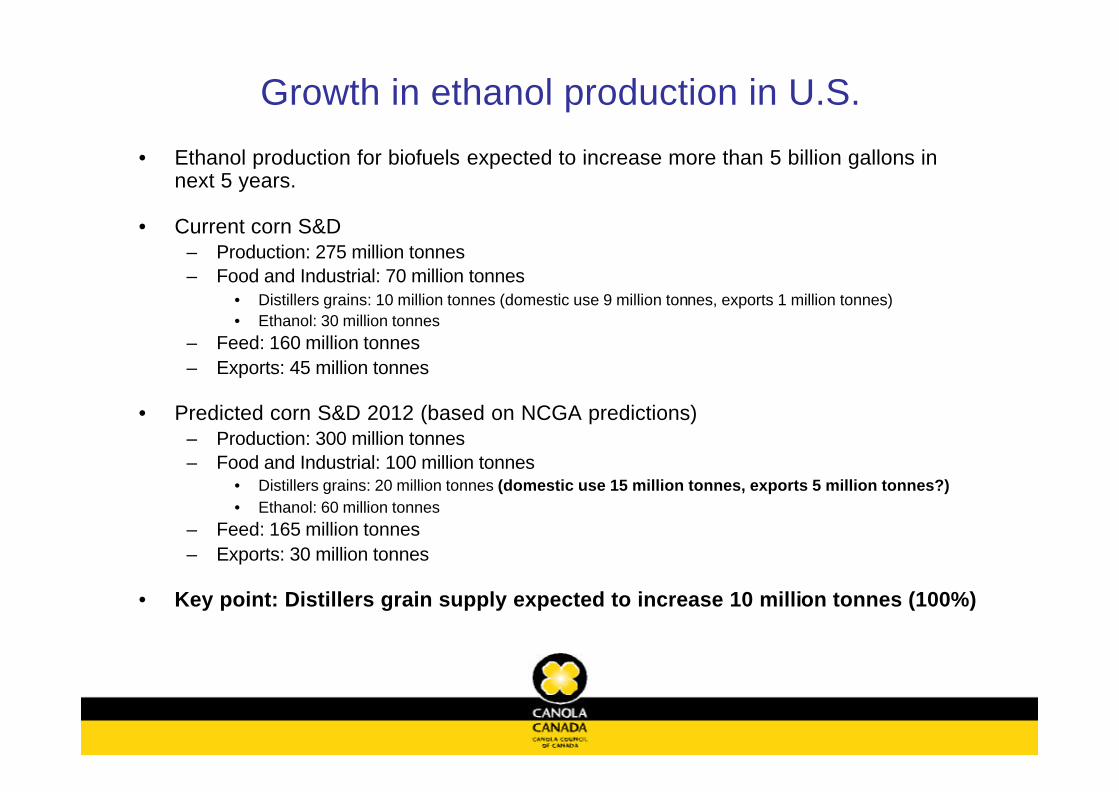
Growth in ethanol production in U.S.
• Ethanol production for biofuels expected to increase more than 5 billion gallons in next 5 years.
• Current corn S&D– Production: 275 million tonnes– Food and Industrial: 70 million tonnes
• Distillers grains: 10 million tonnes (domestic use 9 million tonnes, exports 1 million tonnes)• Ethanol: 30 million tonnes
– Feed: 160 million tonnes– Exports: 45 million tonnes
• Predicted corn S&D 2012 (based on NCGA predictions)– Production: 300 million tonnes– Food and Industrial: 100 million tonnes
• Distillers grains: 20 million tonnes (domestic use 15 million tonnes, exports 5 million tonnes?)• Ethanol: 60 million tonnes
– Feed: 165 million tonnes– Exports: 30 million tonnes
• Key point: Distillers grain supply expected to increase 10 million tonnes (100%)
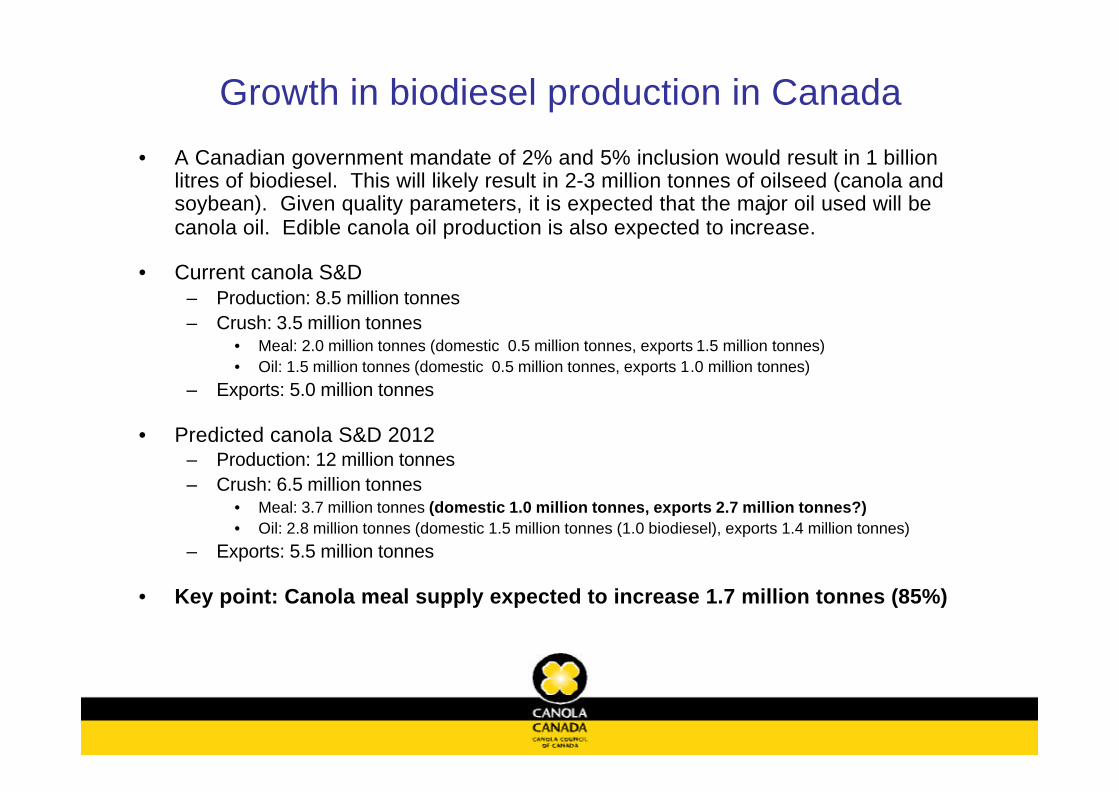
Growth in biodiesel production in Canada
• A Canadian government mandate of 2% and 5% inclusion would result in 1 billion litres of biodiesel. This will likely result in 2-3 million tonnes of oilseed (canola and soybean). Given quality parameters, it is expected that the major oil used will be canola oil. Edible canola oil production is also expected to increase.
• Current canola S&D– Production: 8.5 million tonnes– Crush: 3.5 million tonnes
• Meal: 2.0 million tonnes (domestic 0.5 million tonnes, exports 1.5 million tonnes)• Oil: 1.5 million tonnes (domestic 0.5 million tonnes, exports 1.0 million tonnes)
– Exports: 5.0 million tonnes
• Predicted canola S&D 2012– Production: 12 million tonnes– Crush: 6.5 million tonnes
• Meal: 3.7 million tonnes (domestic 1.0 million tonnes, exports 2.7 million tonnes?)• Oil: 2.8 million tonnes (domestic 1.5 million tonnes (1.0 biodiesel), exports 1.4 million tonnes)
– Exports: 5.5 million tonnes
• Key point: Canola meal supply expected to increase 1.7 million tonnes (85%)
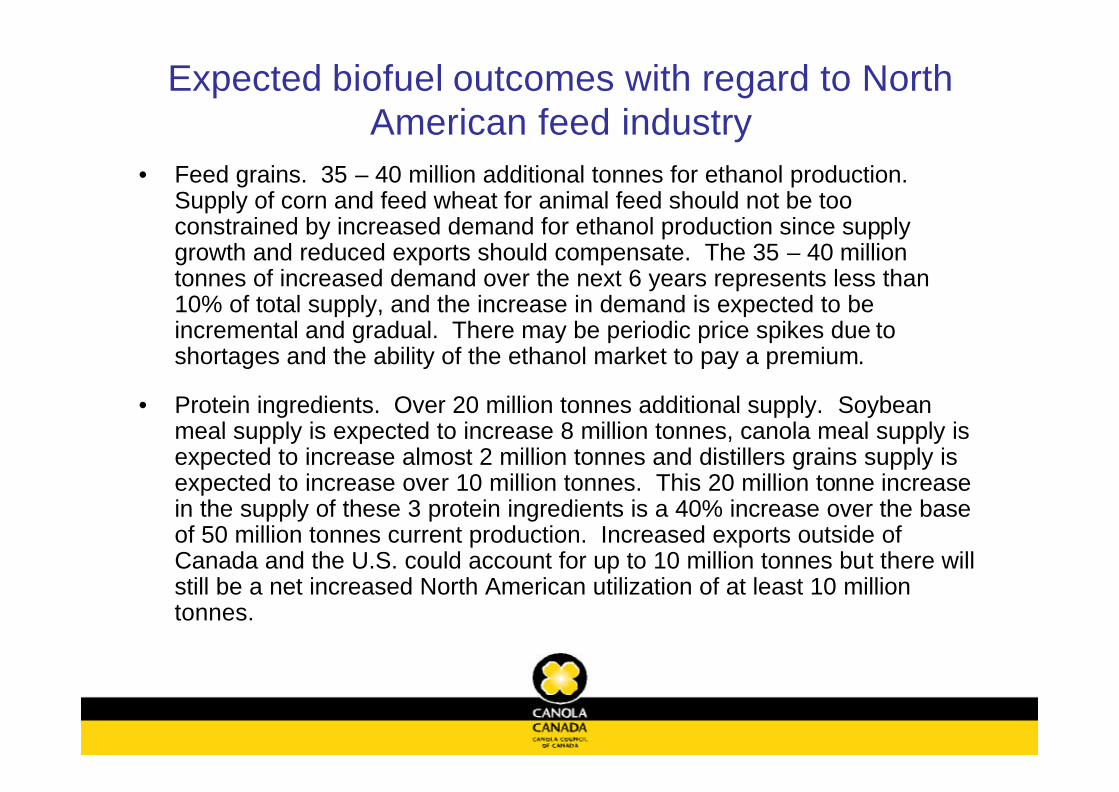
Expected biofuel outcomes with regard to North American feed industry
• Feed grains. 35 – 40 million additional tonnes for ethanol production. Supply of corn and feed wheat for animal feed should not be too constrained by increased demand for ethanol production since supply growth and reduced exports should compensate. The 35 – 40 million tonnes of increased demand over the next 6 years represents less than 10% of total supply, and the increase in demand is expected to be incremental and gradual. There may be periodic price spikes due to shortages and the ability of the ethanol market to pay a premium.
• Protein ingredients. Over 20 million tonnes additional supply. Soybean meal supply is expected to increase 8 million tonnes, canola meal supply is expected to increase almost 2 million tonnes and distillers grains supply is expected to increase over 10 million tonnes. This 20 million tonne increase in the supply of these 3 protein ingredients is a 40% increase over the base of 50 million tonnes current production. Increased exports outside of Canada and the U.S. could account for up to 10 million tonnes but there will still be a net increased North American utilization of at least 10 million tonnes.
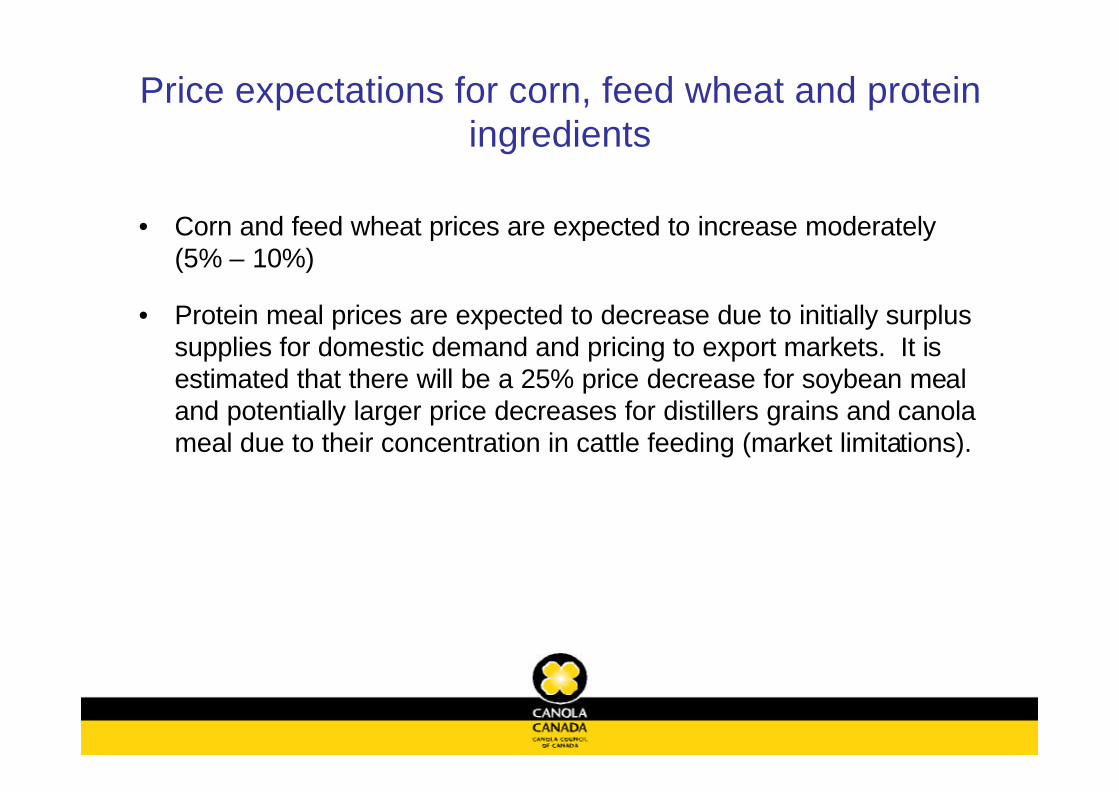
Price expectations for corn, feed wheat and protein ingredients
• Corn and feed wheat prices are expected to increase moderately (5% – 10%)
• Protein meal prices are expected to decrease due to initially surplus supplies for domestic demand and pricing to export markets. It is estimated that there will be a 25% price decrease for soybean meal and potentially larger price decreases for distillers grains and canola meal due to their concentration in cattle feeding (market limitations).

Chicago Soybean Meal Prices
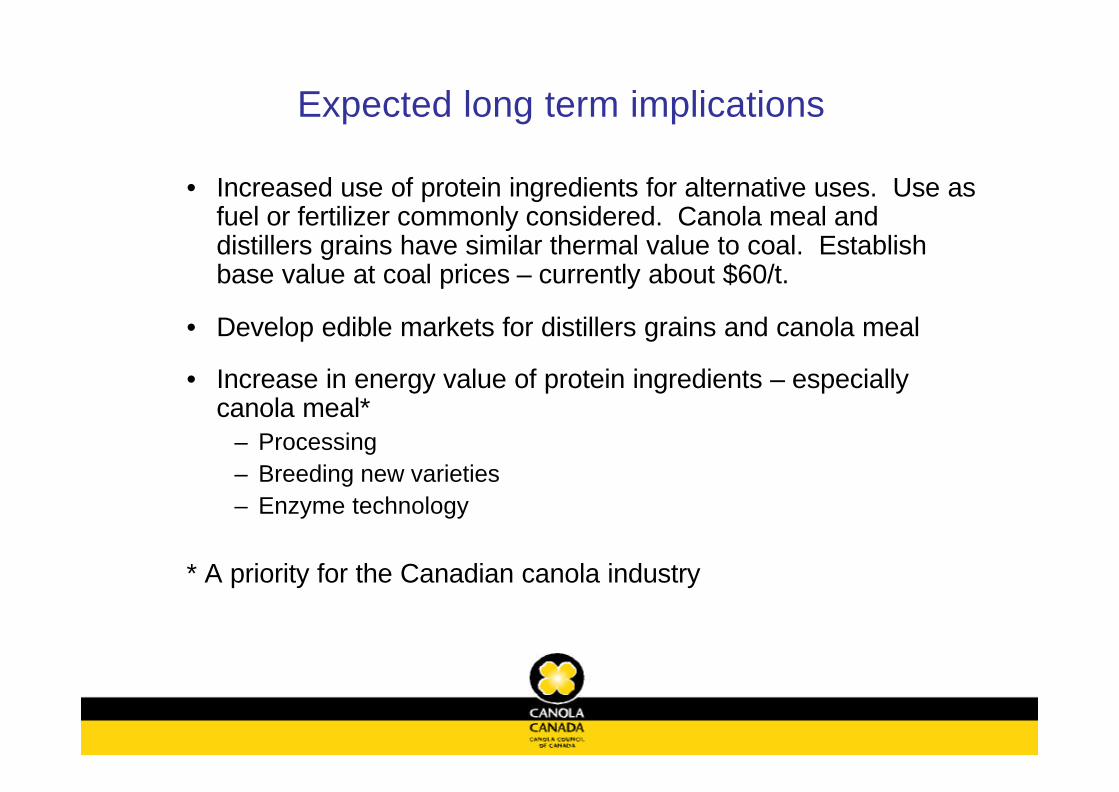
Expected long term implications
• Increased use of protein ingredients for alternative uses. Use as fuel or fertilizer commonly considered. Canola meal and distillers grains have similar thermal value to coal. Establishbase value at coal prices – currently about $60/t.
• Develop edible markets for distillers grains and canola meal
• Increase in energy value of protein ingredients – especially canola meal*
– Processing– Breeding new varieties– Enzyme technology
* A priority for the Canadian canola industry
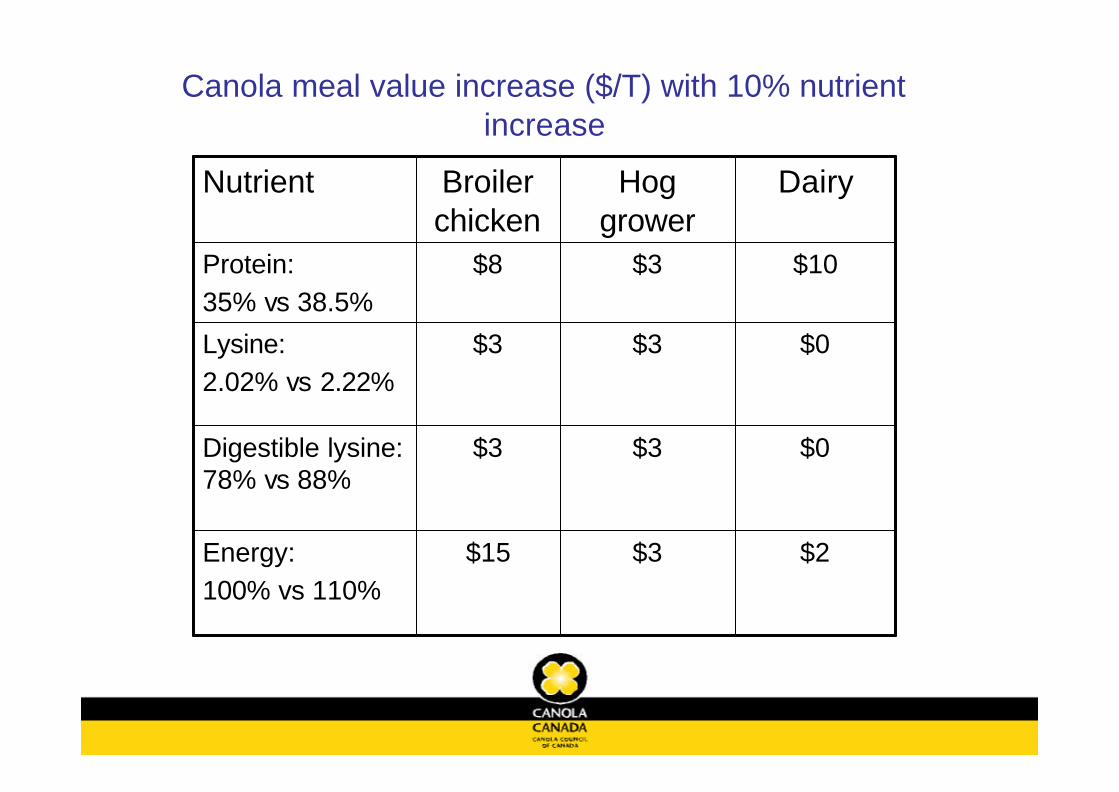
Canola meal value increase ($/T) with 10% nutrient increase
$2$3$15Energy:100% vs 110%
$0$3$3Digestible lysine: 78% vs 88%
$0$3$3Lysine:2.02% vs 2.22%
$10$3$8Protein:35% vs 38.5%
DairyHog grower
Broiler chicken
Nutrient
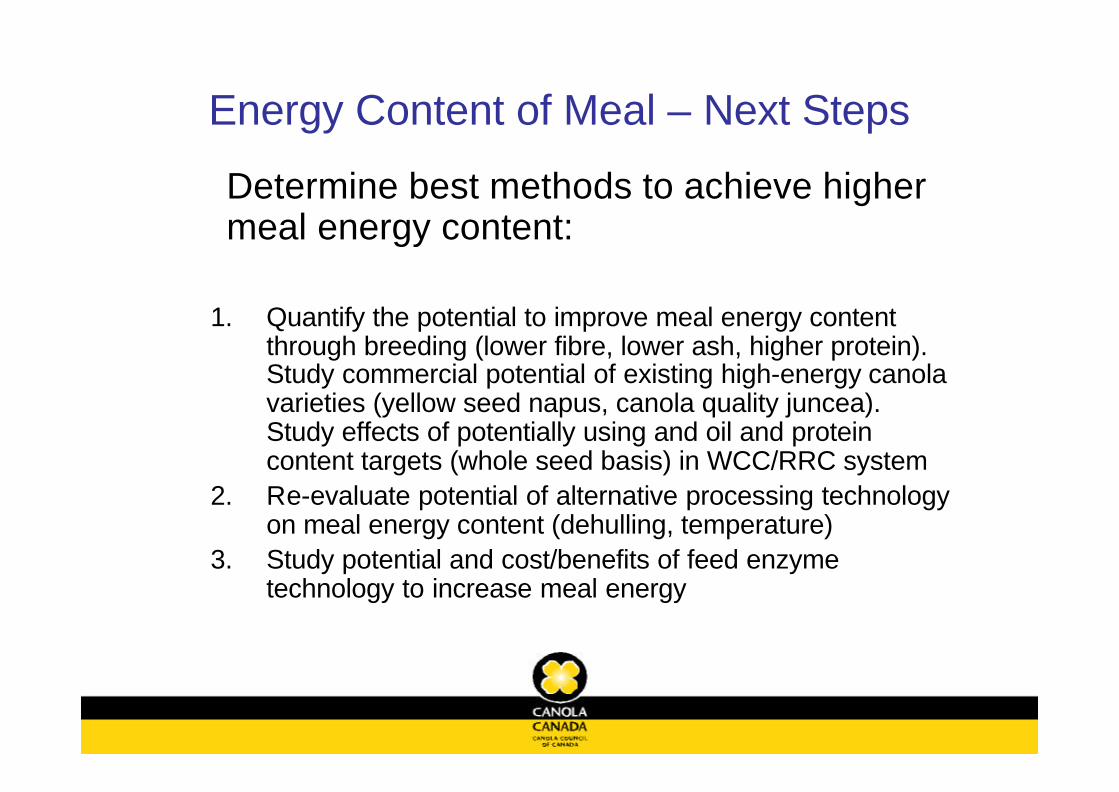
Energy Content of Meal – Next Steps
Determine best methods to achieve higher meal energy content:
1. Quantify the potential to improve meal energy content through breeding (lower fibre, lower ash, higher protein). Study commercial potential of existing high-energy canola varieties (yellow seed napus, canola quality juncea). Study effects of potentially using and oil and protein content targets (whole seed basis) in WCC/RRC system
2. Re-evaluate potential of alternative processing technology on meal energy content (dehulling, temperature)
3. Study potential and cost/benefits of feed enzyme technology to increase meal energy
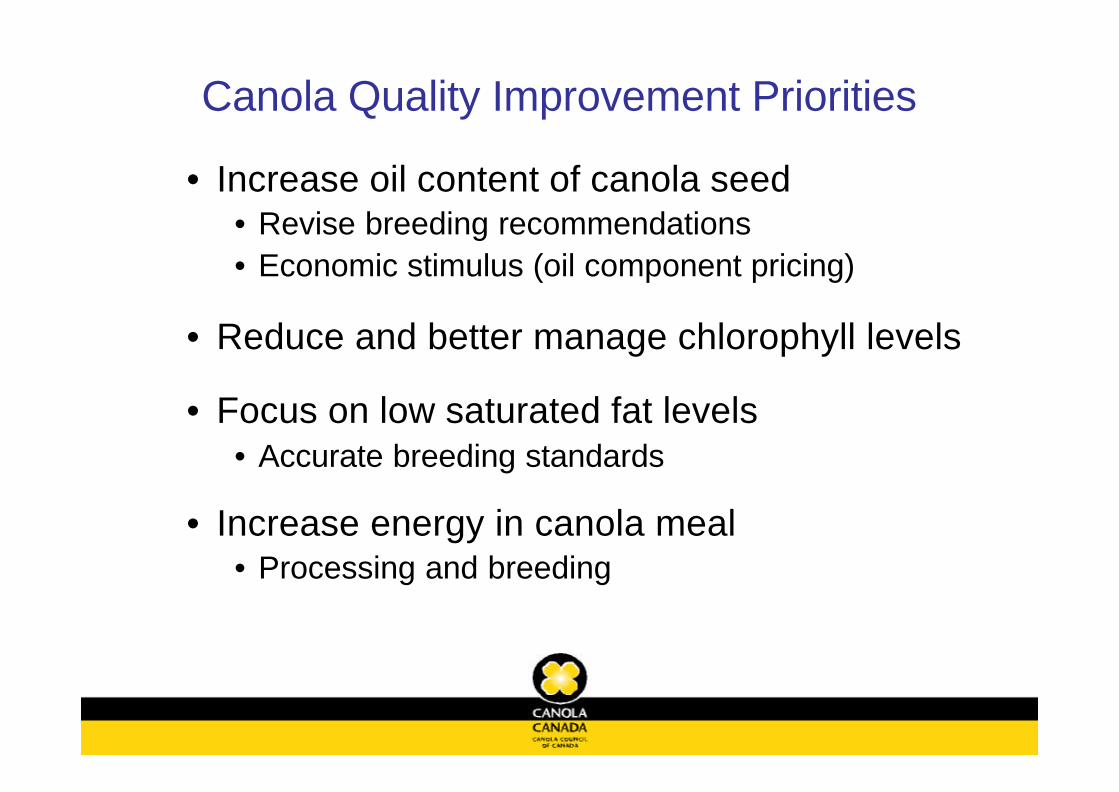
Canola Quality Improvement Priorities
• Increase oil content of canola seed• Revise breeding recommendations• Economic stimulus (oil component pricing)
• Reduce and better manage chlorophyll levels
• Focus on low saturated fat levels• Accurate breeding standards
• Increase energy in canola meal• Processing and breeding
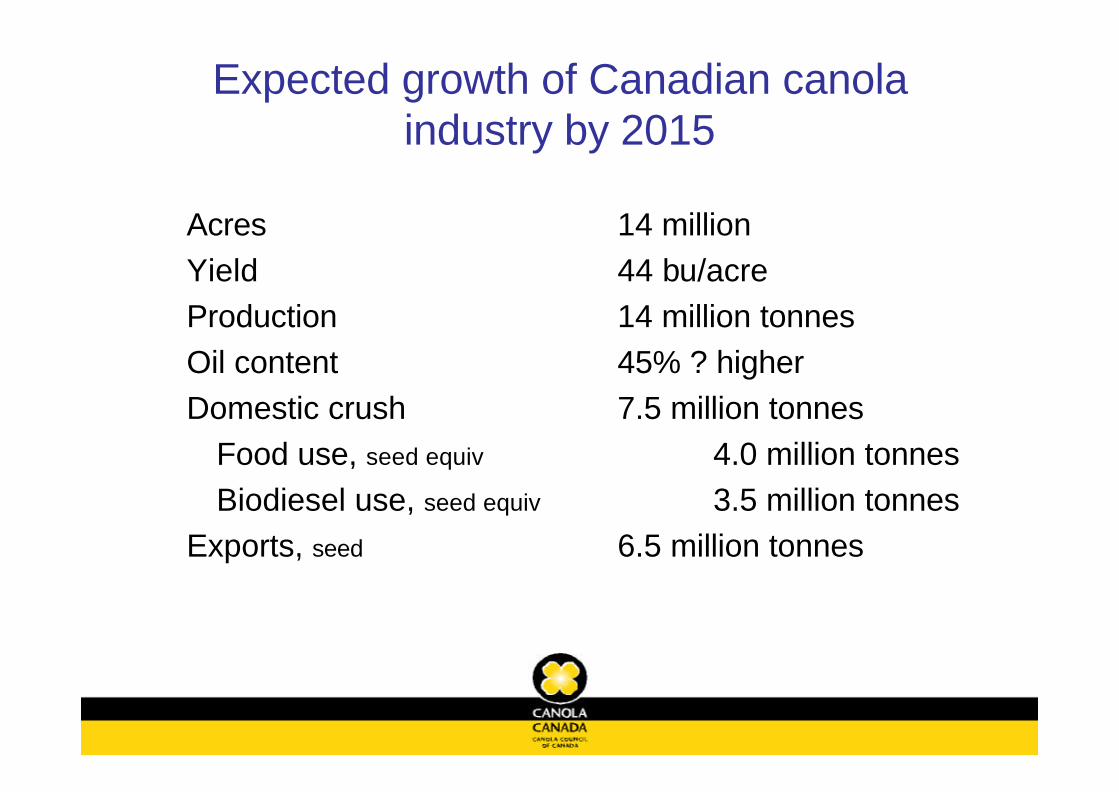
Expected growth of Canadian canola industry by 2015
Acres 14 millionYield 44 bu/acreProduction 14 million tonnesOil content 45% ? higherDomestic crush 7.5 million tonnes
Food use, seed equiv 4.0 million tonnesBiodiesel use, seed equiv 3.5 million tonnes
Exports, seed 6.5 million tonnes
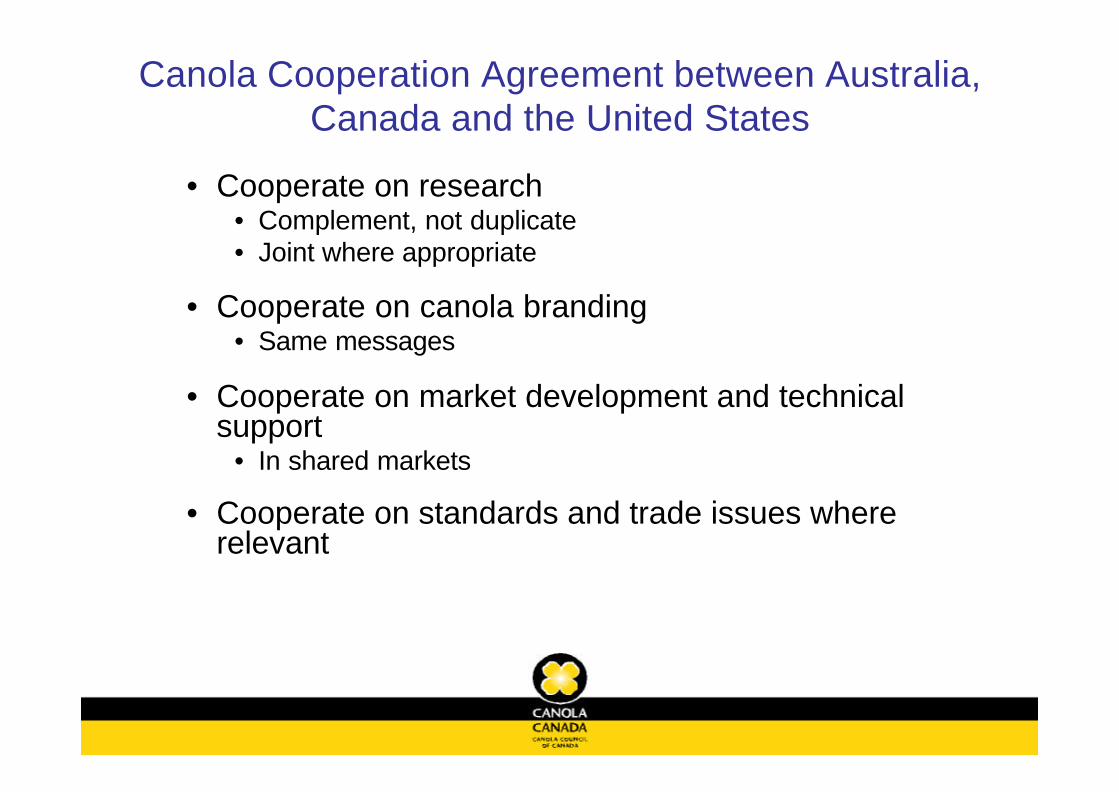
Canola Cooperation Agreement between Australia, Canada and the United States
• Cooperate on research• Complement, not duplicate• Joint where appropriate
• Cooperate on canola branding• Same messages
• Cooperate on market development and technical support
• In shared markets
• Cooperate on standards and trade issues where relevant

Thank you
www.canola-council.org


