Download - Bloomsburg Parking Study
2015
Town of Bloomsburg Parking Study MARCH 25, 2015
RESEARCH PARTICIPANTS & SUPPORT
The Town of Bloomsburg parking study was conducted as a student research project by students and faculty in the Department of Environmental, Geographical and Geological Sciences (EGGS) and the Department of Sociology, Social Work and Criminal Justice at Bloomsburg University of Pennsylvania. The study was supported by funding from the Bloomsburg University Foundation. Additional support was provided by the Columbia County GIS Office (Tim Murphy), the Town of Bloomsburg Police Department, Downtown Bloomsburg Inc., and the Bloomsburg University Center for Community Research and Consulting.
Student Research Assistants:
Anthony T. DiBiase – Senior, Department of Environmental, Geographical and Geological Sciences
Steven Staats – Graduate, Department of Sociology, Social Work and Criminal Justice
Ty Gambler – Graduate, Department of Sociology, Social Work and Criminal Justice
Faculty Advisors:
Jeff Brunskill – Associate Professor, Department of Environmental, Geographical and Geological Sciences
Chris Podeschi – Associate Professor, Department of Sociology, Social Work and Criminal Justice
Student Volunteers:
Billy Shoop Paul Deppen Justin Gonzalez Jon Letizo Matt Hess Blake Senft Johannah Lowe Morris Cooper
Katie Coleman Jon Letzio Kyle Shaffer Jim Smith Josie Legere Danielle P. Josh Wilson Ashakee Jackson
Matt Mattesini Avram Slone Danielle Empson Chelsea Myers Khadija L. Justin G. Hannah Davis Kyle Postupack
Alaina Swiston Victor Nwachukwu Penny M. Adrianna Grace Ladd Audra Mitchell Lauren E. Sam Plocinski
Rochelle Richards Kim King Melissa Sears Sam S. Caleb Myers Gegory Jackson Paul Deppen Molly Davis
Bloomsburg Parking Study – 1.1
CONTENTS
Section 1: Introduction & Methodology
Section 2: Overall Parking Sweep Results
Section 3: Street-side Parking Sweep Results
Section 4: Parking Lot Sweep Results
Section 5: Survey Results
Section 6: Concluding Remarks
Appendices: Employee / Patron Surveys and Survey Tables
Bloomsburg Parking Study – 1.2
2015
1 - Introduction and Methodology MARCH 25, 2015
1.0 – INTRODUCTION
Introduction – In the fall of 2013 and spring of 2014 students and faculty from the Bloomsburg University Department of Environmental, Geographical, and Geological Sciences (EGGS) Department and the Department of Sociology conducted a study of parking in downtown Bloomsburg, Pennsylvania. The general objective was to study the availability of parking spaces in town-maintained lots and along the sides of streets. A particular goal was to explore spatial variations in parking throughout downtown and temporal changes in parking over the course of a day to determine if the number of available spots were sufficient for business patrons. The parking study was conducted using a two-pronged approach. First, a parking space inventory was conducted by teams of student volunteers from 8 AM until 9 PM over the course of six days to track use of downtown parking spaces. Hourly sweeps were conducted each day to study which spaces were occupied, and how long cars occupied a given spot. Second, written surveys were distributed to downtown patrons as well as employees, managers and owners of downtown businesses to explore their parking behaviors and their perceptions of parking availability in downtown Bloomsburg.
The results of the study offer insights into the following questions:
1. How does street-side parking congestion vary throughout the day and over the course of the week?
2. How does the use of permitted parking lots vary throughout the day and over the course of the week?
3. To what degree do business owners, employees and patrons impact the congestion?
4. How do employees, business owners, and patrons perceive the availability and distribution of parking in the Town of Bloomsburg?
Bloomsburg Parking Study – 1.1
1.1 METHODOLOGY
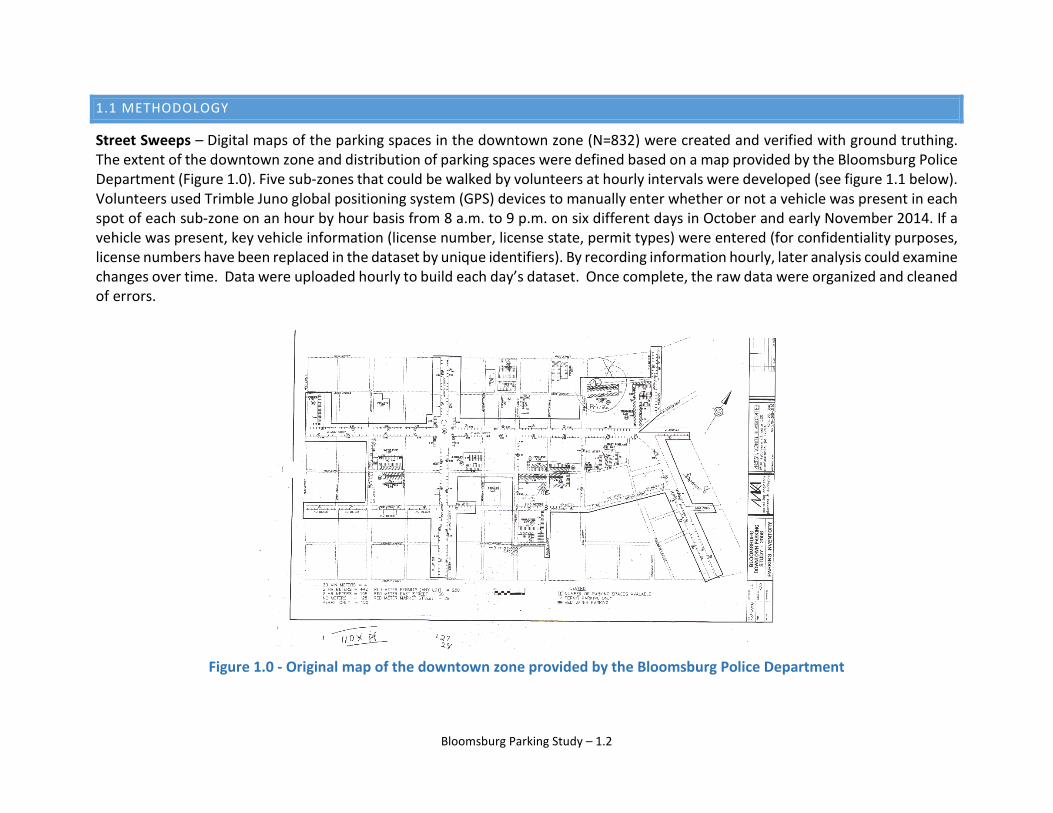
Street Sweeps – Digital maps of the parking spaces in the downtown zone (N=832) were created and verified with ground truthing. The extent of the downtown zone and distribution of parking spaces were defined based on a map provided by the Bloomsburg Police Department (Figure 1.0). Five sub-zones that could be walked by volunteers at hourly intervals were developed (see figure 1.1 below). Volunteers used Trimble Juno global positioning system (GPS) devices to manually enter whether or not a vehicle was present in each spot of each sub-zone on an hour by hour basis from 8 a.m. to 9 p.m. on six different days in October and early November 2014. If a vehicle was present, key vehicle information (license number, license state, permit types) were entered (for confidentiality purposes, license numbers have been replaced in the dataset by unique identifiers). By recording information hourly, later analysis could examine changes over time. Data were uploaded hourly to build each day’s dataset. Once complete, the raw data were organized and cleaned of errors.
Figure 1.0 - Original map of the downtown zone provided by the Bloomsburg Police Department
Bloomsburg Parking Study – 1.2
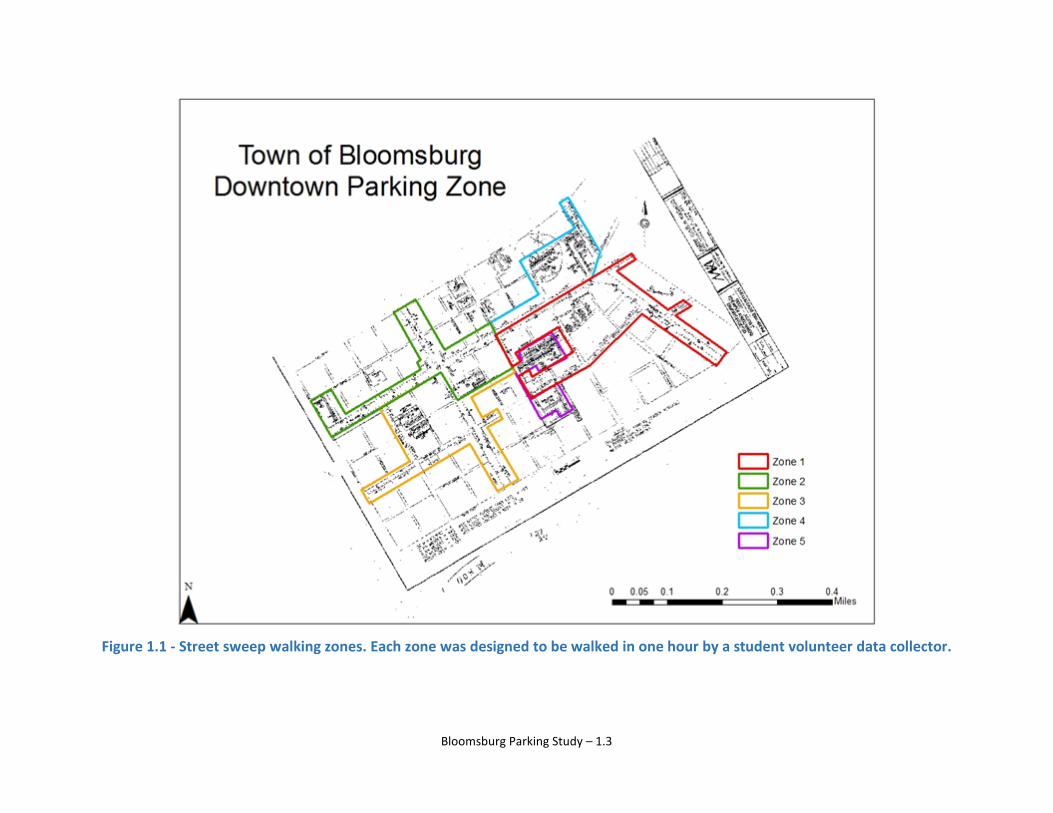
Figure 1.1 - Street sweep walking zones. Each zone was designed to be walked in one hour by a student volunteer data collector.
Bloomsburg Parking Study – 1.3
Surveys – Two versions of a questionnaire were developed, one for downtown patrons (i.e., visitors to the downtown zone) and one for employees, managers and owners (see Appendix). Most questions were asked on both versions, but a handful of questions only applied to patrons or only to employees, managers and owners. Each survey asked a handful of demographic questions, about transportation to the downtown zone, about parking habits in the downtown zone, and about respondents’ opinions of parking in the downtown zone. Patrons were also asked if parking frustration ever caused them to choose not to visit downtown. After training volunteers about proper administration, sampling, and the importance obtaining informed consent, student volunteers administered the survey in April 2014. For employees, managers and owners, the survey team made an effort to get as many responses from as many businesses as possible. For patrons, a “maximum diversity” sampling approach was used, i.e., student researchers were asked to vary the demographics of people approached as much as possible to ensure various walks of life were represented in the dataset.
The employer and patron surveys are listed in the appendix section.
Bloomsburg Parking Study – 1.4
2015
2 – Overall Parking Sweep Results TOWN OF BLOOMSBURG PARKING STUDY
2.0 RESULTS – RAW DATA
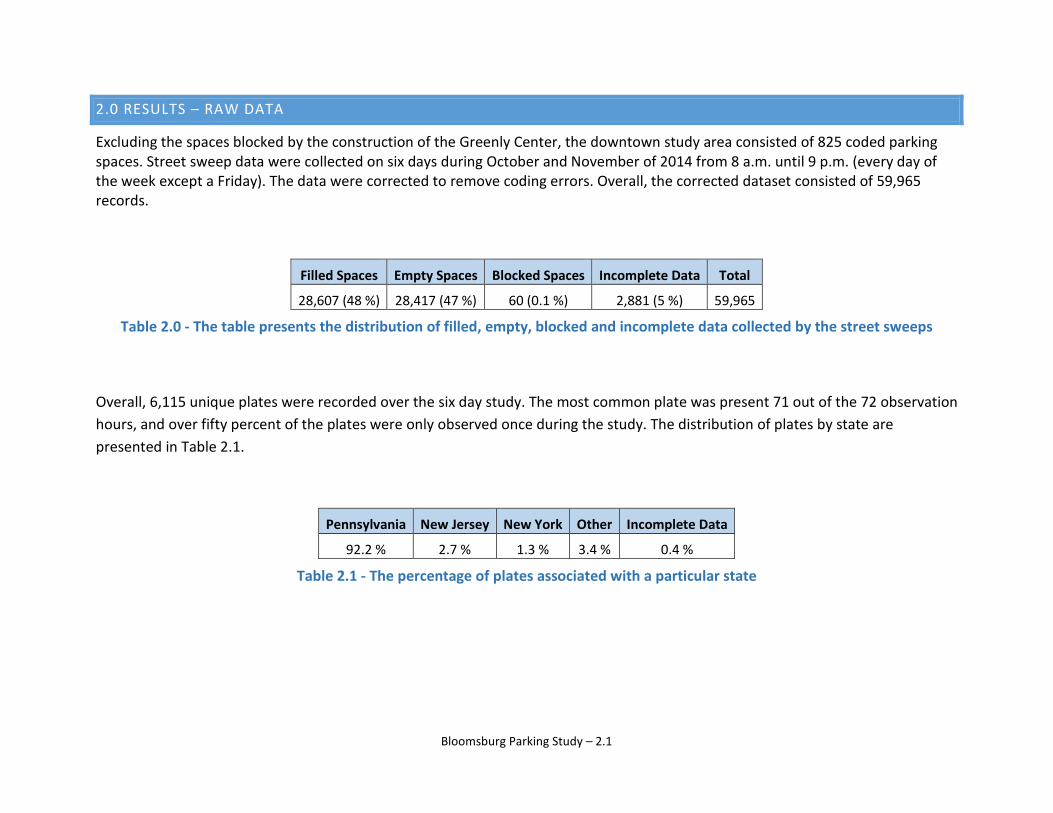
Excluding the spaces blocked by the construction of the Greenly Center, the downtown study area consisted of 825 coded parking spaces. Street sweep data were collected on six days during October and November of 2014 from 8 a.m. until 9 p.m. (every day of the week except a Friday). The data were corrected to remove coding errors. Overall, the corrected dataset consisted of 59,965 records.
Filled Spaces Empty Spaces Blocked Spaces Incomplete Data Total
28,607 (48 %) 28,417 (47 %) 60 (0.1 %) 2,881 (5 %) 59,965
Table 2.0 - The table presents the distribution of filled, empty, blocked and incomplete data collected by the street sweeps
Overall, 6,115 unique plates were recorded over the six day study. The most common plate was present 71 out of the 72 observation hours, and over fifty percent of the plates were only observed once during the study. The distribution of plates by state are presented in Table 2.1.
Pennsylvania New Jersey New York Other Incomplete Data
92.2 % 2.7 % 1.3 % 3.4 % 0.4 %
Table 2.1 - The percentage of plates associated with a particular state
Bloomsburg Parking Study – 2.1
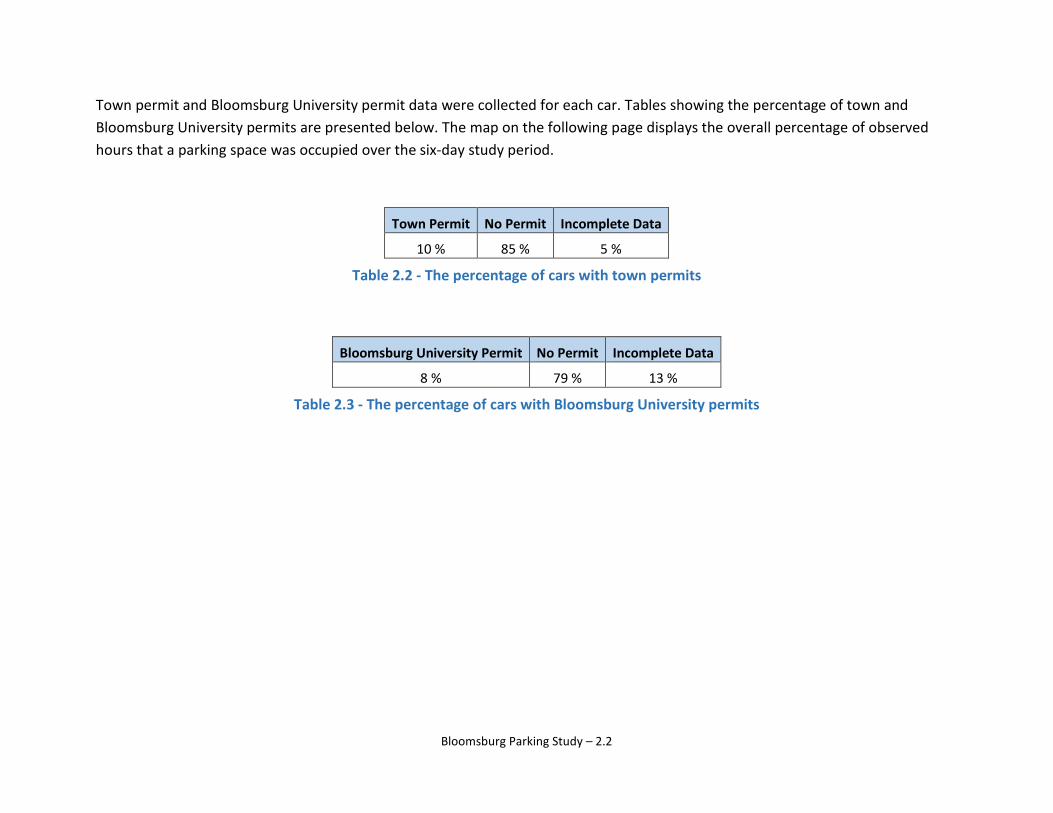
Town permit and Bloomsburg University permit data were collected for each car. Tables showing the percentage of town and Bloomsburg University permits are presented below. The map on the following page displays the overall percentage of observed hours that a parking space was occupied over the six-day study period.
Town Permit No Permit Incomplete Data
10 % 85 % 5 %
Table 2.2 - The percentage of cars with town permits
Bloomsburg University Permit No Permit Incomplete Data
8 % 79 % 13 %
Table 2.3 - The percentage of cars with Bloomsburg University permits
Bloomsburg Parking Study – 2.2
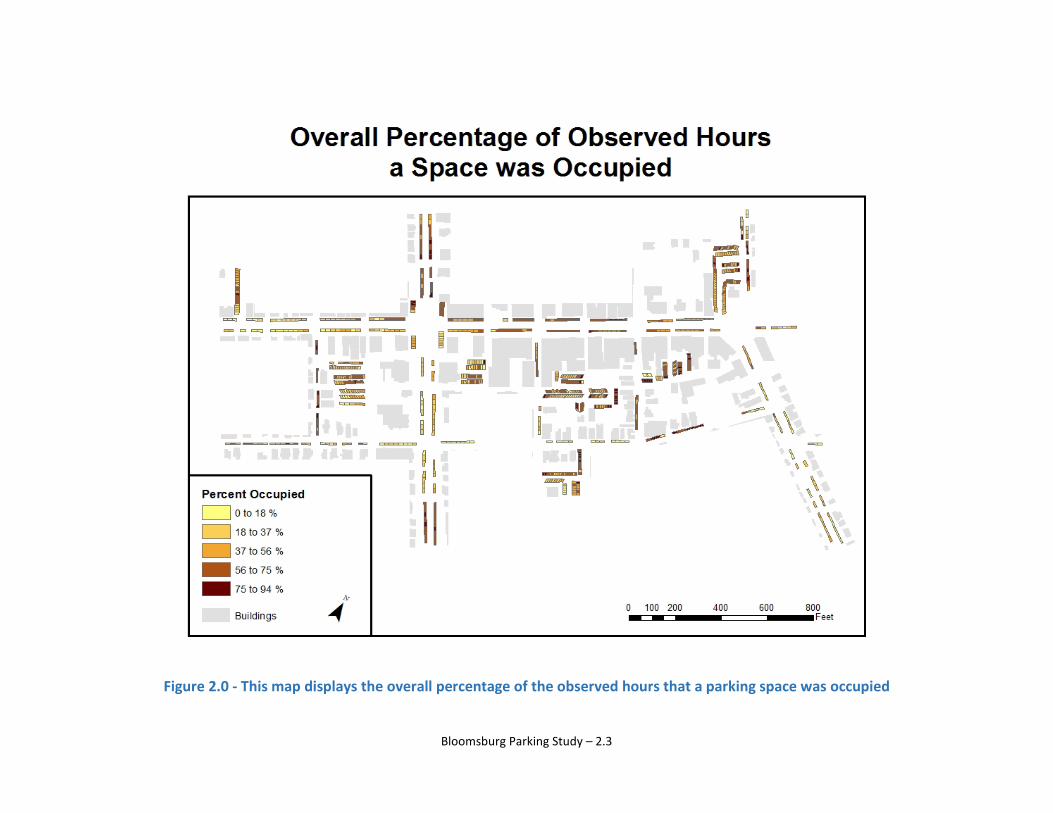
Figure 2.0 - This map displays the overall percentage of the observed hours that a parking space was occupied
Bloomsburg Parking Study – 2.3
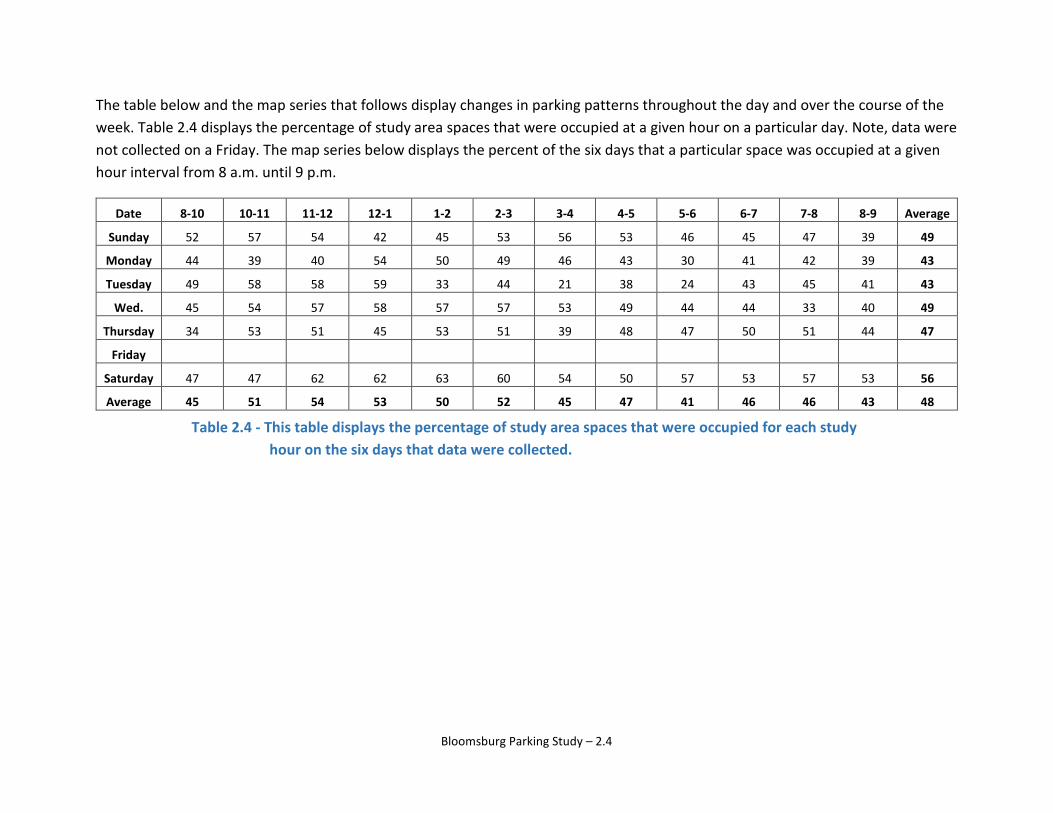
The table below and the map series that follows display changes in parking patterns throughout the day and over the course of the week. Table 2.4 displays the percentage of study area spaces that were occupied at a given hour on a particular day. Note, data were not collected on a Friday. The map series below displays the percent of the six days that a particular space was occupied at a given hour interval from 8 a.m. until 9 p.m.
Date 8-10 10-11 11-12 12-1 1-2 2-3 3-4 4-5 5-6 6-7 7-8 8-9 Average
Sunday 52 57 54 42 45 53 56 53 46 45 47 39 49
Monday 44 39 40 54 50 49 46 43 30 41 42 39 43
Tuesday 49 58 58 59 33 44 21 38 24 43 45 41 43
Wed. 45 54 57 58 57 57 53 49 44 44 33 40 49
Thursday 34 53 51 45 53 51 39 48 47 50 51 44 47
Friday
Saturday 47 47 62 62 63 60 54 50 57 53 57 53 56
Average 45 51 54 53 50 52 45 47 41 46 46 43 48
Table 2.4 - This table displays the percentage of study area spaces that were occupied for each study hour on the six days that data were collected.
Bloomsburg Parking Study – 2.4

Figure 2.1 - This map displays the percent of the six observation days that a parking space was filled during the 8-10 hour.
Bloomsburg Parking Study – 2.5

Figure 2.2 - This map displays the percent of the six observation days that a parking space was filled during the 10-11 hour.
Bloomsburg Parking Study – 2.6

Figure 2.3 - This map displays the percent of the six observation days that a parking space was filled during the 11-12 hour.
Bloomsburg Parking Study – 2.7

Figure 2.4 - This map displays the percent of the six observation days that a parking space was filled during the 12-1 hour.
Bloomsburg Parking Study – 2.8

Figure 2.5 - This map displays the percent of the six observation days that a parking space was filled during the 1-2 hour.
Bloomsburg Parking Study – 2.9
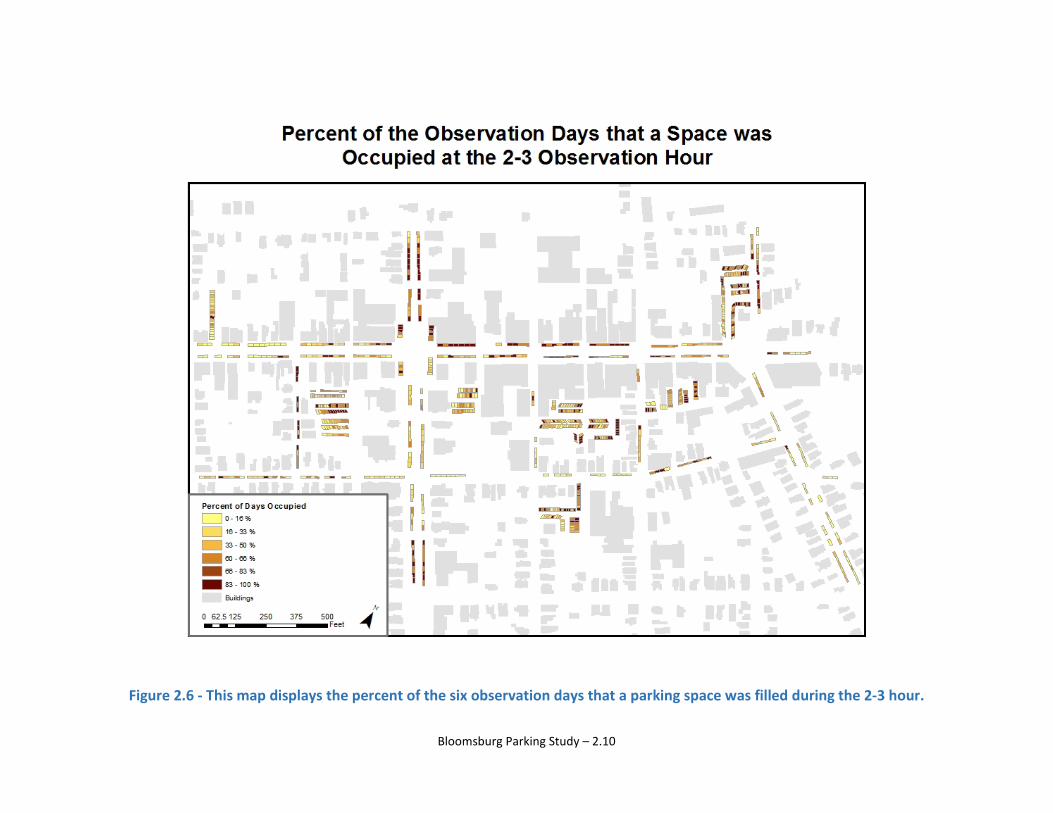
Figure 2.6 - This map displays the percent of the six observation days that a parking space was filled during the 2-3 hour.
Bloomsburg Parking Study – 2.10

Figure 2.7 - This map displays the percent of the six observation days that a parking space was filled during the 3-4 hour.
Bloomsburg Parking Study – 2.11

Figure 2.8 - This map displays the percent of the six observation days that a parking space was filled during the 4-5 hour.
Bloomsburg Parking Study – 2.12

Figure 2.9 - This map displays the percent of the six observation days that a parking space was filled during the 5-6 hour.
Bloomsburg Parking Study – 2.13

Figure 2.10 - This map displays the percent of the six observation days that a parking space was filled during the 6-7 hour.
Bloomsburg Parking Study – 2.14

Figure 2.11 - This map displays the percent of the six observation days that a parking space was filled during the 7-8 hour.
Bloomsburg Parking Study – 2.15

Figure 2.12 - This map displays the percent of the six observation days that a parking space was filled during the 8-9 hour.
Bloomsburg Parking Study – 2.16
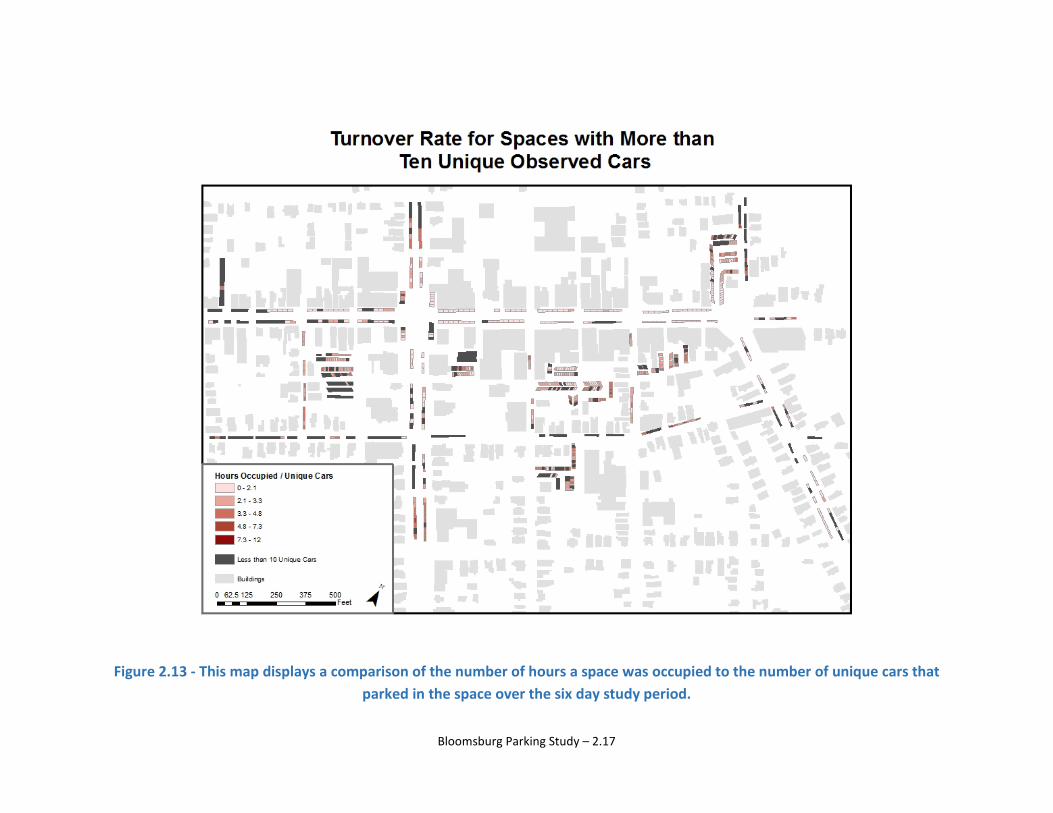
Figure 2.13 - This map displays a comparison of the number of hours a space was occupied to the number of unique cars that parked in the space over the six day study period.
Bloomsburg Parking Study – 2.17
2015
3 – Street-side Parking Sweep Results TOWN OF BLOOMSBURG PARKING STUDY
3.0 STREETSIDE PARKING – OVERALL RESULTS
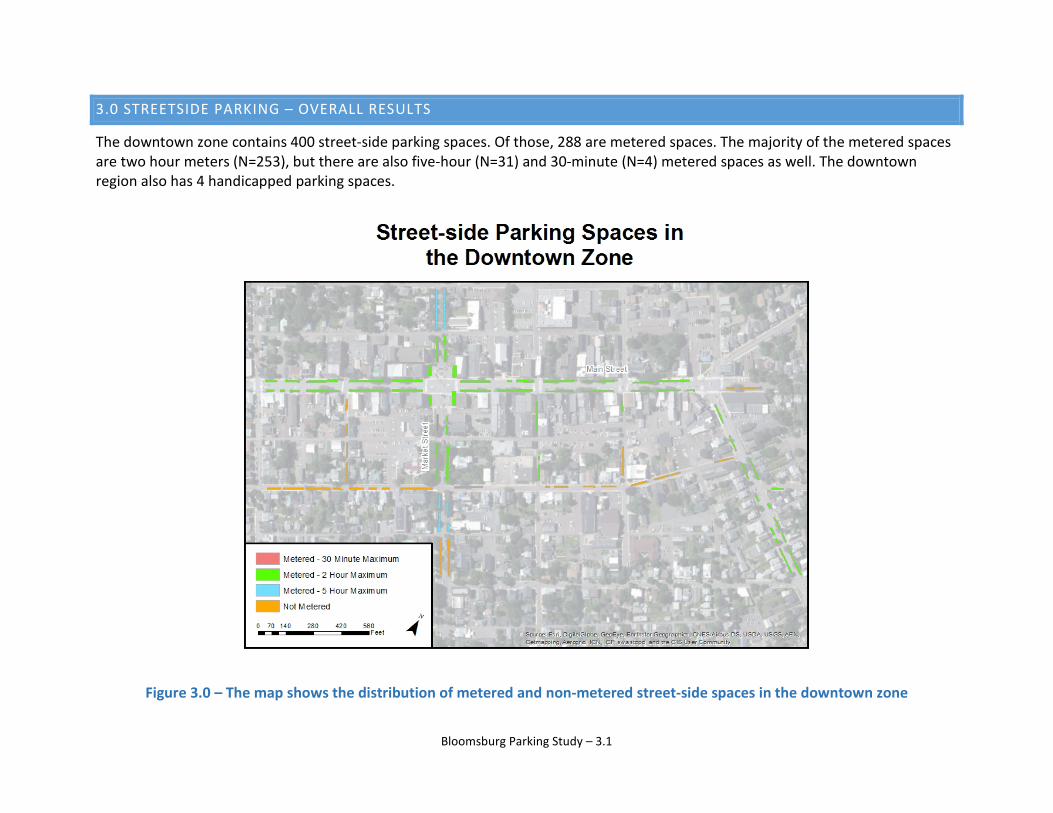
The downtown zone contains 400 street-side parking spaces. Of those, 288 are metered spaces. The majority of the metered spaces are two hour meters (N=253), but there are also five-hour (N=31) and 30-minute (N=4) metered spaces as well. The downtown region also has 4 handicapped parking spaces.
Figure 3.0 – The map shows the distribution of metered and non-metered street-side spaces in the downtown zone
Bloomsburg Parking Study – 3.1
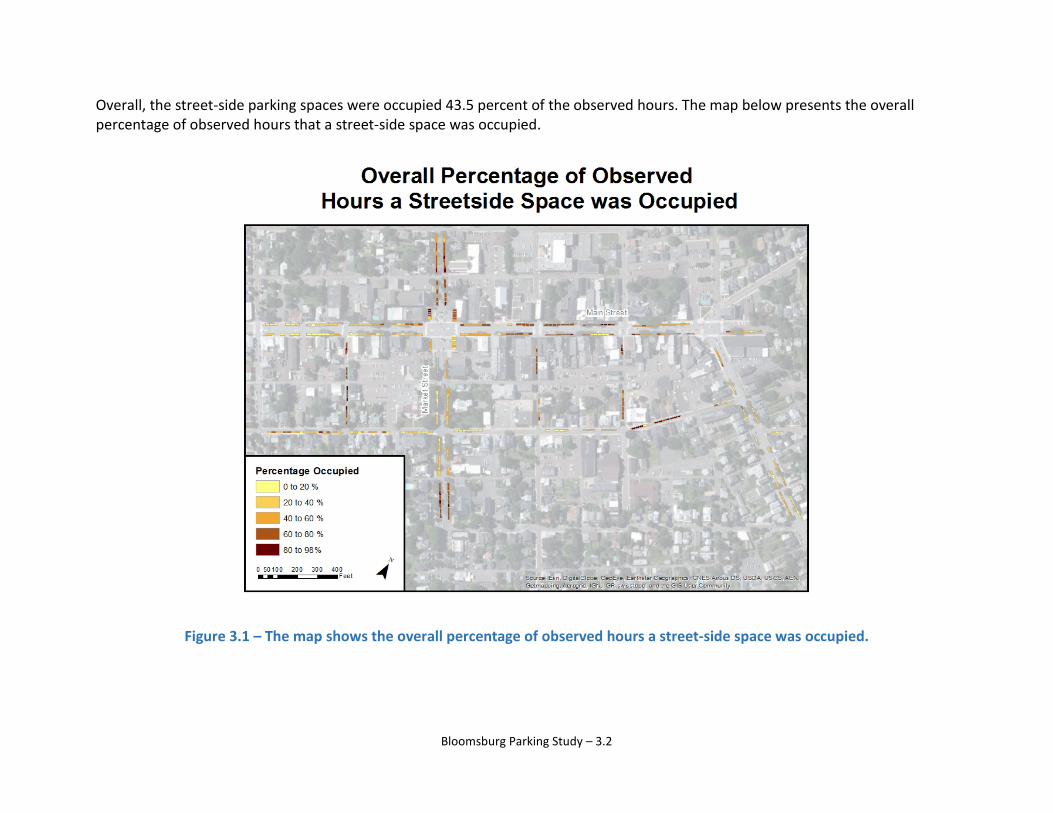
Overall, the street-side parking spaces were occupied 43.5 percent of the observed hours. The map below presents the overall percentage of observed hours that a street-side space was occupied.
Figure 3.1 – The map shows the overall percentage of observed hours a street-side space was occupied.
Bloomsburg Parking Study – 3.2
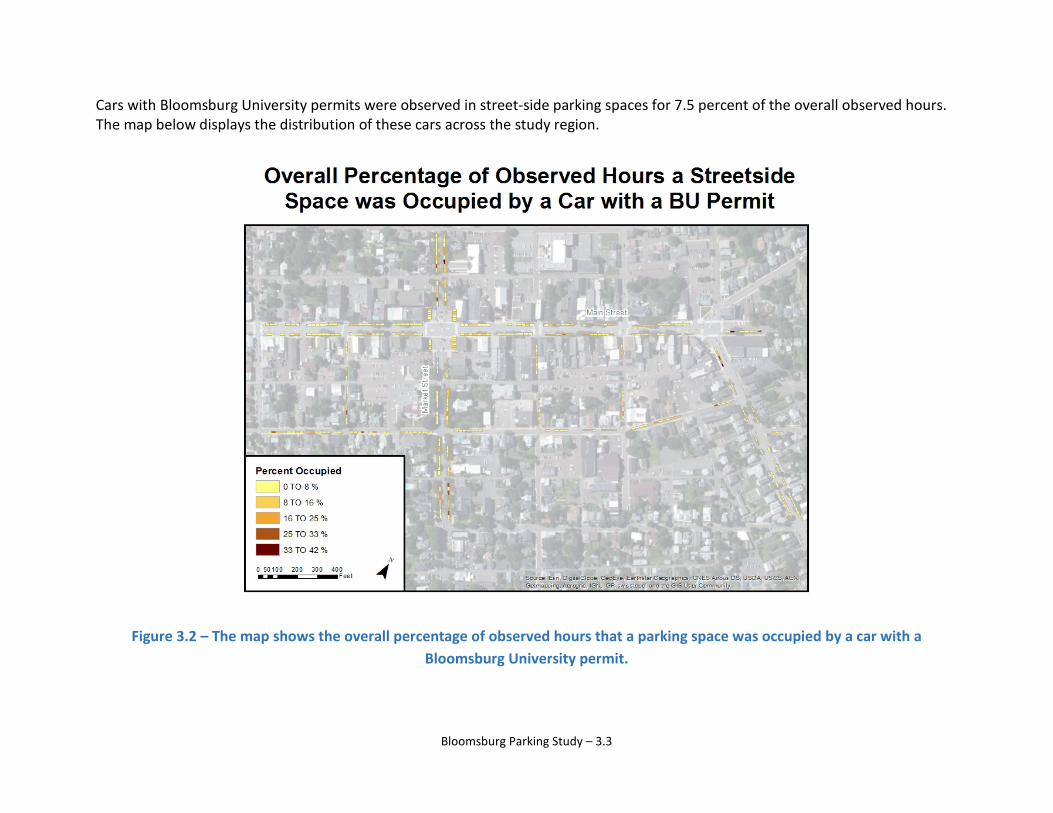
Cars with Bloomsburg University permits were observed in street-side parking spaces for 7.5 percent of the overall observed hours. The map below displays the distribution of these cars across the study region.
Figure 3.2 – The map shows the overall percentage of observed hours that a parking space was occupied by a car with a Bloomsburg University permit.
Bloomsburg Parking Study – 3.3
2015
4 – Parking Lot Sweep Results TOWN OF BLOOMSBURG PARKING STUDY
4.0 PARKING LOT ANALYSIS - OVERVIEW
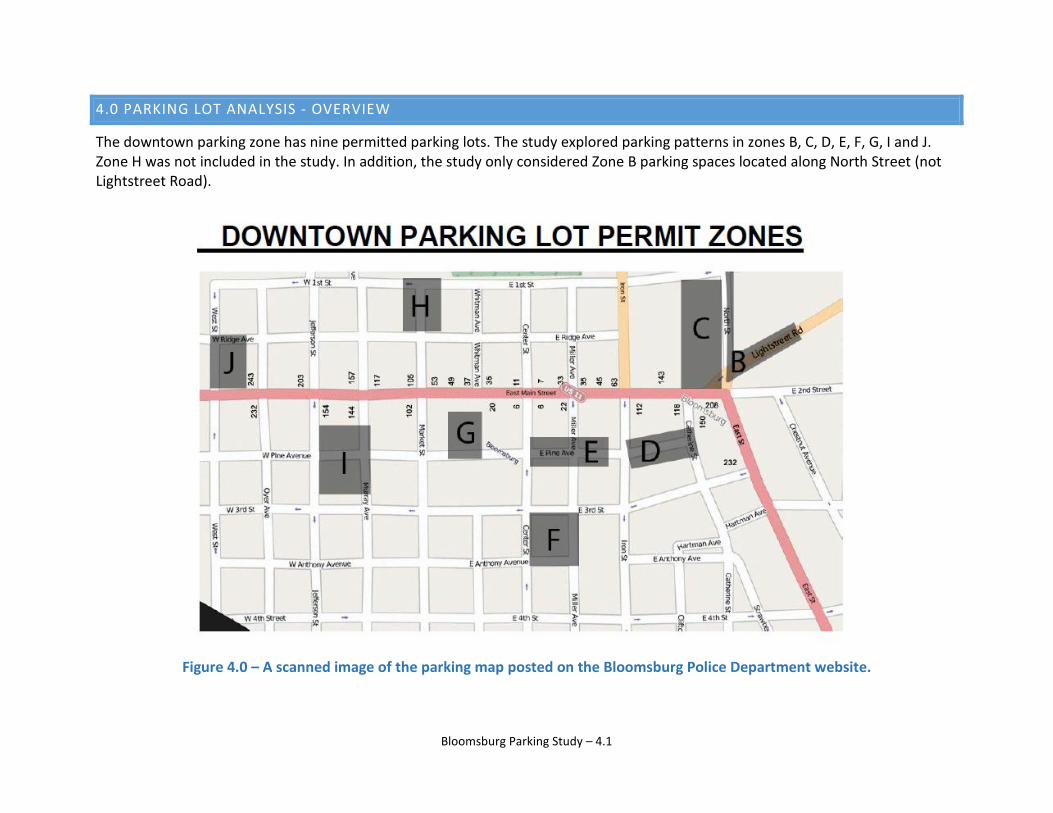
The downtown parking zone has nine permitted parking lots. The study explored parking patterns in zones B, C, D, E, F, G, I and J. Zone H was not included in the study. In addition, the study only considered Zone B parking spaces located along North Street (not Lightstreet Road).
Figure 4.0 – A scanned image of the parking map posted on the Bloomsburg Police Department website.
Bloomsburg Parking Study – 4.1
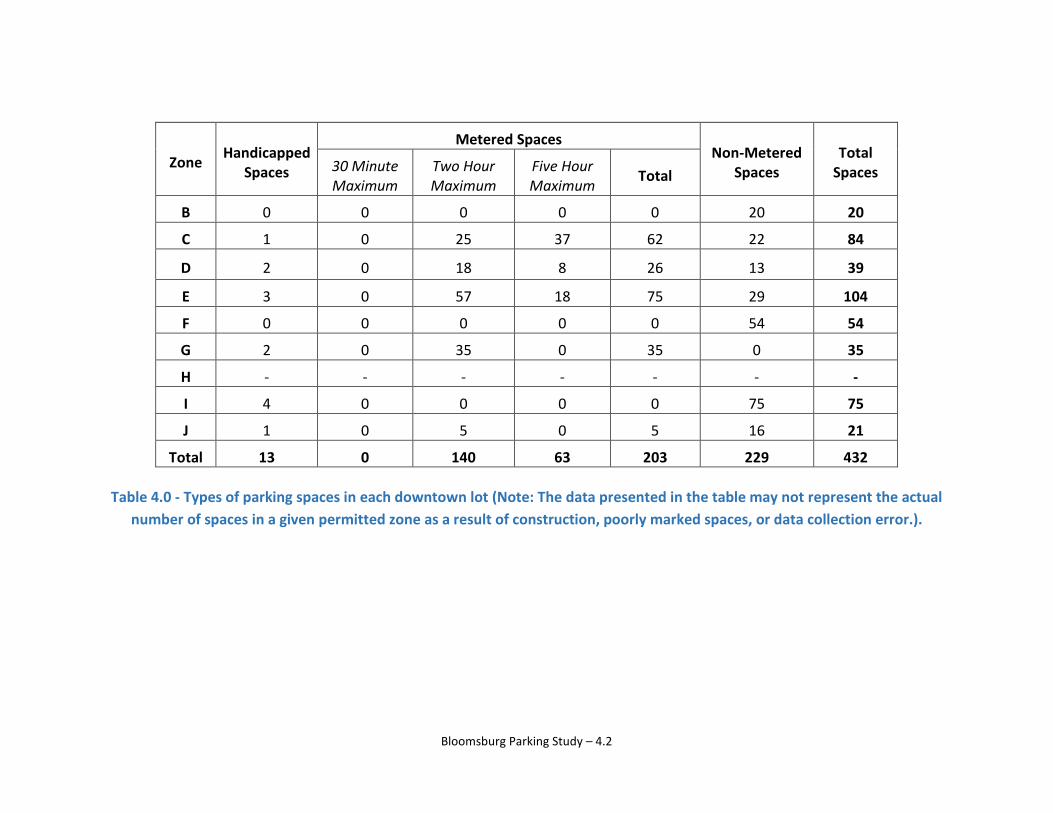
Table 4.0 - Types of parking spaces in each downtown lot (Note: The data presented in the table may not represent the actual number of spaces in a given permitted zone as a result of construction, poorly marked spaces, or data collection error.).
Zone Handicapped Spaces
Metered Spaces Non-Metered
Spaces Total
Spaces 30 Minute Maximum
Two Hour Maximum
Five Hour Maximum Total
B 0 0 0 0 0 20 20
C 1 0 25 37 62 22 84
D 2 0 18 8 26 13 39
E 3 0 57 18 75 29 104
F 0 0 0 0 0 54 54
G 2 0 35 0 35 0 35
H - - - - - - -
I 4 0 0 0 0 75 75
J 1 0 5 0 5 16 21
Total 13 0 140 63 203 229 432
Bloomsburg Parking Study – 4.2
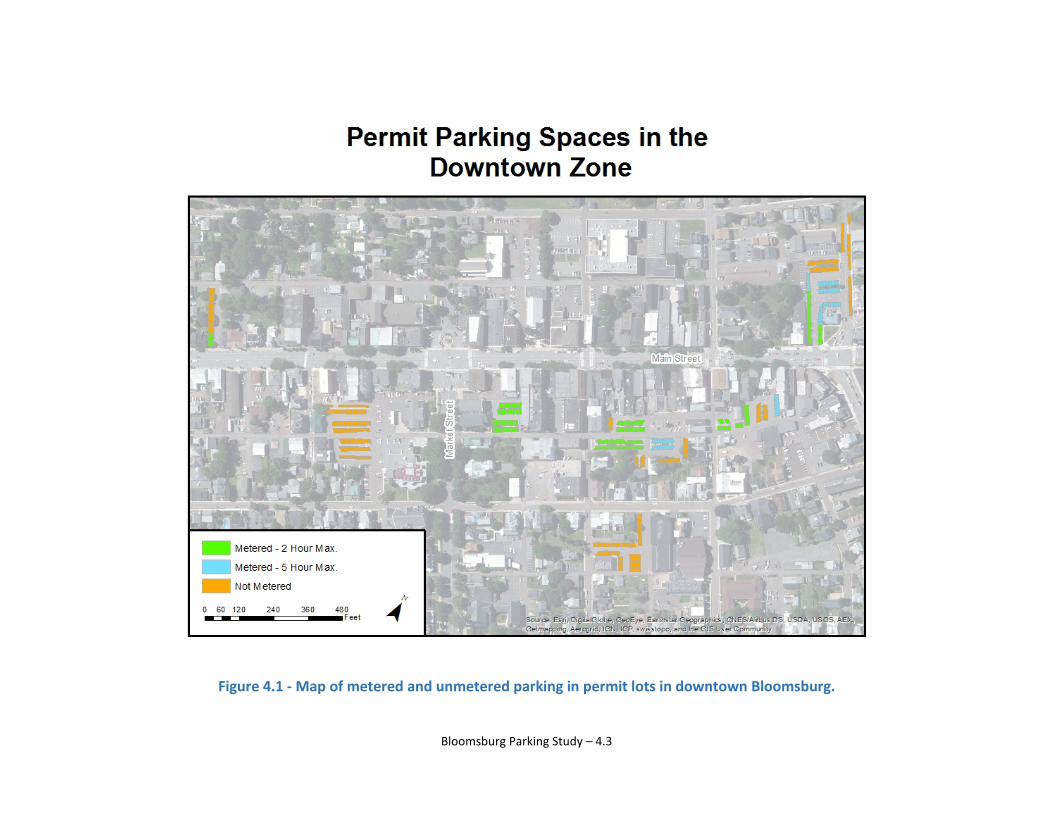
Figure 4.1 - Map of metered and unmetered parking in permit lots in downtown Bloomsburg.
Bloomsburg Parking Study – 4.3
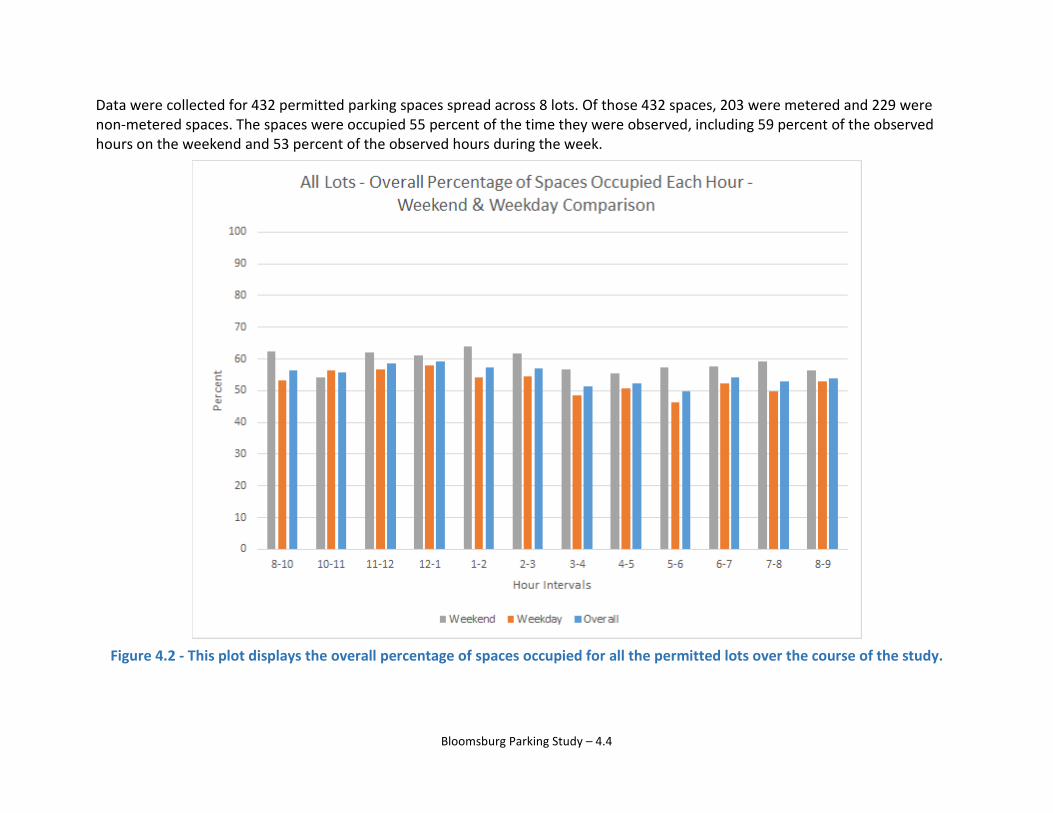
Data were collected for 432 permitted parking spaces spread across 8 lots. Of those 432 spaces, 203 were metered and 229 were non-metered spaces. The spaces were occupied 55 percent of the time they were observed, including 59 percent of the observed hours on the weekend and 53 percent of the observed hours during the week.
Figure 4.2 - This plot displays the overall percentage of spaces occupied for all the permitted lots over the course of the study.
Bloomsburg Parking Study – 4.4
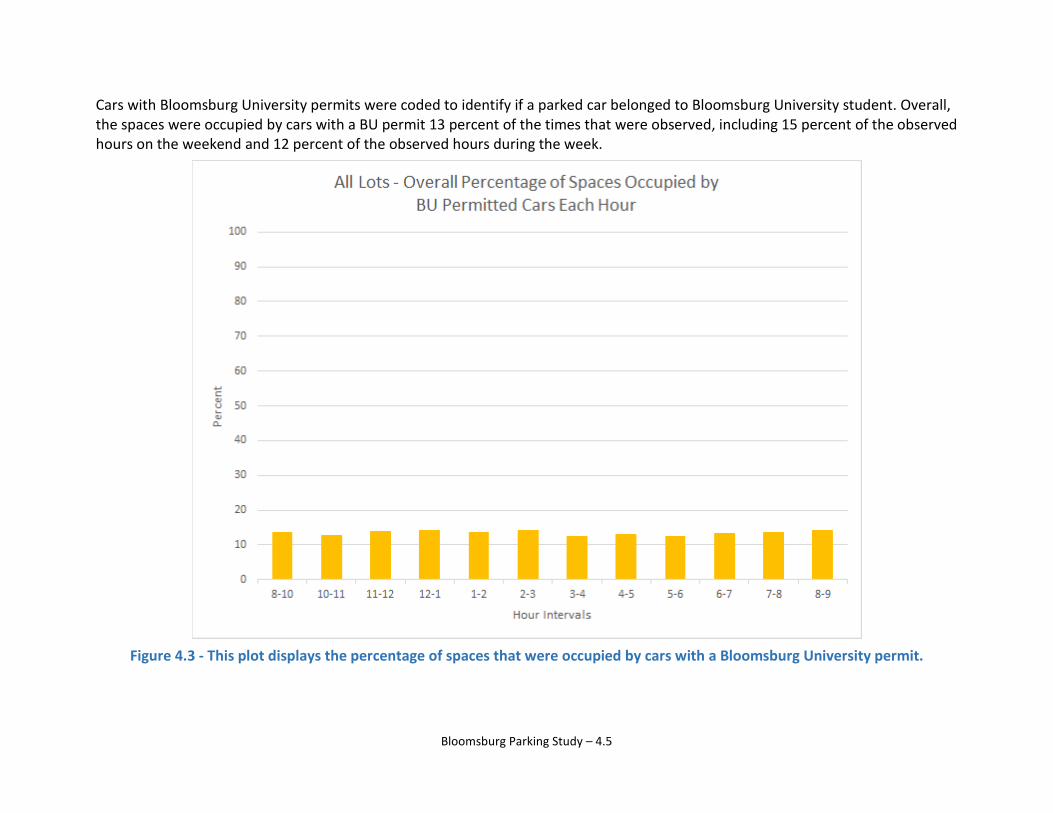
Cars with Bloomsburg University permits were coded to identify if a parked car belonged to Bloomsburg University student. Overall, the spaces were occupied by cars with a BU permit 13 percent of the times that were observed, including 15 percent of the observed hours on the weekend and 12 percent of the observed hours during the week.
Figure 4.3 - This plot displays the percentage of spaces that were occupied by cars with a Bloomsburg University permit.
Bloomsburg Parking Study – 4.5
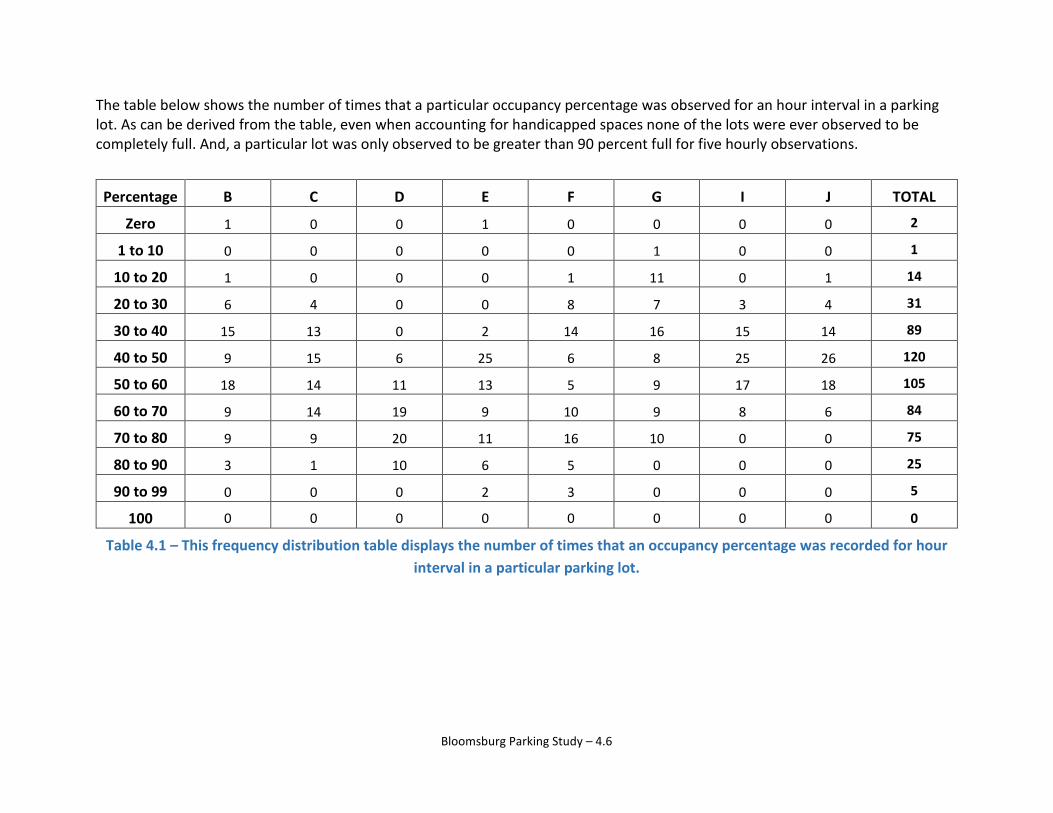
The table below shows the number of times that a particular occupancy percentage was observed for an hour interval in a parking lot. As can be derived from the table, even when accounting for handicapped spaces none of the lots were ever observed to be completely full. And, a particular lot was only observed to be greater than 90 percent full for five hourly observations.
Percentage B C D E F G I J TOTAL
Zero 1 0 0 1 0 0 0 0 2
1 to 10 0 0 0 0 0 1 0 0 1
10 to 20 1 0 0 0 1 11 0 1 14
20 to 30 6 4 0 0 8 7 3 4 31
30 to 40 15 13 0 2 14 16 15 14 89
40 to 50 9 15 6 25 6 8 25 26 120
50 to 60 18 14 11 13 5 9 17 18 105
60 to 70 9 14 19 9 10 9 8 6 84
70 to 80 9 9 20 11 16 10 0 0 75
80 to 90 3 1 10 6 5 0 0 0 25
90 to 99 0 0 0 2 3 0 0 0 5
100 0 0 0 0 0 0 0 0 0
Table 4.1 – This frequency distribution table displays the number of times that an occupancy percentage was recorded for hour interval in a particular parking lot.
Bloomsburg Parking Study – 4.6
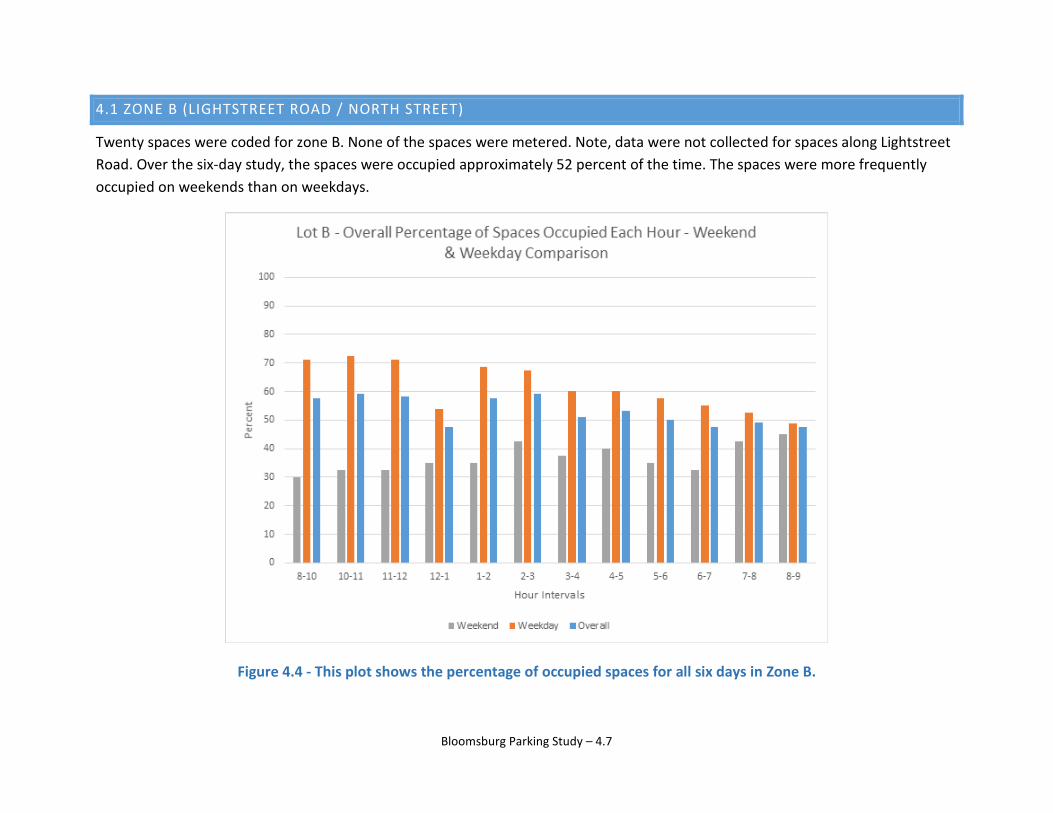
4.1 ZONE B (LIGHTSTREET ROAD / NORTH STREET)
Twenty spaces were coded for zone B. None of the spaces were metered. Note, data were not collected for spaces along Lightstreet Road. Over the six-day study, the spaces were occupied approximately 52 percent of the time. The spaces were more frequently occupied on weekends than on weekdays.
Figure 4.4 - This plot shows the percentage of occupied spaces for all six days in Zone B.
Bloomsburg Parking Study – 4.7
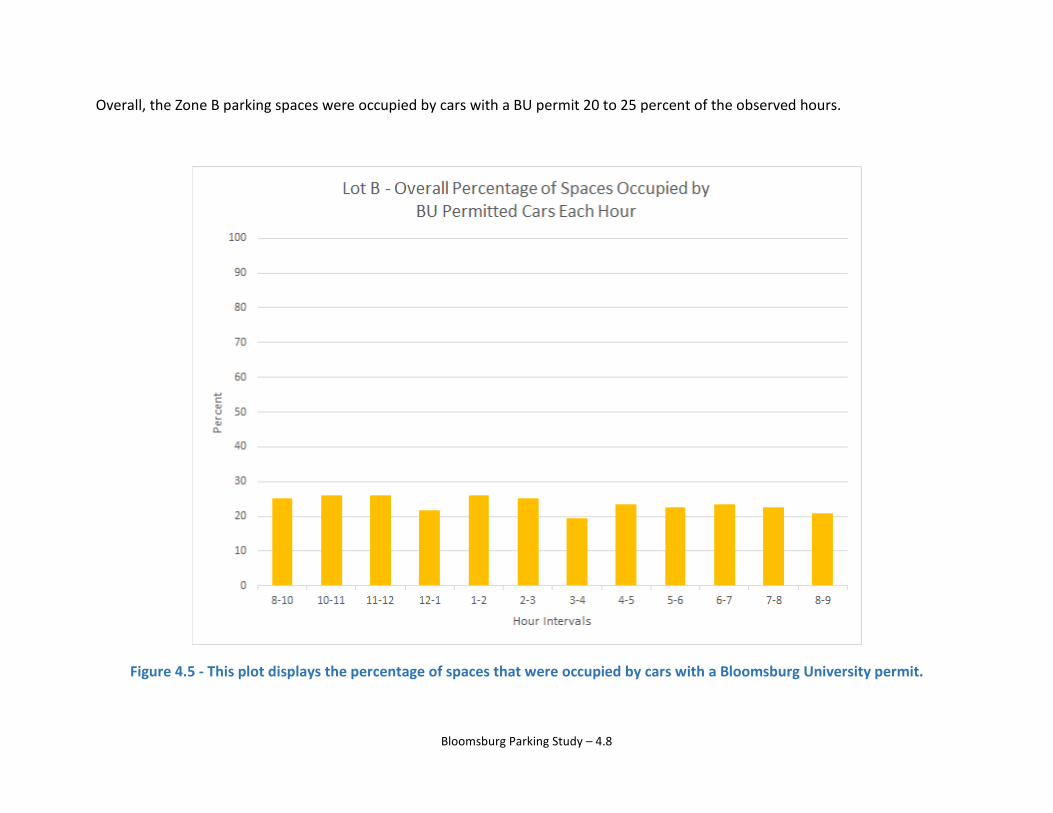
Overall, the Zone B parking spaces were occupied by cars with a BU permit 20 to 25 percent of the observed hours.
Figure 4.5 - This plot displays the percentage of spaces that were occupied by cars with a Bloomsburg University permit.
Bloomsburg Parking Study – 4.8
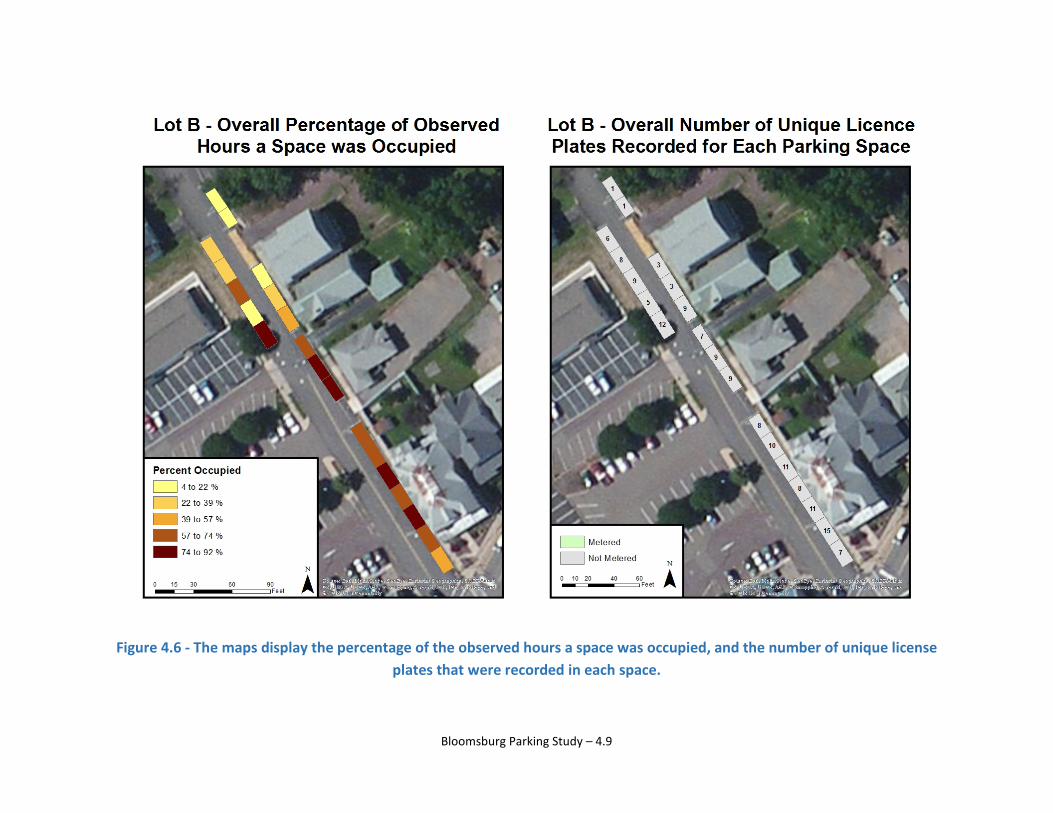
Figure 4.6 - The maps display the percentage of the observed hours a space was occupied, and the number of unique license plates that were recorded in each space.
Bloomsburg Parking Study – 4.9
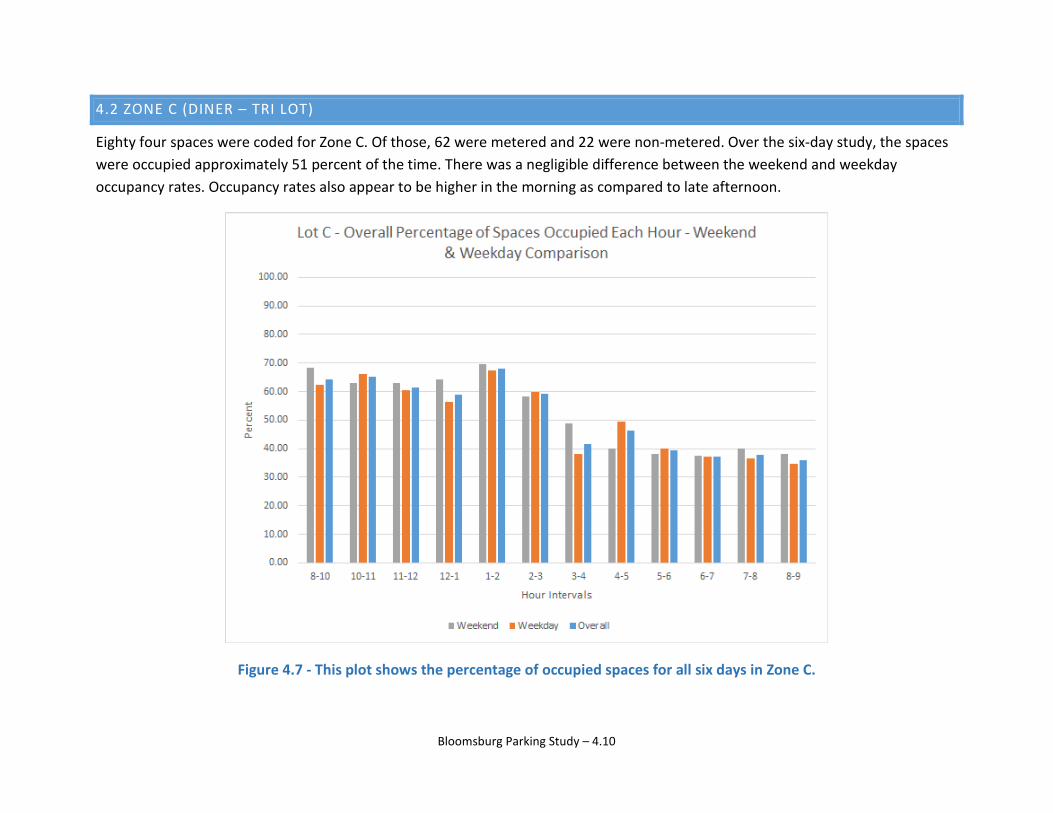
4.2 ZONE C (DINER – TRI LOT)
Eighty four spaces were coded for Zone C. Of those, 62 were metered and 22 were non-metered. Over the six-day study, the spaces were occupied approximately 51 percent of the time. There was a negligible difference between the weekend and weekday occupancy rates. Occupancy rates also appear to be higher in the morning as compared to late afternoon.
Figure 4.7 - This plot shows the percentage of occupied spaces for all six days in Zone C.
Bloomsburg Parking Study – 4.10
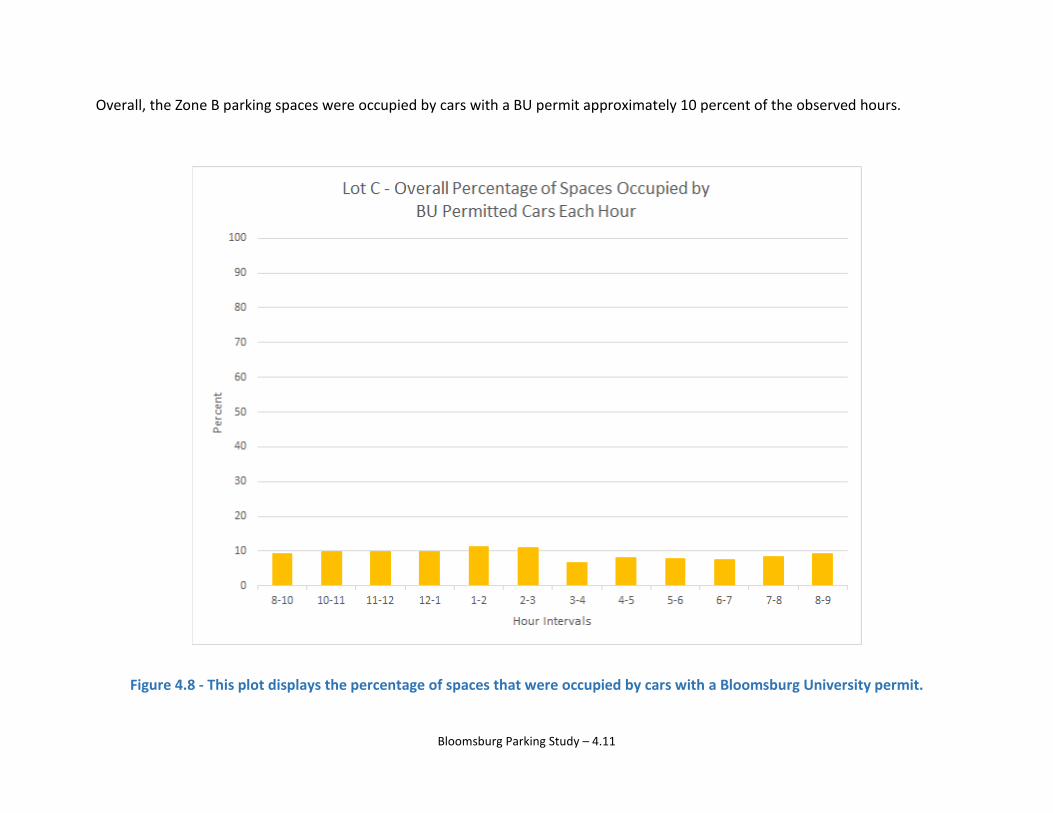
Overall, the Zone B parking spaces were occupied by cars with a BU permit approximately 10 percent of the observed hours.
Figure 4.8 - This plot displays the percentage of spaces that were occupied by cars with a Bloomsburg University permit.
Bloomsburg Parking Study – 4.11
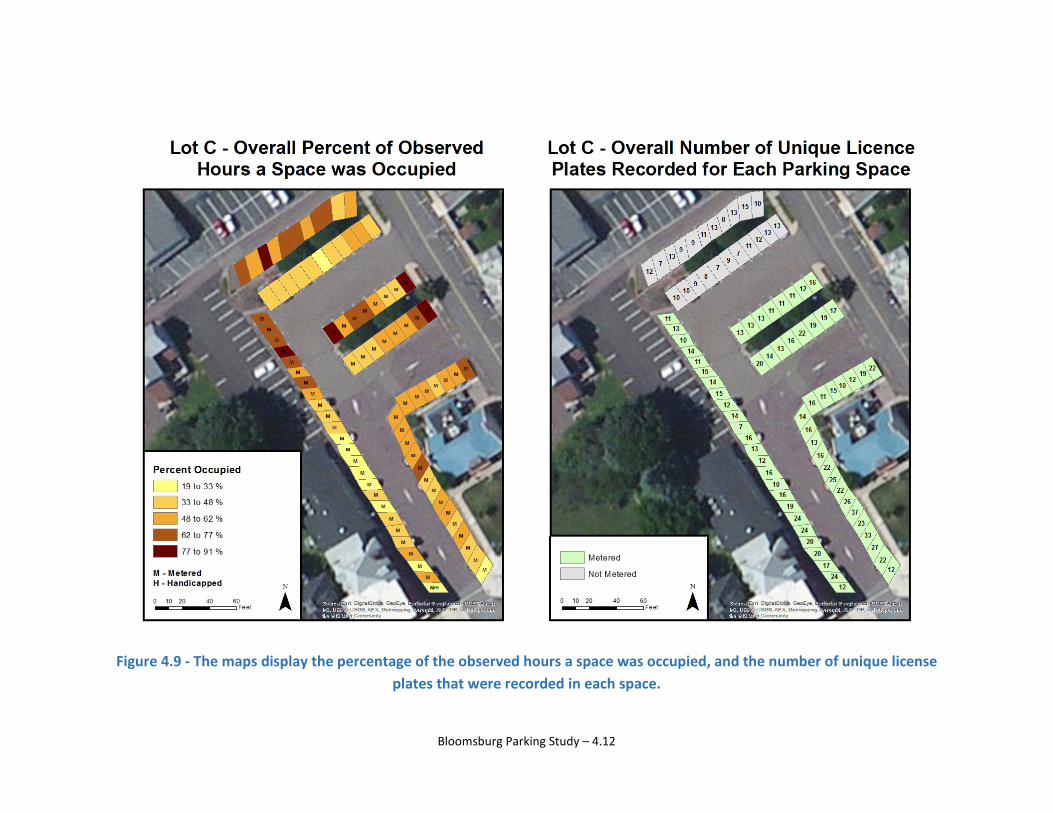
Figure 4.9 - The maps display the percentage of the observed hours a space was occupied, and the number of unique license plates that were recorded in each space.
Bloomsburg Parking Study – 4.12
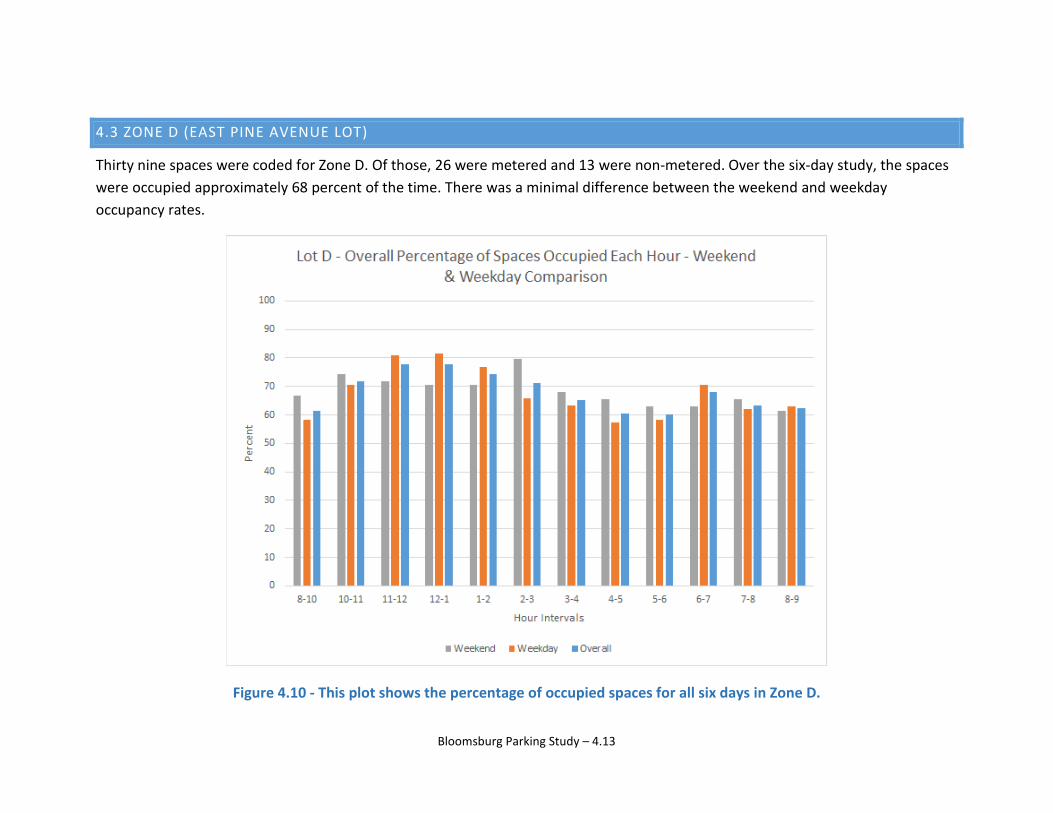
4.3 ZONE D (EAST PINE AVENUE LOT)
Thirty nine spaces were coded for Zone D. Of those, 26 were metered and 13 were non-metered. Over the six-day study, the spaces were occupied approximately 68 percent of the time. There was a minimal difference between the weekend and weekday occupancy rates.
Figure 4.10 - This plot shows the percentage of occupied spaces for all six days in Zone D.
Bloomsburg Parking Study – 4.13

Overall, the Zone D parking spaces were occupied by cars with a BU permit 10 to 15 percent of the observed hours.
Figure 4.11 - This plot displays the percentage of spaces that were occupied by cars with a Bloomsburg University permit.
Bloomsburg Parking Study – 4.14
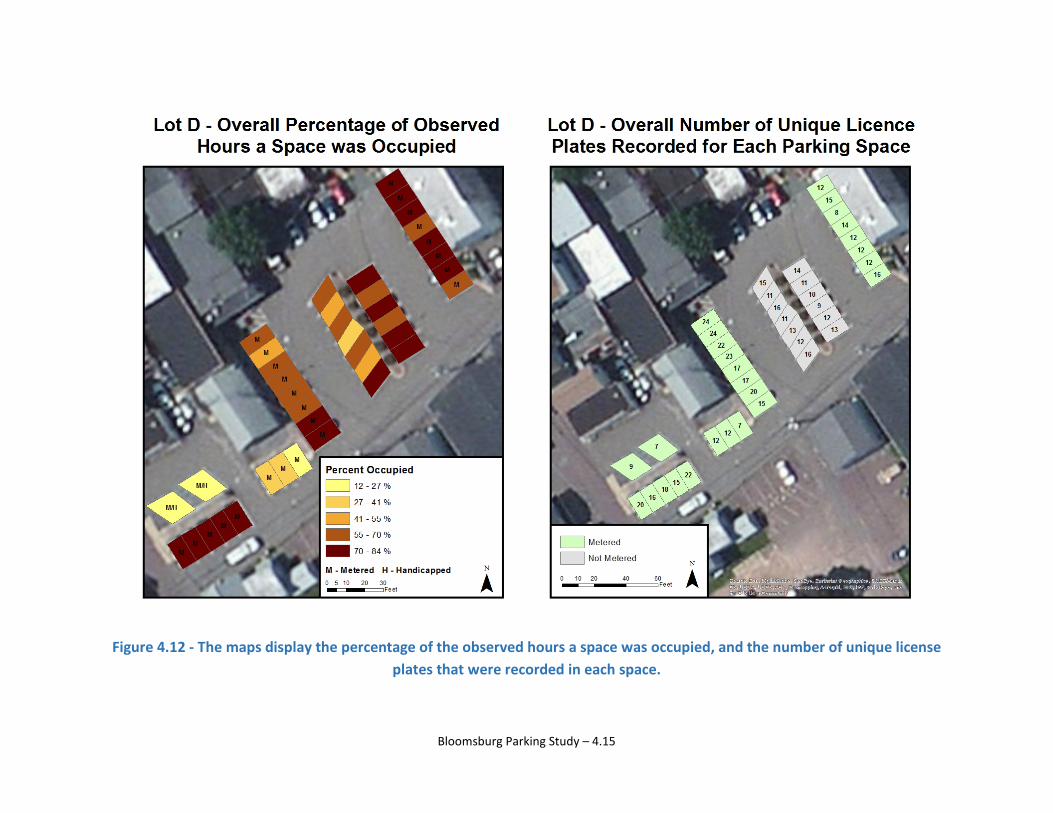
Figure 4.12 - The maps display the percentage of the observed hours a space was occupied, and the number of unique license plates that were recorded in each space.
Bloomsburg Parking Study – 4.15
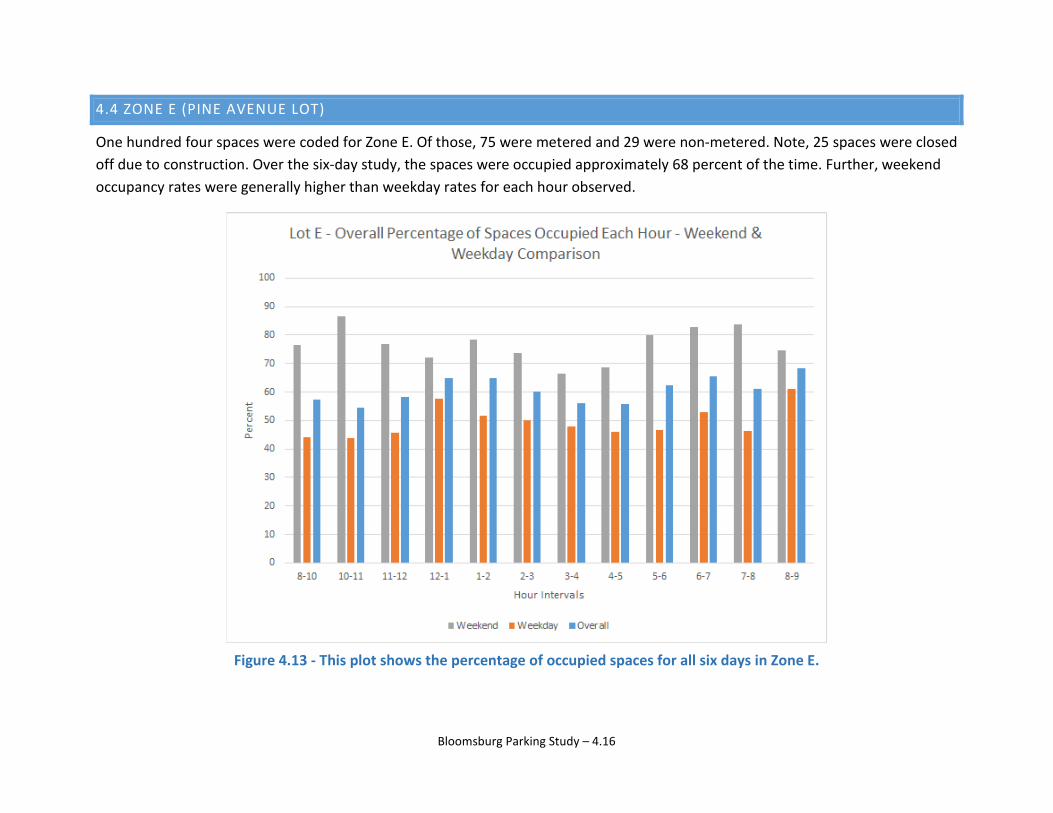
4.4 ZONE E (PINE AVENUE LOT)
One hundred four spaces were coded for Zone E. Of those, 75 were metered and 29 were non-metered. Note, 25 spaces were closed off due to construction. Over the six-day study, the spaces were occupied approximately 68 percent of the time. Further, weekend occupancy rates were generally higher than weekday rates for each hour observed.
Figure 4.13 - This plot shows the percentage of occupied spaces for all six days in Zone E.
Bloomsburg Parking Study – 4.16
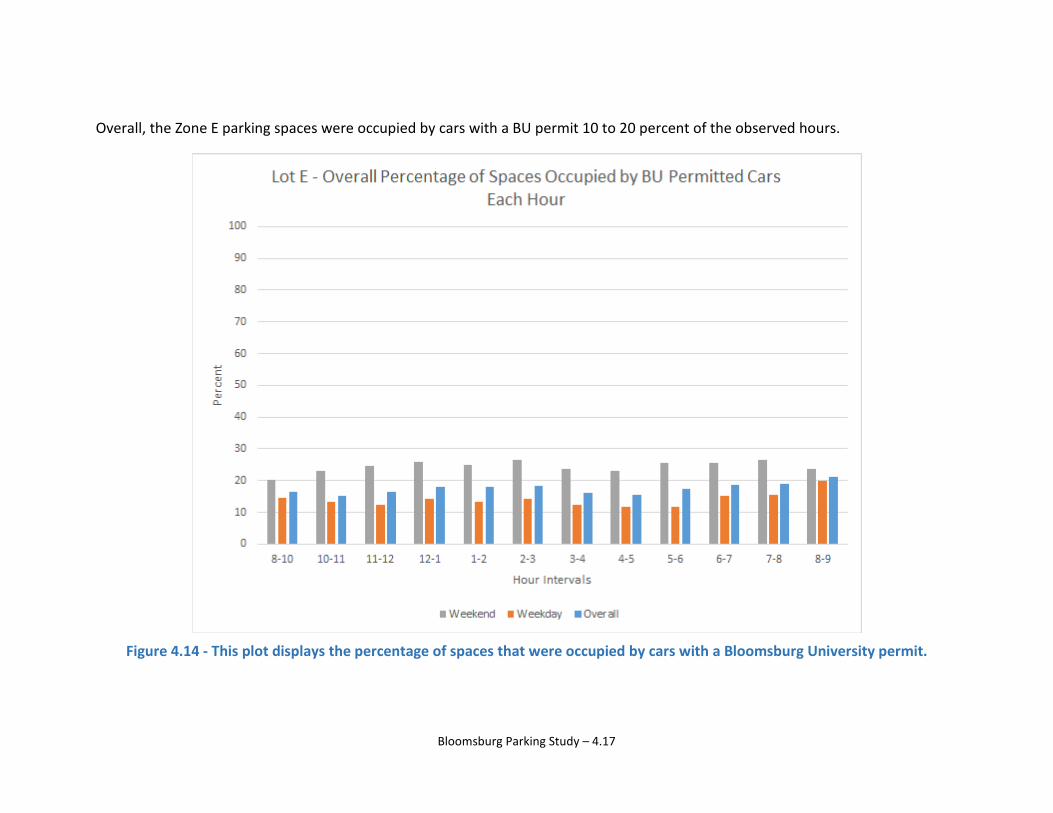
Overall, the Zone E parking spaces were occupied by cars with a BU permit 10 to 20 percent of the observed hours.
Figure 4.14 - This plot displays the percentage of spaces that were occupied by cars with a Bloomsburg University permit.
Bloomsburg Parking Study – 4.17
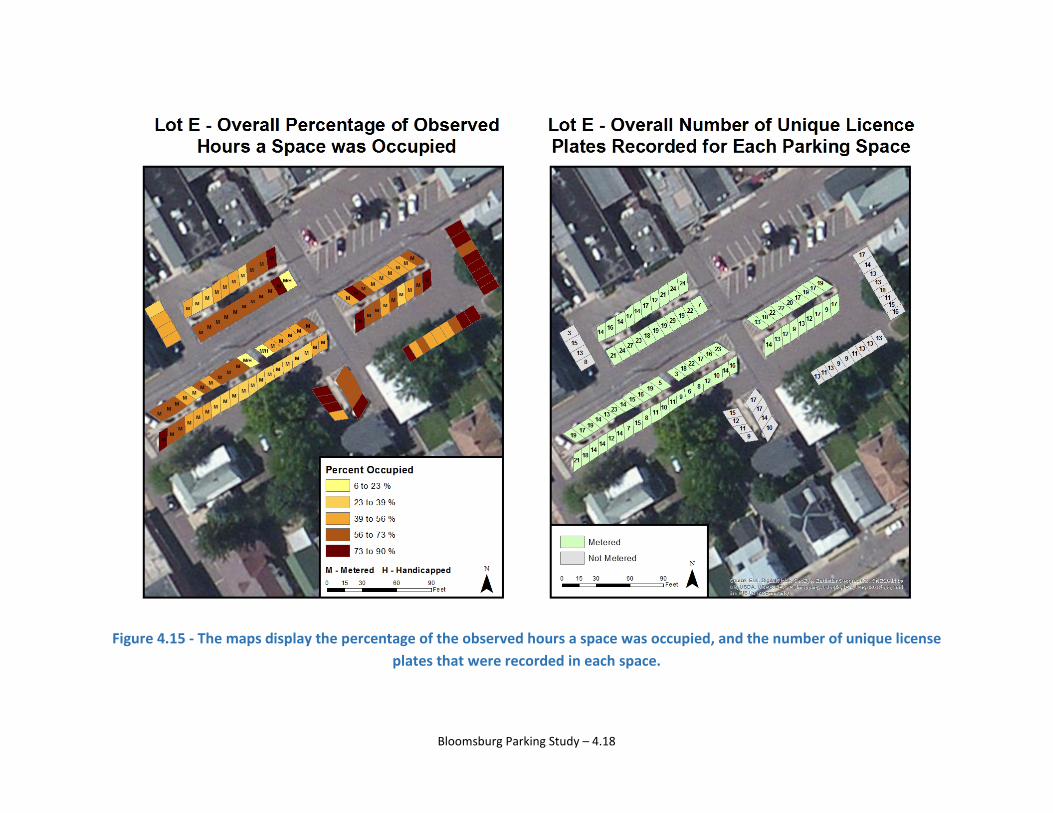
Figure 4.15 - The maps display the percentage of the observed hours a space was occupied, and the number of unique license
plates that were recorded in each space.
Bloomsburg Parking Study – 4.18
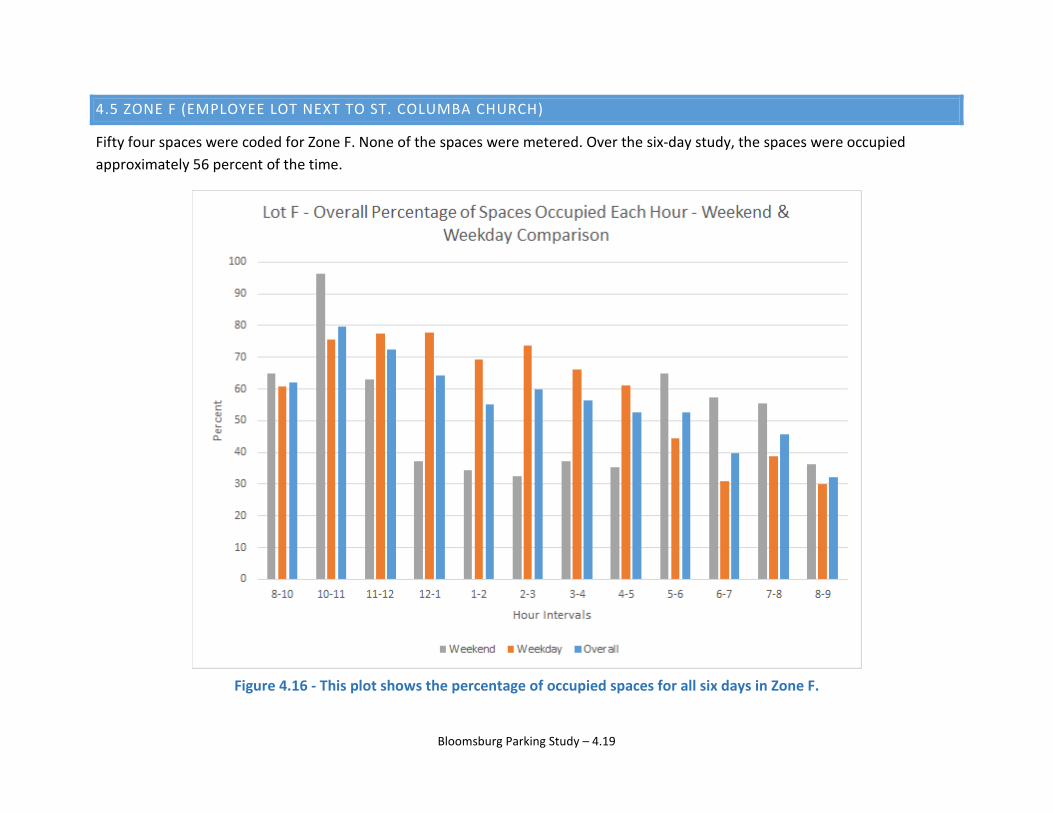
4.5 ZONE F (EMPLOYEE LOT NEXT TO ST. COLUMBA CHURCH)
Fifty four spaces were coded for Zone F. None of the spaces were metered. Over the six-day study, the spaces were occupied approximately 56 percent of the time.
Figure 4.16 - This plot shows the percentage of occupied spaces for all six days in Zone F.
Bloomsburg Parking Study – 4.19
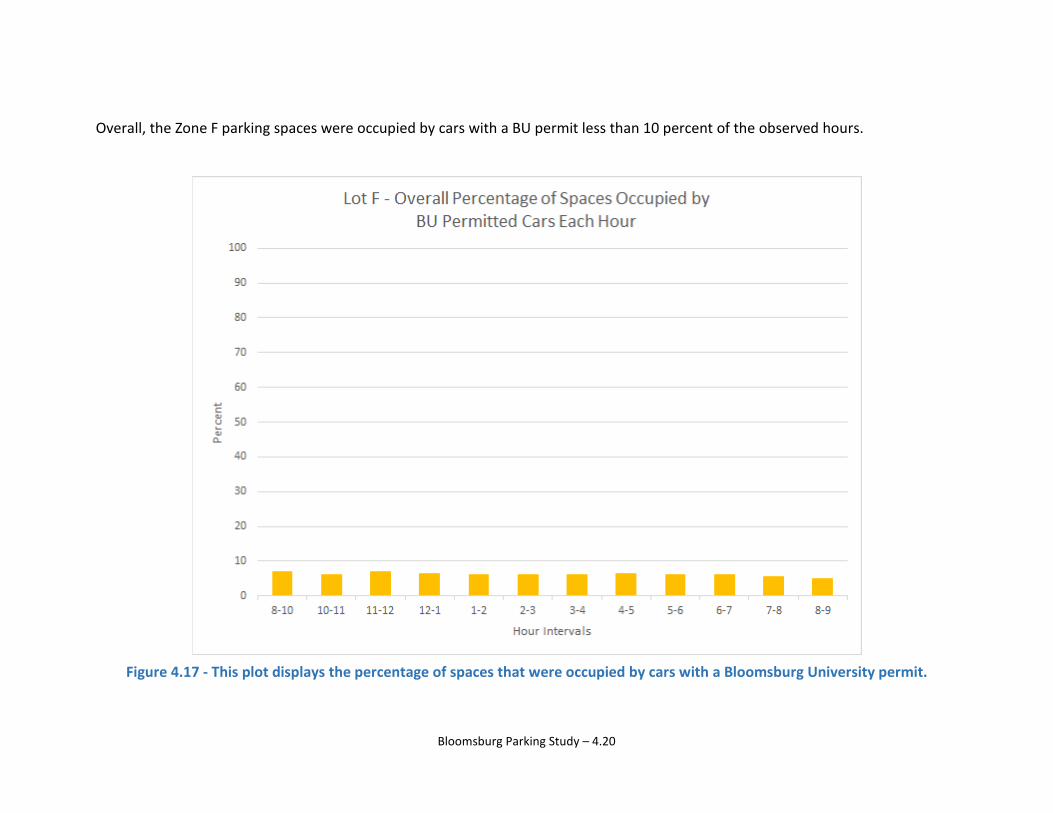
Overall, the Zone F parking spaces were occupied by cars with a BU permit less than 10 percent of the observed hours.
Figure 4.17 - This plot displays the percentage of spaces that were occupied by cars with a Bloomsburg University permit.
Bloomsburg Parking Study – 4.20
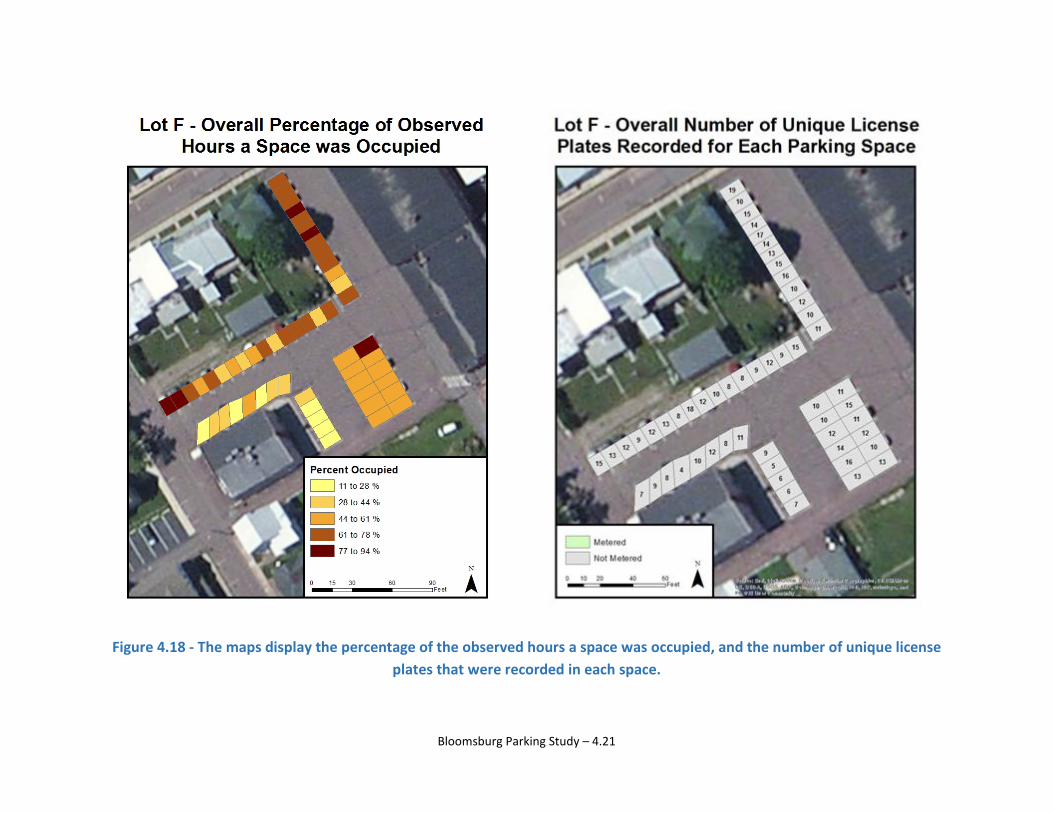
Figure 4.18 - The maps display the percentage of the observed hours a space was occupied, and the number of unique license plates that were recorded in each space.
Bloomsburg Parking Study – 4.21
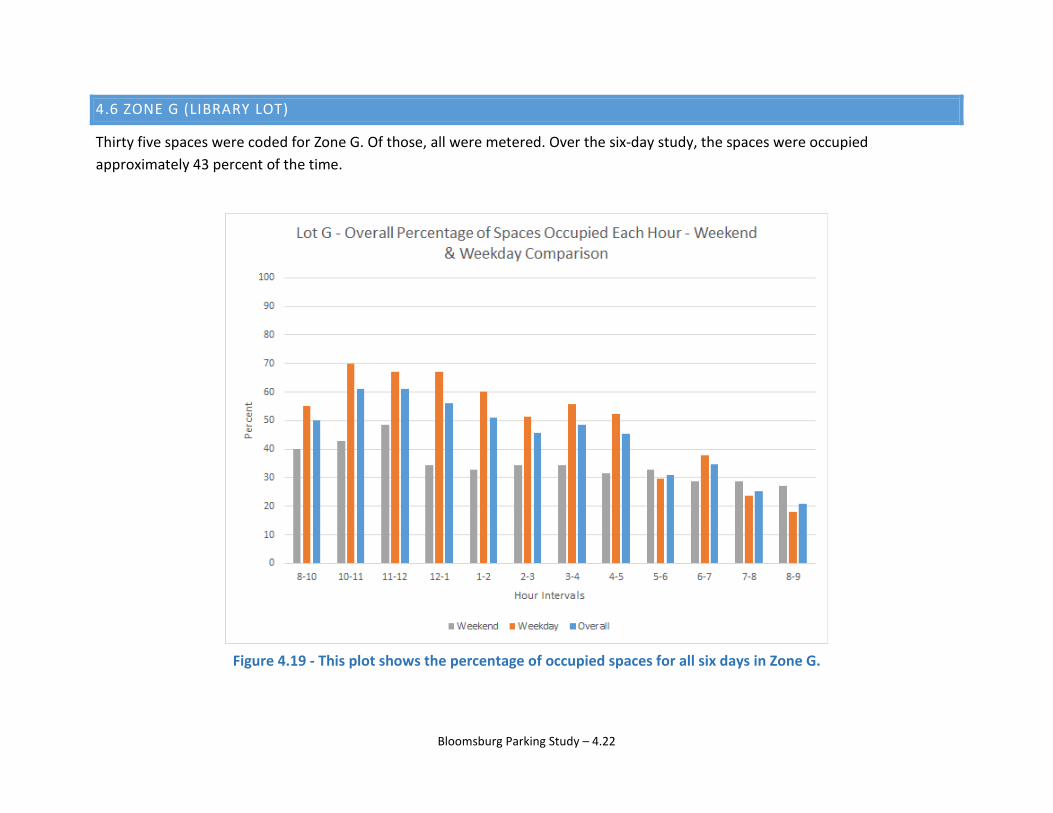
4.6 ZONE G (LIBRARY LOT)
Thirty five spaces were coded for Zone G. Of those, all were metered. Over the six-day study, the spaces were occupied approximately 43 percent of the time.
Figure 4.19 - This plot shows the percentage of occupied spaces for all six days in Zone G.
Bloomsburg Parking Study – 4.22
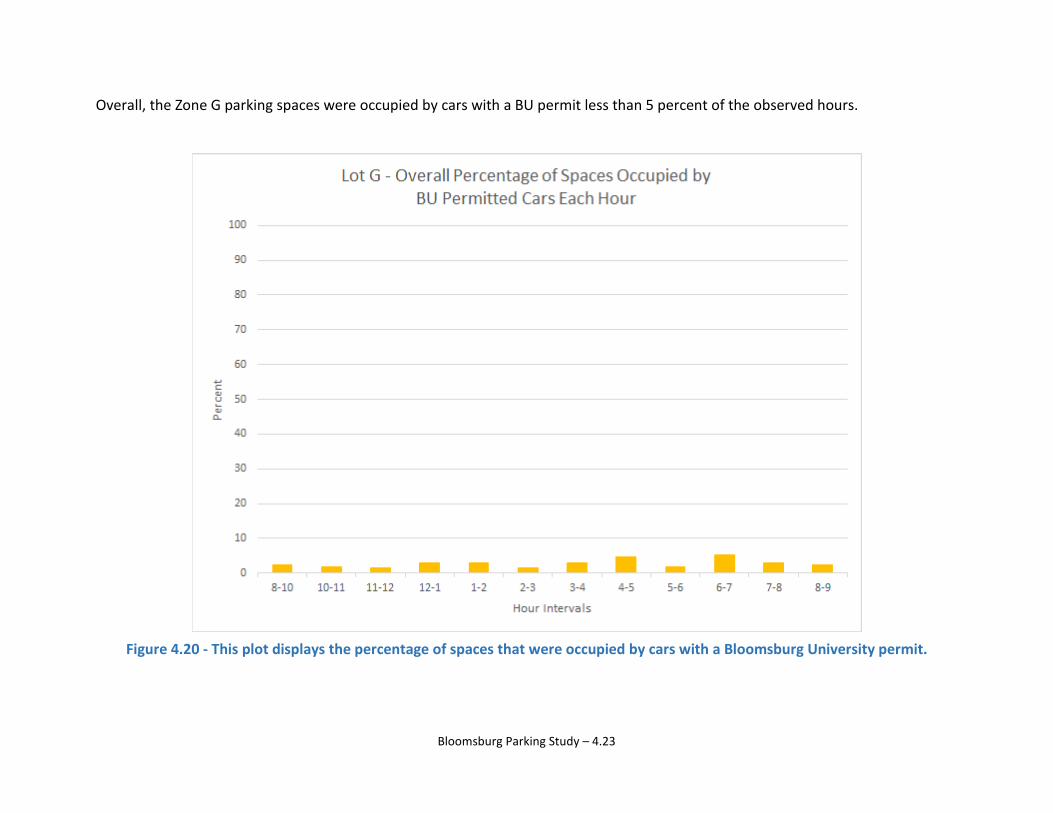
Overall, the Zone G parking spaces were occupied by cars with a BU permit less than 5 percent of the observed hours.
Figure 4.20 - This plot displays the percentage of spaces that were occupied by cars with a Bloomsburg University permit.
Bloomsburg Parking Study – 4.23
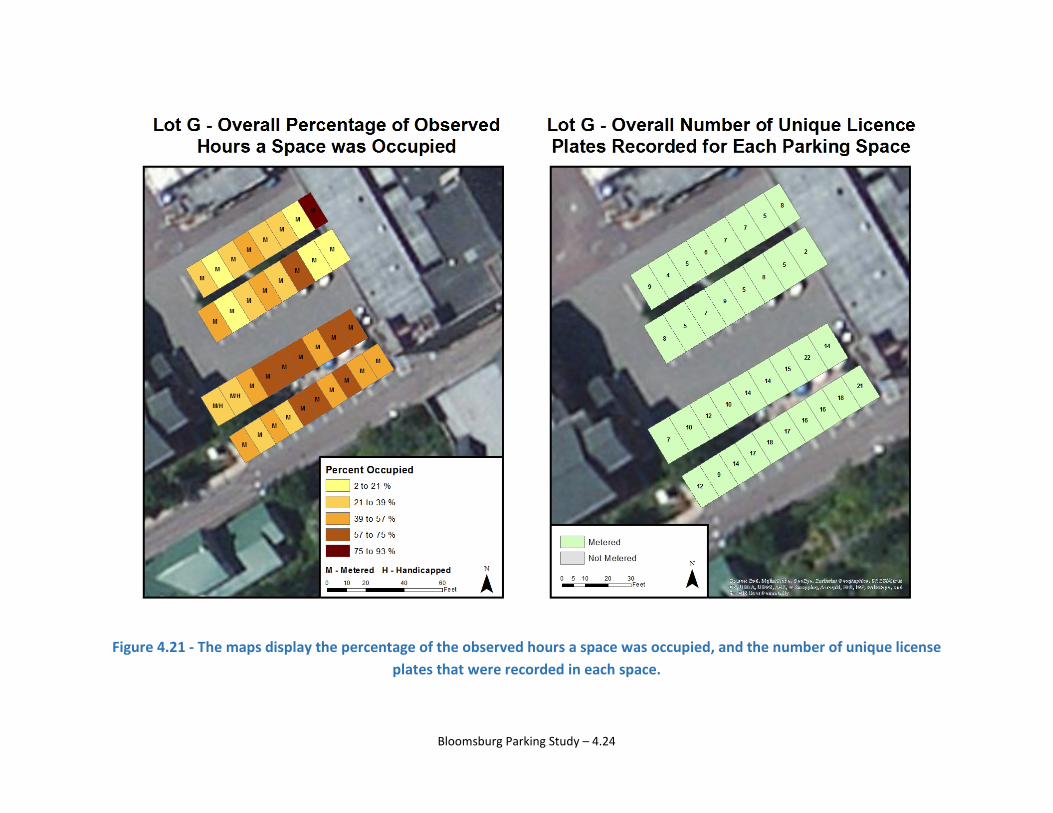
Figure 4.21 - The maps display the percentage of the observed hours a space was occupied, and the number of unique license plates that were recorded in each space.
Bloomsburg Parking Study – 4.24
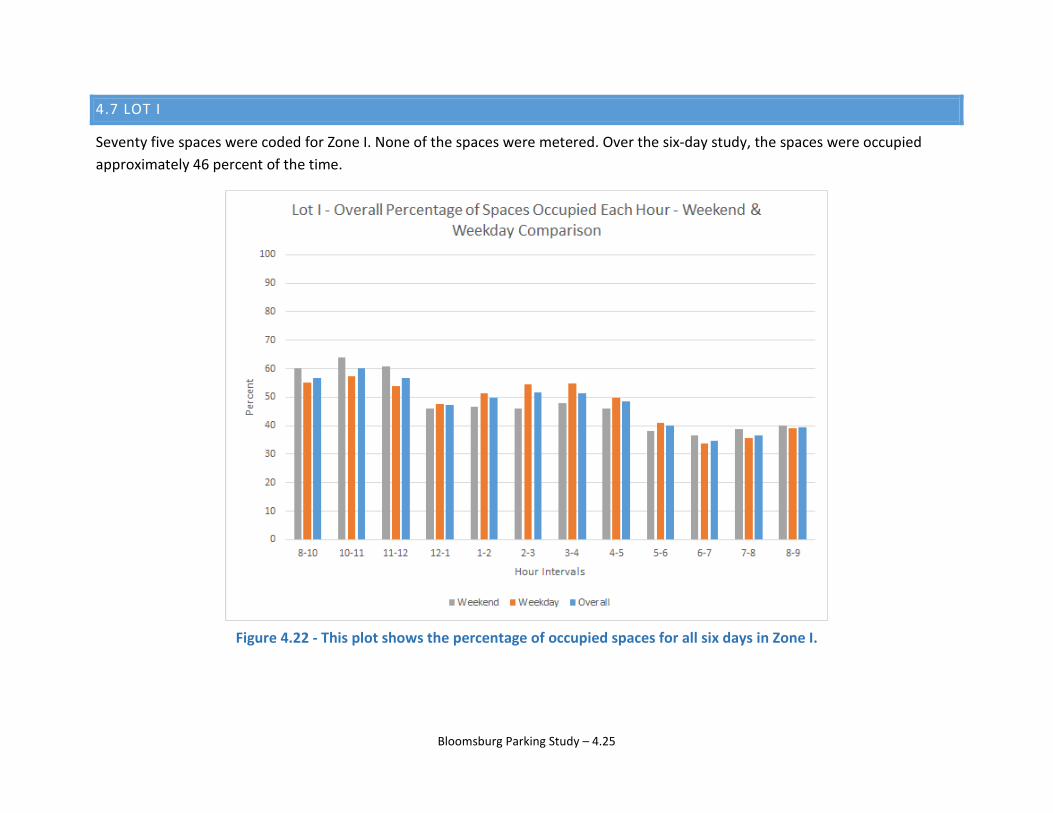
4.7 LOT I
Seventy five spaces were coded for Zone I. None of the spaces were metered. Over the six-day study, the spaces were occupied approximately 46 percent of the time.
Figure 4.22 - This plot shows the percentage of occupied spaces for all six days in Zone I.
Bloomsburg Parking Study – 4.25
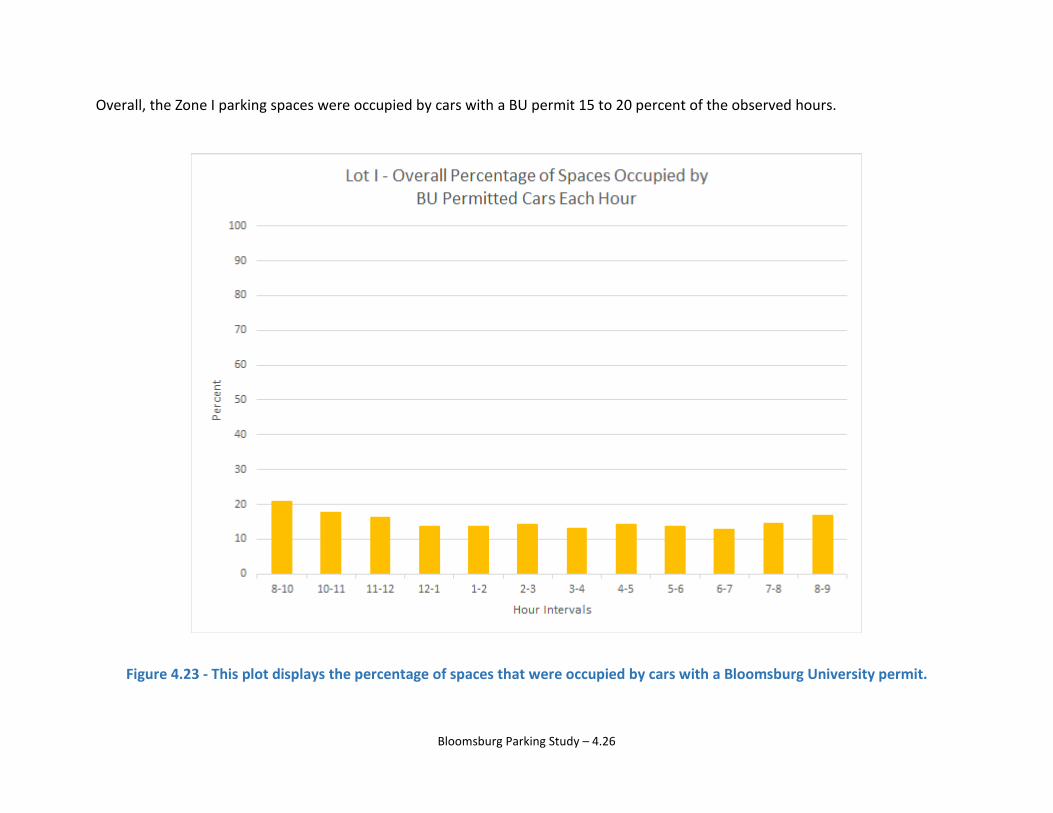
Overall, the Zone I parking spaces were occupied by cars with a BU permit 15 to 20 percent of the observed hours.
Figure 4.23 - This plot displays the percentage of spaces that were occupied by cars with a Bloomsburg University permit.
Bloomsburg Parking Study – 4.26
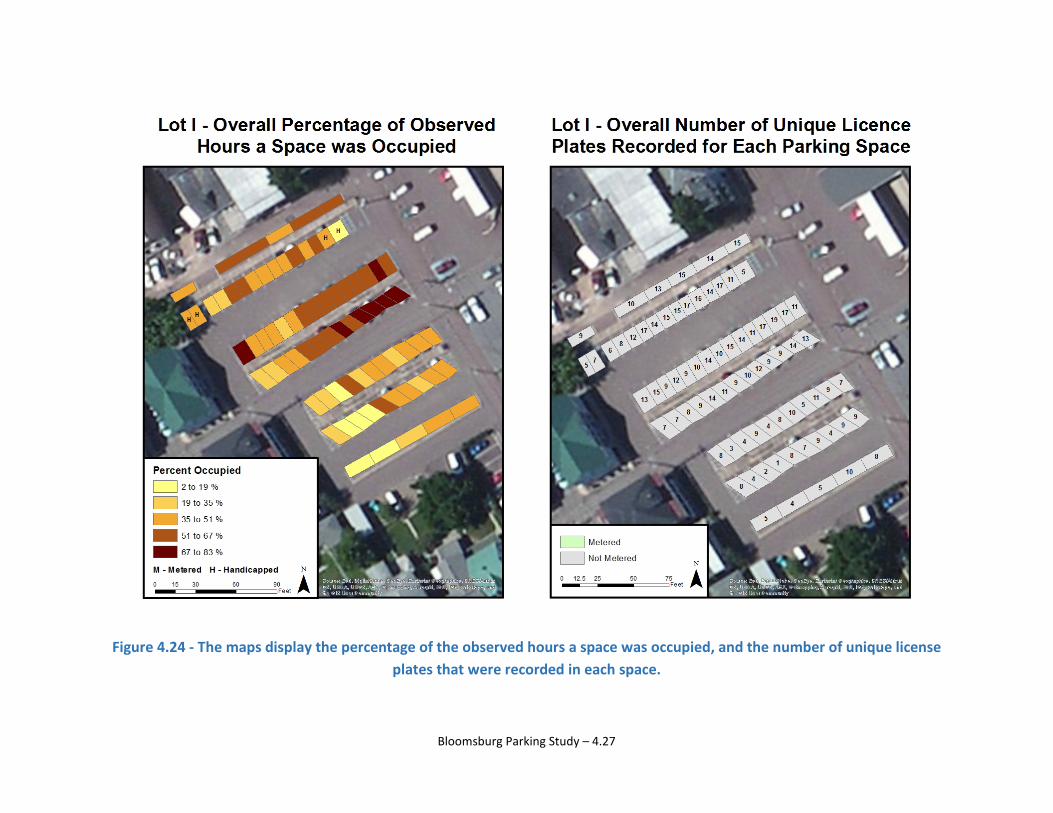
Figure 4.24 - The maps display the percentage of the observed hours a space was occupied, and the number of unique license plates that were recorded in each space.
Bloomsburg Parking Study – 4.27
4.8 LOT J
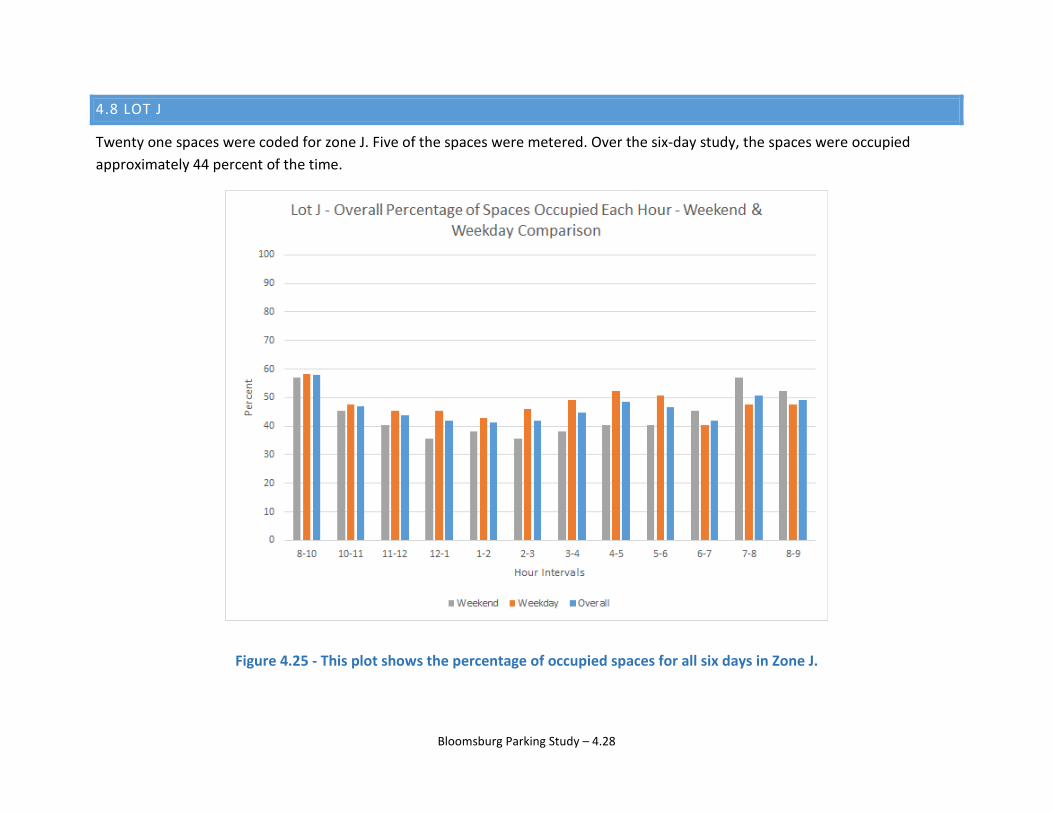
Twenty one spaces were coded for zone J. Five of the spaces were metered. Over the six-day study, the spaces were occupied approximately 44 percent of the time.
Figure 4.25 - This plot shows the percentage of occupied spaces for all six days in Zone J.
Bloomsburg Parking Study – 4.28

Overall, the Zone J parking spaces were occupied by cars with a BU permit 10 to 20 percent of the observed hours.
Figure 4.26 - This plot displays the percentage of spaces that were occupied by cars with a Bloomsburg University permit.
Bloomsburg Parking Study – 4.29
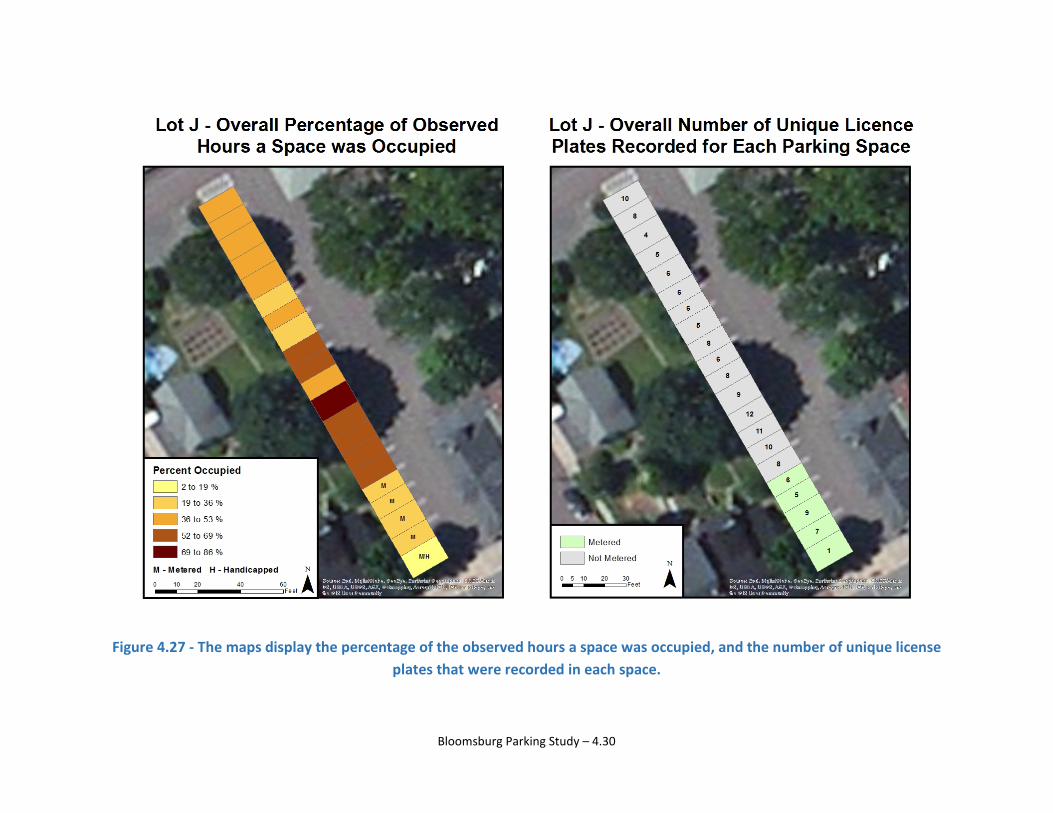
Figure 4.27 - The maps display the percentage of the observed hours a space was occupied, and the number of unique license plates that were recorded in each space.
Bloomsburg Parking Study – 4.30
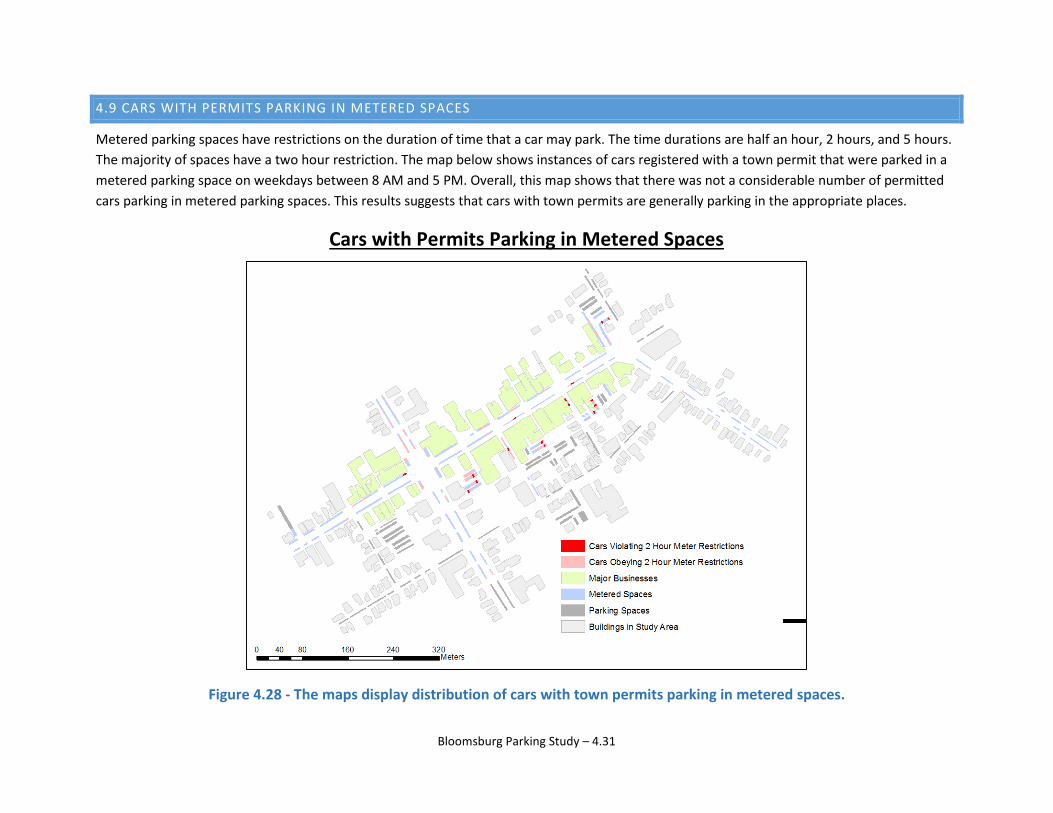
4.9 CARS WITH PERMITS PARKING IN METERED SPACES
Metered parking spaces have restrictions on the duration of time that a car may park. The time durations are half an hour, 2 hours, and 5 hours. The majority of spaces have a two hour restriction. The map below shows instances of cars registered with a town permit that were parked in a metered parking space on weekdays between 8 AM and 5 PM. Overall, this map shows that there was not a considerable number of permitted cars parking in metered parking spaces. This results suggests that cars with town permits are generally parking in the appropriate places.
Cars with Permits Parking in Metered Spaces
Figure 4.28 - The maps display distribution of cars with town permits parking in metered spaces.
Bloomsburg Parking Study – 4.31
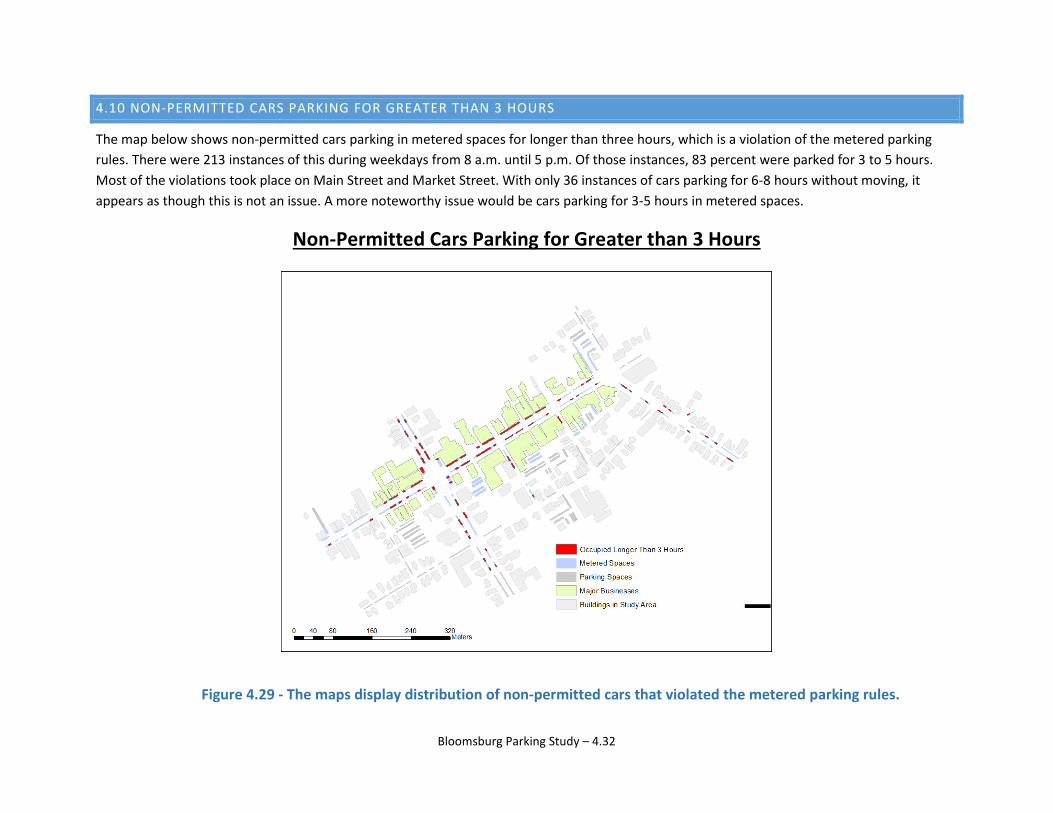
4.10 NON-PERMITTED CARS PARKING FOR GREATER THAN 3 HOURS
The map below shows non-permitted cars parking in metered spaces for longer than three hours, which is a violation of the metered parking rules. There were 213 instances of this during weekdays from 8 a.m. until 5 p.m. Of those instances, 83 percent were parked for 3 to 5 hours. Most of the violations took place on Main Street and Market Street. With only 36 instances of cars parking for 6-8 hours without moving, it appears as though this is not an issue. A more noteworthy issue would be cars parking for 3-5 hours in metered spaces.
Non-Permitted Cars Parking for Greater than 3 Hours
Figure 4.29 - The maps display distribution of non-permitted cars that violated the metered parking rules.
Bloomsburg Parking Study – 4.32
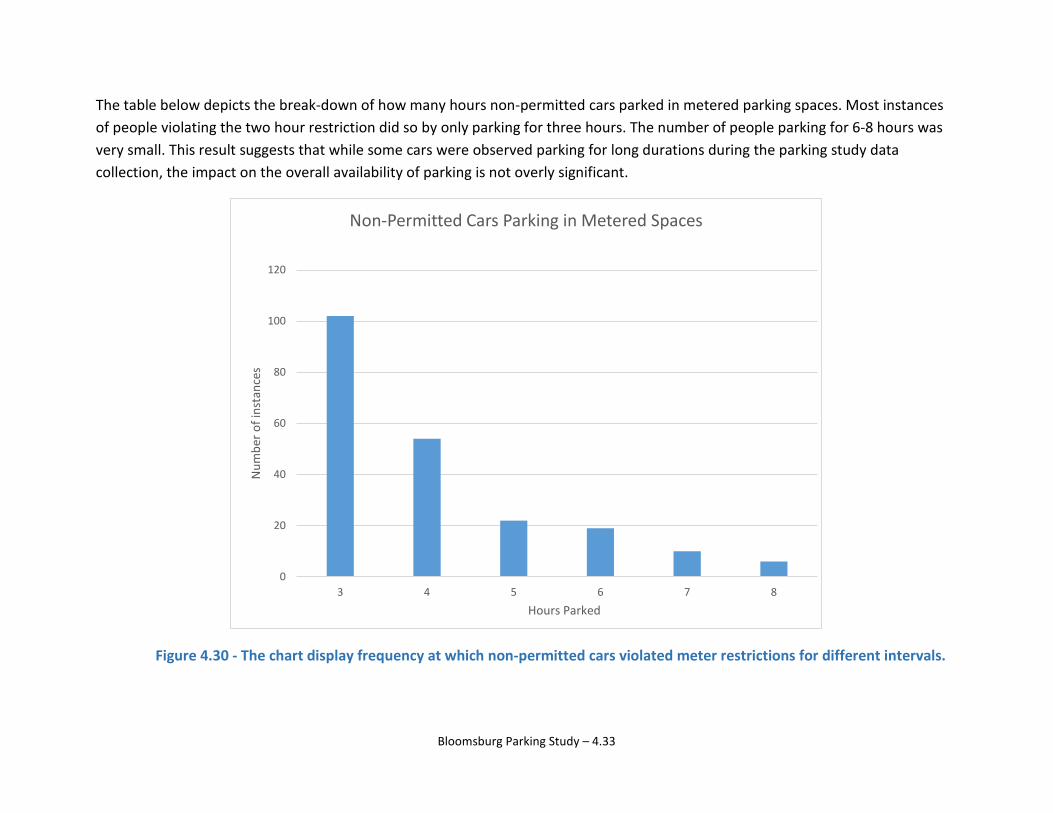
The table below depicts the break-down of how many hours non-permitted cars parked in metered parking spaces. Most instances of people violating the two hour restriction did so by only parking for three hours. The number of people parking for 6-8 hours was very small. This result suggests that while some cars were observed parking for long durations during the parking study data collection, the impact on the overall availability of parking is not overly significant.
Figure 4.30 - The chart display frequency at which non-permitted cars violated meter restrictions for different intervals.
Bloomsburg Parking Study – 4.33
0
20
40
60
80
100
120
3 4 5 6 7 8
Num
ber o
f ins
tanc
es
Hours Parked
Non-Permitted Cars Parking in Metered Spaces
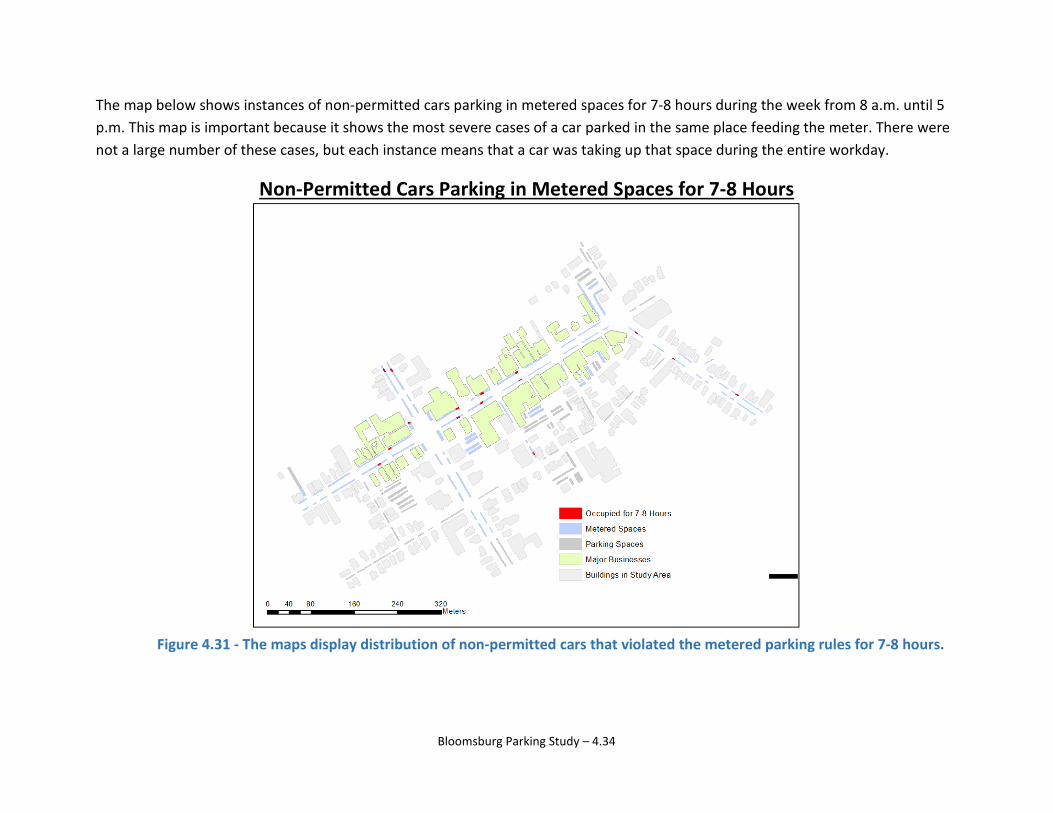
The map below shows instances of non-permitted cars parking in metered spaces for 7-8 hours during the week from 8 a.m. until 5 p.m. This map is important because it shows the most severe cases of a car parked in the same place feeding the meter. There were not a large number of these cases, but each instance means that a car was taking up that space during the entire workday.
Non-Permitted Cars Parking in Metered Spaces for 7-8 Hours
Figure 4.31 - The maps display distribution of non-permitted cars that violated the metered parking rules for 7-8 hours.
Bloomsburg Parking Study – 4.34
2015
5 – Parking Survey Results TOWN OF BLOOMSBURG PARKING STUDY
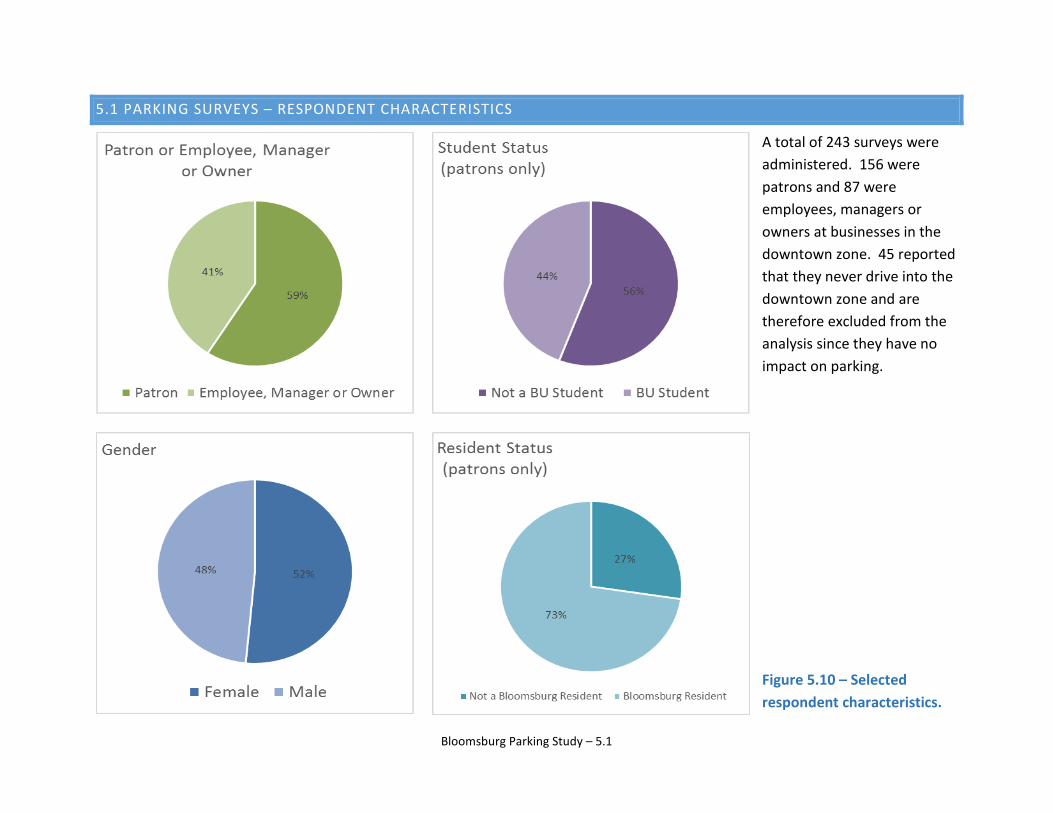
5.1 PARKING SURVEYS – RESPONDENT CHARACTERISTICS
A total of 243 surveys were administered. 156 were patrons and 87 were employees, managers or owners at businesses in the downtown zone. 45 reported that they never drive into the downtown zone and are therefore excluded from the analysis since they have no impact on parking. Figure 5.10 – Selected respondent characteristics.
Bloomsburg Parking Study – 5.1
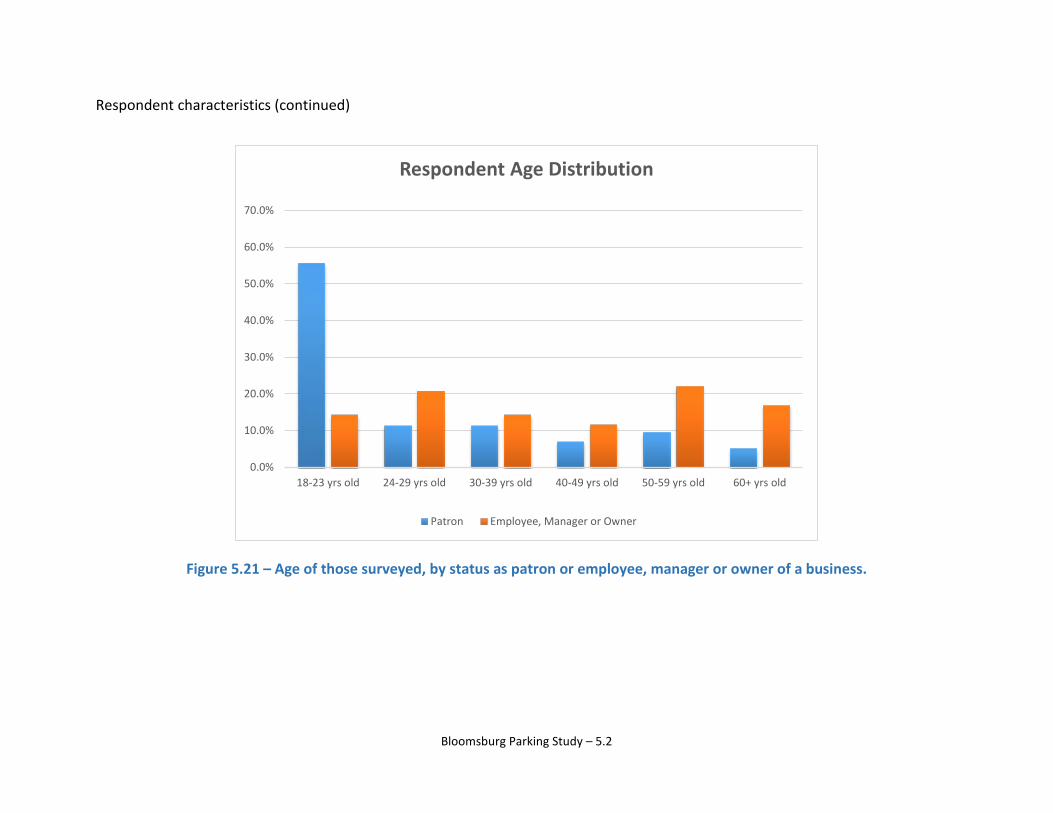
Respondent characteristics (continued)
Figure 5.21 – Age of those surveyed, by status as patron or employee, manager or owner of a business.
0.0%
10.0%
20.0%
30.0%
40.0%
50.0%
60.0%
70.0%
18-23 yrs old 24-29 yrs old 30-39 yrs old 40-49 yrs old 50-59 yrs old 60+ yrs old
Respondent Age Distribution
Patron Employee, Manager or Owner
Bloomsburg Parking Study – 5.2
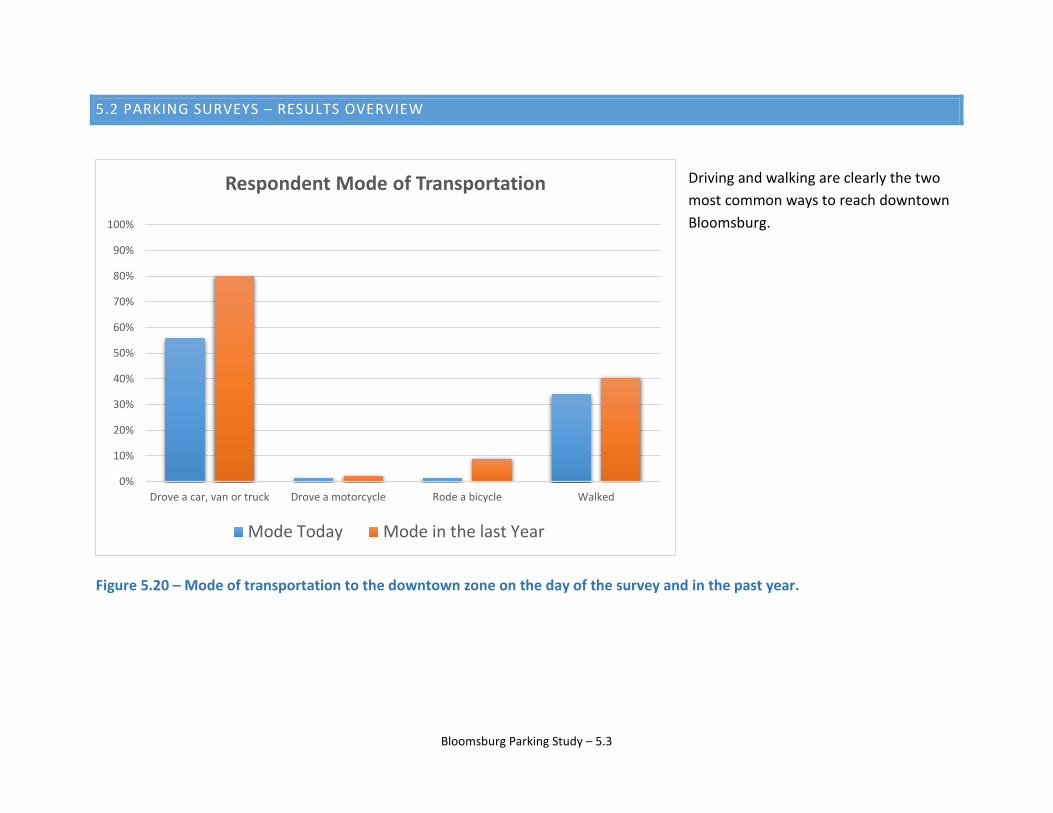
5.2 PARKING SURVEYS – RESULTS OVERVIEW
Driving and walking are clearly the two most common ways to reach downtown Bloomsburg.
Figure 5.20 – Mode of transportation to the downtown zone on the day of the survey and in the past year.
0%
10%
20%
30%
40%
50%
60%
70%
80%
90%
100%
Drove a car, van or truck Drove a motorcycle Rode a bicycle Walked
Respondent Mode of Transportation
Mode Today Mode in the last Year
Bloomsburg Parking Study – 5.3
Results overview (continued)
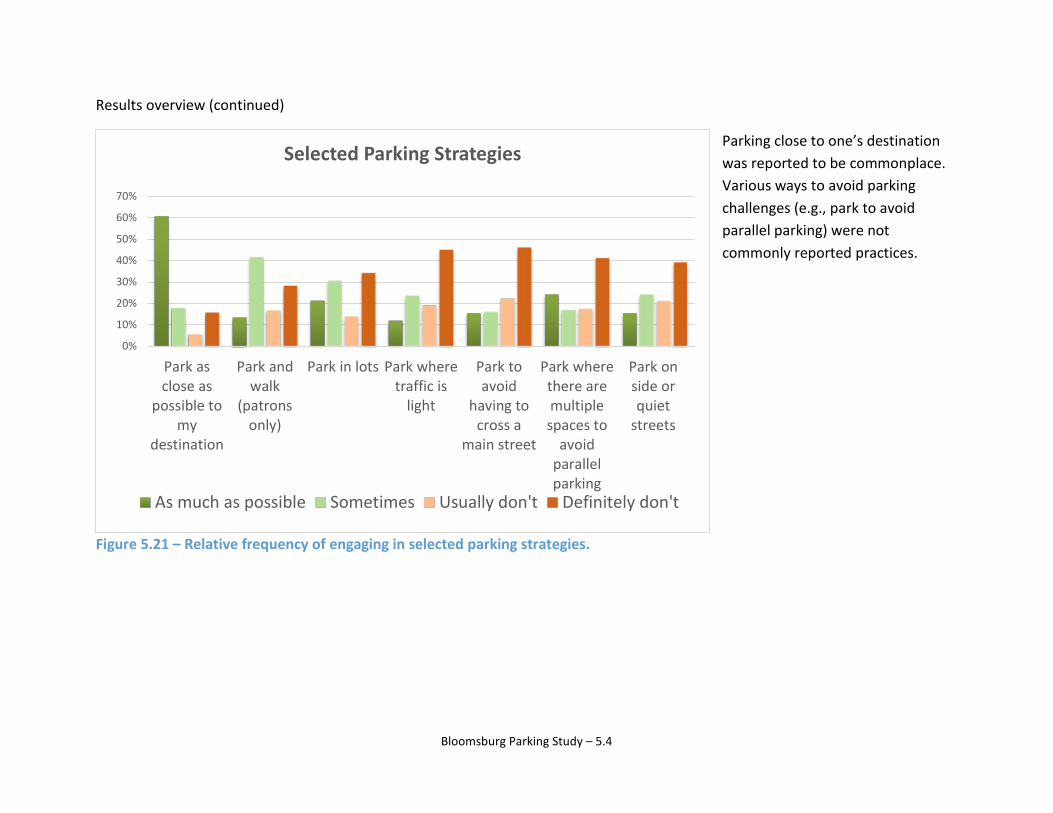
Parking close to one’s destination was reported to be commonplace. Various ways to avoid parking challenges (e.g., park to avoid parallel parking) were not commonly reported practices.
Figure 5.21 – Relative frequency of engaging in selected parking strategies.
0%
10%
20%
30%
40%
50%
60%
70%
Park asclose as
possible tomy
destination
Park andwalk
(patronsonly)
Park in lots Park wheretraffic is
light
Park toavoid
having tocross a
main street
Park wherethere aremultiplespaces to
avoidparallelparking
Park onside orquiet
streets
Selected Parking Strategies
As much as possible Sometimes Usually don't Definitely don't
Bloomsburg Parking Study – 5.4
Results overview (continued)
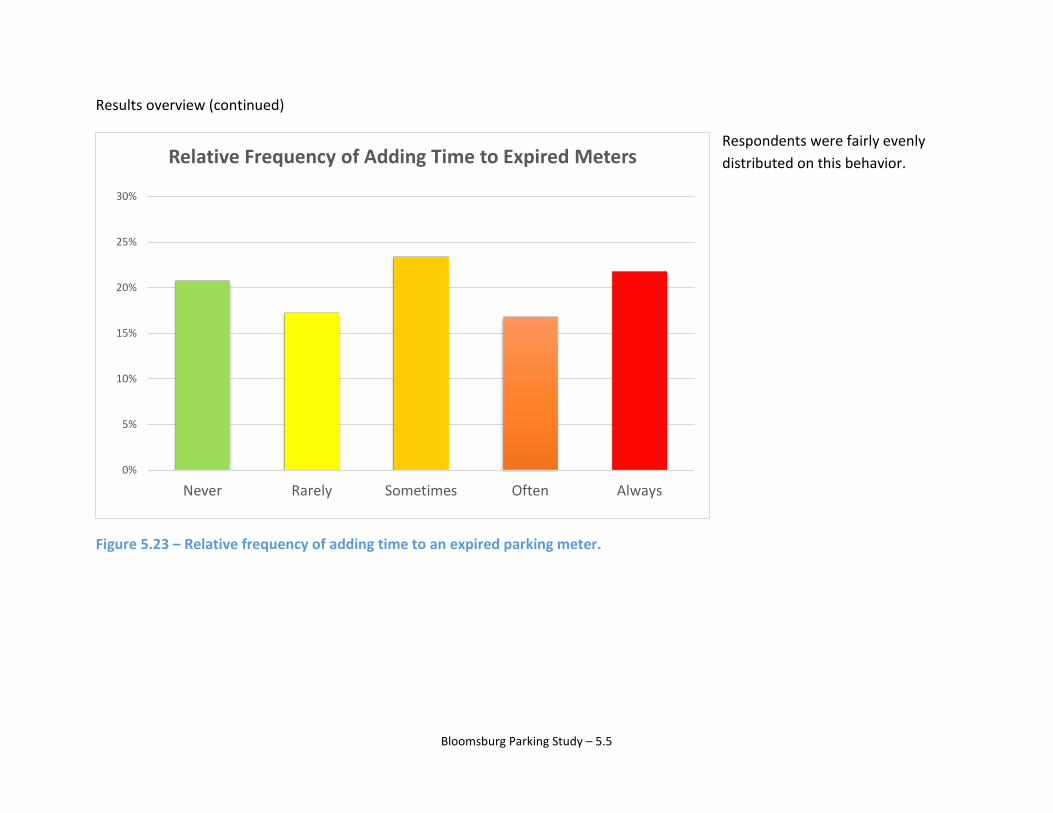
Respondents were fairly evenly distributed on this behavior.
Figure 5.23 – Relative frequency of adding time to an expired parking meter.
0%
5%
10%
15%
20%
25%
30%
Never Rarely Sometimes Often Always
Relative Frequency of Adding Time to Expired Meters
Bloomsburg Parking Study – 5.5
Results overview (continued)
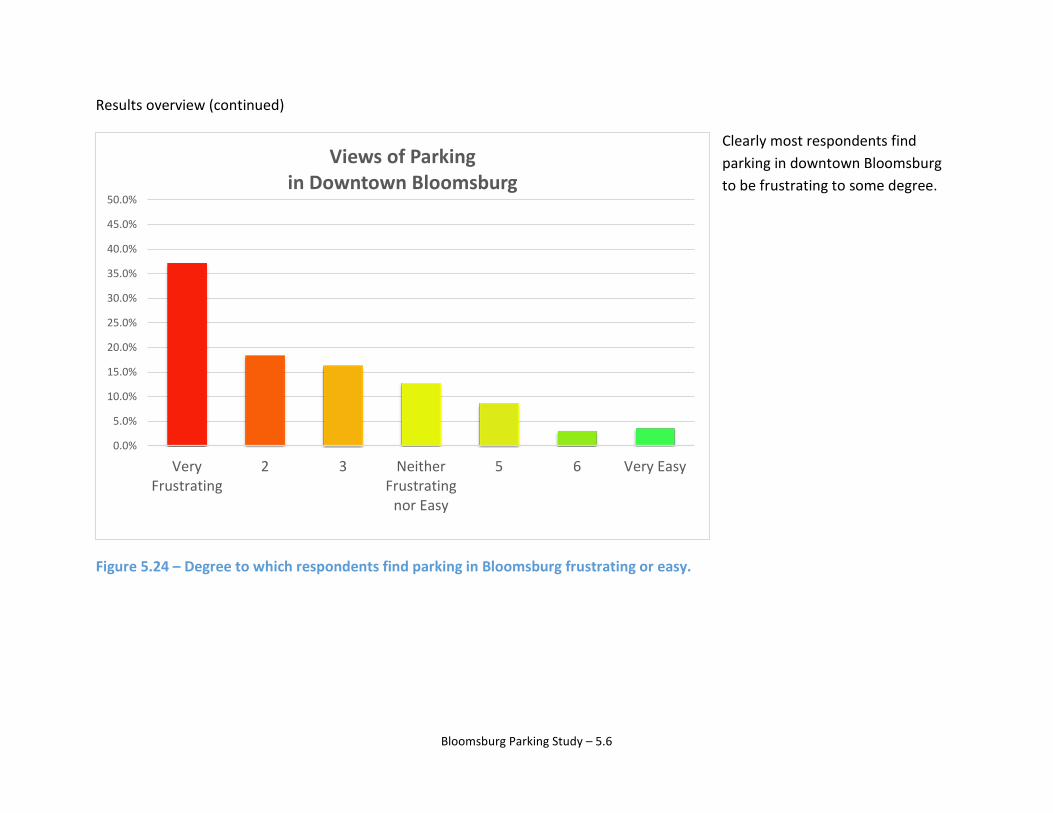
Clearly most respondents find parking in downtown Bloomsburg to be frustrating to some degree.
Figure 5.24 – Degree to which respondents find parking in Bloomsburg frustrating or easy.
0.0%
5.0%
10.0%
15.0%
20.0%
25.0%
30.0%
35.0%
40.0%
45.0%
50.0%
VeryFrustrating
2 3 NeitherFrustrating
nor Easy
5 6 Very Easy
Views of Parking in Downtown Bloomsburg
Bloomsburg Parking Study – 5.6
Results overview (continued)
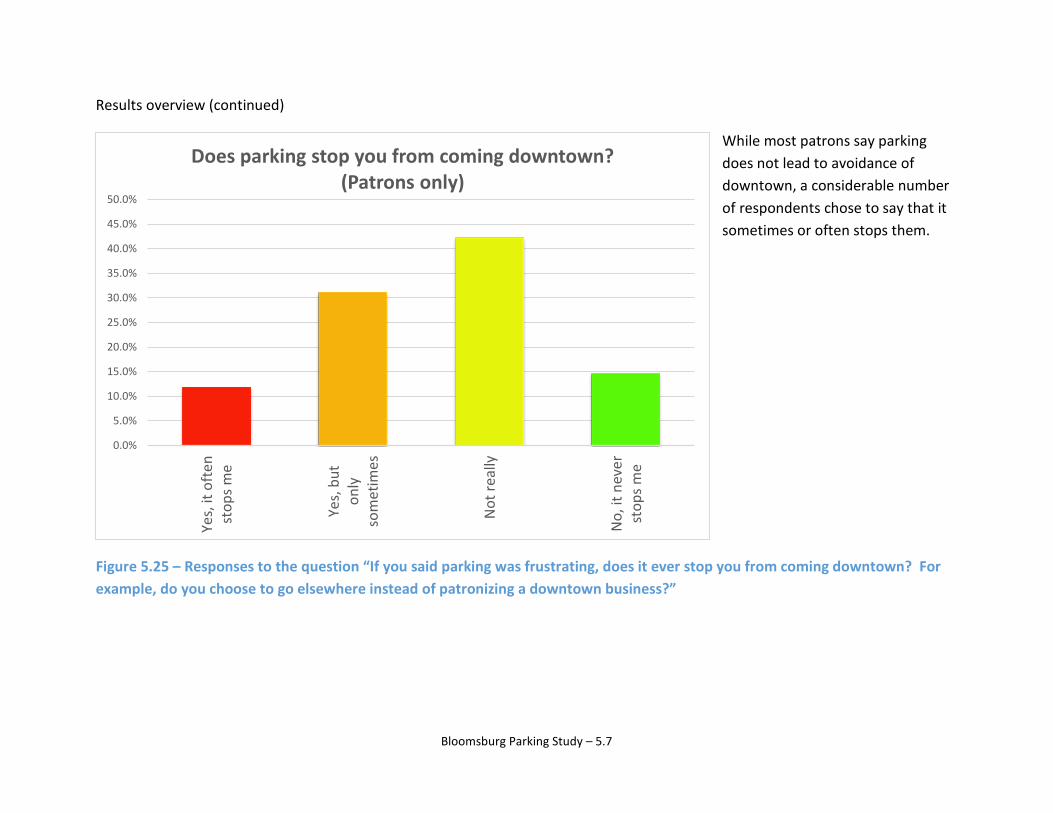
While most patrons say parking does not lead to avoidance of downtown, a considerable number of respondents chose to say that it sometimes or often stops them.
Figure 5.25 – Responses to the question “If you said parking was frustrating, does it ever stop you from coming downtown? For example, do you choose to go elsewhere instead of patronizing a downtown business?”
0.0%
5.0%
10.0%
15.0%
20.0%
25.0%
30.0%
35.0%
40.0%
45.0%
50.0%Ye
s, it
oft
enst
ops m
e
Yes,
but
only
som
etim
es
Not
real
ly
No,
it n
ever
stop
s me
Does parking stop you from coming downtown? (Patrons only)
Bloomsburg Parking Study – 5.7
5.3 PARKING SURVEYS – PREDICTIVE ANALYSES
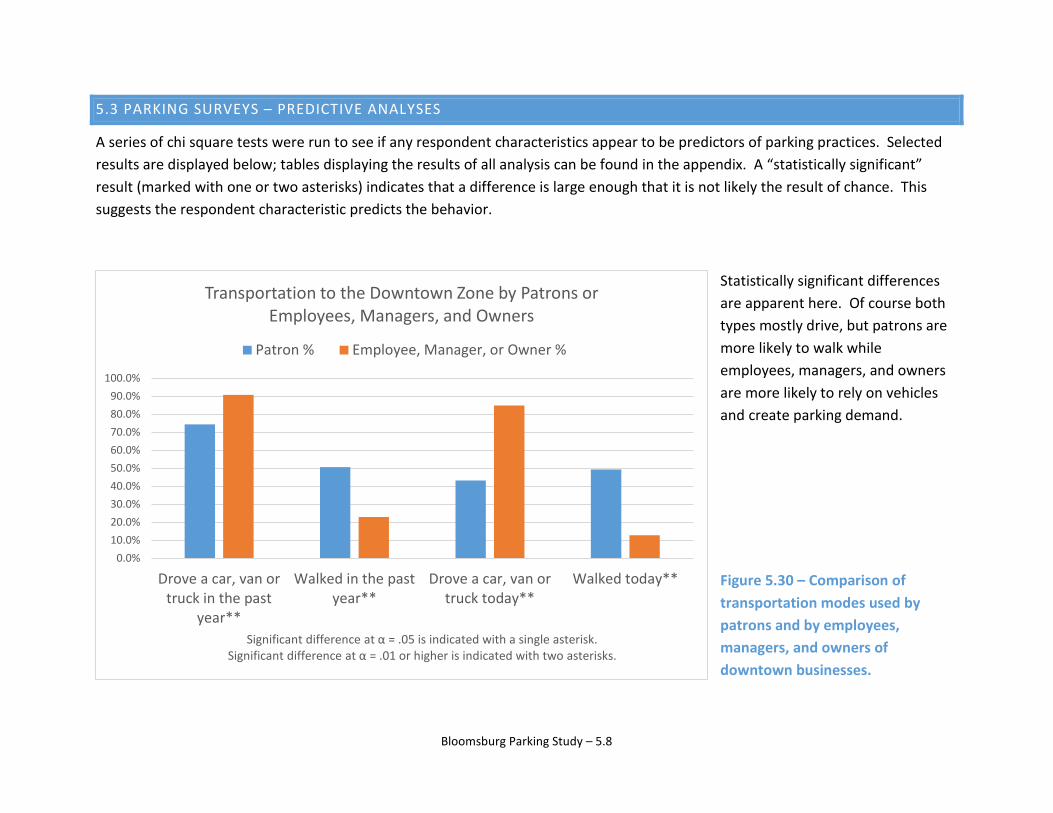
A series of chi square tests were run to see if any respondent characteristics appear to be predictors of parking practices. Selected results are displayed below; tables displaying the results of all analysis can be found in the appendix. A “statistically significant” result (marked with one or two asterisks) indicates that a difference is large enough that it is not likely the result of chance. This suggests the respondent characteristic predicts the behavior.
Statistically significant differences are apparent here. Of course both types mostly drive, but patrons are more likely to walk while employees, managers, and owners are more likely to rely on vehicles and create parking demand.
Figure 5.30 – Comparison of transportation modes used by patrons and by employees, managers, and owners of downtown businesses.
0.0%10.0%20.0%30.0%40.0%50.0%60.0%70.0%80.0%90.0%
100.0%
Drove a car, van ortruck in the past
year**
Walked in the pastyear**
Drove a car, van ortruck today**
Walked today**
Significant difference at α = .05 is indicated with a single asterisk. Significant difference at α = .01 or higher is indicated with two asterisks.
Transportation to the Downtown Zone by Patrons or Employees, Managers, and Owners
Patron % Employee, Manager, or Owner %
Bloomsburg Parking Study – 5.8
Predictive Analyses (continued)
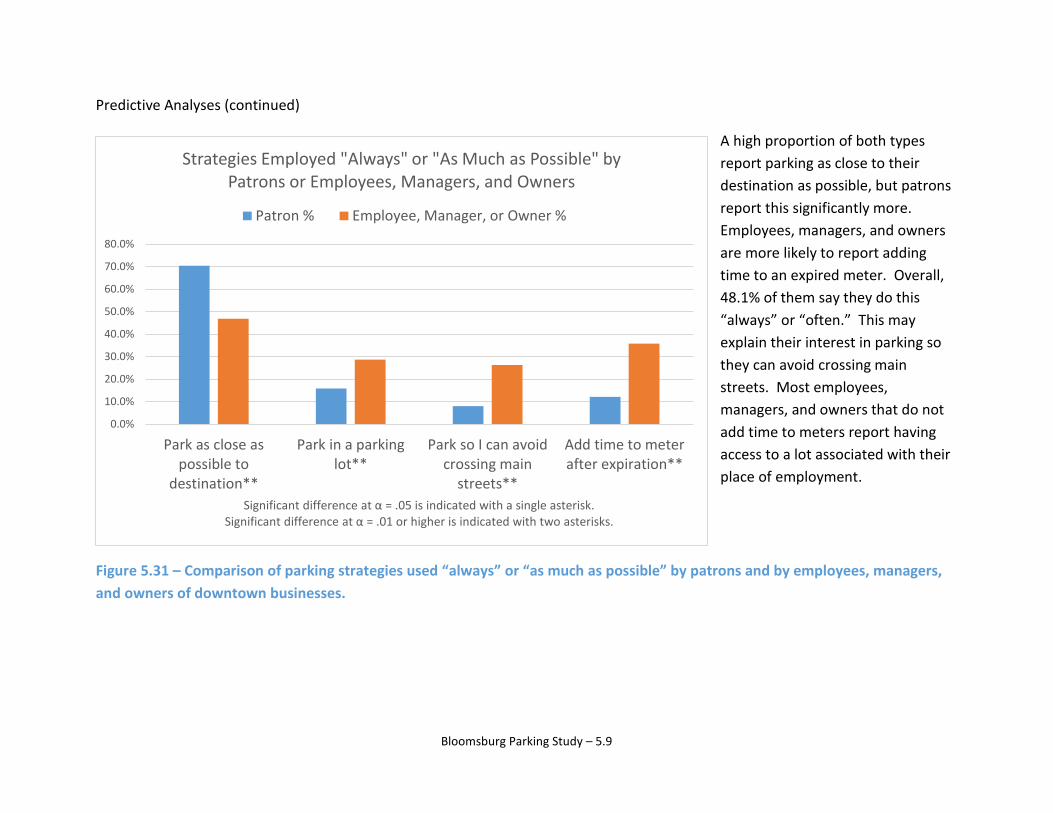
A high proportion of both types report parking as close to their destination as possible, but patrons report this significantly more. Employees, managers, and owners are more likely to report adding time to an expired meter. Overall, 48.1% of them say they do this “always” or “often.” This may explain their interest in parking so they can avoid crossing main streets. Most employees, managers, and owners that do not add time to meters report having access to a lot associated with their place of employment.
Figure 5.31 – Comparison of parking strategies used “always” or “as much as possible” by patrons and by employees, managers, and owners of downtown businesses.
0.0%
10.0%
20.0%
30.0%
40.0%
50.0%
60.0%
70.0%
80.0%
Park as close aspossible to
destination**
Park in a parkinglot**
Park so I can avoidcrossing main
streets**
Add time to meterafter expiration**
Significant difference at α = .05 is indicated with a single asterisk. Significant difference at α = .01 or higher is indicated with two asterisks.
Strategies Employed "Always" or "As Much as Possible" by Patrons or Employees, Managers, and Owners
Patron % Employee, Manager, or Owner %
Bloomsburg Parking Study – 5.9
Predictive Analyses (continued)
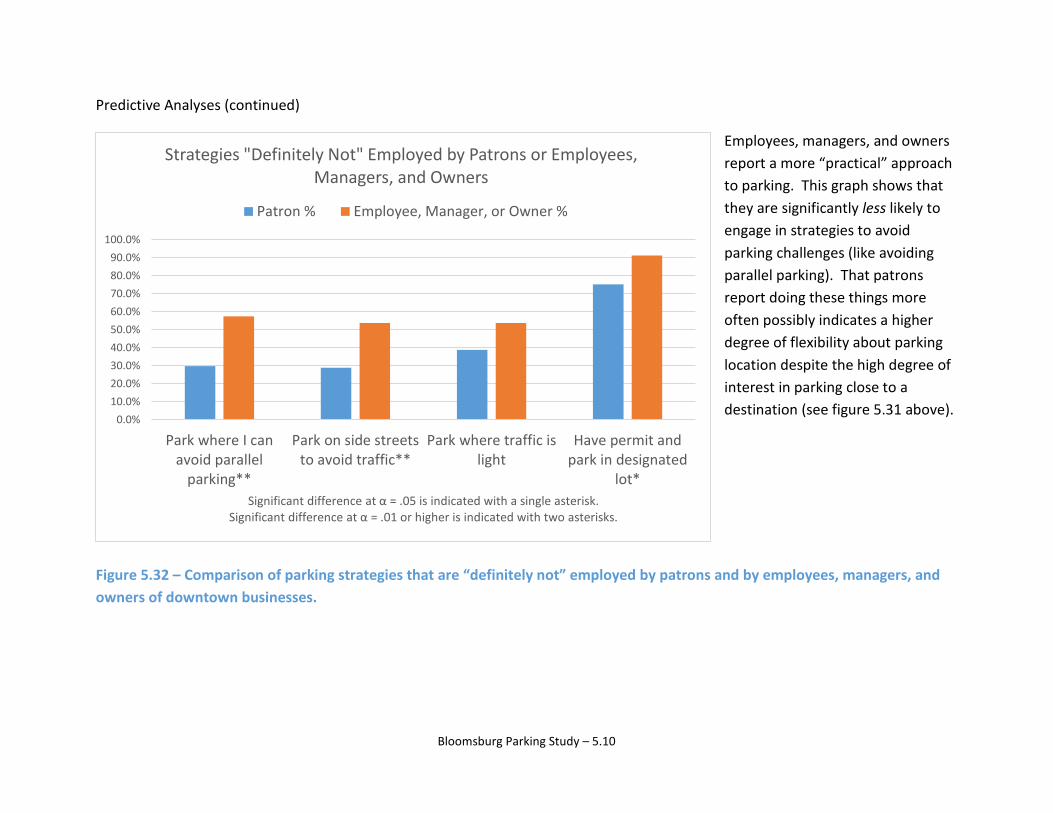
Employees, managers, and owners report a more “practical” approach to parking. This graph shows that they are significantly less likely to engage in strategies to avoid parking challenges (like avoiding parallel parking). That patrons report doing these things more often possibly indicates a higher degree of flexibility about parking location despite the high degree of interest in parking close to a destination (see figure 5.31 above).
Figure 5.32 – Comparison of parking strategies that are “definitely not” employed by patrons and by employees, managers, and owners of downtown businesses.
0.0%10.0%20.0%30.0%40.0%50.0%60.0%70.0%80.0%90.0%
100.0%
Park where I canavoid parallel
parking**
Park on side streetsto avoid traffic**
Park where traffic islight
Have permit andpark in designated
lot*Significant difference at α = .05 is indicated with a single asterisk.
Significant difference at α = .01 or higher is indicated with two asterisks.
Strategies "Definitely Not" Employed by Patrons or Employees, Managers, and Owners
Patron % Employee, Manager, or Owner %
Bloomsburg Parking Study – 5.10

Predictive Analyses (continued)
Students and non-students responded similarly to the question asking about what modes of transportation they used to the get to the downtown zone during the previous year. On the day of the survey, however, BU students were significantly more likely to report that they walked to the downtown zone and non-students were more likely to report driving. Of course some of these students that were surveyed as patrons likely live in or near the downtown zone and may even have had a car parked in the downtown zone at the time they took the survey.
Figure 5.33 – Comparison of transportation modes used by students and non-students.
0.0%
10.0%
20.0%
30.0%
40.0%
50.0%
60.0%
70.0%
80.0%
90.0%
Drove a car, van ortruck in the past year
Walked in the pastyear
Drove a car, van ortruck today*
Walked today**
Significant difference at α = .05 is indicated with a single asterisk. Significant difference at α = .01 or higher is indicated with two asterisks.
Transportation to the Downtown Zone by Non-Students and BU Students
Not a Student % BU Student %
Bloomsburg Parking Study – 5.11
Predictive Analyses (continued)
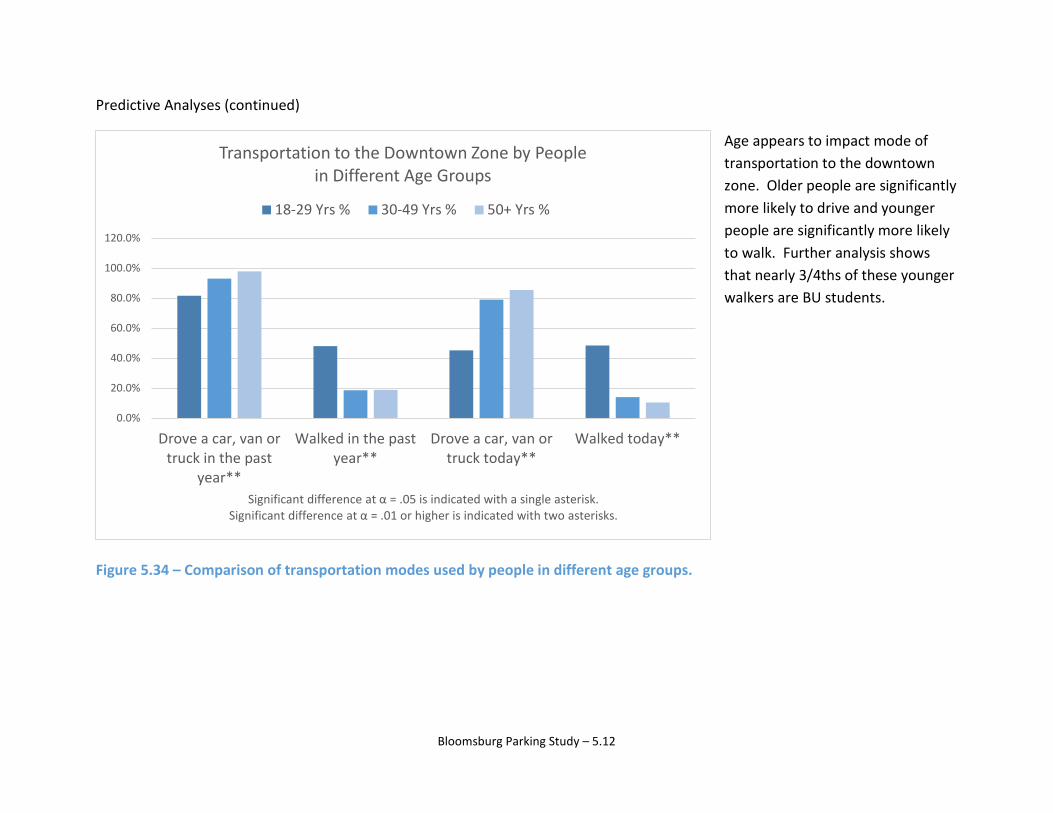
Age appears to impact mode of transportation to the downtown zone. Older people are significantly more likely to drive and younger people are significantly more likely to walk. Further analysis shows that nearly 3/4ths of these younger walkers are BU students.
Figure 5.34 – Comparison of transportation modes used by people in different age groups.
0.0%
20.0%
40.0%
60.0%
80.0%
100.0%
120.0%
Drove a car, van ortruck in the past
year**
Walked in the pastyear**
Drove a car, van ortruck today**
Walked today**
Significant difference at α = .05 is indicated with a single asterisk. Significant difference at α = .01 or higher is indicated with two asterisks.
Transportation to the Downtown Zone by People in Different Age Groups
18-29 Yrs % 30-49 Yrs % 50+ Yrs %
Bloomsburg Parking Study – 5.12
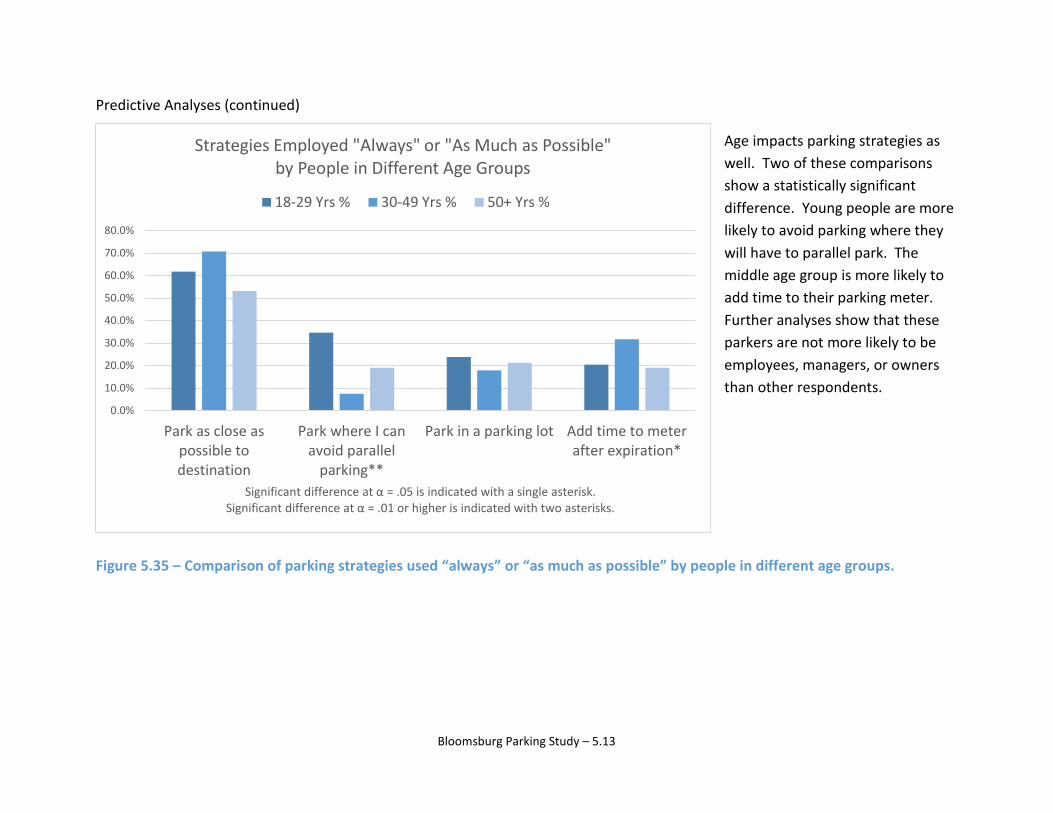
Predictive Analyses (continued)
Age impacts parking strategies as well. Two of these comparisons show a statistically significant difference. Young people are more likely to avoid parking where they will have to parallel park. The middle age group is more likely to add time to their parking meter. Further analyses show that these parkers are not more likely to be employees, managers, or owners than other respondents.
Figure 5.35 – Comparison of parking strategies used “always” or “as much as possible” by people in different age groups.
0.0%
10.0%
20.0%
30.0%
40.0%
50.0%
60.0%
70.0%
80.0%
Park as close aspossible todestination
Park where I canavoid parallel
parking**
Park in a parking lot Add time to meterafter expiration*
Significant difference at α = .05 is indicated with a single asterisk. Significant difference at α = .01 or higher is indicated with two asterisks.
Strategies Employed "Always" or "As Much as Possible" by People in Different Age Groups
18-29 Yrs % 30-49 Yrs % 50+ Yrs %
Bloomsburg Parking Study – 5.13
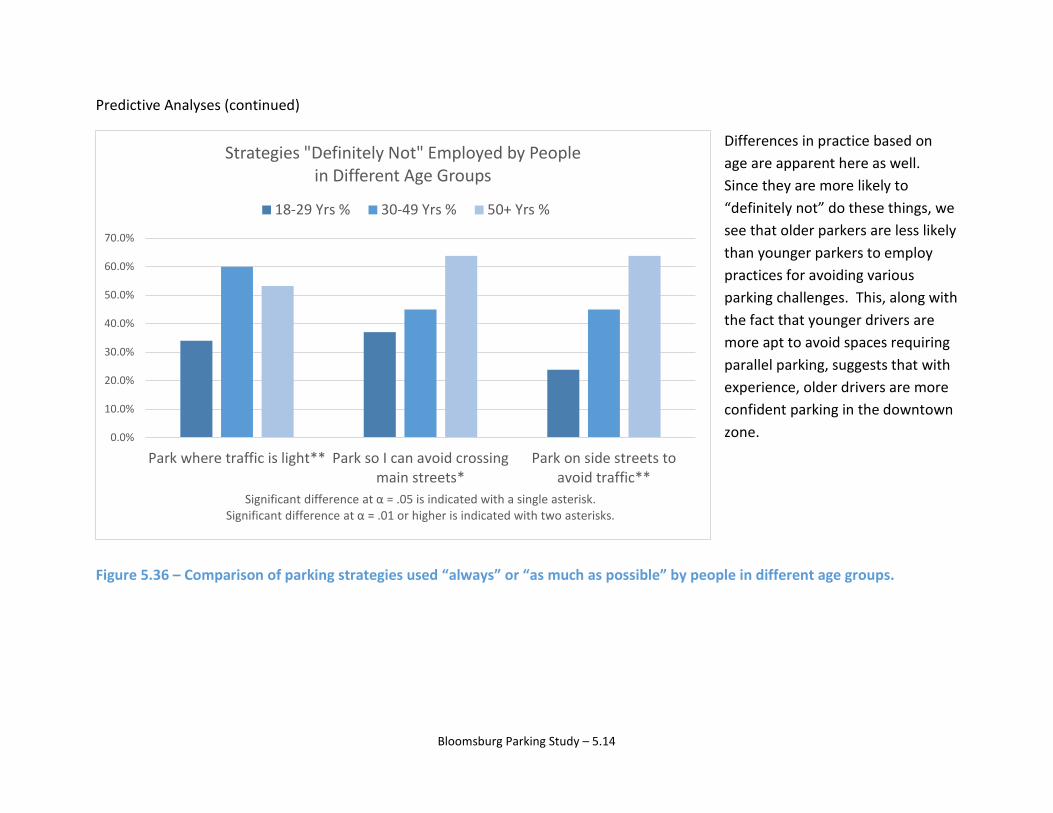
Predictive Analyses (continued)
Differences in practice based on age are apparent here as well. Since they are more likely to “definitely not” do these things, we see that older parkers are less likely than younger parkers to employ practices for avoiding various parking challenges. This, along with the fact that younger drivers are more apt to avoid spaces requiring parallel parking, suggests that with experience, older drivers are more confident parking in the downtown zone.
Figure 5.36 – Comparison of parking strategies used “always” or “as much as possible” by people in different age groups.
0.0%
10.0%
20.0%
30.0%
40.0%
50.0%
60.0%
70.0%
Park where traffic is light** Park so I can avoid crossingmain streets*
Park on side streets toavoid traffic**
Significant difference at α = .05 is indicated with a single asterisk. Significant difference at α = .01 or higher is indicated with two asterisks.
Strategies "Definitely Not" Employed by Peoplein Different Age Groups
18-29 Yrs % 30-49 Yrs % 50+ Yrs %
Bloomsburg Parking Study – 5.14
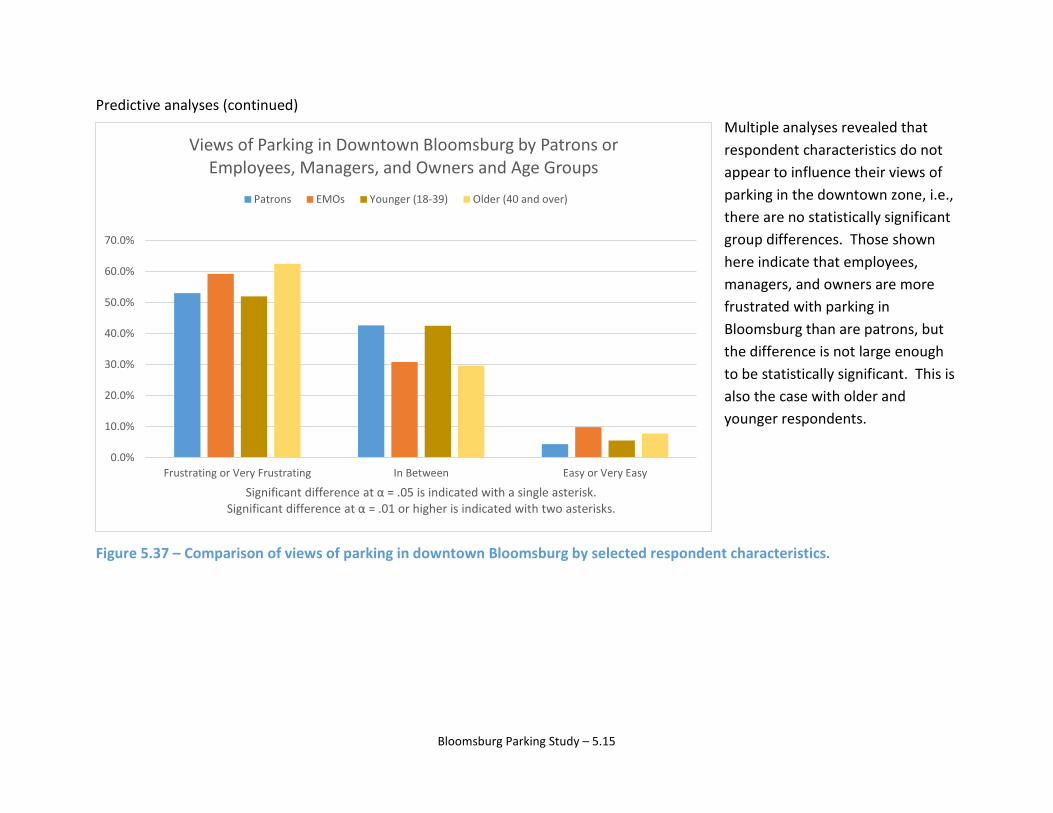
Predictive analyses (continued) Multiple analyses revealed that respondent characteristics do not appear to influence their views of parking in the downtown zone, i.e., there are no statistically significant group differences. Those shown here indicate that employees, managers, and owners are more frustrated with parking in Bloomsburg than are patrons, but the difference is not large enough to be statistically significant. This is also the case with older and younger respondents.
Figure 5.37 – Comparison of views of parking in downtown Bloomsburg by selected respondent characteristics.
0.0%
10.0%
20.0%
30.0%
40.0%
50.0%
60.0%
70.0%
Frustrating or Very Frustrating In Between Easy or Very Easy
Significant difference at α = .05 is indicated with a single asterisk. Significant difference at α = .01 or higher is indicated with two asterisks.
Views of Parking in Downtown Bloomsburg by Patrons or Employees, Managers, and Owners and Age Groups
Patrons EMOs Younger (18-39) Older (40 and over)
Bloomsburg Parking Study – 5.15
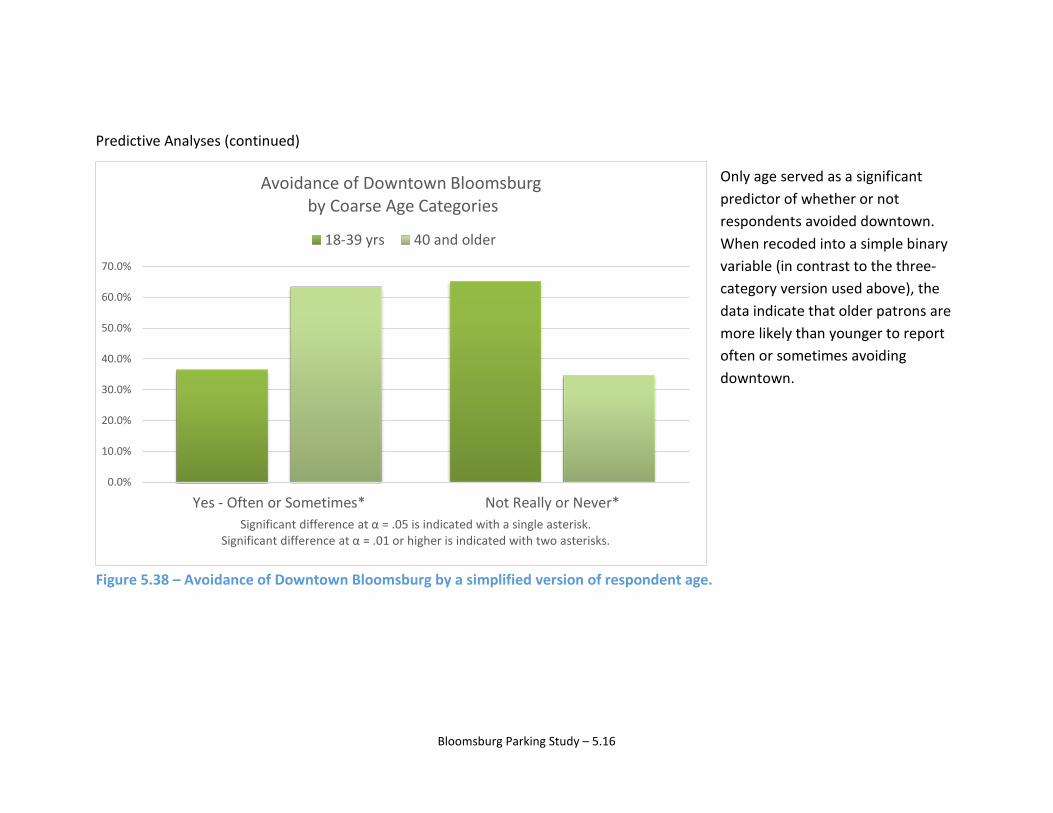
Predictive Analyses (continued)
Only age served as a significant predictor of whether or not respondents avoided downtown. When recoded into a simple binary variable (in contrast to the three- category version used above), the data indicate that older patrons are more likely than younger to report often or sometimes avoiding downtown.
Figure 5.38 – Avoidance of Downtown Bloomsburg by a simplified version of respondent age.
0.0%
10.0%
20.0%
30.0%
40.0%
50.0%
60.0%
70.0%
Yes - Often or Sometimes* Not Really or Never*Significant difference at α = .05 is indicated with a single asterisk.
Significant difference at α = .01 or higher is indicated with two asterisks.
Avoidance of Downtown Bloomsburgby Coarse Age Categories
18-39 yrs 40 and older
Bloomsburg Parking Study – 5.16

2015
6 – Concluding Remarks TOWN OF BLOOMSBURG PARKING STUDY
6.0 PARKING LOT NOTES/SUGGESTIONS
• General Observations:
o There is some parking congestion along Main Street, east of Market Street.
o But, parking is available at any given time in downtown Bloomsburg if people are willing to walk, and have improved knowledge of parking options.
o Overall, for those who purchase permits, it appears that the permit system is working effectively. However, the current system appears to create a subset of parkers for whom it is more economically advantageous to park in metered spots for long durations than it is to purchase a town parking permit.
o Surveys indicate:
Driving is the primary way to get downtown and then people commonly report parking as close as possible to their destination. Efforts to avoid parking challenges (e.g., parallel parking) are not widely reported.
Employees, managers and owners report a higher frequency of adding time to expired meters than patrons, but recall that the parking sweeps show that this practice does not appear to be a common occurrence (or at least did not show up given the manner in which the data were collected).
Many find parking in downtown Bloomsburg to be frustrating and a not-insignificant number say they avoid downtown because of parking (though a similarly large proportion does not avoid downtown because of parking). Age appears to predict avoidance of downtown, with patrons over forty being more likely to report avoiding downtown because of parking.
• Parking Signage:
o Parking signage on Main Street, Route 487 and Market Street is adequate. A problem is that it tends to blend in with the background. A few suggestions are listed below.
o Install signage to distinguish off-street parking from street parking to make people aware of extra parking.
o Install a green/white parking sign on Route 487 near the corner of Route 487 and North Street. This will allow westbound travelers on Route 487 to more easily access the metered parking behind the Bloomsburg Diner.
Bloomsburg Parking Study – 6.1
o Install a green/white parking sign on the south side of Iron Street and Main Street to highlight the Iron Street access to the D and E parking lots. A green/white parking sign is located on westbound side of Main Street prior to the Iron Street intersection, however, the sign is easily missed as drivers approach the intersection.
o Add signs on Iron Street to show people where the parking is located in the D and E lots once they make the turn onto Iron Street from Main Street.
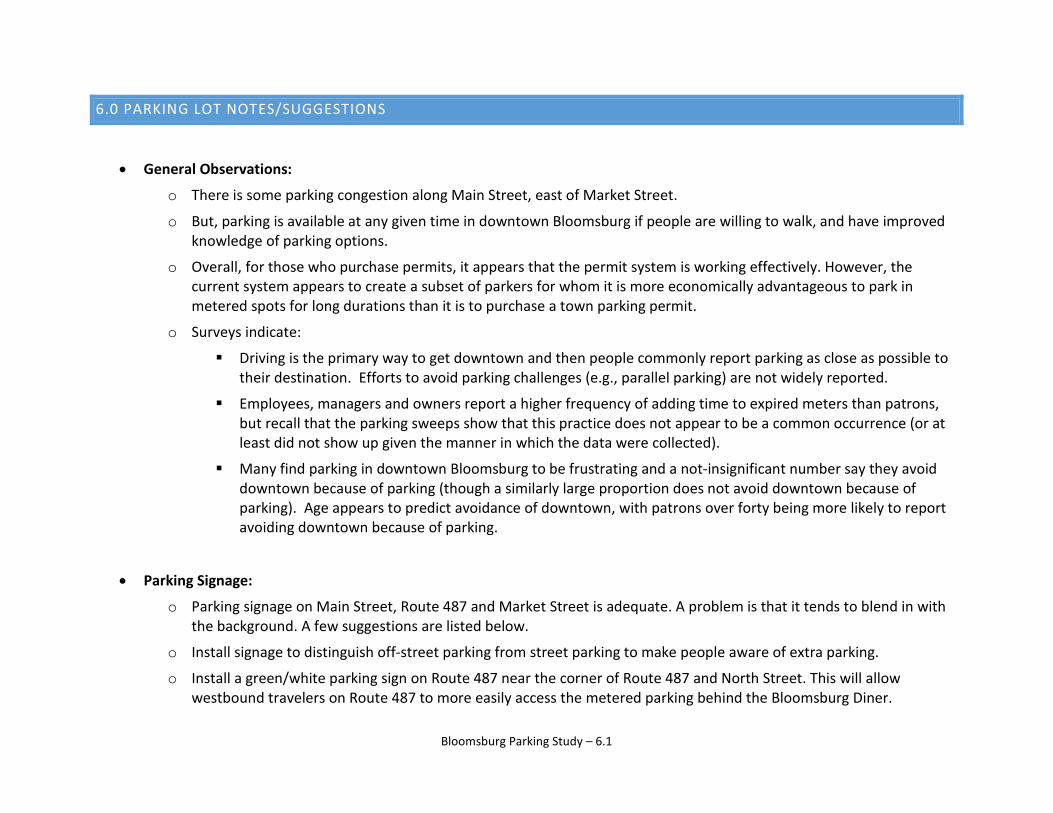
o Improve the sign for the metered spaces in Lot I when entering from Jefferson Street. The sign is very difficult to see and does not appropriately highlight the metered spaces.
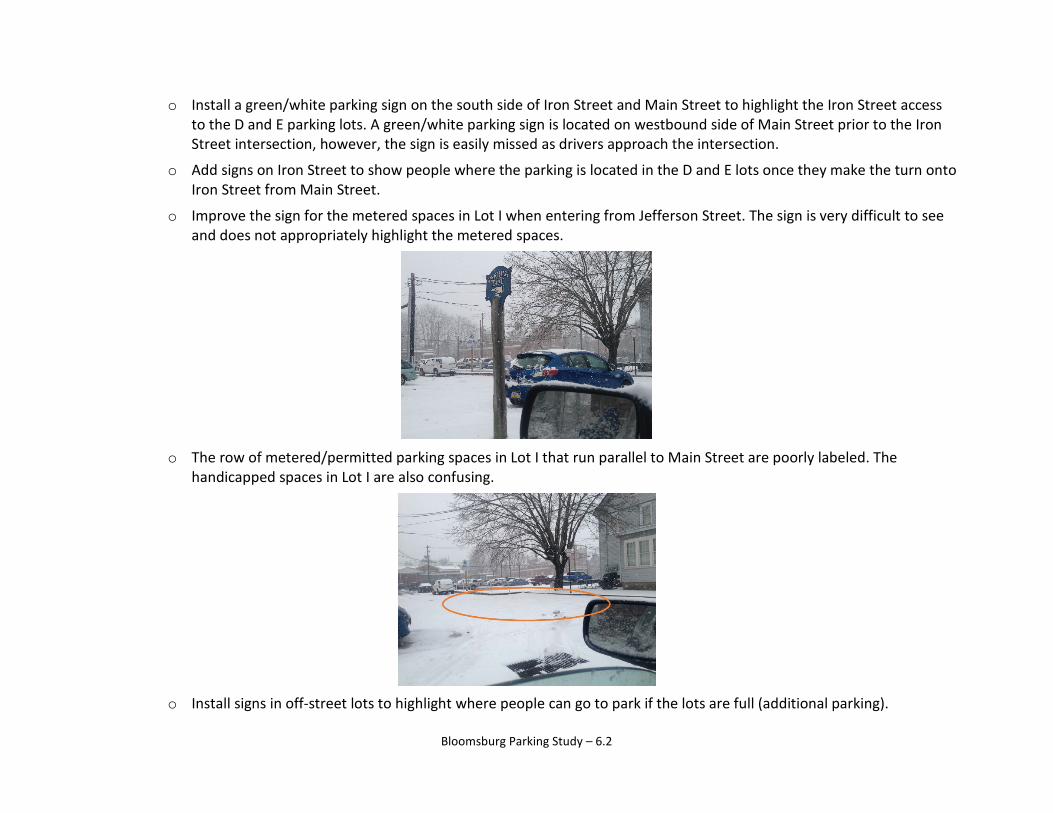
o The row of metered/permitted parking spaces in Lot I that run parallel to Main Street are poorly labeled. The
handicapped spaces in Lot I are also confusing.
o Install signs in off-street lots to highlight where people can go to park if the lots are full (additional parking).
Bloomsburg Parking Study – 6.2
• Infrastructure Changes:
o Lot E is important because of its location, but it is poorly designed. The lot has too many types of spaces (permit and non-permit), space orientations and pathways. It may be worthwhile to purchase peripheral properties, develop an improved flow pattern, and redesign the lot to ease parking for patrons. Focus on making this a destination parking lot (the primary lot).
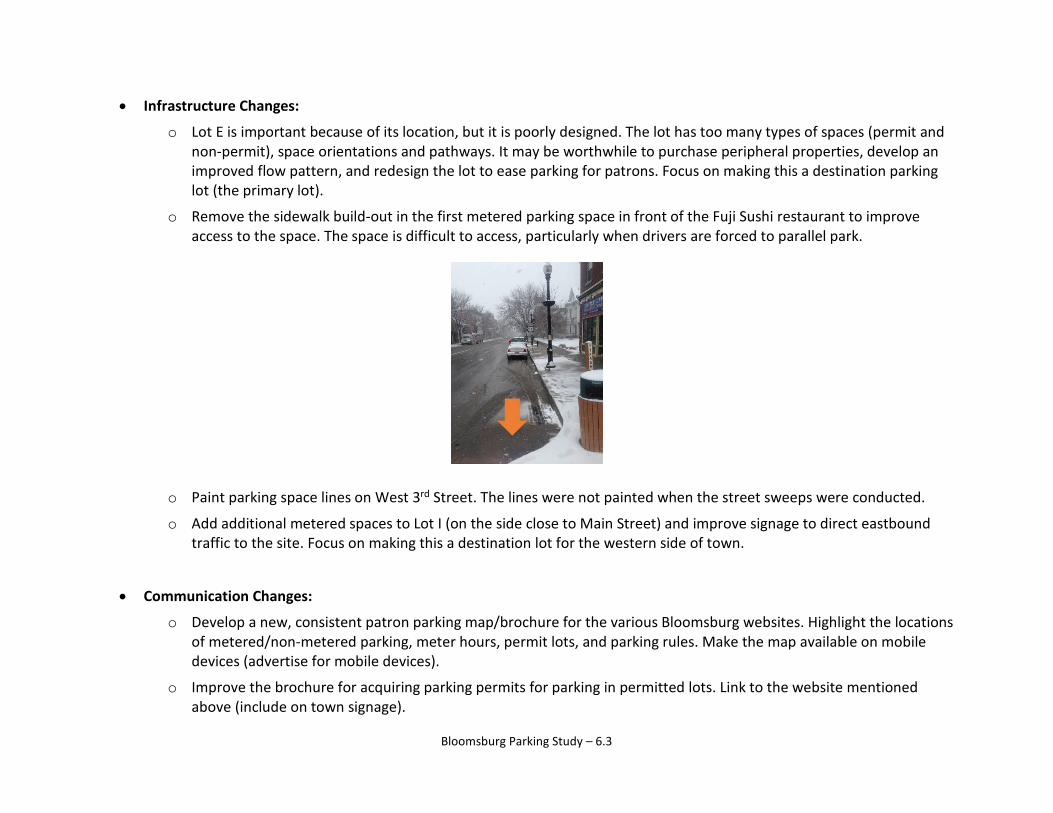
o Remove the sidewalk build-out in the first metered parking space in front of the Fuji Sushi restaurant to improve access to the space. The space is difficult to access, particularly when drivers are forced to parallel park.
o Paint parking space lines on West 3rd Street. The lines were not painted when the street sweeps were conducted.
o Add additional metered spaces to Lot I (on the side close to Main Street) and improve signage to direct eastbound traffic to the site. Focus on making this a destination lot for the western side of town.
• Communication Changes:
o Develop a new, consistent patron parking map/brochure for the various Bloomsburg websites. Highlight the locations of metered/non-metered parking, meter hours, permit lots, and parking rules. Make the map available on mobile devices (advertise for mobile devices).
o Improve the brochure for acquiring parking permits for parking in permitted lots. Link to the website mentioned above (include on town signage).
Bloomsburg Parking Study – 6.3
• Policy Changes / Future Considerations:
o The town parking permit process is confusing and expensive. This may prevent many students from purchasing permits. Make a lower cost, short-term permit for downtown employees. This will help to incentivize use of permitted lots for employees.
o Downtown is currently optimized for traffic flow. Instead, the town should work to shift the balance toward pedestrian flow. This will incentivize patrons’ willingness to park further away from their destinations.
Remove traffic from some alleys on Main Street. This will reduce the perceived/physical barrier to parking further away.
Add sidewalk build-outs on intersections to make it easier for pedestrians to cross wide intersections (e.g., Main Street and Market Street, or Main Street near Town Hall).
Improve pedestrian signals by including timers, better walk/don’t walk signs. There is a great deal of jaywalking because the current traffic setup does not favor pedestrians.
Give pedestrians more control at intersections by making the signals more responsive to their requests to walk.
o Consider developing a Route 11 bypass between Main Street and the river to allow truck and other through-traffic to bypass the downtown. Then, reduce Main Street to two lanes. This will allow an increase in on-street (diagonal) parking and allow sidewalk expansion to promote a pedestrian culture. Increasing the number of people walking on Main Street is necessary to increase patronage of downtown businesses.
Bloomsburg Parking Study – 6.4
2015
Appendices TOWN OF BLOOMSBURG PARKING STUDY
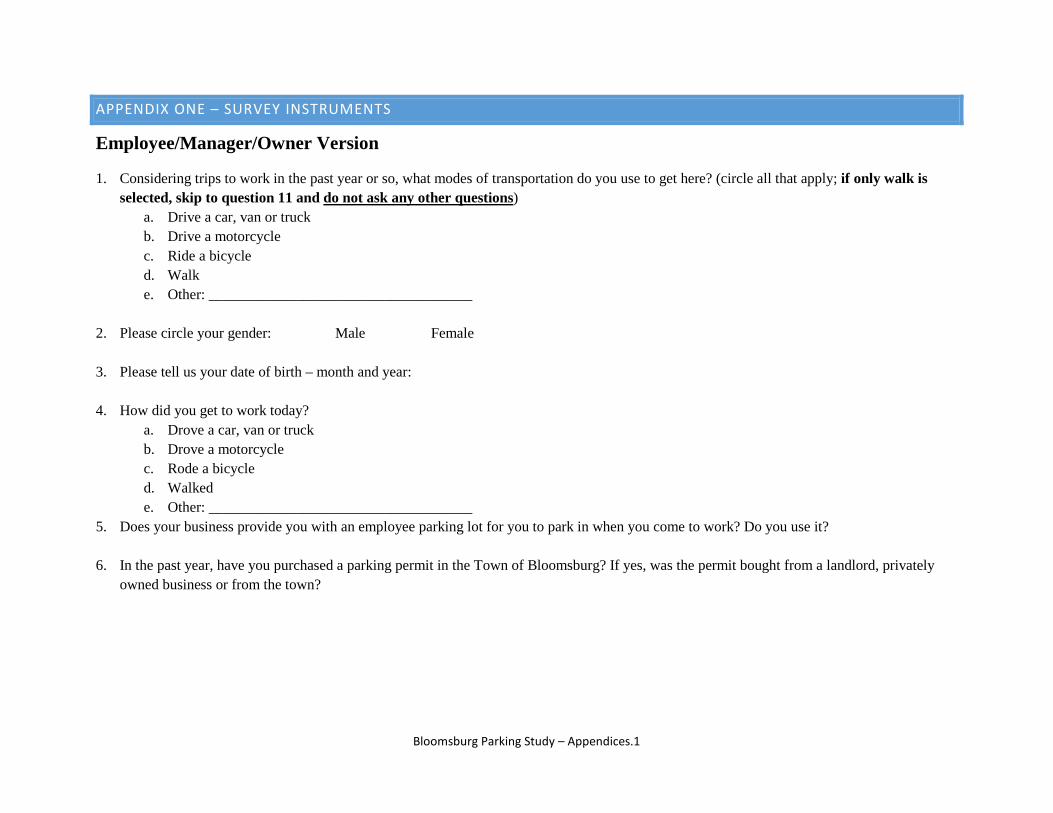
APPENDIX ONE – SURVEY INSTRUMENTS
Employee/Manager/Owner Version
1. Considering trips to work in the past year or so, what modes of transportation do you use to get here? (circle all that apply; if only walk is selected, skip to question 11 and do not ask any other questions)
a. Drive a car, van or truck b. Drive a motorcycle c. Ride a bicycle d. Walk e. Other: ____________________________________
2. Please circle your gender: Male Female
3. Please tell us your date of birth – month and year:
4. How did you get to work today?
a. Drove a car, van or truck b. Drove a motorcycle c. Rode a bicycle d. Walked e. Other: ____________________________________
5. Does your business provide you with an employee parking lot for you to park in when you come to work? Do you use it?
6. In the past year, have you purchased a parking permit in the Town of Bloomsburg? If yes, was the permit bought from a landlord, privately owned business or from the town?
Bloomsburg Parking Study – Appendices.1
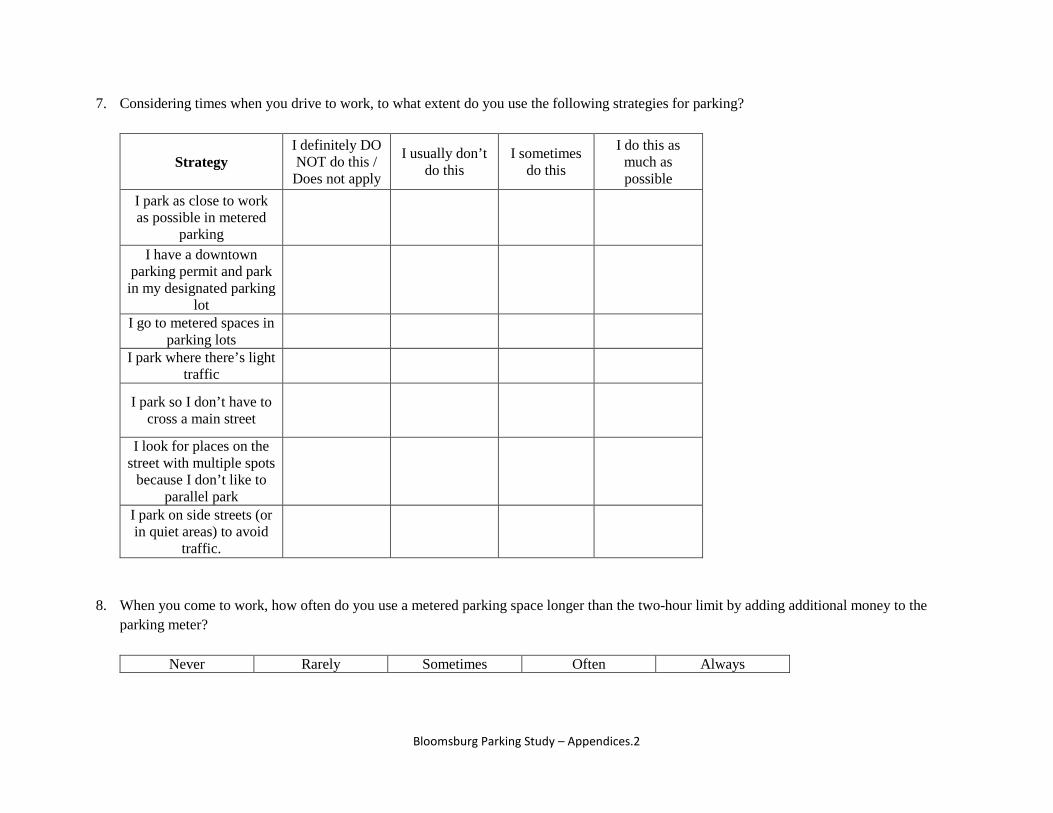
7. Considering times when you drive to work, to what extent do you use the following strategies for parking?
Strategy I definitely DO NOT do this / Does not apply
I usually don’t do this
I sometimes do this
I do this as much as possible
I park as close to work as possible in metered
parking
I have a downtown parking permit and park
in my designated parking lot
I go to metered spaces in parking lots
I park where there’s light traffic
I park so I don’t have to cross a main street
I look for places on the street with multiple spots
because I don’t like to parallel park
I park on side streets (or in quiet areas) to avoid
traffic.
8. When you come to work, how often do you use a metered parking space longer than the two-hour limit by adding additional money to the parking meter?
Never Rarely Sometimes Often Always
Bloomsburg Parking Study – Appendices.2
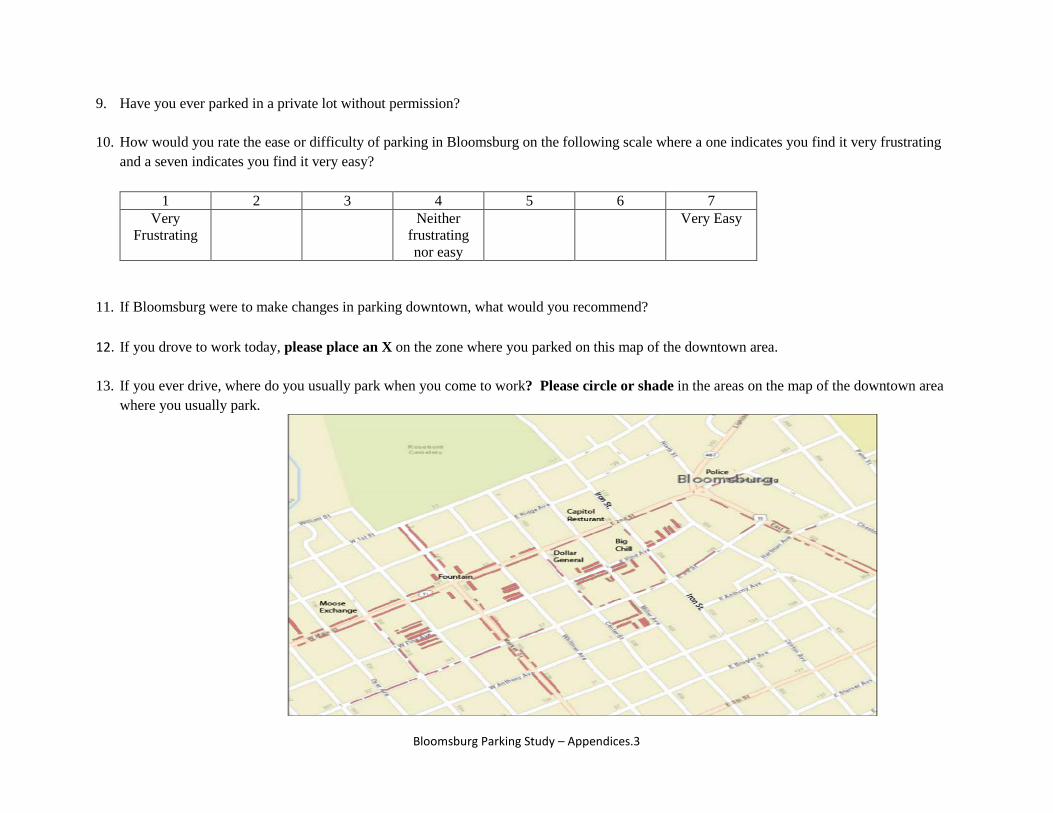
9. Have you ever parked in a private lot without permission?
10. How would you rate the ease or difficulty of parking in Bloomsburg on the following scale where a one indicates you find it very frustrating and a seven indicates you find it very easy?
1 2 3 4 5 6 7
Very Frustrating
Neither frustrating nor easy
Very Easy
11. If Bloomsburg were to make changes in parking downtown, what would you recommend?
12. If you drove to work today, please place an X on the zone where you parked on this map of the downtown area.
13. If you ever drive, where do you usually park when you come to work? Please circle or shade in the areas on the map of the downtown area where you usually park.
Bloomsburg Parking Study – Appendices.3
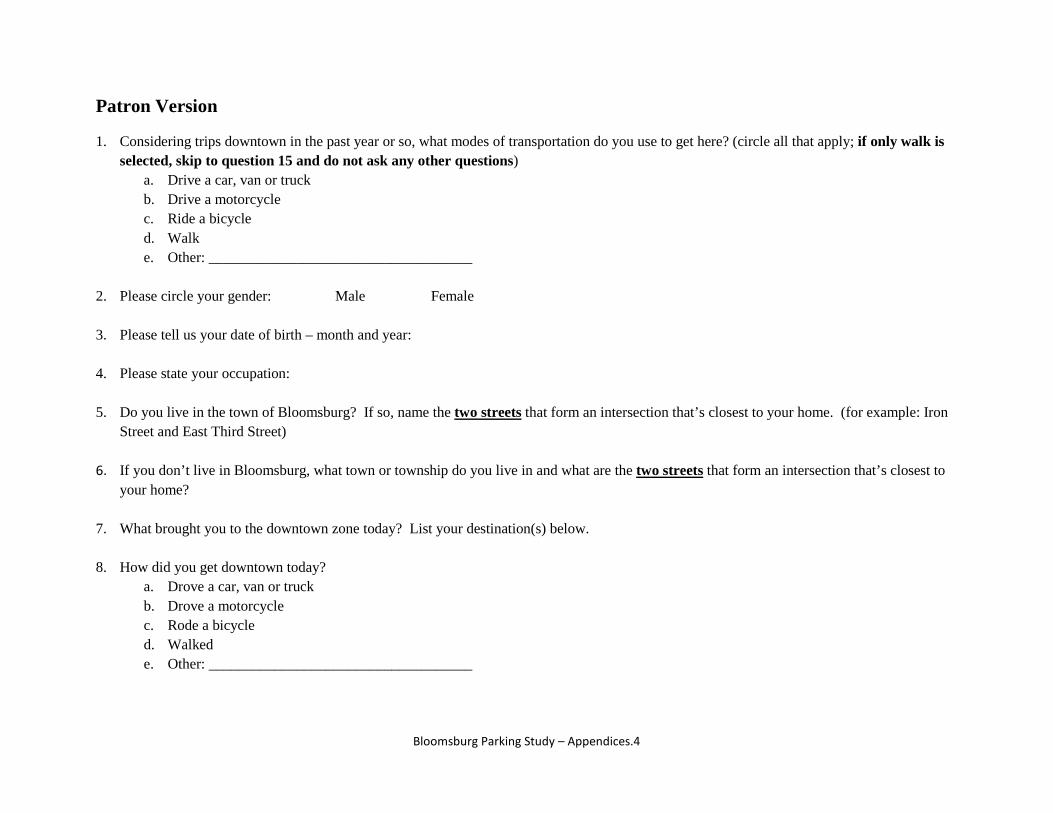
Patron Version
1. Considering trips downtown in the past year or so, what modes of transportation do you use to get here? (circle all that apply; if only walk is selected, skip to question 15 and do not ask any other questions)
a. Drive a car, van or truck b. Drive a motorcycle c. Ride a bicycle d. Walk e. Other: ____________________________________
2. Please circle your gender: Male Female
3. Please tell us your date of birth – month and year:
4. Please state your occupation:
5. Do you live in the town of Bloomsburg? If so, name the two streets that form an intersection that’s closest to your home. (for example: Iron
Street and East Third Street)
6. If you don’t live in Bloomsburg, what town or township do you live in and what are the two streets that form an intersection that’s closest to your home?
7. What brought you to the downtown zone today? List your destination(s) below.
8. How did you get downtown today? a. Drove a car, van or truck b. Drove a motorcycle c. Rode a bicycle d. Walked e. Other: ____________________________________
Bloomsburg Parking Study – Appendices.4
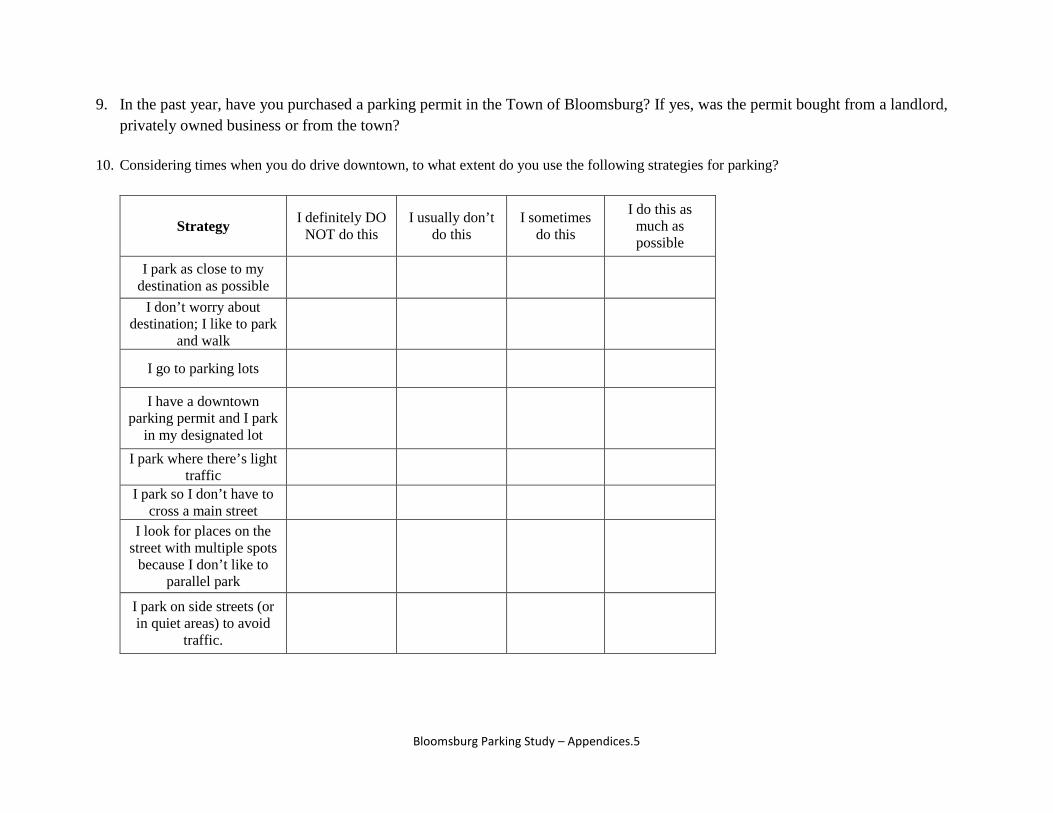
9. In the past year, have you purchased a parking permit in the Town of Bloomsburg? If yes, was the permit bought from a landlord, privately owned business or from the town?
10. Considering times when you do drive downtown, to what extent do you use the following strategies for parking?
Strategy I definitely DO NOT do this
I usually don’t do this
I sometimes do this
I do this as much as possible
I park as close to my destination as possible
I don’t worry about destination; I like to park
and walk
I go to parking lots
I have a downtown parking permit and I park
in my designated lot
I park where there’s light traffic
I park so I don’t have to cross a main street
I look for places on the street with multiple spots
because I don’t like to parallel park
I park on side streets (or in quiet areas) to avoid
traffic.
Bloomsburg Parking Study – Appendices.5
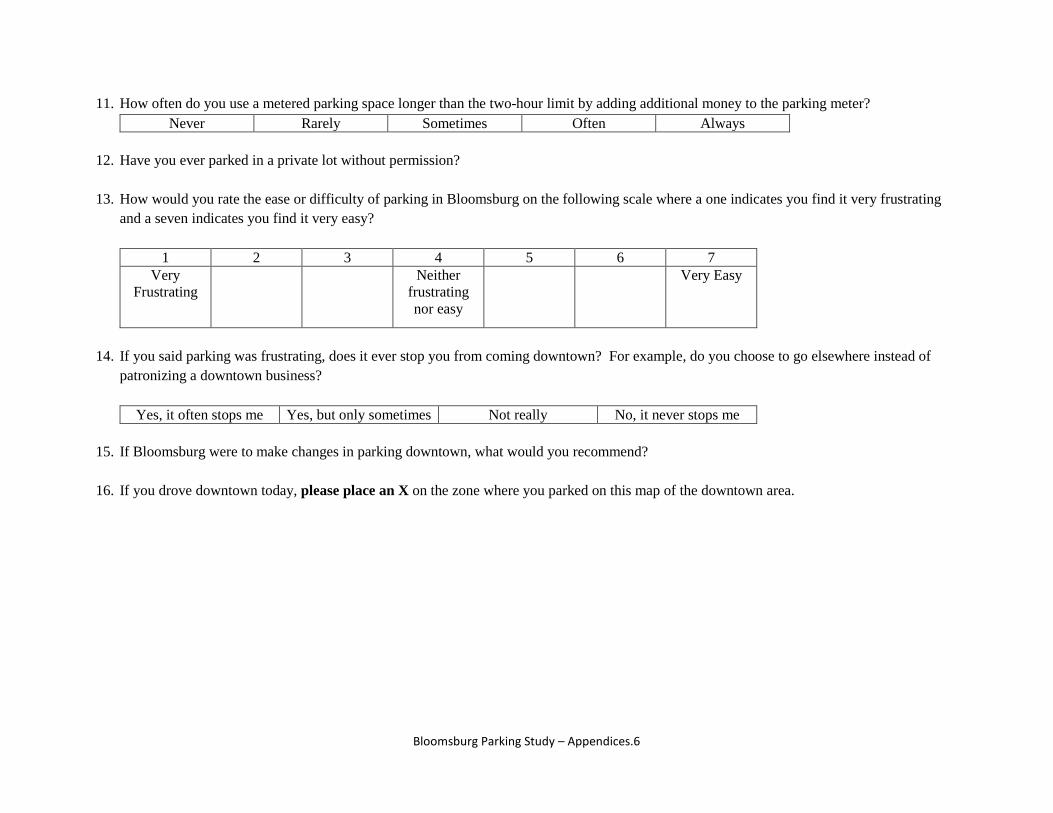
11. How often do you use a metered parking space longer than the two-hour limit by adding additional money to the parking meter? Never Rarely Sometimes Often Always
12. Have you ever parked in a private lot without permission?
13. How would you rate the ease or difficulty of parking in Bloomsburg on the following scale where a one indicates you find it very frustrating
and a seven indicates you find it very easy?
1 2 3 4 5 6 7 Very
Frustrating Neither
frustrating nor easy
Very Easy
14. If you said parking was frustrating, does it ever stop you from coming downtown? For example, do you choose to go elsewhere instead of
patronizing a downtown business?
Yes, it often stops me Yes, but only sometimes Not really No, it never stops me
15. If Bloomsburg were to make changes in parking downtown, what would you recommend?
16. If you drove downtown today, please place an X on the zone where you parked on this map of the downtown area.
Bloomsburg Parking Study – Appendices.6
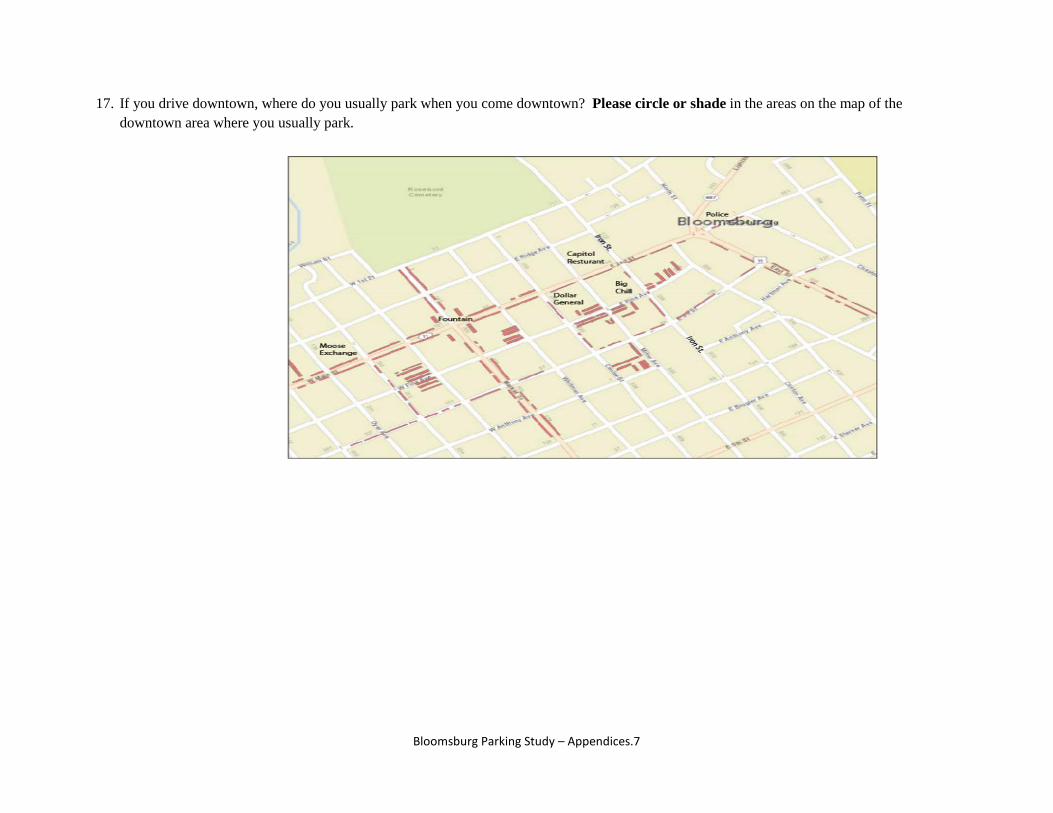
17. If you drive downtown, where do you usually park when you come downtown? Please circle or shade in the areas on the map of the downtown area where you usually park.
Bloomsburg Parking Study – Appendices.7
APPENDIX TWO – SURVEY PREDICTIVE ANALYSES TABLES
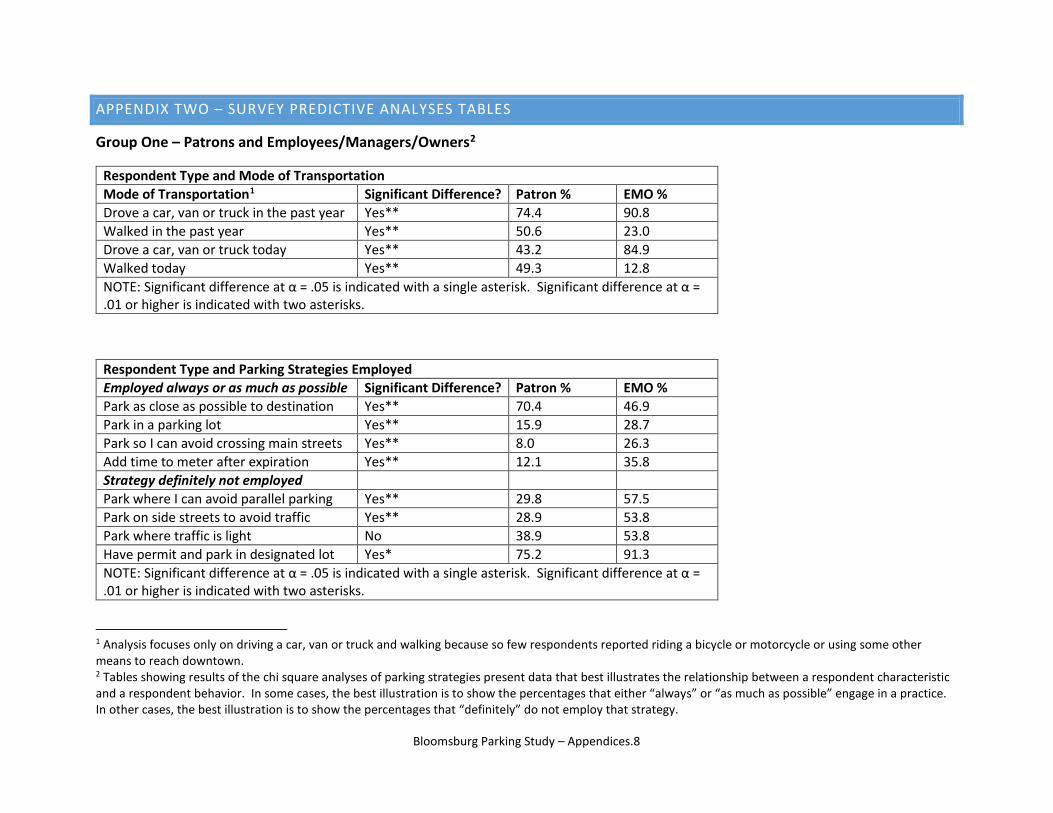
Group One – Patrons and Employees/Managers/Owners2
Respondent Type and Parking Strategies Employed Employed always or as much as possible Significant Difference? Patron % EMO % Park as close as possible to destination Yes** 70.4 46.9 Park in a parking lot Yes** 15.9 28.7 Park so I can avoid crossing main streets Yes** 8.0 26.3 Add time to meter after expiration Yes** 12.1 35.8 Strategy definitely not employed Park where I can avoid parallel parking Yes** 29.8 57.5 Park on side streets to avoid traffic Yes** 28.9 53.8 Park where traffic is light No 38.9 53.8 Have permit and park in designated lot Yes* 75.2 91.3 NOTE: Significant difference at α = .05 is indicated with a single asterisk. Significant difference at α = .01 or higher is indicated with two asterisks.
1 Analysis focuses only on driving a car, van or truck and walking because so few respondents reported riding a bicycle or motorcycle or using some other means to reach downtown. 2 Tables showing results of the chi square analyses of parking strategies present data that best illustrates the relationship between a respondent characteristic and a respondent behavior. In some cases, the best illustration is to show the percentages that either “always” or “as much as possible” engage in a practice. In other cases, the best illustration is to show the percentages that “definitely” do not employ that strategy.
Respondent Type and Mode of Transportation Mode of Transportation1 Significant Difference? Patron % EMO % Drove a car, van or truck in the past year Yes** 74.4 90.8 Walked in the past year Yes** 50.6 23.0 Drove a car, van or truck today Yes** 43.2 84.9 Walked today Yes** 49.3 12.8 NOTE: Significant difference at α = .05 is indicated with a single asterisk. Significant difference at α = .01 or higher is indicated with two asterisks.
Bloomsburg Parking Study – Appendices.8
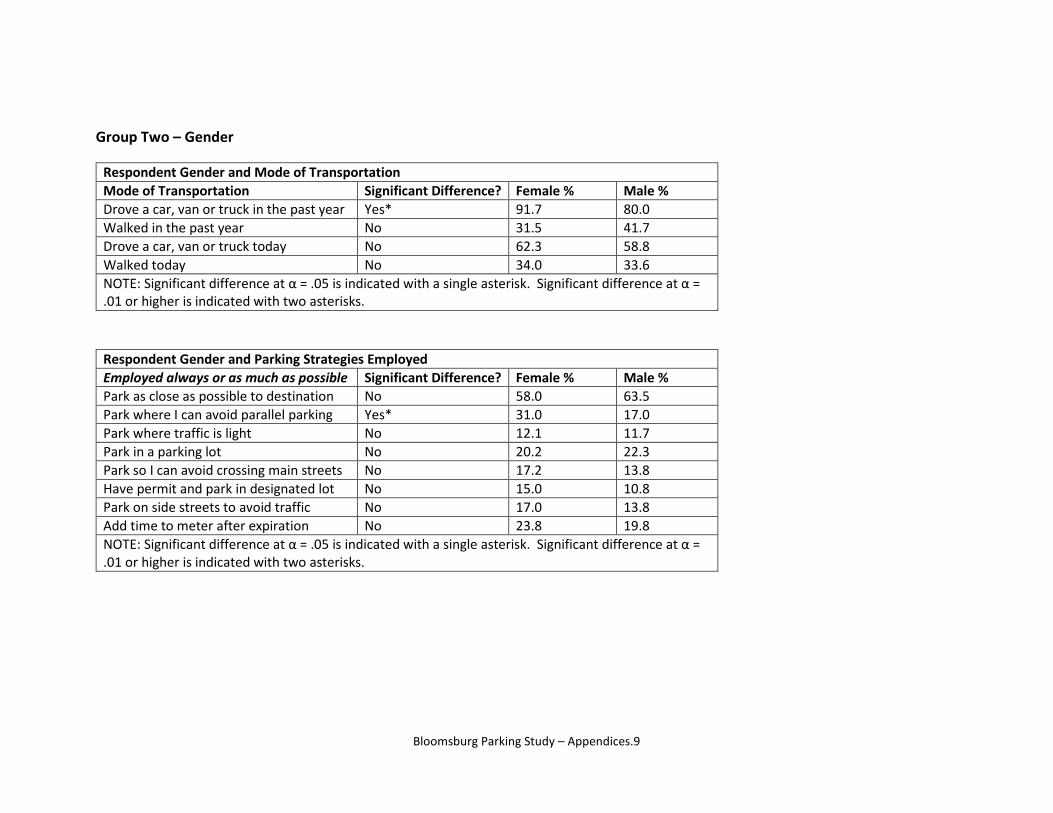
Group Two – Gender
Respondent Gender and Mode of Transportation Mode of Transportation Significant Difference? Female % Male % Drove a car, van or truck in the past year Yes* 91.7 80.0 Walked in the past year No 31.5 41.7 Drove a car, van or truck today No 62.3 58.8 Walked today No 34.0 33.6 NOTE: Significant difference at α = .05 is indicated with a single asterisk. Significant difference at α = .01 or higher is indicated with two asterisks.
Respondent Gender and Parking Strategies Employed Employed always or as much as possible Significant Difference? Female % Male % Park as close as possible to destination No 58.0 63.5 Park where I can avoid parallel parking Yes* 31.0 17.0 Park where traffic is light No 12.1 11.7 Park in a parking lot No 20.2 22.3 Park so I can avoid crossing main streets No 17.2 13.8 Have permit and park in designated lot No 15.0 10.8 Park on side streets to avoid traffic No 17.0 13.8 Add time to meter after expiration No 23.8 19.8 NOTE: Significant difference at α = .05 is indicated with a single asterisk. Significant difference at α = .01 or higher is indicated with two asterisks.
Bloomsburg Parking Study – Appendices.9
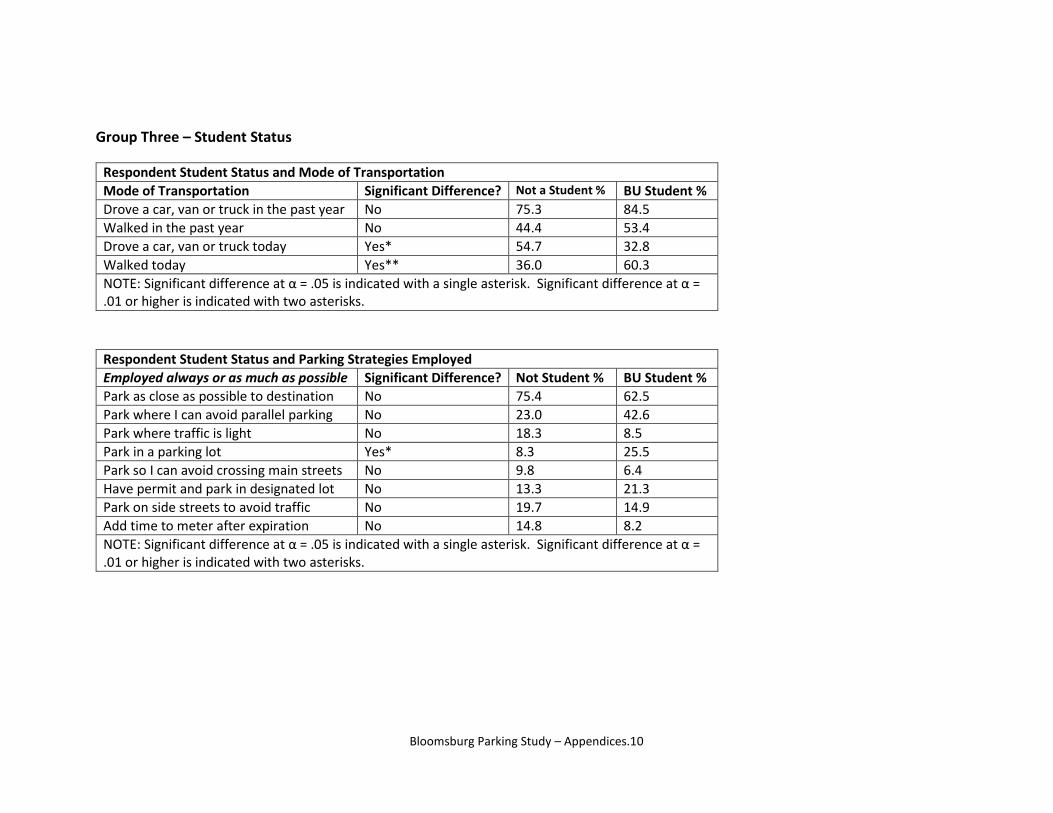
Group Three – Student Status
Respondent Student Status and Mode of Transportation Mode of Transportation Significant Difference? Not a Student % BU Student % Drove a car, van or truck in the past year No 75.3 84.5 Walked in the past year No 44.4 53.4 Drove a car, van or truck today Yes* 54.7 32.8 Walked today Yes** 36.0 60.3 NOTE: Significant difference at α = .05 is indicated with a single asterisk. Significant difference at α = .01 or higher is indicated with two asterisks.
Respondent Student Status and Parking Strategies Employed Employed always or as much as possible Significant Difference? Not Student % BU Student % Park as close as possible to destination No 75.4 62.5 Park where I can avoid parallel parking No 23.0 42.6 Park where traffic is light No 18.3 8.5 Park in a parking lot Yes* 8.3 25.5 Park so I can avoid crossing main streets No 9.8 6.4 Have permit and park in designated lot No 13.3 21.3 Park on side streets to avoid traffic No 19.7 14.9 Add time to meter after expiration No 14.8 8.2 NOTE: Significant difference at α = .05 is indicated with a single asterisk. Significant difference at α = .01 or higher is indicated with two asterisks.
Bloomsburg Parking Study – Appendices.10
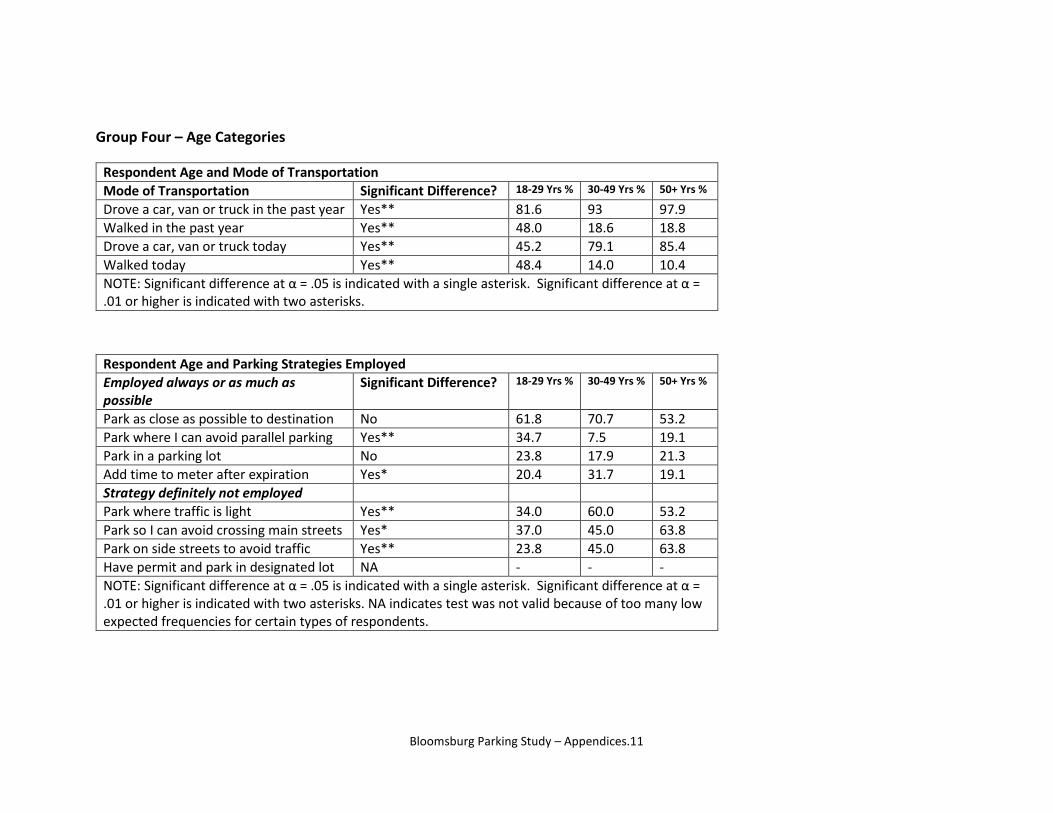
Group Four – Age Categories
Respondent Age and Mode of Transportation Mode of Transportation Significant Difference? 18-29 Yrs % 30-49 Yrs % 50+ Yrs %
Drove a car, van or truck in the past year Yes** 81.6 93 97.9 Walked in the past year Yes** 48.0 18.6 18.8 Drove a car, van or truck today Yes** 45.2 79.1 85.4 Walked today Yes** 48.4 14.0 10.4 NOTE: Significant difference at α = .05 is indicated with a single asterisk. Significant difference at α = .01 or higher is indicated with two asterisks.
Respondent Age and Parking Strategies Employed Employed always or as much as possible
Significant Difference? 18-29 Yrs % 30-49 Yrs % 50+ Yrs %
Park as close as possible to destination No 61.8 70.7 53.2 Park where I can avoid parallel parking Yes** 34.7 7.5 19.1 Park in a parking lot No 23.8 17.9 21.3 Add time to meter after expiration Yes* 20.4 31.7 19.1 Strategy definitely not employed Park where traffic is light Yes** 34.0 60.0 53.2 Park so I can avoid crossing main streets Yes* 37.0 45.0 63.8 Park on side streets to avoid traffic Yes** 23.8 45.0 63.8 Have permit and park in designated lot NA - - - NOTE: Significant difference at α = .05 is indicated with a single asterisk. Significant difference at α = .01 or higher is indicated with two asterisks. NA indicates test was not valid because of too many low expected frequencies for certain types of respondents.
Bloomsburg Parking Study – Appendices.11


