[ .'L.'
!_h __!=:_i
L.
• [//I
TDA ProgressReport42-119
N95-17288
November 15, 1994
Antenna Noise Temperatures of the 34-Meter
Beam-Waveguide Antenna With Horns ofDifferent Gains Installed at F1
T. Y. Otoshi, P. R. Lee, and M. M. Franco
Ground Antennas and FacilitiesEngineering Section
This article presents a set of theoretical and measured zenith-antenna noise tem-
peratures at 8.45 CHz for the DSS-13 34-m beam-waveguide antenna when horns
of different gains are installed at F1. The methodology for calculations is shown
in detail. The major differences between calculated and measured values are at-
tributed to changes in subreflector support leg scattering when illuminated by thevarious horns.
I. Introduction
A study program was initiated to find causes of higher than expected noise temperatures measured at
three focal points in a beam-waveguide (BWG) antenna system. The program consists of developing theo-
retical models for making predictions and obtaining experimental data for model verifications. Theoretical
methods are being developed to predict noise temperatures at focal points F1, F2, and F3. Focal pointF1 is the Cassegraln focal point near the main reflector vertex. An intermediate focal point F2 lies above
the azimuth track, and focal point F3 is the final BWG focal point, located in a subterranean pedestal
room. Degradations caused by the BWG system mirrors and shrouds were experimentally determined
from comparisons made of values measured at the different focal points [1].
The purpose of this article is to present theoretical and measured zenith-antenna noise temperaturevalues at 8.45 GHz for the DSS-13 34-m BWG antenna with different horns installed at F1. The horns
are corrugated, each horn having the same 6.25-deg semiflare angle but of different lengths and aperturediameters.
II. Analytical Procedure and Results
The calculation methodology differs from others used previously in that (1) the noise temperature
generated by the horn spillover (into the sky regions) between the edges of the subreflector and main
reflector is taken into account, (2) subreflector and main reflector efficiencies (to be defined) are applied
as necessary in the calculations of noise temperature contributions, and (3) brightness temperatures arecomputed for each theta for horn, subreflector, and main reflector radiation patterns for the weather
conditions that prevailed at the time of the experiments.
160
https://ntrs.nasa.gov/search.jsp?R=19950010873 2020-02-09T06:12:19+00:00Z
_i_i_ _ _
:i
ii
[ :i_ _ _
A. Radiation Patterns and Spillover Power Ratios
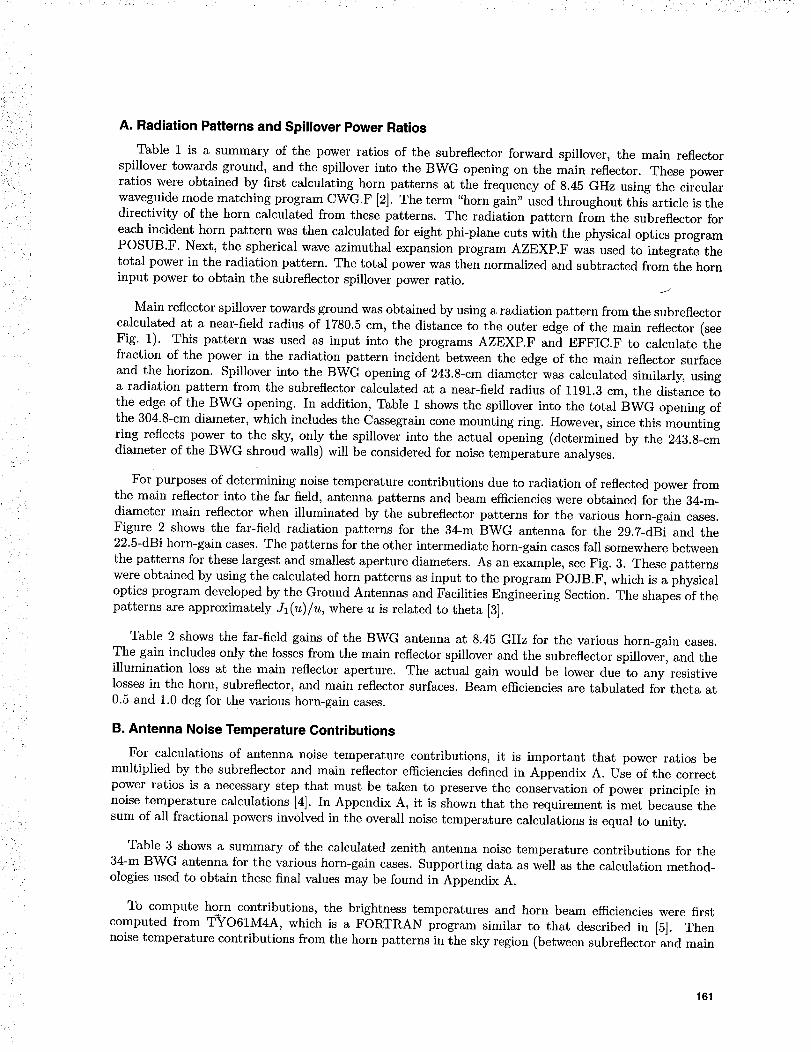
Table 1 is a summary of the power ratios of the subreflector forward spillover, the main reflector
spillover towards ground, and the spillover into the BWG opening on the main reflector. These power
ratios were obtained by first calculating horn patterns at the frequency of 8.45 GHz using the circular
waveguide mode matching program CWG.F [2]. The term "horn gain" used throughout this article is thedirectivity of the horn calculated from these patterns. The radiation pattern from the subreflector for
each incident horn pattern was then calculated for eight phi-plane cuts with the physical optics program
POSUB.F. Next, the spherical wave azimuthal expansion program AZEXP.F was used to integrate the
total power in the radiation pattern. The total power was then normalized and subtracted from the horn
input power to obtain the subreflector spillover power ratio.
Main reflector spillover towards ground was obtained by using a radiation pattern from the subreflector
calculated at a near-field radius of 1780.5 cm, the distance to the outer edge of the main reflector (see
Fig. 1). This pattern was used as input into the programs AZEXP.F and EFFIC.F to calculate the
fraction of the power in the radiation pattern incident between the edge of the main reflector surface
and the horizon. Spillover into the BWG opening of 243.8-cm diameter was calculated similarly, using
a radiation pattern from the subreflector calculated at a near-field radius of 1191.3 cm, the distance to
the edge of the BWG opening. In addition, Table 1 shows the spillover into the total BWG opening of
the 304.8-cm diameter, which includes the Cassegrain cone mounting ring. However, since this mounting
ring reflects power to the sky, only the spillover into the actual opening (determined by the 243.8-cm
diameter of the BWG shroud walls) will be considered for noise temperature analyses.
For purposes of determining noise temperature contributions due to radiation of reflected power from
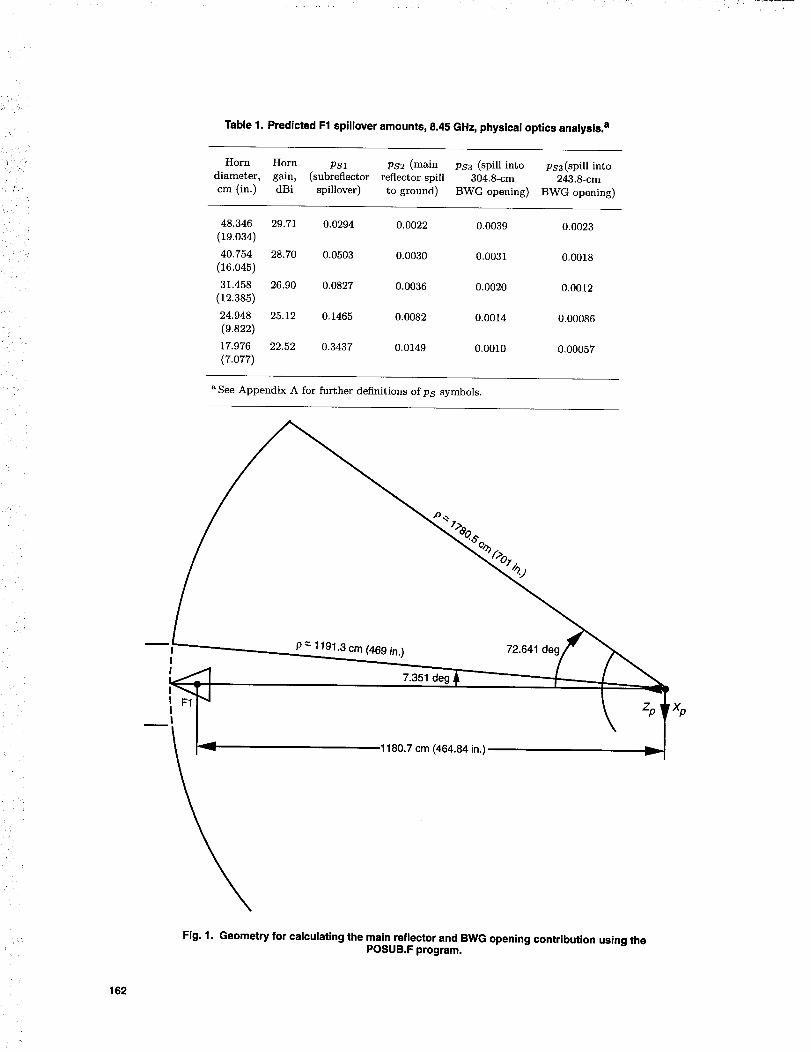
the main reflector into the far field, antenna patterns and beam efficiencies were obtained for the 34-m-diameter main reflector when illuminated by the subreflector patterns for the various horn-gain cases.
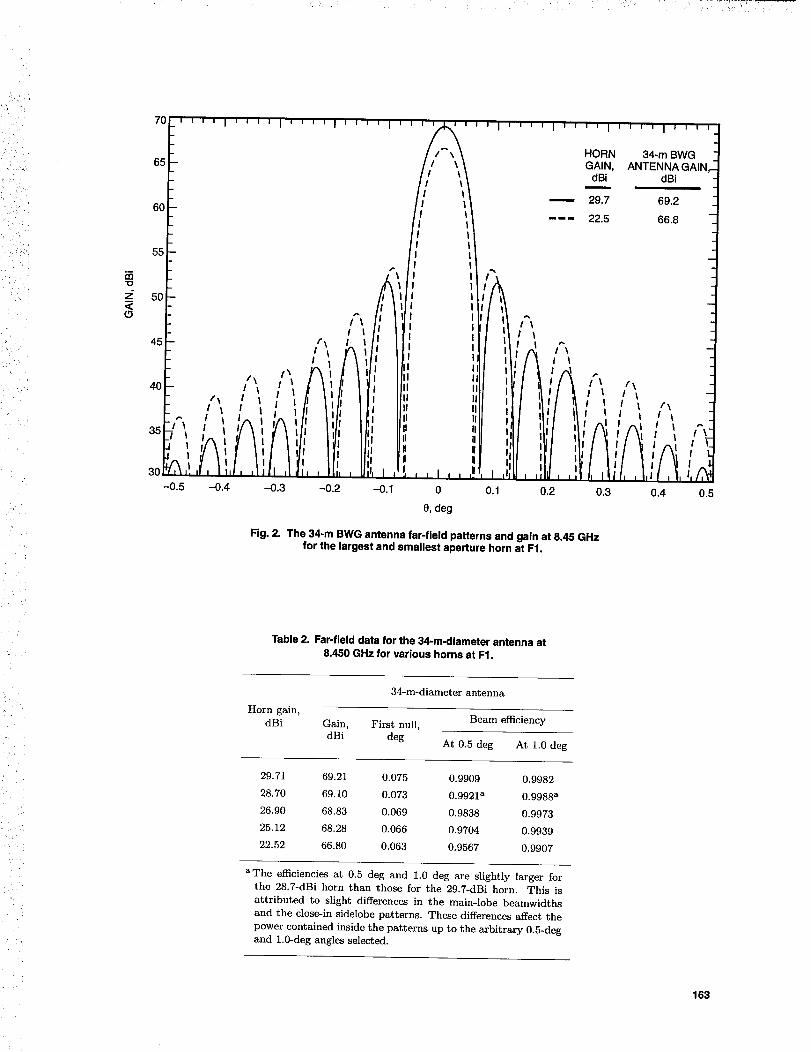
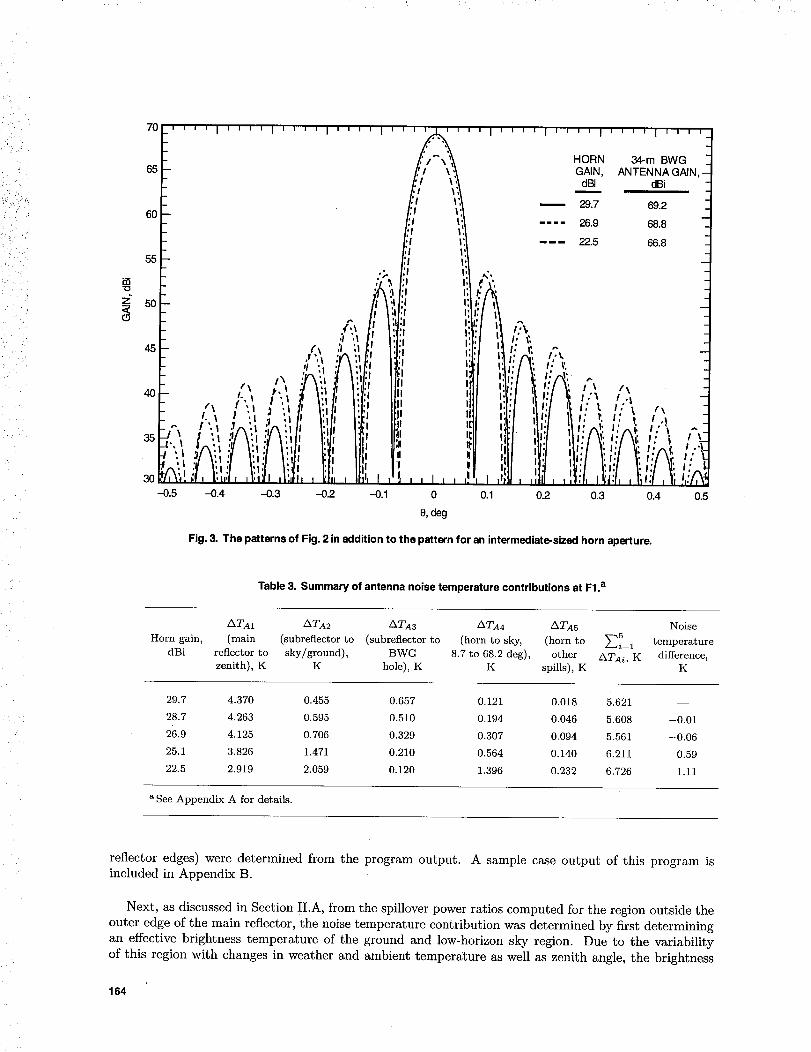
Figure 2 shows the far-field radiation patterns for the 34-m BWG antenna for the 29.7-dBi and the
22.5-dBi horn-gain cases. The patterns for the other intermediate horn-gain cases fall somewhere between
the patterns for these largest and smallest aperture diameters. As an example, see Fig. 3. These patterns
were obtained by using the calculated horn patterns as input to the program POJB.F, which is a physical
optics program developed by the Ground Antennas and Facilities Engineering Section. The shapes of the
patterns are approximately Jl(u)/u, where u is related to theta [3].
Table 2 shows the far-field gains of the BWG antenna at 8.45 GHz for the various horn-gain cases.
The gain includes only the losses from the main reflector spillover and the subreflector spillover, and the
illumination loss at the main reflector aperture. The actual gain would be lower due to any resistive
losses in the horn, subreflector, and main reflector surfaces. Beam efficieneies are tabulated for theta at
0.5 and 1.0 deg for the various horn-gain cases.
B. Antenna Noise Temperature Contributions
For calculations of antenna noise temperature contributions, it is important that power ratios be
multiplied by the subreflector and main reflector efficiencies defined in Appendix A. Use of the correct
power ratios is a necessary step that must be taken to preserve the conservation of power principle in
noise temperature calculations [4]. In Appendix A, it is shown that the requirement is met because the
sum of all fractional powers involved in the overall noise temperature calculations is equal to unity.
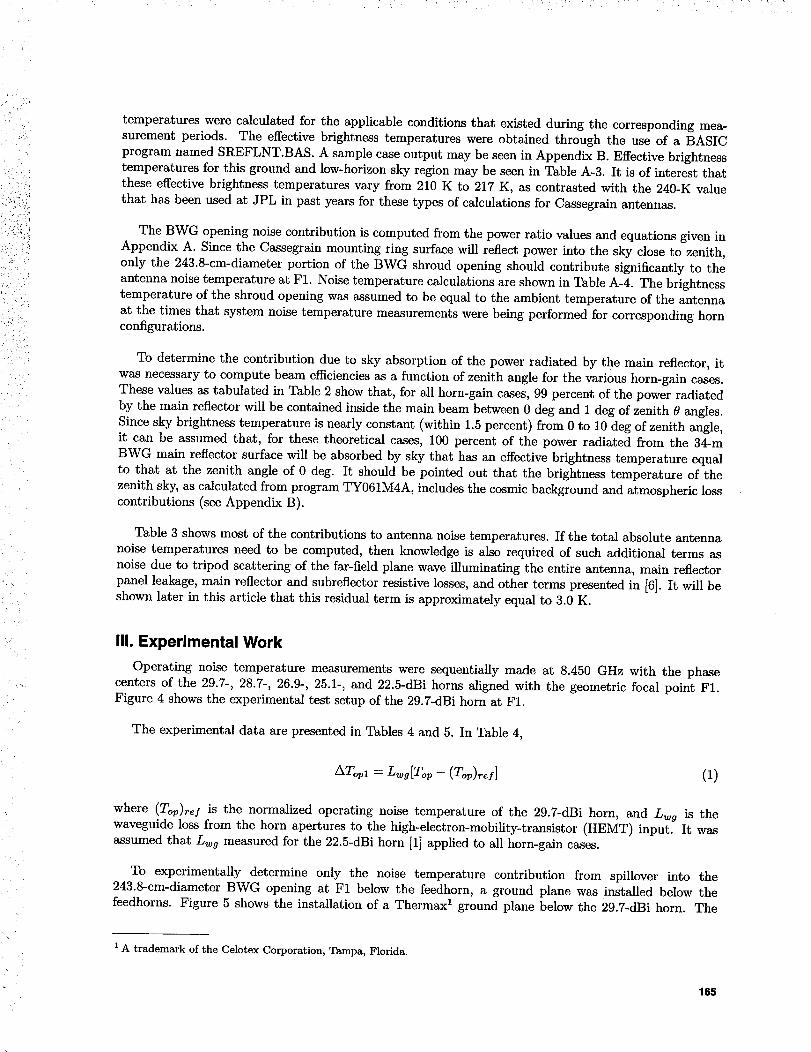
Table 3 shows a summary of the calculated zenith antenna noise temperature contributions for the
34-m BWG antenna for the various horn-gain cases. Supporting data as well as the calculation method-
ologies used to obtain these final values may be found in Appendix A.
To compute horn contributions, the brightness temperatures and horn beam efficiencies were first
computed from T'_YO61M4A, which is a FORTRAN program similar to that described in [5]. Then
noise temperature contributions from the horn patterns in the sky region (between subreflector and main
161
i_ ¸
•"i ?:
) • ):
Y
Table 1. Predicted F1 spillover amounts, 8.45 GHz, physical optics analysis, a
Horn Horn Ps1 PS2 (main Ps3 (spill into Ps3(spill into
diameter, gain, (subreflector reflector spill 304.8-cm 243.8-cm
cm (in.) dBi spillover) to ground) BWG opening) BWG opening)
48.346 29.71 0.0294 0.0022 0.0039 0.0023
(19.034)40.754 28.70 0.0503 0.0030 0.0031 0.0018
(16.045)31.458 26.90 0.0827 0.0036 0.0020 0.0012
(12.385)
24.948 25.12 0.1465 0.0082 0.0014 0.00086
(9.822)
17.976 22.52 0.3437 0.0149 0.0010 0.00057
(7.077)
a See Appendix A for further definitions of Ps symbols.
11"=11 7.351
i
1180.7 cm (464.84 in.) _I
Fig. 1. Geometry for calculating the main reflector and BWG opening contribution using thePOSUB.F program.
162
i/ /, i_ i
: i¸ •,
70
65
60
55
45
40
35
3O--0.5
l
HORN
GAIN,
dBi
29.7
22.5
34-m BWG
ANTENNA GAIN
dBi
69.2
66.8
Fig. 2. The 34-m BWG antenna far-field patterns and gain at 8.45 GHz
for the largest and smallest aperture horn at F1.
Table 2. Far-field data for the 34-m-diameter antenna at
8.450 GHz for various horns at F1.
r:
"r
34-m-diameter antenna
Horn gain,dBi Gain, First null, Beam efficiency
dBi deg At 0.5 deg At 1.0 deg
29.71 69.21 0.075 0.9909 0.9982
28.70 69.10 0.073 0.9921 a 0.9988 a
26.90 68.83 0.069 0.9838 0.9973
25.12 68.28 0.066 0.9704 0.9939
22.52 66.80 0.063 0.9567 0.9907
aThe efficiencies at 0.5 deg and 1.0 deg axe slightly larger for
the 28.7-dBi horn than those for the 29.7-dBi horn. This is
attributed to slight differences in the main-lobe beamwidths
and the close-in sidelobe patterns. These differences affect the
power contained inside the patterns up to the arbitrary 0.5-deg
and 1.0-deg angles selected.
163
i_ _(i_)
s ,
W
, , ,i , J , ,i ,,_ ,i,,,, I70 i
65
60
55
50
40 ,'\ _,l :l /;I.+-,I I '_ _ I'1
+ f,x[', +h',ih ',lil .+.'Ai,i/ I..,i/l.',tt t::, :,: '.,: .., .
1|
+I,1.,,.I,,t.,_t,,l'.,I;,, I.3O
-0.5 -0.4
:t : t
k!IP
I I
--0.13 -0.2
wa
IIIItltl
+i:!:1,!'!!I!I!I
--OA
I I I I i I I
i, ,l+, ,i
I'1 I,
h I I
,!lil I_
il ':I1
I:
I, 'JI|
:II ilII II,,,If It,:_ti tl:ill
!
0
e, deg
i I I
I ix
,, ,..-.,II
'tiI; l:
,, ilII,0.1
,i,,
m
_mmm
|mm
,, i,_ , _ i , , , ,
HORN 34-m BWGGAIN, ANTENNA GAIN,-
dBi dBi
29.7 69.2
26.9 68.8
22.5 66.8
l: t'.II/"_ ,,.
ril !+ _,,' _, _,,",+, ,,,,
"1 iU'I 1' I'/ _: ;',,'_¢, ;-'_
: : ;I; ; I: ; I:: _: ;_: !,:_
0.2 0.3 0.4 0.5
Fig. 3. The patterns of Fig. 2 in addition to the pattern for an intermediate-sized horn aperture.
Table 3. Summary of antenna noise temperature contributions at Fl.a
ATA1 ATA2 ATA3 ATA4 ATA5 Noise
Horn gain, (main (subreflector to (subreflector to (horn to sky, (horn to _i5__1 temperature
dBi reflector to sky/ground), BWG 8.7 to 68.2 deg), other ATA_, K difference,zenith), K K hole), K K spills), K K
29.7 4.370 0.455 0.657 0.121 0.018 5.621 --
28.7 4.263 0.595 0.510 0.194 0.046 5.608 -0.01
26.9 4.125 0.706 0.329 0.307 0.094 5.561 -0.06
25.1 3.826 1.471 0.210 0.564 0.140 6.211 0.59
22.5 2.919 2.059 0.120 1.396 0.232 6.726 1.11
a See Appendix A for details.
+ reflector edges) were determined from the program output. A sample case output of this program is
included in Appendix B.
Next, as discussed in Section II.A, from the spillover power ratios computed for the region outside the
outer edge of the main reflector, the noise temperature contribution was determined by first determining
an effective brightness temperature of the ground and low-horizon sky region. Due to the variability
of this region with changes in weather and ambient temper_'ture as well as zenith angle, the brightness
164
j.•[) ,L .'
:k_ '
/
/
temperatures were calculated for the applicable conditions that existed during the corresponding mea-
surement periods. The effective brightness temperatures were obtained through the use of a BASIC
program named SREFLNT.BAS. A sample case output may be seen in Appendix B. Effective brightness
temperatures for this ground and low-horizon sky region may be seen in Table A-3. It is of interest that
these effective brightness temperatures vary from 210 K to 217 K, as contrasted with the 240-K value
that has been used at JPL in past years for these types of calculations for Cassegrain antennas.
The BWG opening noise contribution is computed from the power ratio values and equations given in
Appendix A. Since the Cassegrain mounting ring surface will reflect power into the sky close to zenith,
only the 243.8-cm-diameter portion of the BWG shroud opening should contribute significantly to the
antenna noise temperature at F1. Noise temperature calculations are shown in Table A-4. The brightness
temperature of the shroud opening was assumed to be equal to the ambient temperature of the antenna
at the times that system noise temperature measurements were being performed for corresponding horn
configurations.
To determine the contribution due to sky absorption of the power radiated by the main reflector, it
was necessary to compute beam efficiencies as a function of zenith angle for the various horn-gain cases.
These values as tabulated in Table 2 show that, for all horn-gain cases, 99 percent of the power radiated
by the main reflector will be contained inside the main beam between 0 deg and 1 deg of zenith 6 angles.
Since sky brightness temperature is nearly constant (within 1.5 percent) from 0 to 10 deg of zenith angle,
it can be assumed that, for these theoretical cases, 100 percent of the power radiated from the 34-m
BWG main reflector surface will be absorbed by sky that has an effective brightness temperature equal
to that at the zenith angle of 0 deg. It should be pointed out that the brightness temperature of the
zenith sky, as calculated from program TY061M4A, includes the cosmic background and atmospheric loss
contributions (see Appendix B).
Table 3 shows most of the contributions to antenna noise temperatures. If the total absolute antenna
noise temperatures need to be computed, then knowledge is also required of such additional terms as
noise due to tripod scattering of the far-field plane wave illuminating the entire antenna, main reflector
panel leakage, main reflector and subreflector resistive losses, and other terms presented in [6]. It will be
shown later in this article that this residual term is approximately equal to 3.0 K.
III. Experimental Work
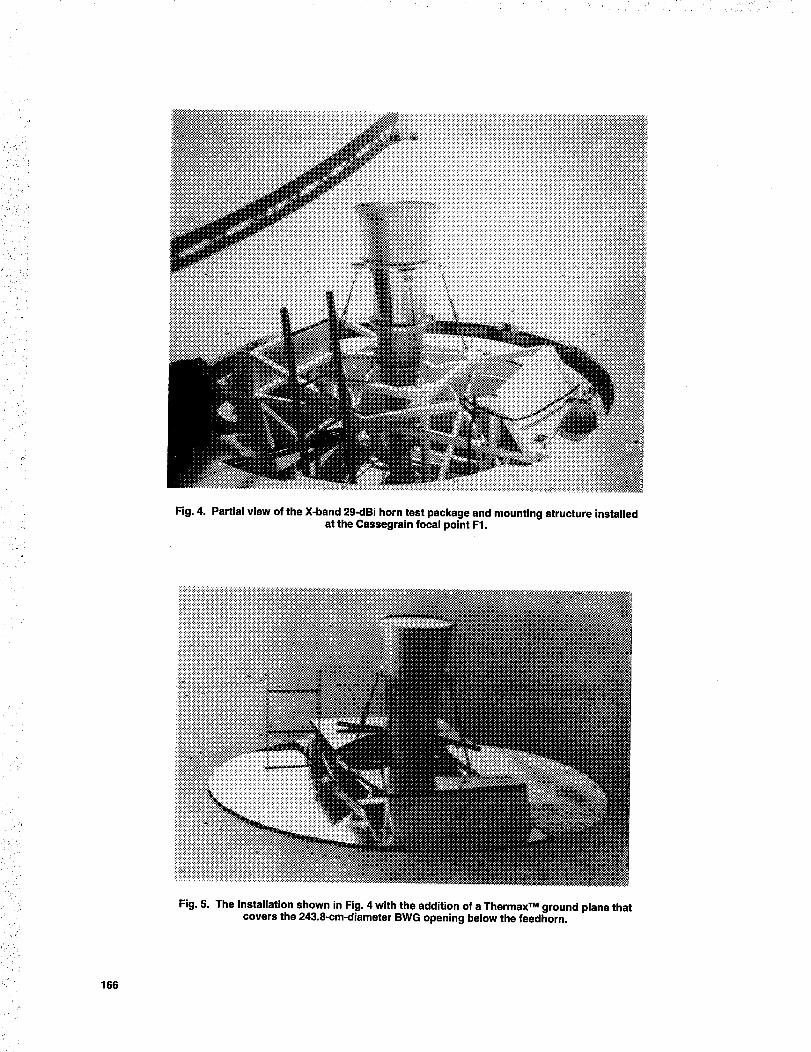
Operating noise temperature measurements were sequentially made at 8.450 GHz with the phase
centers of the 29.7-, 28.7-, 26.9-, 25.1-, and 22.5-dBi horns aligned with the geometric focal point F1.
Figure 4 shows the experimental test setup of the 29.7-dBi horn at F1.
The experimental data are presented in Tables 4 and 5. In Table 4,
ATop1 = L_g[Top - (Top)re f] (1)
where (Top)_ef is the normalized operating noise temperature of the 29.7-dBi horn, and L_og is thewaveguide loss from the horn apertures to the high-electron-mobility-transistor (HEMT) input. It was
assumed that L_g measured for the 22.5-dBi horn [1] applied to all horn-gain cases.
To experimentally determine only the noise temperature contribution from spillover into the
243.8-cm-diameter BWG opening at F1 below the feedhorn, a ground plane was installed below thefeedhorns. Figure 5 shows the installation of a Thermax 1 ground plane below the 29.7-dBi horn. The
1 A trademark of the Celotex Corporation, Tampa, Florida.
165
i¸ i
/ •
r
O
0
Fig. 4. Partial view of the X-band 29-dBi horn test package and mounting structure installedat the Cassegrain focal point F1.
166
Fig. 5. The installation shown in Fig. 4 with the addition of a Thermax TM ground plane thatcovers the 243.8-cm-diameter BWG opening below the feedhorn.
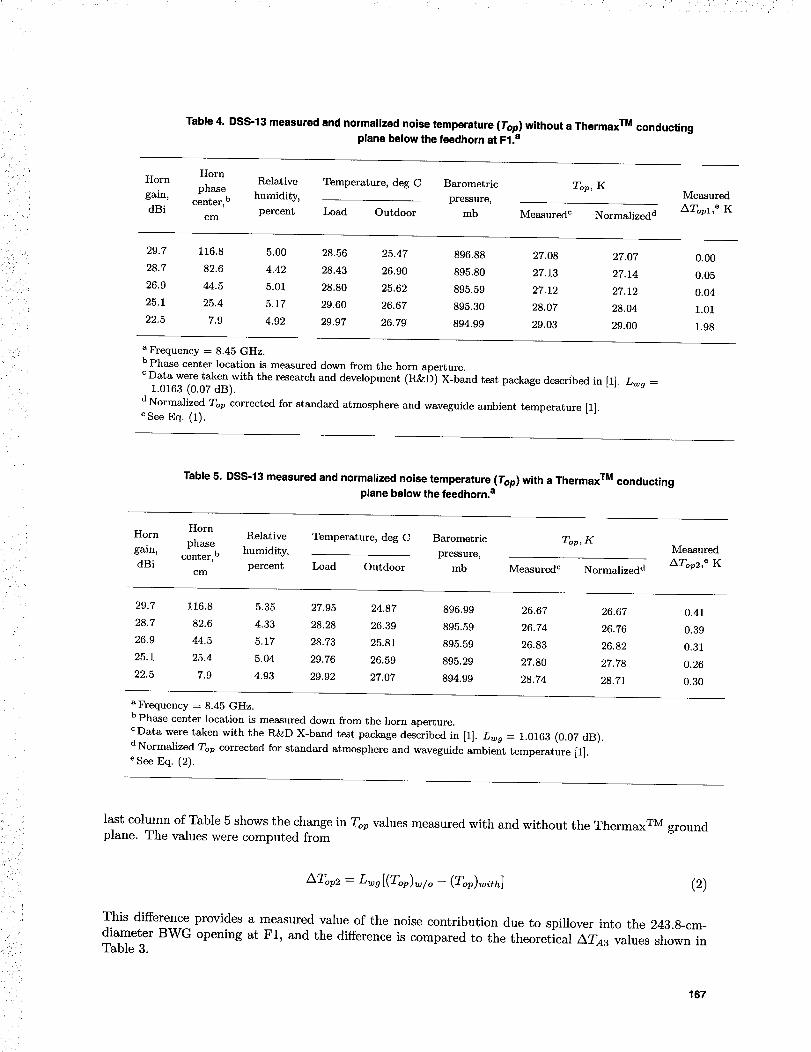
Table 4. DSS-13 measured and normalized noise temperature (Top) without a Thermax TM conducting
plane below the feedhorn at Fl.a
Horn
gain,
dBi
HornRelative Temperature, deg C Barometric
phase humidity, pressure,center, b
percent Load Outdoor mbam
Top, K
Measured c Normalized d
Measured
ATop 1 ,e K
29.7 116.8 5.00 28.56 25.47 896.88 27.08 27.07
28.7 82.6 4.42 28.43 26.90 895.80 27.13 27.14
: ::" 26.9 44.5 5.01 28.80 25.62 895.59 27.12 27.12
• ' 25.1 25.4 5.17 29.60 26.67 895.30 28.07 28.04
22.5 7.9 4.92 29.97 26.79 894.99 29.03 29.00
0.00
0.05
0.04
1.01
1.98
a Frequency = 8.45 GHz.
b Phase center location is measured down from the horn aperture.
c Data were taken with the research and development (R&D) X-band test package described in [1]. L_, 9 :
1.0163 (0.07 dB).
d Normalized Top corrected for standard atmosphere and waveguide ambient temperature [1].
e See Eq. (1).
Table 5. DSS-13 measured and normalized noise temperature (Top) with a Thermax TM conducting
plane below the feedhorn, a
HornHorn Relative Temperature, deg C Barometric
gain, phasecenter,b humidity, pressure,
dBi percent Load Outdoor mbcm
Top, K
Measured c Normalized d
Measured
/kTop2, e K
29.7 116.8 5.35 27.95 24.87 896.99 26.67 26.67
28.7 82.6 4.33 28.28 26.39 895.59 26.74 26.76
26.9 44.5 5.17 28.73 25.81 895.59 26.83 26.82
25.1 25.4 5.04 29.76 26.59 895.29 27.80 27.78
22.5 7.9 4.93 29.92 27.07 894.99 28.74 28.71
0.41
0.39
0.31
0.26
0.30
aFrequcncy -= 8.45 GHz.
b Phase center location is measured down from the horn aperture.
c Data were taken with the R&D X-band test package described in [1]. Lwg = 1.0163 (0.07 dB).
d Normalized Top corrected for standard atmosphere and waveguide ambient temperature [1].
e See Eq. (2).
/
last column of Table 5 shows the change in Top values measured with and without the Thermax TM groundplane. The values were computed from
ATop2 = L_g [(Top)_/o - (Top)_i_u] (2)
This difference provides a measured value of the noise contribution due to spillover into the 243.8-cm-diameter BWG opening at F1, and the difference is compared to the theoretical ATA3 values shown inTable 3.
167
"_ : i ¸ ,
:/
IV. Discussion of Results
The zenith Top value of the 34-m BWG antenna with the X-band test package and a particular feedhorn
installed at F1 can be expressed as
(Top)F 1 --1= LwgTA,F1 q- Twg + Themt + Tfu (3)
where TA,F1 is the 34-m BWG antenna noise temperature at F1 and the other symbols are defined in
Appendix A. Algebraic manipulation of Eq. (3) gives
TA,FI = (Top)F1 -- Lwg(T_g + Themt + T/u) (4)
From [1], Lwg -- 1.0163, T_g = 4.69 K, Themt = 13.0 K, and Tf, = 0.4 K, and from Table 4, the
measured (Top)F1 for the 29.7-dBi horn is shown to be 27.08 K. Substitution of these values in Eq. (4)
gives
TA,F1 -_ 8.70 K
which includes the cosmic background and atmospheric loss contributions. It is also valid to state that
5
TA,F1 = E ATAi + Tu (5)
i=1
which gives
5
Tu = TA,F1 -- E ATAi (6)
i=1
where T_ is a residual (currently unknown) contribution due to strut scattering, leakage through gaps in
the main reflector surface, holes in the main reflector surface panels, and subreflector and main reflector
resistive losses. Some of the values for these contributions can be obtained from [6].
Substitution of TA,F1 8.70 K and 5= _i=l ATAi = 5.62 K (from Table 3) in EQ. (6) gives
Tu = 3.08 K
Another method of getting an approximate value for T_ is from the relationship
= (Top)F - (7)
where (Top)ground is the operating noise temperature of the portable front-end X-band test package (with
horn) on the ground [1]. The value on the right-hand side of Eq. (7) was shown in [1] to be 3.2 K for the
29.7-dBi horn configuration.
For interest, differential antenna noise temperatures (relative to the 29.7-dBi horn) are presented in
Table 6. Values for this table were derived from values given in Tables 3 and 4. The differential values
168

,_i ,_
shown in the last column of Table 6 are attributed primarily to residual tripod (strut) contributions nottaken into account correctly by the theoretical method. Tripod contributions are difficult to calculate, butan estimate of the changes can be obtained by first accounting for M1known or best-estimate contributions
(excluding tripod contributions) and then subtracting the calculated total from the measured value. Notethat more noise contribution from the tripod occurs for the horns of smaller gain. As shown in Table 7,horns of smaller gain illuminate more of the tripod legs away from the tripod-subreflector connectionpoints and thus have higher tripod-scatter contributions.
Table 6. Relative differences between antenna temperatures of
the 29.7-dBi horn and other horns installed at Fl.a
Horn gain, dBi
ATA, b K
Measured c Calculated d Difference
29.7 -- -- --
28.7 0.05 -0,01 0.06
26.9 0.04 -0.06 0.10
25.1 1.01 0.59 0.42
22.5 1.98 1.11 0.87
aFrequency = 8.45 GHz.
b ATA -= [(TA)horn -- (TA)29.7 dBi horn] _ ATopl.
c From Table 4.
d From Table 3.
Table 7. Comparison of fractional powers in
scatter regions near the subreflection edge,
Horn gain, dBi Oi, deg
Fraction of total
power contained
in _i region
29.7 8.7 to 11 0.0173
11 to 17 0.0084
28.7 8.7 to 11 0.0291
11 to 17 0.0121
26.9 8.7 to 11 0.0357
11 to 17 0.0282
25.1 8.7 to 11 0.0747
11 to 17 0.0429
22.5 8.7 to 11 0.1533
11 to 17 0.1293
V, Conclusions
A methodology has been presented for calculating antenna noise temperature contributions of aBWG antenna for various horns placed at F1. A reference antenna noise temperature is based on the29.7-dBi horn because this is the equivalent horn for which the BWG antenna was designed. As the
169
i) i
"i/ • ]/_ :
horn gains become smaller towards 22.5 dBi, a larger discrepancy in noise temperature, of about 0.87 K,
occurs. This discrepancy is attributed to larger unknown noise contributions from tripod scattering asthe horn gain becomes smaller.
References
[i] T. Y. Otoshi, S. R. Stewart, and M. M. Franco, "Portable Microwave Test
Packages for Beam-Waveguide Antenna Performance Evaluations," IEEE Trans.
on Microwave Theory and Techniques, Special Issue: Microwaves in Space,vol. MTT-40, no. 6, pp. 1286-1293, June 1992.
[2] D. Hoppe, "Scattering Matrix Program for Circular Waveguide Junctions," Cos-
mic Software Catalog, 1987 edition, NASA-CR-179669, NTO-17245, NASA's
Computer Software Management and Information Center, Athens, Georgia, 1987.
[3] S. Silver, ed., Microwave Antenna Theory and Design, Radiation Laboratory
Series, New York: McGraw-Hill Book Company, Inc., p. 194, 1949.
[4] W. W. Mumford and E. H. Scheibe, Noise Performance Factors in Communica-
tion Systems, Dedham, Massachusetts: Horizon House-Microwave, Inc., pp. 16-17and 20, 1968.
[5] T. Y. Otoshi and C. T. Stelzried, "Antenna Temperature Analysis," Space Pro-
gram Summary No. 37-36, vol. IV, Jet Propulsion Laboratory, Pasadena, Cali-fornia, pp. 262-267, December 31, 1965.
[6] D. A. Bathker, W. Veruttipong, T. Y. Otoshi, and P. W. Cramer, Jr., "Beam-
Waveguide Antenna Performance Predictions with Comparisons to Experimental
Results," IEEE Trans. on Microwave Theory and Techniques, Special Issue: Mi-crowaves in Space, vol. MTT-40, no. 6, pp. 1274-1285, June 1992.
)
: 170
/ rz(/::
• ' / ]•r
: : :i_̧¸
,/ i i
,: i_/i
/ r_/: !
:_i •• .
Appendix A
Analysis of Antenna Noise Temperature Contributions at F1
I. Nomenclature
O_H1
7]SR
?']MR
_B
Lwg
(Tb)A1
(Tb)A2
(Tb) 2
(Tb) 3
Theme
(See Fig. A-l)
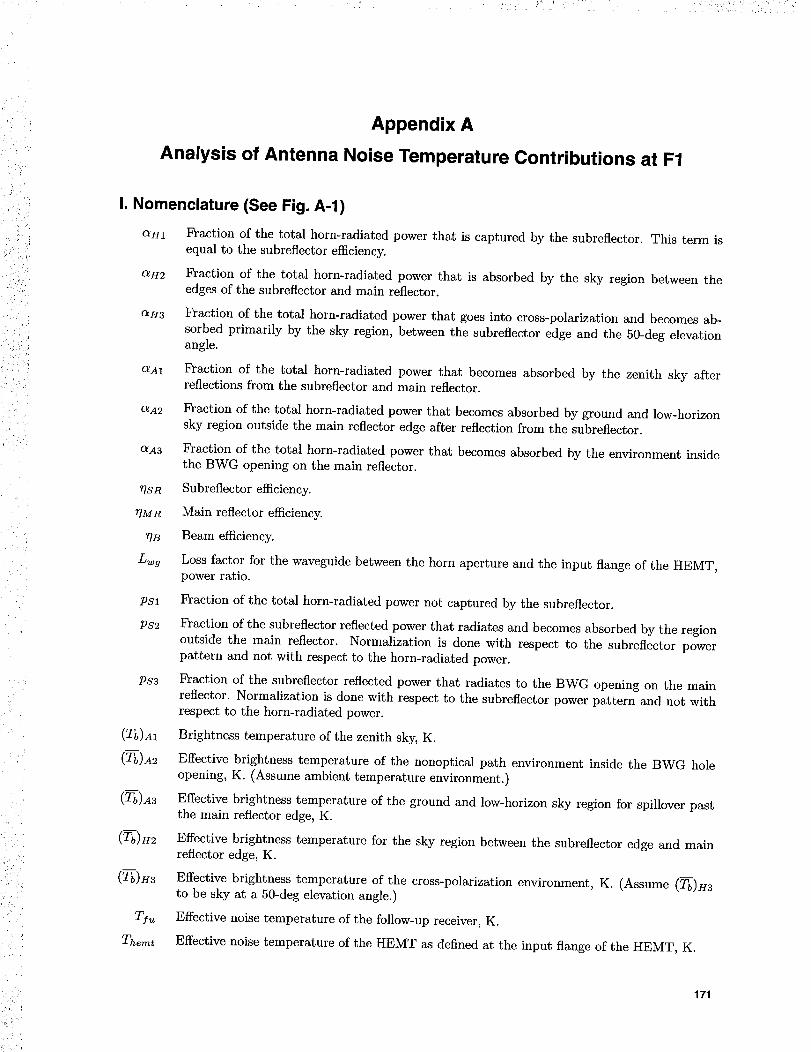
Fraction of the total horn-radiated power that is captured by the subreflector. This term is
equal to the subreflector efficiency.
OLH2 Fraction of the total horn-radiated power that is absorbed by the sky region between the
edges of the subreflector and main reflector.
OlH3 Fraction of the total horn-radiated power that goes into cross-polarization and becomes ab-
sorbed primarily by the sky region, between the subreflector edge and the 50-deg elevation
angle.
_A1 Fraction of the total horn-radiated power that becomes absorbed by the zenith sky after
reflections from the subreflector and main reflector.
O_A2 Fraction of the total horn-radiated power that becomes absorbed by ground and low-horizon
sky region outside the main reflector edge after reflection from the subreflector.
OLA3 Fraction of the total horn-radiated power that becomes absorbed by the environment inside
the BWG opening on the main reflector.
Subreflector efficiency.
Main reflector efficiency.
Beam efficiency.
Loss factor for the waveguide between the horn aperture and the input flange of the HEMT,
power ratio.
Ps1 Fraction of the total horn-radiated power not captured by the subreflector.
Ps2 Fraction of the subreflector reflected power that radiates and becomes absorbed by the region
outside the main reflector. Normalization is done with respect to the subreflector power
pattern and not with respect to the horn-radiated power.
Ps3 Fraction of the subreflector reflected power that radiates to the BWG opening on the main
reflector. Normalization is done with respect to the subreflector power pattern and not with
respect to the horn-radiated power.
Brightness temperature of the zenith sky, K.
Effective brightness temperature of the nonoptical path environment inside the BWG hole
opening, K. (Assume ambient temperature environment.)
Effective brightness temperature of the ground and low-horizon sky region for spillover past
the main reflector edge, K.
Effective brightness temperature for the sky region between the subreflector edge and main
reflector edge, K.
Effective brightness temperature of the cross-polarization environment, K. (Assume (Tb)H3
to be sky at a 50-deg elevation angle.)
Effective noise temperature of the follow-up receiver, K.
Effective noise temperature of the HEMT as defined at the input flange of the HEMT, K.
171
i( _ •
, i_
ii/ •
Top
%
Tsky,zen
T_
Twg
Operating noise temperature, K.
Physical temperature of absorber (approximately 300 K).
Brightness temperature of zenith sky.,, including cosmic background and atmospheric contri-
butions, K.
Unknown residual contribution not taken into account by the method presented in this article,
K..
Noise temperature due to waveguide loss between the horn aperture and the input flange of
the HEMT, K.
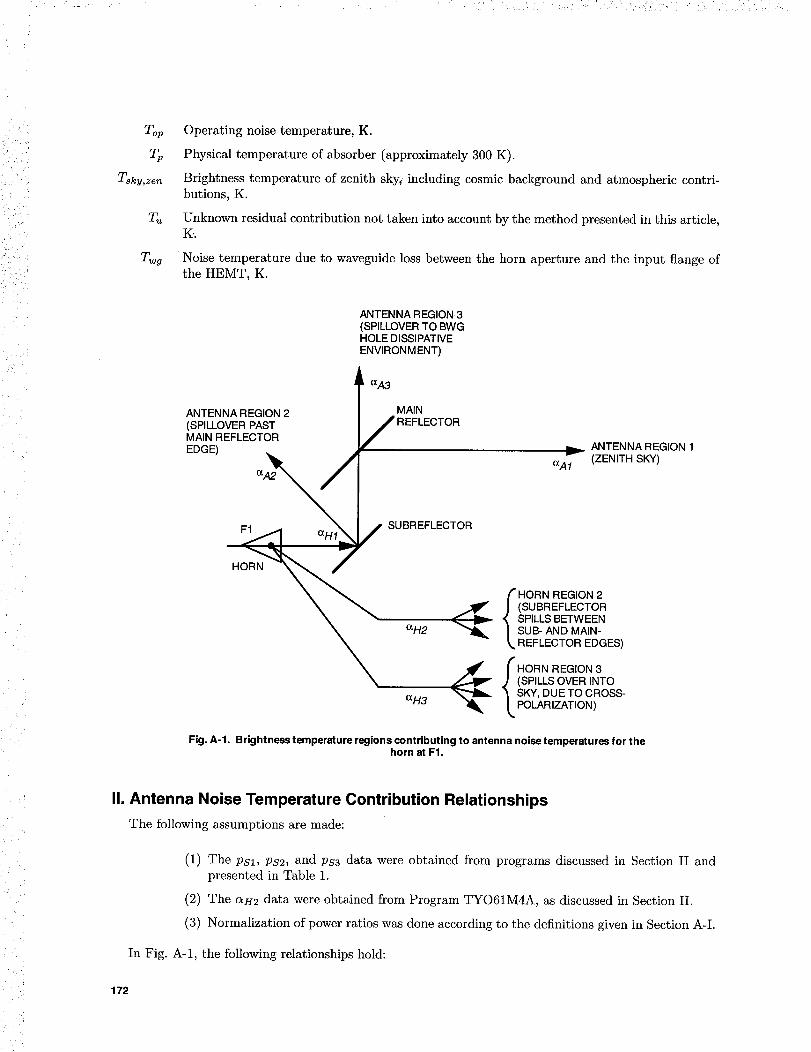
ANTENNA REGION, 3(SPILLOVER TO BWGHOLE DISSIPATIVEENVIRONM ENT)
l aA3
ANTENNA REGION 2 / MAIN(SPILLOVER PAST I / REFLECTORMAIN REFLECTOREDGE) _ ANTENNA REGION 1
_" HORN REGION 2J (SUBREFLECTOR
SPILLS BETWEEN|SUB- AND MAIN-_. REFLECTOR EDGES)
HORN REGION 3
J (SPILLS OVER INTO_SKY, DUE TO CROSS-
L POLAR IZATION )
Fig. A-1. Brightness temperature regions contributing to antenna noise temperatures for thehorn at F1.
II. Antenna Noise Temperature Contribution Relationships
The following assumptions are made:
(1) The Ps1, Ps2, and Ps3 data were obtained from programs discussed in Section II and
presented in Table 1.
(2) The C_H2 data were obtained from Program TYO61M4A, as discussed in Section II.
(3) Normalization of power ratios was done according to the definitions given in Section A-I.
In Fig. A-I, the following relationships hold:
172
i_ ¸ :i
i _ •
• .>:
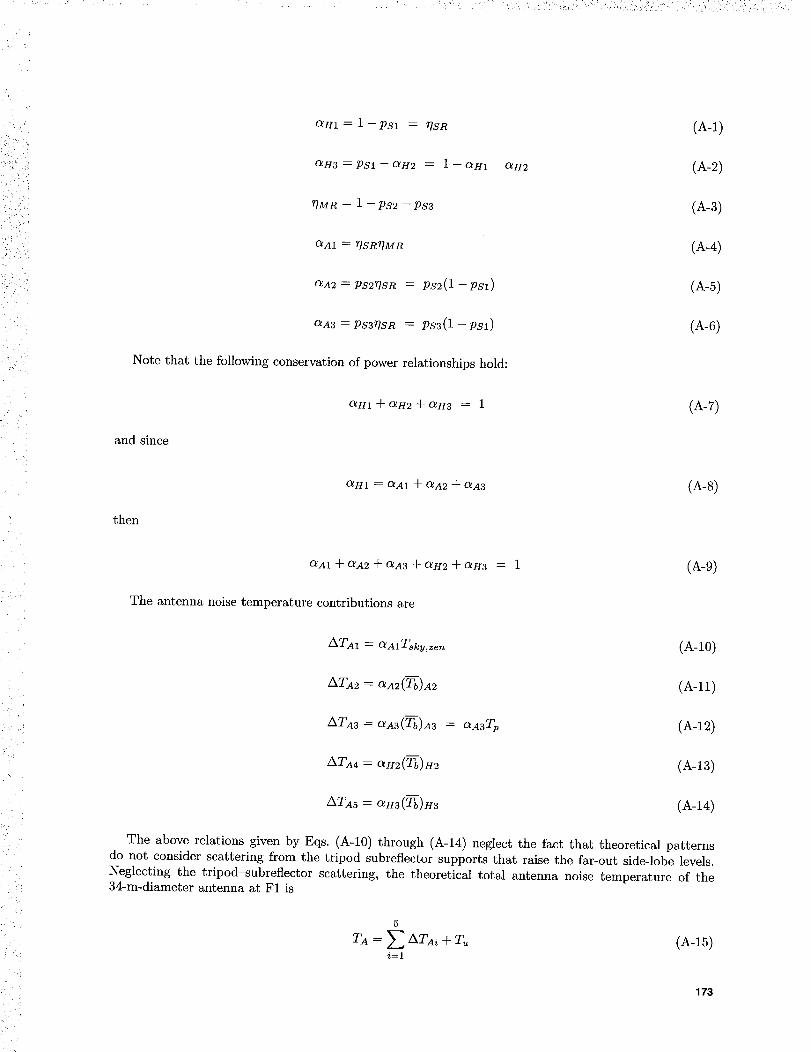
_HI = I--PSl = ZISR
OiH3 _ PSI --C_H2 _- I --OLH1 -- OLH2
_?MR = 1 -- PS2 -- PSZ
OLA1 --_ _SI:tTIMR
O_g2 = PS2?TSR -= pS2(1 -- PS1)
OZn3 : RS3?_SR -_ PS3(1 -- PSl)
Note that the following conservation of power relationships hold:
C_H1 q- OIH2 q- OZH3 ---_1
and since
OtH1 = O_A1 -}-O_A2 2r-_A3
(A-l)
(A-2)
(A-3)
(A-4)
(A-5)
(A-6)
(A-r)
(A-S)
/ i _
j_
then
OLA1 -_-OlA2 -_-OlA3 + O_H2 q- OLH3 = 1 (A-9)
The antenna noise temperature contributions are
ATA1 -_- OzAI Tsky,zen (A-10)
ATA2 = aA2(Tb)A2 (A-II)
(A-12)
ATA4 _- OLH2(_bb)H2 (A-13)
ATA5 = ag3(T'bb)U3 (A-14)
The above relations given by Eqs. (A-10) through (A-14) neglect the fact that theoretical patterns
do not consider scattering from the tripod subreflector supports that raise the far-out side-lobe levels.
Neglecting the tripod-subreflector scattering, the theoretical total antenna noise temperature of the
34-m-diameter antenna at F1 is
5
TA = E ATAi + Tu (A-15)
i=1
173
where T_ is other unknown contributions from panel leakage, resistive subreflector and main reflector
losses, and tripod-scattering effects. As discussed in Section IV, an approximate value of T_ can be
obtained from calculated values using the methodology given in [1] or from the measured value of
(Tu)approx = (Top)F 1 -- (Top)groun d (A-16)
In a future more rigorous analysis, some of the fractional powers associated with Tu might be calculable
and then taken into account by including a new term, aA4, in the power ratio relationships given in
Eqs. (A-8) and (A-9).
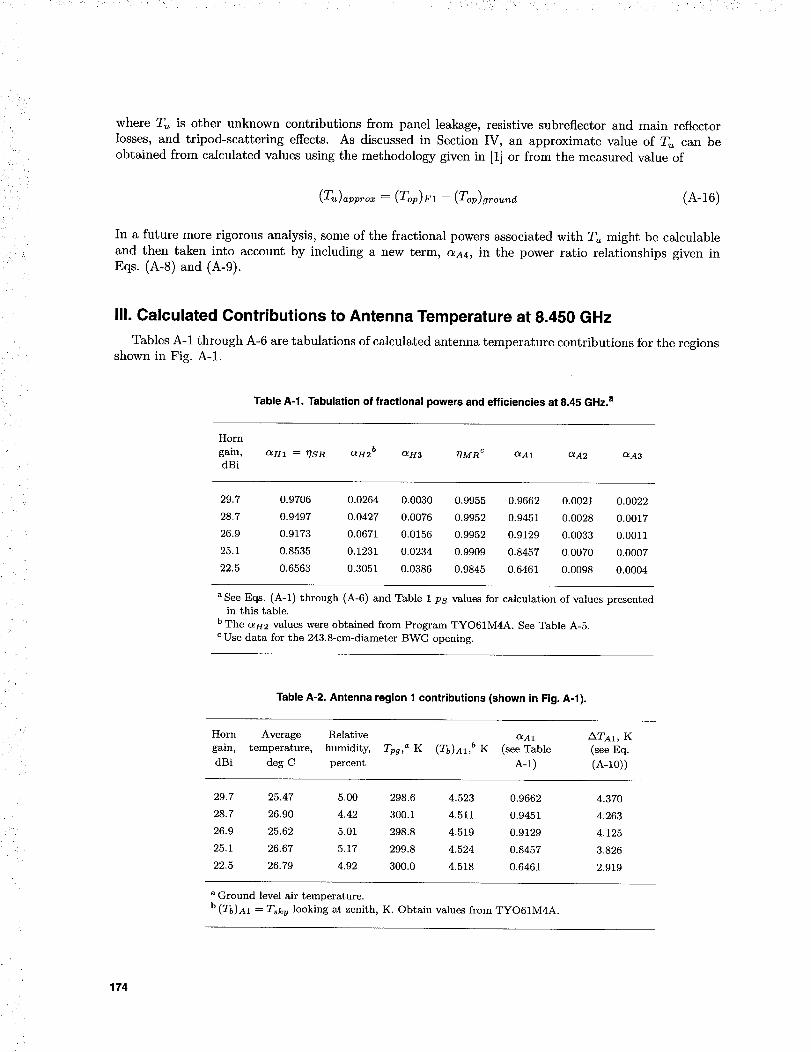
III. Calculated Contributions to Antenna Temperature at 8.450 GHz
Tables A-1 through A-6 are tabulations of calculated antenna temperature contributions for the regions
shown in Fig. A-1.
Table A-1. Tabulation of fractional powers and efficiencies at 8.45 GHz. a
Horn
gain, OtH1 -_ ?'ISR O_H2 b
dBiOtH3 _IMR c OLA1 _A2 OZA3
29.7 0.9706 0.0264 0.0030 0.9955 0.9662 0.0021 0.0022
28.7 0.9497 0.0427 0.0076 0.9952 0.9451 0.0028 0.0017
26.9 0.9173 0.0671 0.0156 0.9952 0.9129 0.0033 0.0011
25.1 0.8535 0.1231 0.0234 0.9909 0.8457 0.0070 0.0007
22.5 0.6563 0.3051 0.0386 0.9845 0.6461 0.0098 0.0004
a See Eqs. (A-l) through (A-6) and Table 1 Ps wlues for calculation of values presentedin this table.
b The O_H2 values were obtained from Program TYO61M4A. See Table A-5.
c Use data for the 243.8-cm-diameter BWG opening.
:-./
Table A-2. Antenna region 1 contributions (shown in Fig. A-l).
Horn Average Relative OrAl /kTA1 , K
gain, temperature, humidity, Tpg, _ K (Tb)A1, b K (see Table (see Eq.
dBi deg C percent A-l) (A-10))
29.7 25.47 5.00 298.6 4.523 0.9662 4.370
28.7 26.90 4.42 300.1 4.511 0.9451 4.263
26.9 25.62 5.01 298.8 4.519 0.9129 4.125
25.1 26.67 5.17 299.8 4.524 0.8457 3.826
22.5 26.79 4.92 300.0 4.518 0.6461 2.919
a Ground level air temperature.
b (Tb)A1 __ risky looking at zenith, K. Obtain values from TYO61M4A.
174
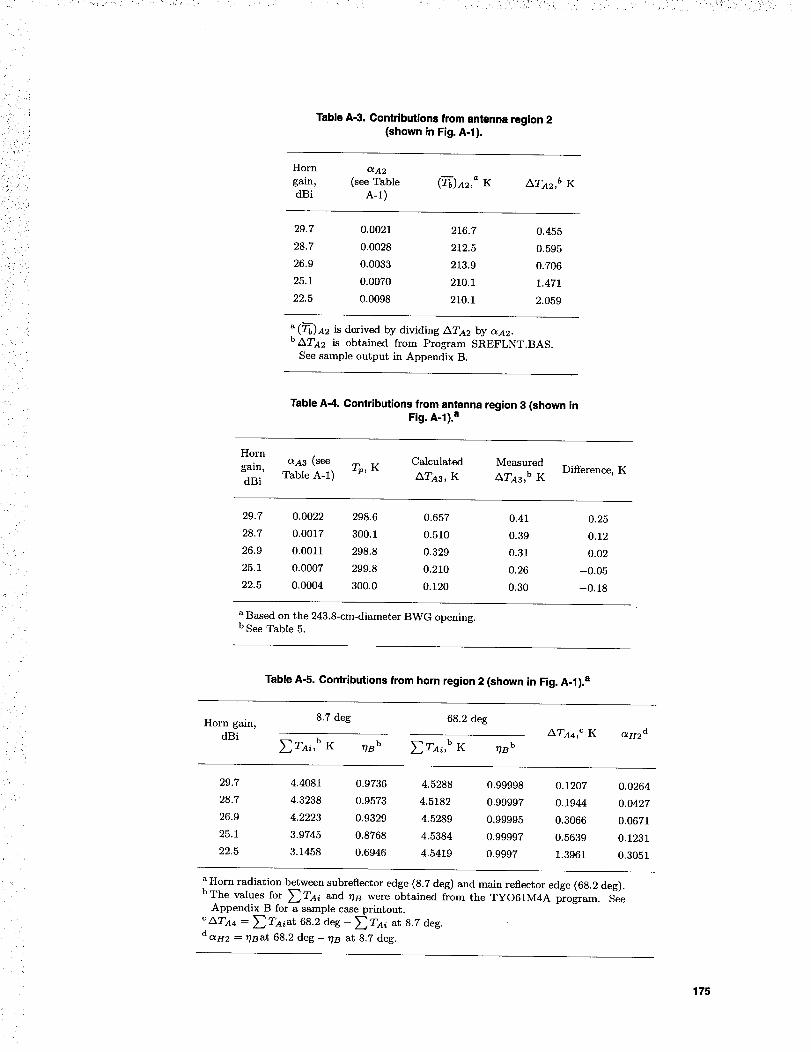
Table A-3. Contributions from antenna region 2
(shown in Fig. A-l).
/i .- (, _
i:/(:il
Horn O_A2
gain, (see Table ( b)A2, K ATA2, b K
dBi A-l)
29,7 0,0021 216,7 0,455
28.7 0.0028 212.5 0.595
26.9 0.0033 213.9 0.706
25.1 0.0070 210.1 1.471
22.5 0.0098 210.1 2.059
a (Tb)A2 is derived by dividing ATA2 by aA2.
bATA2 is obtained from Program SREFLNT.BAS.
See sample output in Appendix B.
Table A-4. Contributions from antenna region 3 (shown in
Fig. A-l). a
HornaA3 (see Calculated Measured
gain, Tp, KTable A-I) ATA3, K ATA3, b K
dBi
Difference, K
• •)
• •)
/ /
29.7 0.0022 298.6 0.657 0.41
28.7 0.0017 300.1 0.510 0.39
26.9 0.0011 298.8 0.329 0.31
25.1 0.0007 299.8 0.210 0.26
22.5 0.0004 300.0 0.120 0.30
0.25
0.12
0.02
--0.05
--0.18
a Based on the 243.8-cm-diameter BWG opening.
b See Table 5.
Table A-5. Contributions from horn region 2 (shown in Fig. A-l). a
8.7 deg 68.2 deg
Horn gain, ATA4, c K
dBi _TAI, b K _B b _TAi, b K Z]B b
_H2 d
29.7 4.4081 0.9736 4.5288 0.99998 0.1207 0.0264
28.7 4.3238 0.9573 4.5182 0.99997 0.1944 0.0427
26,9 4,2223 0,9329 4.5289 0.99995 0,3066 0.0671
25.1 3.9745 0.8768 4.5384 0.99997 0.5639 0.1231
22.5 3.1458 0.6946 4.5419 0.9997 1.3961 0.3051
a Horn radiation between subreflector edge (8,7 deg) and main refector edge (68,2 deg),
b The values for _ TAi and Z]B were obtained from the TYO61M4A program. See
Appendix B for a sample case printout.
CATA4 = _TAiat 68.2 deg - _TAi at 8.7 deg.
dart2 = _Bat 68.2 deg-- _B at 8.7 deg.
175
/ • J
!!i ¸¸ '/ ?i
Horn
gain,dBi
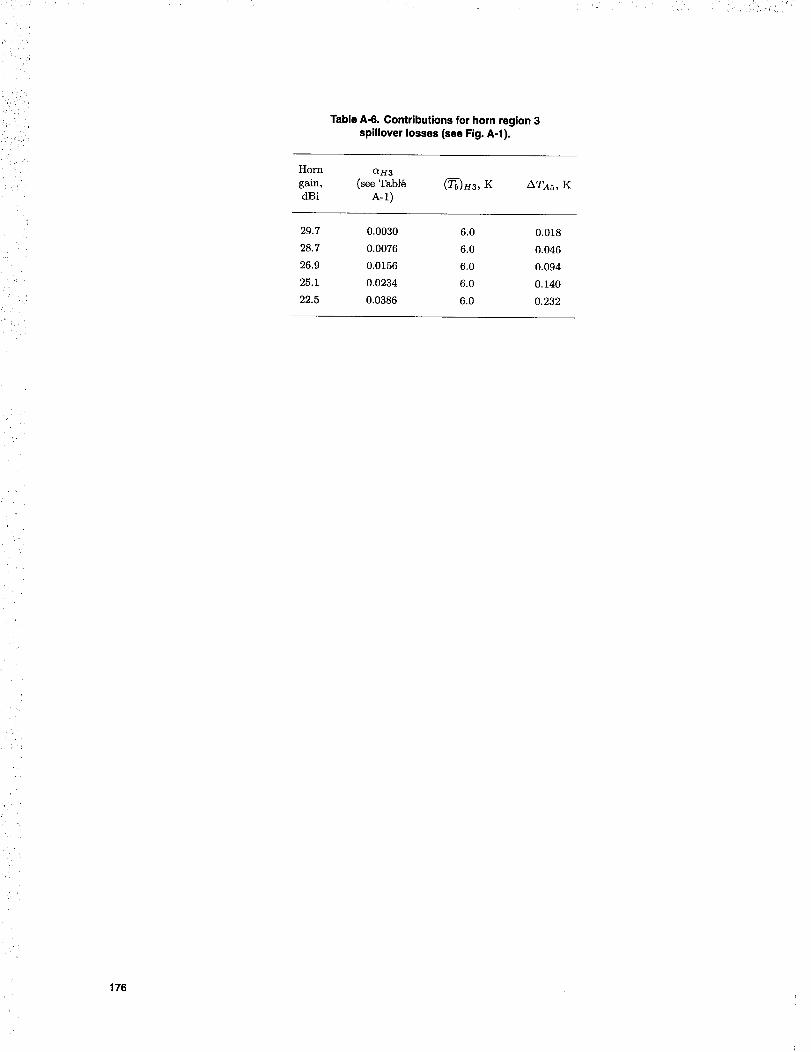
Table A-6. Contributions for horn region 3
spillover losses (see Fig. A-l).
O_H 3
(see Tabl_ (_bb)H3, K
A-l)
ATA5, K
29.7 0.0030 6.0 0.018
28.7 0.0076 6.0 0.046
26.9 0.0156 6.0 0.094
25.1 0.0234 6.0 0.140
22.5 0.0386 6.0 0.232
176
.... ., _ I, _._. , • _
11ri•i•_•
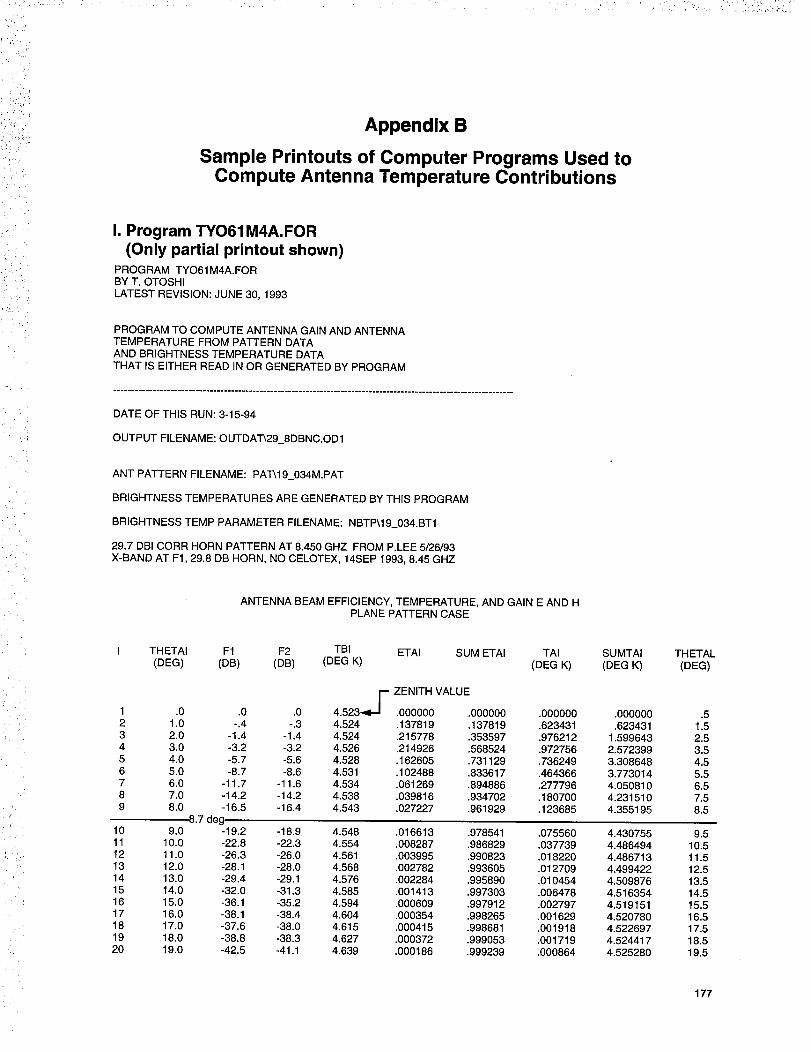
Appendix B
Sample Printouts of Computer Programs Used toCompute Antenna Temperature Contributions
•/_ : _i__
I. Program TYO61M4A.FOR
(Only partial printout shown)PROGRAM TYO61M4A.FORBY T. OTOSHILATEST REVISION: JUNE 30, 1993
PROGRAM TO COMPUTE ANTENNA GAIN AND ANTENNATEMPERATURE FROM PATTERN DATAAND BRIGHTNESS TEMPERATURE DATATHAT IS EITHER READ IN OR GENERATED BY PROGRAM
DATE OF THIS RUN: 3-15-94
OUTPUT FILENAME: OUTDA"I'_29_8DBNC.OD1
ANT PATTERN FILENAME: PAT_19_034M.PAT
BRIGHTNESS TEMPERATURES ARE GENERATED BY THIS PROGRAM
BRIGHTNESS TEMP PARAMETER FILENAME: NBTP\19_034.BT1
29.7 DBI CORR HORN PATTERN AT 8.450 GHZ FROM P.LEE 5/26/93X-BAND AT F1, 29.8 DB HORN, NO CELOTEX, 14SEP 1993, 8.45 GHZ
ANTENNA BEAM EFFICIENCY, TEMPERATURE, AND GAIN E AND HPLANE PATTERN CASE
4
I THETAI F1 F2 TBI ETAI SUM ETAI TAI(BEG) (DB) (DB) (BEG K) (BEG K)
F1 .0 .0 .0 4.523-.91J2 1.0 -.4 -.3 4.5243 2.0 -1.4 -1.4 4.5244 3.0 -3.2 -3.2 4.5265 4.0 -5.7 -5.6 4.5286 5.0 -8.7 -8.6 4.5317 6.0 -11.7 -11.6 4.5348 7.0 -14.2 -14.2 4.5389 8.0 -16.5 -16.4 4.543
8.7 deg10 9.0 -19.2 -18.9 4.54811 10.0 -22.8 -22.3 4.55412 11.0 -26.3 -26.0 4.56113 12.0 -28.1 -28.0 4.56814 13.0 -29.4 -29.1 4.57615 14.0 -32.0 -31.3 4.58516 15.0 -36.1 -35.2 4.59417 16.0 -38.1 -38.4 4.60418 17.0 -37.6 -38.0 4.61519 18.0 -38.8 -38.3 4.62720 19.0 -42.5 -41.1 4.639
ZENITH VALUE
SUMTAI(BEG K)
THETAL(BEG)
.000000 .000000 .000000 .000000 .5
.137819 .137819 .623431 .623431 1.5
.215778 .353597 .976212 1.599643 2.5
.214926 .568524 .972756 2.572399 3.5
.162605 .731129 .736249 3.308648 4.5
.102488 .833617 .464366 3.773014 5.5
.061269 .894886 .277796 4.050810 6.5
.039816 .934702 .180700 4.231510 7.5
.027227 .961929 .123685 4.355195 8.5
.016613 .978541 .075560 4.430755
.008287 .986829 .037739 4.486494
.003995 .990823 .018220 4.486713
.002782 .993605 .012709 4.499422.002284 .995890 .010454 4.509876.001413 .997303 .006478 4.516354.000609 .997912 .002797 4.519151.000354 .998265 .001629 4.520780.000415 .998681 .001918 4.522697.000372 .999053 .001719 4.524417.000186 .999239 .000864 4.525280
9.510.511.512.513.514.515.516.517.518.519.5
177
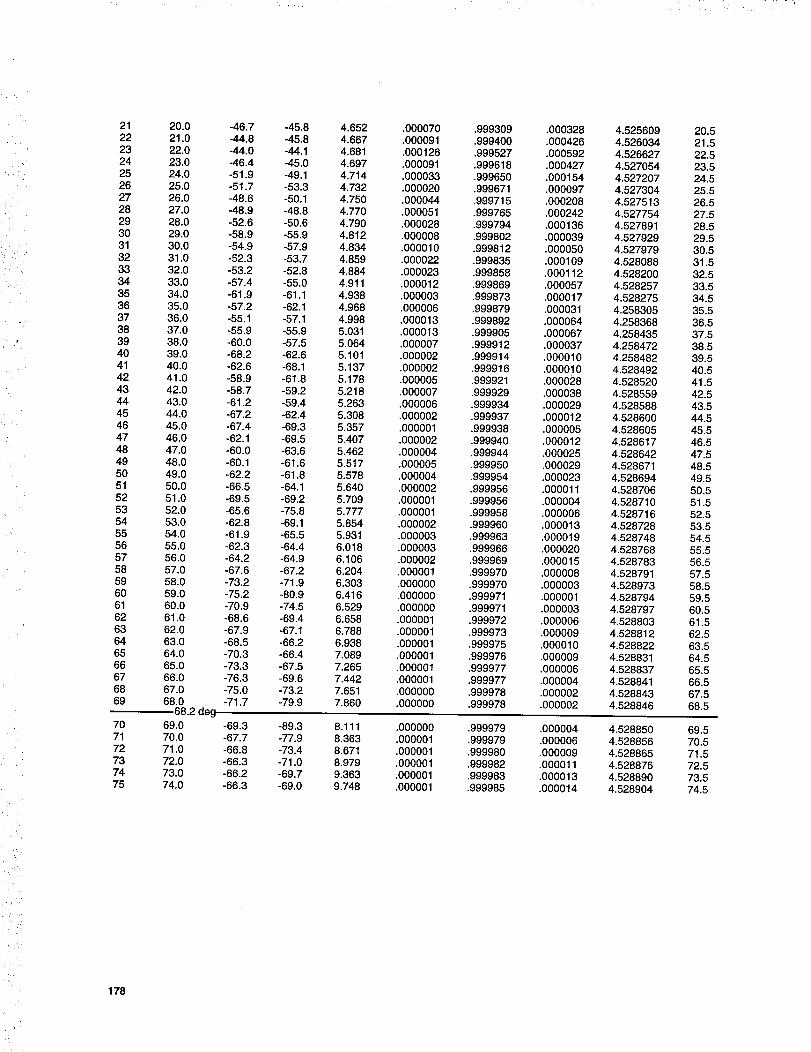
2122232425262728293O313233343536373839404142434445464748495O51525354555657585960616263646566676869
707172737475
178
20.021.022.023.024.025.026.027.028.029.030.031.032.033.034.035.036.037.038.039.040.041.042.043.044.045.046.047.048.049.050.051.052.053.054.055.056.057.058.059.060.061.062.063.064.065.066.067.068.0
68.2 deg69.070.071.072.073.074.0
-46.7-44.8-44.0-46.4-51.9-51.7-48.6-48.9-52.6-58.9-54.9-52.3-53.2-57.4-61.9-57.2-55.1-55.9-60.0-68.2-62.6-58.9-58.7-61.2-67.2-67.4-62.1-60.0-60.1-62.2-66.5-69.5-65.6-62.8-61.9-62.3-64.2-67.6-73.2-75.2-70.9-68.6-67.9-68.5-70.3-73.3-76.3-75.0-71.7
-69.3-67.7-66.8-66.3-66.2-66.3
-45.8-45.8-44.1-45.0-49.1-53.3-50.1-48.8-50.6-55.9-57.9-53.7-52.8-55.0-61.1-62.1-57.1-55.9-57.5-62.6-68.1-61.8-59.2-59.4-62.4-69.3-69.5-63.6-61.6-61.8-64.1-69.2-75.8-69.1-65.5-64.4-64.9-67.2-71.9-80.9-74.5-69.4-67.1-66.2-66.4-67.5-69.6-73.2-79.9
-89.3-77.9-73.4-71.0-69.7-69.0
4.6524.6674.6814.6974.7144.7324.7504.7704.7904.8124.8344.8594.8844.9114.9384.9684.9985.0315.0645.1015.1375.1785.2185.2635.3085.3575.4075.4625.5175.5785.6405.7095.7775.8545.9316.0186.1066.2046.3036.4166.5296.6586.7886.9387.0897.2657.4427.6517.860
8.1118.3638.6718.9799.3639.748
.000070
.000091.000126.000091.000033.000020.000044.000051.000028.000008.000010.000022.000023.000012.000003.000006.000013.000013.000007.000002.000002.000005.000007.000006.000002.000001.000002•000004.000005.000004.000002.000001•000001.000002.000003•000003.000002.000001.000000.000000.000000.000001.000001.000001.000001.000001.000001.000000.000000
.000000
.000001
.000001•000001.000001.000001
.999309
.999400.999527.999618•999650.999671.999715.999765•999794.999802.999812.999835.999858.999869.999873•999879.999892•999905.999912.999914.999916.999921.999929.999934•999937.999938.999940.999944.999950.999954.999956.999956.999958.999960.999963•999966.999969.999970.999970.999971.999971.999972•999973.999975.999976.999977.999977.999978•999978
.999979•999979.999980.999982.999983.999985
.OOO328
.000426
.000592
.000427.000154.000097.000208.000242.000136.000039.000050.000109•000112.000057.000017•000031.000064•000067.000037.000010.000010•000028.000038.000029•000012.000005.000012.000025•000029.000023.000011.000004.000006.000013.000019.000020.000015.000008•000003.000001.000003.000006.000009.000010•000009.000006•000004.000002.000002
.000004
.000006•000009.000011.000013.000014
4.5256094.5260344.5266274.5270544•5272074.5273044.5275134.5277544.5278914•5279294.5279794.5280884.5282004•5282574.5282754.2583054.2583684.2584354•2584724.2584824•5284924.5285204.5285594.5285884•5286004.5286054.5286174.5286424.5286714.5286944.5287064•5287104.5287164.5287284•5287484.5287684•5287834.5287914.5289734•5287944.5287974.5288034.5288124.5288224.5288314•5288374.5288414.5288434.528846
4.5288504.5288564.5288654.5288764.5288904.528904
20.521.522.523.524.525.526.527.528.529.530.531.532.533.534.535.536.537.538.539.540.541.542.543.544.545.546.547.548.549.550.551.552.553.554.555.556.557.558.559.560.561.562.563.564.565.566.567.568.5
69.570.571.572.573.574.5
. i
i̧ ¸iii_il
i ¸ ,.
_,_i_ _i
•_ i •i•
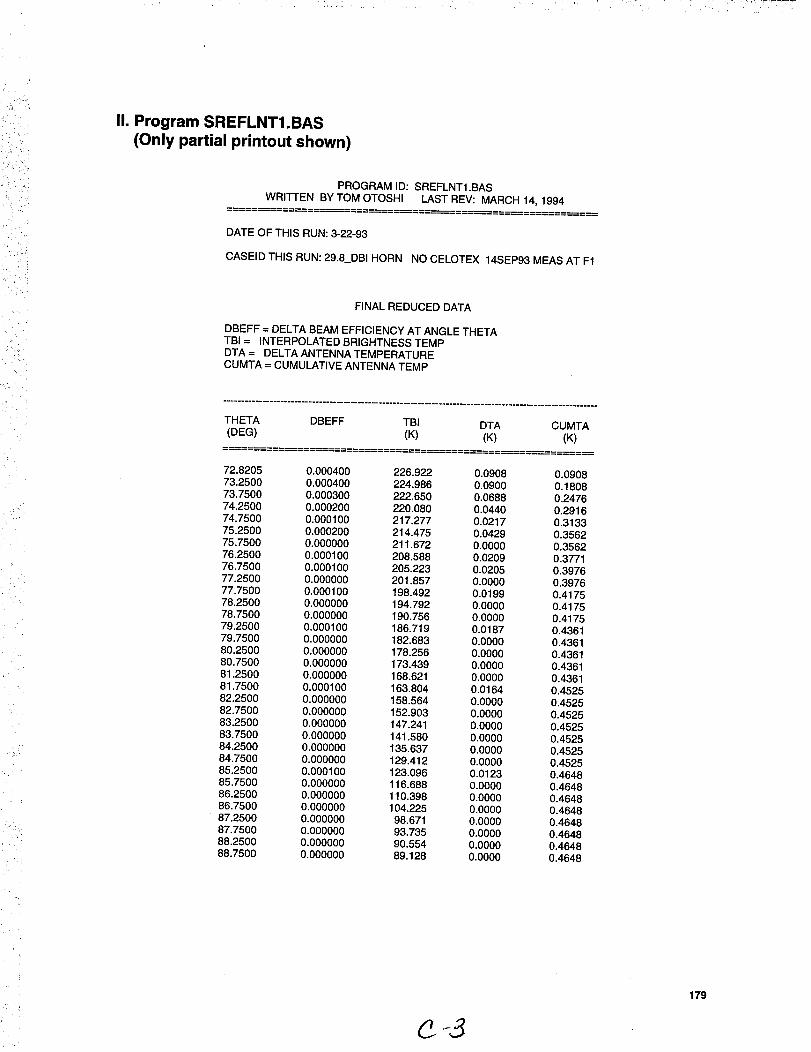
II. Program SREFLNT1.BAS(Only partial printout shown)
PROGRAM ID: SREFLNT1.BASWRITTEN BY TOM OTOSHI LAST REV: MARCH 14, 1994
DATE OF THIS RUN: 3-22-93
CASEID THIS RUN: 29.8_DBI HORN NO CELOTEX 14SEP93 MEAS AT F1
FINAL REDUCED DATA
DBEFF = DELTA BEAM EFFICIENCY AT ANGLE THETATBI = INTERPOLATED BRIGHTNESS TEMPDTA = DELTA ANTENNATEMPERATURECUMTA = CUMULATIVE ANTENNA TEMP
THETA DBEFF TBI DTA CUMTA(DEG) (K) (K) (K)
72.8205 0.000400 226,922 0.0908 0.090873.2500 0.000400 224.986 0.0900 0.180873.7500 0.000300 222.650 0.0688 0.247674.2500 0.000200 220.080 0.0440 0.291674.7500 0.000100 217.277 0.0217 0.313375.2500 0.000200 214.475 0.0429 0.356275.7500 0.000000 211.672 0.0000 0.356276.2500 0.000100 208.588 0.0209 0.377176.7500 0.000100 205.223 0.0205 0.397677.2500 0.000000 201.857 0.0000 0.397677.7500 0.000100 198.492 0.0199 0.417578.2500 0.000000 194.792 0.0000 0.417578.7500 0.000000 190.756 0.0000 0.417579.2500 0.000100 186.719 0.0187 0.436179.7500 0.000000 182.683 0.0000 0.436180.2500 0.000000 178.256 0.0000 0.436180.7500 0.000000 173.439 0.0000 0.436181.2500 0.000000 168.621 0.0000 0.436181.7500 0.000100 163.804 0.0164 0.452582.2500 0.000000 158.564 0.0000 0.452582.7500 0.000000 152.903 0.0000 0.452583.2500 0.000000 147.241 0.0000 0.452583.7500 0.000000 141.580 0.0000 0.452584.2500 0.000000 135.637 0.0000 0.452584.7500 0.000000 129.412 0.0000 0.452585.2500 0.000100 123,096 0,0123 0.464885.7500 0.000000 116.688 0.0000 0.464886.2500 0.000000 110,398 0,0000 0.464886.7500 0.000000 104.225 0.0000 0.464887.2500 0.000000 98.671 0.0000 0.464887.7500 0.000000 93,735 0.0000 0.464888.2500 0.000000 90.554 0.0000 0.464888.7500 0.000000 89.128 0.0000 0.4648
179
_ i
: r
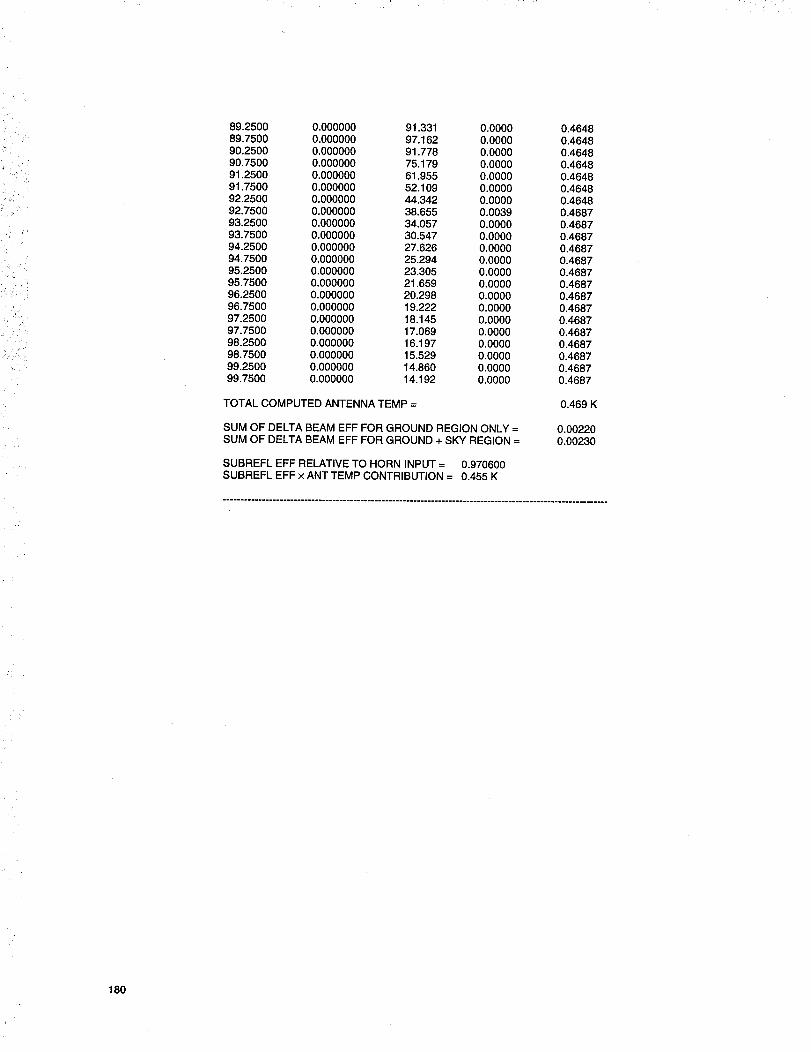
89.2500 0.000000 91.331 0.0000 0.464889.7500 0.000000 97.162 0.0000 0.464890.2500 0.000000 91.778 0.0000 0.464890.7500 0.000000 75.179 0.0000 0.464891.2500 0.000000 61.955 0.0000 0.464891.7500 0.000000 52.109 0.0000 0.464892.2500 0.000000 44.342 0.0000 0.464892.7500 0.000000 38.655 0.0039 0.468793.2500 0.000000 34.057 0.0000 0.468793.7500 0.000000 30.547 0.0000 0.468794.2500 0.000000 27.626 0.0000 0.468794.7500 0.000000 25.294 0.0000 0.468795.2500 0.000000 23.305 0.0000 0.468795.7500 0.000000 21.659 0.0000 0.468796.2500 0.000000 20.298 0.0000 0.468796.7500 0.000000 19.222 0.0000 0.468797.2500 0.000000 18.145 0.0000 0.468797.7500 0.000000 17.069 0.0000 0.468798.2500 0.000000 16.197 0.0000 0.468798.7500 0.000000 15.529 0.0000 0.468799.2500 0.000000 14.860 0.0000 0.468799.7500 0.000000 14.192 0.0000 0.4687
TOTAL COMPUTED ANTENNA TEMP = 0.469 K
SUM OF DELTA BEAM EFF FOR GROUND REGION ONLY = 0.00220SUM OF DELTA BEAM EFF FOR GROUND + SKY REGION = 0.00230
SUBREFL EFF RELATIVE TO HORN INPUT = 0.970600SUBREFL EFF x ANT TEMP CONTRIBUTION = 0.455 K
180


