Annual Report 2010
Our Journey Continues
Contents
Our Responsibilities 4
Highlights 5
Letter to Minister 6
Our Performance 7
Chairman & CEO’s Report 8
Board of Management 12
Executive Management 12
Our Strategy - TAC 2015 13
What We Do 14
How We Do It 22
Who We Are 28
Appendix - Performance Graphs 32
Financial Report 35
2
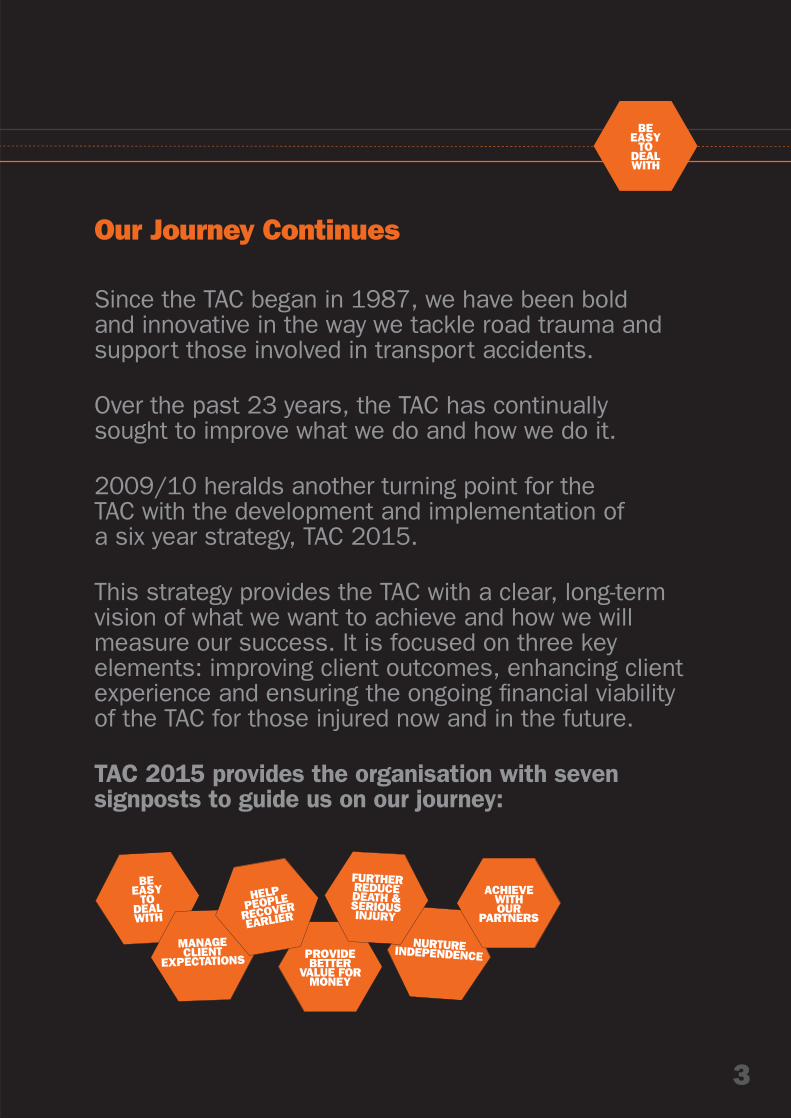
Our Journey Continues
Since the TAC began in 1987, we have been bold and innovative in the way we tackle road trauma and support those involved in transport accidents.
Over the past 23 years, the TAC has continuallysought to improve what we do and how we do it.
2009/10 heralds another turning point for theTAC with the development and implementation ofa six year strategy, TAC 2015.
This strategy provides the TAC with a clear, long-term vision of what we want to achieve and how we willmeasure our success. It is focused on three key elements: improving client outcomes, enhancing client experience and ensuring the ongoing fi nancial viability of the TAC for those injured now and in the future.
TAC 2015 provides the organisation with seven signposts to guide us on our journey:
3
BE EASY
TO DEALWITH
Our Responsibilities
The TAC is governed by the Transport Accident Act 1986 that has the following objectives:6
• Reduce the cost to the Victorian communityof compensation for transport accidents
• Reduce the incidence of transport accidents
• Provide, in the most socially and economically appropriate manner, suitable and just compensationin respect of persons injured or who die as a resultof transport accidents
• Determine claims for compensation quicklyand effi ciently and
• Provide suitable systems for the effectiverehabilitation of persons injured as a result of transport accidents.
4
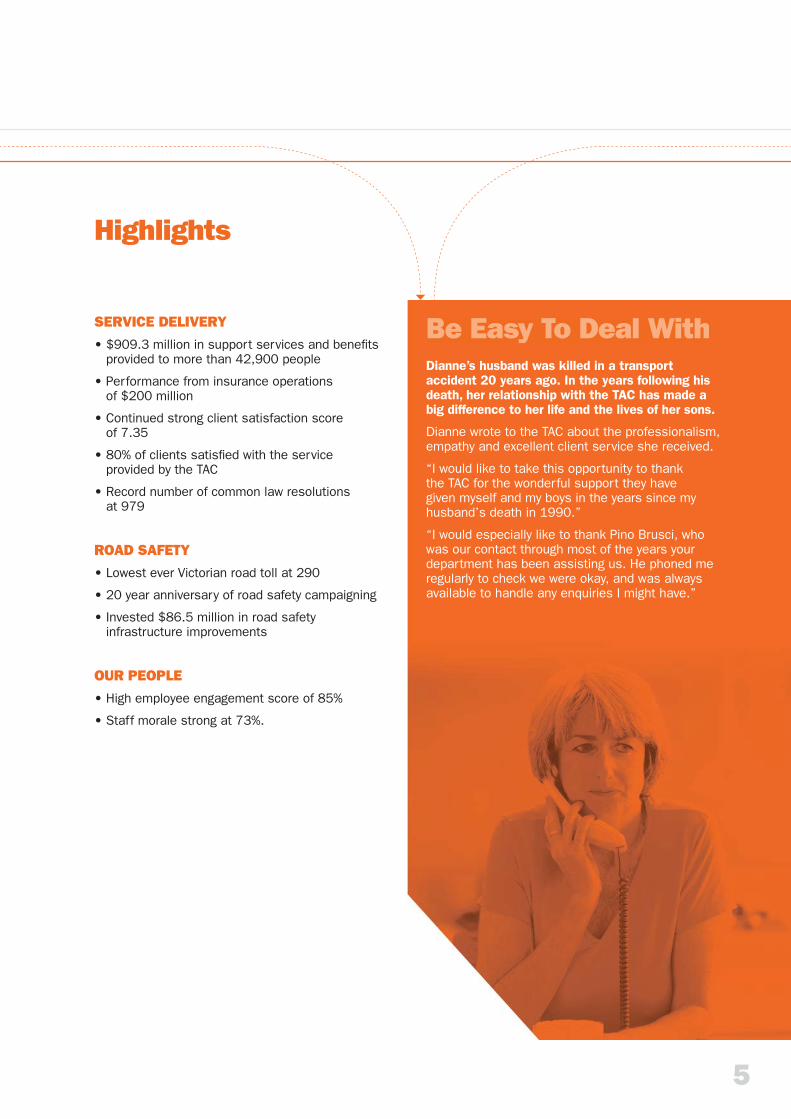
Dianne’s husband was killed in a transport accident 20 years ago. In the years following his death, her relationship with the TAC has made a big difference to her life and the lives of her sons.
Dianne wrote to the TAC about the professionalism, empathy and excellent client service she received.
“I would like to take this opportunity to thank the TAC for the wonderful support they have given myself and my boys in the years since my husband’s death in 1990.”
“I would especially like to thank Pino Brusci, who was our contact through most of the years your department has been assisting us. He phoned me regularly to check we were okay, and was always available to handle any enquiries I might have.”
Be Easy To Deal WithSERVICE DELIVERY
• $909.3 million in support services and benefi ts provided to more than 42,900 people
• Performance from insurance operationsof $200 million
• Continued strong client satisfaction scoreof 7.35
• 80% of clients satisfi ed with the serviceprovided by the TAC
• Record number of common law resolutionsat 979
ROAD SAFETY
• Lowest ever Victorian road toll at 290
• 20 year anniversary of road safety campaigning
• Invested $86.5 million in road safety infrastructure improvements
OUR PEOPLE
• High employee engagement score of 85%
• Staff morale strong at 73%.
Highlights
5
6
Letter from theChairman to the Minister
1 September 2010
The Honorable Tim Holding MP Minister for Finance, WorkCover and the TAC 121 Exhibition StreetMELBOURNE VIC 3000
Dear Minister
I am pleased to submit the twenty-fourth Annual Report of the Transport Accident Commission (TAC) for presentation to Parliament pursuant to Part 7of the Financial Management Act 1994.
Paul Barker Chairman
7
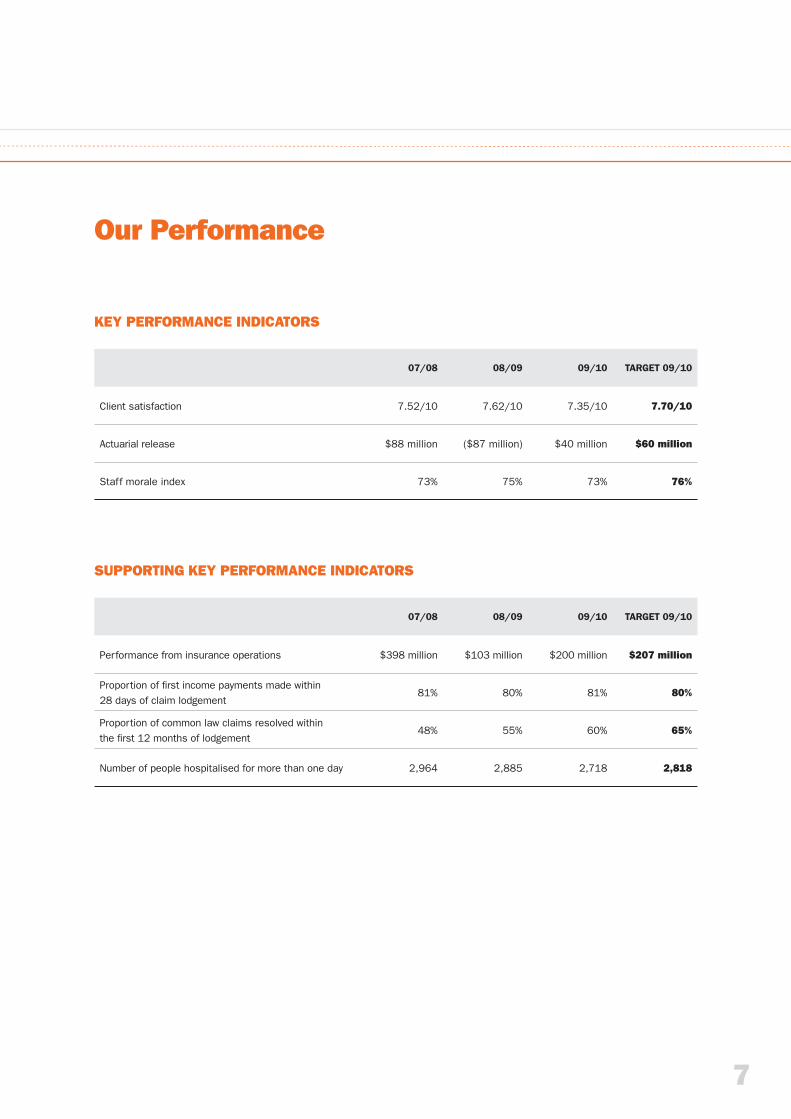
07/08 08/09 09/10 TARGET 09/10
Client satisfaction 7.52/10 7.62/10 7.35/10 7.70/10
Actuarial release $88 million ($87 million) $40 million $60 million
Staff morale index 73% 75% 73% 76%
07/08 08/09 09/10 TARGET 09/10
Performance from insurance operations $398 million $103 million $200 million $207 million
Proportion of fi rst income payments made within28 days of claim lodgement
81% 80% 81% 80%
Proportion of common law claims resolved withinthe fi rst 12 months of lodgement
48% 55% 60% 65%
Number of people hospitalised for more than one day 2,964 2,885 2,718 2,818
Our Performance
KEY PERFORMANCE INDICATORS
SUPPORTING KEY PERFORMANCE INDICATORS
Chairman& CEO’s Report
2009/10 is another milestone year for the TAC as it marksthe beginning of a new strategic direction for the organisation.In 2009, the Board approved a six year strategy which providesa clear, long term vision of what we want to achieve and how wewill measure our success.
TAC 2015 is a bold strategy that touches every major aspect ofthe TAC’s operations; claims management, road trauma prevention, capital management and IT systems and support. Our vision is a future where every journey is a safe one.
We will measure client outcomes for the fi rst time while reinforcing the TAC’s historical focus on scheme viability and client experience, which has underpinned our strong performance over the past 23 years.
TAC 2015 is an ambitious strategy but the objectives set are achievable. The TAC is an organisation with a willingness to improve what we do and how we do it – we have a great road map in placeto navigate our way towards 2015.
This year, the road toll dropped a further 4% from the historic low of 303 achieved in 2008. Our clients continue to be highly satisfi ed and staff morale has remained strong. These are solid outcomes for the organisation and set a strong benchmark from which to move forward.
The TAC has come a long way since we began in 1987. We’ve achievedwhat we have by working through challenges with great dedication, driven by a profound belief in what the TAC does and what the TAC stands for.
As we follow the 2015 roadmap we begin the next chapter of the TAC’s journey with renewed vigour.
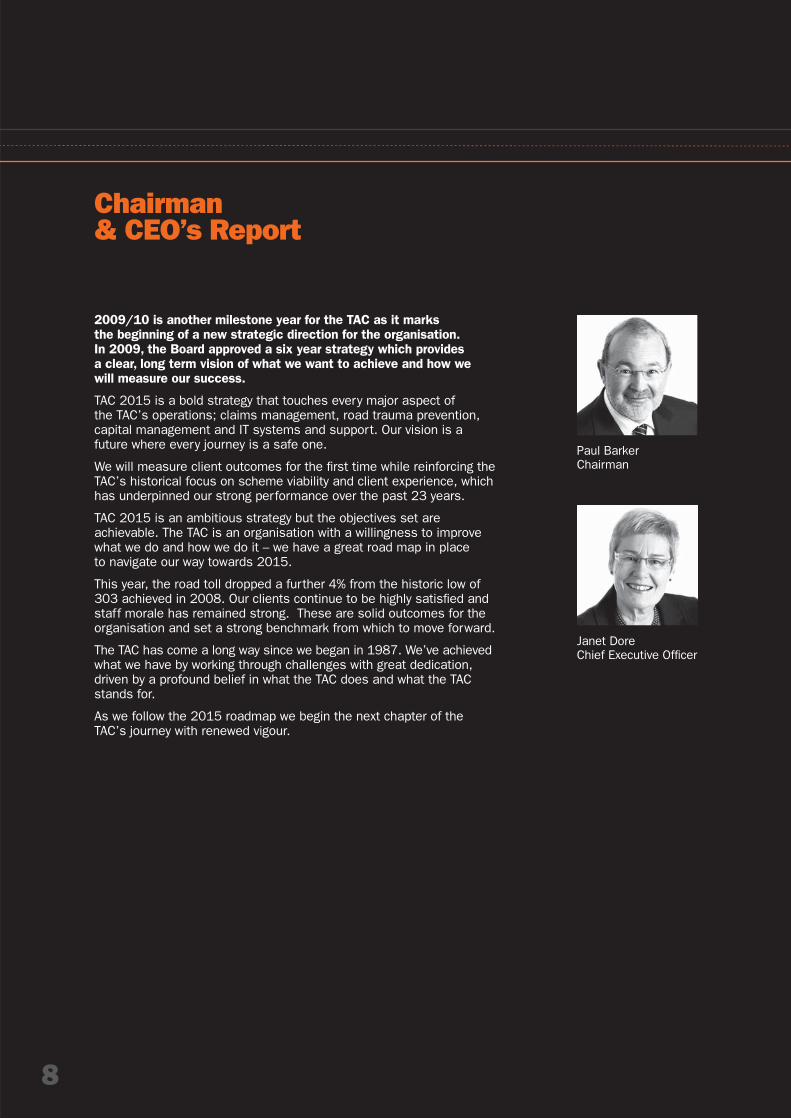
Paul BarkerChairman
Janet DoreChief Executive Offi cer
8
9
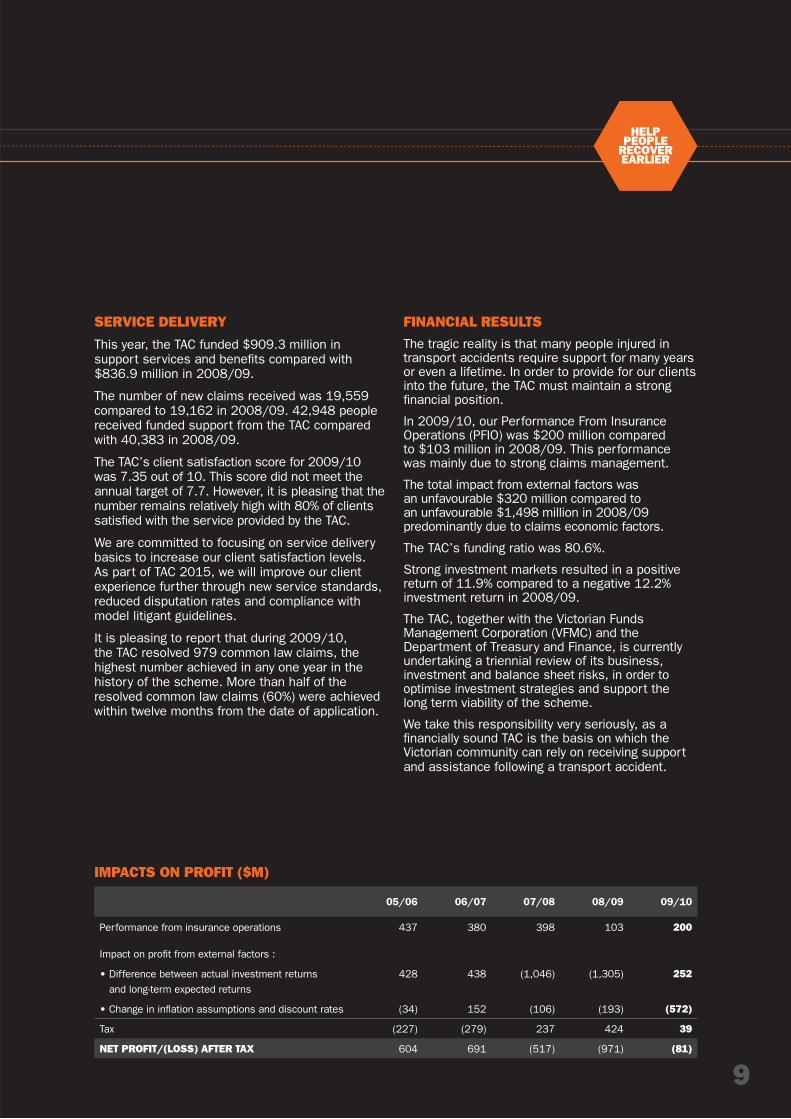
IMPACTS ON PROFIT ($M)
HELPPEOPLE
RECOVEREARLIER
SERVICE DELIVERY
This year, the TAC funded $909.3 million in support services and benefi ts compared with $836.9 million in 2008/09.
The number of new claims received was 19,559 compared to 19,162 in 2008/09. 42,948 people received funded support from the TAC compared with 40,383 in 2008/09.
The TAC’s client satisfaction score for 2009/10 was 7.35 out of 10. This score did not meet the annual target of 7.7. However, it is pleasing that the number remains relatively high with 80% of clients satisfi ed with the service provided by the TAC.
We are committed to focusing on service delivery basics to increase our client satisfaction levels.As part of TAC 2015, we will improve our client experience further through new service standards, reduced disputation rates and compliance with model litigant guidelines.
It is pleasing to report that during 2009/10,the TAC resolved 979 common law claims, the highest number achieved in any one year in the history of the scheme. More than half of the resolved common law claims (60%) were achieved within twelve months from the date of application.
FINANCIAL RESULTS The tragic reality is that many people injured in transport accidents require support for many years or even a lifetime. In order to provide for our clients into the future, the TAC must maintain a strong fi nancial position.
In 2009/10, our Performance From Insurance Operations (PFIO) was $200 million comparedto $103 million in 2008/09. This performancewas mainly due to strong claims management.
The total impact from external factors was an unfavourable $320 million compared to an unfavourable $1,498 million in 2008/09 predominantly due to claims economic factors.
The TAC’s funding ratio was 80.6%.
Strong investment markets resulted in a positive return of 11.9% compared to a negative 12.2% investment return in 2008/09.
The TAC, together with the Victorian Funds Management Corporation (VFMC) and the Department of Treasury and Finance, is currently undertaking a triennial review of its business, investment and balance sheet risks, in order to optimise investment strategies and support thelong term viability of the scheme.
We take this responsibility very seriously, as a fi nancially sound TAC is the basis on which the Victorian community can rely on receiving support and assistance following a transport accident.
05/06 06/07 07/08 08/09 09/10
Performance from insurance operations
Impact on profi t from external factors :
437 380 398 103 200
• Difference between actual investment returnsand long-term expected returns
428 438 (1,046) (1,305) 252
• Change in infl ation assumptions and discount rates (34) 152 (106) (193) (572)
Tax (227) (279) 237 424 39
NET PROFIT/(LOSS) AFTER TAX 604 691 (517) (971) (81)
10
OUR PEOPLE
TAC employees are the backbone of the organisation and have adapted to a number of signifi cant changes in recent years. They have adopted the new corporate strategy, TAC 2015 with the same enthusiasm and commitment they showed when we moved our headquarters to Geelong. Their support has been unwavering and has not gone unnoticed.
This commitment is shown through the annual employee survey which measures employee engagement and staff morale. An outstanding 90% of employees participated in the TAC’s 2010 survey. The results are well above the Australian national average and are a testament to the continued high level of employee engagement during a period of change for the organisation.
Overall, the TAC’s employee engagement score dropped by just 1% to 85%. We believe that this result refl ects a strong sense of pride and belonging in what we do as an organisation. Staff morale also remained high at 73% and further refl ects employee commitment to the TAC.
Our Executive and Board are also highly engaged and have enthusiastically endorsed the TAC’s new strategic direction.
We are pleased to welcome Deborah Hallmark to the TAC Board. Deborah has 15 years experience in the advertising and media industry and runs her own marketing company.
Deborah’s appointment to the Board follows the resignation of Maria Wilton. After six years of service, Maria resigned from the Board in June 2010. We take this opportunity to thank Mariafor her support.
ROAD SAFETY
In December 2009, we refl ected on how many lives have been saved on our roads when we commemorated the 20th anniversary of TAC advertising campaigns. The powerful campaigns have ensured that people across Victoria are made aware of the devastating impacts of road trauma.
Our campaigns have undoubtedly contributed to our road toll halving over the past 20 years. Special thanks to our creative partners who have contibuted to their enduring resonance with the Victorian community.
To mark the 20th anniversary of the TAC’s road safety advertising campaigns, the TAC called on the community to turn their headlights on at low beam, to remember those who have died on our roads and show their commitment to driving safely.
A three minute montage of TAC advertisements were shown across commercial television and launched on YouTube. The montage has been viewed online by more than 4 million peoplearound the world.
Road safety is also pursued at a grass roots level through our Community Road Safety Grants program. It involves grants of up to $20,000 being provided to community based projects run by not-for-profi t groups to address specifi c local road safety issues. In 2009/10, 44 new Community Road Safety Grants were approved. Since the grants program began in 2008, the TAC has received 188 applications, approved 127 projects and committed grant funding totalling almost $2.2 million.
In 2009/10, the TAC contributed over $86.5 millionto improving Victoria’s road infrastructure. Future commitments will be addressed as part of the state’s road safety action plan.
The TAC is working alongside our road safety partners on the second action plan to support the Victorian Government’s 10 year arrive alive strategy.

11
OUR JOURNEY CONTINUES
We look forward to another milestone year of opportunities as we embed our long term strategy throughout the organisation. TAC 2015 provides a clear, long term vision of what we want to achieve and how we will measure our success.
It encapsulates all the work of the TAC and aimsto create a better organisation for the future. Given the scope of the TAC 2015 changes, initiatives will be prioritised and phased in overthe next fi ve years.
Ultimately the success of TAC 2015 will be based on the hard work, talent and commitment of the TAC and our partners to deliver for the Victorian community.
TAC 2015 sets the bar for this organisation higher than ever before.
Just as we have shown over the last 23 years of the TAC, we welcome and relish the challenge.
Paul BarkerChairman
Janet DoreChief Executive Offi cer
Help PeopleRecover EarlyJacob was seriously injured in June 2009 when his car collided with a truck as he came around a bend. He was told by doctors that he had a 5% chance of surviving. Jacob proved them wrong and has made a remarkable recovery with the assistance of the TAC.
“The doctors originally said that I would be inthe Intensive Care Unit for fi ve to six weeks;I managed to get out of there in seven days. They can’t explain it. I was moved to a ward which I stayed in for two and a half weeks in the Alfred and then I was off to rehabilitation at the Victorian rehabilitation centre in Glen Waverley.”
“I was there for fi ve and a half weeks before I was able to come home. So in less than two months I had returned home and was able to move around using a wheelchair and crutches.”
12
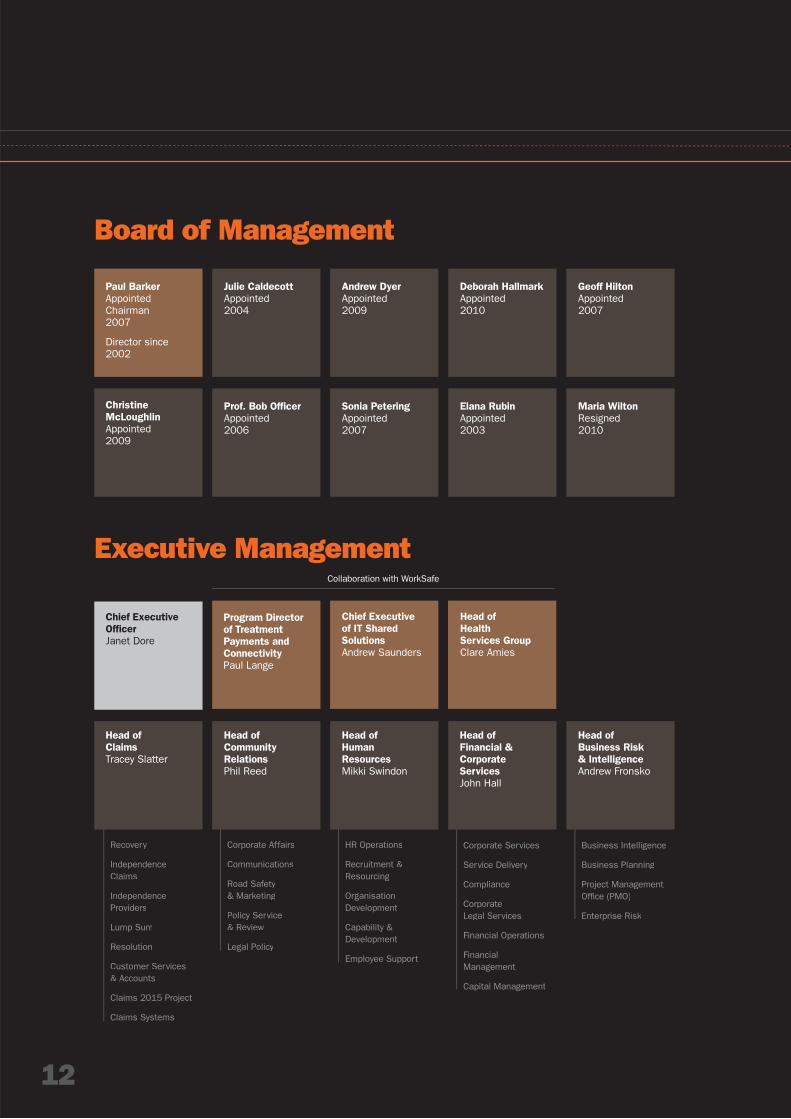
Board of Management
Executive Management
Paul Barker
Appointed Chairman 2007
Director since 2002
Chief Executive
Offi cer
Janet Dore
Program Director
of Treatment
Payments and
Connectivity
Paul Lange
Head of
Human
Resources
Mikki Swindon
Head of
Financial &
Corporate
Services
John Hall
Head of
Business Risk
& Intelligence
Andrew Fronsko
Recovery
Independence Claims
Independence Providers
Lump Sum
Resolution
Customer Services & Accounts
Claims 2015 Project
Claims Systems
Corporate Affairs
Communications
Road Safety & Marketing
Policy Service & Review
Legal Policy
HR Operations
Recruitment &Resourcing
OrganisationDevelopment
Capability &Development
Employee Support
Corporate Services
Service Delivery
Compliance
CorporateLegal Services
Financial Operations
FinancialManagement
Capital Management
Business Intelligence
Business Planning
Project ManagementOffi ce (PMO)
Enterprise Risk
Chief Executive
of IT Shared
Solutions
Andrew Saunders
Head of
Health
Services Group
Clare Amies
Head of
Community
Relations
Phil Reed
Christine
McLoughlin
Appointed 2009
Julie Caldecott
Appointed 2004
Prof. Bob Offi cer
Appointed 2006
Andrew Dyer
Appointed 2009
Sonia Petering
Appointed 2007
Deborah Hallmark
Appointed 2010
Elana Rubin
Appointed 2003
Maria Wilton
Resigned 2010
Geoff Hilton
Appointed 2007
Collaboration with WorkSafe
Head of
Claims
Tracey Slatter
12
13
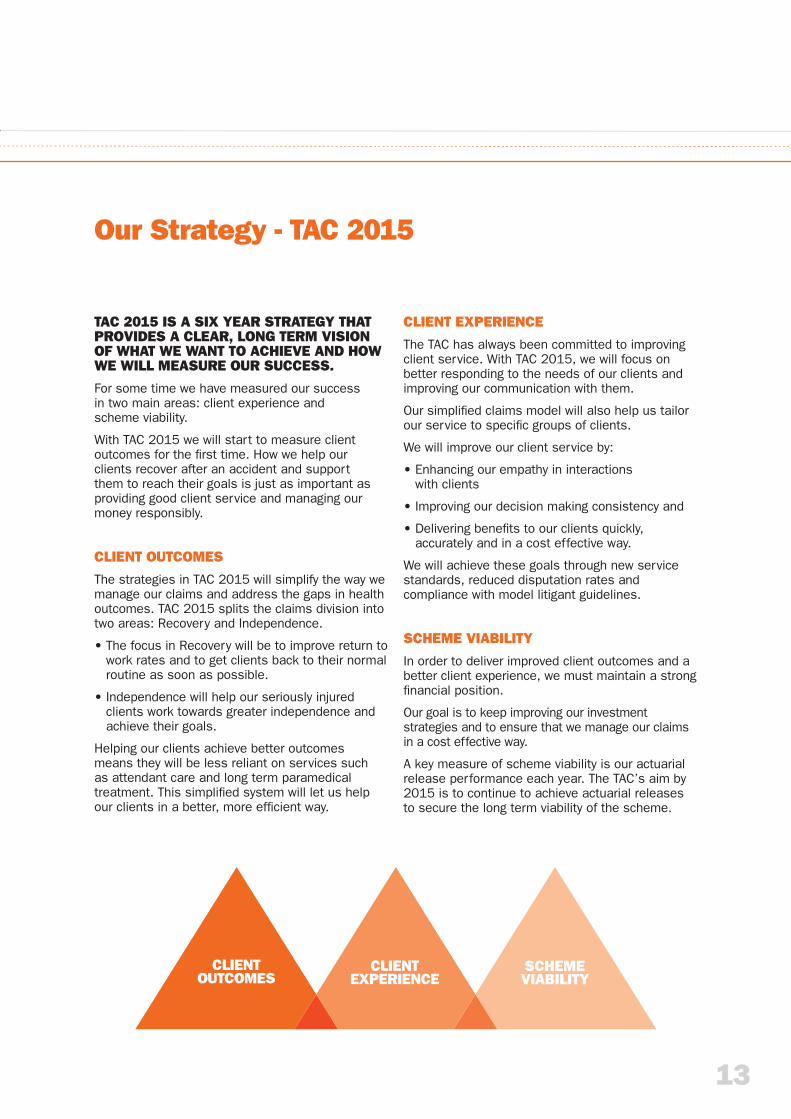
Our Strategy - TAC 2015
TAC 2015 IS A SIX YEAR STRATEGY THAT PROVIDES A CLEAR, LONG TERM VISION OF WHAT WE WANT TO ACHIEVE AND HOW WE WILL MEASURE OUR SUCCESS.
For some time we have measured our success in two main areas: client experience and scheme viability.
With TAC 2015 we will start to measure client outcomes for the fi rst time. How we help our clients recover after an accident and support them to reach their goals is just as important as providing good client service and managing our money responsibly.
CLIENT OUTCOMES
The strategies in TAC 2015 will simplify the way we manage our claims and address the gaps in health outcomes. TAC 2015 splits the claims division into two areas: Recovery and Independence.
• The focus in Recovery will be to improve return to work rates and to get clients back to their normal routine as soon as possible.
• Independence will help our seriously injured clients work towards greater independence and achieve their goals.
Helping our clients achieve better outcomes means they will be less reliant on services such as attendant care and long term paramedical treatment. This simplifi ed system will let us help our clients in a better, more effi cient way.
CLIENT EXPERIENCE
The TAC has always been committed to improving client service. With TAC 2015, we will focus on better responding to the needs of our clients and improving our communication with them.
Our simplifi ed claims model will also help us tailor our service to specifi c groups of clients.
We will improve our client service by:
• Enhancing our empathy in interactionswith clients
• Improving our decision making consistency and
• Delivering benefi ts to our clients quickly, accurately and in a cost effective way.
We will achieve these goals through new service standards, reduced disputation rates and compliance with model litigant guidelines.
SCHEME VIABILITY
In order to deliver improved client outcomes and a better client experience, we must maintain a strong fi nancial position.
Our goal is to keep improving our investment strategies and to ensure that we manage our claims in a cost effective way.
A key measure of scheme viability is our actuarial release performance each year. The TAC’s aim by 2015 is to continue to achieve actuarial releases to secure the long term viability of the scheme.
CLIENT OUTCOMES
CLIENT EXPERIENCE
SCHEME VIABILITY
14
What We Do
THE TAC WORKS WITH THE VICTORIAN COMMUNITY TO REDUCE ROAD TRAUMA AND SUPPORT THOSE IT AFFECTS. TOGETHER, WE STRIVE TO REDUCE THE COST AND IMPACT OF TRANSPORT ACCIDENTS THROUGH:
• Accident prevention – working with our road safety partners to reduce the incidence and severity of road trauma.
• Rehabilitation and lifetime support – working with our claims and health partners to maximise the return to health, work and independence of those injured.
• Claims management – supporting ouremployees to make the right decision at the earliest possible time to deliver timely, effective and suitable compensation.
• Financial management – working with stakeholders and Government to ensure the scheme is viable and sustainable, and represents value for money.
• Scheme design – working with stakeholdersto ensure compensation is suitable, just, in line with community expectations and effectively delivered.
ABOUT THE TAC SCHEME
The TAC supports people injured in transport accidents that are directly caused by the driving of a car, motorcyle, bus, train or tram.
The TAC administers a “no-fault” scheme, which means that anyone injured in a transport accident within Victoria (or interstate if in a Victorian registered vehicle) is eligible to receive support services, irrespective of who caused the crash. Where a person suffers a serious injury in a transport accident, and the accident was someone else’s fault, they may receive a lump sum payment and make a common law claim.
HOW WE MAKE DECISIONS
The TAC is governed by the Transport Accident Act 1986, which sets out what can be funded and any conditions that apply. To support this, we have policies and guidelines that help with our decision making. We also rely on information and recommendations obtained from health care professionals.
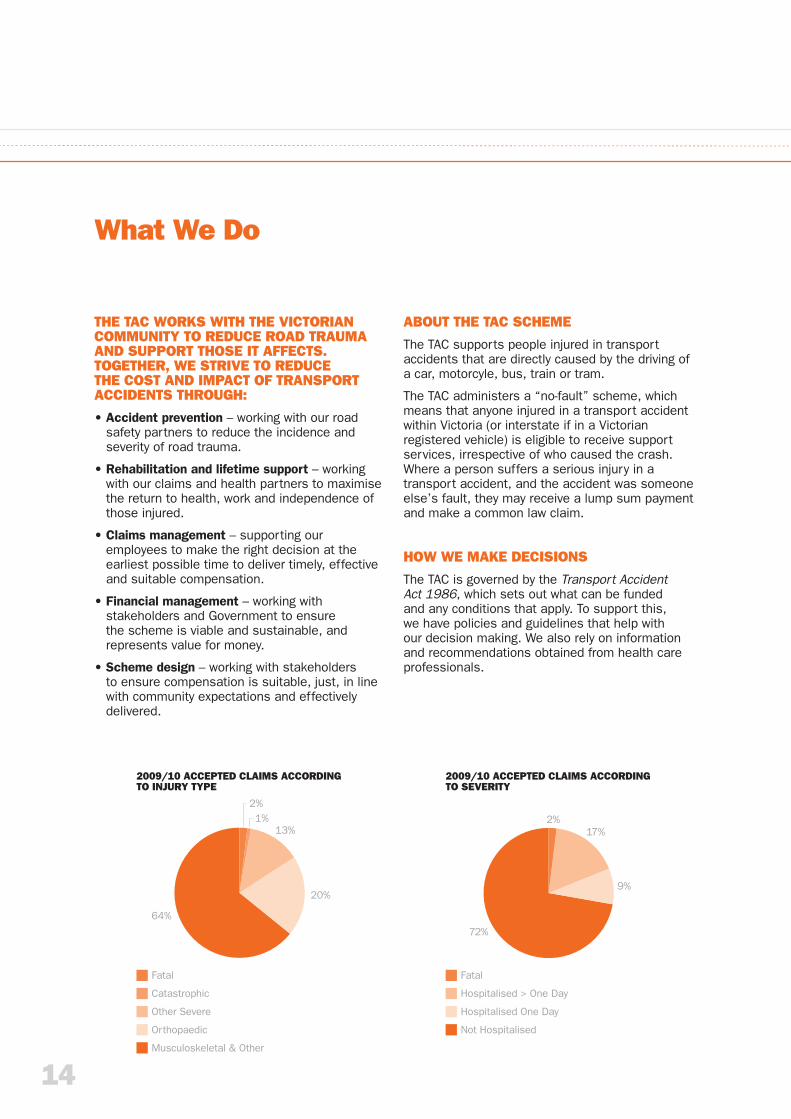
2009/10 ACCEPTED CLAIMS ACCORDINGTO INJURY TYPE
Fatal
Catastrophic
Other Severe
Orthopaedic
Musculoskeletal & Other
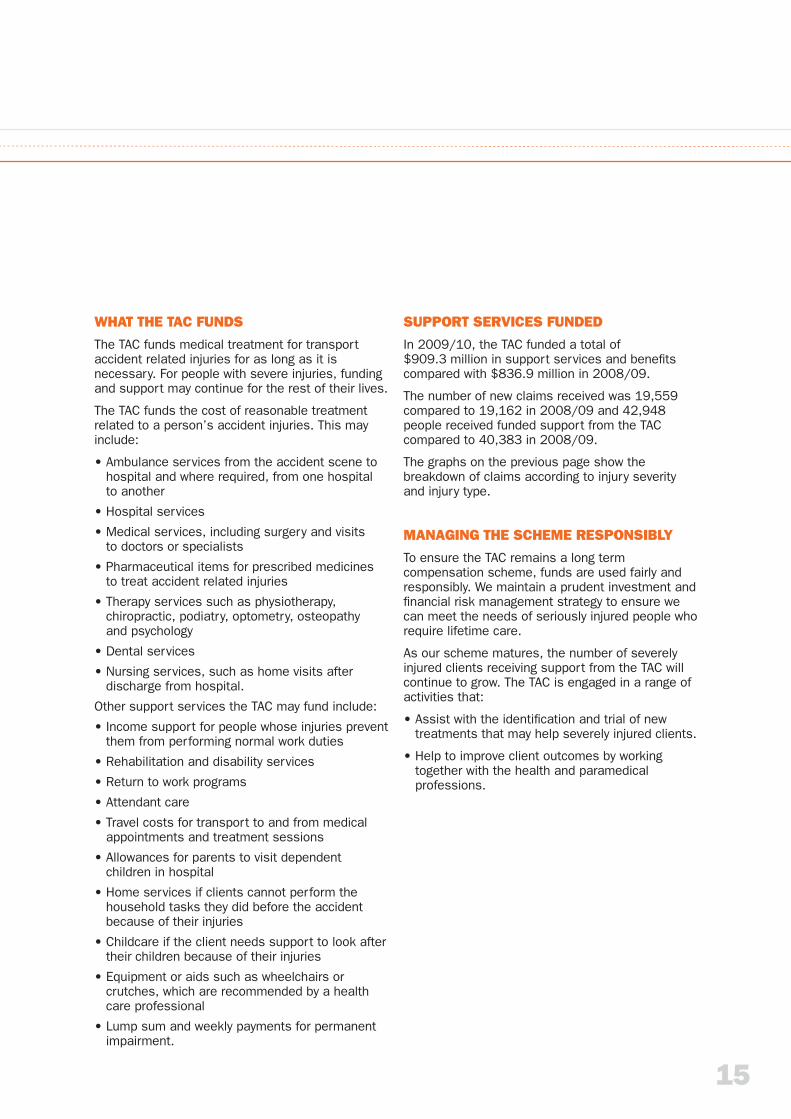
2%
2%17%
9%
72%
1%13%
20%
64%
2009/10 ACCEPTED CLAIMS ACCORDINGTO SEVERITY
Fatal
Hospitalised > One Day
Hospitalised One Day
Not Hospitalised
15
WHAT THE TAC FUNDS
The TAC funds medical treatment for transport accident related injuries for as long as it is necessary. For people with severe injuries, funding and support may continue for the rest of their lives.
The TAC funds the cost of reasonable treatment related to a person’s accident injuries. This may include:
• Ambulance services from the accident scene to hospital and where required, from one hospitalto another
• Hospital services
• Medical services, including surgery and visitsto doctors or specialists
• Pharmaceutical items for prescribed medicines to treat accident related injuries
• Therapy services such as physiotherapy, chiropractic, podiatry, optometry, osteopathyand psychology
• Dental services
• Nursing services, such as home visits after discharge from hospital.
Other support services the TAC may fund include:
• Income support for people whose injuries prevent them from performing normal work duties
• Rehabilitation and disability services
• Return to work programs
• Attendant care
• Travel costs for transport to and from medical appointments and treatment sessions
• Allowances for parents to visit dependent children in hospital
• Home services if clients cannot perform the household tasks they did before the accident because of their injuries
• Childcare if the client needs support to look after their children because of their injuries
• Equipment or aids such as wheelchairs or crutches, which are recommended by a health care professional
• Lump sum and weekly payments for permanent impairment.
SUPPORT SERVICES FUNDED
In 2009/10, the TAC funded a total of$909.3 million in support services and benefi ts compared with $836.9 million in 2008/09.
The number of new claims received was 19,559 compared to 19,162 in 2008/09 and 42,948 people received funded support from the TAC compared to 40,383 in 2008/09.
The graphs on the previous page show the breakdown of claims according to injury severity and injury type.
MANAGING THE SCHEME RESPONSIBLY
To ensure the TAC remains a long term compensation scheme, funds are used fairly and responsibly. We maintain a prudent investment and fi nancial risk management strategy to ensure we can meet the needs of seriously injured people who require lifetime care.
As our scheme matures, the number of severely injured clients receiving support from the TAC will continue to grow. The TAC is engaged in a range of activities that:
• Assist with the identifi cation and trial of new treatments that may help severely injured clients.
• Help to improve client outcomes by working together with the health and paramedical professions.
16
What We Do
SMALL GRANTS PROGRAM
The TAC recognises that many community organisations are already working in innovative ways that maximise our clients opportunities to participate in and contribute to their local community. The Small Grants Program encourages the development of innovative projects and initiatives and supports community contributions from people with a disability.
In 2009/10, the TAC funded $138,455 in grants to enable community organisations to deliver projects benefi ting people living with disabilities.
The community organisations included:
• Back to Back Theatre
• Ballarat and Golden Plains Shire
• The Journey
• Echuca Cycling Club
• Cardinia Shire Council; and
• Lyndoch.
As an example, the TAC’s Small Grants Program enabled the development of a resource booklet titled “The Journey”. It is for family, friends and support workers of a person who has sustained a brain injury. The booklet informs them how a brain injury can affect existing friendships and provides guidance on how new friendships can be formed and sustained.
LEADERSHIP PLUS
As part of the TAC Disability Grants Program the TAC provided part funding to Leadership Plus to deliver its leadership program to members of the community who have a disability. The purpose of the program is to develop the leadership capacities of people with disabilities.
Seven TAC clients have participated in the leadership program. Outcomes from the program have seen TAC clients develop greater knowledge of their abilities and leadership qualities. It has assisted one client fulfi l a dream of working for a theatre company and another the opportunity to play sport for Australia.
DISABILITY PROVIDER INITIATIVES
A training module has been developed for attendant care workers to better support our clients in achieving maximum independence. Independence support is a way of delivering services that assist TAC clients to increase their ability in all aspects of life and be able to act as independently as possible.
The model is specifi cally focused on TAC clients with severe injuries, including acquired brain injury and acquired spinal cord injury. The module was delivered to 75% of the support workers engaged through the TAC’s contracted panel.
From October 2010, the new disability contracts for panel providers will include key performance indicators to monitor providers’ staff capability and training to provide quality services which meet the needs of the clients.
PROVIDER ADVISORY GROUP
The Provider Advisory Group was set up with industry leaders to inform program development, partnership opportunities and effective engagement with health and disability service providers. It is comprised of leaders in the fi elds of traumatic injury, disability services and key professional associations. The group will play a critical role in communicating externally the TAC 2015 strategic directions and specifi cally objectives of the Independence project.
DISABILITY GRANTS
The TAC allocated $5,100 to the Echuca Cycling Club to assist in the running of the Victorian round of the National Hand Cycle Series. Participants competed in a 20km time trial race on the fi rst day and a road race over varying distances depending on the participant’s level of injury (quadriplegic, paraplegic, amputee) on the second day.
17
VICTORIAN SPINAL CORD INJURY PROGRAM PILOT
On 12 November 2009 the Minister for Health, Daniel Andrews MP launched the Victorian Spinal Cord Injury Program Pilot at the Royal Talbot Rehabilitation Centre. The program is designed to ensure that clients receive the support and services they need to achieve their personal goals for independence and return to home, work and the community. The TAC is also funding an independent evaluation of the new service to measure the outcomes of the program. The pilot has so far recruited a total of 32 clients which includes 7TAC clients.
NATIONAL DISABILITYINSURANCE SCHEME
On 23 November 2009, it was announced that the Australian Government would engage the Productivity Commission to carry out an inquiry into a National Disability Insurance Scheme. They are looking into the costs, benefi ts and feasibility of approaches which provide essential care and support – on an entitlement basis – for eligible people with a severe or profound disability. The TAC is providing input into the review as part of the Victorian Government’s consideration of the feasibility study.
INSTITUTE FOR SAFETY COMPENSATION AND RECOVERY RESEARCH (ISCRR)
The Institute for Safety Compensation and Recovery Research (ISCRR) is a joint initiative of WorkSafe, the TAC, and Monash University. Launched on 18 June 2009 by the Minister for WorkCover, Tim Holding MP, the ISCRR undertakes research in compensation practice, health and vocational rehabilitation. The ISCRR aims to identify and develop new opportunities to improve outcomes for those injured at work or in transport accidents, and will positively impact compensation scheme performance. The outcomes of ISCRR research will be transferable and benefi t other workers compensation and Compulsory ThirdParty transport accident schemes in Australiaand internationally.
VICTORIAN NEUROTRAUMA INITIATIVE
The Victorian Neurotrauma Initiative (VNI) supports research into traumatic brain injury and spinal cord injury to improve the quality of life of individuals living with neurotrauma and specifi cally to improve health outcomes for TAC clients.
During 2009/10 the VNI collaborated on project and people support funding with the National Health and Medical Research Council (NHMRC), Australia’s peak body for supporting health and medical research. Several project and people support rounds are still in progress. One completed project round resulted in $747,000 allocated to two projects that will focus on fi nding solutions to improve recovery for children with brain injury.
The VNI also deepened its collaboration with the Ontario Neurotrauma Foundation (ONF) in Canada through its joint funding round. The VNI and ONF announced over $1.1 million in funding to four projects that include using serum biomarkers to predict quality of life after brain injury in children, assessing readiness for driving after brain injury, examining preventable job loss following return to work after spinal cord injury and organising a joint workshop to share lessons learned and develop strategies for translation of neurotrauma research outcomes into clinical practice.
The VNI continues to manage four large international multi-disciplinary research programs, 43 projects and 13 fellowships with six funded projects and two training fellowships completed during the year.
In 2009/10 a review was conducted on the way in which TAC funds neurotrauma research and translates research into practice and policy. It was determined that TAC would not continue to fund the Victorian Neurotrauma Initiative (VNI) past its current contract which expires in May 2011.
The focus in the coming year will be on winding down the VNI and developing an overall strategy for funding health research into the future within the TAC. The TAC has approved $20 million in funding for neurotrauma research over fi ve years. This funding will be available from July 2011.
All committed VNI funded activities will continue and funding of any research activity beyond May 2011 will transition to the TAC. The decision does not impact the VNI’s current funding rounds which will proceed as planned.
FURTHER REDUCEDEATH & SERIOUSINJURY
18
What We Do
THE ROAD SAFETY JOURNEY
THE TAC IS COMMITTED TO REDUCING DEATHS AND SERIOUS INJURIES ON VICTORIA’S ROADS. WE WORK TOWARDS THIS GOAL WITH OUR ROAD SAFETY PARTNERS, VICTORIA POLICE, VICROADS AND THE DEPARTMENT OF JUSTICE, GUIDED BY THE ARRIVE ALIVE 2008-2017 STRATEGY.
The strategy focuses on a “safe system” approach, to have safer drivers in safer cars on safer roads:
• Safer drivers through the Graduated Licensing System and its increased driver practice
• Safer vehicles with the introduction of mandatory ESC (Electronic Stability Control) next year and initiatives such as the First Car List for young drivers and
• Safer roads through an extensive $650 million Infrastructure Program.
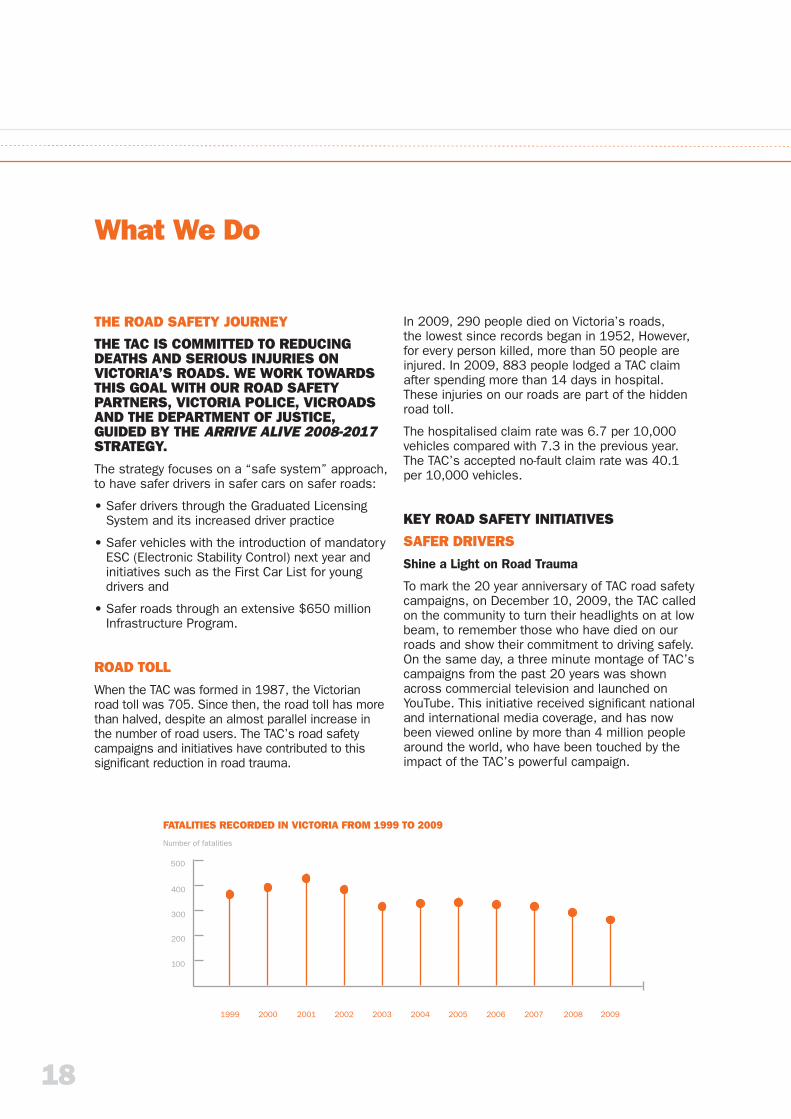
ROAD TOLL
When the TAC was formed in 1987, the Victorian road toll was 705. Since then, the road toll has more than halved, despite an almost parallel increase in the number of road users. The TAC’s road safety campaigns and initiatives have contributed to this signifi cant reduction in road trauma.
In 2009, 290 people died on Victoria’s roads,the lowest since records began in 1952, However, for every person killed, more than 50 people are injured. In 2009, 883 people lodged a TAC claim after spending more than 14 days in hospital. These injuries on our roads are part of the hidden road toll.
The hospitalised claim rate was 6.7 per 10,000 vehicles compared with 7.3 in the previous year. The TAC’s accepted no-fault claim rate was 40.1 per 10,000 vehicles.
KEY ROAD SAFETY INITIATIVES
SAFER DRIVERS
Shine a Light on Road Trauma
To mark the 20 year anniversary of TAC road safety campaigns, on December 10, 2009, the TAC called on the community to turn their headlights on at low beam, to remember those who have died on our roads and show their commitment to driving safely.On the same day, a three minute montage of TAC’s campaigns from the past 20 years was shown across commercial television and launched on YouTube. This initiative received signifi cant national and international media coverage, and has now been viewed online by more than 4 million people around the world, who have been touched by the impact of the TAC’s powerful campaign.
FATALITIES RECORDED IN VICTORIA FROM 1999 TO 2009
1999 2000 2001 2002 2003 2004 2005 2006 2007 2008 2009
100
200
300
400
500
Number of fatalities
19
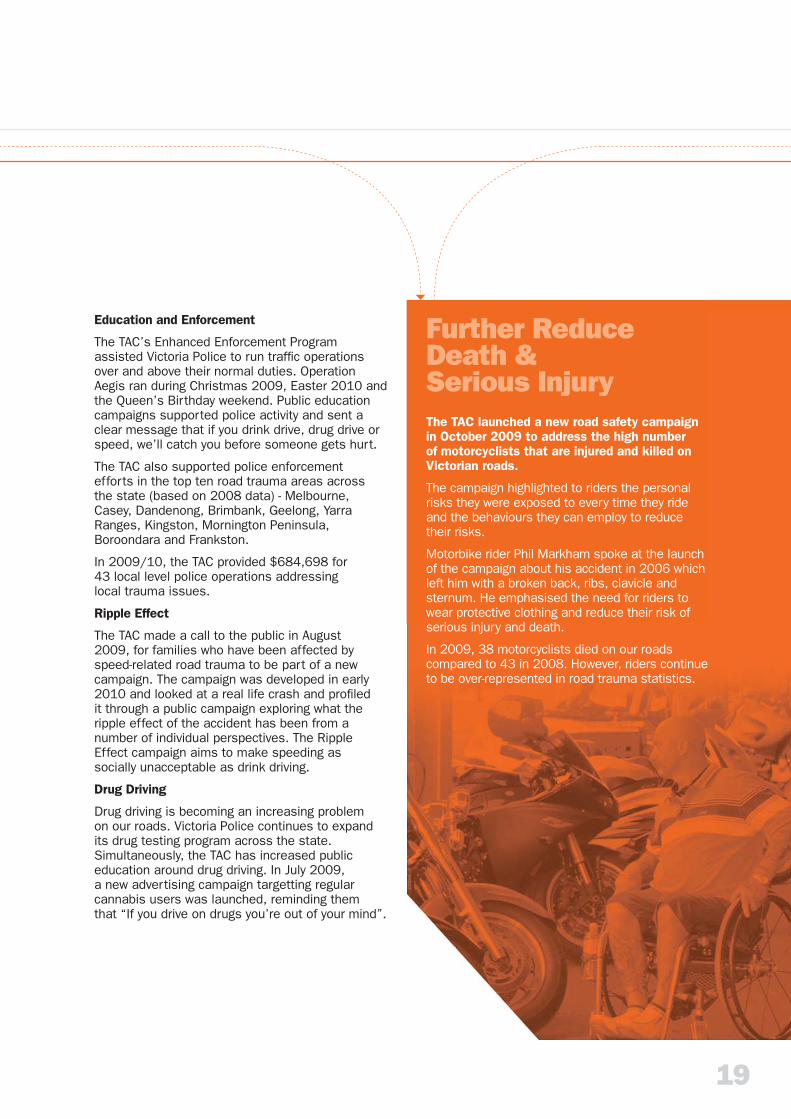
Further Reduce Death & Serious Injury
Education and Enforcement
The TAC’s Enhanced Enforcement Programassisted Victoria Police to run traffi c operations over and above their normal duties. Operation Aegis ran during Christmas 2009, Easter 2010 and the Queen’s Birthday weekend. Public education campaigns supported police activity and sent a clear message that if you drink drive, drug drive or speed, we’ll catch you before someone gets hurt.
The TAC also supported police enforcementefforts in the top ten road trauma areas acrossthe state (based on 2008 data) - Melbourne, Casey, Dandenong, Brimbank, Geelong, Yarra Ranges, Kingston, Mornington Peninsula, Boroondara and Frankston.
In 2009/10, the TAC provided $684,698 for43 local level police operations addressinglocal trauma issues.
Ripple Effect
The TAC made a call to the public in August2009, for families who have been affected byspeed-related road trauma to be part of a new campaign. The campaign was developed in early 2010 and looked at a real life crash and profi ledit through a public campaign exploring what the ripple effect of the accident has been from a number of individual perspectives. The Ripple Effect campaign aims to make speeding associally unacceptable as drink driving.
Drug Driving
Drug driving is becoming an increasing problem on our roads. Victoria Police continues to expand its drug testing program across the state. Simultaneously, the TAC has increased public education around drug driving. In July 2009,a new advertising campaign targetting regular cannabis users was launched, reminding themthat “If you drive on drugs you’re out of your mind”.
The TAC launched a new road safety campaignin October 2009 to address the high numberof motorcyclists that are injured and killed on Victorian roads.
The campaign highlighted to riders the personal risks they were exposed to every time they rideand the behaviours they can employ to reducetheir risks.
Motorbike rider Phil Markham spoke at the launch of the campaign about his accident in 2006 which left him with a broken back, ribs, clavicle and sternum. He emphasised the need for riders to wear protective clothing and reduce their risk of serious injury and death.
In 2009, 38 motorcyclists died on our roads compared to 43 in 2008. However, riders continue to be over-represented in road trauma statistics.
20
What We Do
Motorcyclists
In October 2009, the TAC launched a new campaign urging riders to reduce their risks on the roads. Regardless of who is at fault in a crash between a car and a motorcycle, it is the rider who will come off second best. The campaign called on riders to make decisions that reduce their level of risk each time they ride – whether that be slowing down or wearing the right protective clothing. The message to riders was – “it’s up to you to reduce the risks”.
Youth
The TAC continues to address youth safetythrough a number of means, focussing onrisk-taking and the importance of drivingexperience as a learner driver.
The TAC Cup partnership is in its 19th year and includes a road safety program for the 600 TAC Cup players and their parents, centred around the state’s Graduated Licensing System. The competition has the support of the weekly television program TAC Cup Future Stars, highlighting the talent of the competition and the road safety message. In addition, four short advertisements have been released aimed at encouraging parents to help their learner driver children get more practice on the roads.
The TAC’s annual ‘Make a Film. Make a Difference’ short fi lm competition received more than 300 entries from aspiring young Victorian fi lm makers in 2009. Using the theme “Your mate’s life is in your hands”, the two winning fi lms by Bill Irving and Carmen Knox encouraged discussion about the infl uence of peer group pressure and peer intervention on risk taking. These were screened in cinemas and at major youth festivals throughout the year.
SAFER CARS
The TAC is a supporter of the Australasian New Car Assessment Program (ANCAP) and with its Victorian partners VicRoads and the RACV, encourages the purchase of fi ve-star rated cars, complete with new technologies such as Electronic Stability Control (ESC) and side curtain airbags.
In the past year we also worked with our partners to release the Used Car Safety Rating guide and the First Car list for new drivers.
The partnership has also developed the Stars on Cars program. Based on a successful Western Australian pilot, Stars on Cars will see around 40car dealers in Melbourne and Geelong display star crash rating stickers on vehicles with 4 or 5 star ratings. Stars on Cars increases buyers awareness of the safest cars in the dealership when considering their new vehicle.
The TAC continues to trial and promote next generation technologies through its Safecar project.
SAFER ROADS
As part of the ‘safe system’ approach to road safety, the TAC invests in safety-based infrastructure improvements to Victoria’s road network. The TAC is contributing over $650 million over 10 years towards road improvement projects. These projects, managed by VicRoads, include upgrades of Victoria’s highest risk locations for run-off road crashes in regional areas and improvements to high risk intersections.
In 2009/10, the TAC committed $86.5 millionto continue road safety improvements including:
• Upgrading and developing new roundabouts
• Introducing more fully controlled right turns
• Providing fl exible barrier systems on roadsides and tactile centre line markings to help prevent cross-over into other lanes
• Trialling new innovative treatments
• Research and evaluation.
ACHIEVE WITH OUR
PARTNERS
21
Achieve WithOur Partners
COMMUNITY ROAD SAFETY GRANTS
The TAC’s Community Road Safety Grants program makes grants of up to $20,000 available for community-based projects run by not-for-profi t groups to address specifi c local road safety issues.
In 2009/10, 44 new Community Road Safety Grants were approved. Since the grants program began in 2008, the TAC has received 188 applications, approved 127 projects and committed grant funding totalling almost $2.2 million.
PARTNERSHIPS
The TAC continued to build strong community partnerships to ensure road safety messages reach a diverse audience at grass roots level. During 2009/10 the TAC partnered with:
• Under 18 TAC Cup Football Competition
• Falls Festival
• Melbourne Victory
• Australian Formula 1 Grand Prix
• Australian Motorcycle Grand Prix
• Rutherglen Wine Festival
• Country Racing Victoria Limited
• United Way
• Great Ocean Road Marathon
• Brainlink
• Independence Australia
• Epworth Foundation
• Barwon Health Foundation
• Amy Gillett Foundation
Community engagement activities included free breath-testing, running educational competitions, supporting shuttle buses as alternative transport options for patrons and distributing targeted road safety information.
The TAC also works closely with the Australian Drug Foundation, Road Trauma Support Services Victoria and VicHealth to support our public education and community engagement efforts.
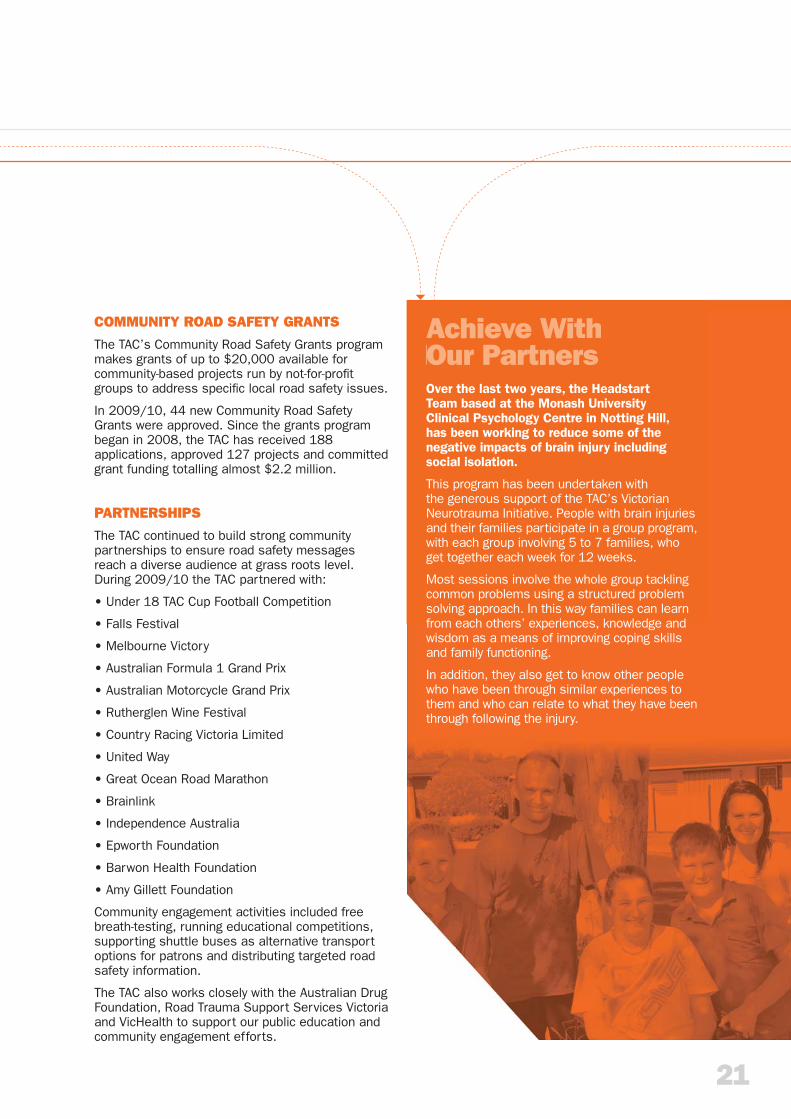
Over the last two years, the Headstart Team based at the Monash University Clinical Psychology Centre in Notting Hill, has been working to reduce some of the negative impacts of brain injury including social isolation.
This program has been undertaken with the generous support of the TAC’s Victorian Neurotrauma Initiative. People with brain injuries and their families participate in a group program, with each group involving 5 to 7 families, who get together each week for 12 weeks.
Most sessions involve the whole group tackling common problems using a structured problem solving approach. In this way families can learn from each others’ experiences, knowledge and wisdom as a means of improving coping skills and family functioning.
In addition, they also get to know other people who have been through similar experiences to them and who can relate to what they have been through following the injury.
22
How We Do It
THE TAC DELIVERS ON COMMUNITY EXPECTATIONS BY LISTENING TO CLIENT NEEDS, RESOLVING ISSUES AND PROVIDING SUPPORT SERVICES IN A FAIR, EFFICIENT AND FINANCIALLY RESPONSIBLE WAY.
SERVICE DELIVERY
The TAC’s enquiry centre answered 281,707calls in 2009/10, with an average call handlingtime of 8 minutes 40 seconds. Our calls consisted of 65% from TAC clients and 35% from providers or other stakeholders. The TAC made payments for 1.8 million services, with the majority of these made to service providers and 15% to clients.
CLIENT EXPERIENCE
Each year, the TAC surveys approximately 2,000 clients to measure their satisfaction with the organisation on three key criteria: resolving issues, keeping them up-to-date and treating them as individuals.
The TAC’s client satisfaction score for 2009/10 was 7.35 out of 10. This score did not meet the annual target of 7.70 and was lower than the score obtained for June 2008/09 (7.62). The number of satisfi ed clients remains relatively high with 80% of clients satisfi ed with the service provided by the TAC.
The TAC is committed to focusing on service basics to increase our client satisfaction levels. For the fourth year, we have instigated a Client Zone.It involves clients sharing their perspectives about the TAC’s service delivery, providing insight into the role we play in their lives – and identifying where service improvements may be made.
In the coming year, clients will be surveyed more regularly to allow greater insight into the client experience. This will help inform strategies focused on keeping clients up-to-date, treating clients with empathy and respect, and providing services quickly and effi ciently.
CLIENT OUTCOMES
The measurement of client outcomes is relatively new to the compensation industry. The TAC conducted an inaugural client outcomes survey towards the end of 2008 and a second wave of data was collected in 2009 in collaboration with the Institute for Safety, Compensation and Recovery Research. The 2009 study enabled the TAC to refi ne methodological considerations and further enhance its understanding of the health and vocational outcomes of TAC clients.
The TAC is currently planning a third client outcomes study. It is anticipated that the 2010 study will replicate the methodology adopted in 2009 and provide directly comparable time-seriesresults between the two survey waves. The insights from the survey will be used to inform client focused return to work and return to health strategies.
CLIENT ART EXHIBITION
As part of the TAC’s Client Voice program, an exhibition of inspiring artwork by clients was held in Geelong and Melbourne. The exhibition titled “Picture This” provided an excellent opportunityfor the clients, their families and TAC staff to share their experiences of road trauma.
23
HEALTH STRATEGY AND PARTNERSHIPS
The Health Services Group (HSG) is a collaboration between the TAC and WorkSafe. It aims to improve the health and return to work outcomes for TAC clients and injured workers.
The HSG has developed a Network Provider Program which focuses on the delivery of accessible, quality and cost effective services to improve outcomes for TAC clients and injured workers. In 2009/10, HSG has commenced evaluating the pilot network provider models and has obtained approval to extend the occupational physiotherapy and network psychology models. The Network Provider Program is also providing research into health outcomes for TAC clients and injured workers.
The Clinical Panel is a key interface betweenthe TAC and WorkSafe with treating practitioners.In 2009/10, HSG conducted a review of the protocols utilised by the Clinical Panel to undertake targeted reviews of claims, in order to maximise support for TAC clients and injured workers.
HSG will also develop key long term strategies relating to enhanced communication with General Practitioners, as well as improved mental health strategies and interventions.
COMMON LAW
If a person suffers a “serious injury” as defi ned by the Transport Accident Act 1986 and another person was to blame for the accident, they may lodge a common law claim.
Common law damages are payable for economic loss up to a maximum of $1,031,540 and for pain and suffering up to a maximum of $458,450. Economic loss can be paid to the dependents of a person killed in a transport accident up to a maximum of $750,890.
During 2009/10, the TAC resolved 979 common law claims, the highest number in any one year achieved in the history of the scheme. More than half of the resolved common law claims (60%) were achieved within twelve months from the date of application.
COLLABORATION WITHWORKSAFE VICTORIA
Information Technology Shared Solutions (ITSS) is a shared division of TAC and WorkSafe, which aims to support the achievement of both organisations’ strategic objectives through delivery of effective information technology solutions and expertise.
In 2009/10 key achievements included:
• Successful implementation of new releases of the claims management system (Avanti Peoples’ Release Phase One and Two), leading to a signifi cant increase in user satisfaction
• Implementation of new HR system (MyTAC)to better support managers and individual staff members
• Ongoing monthly enhancements to the claims management system, Avanti
• HSG pharmacy project improving drug categorisation for better reporting
• Technology upgrades to ensure our infrastructure remains current and able to be effectively supported
• Implementation of a new IT Service Desk application to better support our internal users
• Improved security through user access controls
• A number of successful tests to our disaster recovery capability and
• Development of a refreshed fi ve year IT strategy to ensure we can enable TAC’s strategic goals and, in particular, support TAC 2015.
MANAGE CLIENT
EXPECTATIONS
24
How We Do It
NEW ELECTRONIC PAYMENT SYSTEM
The Treatment Payments and Connectivity (TPC) project is a TAC and WorkSafe collaboration to implement a new payment system and improve electronic capability and services, especially for interactions with providers.
The payment of invoices for approved treatments will be mostly automated, meaning less time will be required to review and make decisions on outstanding invoices. TAC claims managers will have more time to concentrate on returning our clients back to their pre-accident health as soonas possible.
TPC will initially involve providers and staff fromthe TAC and WorkSafe. In the longer term, clients will have the ability to lodge reimbursement requests through a portal and check the statusof their remittance online.
BUSINESS RISK AND INTELLIGENCE
In 2009/10, the TAC established a new division called Business Risk and Intelligence to ensure strong corporate strategic oversight and supportas the TAC implements its TAC 2015 objectives.
The Risk Management Policy, Methodology Guidance and Board Risk Appetite Statements of both the TAC and WorkSafe have been harmonised to ensure a common policy platform for employees of both organisations and their shared services.
The common Risk Management Policy for both organisations has also been aligned to the new AS/NZS ISO 31000 Risk Management Standard, which provides a more explicit outline of risk management principles, accountabilities and the risk culture and awareness (i.e. values, behaviours and practices) within TAC.
RESOLVING DISPUTES AND COMPLAINTS
The TAC makes hundreds of decisions each week that affect our clients. Sometimes, a decision may not be accepted or understood. In these cases,a client may choose to have the decision.
• Informally reviewed by the TAC
• Reviewed under the No Fault Disputation Protocols
• Reviewed by the Victorian Civil and Administrative Tribunal (VCAT) – known as a ‘merit review’.
Informal reviews
Disputes over TAC decisions have increased this year with 429 requests for an informal review lodged compared to 348 in 2008/09. Over 90% of informal reviews are resolved within four months with around 60% of reviews maintaining TAC’s original decision and 30% being compromised or overturned.
Dispute Resolution Protocols
In 2005, protocols were implemented in collaboration with legal stakeholders to provide an alternative to the formal disputation process at VCAT and reduce the time and cost to resolve disputes.
In 2009/10, 871 applications for a review of a TAC decision were lodged under the protocols, compared to 858 in 2008/09. During the year, 650 applications were resolved, compared to 695 in the previous year.
Merit reviews
A total of 639 merit review applications were lodged at the VCAT in 2009/10 and over half of these were issued concurrently with a dispute application under the protocols. In the previous year, 661 merit reviews were lodged.
The number of merit reviews resolved during the year was 464, compared to 439 in 2008/09.
25
Manage Client Expectations
Model litigant
The TAC is committed to the Victorian Government’s Model Litigant Guidelines.The guidelines require the TAC to act fairly and consistently, to avoid litigation, pay legitimate claims promptly and to minimise legal costs. The guidelines require fairness and the utmost propriety.
During 2009/10, fourteen formal complaints were received. All complaints were investigated with no breaches of the guidelines found.
Complaints
The TAC takes service complaints very seriously and has a formal complaints offi ce to manage these issues, including matters of inquiry fromthe CEO’s offi ce and Ombudsman Victoria.
In 2009/10, the number of formal complaints increased from 219 in 2008/09 to 353. This is in line with the maturation of the formal complaints offi ce and in the context of over 40,000 claims being managed by TAC.
The TAC welcomes feedback from clients and other stakeholders to help us improve our service.
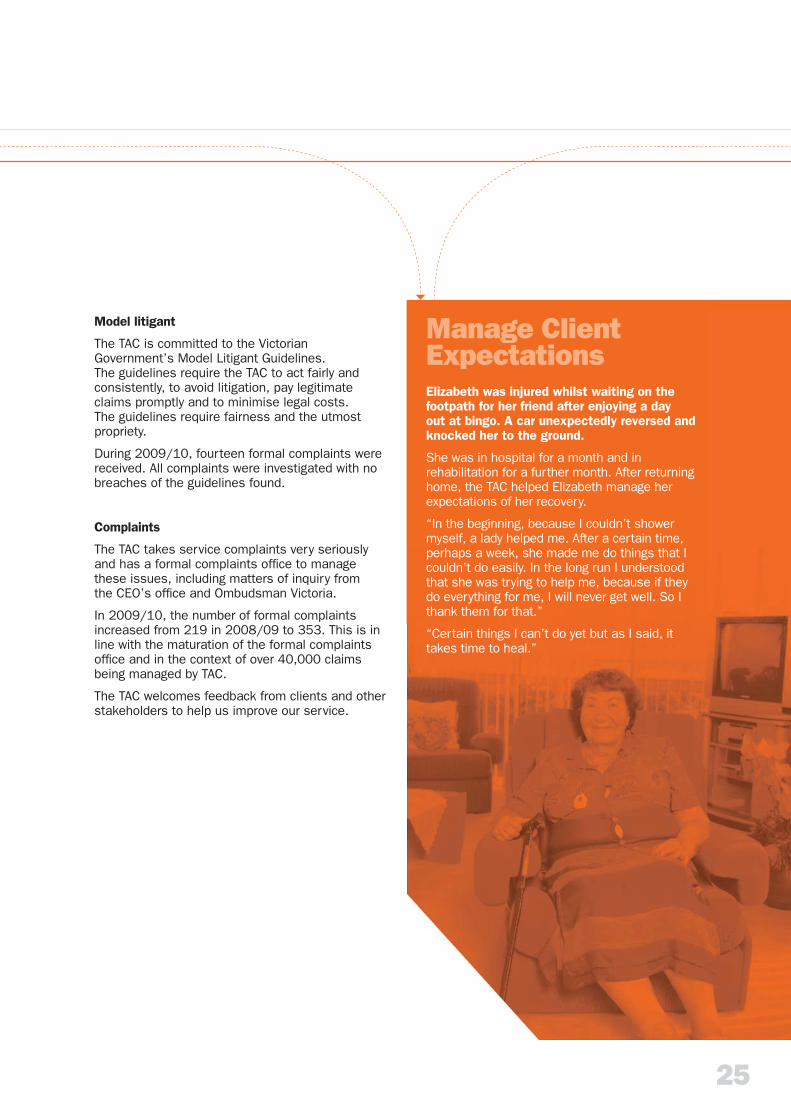
Elizabeth was injured whilst waiting on the footpath for her friend after enjoying a dayout at bingo. A car unexpectedly reversed and knocked her to the ground.
She was in hospital for a month and in rehabilitation for a further month. After returning home, the TAC helped Elizabeth manage her expectations of her recovery.
“In the beginning, because I couldn’t shower myself, a lady helped me. After a certain time, perhaps a week, she made me do things that I couldn’t do easily. In the long run I understood that she was trying to help me, because if they do everything for me, I will never get well. So I thank them for that.”
“Certain things I can’t do yet but as I said, it takes time to heal.”
26
How We Do It
FINANCIAL ANDCAPITAL MANAGEMENT
OPERATING RESULTS
Sound fi nancial management, prudent investment and risk management ensured that the TAC scheme remains viable.
The TAC recorded an after-tax operating loss of$81 million in 2009/10, compared with anafter-tax operating loss of $971 million in 2008/09.
Buoyant investment markets saw TAC’s investments return 11.9% in 2009/10 compared to a negative return of 12.2% in the previous year.
This impacted the TAC’s rolling 10 year real investment return of 1.9% per annum above infl ation compared to targeted real return of 5% per annum above infl ation.
The TAC has developed a reporting framework where contributions to annual profi t from internal and external factors (such as volatility in investment markets, claims discount rates and infl ation) are identifi ed and reported separately.
In 2009/10, performance from insurance operations was $200 million (compared to $103 million in 2008/09). This improvement is due to strong claims management.
The TAC achieved an actuarial release (or write-down in projected liabilities) of $40 million.
The total impact from external factors was an unfavourable $320 million (compared to an unfavourable $1,498 million in 2008/09).
ASSETS AND LIABILITIES
The TAC’s total assets as at 30 June 2010 were $8.0 billion while total liabilities were $8.4 billion.
The TAC’s funding ratio was 80.6%.
DIVIDEND
Under the Transport Accident Act 1986, the TAC may pay an annual dividend to the Victorian Government. The dividend is determined each year by the Treasurer in consultation with the TAC Board, Chairman and the Minister, having regard to funding levels and other factors. No dividend was paid in 2009/10 relating to the 2008/09 results.
TRANSPORT ACCIDENT CHARGE
Consistent with the Transport Accident Act 1986, transport accident charge levels for motorists increased in line with the CPI (3.15%) on 1 July 2009.
The TAC also covers people injured in train and tram accidents with charges paid by the railway and tramway managers to fund these claims.
Transport accident charge levels for both motor vehicles and railways/tramways are set following a review of claims experience by independent actuaries.
REINSURANCE
As part of the TAC’s fi nancial risk management strategies – to protect the scheme against the impact of a catastrophic accident – the TAC has reinsurance cover for $175 million above $100 million retention.
PROVIDE BETTER
VALUE FOR MONEY
27
INVESTMENT STRATEGY REVIEW
The TAC’s investment portfolio is managed by the Victorian Funds Management Corporation (VFMC). Under this arrangement, the TAC is responsible for annually reviewing the overall investment objectives to ensure they deliver maximum income at an acceptable level of risk and also comply with the prudential risk measures imposed by Government. The VFMC then develops and executes investment strategy in accordance with the objectives.
The TAC, together with the VFMC and the Department of Treasury and Finance, is currently undertaking a triennial review of its business, investment and balance sheet risks in order to optimise investment strategies and support the long term viability of the scheme.
REDUCING FRAUD
While the overwhelming majority of TAC clientsand service providers are entitled to the benefi ts and payments they claim, a very small number seek to defraud the TAC and ultimately, the people of Victoria. The TAC has fraud and risk management controls in place and in cases where fraud is suspected, we exercise our strong legislative powers to investigate and prosecute.
During 2009/10, 15 prosecutions were fi nalised through the Magistrates’ Court. In nine cases, a conviction was recorded and a total of $108,462 in restitution was awarded to the TAC. Six matters are currently before the courts where the TAC is alleging fraud against the scheme totalling $211,929.
Thirteen letters of caution for breaches of theAct relating to fraud and providing false information to the TAC were sent to clients and providers incorporating requests for reimbursement of $56,585. In addition, six service providers were referred to their respective regulatory boards as a result of concerns over their services to TAC clients.
The TAC continued to focus on ensuring the accuracy of payments to service providers with over 3,500 reviews completed during the year across medical practitioner and other allied health disciplines resulting in the reimbursement of $343,612.
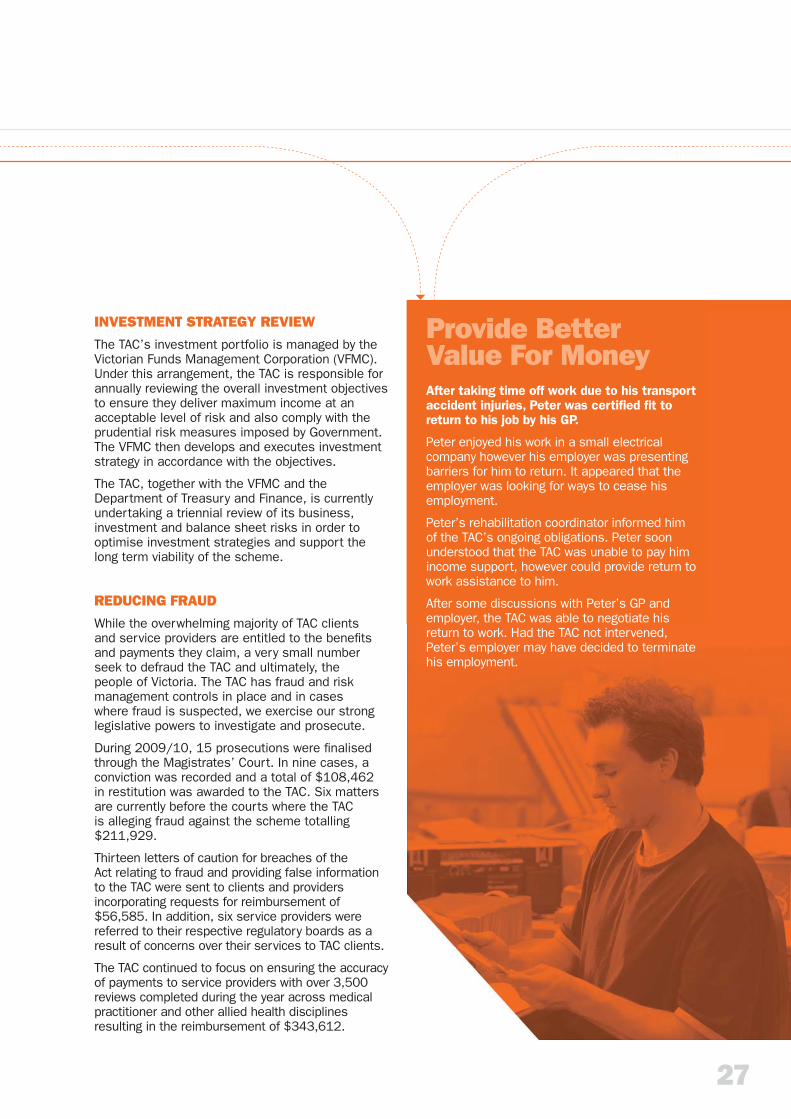
Provide BetterValue For Money After taking time off work due to his transport accident injuries, Peter was certifi ed fi t to return to his job by his GP.
Peter enjoyed his work in a small electrical company however his employer was presenting barriers for him to return. It appeared that the employer was looking for ways to cease his employment.
Peter’s rehabilitation coordinator informed him of the TAC’s ongoing obligations. Peter soon understood that the TAC was unable to pay him income support, however could provide return to work assistance to him.
After some discussions with Peter’s GP and employer, the TAC was able to negotiate his return to work. Had the TAC not intervened, Peter’s employer may have decided to terminate his employment.
Who We Are
THE TAC IS A VICTORIAN GOVERNMENT OWNED ORGANISATION SET UP IN 1986 TO PAY FOR TREATMENT AND BENEFITS FOR PEOPLE INJURED IN TRANSPORT ACCIDENTS.
Continuous improvement in our claims management, rehabilitation, lifetime support and fi nancial management has seen signifi cant improvements in client service and the long term viability of the scheme.
Over recent years, the TAC has worked collaboratively with WorkSafe Victoria and theallied health sector to develop strategies that improve treatment outcomes for TAC clientsand injured workers.
OUR MISSION
To reduce road trauma and its impact on thelives of accident victims in a caring, effi cientand fi nancially responsible manner.
OUR VISION
To provide Victorians with the most equitable personal injury compensation scheme in the world and set international standards in its delivery.
OUR VALUES
The TAC is an organisation that thrives on teamwork and the contribution of talented and committed people. Our fi ve shared values refl ect our culture and guide us in the way we work with our clients, providers and each other.
INTEGRITY
We will be open, honest and reliable in everything we do, achieving and maintaining the highest levels of professional service for our stakeholders and each other.
UNITY OF PURPOSE
We will work together to achieve our visionand mission. We will share experiences, knowledge and ideas to foster greater communication, interaction and cohesiveness within the organisation.
DIGNITY AND RESPECT
We will treat all people, inside and outsidethe organisation, with dignity and respect.
INNOVATION
We recognise the role innovation can play in achieving the organisation’s vision and mission. We will foster a culture that encourages employees to maximise their potential.
ACCOUNTABILITY AND RESPONSIBILITY
We will support and encourage employees to be responsible and accountable, and to make decisions within the scope of their role.
28
INVESTING IN OUR PEOPLE
At the TAC, we are committed to equipping our frontline managers and senior leaders with the skills they need to excel. Our in-house leadership programs are practical, work-based programs that give leaders an opportunity to explore and apply contemporary leadership practices within areal-time context.
Having a relatively new workforce, the TAC mentoring and coaching programs have an important role in facilitating organisational knowledge and experience exchange.
The Ambassador program was implemented bythe TAC in collaboration with Worksafe in 2006. The aim of this program is to build global relationships with organisations recognised for best practice and subject matter expertise.The TAC has chosen to align the knowledge captured through the Ambassador program withits long term strategy needs – TAC 2015.
The TAC promotes opportunities for external development of our leaders, including community based leadership programs such as the Leaders for Geelong Program (run by the Committee for Geelong) and the Williamson Community Program (run by Leadership Victoria).
EMPLOYEE OPINION SURVEY
The TAC conducts an annual employee survey to measure employee engagement and staff morale. An outstanding 90% of employees participated in the TAC’s 2010 survey which was conducted by Towers Watson.
The results are well above those of Australian national norms and are a testament to the continued high level of employee engagement during a period of signifi cant change for the organisation.
Overall, the TAC’s employee engagement score decreased in 2010 by just 1% to 85%. This refl ects employee alignment to the organisation’s values, beliefs and goals, as well as a strong sense of pride and belonging. Staff morale also remainedat high levels at 73% and further refl ects employee commitment to the TAC.
29
NURTUREINDEPENDENCE
30
DIVERSITY PROGRAM
The TAC is committed to building a culture of diversity and inclusion, where we value and utilise the contribution of our employees from diverse backgrounds and experiences.
The TAC’s Diversity and Inclusion Strategy was launched in March 2010. The strategy is our blueprint to creating a more inclusive workplace where we promote, recruit, develop and retain a diverse range of people and skills. A diverse workplace will better enable us to deliver an improved client experience – one of the key commitments we have outlined in our 2015 strategy. We will be able to draw on a broader pool of ideas, perspectives and experiences, all of which will help us improve the service to our clients.
HEALTH PROMOTION
During 2009/10 the TAC undertook thefollowing initiatives:
• Testing and treatment for improved health
• Onsite counselling and employee referrals
• Free fl u vaccination program
• Eyesight testing and
• Health checks.
The TAC was also a recipient of a High Commendation in the 2009/10 NationalWorklife Balance Awards.
PRO BONO LEGAL SERVICES
The TAC actively supports pro bono legal service programs. In 2009/10, the TAC continued to fund a position with the Public Interest Law Clearing House (PILCH) - an independent not-for-profi t legal referral service committed to improving access to justice and protecting human rights.
A number of the TAC’s in-house lawyers also volunteer their services at the Barwon Community Legal Service (Night Service), which provides free legal advice to the Barwon Region.
TRAINEESHIP PROGRAM
In 2009/10, the TAC had twelve trainees working in the claims division, each undertaking a 12 month traineeship. The trainees worked for approximately four months across three different claims areas.
In line with TAC’s commitment to the Corio Norlane Neighbourhood Renewal project and Northern Futures, 75% of trainees come from the northern suburbs of Geelong. The TAC worked in partnership with G-Force and Mentor to deliver a successful traineeship program.
Since January 2009, 11 trainees have completed their 12 month traineeships. Five have obtained ongoing roles with the TAC and four have been successful in obtaining employment locally.
30
Who We Are
31
NurtureIndependence
31
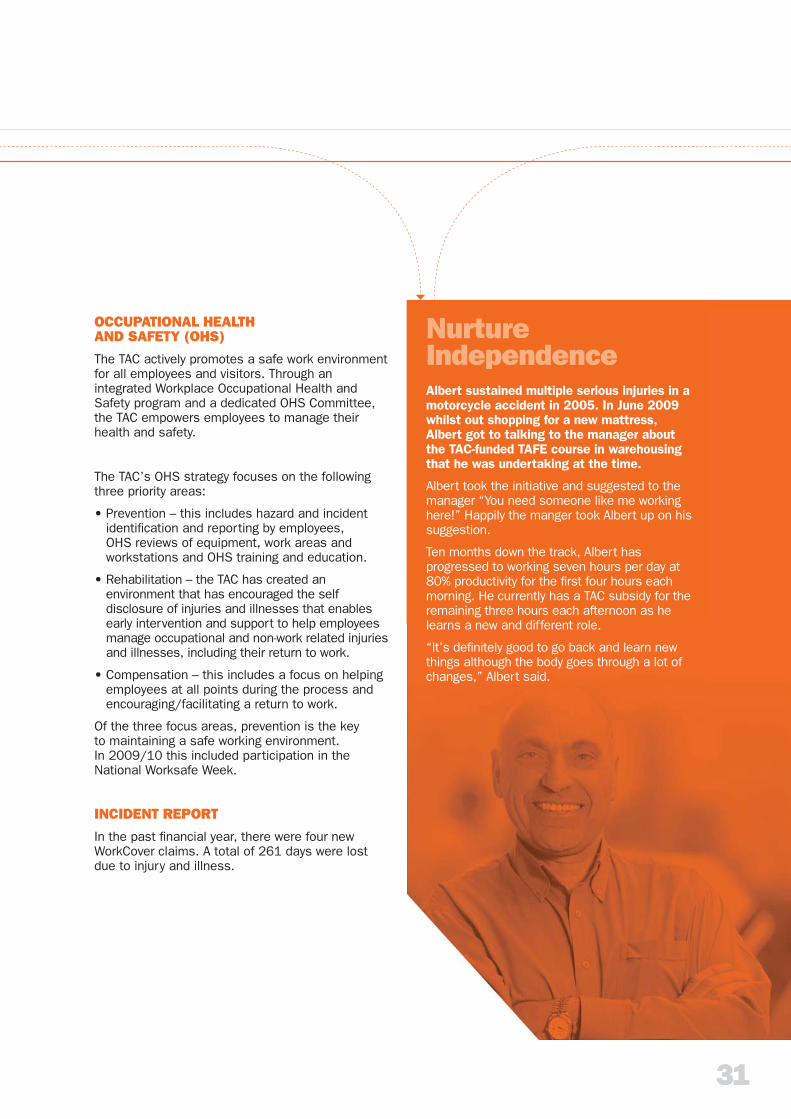
Albert sustained multiple serious injuries in a motorcycle accident in 2005. In June 2009 whilst out shopping for a new mattress,Albert got to talking to the manager about the TAC-funded TAFE course in warehousing that he was undertaking at the time.
Albert took the initiative and suggested to the manager “You need someone like me working here!” Happily the manger took Albert up on his suggestion.
Ten months down the track, Albert has progressed to working seven hours per day at 80% productivity for the fi rst four hours each morning. He currently has a TAC subsidy for the remaining three hours each afternoon as he learns a new and different role.
“It’s defi nitely good to go back and learn new things although the body goes through a lot of changes,” Albert said.
OCCUPATIONAL HEALTHAND SAFETY (OHS)
The TAC actively promotes a safe work environment for all employees and visitors. Through an integrated Workplace Occupational Health and Safety program and a dedicated OHS Committee, the TAC empowers employees to manage their health and safety.
The TAC’s OHS strategy focuses on the following three priority areas:
• Prevention – this includes hazard and incident identifi cation and reporting by employees, OHS reviews of equipment, work areas and workstations and OHS training and education.
• Rehabilitation – the TAC has created an environment that has encouraged the self disclosure of injuries and illnesses that enables early intervention and support to help employees manage occupational and non-work related injuries and illnesses, including their return to work.
• Compensation – this includes a focus on helping employees at all points during the process and encouraging/facilitating a return to work.
Of the three focus areas, prevention is the keyto maintaining a safe working environment.In 2009/10 this included participation in the National Worksafe Week.
INCIDENT REPORT
In the past fi nancial year, there were four new WorkCover claims. A total of 261 days were lost due to injury and illness.
32
Appendix - Performance Graphs
0
100
200
300
400
500
600
700
800
900
1000
2005/06 2006/07 2007/08 2008/09 2009/10
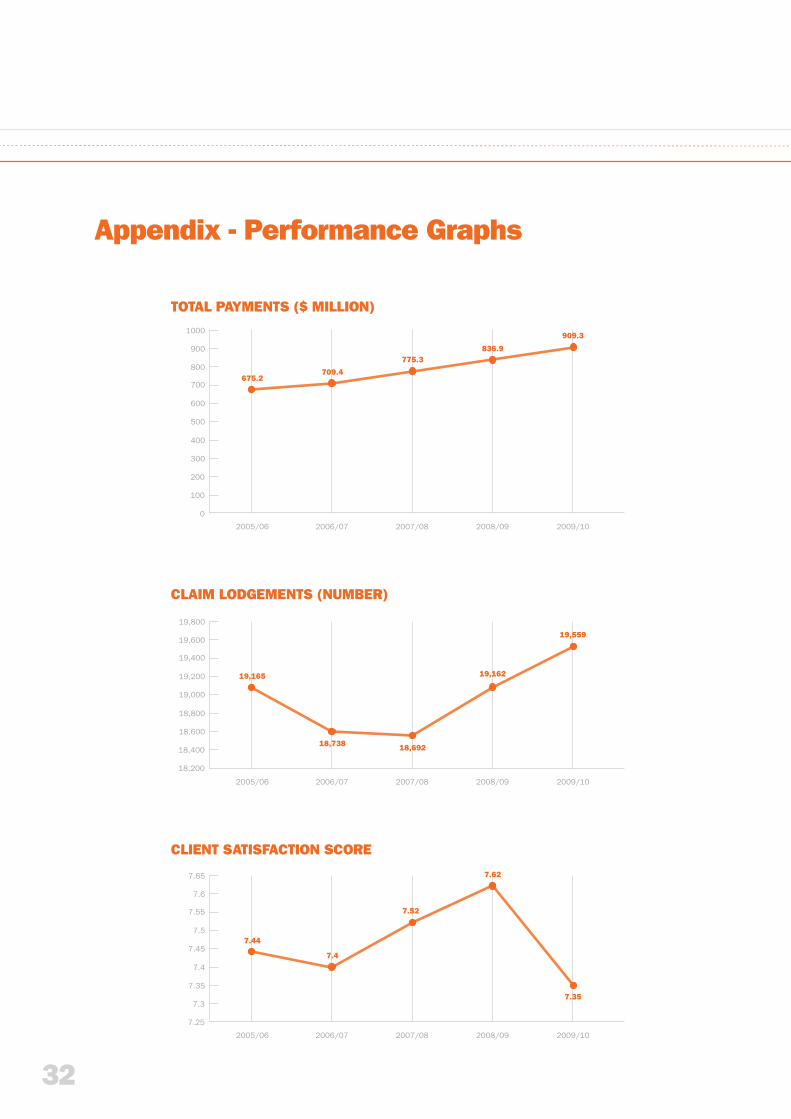
TOTAL PAYMENTS ($ MILLION)
675.2709.4
836.9
909.3
775.3
18,200
18,400
18,600
18,800
19,000
19,200
19,400
19,600
19,800
2005/06 2006/07 2007/08 2008/09 2009/10
CLAIM LODGEMENTS (NUMBER)
19,165
18,738
19,162
19,559
18,692
7.25
7.3
7.35
7.4
7.45
7.5
7.55
7.6
7.65
2005/06 2006/07 2007/08 2008/09 2009/10
CLIENT SATISFACTION SCORE
7.44
7.4
7.62
7.35
7.52
33
70.5
71
71.5
72
72.5
73
73.5
74
74.5
75
75.5
2005/06 2006/07 2007/08 2008/09 2009/10
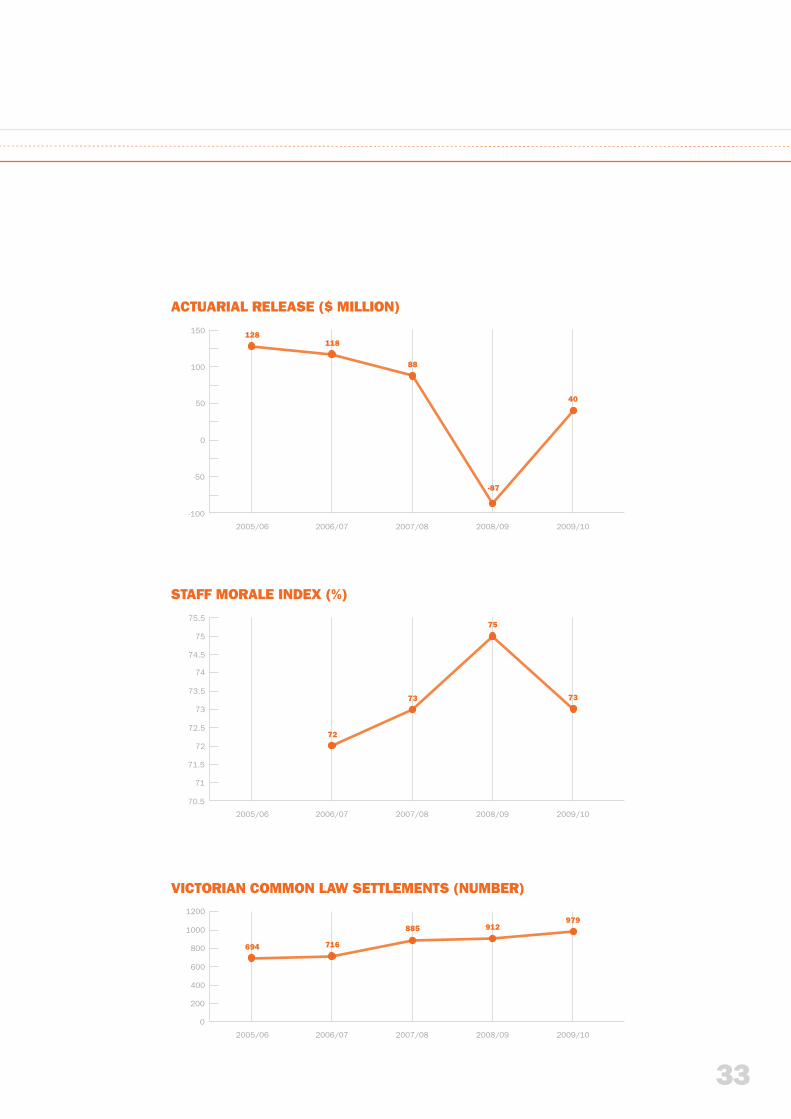
STAFF MORALE INDEX (%)
72
75
7373
-100
-50
0
50
100
150
2005/06 2006/07 2007/08 2008/09 2009/10
ACTUARIAL RELEASE ($ MILLION)
128118
-87
40
88
0
200
400
600
800
1000
1200
2005/06 2006/07 2007/08 2008/09 2009/10
VICTORIAN COMMON LAW SETTLEMENTS (NUMBER)
694 716
912979
885

34
Our seven signposts lead us towards our goal: “A future where every journey is a safe one.
34
35
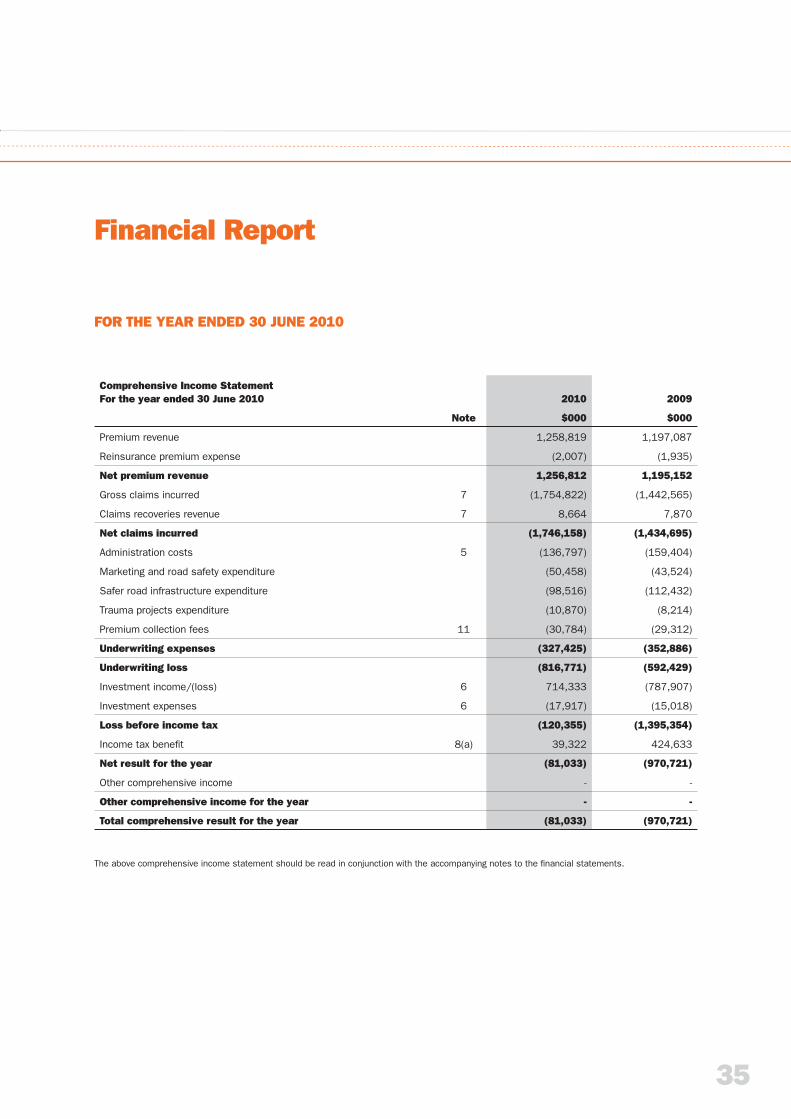
Comprehensive Income StatementFor the year ended 30 June 2010 2010 2009
Note $000 $000
Premium revenue 1,258,819 1,197,087
Reinsurance premium expense (2,007) (1,935)
Net premium revenue 1,256,812 1,195,152
Gross claims incurred 7 (1,754,822) (1,442,565)
Claims recoveries revenue 7 8,664 7,870
Net claims incurred (1,746,158) (1,434,695)
Administration costs 5 (136,797) (159,404)
Marketing and road safety expenditure (50,458) (43,524)
Safer road infrastructure expenditure (98,516) (112,432)
Trauma projects expenditure (10,870) (8,214)
Premium collection fees 11 (30,784) (29,312)
Underwriting expenses (327,425) (352,886)
Underwriting loss (816,771) (592,429)
Investment income/(loss) 6 714,333 (787,907)
Investment expenses 6 (17,917) (15,018)
Loss before income tax (120,355) (1,395,354)
Income tax benefi t 8(a) 39,322 424,633
Net result for the year (81,033) (970,721)
Other comprehensive income - -
Other comprehensive income for the year - -
Total comprehensive result for the year (81,033) (970,721)
Financial Report
FOR THE YEAR ENDED 30 JUNE 2010
The above comprehensive income statement should be read in conjunction with the accompanying notes to the fi nancial statements.
36
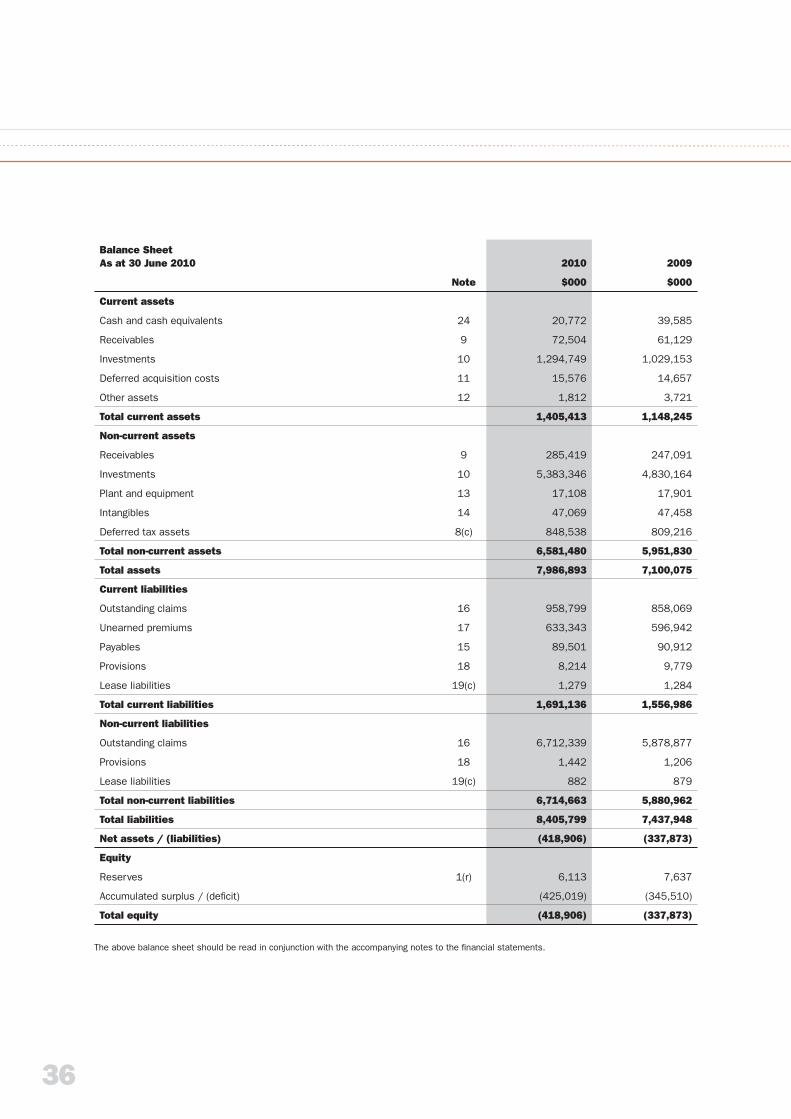
Balance SheetAs at 30 June 2010 2010 2009
Note $000 $000
Current assets
Cash and cash equivalents 24 20,772 39,585
Receivables 9 72,504 61,129
Investments 10 1,294,749 1,029,153
Deferred acquisition costs 11 15,576 14,657
Other assets 12 1,812 3,721
Total current assets 1,405,413 1,148,245
Non-current assets
Receivables 9 285,419 247,091
Investments 10 5,383,346 4,830,164
Plant and equipment 13 17,108 17,901
Intangibles 14 47,069 47,458
Deferred tax assets 8(c) 848,538 809,216
Total non-current assets 6,581,480 5,951,830
Total assets 7,986,893 7,100,075
Current liabilities
Outstanding claims 16 958,799 858,069
Unearned premiums 17 633,343 596,942
Payables 15 89,501 90,912
Provisions 18 8,214 9,779
Lease liabilities 19(c) 1,279 1,284
Total current liabilities 1,691,136 1,556,986
Non-current liabilities
Outstanding claims 16 6,712,339 5,878,877
Provisions 18 1,442 1,206
Lease liabilities 19(c) 882 879
Total non-current liabilities 6,714,663 5,880,962
Total liabilities 8,405,799 7,437,948
Net assets / (liabilities) (418,906) (337,873)
Equity
Reserves 1(r) 6,113 7,637
Accumulated surplus / (defi cit) (425,019) (345,510)
Total equity (418,906) (337,873)
The above balance sheet should be read in conjunction with the accompanying notes to the fi nancial statements.
37
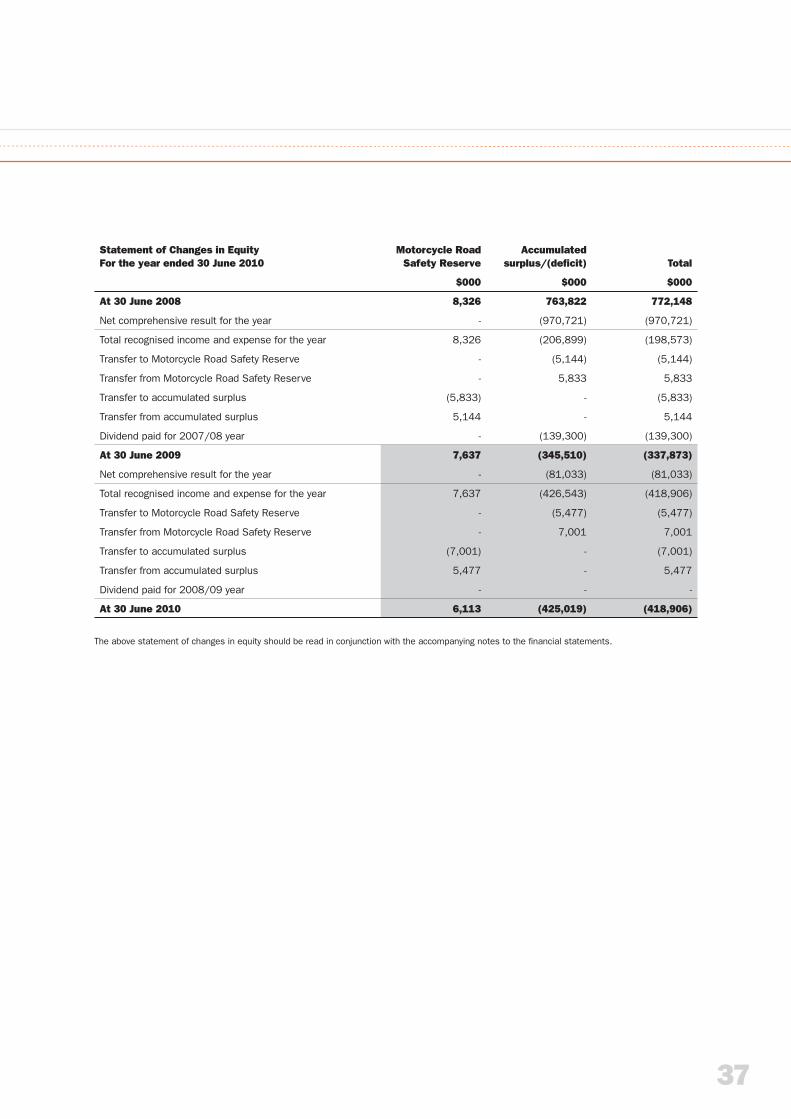
Statement of Changes in EquityFor the year ended 30 June 2010
Motorcycle Road Safety Reserve
Accumulated surplus/(defi cit) Total
$000 $000 $000
At 30 June 2008 8,326 763,822 772,148
Net comprehensive result for the year - (970,721) (970,721)
Total recognised income and expense for the year 8,326 (206,899) (198,573)
Transfer to Motorcycle Road Safety Reserve - (5,144) (5,144)
Transfer from Motorcycle Road Safety Reserve - 5,833 5,833
Transfer to accumulated surplus (5,833) - (5,833)
Transfer from accumulated surplus 5,144 - 5,144
Dividend paid for 2007/08 year - (139,300) (139,300)
At 30 June 2009 7,637 (345,510) (337,873)
Net comprehensive result for the year - (81,033) (81,033)
Total recognised income and expense for the year 7,637 (426,543) (418,906)
Transfer to Motorcycle Road Safety Reserve - (5,477) (5,477)
Transfer from Motorcycle Road Safety Reserve - 7,001 7,001
Transfer to accumulated surplus (7,001) - (7,001)
Transfer from accumulated surplus 5,477 - 5,477
Dividend paid for 2008/09 year - - -
At 30 June 2010 6,113 (425,019) (418,906)
The above statement of changes in equity should be read in conjunction with the accompanying notes to the fi nancial statements.
38
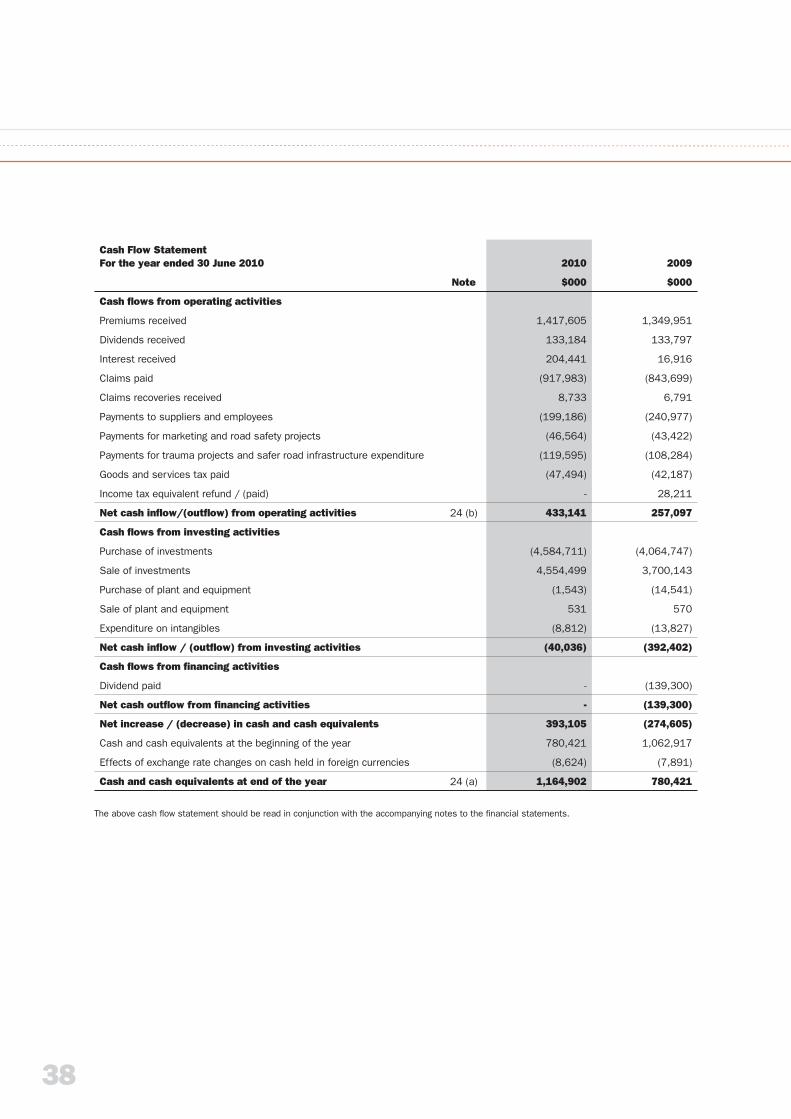
Cash Flow StatementFor the year ended 30 June 2010 2010 2009
Note $000 $000
Cash fl ows from operating activities
Premiums received 1,417,605 1,349,951
Dividends received 133,184 133,797
Interest received 204,441 16,916
Claims paid (917,983) (843,699)
Claims recoveries received 8,733 6,791
Payments to suppliers and employees (199,186) (240,977)
Payments for marketing and road safety projects (46,564) (43,422)
Payments for trauma projects and safer road infrastructure expenditure (119,595) (108,284)
Goods and services tax paid (47,494) (42,187)
Income tax equivalent refund / (paid) - 28,211
Net cash infl ow/(outfl ow) from operating activities 24 (b) 433,141 257,097
Cash fl ows from investing activities
Purchase of investments (4,584,711) (4,064,747)
Sale of investments 4,554,499 3,700,143
Purchase of plant and equipment (1,543) (14,541)
Sale of plant and equipment 531 570
Expenditure on intangibles (8,812) (13,827)
Net cash infl ow / (outfl ow) from investing activities (40,036) (392,402)
Cash fl ows from fi nancing activities
Dividend paid - (139,300)
Net cash outfl ow from fi nancing activities - (139,300)
Net increase / (decrease) in cash and cash equivalents 393,105 (274,605)
Cash and cash equivalents at the beginning of the year 780,421 1,062,917
Effects of exchange rate changes on cash held in foreign currencies (8,624) (7,891)
Cash and cash equivalents at end of the year 24 (a) 1,164,902 780,421
The above cash fl ow statement should be read in conjunction with the accompanying notes to the fi nancial statements.
39
The Transport Accident Commission (TAC) was established and is governed by the Transport Accident Act 1986. The TAC operates the transport accident compensation scheme for Victorians who are injured or die as a result of a transport accident. For the purposes of this fi nancial report prepared under Australian Accounting Standards:
• insurance refers to the transport accident compensation scheme;
• premiums refer to transport accident charge for motor vehicles and charge for trains and trams; and
• policy refers to the cover provided under the Transport Accident Act 1986.
1. SUMMARY OF SIGNIFICANT ACCOUNTING POLICIESStatement of compliance
The fi nancial report is a general purpose fi nancial report which has been prepared on an accrual basis in accordance with the Financial Management Act 1994, Australian Accounting Standards and Interpretations. Accounting Standards include Australian equivalents to International Financial Reporting Standards (A-IFRSs).
The fi nancial report was authorised for issue by the directors on 31st August 2010.
Basis of preparation
This fi nancial report has been prepared on a historical cost basis, except for outstanding claims liabilities, recovery receivables, employee leave liabilities which are included at present value and investments which are included at fair value. Cost is based on the fair values of the consideration given in exchange for assets.
In the application of A-IFRS, management is required to make judgements, estimates and assumptions about carrying values of assets and liabilities that are not readily apparent from other sources. The estimates and associated assumptions are based on historical experience and various other factors that are believed to be reasonable under the circumstances, the results of which form the basis of making the judgements. Actual results may differ from these estimates.
The estimates and underlying assumptions are reviewed on an ongoing basis. Revisions to accounting estimates are recognised in the period in which the estimate is revised if the revision affects only that period or in the period of the revision and future periods if the revision affects both current and future periods.
Judgements made by management in the application of A-IFRS that have signifi cant effects on the fi nancial report and estimates with a signifi cant risk of material adjustments in the next year are disclosed in note 1(e) and 2 of the fi nancial report.
Australian Accounting Standards issued but not yet effective
The AASB has issued the following amendments to Australian Accounting Standards which are applicable to the TAC. These amendments are not effective for the annual reporting period ended 30 June 2010 and have not been applied in preparing the TAC’s fi nancial report.
The nature of the impact of the application of these standards is disclosure only. The TAC will apply these standards for the annual reporting periods beginning on or after the operative dates set out below.
Notes to and forming part of the fi nancial report for the year ended 30 June 2010
40
The following signifi cant accounting policies have been adopted in the preparation and presentation of the fi nancial report.
(a) Premium revenue
Premium revenue is recognised in the comprehensive income statement when it has been earned and is calculated from the attachment date over the period of the policy. The pattern of recognition over the policy period is based on time, which is considered to approximate closely the pattern of risks underwritten.
Premium revenue is net of refunds and excludes stamp duty and goods and services tax.
(b) Investment income
Dividend income is recognised when the TAC’s right to receive dividend has been established. Interest income is recognised on an accrual basis. Trust distribution income is recognised when the market prices are quoted ex-distribution for listed trusts. Unlisted trust distribution income is recognised when the trustee declares a distribution.
Changes in fair values of investments at balance date, as compared with their fair values at the previous balance date or cost of acquisition if acquired during the fi nancial year, are recognised as investment income or loss. Realised profi ts or losses on the termination of derivative fi nancial instruments and realised and unrealised profi ts or losses on changes in fair values of fi nancial instruments are included in investment income.
(c) Unearned premiums
Unearned premiums represent the proportion of premiums received or receivable not earned and relate to periods of insurance subsequent to balance date, computed on the basis that the risk attaches to all policies from the middle of the month in which they are written.
(d) Unexpired risk liability
At each reporting date the TAC performs a liability adequacy test to assess whether the unearned premium liability is suffi cient to cover all expected future cash fl ows relating to future claims against current insurance contracts.
If the present value of the expected future cash fl ows relating to future claims plus the additional risk margin to refl ect the inherent uncertainty in the central estimate exceeds the unearned premium liability less related intangible assets and related deferred acquisition costs then the unearned premium liability is deemed to be defi cient. The TAC applies a risk margin to achieve the same probability of suffi ciency for future claims as is achieved by the estimate of the outstanding claims liability, see note 1(e).
Title Operative Date
2009-5 Further amendments to Australian Accounting Standards arising fromthe Annual Improvements Project
1 January 2010
AASB 124 Related party disclosures (December 2009) 1 January 2011
AASB 9 Financial Instruments 1 January 2013
2009-11 Amendments to Australian Accounting Standards arising from AASB9 1 January 2013
Notes to and forming part of the fi nancial report for the year ended 30 June 2010
41
The entire defi ciency is recognised immediately in the comprehensive income statement. The defi ciency is recognised fi rst by writing down any related intangible assets and then related deferred acquisition costs, with any excess being recorded in the balance sheet as an unexpired risk liability. No defi ciency resulted in 2009/10.
(e) Outstanding claims liability
The liability for outstanding claims is measured on the basis of actuarially estimated costs of future claims payments, which include goods and services tax and the anticipated effects of infl ation and other factors and are discounted to a present value at balance date. The expected future payments include those in relation to claims reported but not yet paid, claims incurred but not yet reported and the anticipated direct and indirect costs of settling those claims. The expected future payments are discounted to present value using a risk free rate.
A risk margin (refer note 16) is applied to the outstanding claims liability to refl ect the inherent uncertainty in the central estimate of the outstanding claims liability. The risk margin increases the probability that the claims liability is adequately provided for to a 75% (2009: 75%) probability of suffi ciency.
(f) Claim recovery receivables
Recoveries on claims paid and outstanding claims are recognised as revenue. Recoveries receivable are assessed in a manner similar to the measurement of outstanding claims liability. Receivables are measured as the present value of the expected future receipts, calculated on the same basis as the outstanding claims liability (note 1(e)). A provision for impairment is established when there is objective evidence that the TAC will not be able to collect all the claim recovery amounts.
(g) Deferred acquisition costs
Acquisition costs represent fees incurred for the collection of transport accident charges for motor vehicles. Acquisition costs are deferred and recognised as assets where they can be reliably measured and where it is probable that they will give rise to a future benefi t. Deferred acquisition costs are measured at the lower of cost and recoverable amount and are expensed to correspond to the earning pattern of the premium revenue.
(h) Assets backing insurance liabilities
The TAC’s investment portfolio is managed by the Victorian Funds Management Corporation (VFMC) through internal management and fund managers and a Master Custodian. The Master Custodian holds the investments and conducts settlements pursuant to instructions from internal management and fund managers.
The TAC has determined that all assets, except for plant and equipment and intangibles, are held to back insurance liabilities and are designated at fair value through profi t and loss. Initial recognition is at cost in the balance sheet and subsequent measurement is at fair value with any resultant unrealised profi ts and losses recognised in the comprehensive income statement.
Notes to and forming part of the fi nancial report for the year ended 30 June 2010
42
The following methods and assumptions are used to determine the fair value of investments:
• fi nancial instruments traded in an organised fi nancial market (traded securities) – fair value based on current quotedmarket price for the instrument. Quoted market prices are used to value listed shares, options, debentures and other equityand debt securities.
• fi nancial instruments not readily traded in an organised fi nancial market – fair value based on present value of contractual future cash fl ows. Cash fl ows are discounted using standard valuation techniques at the applicable market yield having regard to the timing of the cash fl ows.
Details of fair value for the different types of investment assets are listed below:
• cash assets, deposits held at call with banks and investments in money market instruments are carried at face value which approximate to their fair value;
• investments in discounted money market instruments are valued at their quoted mid price at the balance sheet date, as with fi ne trading spreads in this market, there is an ability to transact at mid price;
• shares, fi xed interest securities, options and units in trusts listed on stock exchanges are initially recognised at cost (which is equal to fair value) and the subsequent fair value is taken as the quoted bid price of the instruments at the balance sheet date;
• futures contracts listed on recognised exchanges are valued using the quoted settlement price; and
• units in unlisted trusts are recorded at fair value as determined by the fund manager. In determining fair value the manager uses observable market transactions of the units and underlying assets where available and applicable; some of the underlying assets of the trusts are valued using valuation models.
All purchases and sales of investments that require delivery of the asset within the time frame established by regulation or market convention (‘regular way’ transactions) are recognised at trade date, being the date on which the commitments are made to buy or sell the asset. In cases where the period between trade and settlement exceeds this time frame, the transaction is recognised at settlement date.
Investments are derecognised when the rights to receive future cash fl ows from the assets have expired, or have been transferred, and the TAC has transferred substantially all the risks and rewards of ownership.
Investments that are due to mature, expire or be realised within twelve months of balance date are classifi ed as current investments for the purposes of classifi cation in the balance sheet. While this classifi cation policy may result in a reportedworking capital defi cit, the TAC holds high quality liquid assets in its investment portfolio which are readily convertible to cash assets. In addition, the TAC is normally cash fl ow positive with premium and investment income exceeding claims and administrative cost payments.
(i) Foreign currency translation
Foreign currency transactions are translated into Australian dollars at the exchange rates ruling at the dates of the transactions. Investments held at balance date that are denominated in foreign currencies are retranslated to Australian dollars at rates of exchange ruling at the balance sheet date. Exchange differences are recognised in profi t or loss in the period in which they arise.
Notes to and forming part of the fi nancial report for the year ended 30 June 2010
43
(j) Derivative fi nancial instruments
VFMC and fund managers use derivative fi nancial instruments such as foreign exchange contracts, futures, swaps and options to more effectively manage the risks associated with investing in large institutional portfolios. Derivatives are originally recognised at fair value at the date a derivative contract is entered into and are subsequently remeasured to their fair value at each reporting date with gain or loss recognised in the comprehensive income statement.
The fair value of forward exchange contracts is calculated by reference to current forward exchange rates for contracts with similar maturity profi les. The fair value of interest rate swap contracts is determined by reference to market values for similar instruments.
(k) Employee benefi ts
Provision is made for benefi ts accruing to employees in respect of salaries, annual leave and long service leave. No provision is made for non-vesting sick leave as the TAC has no legal obligation to pay accumulated sick leave upon staff termination.
Provisions made in respect of employee benefi ts expected to be settled within twelve months, are measured at their nominal values using the remuneration rate expected to apply at the time of settlement.
Those liabilities that are not expected to be settled within twelve months are recognised in the provision for employee benefi ts as current liabilities, where the TAC do not have the right to defer settlement. This is measured at present value of the amounts expected to be paid when the liabilities are settled using the remuneration rate expected to apply at the time of settlement.
Employee entitlements for which the TAC has an unconditional right to defer settlement of the liability beyond 12 months after the reporting date are shown as a non-current liability.
Defi ned contribution superannuation plansContributions to defi ned contribution superannuation plans are expensed when incurred.
Defi ned benefi t superannuation plansThe amount charged to the comprehensive income statement in respect of defi ned benefi t superannuation plans represents the contributions made to the superannuation plans in respect of the current services of employees. Superannuation contributions are made to the plans based on the relevant rules of each plan.
(l) Plant, equipment and motor vehicle
Plant and equipment is stated at cost less accumulated depreciation and any impairment in value. Motor vehicles under fi nance leases are capitalised at the present value of the minimum lease payments.
Depreciation of plant and equipment is calculated on the straight line basis at rates which allocate their costs over the estimated useful lives of the assets to its estimated residual value. The costs of improvements to leasehold premises is amortised over the remaining period of the lease or estimated useful life, whichever is the shorter, using the straight line method. The estimated useful lives, residual values and depreciation method are reviewed at the end of each annual reporting period.
Depreciation on motor vehicles is calculated on a straight line basis over the term of the lease.
The depreciation rates applied to each of the asset classes are as follows:• Leasehold improvements, plant and equipment - 5% - 15% (2009: 5% - 15%)• Motor vehicles under lease - 33% (2009: 33%)
Notes to and forming part of the fi nancial report for the year ended 30 June 2010
44
(m) Intangible asset
Intangible asset represents identifi able non-monetary asset without physical substance.
Costs associated with the acquisition or development of computer software are capitalised and amortised on a straight linebasis over the expected useful life of the computer software. The useful lives range from 3 to 7 years (2009: 3 to 7 years).The amortisation period for an intangible asset is reviewed annually.
(n) Impairment of assets
Assets are assessed annually for indications of impairment except for fi nancial instrument assets and deferred tax assets.If there is an indication of impairment, the assets concerned are tested as to whether their carrying value exceeds theirrecoverable amount. Where an asset’s carrying value exceeds its recoverable amount, the difference is written-off by a chargeto the comprehensive income statement.
The recoverable amount for assets is measured at the higher of the present value of future cash fl ows expected to be obtained from the asset and fair value less costs to sell, where applicable.
(o) Leases
Leases are classifi ed as fi nance leases whenever the terms of the lease transfer substantially all the risks and rewards of ownership to the lessee. All other leases are classifi ed as operating leases.
Finance leases are capitalised at fair value, or if lower, at the present value of the minimum lease payments. A lease liability of equal value is also recognised. Lease payments are allocated between the principal component of the lease liability and the interest expense. Finance leases assets are amortised on a straight line basis over the term of the lease.
Operating lease payments are charged as an expense in the comprehensive income statement on a straight-line basis over the lease term.
(p) Dividends
In accordance with section 29B of the Transport Accident Act 1986, the TAC is required to pay to the Victorian State Government,a dividend as determined by the Treasurer.
An obligation to pay a dividend only arises after a formal determination is made by the Treasurer following consultation between the TAC, the Minister for Finance, WorkCover and the Transport Accident Commission and the Treasurer.
(q) Income tax
In accordance with section 88 (3D) of the State Owned Enterprises Act 1992, the TAC is required to pay income tax equivalent under the National Tax Equivalent Regime (NTER).
The income tax expense represents the tax payable on the current year’s taxable income based on the prevailing income tax rate adjusted for changes in deferred tax assets and liabilities.
Deferred tax is accounted for using the balance sheet liability method in respect of temporary differences arising from differences between the carrying amount of assets and liabilities in the fi nancial statements and the corresponding tax base of those items. Deferred tax assets and liabilities are recognised for temporary differences at the tax rates that are expected to apply when the assets and liabilities are realised or settled, based on tax rates that have been enacted or substantially enacted by reporting date.
Notes to and forming part of the fi nancial report for the year ended 30 June 2010
45
Deferred tax assets are recognised to the extent that it is probable that suffi cient taxable amounts will be available against which deductible temporary differences or unused tax losses and tax offsets can be utilised. However, deferred tax assets and liabilities are not recognised if the temporary differences giving rise to them arise from the initial recognition of assets and liabilities which affect neither taxable income nor accounting profi t.
The carrying amount of deferred tax assets is reviewed at each balance sheet date and reduced to the extent that it is no longer probable that suffi cient taxable profi t will be available to allow all or part of the deferred tax asset to be utilised.
Deferred tax assets and liabilities are offset as the TAC settles its current tax assets and liabilities on a net basis.
(r) Motorcycle Road Safety Reserve
The TAC premiums for certain motorcycle classes include an additional levy collected annually to fund special projects to improve motorcycle road safety in Victoria. These monies are set aside in the Motorcycle Road Safety Reserve specifi cally set up for this program. The program expenditure is developed by the Victorian Motorcycle Advisory Council (made up of representatives from the State’s main road safety agencies, the RACV and motorcyclist interest groups) and administered by VicRoads which seeks reimbursement for expenditure from the TAC.
(s) Goods and services tax
Revenues, expenses and assets are recognised net of the amount of goods and services tax (GST), except where the amount of GST incurred is not recoverable from the Australian Taxation Offi ce (ATO). In these circumstances the GST is recognised as part of the cost of acquisition of the asset or as part of expense. Receivables and payables are stated inclusive of GST.
The net amount of GST recoverable from, or payable to, the ATO is included as part of receivables or payables in the balance sheet.
Cash fl ows are included in the cash fl ow statement of cash fl ows on a gross basis. The GST component of cash fl ows arising from investing and fi nancing activities, which is recoverable from, or payable to, the ATO are classifi ed as operating cash fl ows.
(t) Commitments
Commitments include operating and capital expenditure commitments arising from non-cancellable contractual sources and are disclosed at their nominal value.
(u) Rounding
Amounts have been rounded to the nearest thousand dollars unless otherwise stated.
(v) Comparative fi gures
Where necessary, comparative fi gures have been adjusted to conform with changes in presentation in the current year in accordance with the accounting standards.
(w) Functional and presentation currency
The functional currency of the TAC is the Australian dollar, which has also been identifi ed as the presentation currency of the TAC.
Notes to and forming part of the fi nancial report for the year ended 30 June 2010
46
2. ACTUARIAL ASSUMPTIONS AND METHODS
The TAC operates the Victorian transport accident compensation scheme which is long tail in nature, meaning that claims are typically settled more than one year after being reported.
Signifi cant estimates and judgements are made by the TAC valuation actuary in respect of certain key asset and liability amounts disclosed in the fi nancial statements. These estimates and judgements are continually being evaluated and are based on historical experience, as well as enhancements to actuarial modelling techniques. The key areas of signifi cant estimates and judgements and the methodologies used to determine key assumptions are set out below.
Provision is made at the year end for the estimated cost of claims incurred but not settled at the balance sheet date, including the cost of claims incurred but not reported to the TAC.
The estimation of outstanding claims liabilities is based largely on the assumption that past developments are an appropriate predictor of the future and involves a variety of actuarial techniques that analyse experience, trends and other relevant factors.The process commences with the actuarial projection of the future claims payments and claims handling costs incurred to reporting date. Each benefi t type is usually examined separately.
Actuarial techniques used to analyse and project the various benefi t types, include:
• Payments per claim incurred (PPCI)• Payments per active claim (PPAC)• Payments per claim settled (PPCS)• Annuity based individual claim models (ICM)• Infl ation adjusted chain ladder method (CLM)
Projected future claims payments and associated claims handling costs are discounted to a present value as required using appropriate risk free discount rates (i.e. rates set with reference to Commonwealth Government Securities). A projection of future claims payments is undertaken separately of both gross claims payments and recoveries.
This projection is made without bias toward over or under estimation. As such, the resulting estimate is considered to be a net central estimate of outstanding claims liabilities that has an approximately equal chance of proving adequate or inadequate. Where possible and appropriate, multiple actuarial methods will be applied to project future claims payments. This assists in providing a greater understanding of the trends inherent in the past data. The projections obtained from various methods also assist in setting the range of possible outcomes. The most appropriate method, or even a combination of methods, is selected taking into account the characteristics of each benefi t type and the extent of the development of each past accident period.
Large claims impacting each relevant benefi t type are generally assessed separately, being measured on a case by case basisor projected separately in order to allow for the possible distortive effect of the development and incidence of these large claims.
The fi nal provision is then obtained by examining the results from the above methods and using judgement to combine them in varying proportions according to injury period.
Notes to and forming part of the fi nancial report for the year ended 30 June 2010
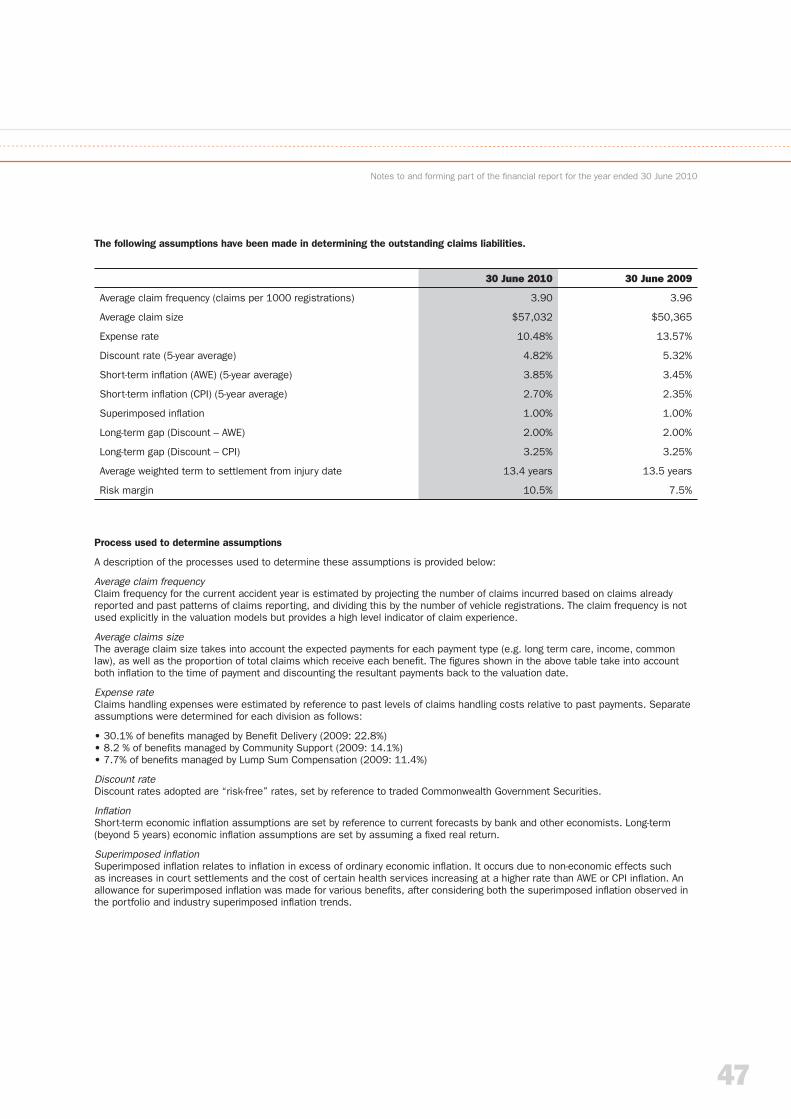
47
Process used to determine assumptions
A description of the processes used to determine these assumptions is provided below:
Average claim frequencyClaim frequency for the current accident year is estimated by projecting the number of claims incurred based on claims already reported and past patterns of claims reporting, and dividing this by the number of vehicle registrations. The claim frequency is not used explicitly in the valuation models but provides a high level indicator of claim experience.
Average claims sizeThe average claim size takes into account the expected payments for each payment type (e.g. long term care, income, common law), as well as the proportion of total claims which receive each benefi t. The fi gures shown in the above table take into account both infl ation to the time of payment and discounting the resultant payments back to the valuation date.
Expense rateClaims handling expenses were estimated by reference to past levels of claims handling costs relative to past payments. Separate assumptions were determined for each division as follows:
• 30.1% of benefi ts managed by Benefi t Delivery (2009: 22.8%)• 8.2 % of benefi ts managed by Community Support (2009: 14.1%)• 7.7% of benefi ts managed by Lump Sum Compensation (2009: 11.4%)
Discount rateDiscount rates adopted are “risk-free” rates, set by reference to traded Commonwealth Government Securities.
Infl ationShort-term economic infl ation assumptions are set by reference to current forecasts by bank and other economists. Long-term (beyond 5 years) economic infl ation assumptions are set by assuming a fi xed real return.
Superimposed infl ationSuperimposed infl ation relates to infl ation in excess of ordinary economic infl ation. It occurs due to non-economic effects such as increases in court settlements and the cost of certain health services increasing at a higher rate than AWE or CPI infl ation. An allowance for superimposed infl ation was made for various benefi ts, after considering both the superimposed infl ation observed in the portfolio and industry superimposed infl ation trends.
The following assumptions have been made in determining the outstanding claims liabilities.
Notes to and forming part of the fi nancial report for the year ended 30 June 2010
30 June 2010 30 June 2009
Average claim frequency (claims per 1000 registrations) 3.90 3.96
Average claim size $57,032 $50,365
Expense rate 10.48% 13.57%
Discount rate (5-year average) 4.82% 5.32%
Short-term infl ation (AWE) (5-year average) 3.85% 3.45%
Short-term infl ation (CPI) (5-year average) 2.70% 2.35%
Superimposed infl ation 1.00% 1.00%
Long-term gap (Discount – AWE) 2.00% 2.00%
Long-term gap (Discount – CPI) 3.25% 3.25%
Average weighted term to settlement from injury date 13.4 years 13.5 years
Risk margin 10.5% 7.5%
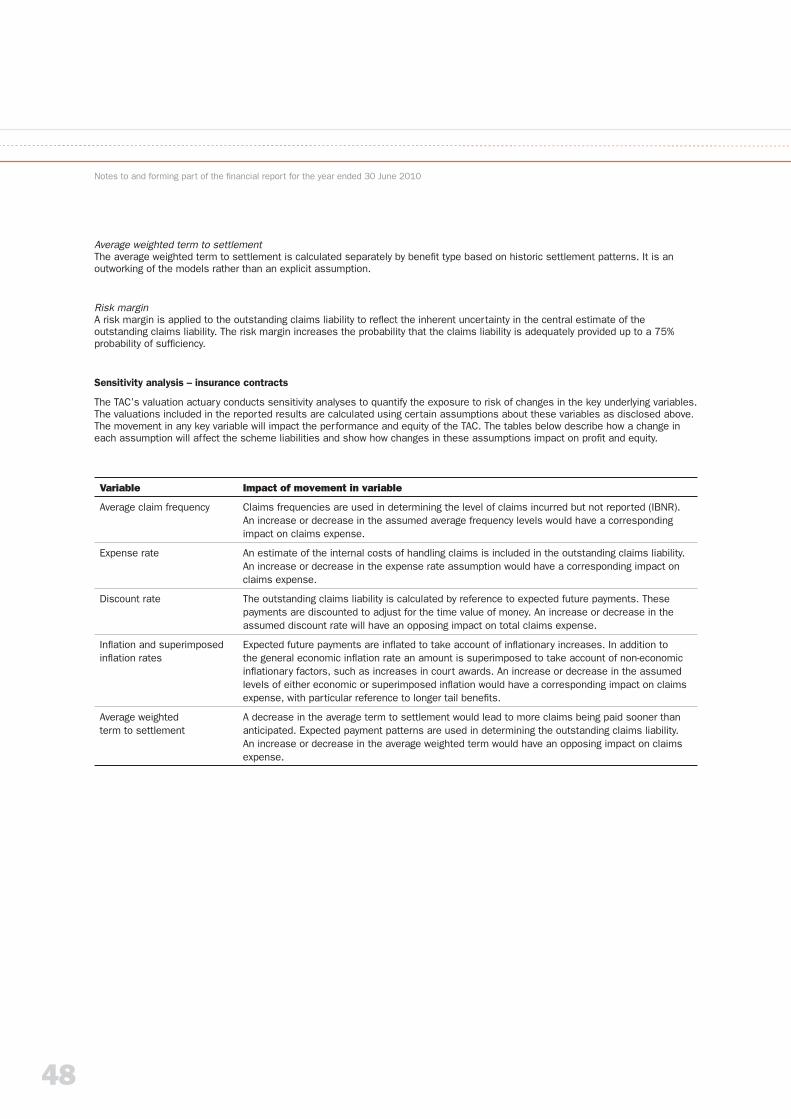
48
Average weighted term to settlementThe average weighted term to settlement is calculated separately by benefi t type based on historic settlement patterns. It is an outworking of the models rather than an explicit assumption.
Risk marginA risk margin is applied to the outstanding claims liability to refl ect the inherent uncertainty in the central estimate of the outstanding claims liability. The risk margin increases the probability that the claims liability is adequately provided up to a 75% probability of suffi ciency.
Sensitivity analysis – insurance contracts
The TAC’s valuation actuary conducts sensitivity analyses to quantify the exposure to risk of changes in the key underlying variables. The valuations included in the reported results are calculated using certain assumptions about these variables as disclosed above. The movement in any key variable will impact the performance and equity of the TAC. The tables below describe how a change in each assumption will affect the scheme liabilities and show how changes in these assumptions impact on profi t and equity.
Notes to and forming part of the fi nancial report for the year ended 30 June 2010
Variable Impact of movement in variable
Average claim frequency Claims frequencies are used in determining the level of claims incurred but not reported (IBNR).An increase or decrease in the assumed average frequency levels would have a corresponding impact on claims expense.
Expense rate An estimate of the internal costs of handling claims is included in the outstanding claims liability. An increase or decrease in the expense rate assumption would have a corresponding impact on claims expense.
Discount rate The outstanding claims liability is calculated by reference to expected future payments. These payments are discounted to adjust for the time value of money. An increase or decrease in the assumed discount rate will have an opposing impact on total claims expense.
Infl ation and superimposed infl ation rates
Expected future payments are infl ated to take account of infl ationary increases. In addition to the general economic infl ation rate an amount is superimposed to take account of non-economic infl ationary factors, such as increases in court awards. An increase or decrease in the assumed levels of either economic or superimposed infl ation would have a corresponding impact on claims expense, with particular reference to longer tail benefi ts.
Average weightedterm to settlement
A decrease in the average term to settlement would lead to more claims being paid sooner than anticipated. Expected payment patterns are used in determining the outstanding claims liability. An increase or decrease in the average weighted term would have an opposing impact on claims expense.
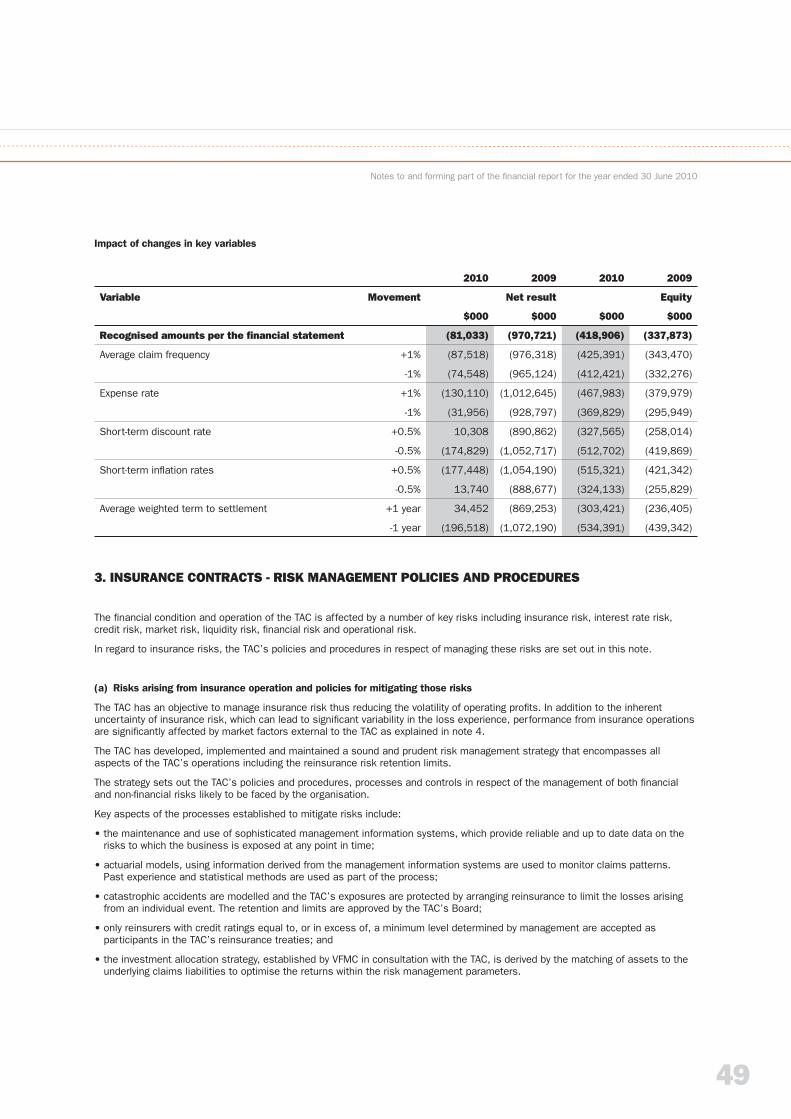
49
3. INSURANCE CONTRACTS - RISK MANAGEMENT POLICIES AND PROCEDURES
The fi nancial condition and operation of the TAC is affected by a number of key risks including insurance risk, interest rate risk, credit risk, market risk, liquidity risk, fi nancial risk and operational risk.
In regard to insurance risks, the TAC’s policies and procedures in respect of managing these risks are set out in this note.
(a) Risks arising from insurance operation and policies for mitigating those risks
The TAC has an objective to manage insurance risk thus reducing the volatility of operating profi ts. In addition to the inherent uncertainty of insurance risk, which can lead to signifi cant variability in the loss experience, performance from insurance operations are signifi cantly affected by market factors external to the TAC as explained in note 4.
The TAC has developed, implemented and maintained a sound and prudent risk management strategy that encompasses all aspects of the TAC’s operations including the reinsurance risk retention limits.
The strategy sets out the TAC’s policies and procedures, processes and controls in respect of the management of both fi nancial and non-fi nancial risks likely to be faced by the organisation.
Key aspects of the processes established to mitigate risks include:
• the maintenance and use of sophisticated management information systems, which provide reliable and up to date data on the risks to which the business is exposed at any point in time;
• actuarial models, using information derived from the management information systems are used to monitor claims patterns.Past experience and statistical methods are used as part of the process;
• catastrophic accidents are modelled and the TAC’s exposures are protected by arranging reinsurance to limit the losses arising from an individual event. The retention and limits are approved by the TAC’s Board;
• only reinsurers with credit ratings equal to, or in excess of, a minimum level determined by management are accepted as participants in the TAC’s reinsurance treaties; and
• the investment allocation strategy, established by VFMC in consultation with the TAC, is derived by the matching of assets to the underlying claims liabilities to optimise the returns within the risk management parameters.
Notes to and forming part of the fi nancial report for the year ended 30 June 2010
2010 2009 2010 2009
Variable Movement Net result Equity
$000 $000 $000 $000
Recognised amounts per the fi nancial statement (81,033) (970,721) (418,906) (337,873)
Average claim frequency +1% (87,518) (976,318) (425,391) (343,470)
-1% (74,548) (965,124) (412,421) (332,276)
Expense rate +1% (130,110) (1,012,645) (467,983) (379,979)
-1% (31,956) (928,797) (369,829) (295,949)
Short-term discount rate +0.5% 10,308 (890,862) (327,565) (258,014)
-0.5% (174,829) (1,052,717) (512,702) (419,869)
Short-term infl ation rates +0.5% (177,448) (1,054,190) (515,321) (421,342)
-0.5% 13,740 (888,677) (324,133) (255,829)
Average weighted term to settlement +1 year 34,452 (869,253) (303,421) (236,405)
-1 year (196,518) (1,072,190) (534,391) (439,342)
Impact of changes in key variables
50
Notes to and forming part of the fi nancial report for the year ended 30 June 2010
(b) Terms and conditions
The terms and conditions of the transport accident compensation scheme administered by the TAC are established under the Transport Accident Act 1986. The period of indemnity is generally 12 months.
Reinsurance contracts are negotiated and entered into annually to protect the TAC against large losses.
(c) Concentration of insurance risk
The TAC operates the Victorian transport accident compensation scheme. The TAC’s exposure to concentration of insurance risksis motor vehicles, trains and trams in metropolitan Melbourne.
(d) Interest rate risk
None of the fi nancial assets or liabilities arising from insurance or reinsurance contracts entered into by the TAC is directly exposed to interest rate risk.
(e) Credit risk
The TAC has no signifi cant concentrations of credit risk. Reinsurers with credit ratings equal to, or in excess of, a minimum level determined by management are accepted as participants in the TAC’s reinsurance contracts.
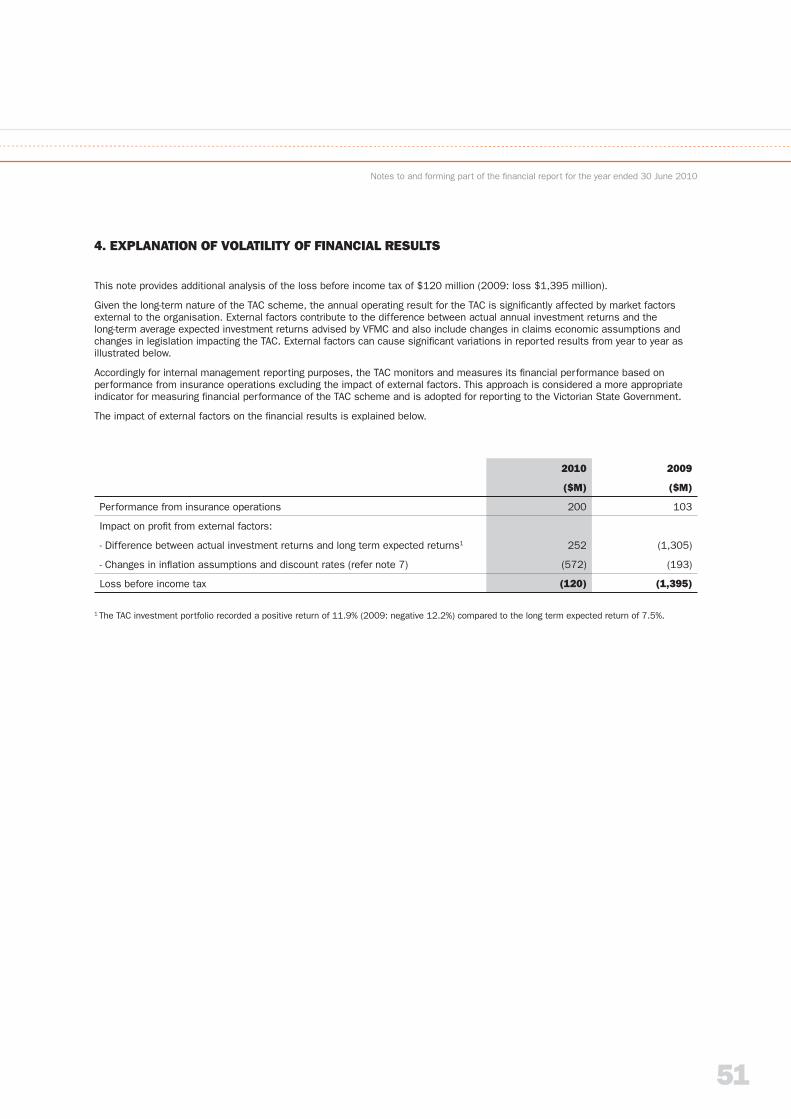
51
Notes to and forming part of the fi nancial report for the year ended 30 June 2010
4. EXPLANATION OF VOLATILITY OF FINANCIAL RESULTS
This note provides additional analysis of the loss before income tax of $120 million (2009: loss $1,395 million).
Given the long-term nature of the TAC scheme, the annual operating result for the TAC is signifi cantly affected by market factors external to the organisation. External factors contribute to the difference between actual annual investment returns and the long-term average expected investment returns advised by VFMC and also include changes in claims economic assumptions and changes in legislation impacting the TAC. External factors can cause signifi cant variations in reported results from year to year as illustrated below.
Accordingly for internal management reporting purposes, the TAC monitors and measures its fi nancial performance based on performance from insurance operations excluding the impact of external factors. This approach is considered a more appropriate indicator for measuring fi nancial performance of the TAC scheme and is adopted for reporting to the Victorian State Government.
The impact of external factors on the fi nancial results is explained below.
2010 2009
($M) ($M)
Performance from insurance operations 200 103
Impact on profi t from external factors:
- Difference between actual investment returns and long term expected returns1 252 (1,305)
- Changes in infl ation assumptions and discount rates (refer note 7) (572) (193)
Loss before income tax (120) (1,395)
1 The TAC investment portfolio recorded a positive return of 11.9% (2009: negative 12.2%) compared to the long term expected return of 7.5%.
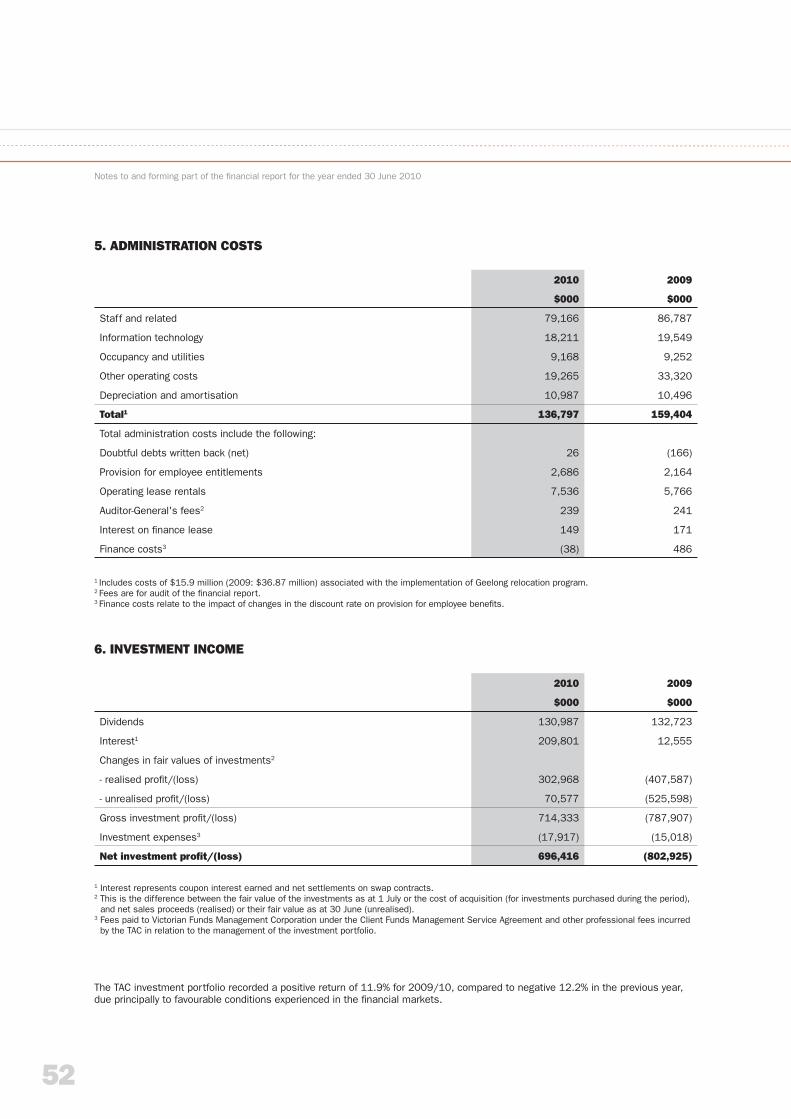
52
Notes to and forming part of the fi nancial report for the year ended 30 June 2010
2010 2009
$000 $000
Staff and related 79,166 86,787
Information technology 18,211 19,549
Occupancy and utilities 9,168 9,252
Other operating costs 19,265 33,320
Depreciation and amortisation 10,987 10,496
Total1 136,797 159,404
Total administration costs include the following:
Doubtful debts written back (net) 26 (166)
Provision for employee entitlements 2,686 2,164
Operating lease rentals 7,536 5,766
Auditor-General's fees2 239 241
Interest on fi nance lease 149 171
Finance costs3 (38) 486
2010 2009
$000 $000
Dividends 130,987 132,723
Interest1 209,801 12,555
Changes in fair values of investments2
- realised profi t/(loss) 302,968 (407,587)
- unrealised profi t/(loss) 70,577 (525,598)
Gross investment profi t/(loss) 714,333 (787,907)
Investment expenses3 (17,917) (15,018)
Net investment profi t/(loss) 696,416 (802,925)
1 Includes costs of $15.9 million (2009: $36.87 million) associated with the implementation of Geelong relocation program. 2 Fees are for audit of the fi nancial report.3 Finance costs relate to the impact of changes in the discount rate on provision for employee benefi ts.
1 Interest represents coupon interest earned and net settlements on swap contracts.2 This is the difference between the fair value of the investments as at 1 July or the cost of acquisition (for investments purchased during the period),
and net sales proceeds (realised) or their fair value as at 30 June (unrealised).3 Fees paid to Victorian Funds Management Corporation under the Client Funds Management Service Agreement and other professional fees incurred
by the TAC in relation to the management of the investment portfolio.
5. ADMINISTRATION COSTS
6. INVESTMENT INCOME
The TAC investment portfolio recorded a positive return of 11.9% for 2009/10, compared to negative 12.2% in the previous year, due principally to favourable conditions experienced in the fi nancial markets.
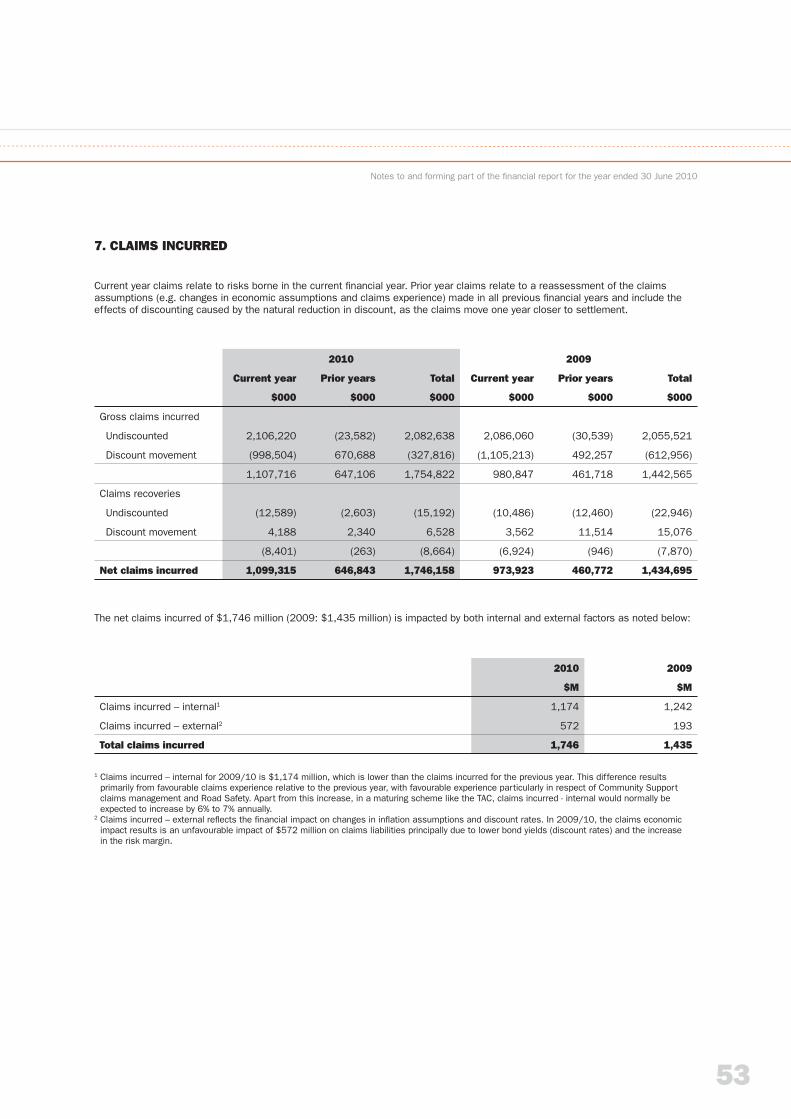
53
Notes to and forming part of the fi nancial report for the year ended 30 June 2010
2010 2009
Current year Prior years Total Current year Prior years Total
$000 $000 $000 $000 $000 $000
Gross claims incurred
Undiscounted 2,106,220 (23,582) 2,082,638 2,086,060 (30,539) 2,055,521
Discount movement (998,504) 670,688 (327,816) (1,105,213) 492,257 (612,956)
1,107,716 647,106 1,754,822 980,847 461,718 1,442,565
Claims recoveries
Undiscounted (12,589) (2,603) (15,192) (10,486) (12,460) (22,946)
Discount movement 4,188 2,340 6,528 3,562 11,514 15,076
(8,401) (263) (8,664) (6,924) (946) (7,870)
Net claims incurred 1,099,315 646,843 1,746,158 973,923 460,772 1,434,695
2010 2009
$M $M
Claims incurred – internal1 1,174 1,242
Claims incurred – external2 572 193
Total claims incurred 1,746 1,435
1 Claims incurred – internal for 2009/10 is $1,174 million, which is lower than the claims incurred for the previous year. This difference results primarily from favourable claims experience relative to the previous year, with favourable experience particularly in respect of Community Support claims management and Road Safety. Apart from this increase, in a maturing scheme like the TAC, claims incurred - internal would normally be expected to increase by 6% to 7% annually.
2 Claims incurred – external refl ects the fi nancial impact on changes in infl ation assumptions and discount rates. In 2009/10, the claims economic impact results is an unfavourable impact of $572 million on claims liabilities principally due to lower bond yields (discount rates) and the increasein the risk margin.
7. CLAIMS INCURRED
Current year claims relate to risks borne in the current fi nancial year. Prior year claims relate to a reassessment of the claims assumptions (e.g. changes in economic assumptions and claims experience) made in all previous fi nancial years and include the effects of discounting caused by the natural reduction in discount, as the claims move one year closer to settlement.
The net claims incurred of $1,746 million (2009: $1,435 million) is impacted by both internal and external factors as noted below:
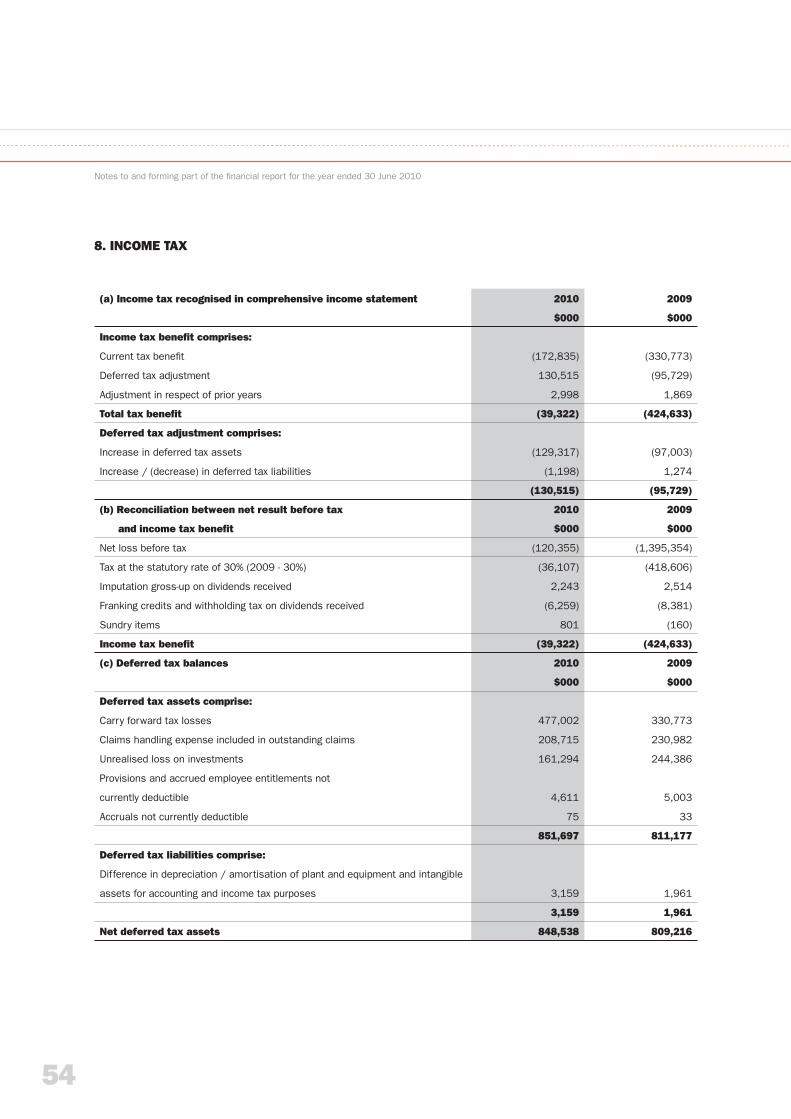
54
Notes to and forming part of the fi nancial report for the year ended 30 June 2010
(a) Income tax recognised in comprehensive income statement 2010 2009
$000 $000
Income tax benefi t comprises:
Current tax benefi t (172,835) (330,773)
Deferred tax adjustment 130,515 (95,729)
Adjustment in respect of prior years 2,998 1,869
Total tax benefi t (39,322) (424,633)
Deferred tax adjustment comprises:
Increase in deferred tax assets (129,317) (97,003)
Increase / (decrease) in deferred tax liabilities (1,198) 1,274
(130,515) (95,729)
(b) Reconciliation between net result before tax 2010 2009
and income tax benefi t $000 $000
Net loss before tax (120,355) (1,395,354)
Tax at the statutory rate of 30% (2009 - 30%) (36,107) (418,606)
Imputation gross-up on dividends received 2,243 2,514
Franking credits and withholding tax on dividends received (6,259) (8,381)
Sundry items 801 (160)
Income tax benefi t (39,322) (424,633)
(c) Deferred tax balances 2010 2009
$000 $000
Deferred tax assets comprise:
Carry forward tax losses 477,002 330,773
Claims handling expense included in outstanding claims 208,715 230,982
Unrealised loss on investments 161,294 244,386
Provisions and accrued employee entitlements not
currently deductible 4,611 5,003
Accruals not currently deductible 75 33
851,697 811,177
Deferred tax liabilities comprise:
Difference in depreciation / amortisation of plant and equipment and intangible
assets for accounting and income tax purposes 3,159 1,961
3,159 1,961
Net deferred tax assets 848,538 809,216
8. INCOME TAX
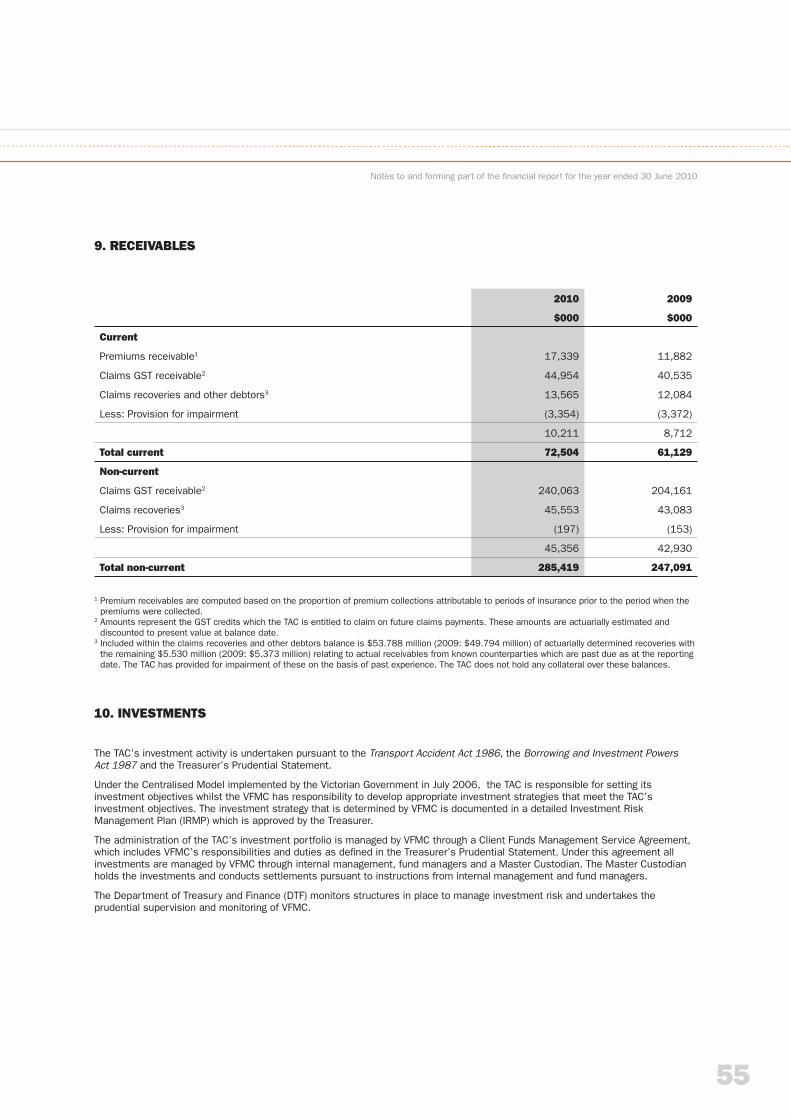
55
Notes to and forming part of the fi nancial report for the year ended 30 June 2010
2010 2009
$000 $000
Current
Premiums receivable1 17,339 11,882
Claims GST receivable2 44,954 40,535
Claims recoveries and other debtors3 13,565 12,084
Less: Provision for impairment (3,354) (3,372)
10,211 8,712
Total current 72,504 61,129
Non-current
Claims GST receivable2 240,063 204,161
Claims recoveries3 45,553 43,083
Less: Provision for impairment (197) (153)
45,356 42,930
Total non-current 285,419 247,091
9. RECEIVABLES
1 Premium receivables are computed based on the proportion of premium collections attributable to periods of insurance prior to the period when the premiums were collected.
2 Amounts represent the GST credits which the TAC is entitled to claim on future claims payments. These amounts are actuarially estimated and discounted to present value at balance date.
3 Included within the claims recoveries and other debtors balance is $53.788 million (2009: $49.794 million) of actuarially determined recoveries with the remaining $5.530 million (2009: $5.373 million) relating to actual receivables from known counterparties which are past due as at the reporting date. The TAC has provided for impairment of these on the basis of past experience. The TAC does not hold any collateral over these balances.
10. INVESTMENTS
The TAC’s investment activity is undertaken pursuant to the Transport Accident Act 1986, the Borrowing and Investment PowersAct 1987 and the Treasurer’s Prudential Statement.
Under the Centralised Model implemented by the Victorian Government in July 2006, the TAC is responsible for setting its investment objectives whilst the VFMC has responsibility to develop appropriate investment strategies that meet the TAC’s investment objectives. The investment strategy that is determined by VFMC is documented in a detailed Investment Risk Management Plan (IRMP) which is approved by the Treasurer.
The administration of the TAC’s investment portfolio is managed by VFMC through a Client Funds Management Service Agreement, which includes VFMC’s responsibilities and duties as defi ned in the Treasurer’s Prudential Statement. Under this agreement all investments are managed by VFMC through internal management, fund managers and a Master Custodian. The Master Custodian holds the investments and conducts settlements pursuant to instructions from internal management and fund managers.
The Department of Treasury and Finance (DTF) monitors structures in place to manage investment risk and undertakes the prudential supervision and monitoring of VFMC.
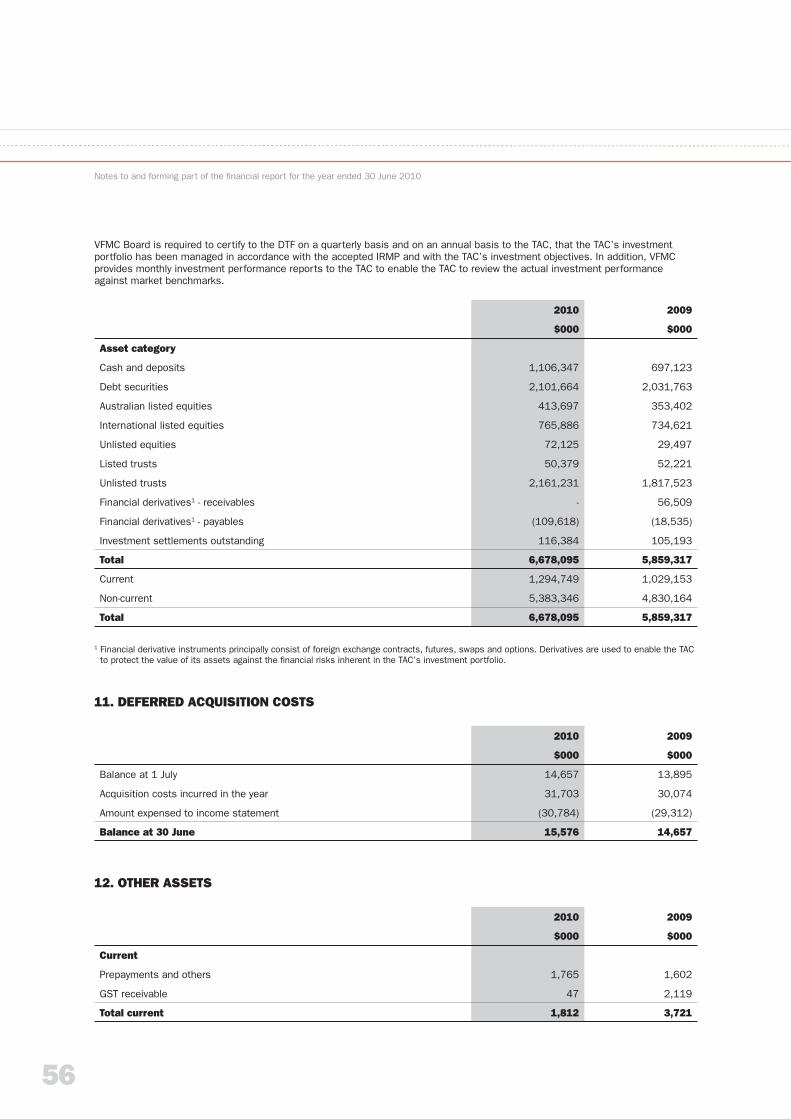
56
VFMC Board is required to certify to the DTF on a quarterly basis and on an annual basis to the TAC, that the TAC’s investment portfolio has been managed in accordance with the accepted IRMP and with the TAC’s investment objectives. In addition, VFMC provides monthly investment performance reports to the TAC to enable the TAC to review the actual investment performance against market benchmarks.
Notes to and forming part of the fi nancial report for the year ended 30 June 2010
2010 2009
$000 $000
Asset category
Cash and deposits 1,106,347 697,123
Debt securities 2,101,664 2,031,763
Australian listed equities 413,697 353,402
International listed equities 765,886 734,621
Unlisted equities 72,125 29,497
Listed trusts 50,379 52,221
Unlisted trusts 2,161,231 1,817,523
Financial derivatives1 - receivables - 56,509
Financial derivatives1 - payables (109,618) (18,535)
Investment settlements outstanding 116,384 105,193
Total 6,678,095 5,859,317
Current 1,294,749 1,029,153
Non-current 5,383,346 4,830,164
Total 6,678,095 5,859,317
2010 2009
$000 $000
Balance at 1 July 14,657 13,895
Acquisition costs incurred in the year 31,703 30,074
Amount expensed to income statement (30,784) (29,312)
Balance at 30 June 15,576 14,657
2010 2009
$000 $000
Current
Prepayments and others 1,765 1,602
GST receivable 47 2,119
Total current 1,812 3,721
1 Financial derivative instruments principally consist of foreign exchange contracts, futures, swaps and options. Derivatives are used to enable the TAC to protect the value of its assets against the fi nancial risks inherent in the TAC’s investment portfolio.
11. DEFERRED ACQUISITION COSTS
12. OTHER ASSETS
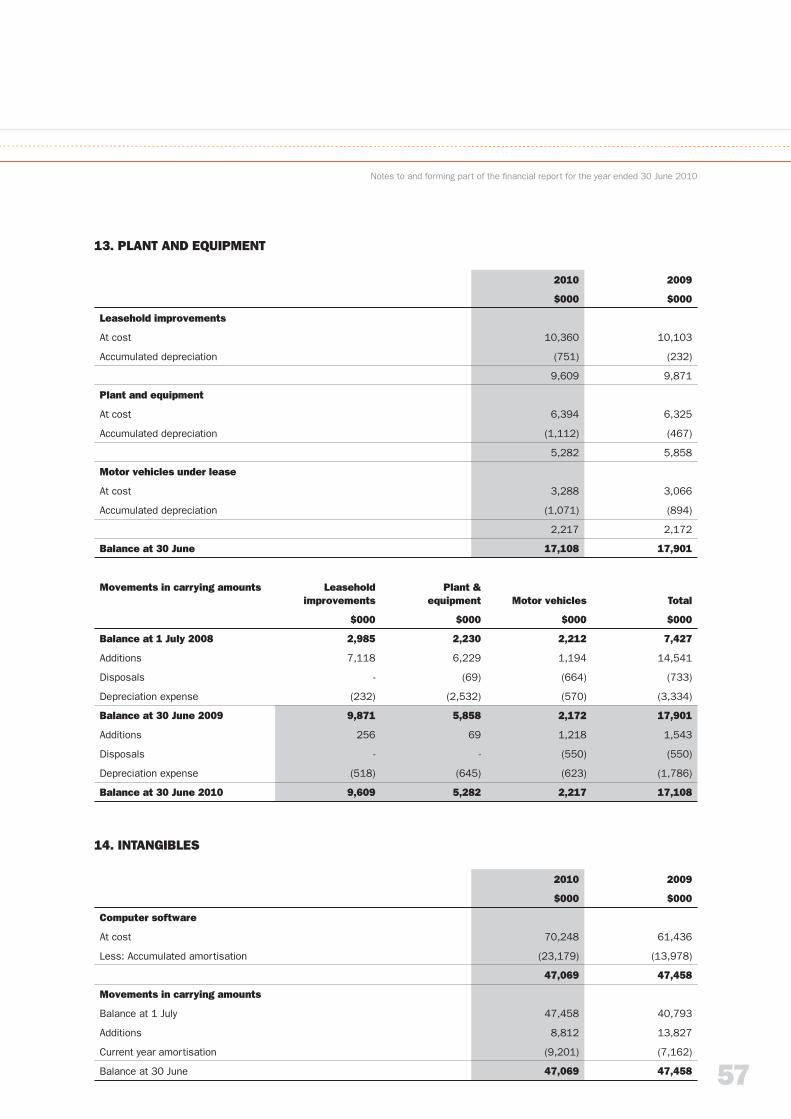
57
Notes to and forming part of the fi nancial report for the year ended 30 June 2010
2010 2009
$000 $000
Leasehold improvements
At cost 10,360 10,103
Accumulated depreciation (751) (232)
9,609 9,871
Plant and equipment
At cost 6,394 6,325
Accumulated depreciation (1,112) (467)
5,282 5,858
Motor vehicles under lease
At cost 3,288 3,066
Accumulated depreciation (1,071) (894)
2,217 2,172
Balance at 30 June 17,108 17,901
2010 2009
$000 $000
Computer software
At cost 70,248 61,436
Less: Accumulated amortisation (23,179) (13,978)
47,069 47,458
Movements in carrying amounts
Balance at 1 July 47,458 40,793
Additions 8,812 13,827
Current year amortisation (9,201) (7,162)
Balance at 30 June 47,069 47,458
Movements in carrying amounts Leasehold improvements
Plant &equipment Motor vehicles Total
$000 $000 $000 $000
Balance at 1 July 2008 2,985 2,230 2,212 7,427
Additions 7,118 6,229 1,194 14,541
Disposals - (69) (664) (733)
Depreciation expense (232) (2,532) (570) (3,334)
Balance at 30 June 2009 9,871 5,858 2,172 17,901
Additions 256 69 1,218 1,543
Disposals - - (550) (550)
Depreciation expense (518) (645) (623) (1,786)
Balance at 30 June 2010 9,609 5,282 2,217 17,108
13. PLANT AND EQUIPMENT
14. INTANGIBLES
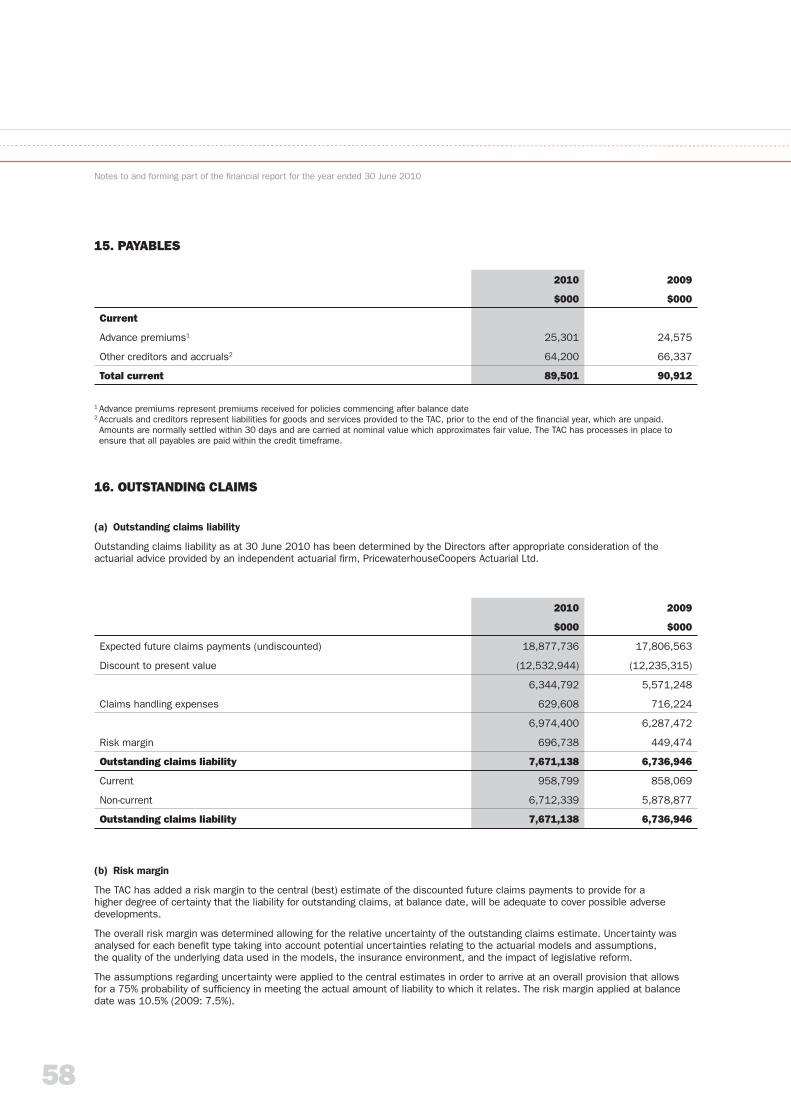
58
Notes to and forming part of the fi nancial report for the year ended 30 June 2010
2010 2009
$000 $000
Current
Advance premiums1 25,301 24,575
Other creditors and accruals2 64,200 66,337
Total current 89,501 90,912
2010 2009
$000 $000
Expected future claims payments (undiscounted) 18,877,736 17,806,563
Discount to present value (12,532,944) (12,235,315)
6,344,792 5,571,248
Claims handling expenses 629,608 716,224
6,974,400 6,287,472
Risk margin 696,738 449,474
Outstanding claims liability 7,671,138 6,736,946
Current 958,799 858,069
Non-current 6,712,339 5,878,877
Outstanding claims liability 7,671,138 6,736,946
15. PAYABLES
1 Advance premiums represent premiums received for policies commencing after balance date2 Accruals and creditors represent liabilities for goods and services provided to the TAC, prior to the end of the fi nancial year, which are unpaid. Amounts are normally settled within 30 days and are carried at nominal value which approximates fair value. The TAC has processes in place to ensure that all payables are paid within the credit timeframe.
16. OUTSTANDING CLAIMS
(a) Outstanding claims liability
Outstanding claims liability as at 30 June 2010 has been determined by the Directors after appropriate consideration of the actuarial advice provided by an independent actuarial fi rm, PricewaterhouseCoopers Actuarial Ltd.
(b) Risk margin
The TAC has added a risk margin to the central (best) estimate of the discounted future claims payments to provide for a higher degree of certainty that the liability for outstanding claims, at balance date, will be adequate to cover possible adverse developments.
The overall risk margin was determined allowing for the relative uncertainty of the outstanding claims estimate. Uncertainty was analysed for each benefi t type taking into account potential uncertainties relating to the actuarial models and assumptions,the quality of the underlying data used in the models, the insurance environment, and the impact of legislative reform.
The assumptions regarding uncertainty were applied to the central estimates in order to arrive at an overall provision that allowsfor a 75% probability of suffi ciency in meeting the actual amount of liability to which it relates. The risk margin applied at balance date was 10.5% (2009: 7.5%).
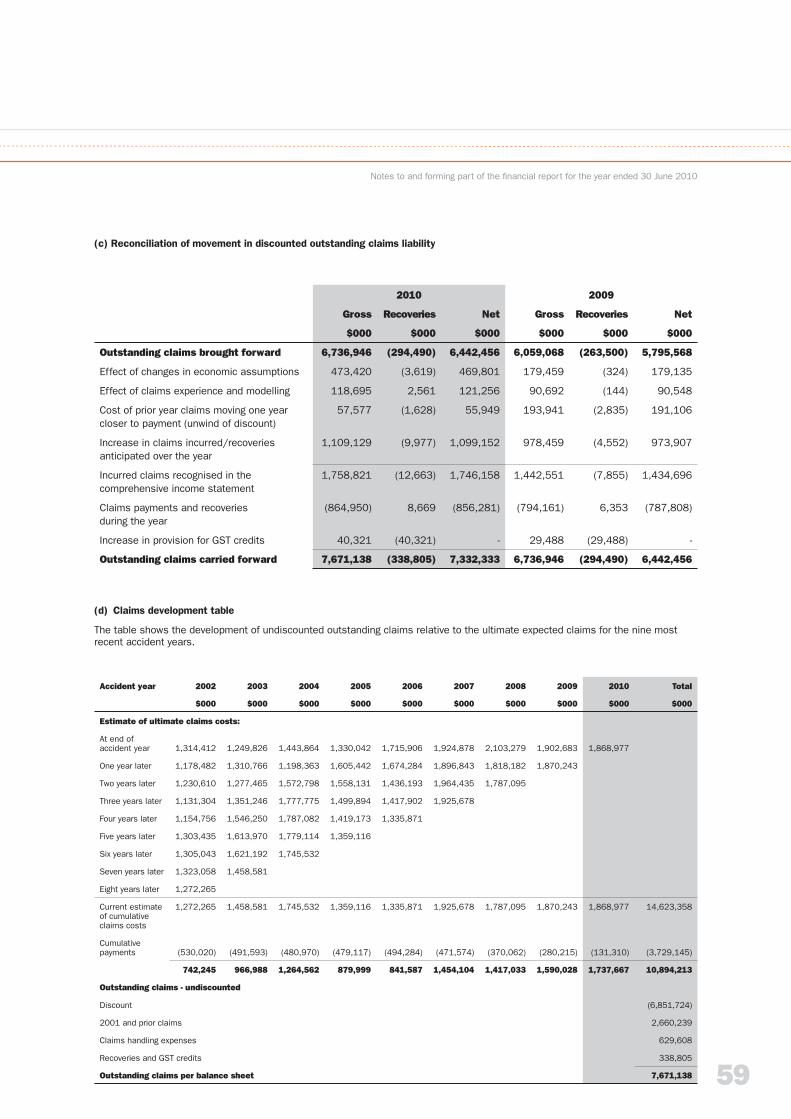
59
Notes to and forming part of the fi nancial report for the year ended 30 June 2010
(c) Reconciliation of movement in discounted outstanding claims liability
(d) Claims development table
The table shows the development of undiscounted outstanding claims relative to the ultimate expected claims for the nine most recent accident years.
2010 2009
Gross Recoveries Net Gross Recoveries Net
$000 $000 $000 $000 $000 $000
Outstanding claims brought forward 6,736,946 (294,490) 6,442,456 6,059,068 (263,500) 5,795,568
Effect of changes in economic assumptions 473,420 (3,619) 469,801 179,459 (324) 179,135
Effect of claims experience and modelling 118,695 2,561 121,256 90,692 (144) 90,548
Cost of prior year claims moving one year closer to payment (unwind of discount)
57,577 (1,628) 55,949 193,941 (2,835) 191,106
Increase in claims incurred/recoveries anticipated over the year
1,109,129 (9,977) 1,099,152 978,459 (4,552) 973,907
Incurred claims recognised in the comprehensive income statement
1,758,821 (12,663) 1,746,158 1,442,551 (7,855) 1,434,696
Claims payments and recoveriesduring the year
(864,950) 8,669 (856,281) (794,161) 6,353 (787,808)
Increase in provision for GST credits 40,321 (40,321) - 29,488 (29,488) -
Outstanding claims carried forward 7,671,138 (338,805) 7,332,333 6,736,946 (294,490) 6,442,456
Accident year 2002 2003 2004 2005 2006 2007 2008 2009 2010 Total
$000 $000 $000 $000 $000 $000 $000 $000 $000 $000
Estimate of ultimate claims costs:
At end of accident year 1,314,412 1,249,826 1,443,864 1,330,042 1,715,906 1,924,878 2,103,279 1,902,683 1,868,977
One year later 1,178,482 1,310,766 1,198,363 1,605,442 1,674,284 1,896,843 1,818,182 1,870,243
Two years later 1,230,610 1,277,465 1,572,798 1,558,131 1,436,193 1,964,435 1,787,095
Three years later 1,131,304 1,351,246 1,777,775 1,499,894 1,417,902 1,925,678
Four years later 1,154,756 1,546,250 1,787,082 1,419,173 1,335,871
Five years later 1,303,435 1,613,970 1,779,114 1,359,116
Six years later 1,305,043 1,621,192 1,745,532
Seven years later 1,323,058 1,458,581
Eight years later 1,272,265
Current estimate of cumulative claims costs
1,272,265 1,458,581 1,745,532 1,359,116 1,335,871 1,925,678 1,787,095 1,870,243 1,868,977 14,623,358
Cumulative payments (530,020) (491,593) (480,970) (479,117) (494,284) (471,574) (370,062) (280,215) (131,310) (3,729,145)
742,245 966,988 1,264,562 879,999 841,587 1,454,104 1,417,033 1,590,028 1,737,667 10,894,213
Outstanding claims - undiscounted
Discount (6,851,724)
2001 and prior claims 2,660,239
Claims handling expenses 629,608
Recoveries and GST credits 338,805
Outstanding claims per balance sheet 7,671,138
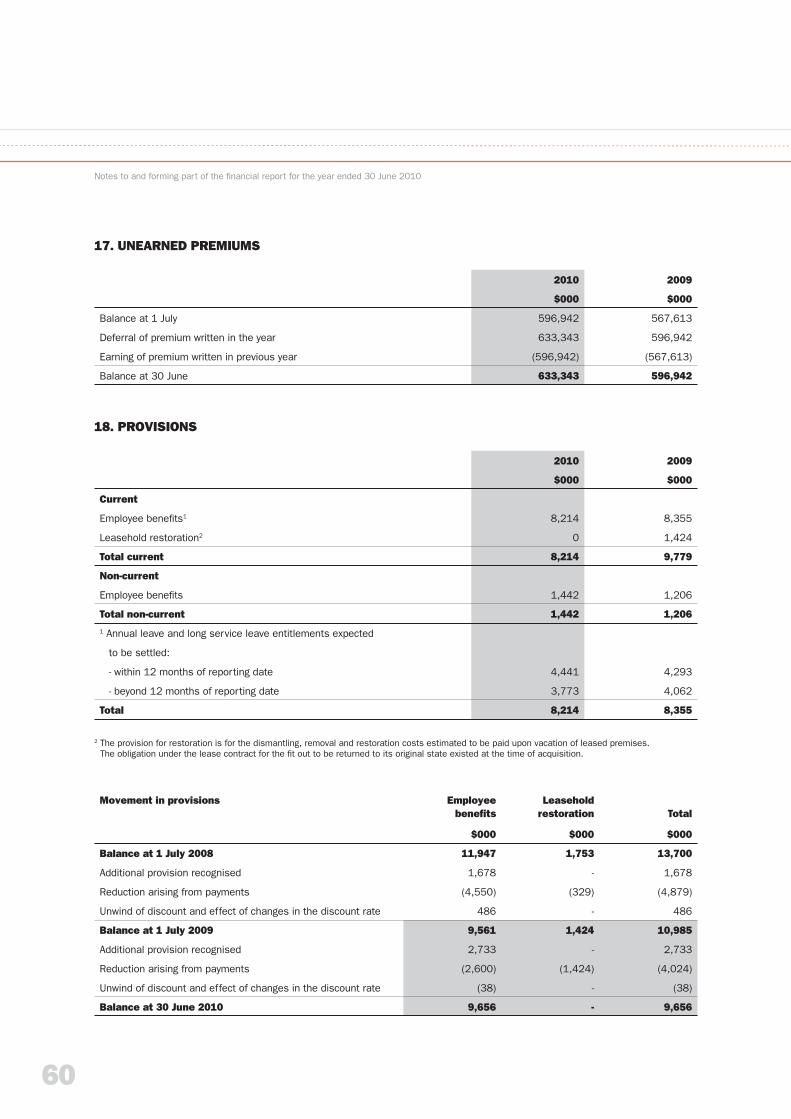
60
Notes to and forming part of the fi nancial report for the year ended 30 June 2010
2010 2009
$000 $000
Balance at 1 July 596,942 567,613
Deferral of premium written in the year 633,343 596,942
Earning of premium written in previous year (596,942) (567,613)
Balance at 30 June 633,343 596,942
Movement in provisions Employee benefi ts
$000
Leasehold restoration
$000
Total
$000
Balance at 1 July 2008 11,947 1,753 13,700
Additional provision recognised 1,678 - 1,678
Reduction arising from payments (4,550) (329) (4,879)
Unwind of discount and effect of changes in the discount rate 486 - 486
Balance at 1 July 2009 9,561 1,424 10,985
Additional provision recognised 2,733 - 2,733
Reduction arising from payments (2,600) (1,424) (4,024)
Unwind of discount and effect of changes in the discount rate (38) - (38)
Balance at 30 June 2010 9,656 - 9,656
2010 2009
$000 $000
Current
Employee benefi ts1 8,214 8,355
Leasehold restoration2 0 1,424
Total current 8,214 9,779
Non-current
Employee benefi ts 1,442 1,206
Total non-current 1,442 1,2061 Annual leave and long service leave entitlements expected
to be settled:
- within 12 months of reporting date 4,441 4,293
- beyond 12 months of reporting date 3,773 4,062
Total 8,214 8,355
17. UNEARNED PREMIUMS
18. PROVISIONS
2 The provision for restoration is for the dismantling, removal and restoration costs estimated to be paid upon vacation of leased premises.The obligation under the lease contract for the fi t out to be returned to its original state existed at the time of acquisition.
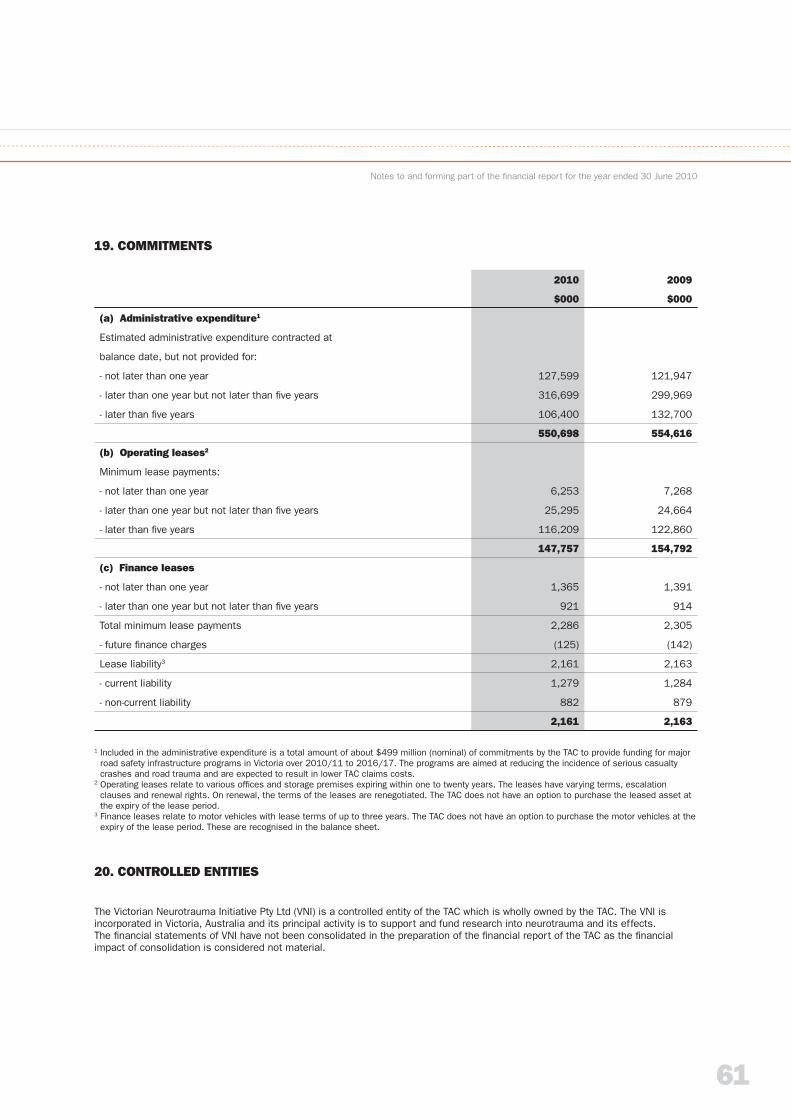
61
Notes to and forming part of the fi nancial report for the year ended 30 June 2010
2010 2009
$000 $000
(a) Administrative expenditure1
Estimated administrative expenditure contracted at
balance date, but not provided for:
- not later than one year 127,599 121,947
- later than one year but not later than fi ve years 316,699 299,969
- later than fi ve years 106,400 132,700
550,698 554,616
(b) Operating leases2
Minimum lease payments:
- not later than one year 6,253 7,268
- later than one year but not later than fi ve years 25,295 24,664
- later than fi ve years 116,209 122,860
147,757 154,792
(c) Finance leases
- not later than one year 1,365 1,391
- later than one year but not later than fi ve years 921 914
Total minimum lease payments 2,286 2,305
- future fi nance charges (125) (142)
Lease liability3 2,161 2,163
- current liability 1,279 1,284
- non-current liability 882 879
2,161 2,163
19. COMMITMENTS
1 Included in the administrative expenditure is a total amount of about $499 million (nominal) of commitments by the TAC to provide funding for major road safety infrastructure programs in Victoria over 2010/11 to 2016/17. The programs are aimed at reducing the incidence of serious casualty crashes and road trauma and are expected to result in lower TAC claims costs.
2 Operating leases relate to various offi ces and storage premises expiring within one to twenty years. The leases have varying terms, escalation clauses and renewal rights. On renewal, the terms of the leases are renegotiated. The TAC does not have an option to purchase the leased asset at the expiry of the lease period.
3 Finance leases relate to motor vehicles with lease terms of up to three years. The TAC does not have an option to purchase the motor vehicles at the expiry of the lease period. These are recognised in the balance sheet.
20. CONTROLLED ENTITIES
The Victorian Neurotrauma Initiative Pty Ltd (VNI) is a controlled entity of the TAC which is wholly owned by the TAC. The VNI is incorporated in Victoria, Australia and its principal activity is to support and fund research into neurotrauma and its effects.The fi nancial statements of VNI have not been consolidated in the preparation of the fi nancial report of the TAC as the fi nancial impact of consolidation is considered not material.
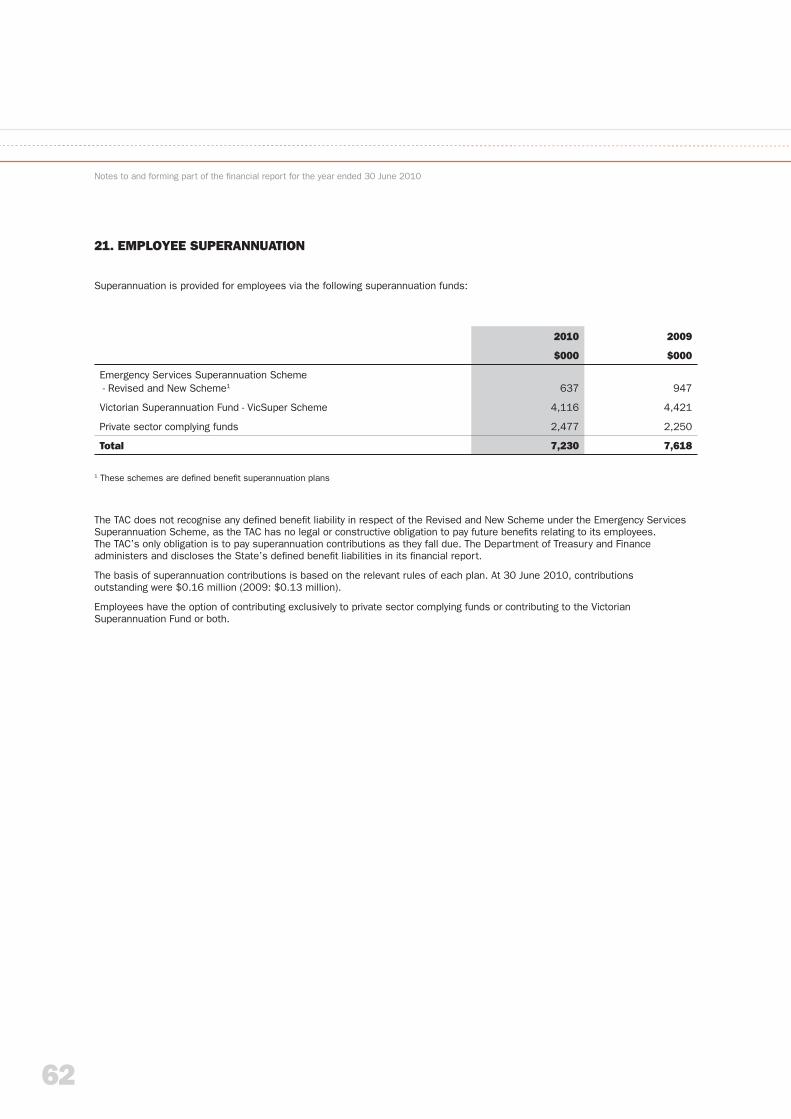
62
Notes to and forming part of the fi nancial report for the year ended 30 June 2010
21. EMPLOYEE SUPERANNUATION
Superannuation is provided for employees via the following superannuation funds:
The TAC does not recognise any defi ned benefi t liability in respect of the Revised and New Scheme under the Emergency Services Superannuation Scheme, as the TAC has no legal or constructive obligation to pay future benefi ts relating to its employees.The TAC’s only obligation is to pay superannuation contributions as they fall due. The Department of Treasury and Finance administers and discloses the State’s defi ned benefi t liabilities in its fi nancial report.
The basis of superannuation contributions is based on the relevant rules of each plan. At 30 June 2010, contributionsoutstanding were $0.16 million (2009: $0.13 million).
Employees have the option of contributing exclusively to private sector complying funds or contributing to the Victorian Superannuation Fund or both.
2010 2009
$000 $000
Emergency Services Superannuation Scheme - Revised and New Scheme1 637 947
Victorian Superannuation Fund - VicSuper Scheme 4,116 4,421
Private sector complying funds 2,477 2,250
Total 7,230 7,618
1 These schemes are defi ned benefi t superannuation plans
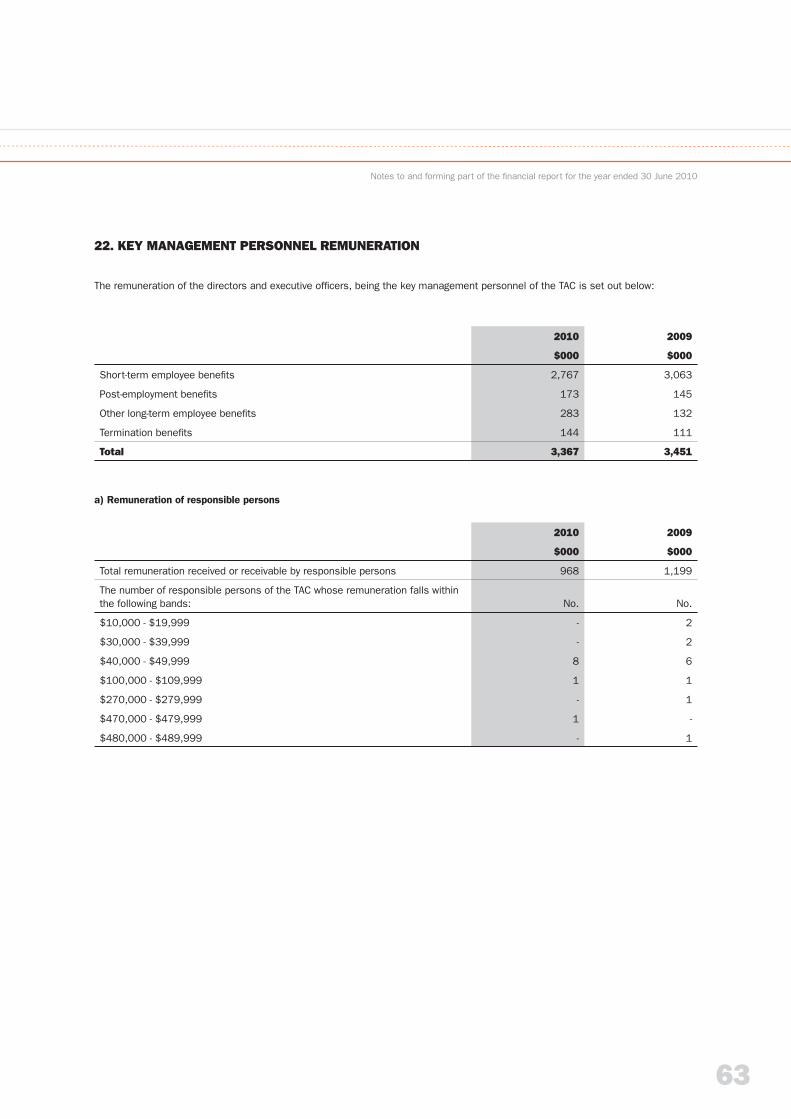
63
Notes to and forming part of the fi nancial report for the year ended 30 June 2010
22. KEY MANAGEMENT PERSONNEL REMUNERATION
The remuneration of the directors and executive offi cers, being the key management personnel of the TAC is set out below:
a) Remuneration of responsible persons
2010 2009
$000 $000
Short-term employee benefi ts 2,767 3,063
Post-employment benefi ts 173 145
Other long-term employee benefi ts 283 132
Termination benefi ts 144 111
Total 3,367 3,451
2010 2009
$000 $000
Total remuneration received or receivable by responsible persons 968 1,199
The number of responsible persons of the TAC whose remuneration falls within the following bands: No. No.
$10,000 - $19,999 - 2
$30,000 - $39,999 - 2
$40,000 - $49,999 8 6
$100,000 - $109,999 1 1
$270,000 - $279,999 - 1
$470,000 - $479,999 1 -
$480,000 - $489,999 - 1
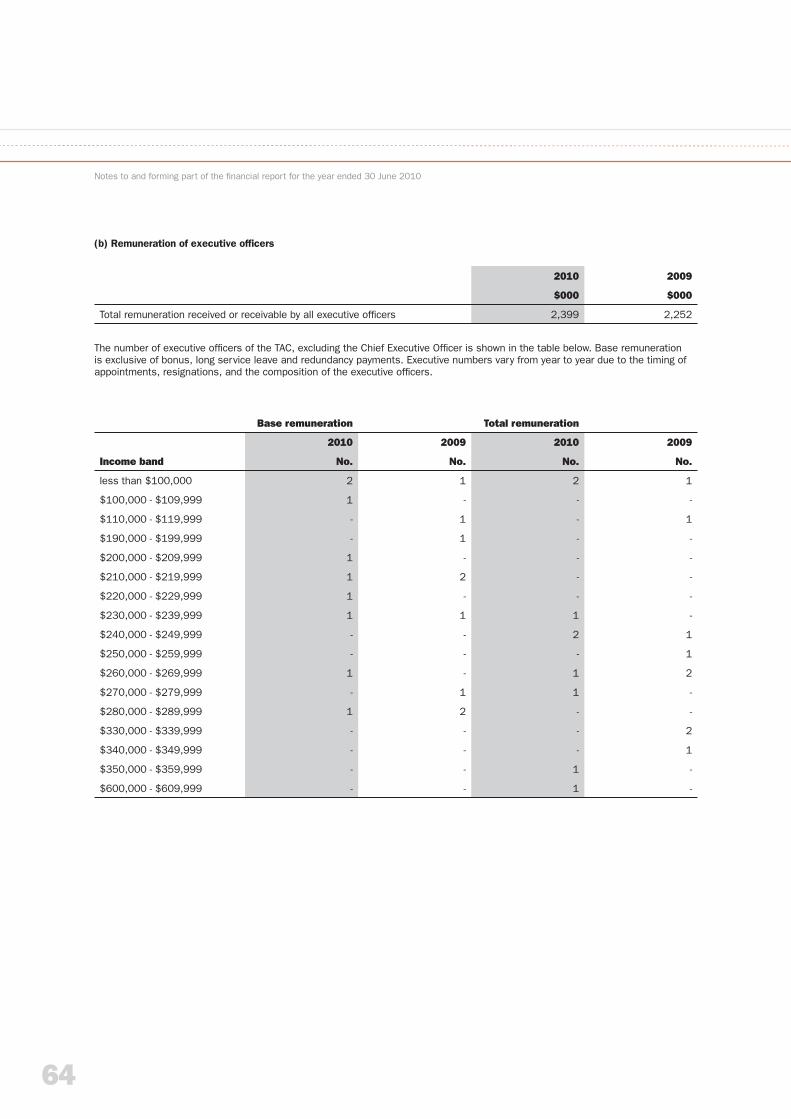
64
Notes to and forming part of the fi nancial report for the year ended 30 June 2010
(b) Remuneration of executive offi cers
The number of executive offi cers of the TAC, excluding the Chief Executive Offi cer is shown in the table below. Base remuneration is exclusive of bonus, long service leave and redundancy payments. Executive numbers vary from year to year due to the timing of appointments, resignations, and the composition of the executive offi cers.
2010 2009
$000 $000
Total remuneration received or receivable by all executive offi cers 2,399 2,252
Base remuneration Total remuneration
2010 2009 2010 2009
Income band No. No. No. No.
less than $100,000 2 1 2 1
$100,000 - $109,999 1 - - -
$110,000 - $119,999 - 1 - 1
$190,000 - $199,999 - 1 - -
$200,000 - $209,999 1 - - -
$210,000 - $219,999 1 2 - -
$220,000 - $229,999 1 - - -
$230,000 - $239,999 1 1 1 -
$240,000 - $249,999 - - 2 1
$250,000 - $259,999 - - - 1
$260,000 - $269,999 1 - 1 2
$270,000 - $279,999 - 1 1 -
$280,000 - $289,999 1 2 - -
$330,000 - $339,999 - - - 2
$340,000 - $349,999 - - - 1
$350,000 - $359,999 - - 1 -
$600,000 - $609,999 - - 1 -
65
Notes to and forming part of the fi nancial report for the year ended 30 June 2010
23. RESPONSIBLE PERSON-RELATED DISCLOSURES
In accordance with the Ministerial Directions issued by the Minister for Finance under the Financial Management Act 1994,the responsible persons who held offi ce during the fi nancial year were The Honourable Tim Holding MP, Minister for Finance, WorkCover and the Transport Accident Commission and the following responsible persons:
Directors:Mr Paul Barker (Chairman)Dr Julie Caldecott Mr Andrew DyerMr Geoff Hilton Ms Christine McLoughlinProfessor Robert Offi cer Ms Sonia Petering Ms Elana Rubin Ms Maria Wilton
Chief Executive Offi cer:Ms Janet Dore
Related party transactions
There are no transactions with responsible persons and responsible person-related parties requiring disclosure under the Directionsof the Minister for Finance.
Other payments
The following payments are also noted, although they are not considered to be responsible person related party transactions for the purpose of Ministerial Directions under the Financial Management Act 1994. Dr Julie Caldecott is a director of the Royal Children’s Hospital which received project funding from the TAC during the year on normal commercial terms and conditions.
Ms Christine McLoughlin is a council member of Chief Executive Women Inc. which has provided services to the TAC during the year on normal commercial terms and conditions.
Professor Robert Offi cer is a director of the Personal Injury Education Foundation (PIEF), which has provided services to the TAC during the year on normal commercial terms and conditions. In addition, the TAC is a member of PIEF and has paid membership fees to PIEF during the year.
Mr Paul Barker, Mr Geoff Hilton and Ms Elana Rubin are directors of the Victorian WorkCover Authority (WorkSafe), which is entitled to recover from the TAC under the Accident Compensation Act 1985, all compensation payable under the WorkCover scheme for injury in a transport accident during the course of work. In addition, the TAC has also made payments to the WorkSafe as reimbursement for external services jointly acquired by the TAC and the WorkSafe, and payments for the provision of services by the WorkSafe to the TAC, on normal commercial terms and conditions.
Other transactions
Other related transactions requiring disclosure under the Directions of the Minister for Finance have been considered and there are no matters to report.
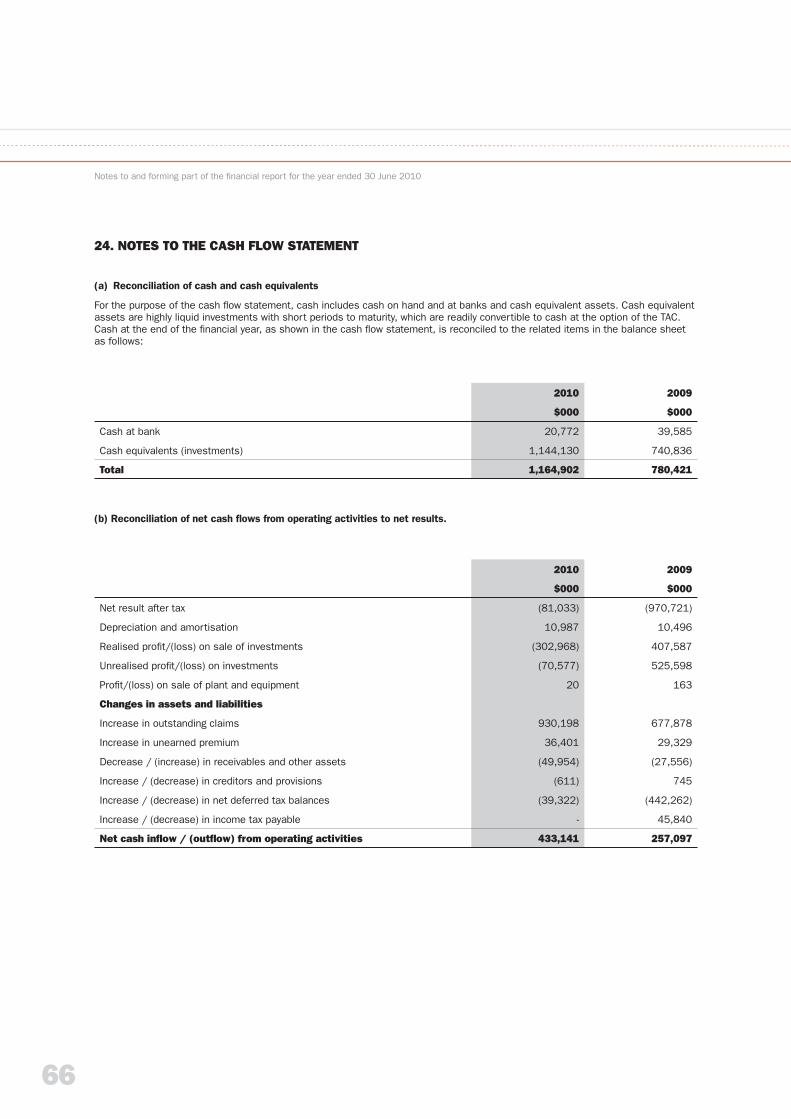
66
24. NOTES TO THE CASH FLOW STATEMENT
(a) Reconciliation of cash and cash equivalents
For the purpose of the cash fl ow statement, cash includes cash on hand and at banks and cash equivalent assets. Cash equivalent assets are highly liquid investments with short periods to maturity, which are readily convertible to cash at the option of the TAC. Cash at the end of the fi nancial year, as shown in the cash fl ow statement, is reconciled to the related items in the balance sheet as follows:
(b) Reconciliation of net cash fl ows from operating activities to net results.
Notes to and forming part of the fi nancial report for the year ended 30 June 2010
2010 2009
$000 $000
Cash at bank 20,772 39,585
Cash equivalents (investments) 1,144,130 740,836
Total 1,164,902 780,421
2010 2009
$000 $000
Net result after tax (81,033) (970,721)
Depreciation and amortisation 10,987 10,496
Realised profi t/(loss) on sale of investments (302,968) 407,587
Unrealised profi t/(loss) on investments (70,577) 525,598
Profi t/(loss) on sale of plant and equipment 20 163
Changes in assets and liabilities
Increase in outstanding claims 930,198 677,878
Increase in unearned premium 36,401 29,329
Decrease / (increase) in receivables and other assets (49,954) (27,556)
Increase / (decrease) in creditors and provisions (611) 745
Increase / (decrease) in net deferred tax balances (39,322) (442,262)
Increase / (decrease) in income tax payable - 45,840
Net cash infl ow / (outfl ow) from operating activities 433,141 257,097
67
25. FINANCIAL INSTRUMENTS
The TAC’s fi nancial assets and liabilities are exposed to a variety of fi nancial risks: market risk, credit risk and liquidity risk. VFMC uses different methods to measure different types of risk to which the TAC’s investment portfolio is exposed. These methods include sensitivity analysis in the case of interest rate, foreign exchange and other price risks, and credit rating for credit risk.
Market risk
Market risk is the risk that the fair value of future cash fl ows of a fi nancial instrument will fl uctuate because of changes in market prices. Market risk comprises three types of risk: market interest rates (interest rate risk), foreign exchange (currency risk),and market prices (price risk).
VFMC manages market risk by seeking input from the TAC’s actuaries to ensure the investment mix is appropriate to service future liabilities and that projected outcomes are in line with the TAC’s overall investment objectives and remain within the risk parameters approved by the Treasurer.
For the sensitivity analysis of each type of market risk, the percentage change used for each of the variables has been determined by the TAC as at 30 June 2010 and 30 June 2009, in consultation with VFMC.
(a) Interest rate risk
Interest rate risk is the risk that the fair value or future cash fl ows of a fi nancial instrument will fl uctuate because of changes in market interest rates.
The signifi cant accounting policies (Note 1) describe the policies used to measure and report the assets and liabilities of the TAC. Where the applicable fair value is determined by discounting future cash fl ows, movements in interest rates will result in a reported unrealised gain or loss in the operating statement.
VFMC manages interest rate risk through an asset allocation strategy for the TAC’s investment portfolio, which acts as an economic hedge against the insurance liabilities of the TAC. To the extent that these assets and liabilities can be matched, unrealised gains and losses on re-measurement of liabilities resulting from interest rate movements will be offset by unrealised losses or gains on re-measurement of investment assets.
VFMC uses derivatives to manage the interest rate risk on interest rate sensitive assets. Interest rate swap contracts and forward rate agreements are used to either change the interest rate risk between fi xed and fl oating rates of interest or between different fl oating rates of interest.
Interest rate swaps Interest rate swaps allow VFMC to swap fl oating rate investments into fi xed rates and vice versa. The settlement dates coincide with the dates on which interest is payable on the underlying debt.
Contracts normally involve quarterly payment or receipt of the net amount of interest. The unrealised profi t/(loss) on the swaps in the portfolio at 30 June 2010 was $54.9 million (2009: unrealised loss $18.5 million).
Notes to and forming part of the fi nancial report for the year ended 30 June 2010
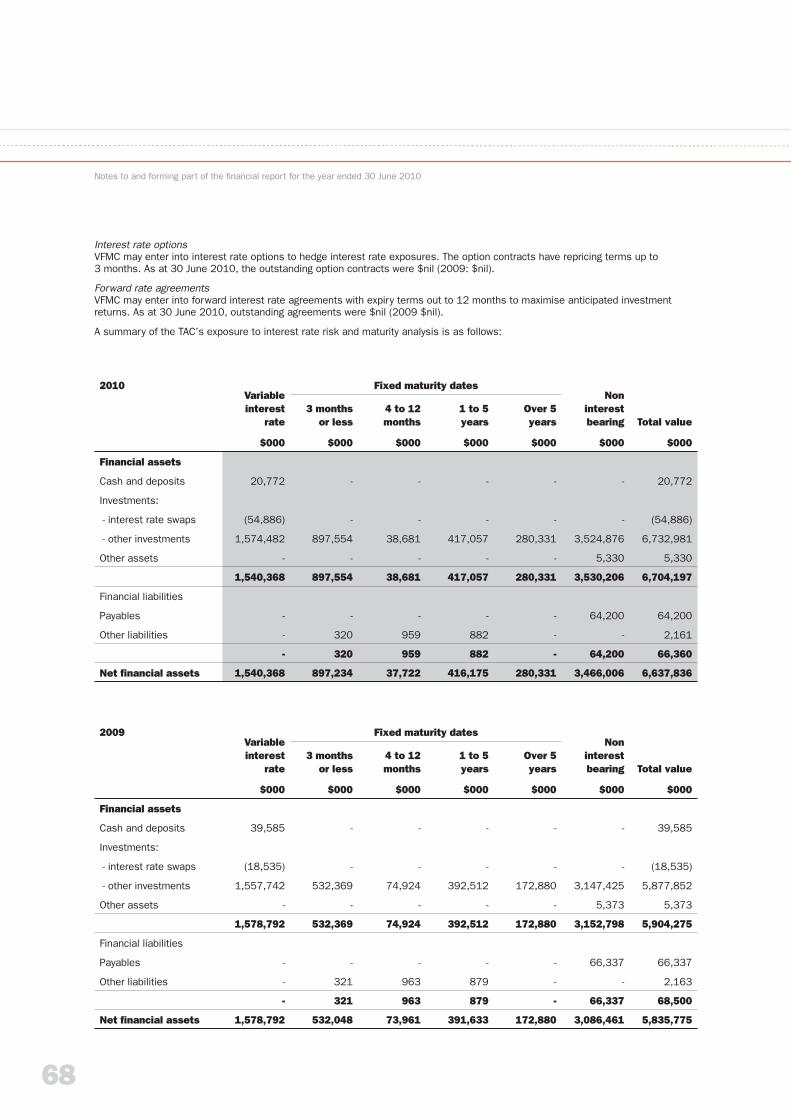
68
Notes to and forming part of the fi nancial report for the year ended 30 June 2010
Interest rate options VFMC may enter into interest rate options to hedge interest rate exposures. The option contracts have repricing terms up to3 months. As at 30 June 2010, the outstanding option contracts were $nil (2009: $nil).
Forward rate agreementsVFMC may enter into forward interest rate agreements with expiry terms out to 12 months to maximise anticipated investment returns. As at 30 June 2010, outstanding agreements were $nil (2009 $nil).
A summary of the TAC’s exposure to interest rate risk and maturity analysis is as follows:
2010Variable interest
rate
$000
Fixed maturity datesNon
interestbearing
$000
Total value
$000
3 monthsor less
$000
4 to 12 months
$000
1 to 5years
$000
Over 5 years
$000
Financial assets
Cash and deposits 20,772 - - - - - 20,772
Investments:
- interest rate swaps (54,886) - - - - - (54,886)
- other investments 1,574,482 897,554 38,681 417,057 280,331 3,524,876 6,732,981
Other assets - - - - - 5,330 5,330
1,540,368 897,554 38,681 417,057 280,331 3,530,206 6,704,197
Financial liabilities
Payables - - - - - 64,200 64,200
Other liabilities - 320 959 882 - - 2,161
- 320 959 882 - 64,200 66,360
Net fi nancial assets 1,540,368 897,234 37,722 416,175 280,331 3,466,006 6,637,836
2009Variable interest
rate
$000
Fixed maturity datesNon
interestbearing
$000
Total value
$000
3 monthsor less
$000
4 to 12 months
$000
1 to 5years
$000
Over 5 years
$000
Financial assets
Cash and deposits 39,585 - - - - - 39,585
Investments:
- interest rate swaps (18,535) - - - - - (18,535)
- other investments 1,557,742 532,369 74,924 392,512 172,880 3,147,425 5,877,852
Other assets - - - - - 5,373 5,373
1,578,792 532,369 74,924 392,512 172,880 3,152,798 5,904,275
Financial liabilities
Payables - - - - - 66,337 66,337
Other liabilities - 321 963 879 - - 2,163
- 321 963 879 - 66,337 68,500
Net fi nancial assets 1,578,792 532,048 73,961 391,633 172,880 3,086,461 5,835,775
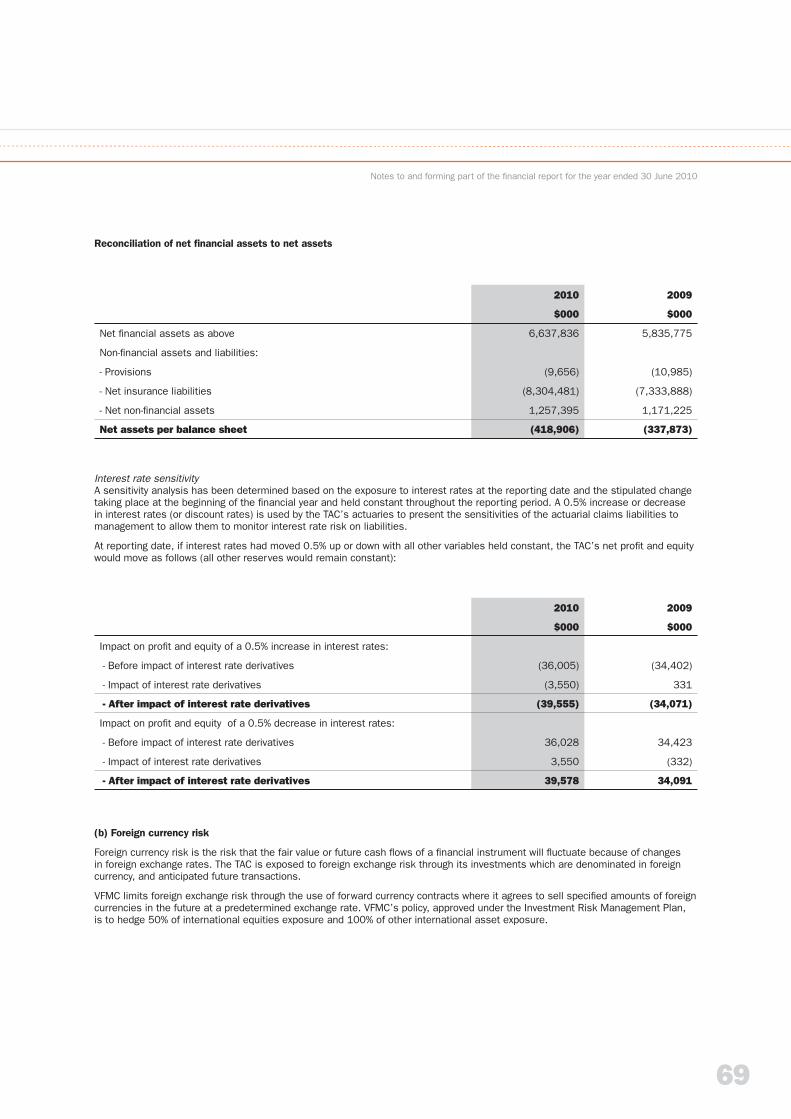
69
Notes to and forming part of the fi nancial report for the year ended 30 June 2010
Reconciliation of net fi nancial assets to net assets
Interest rate sensitivityA sensitivity analysis has been determined based on the exposure to interest rates at the reporting date and the stipulated change taking place at the beginning of the fi nancial year and held constant throughout the reporting period. A 0.5% increase or decrease in interest rates (or discount rates) is used by the TAC’s actuaries to present the sensitivities of the actuarial claims liabilities to management to allow them to monitor interest rate risk on liabilities.
At reporting date, if interest rates had moved 0.5% up or down with all other variables held constant, the TAC’s net profi t and equity would move as follows (all other reserves would remain constant):
(b) Foreign currency risk
Foreign currency risk is the risk that the fair value or future cash fl ows of a fi nancial instrument will fl uctuate because of changes in foreign exchange rates. The TAC is exposed to foreign exchange risk through its investments which are denominated in foreign currency, and anticipated future transactions.
VFMC limits foreign exchange risk through the use of forward currency contracts where it agrees to sell specifi ed amounts of foreign currencies in the future at a predetermined exchange rate. VFMC’s policy, approved under the Investment Risk Management Plan,is to hedge 50% of international equities exposure and 100% of other international asset exposure.
2010 2009
$000 $000
Net fi nancial assets as above 6,637,836 5,835,775
Non-fi nancial assets and liabilities:
- Provisions (9,656) (10,985)
- Net insurance liabilities (8,304,481) (7,333,888)
- Net non-fi nancial assets 1,257,395 1,171,225
Net assets per balance sheet (418,906) (337,873)
2010 2009
$000 $000
Impact on profi t and equity of a 0.5% increase in interest rates:
- Before impact of interest rate derivatives (36,005) (34,402)
- Impact of interest rate derivatives (3,550) 331
- After impact of interest rate derivatives (39,555) (34,071)
Impact on profi t and equity of a 0.5% decrease in interest rates:
- Before impact of interest rate derivatives 36,028 34,423
- Impact of interest rate derivatives 3,550 (332)
- After impact of interest rate derivatives 39,578 34,091
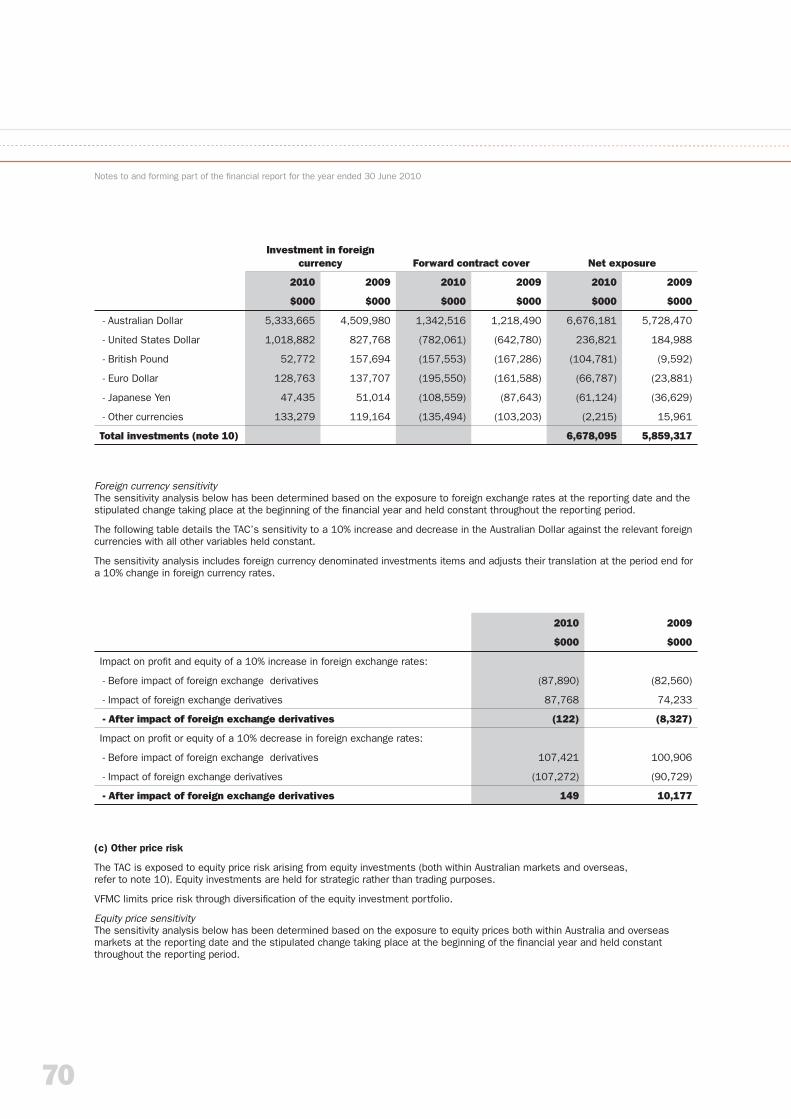
70
Notes to and forming part of the fi nancial report for the year ended 30 June 2010
(c) Other price risk
The TAC is exposed to equity price risk arising from equity investments (both within Australian markets and overseas,refer to note 10). Equity investments are held for strategic rather than trading purposes.
VFMC limits price risk through diversifi cation of the equity investment portfolio.
Equity price sensitivityThe sensitivity analysis below has been determined based on the exposure to equity prices both within Australia and overseas markets at the reporting date and the stipulated change taking place at the beginning of the fi nancial year and held constant throughout the reporting period.
Foreign currency sensitivityThe sensitivity analysis below has been determined based on the exposure to foreign exchange rates at the reporting date and the stipulated change taking place at the beginning of the fi nancial year and held constant throughout the reporting period.
The following table details the TAC’s sensitivity to a 10% increase and decrease in the Australian Dollar against the relevant foreign currencies with all other variables held constant.
The sensitivity analysis includes foreign currency denominated investments items and adjusts their translation at the period end for a 10% change in foreign currency rates.
2010 2009
$000 $000
Impact on profi t and equity of a 10% increase in foreign exchange rates:
- Before impact of foreign exchange derivatives (87,890) (82,560)
- Impact of foreign exchange derivatives 87,768 74,233
- After impact of foreign exchange derivatives (122) (8,327)
Impact on profi t or equity of a 10% decrease in foreign exchange rates:
- Before impact of foreign exchange derivatives 107,421 100,906
- Impact of foreign exchange derivatives (107,272) (90,729)
- After impact of foreign exchange derivatives 149 10,177
Investment in foreign currency Forward contract cover Net exposure
2010 2009 2010 2009 2010 2009
$000 $000 $000 $000 $000 $000
- Australian Dollar 5,333,665 4,509,980 1,342,516 1,218,490 6,676,181 5,728,470
- United States Dollar 1,018,882 827,768 (782,061) (642,780) 236,821 184,988
- British Pound 52,772 157,694 (157,553) (167,286) (104,781) (9,592)
- Euro Dollar 128,763 137,707 (195,550) (161,588) (66,787) (23,881)
- Japanese Yen 47,435 51,014 (108,559) (87,643) (61,124) (36,629)
- Other currencies 133,279 119,164 (135,494) (103,203) (2,215) 15,961
Total investments (note 10) 6,678,095 5,859,317
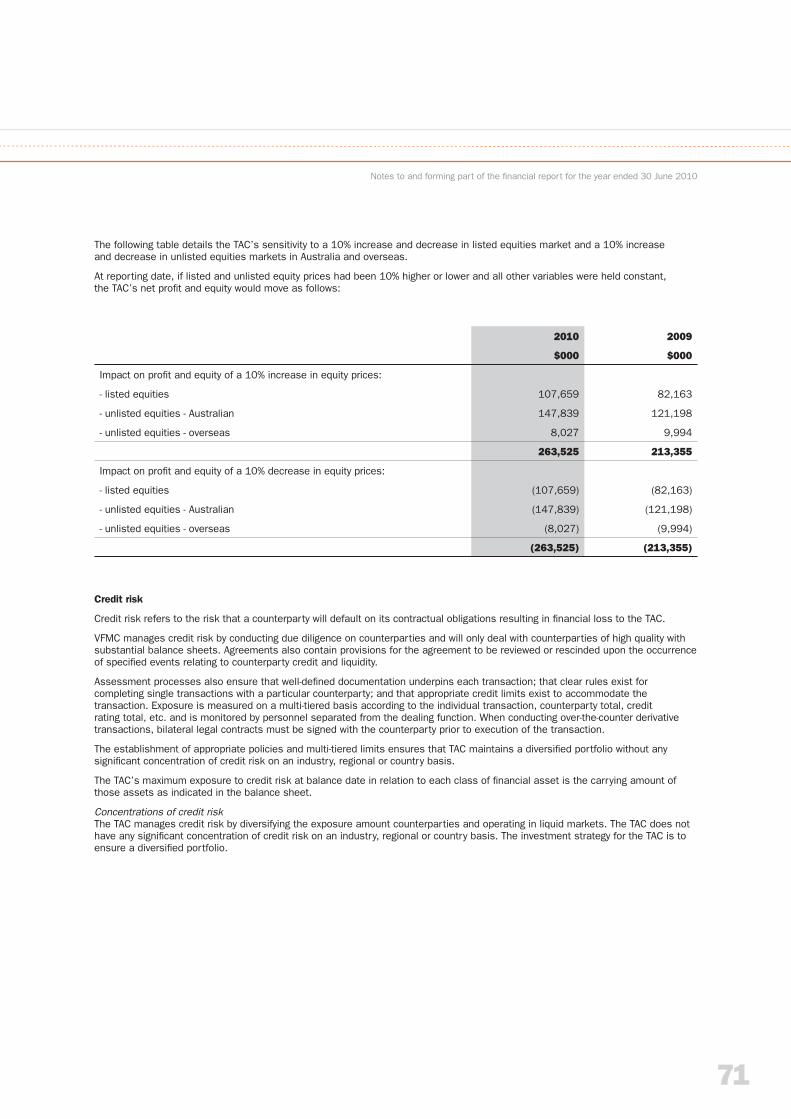
71
Notes to and forming part of the fi nancial report for the year ended 30 June 2010
2010 2009
$000 $000
Impact on profi t and equity of a 10% increase in equity prices:
- listed equities 107,659 82,163
- unlisted equities - Australian 147,839 121,198
- unlisted equities - overseas 8,027 9,994
263,525 213,355
Impact on profi t and equity of a 10% decrease in equity prices:
- listed equities (107,659) (82,163)
- unlisted equities - Australian (147,839) (121,198)
- unlisted equities - overseas (8,027) (9,994)
(263,525) (213,355)
The following table details the TAC’s sensitivity to a 10% increase and decrease in listed equities market and a 10% increaseand decrease in unlisted equities markets in Australia and overseas.
At reporting date, if listed and unlisted equity prices had been 10% higher or lower and all other variables were held constant,the TAC’s net profi t and equity would move as follows:
Credit risk
Credit risk refers to the risk that a counterparty will default on its contractual obligations resulting in fi nancial loss to the TAC.
VFMC manages credit risk by conducting due diligence on counterparties and will only deal with counterparties of high quality with substantial balance sheets. Agreements also contain provisions for the agreement to be reviewed or rescinded upon the occurrence of specifi ed events relating to counterparty credit and liquidity.
Assessment processes also ensure that well-defi ned documentation underpins each transaction; that clear rules exist for completing single transactions with a particular counterparty; and that appropriate credit limits exist to accommodate the transaction. Exposure is measured on a multi-tiered basis according to the individual transaction, counterparty total, credit rating total, etc. and is monitored by personnel separated from the dealing function. When conducting over-the-counter derivative transactions, bilateral legal contracts must be signed with the counterparty prior to execution of the transaction.
The establishment of appropriate policies and multi-tiered limits ensures that TAC maintains a diversifi ed portfolio without any signifi cant concentration of credit risk on an industry, regional or country basis.
The TAC’s maximum exposure to credit risk at balance date in relation to each class of fi nancial asset is the carrying amount of those assets as indicated in the balance sheet.
Concentrations of credit riskThe TAC manages credit risk by diversifying the exposure amount counterparties and operating in liquid markets. The TAC does not have any signifi cant concentration of credit risk on an industry, regional or country basis. The investment strategy for the TAC is to ensure a diversifi ed portfolio.
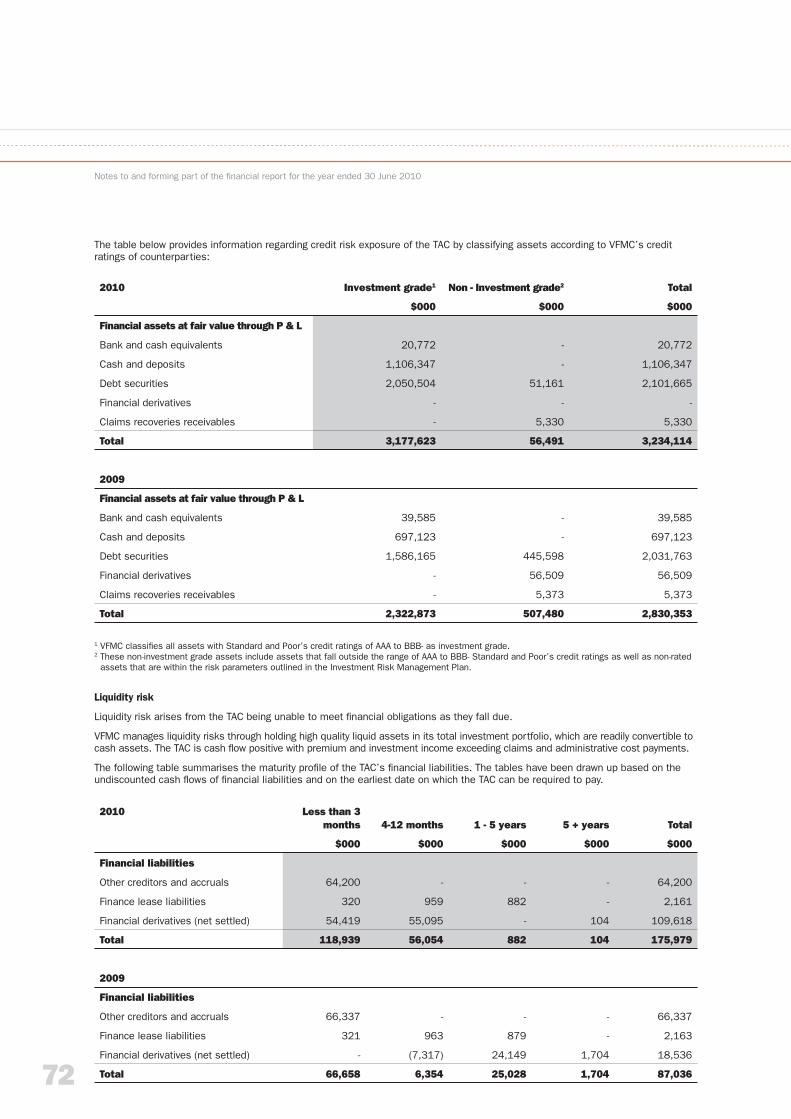
72
Notes to and forming part of the fi nancial report for the year ended 30 June 2010
The table below provides information regarding credit risk exposure of the TAC by classifying assets according to VFMC’s credit ratings of counterparties:
Liquidity risk
Liquidity risk arises from the TAC being unable to meet fi nancial obligations as they fall due.
VFMC manages liquidity risks through holding high quality liquid assets in its total investment portfolio, which are readily convertible to cash assets. The TAC is cash fl ow positive with premium and investment income exceeding claims and administrative cost payments.
The following table summarises the maturity profi le of the TAC’s fi nancial liabilities. The tables have been drawn up based on the undiscounted cash fl ows of fi nancial liabilities and on the earliest date on which the TAC can be required to pay.
2010 Investment grade1 Non - Investment grade2 Total
$000 $000 $000
Financial assets at fair value through P & L
Bank and cash equivalents 20,772 - 20,772
Cash and deposits 1,106,347 - 1,106,347
Debt securities 2,050,504 51,161 2,101,665
Financial derivatives - - -
Claims recoveries receivables - 5,330 5,330
Total 3,177,623 56,491 3,234,114
2009
Financial assets at fair value through P & L
Bank and cash equivalents 39,585 - 39,585
Cash and deposits 697,123 - 697,123
Debt securities 1,586,165 445,598 2,031,763
Financial derivatives - 56,509 56,509
Claims recoveries receivables - 5,373 5,373
Total 2,322,873 507,480 2,830,353
1 VFMC classifi es all assets with Standard and Poor’s credit ratings of AAA to BBB- as investment grade.2 These non-investment grade assets include assets that fall outside the range of AAA to BBB- Standard and Poor’s credit ratings as well as non-rated
assets that are within the risk parameters outlined in the Investment Risk Management Plan.
2010 Less than 3 months 4-12 months 1 - 5 years 5 + years Total
$000 $000 $000 $000 $000
Financial liabilities
Other creditors and accruals 64,200 - - - 64,200
Finance lease liabilities 320 959 882 - 2,161
Financial derivatives (net settled) 54,419 55,095 - 104 109,618
Total 118,939 56,054 882 104 175,979
2009
Financial liabilities
Other creditors and accruals 66,337 - - - 66,337
Finance lease liabilities 321 963 879 - 2,163
Financial derivatives (net settled) - (7,317) 24,149 1,704 18,536
Total 66,658 6,354 25,028 1,704 87,036
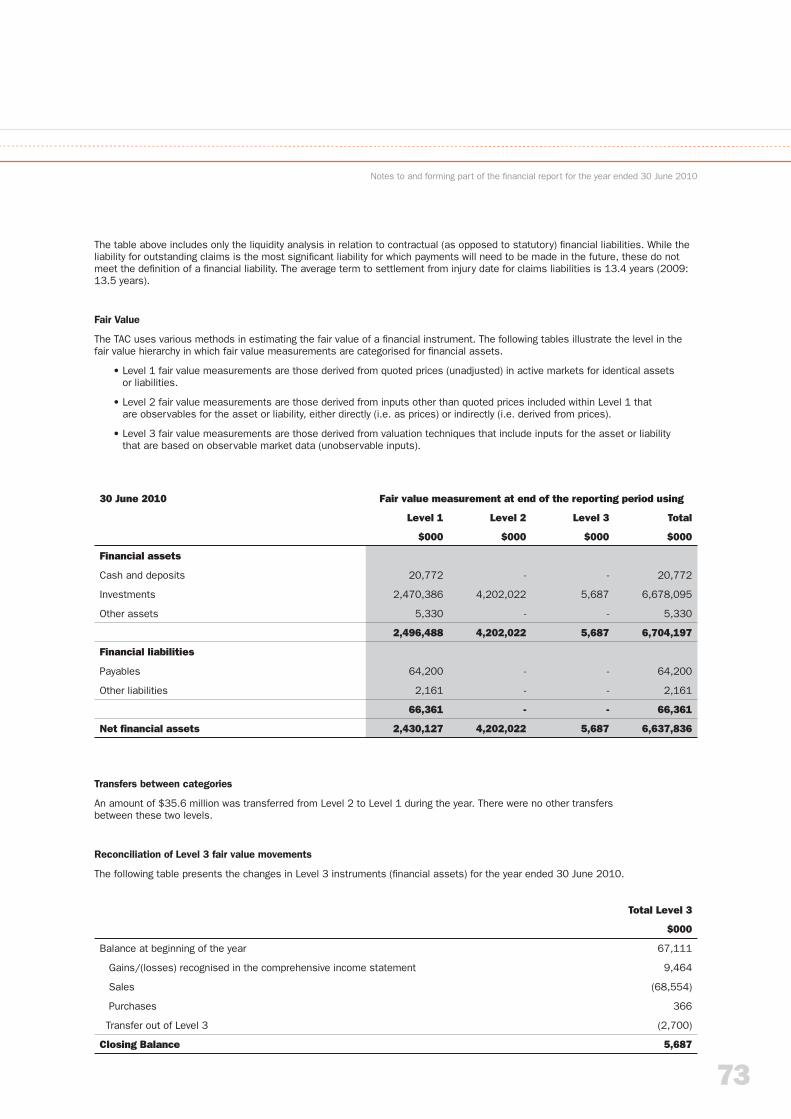
73
Notes to and forming part of the fi nancial report for the year ended 30 June 2010
The table above includes only the liquidity analysis in relation to contractual (as opposed to statutory) fi nancial liabilities. While the liability for outstanding claims is the most signifi cant liability for which payments will need to be made in the future, these do not meet the defi nition of a fi nancial liability. The average term to settlement from injury date for claims liabilities is 13.4 years (2009: 13.5 years).
Fair Value
The TAC uses various methods in estimating the fair value of a fi nancial instrument. The following tables illustrate the level in the fair value hierarchy in which fair value measurements are categorised for fi nancial assets.
• Level 1 fair value measurements are those derived from quoted prices (unadjusted) in active markets for identical assetsor liabilities.
• Level 2 fair value measurements are those derived from inputs other than quoted prices included within Level 1 thatare observables for the asset or liability, either directly (i.e. as prices) or indirectly (i.e. derived from prices).
• Level 3 fair value measurements are those derived from valuation techniques that include inputs for the asset or liabilitythat are based on observable market data (unobservable inputs).
Transfers between categories
An amount of $35.6 million was transferred from Level 2 to Level 1 during the year. There were no other transfersbetween these two levels.
Reconciliation of Level 3 fair value movements
The following table presents the changes in Level 3 instruments (fi nancial assets) for the year ended 30 June 2010.
30 June 2010 Fair value measurement at end of the reporting period using
Level 1 Level 2 Level 3 Total
$000 $000 $000 $000
Financial assets
Cash and deposits 20,772 - - 20,772
Investments 2,470,386 4,202,022 5,687 6,678,095
Other assets 5,330 - - 5,330
2,496,488 4,202,022 5,687 6,704,197
Financial liabilities
Payables 64,200 - - 64,200
Other liabilities 2,161 - - 2,161
66,361 - - 66,361
Net fi nancial assets 2,430,127 4,202,022 5,687 6,637,836
Total Level 3
$000
Balance at beginning of the year 67,111
Gains/(losses) recognised in the comprehensive income statement 9,464
Sales (68,554)
Purchases 366
Transfer out of Level 3 (2,700)
Closing Balance 5,687
74
Notes to and forming part of the fi nancial report for the year ended 30 June 2010
Capital management strategy
Capital maintained by the TAC is an integral part of managing the uncertainties impacting on the value of outstanding claims liabilities and returns from its investment portfolio. Consistent with the outcome of the State Government review, the TAC has adopted a target funding level of 110%, being the midpoint of a target funding level range of 100-120%. It is expected that from time to time the TAC’s actual funding ratio will be outside that target funding range. In such circumstances, corrective action may be recommended to transition the actual funding range to the target funding level over time.
The TAC will seek to continually aim towards the target funding ratio of 110% over rolling fi ve-year periods. Where funding ratio fell below 100%, it is expected that dividend payments to Government would cease. Where funding ratio exceeded 120%, ‘special’ dividends may be payable in addition to the ordinary dividend, or other options such as increasing benefi ts or reducing premiums may be considered.
The TAC’s funding ratio is calculated as “net assets less deferred tax asset and intangible assets divided by net outstanding claims liability”. The funding ratio is also adjusted for an allowance for dividend at the benchmark rate to ensure the reported funding ratio is not misleading.
26. SEGMENT INFORMATIONThe TAC operates the transport accident compensation scheme in Victoria.
75
STATEMENT BYCHAIRMAN, CHIEF EXECUTIVE OFFICER AND CHIEF FINANCE AND ACCOUNTING OFFICER
We certify that the fi nancial report of the Transport Accident Commission has been prepared in accordance with Standing Direction 4.2 of the Financial Management Act 1994, applicable Financial Reporting Directions, Australian Accounting Standards and other mandatory professional reporting requirements.
We further state that, in our opinion, the information set out in the comprehensive income statement, balance sheet, statement of changes in equity, cash fl ow statement and notes to and forming part of the fi nancial statements, present fairly the fi nancial transactions for the year ended 30 June 2010 and the fi nancial position of the Transport Accident Commission as at that date.
We are not aware of any circumstances which would render any particulars included in the fi nancial report misleading or inaccurate.
Dated at Geelong this 31st day of August 2010.
Paul Barker Janet Dore John Hall
Chairman Chief Executive Offi cer Chief Finance and Accounting Offi cer
76
Level 24, 35 Collins Street, Melbourne Vic. 3000
Telephone 61 3 8601 7000 Facsimile 61 3 8601 7010 Email [email protected] Website www.audit.vic.gov.au
Auditing in the Public Interest
Victorian Auditor -General’s Office
INDEPENDENT AUDITOR’S REPORT
TO THE BOARD MEMBERS, TRANSPORT ACCIDENT COMMISSION
The Financial Report
The accompanying fi nancial report for the year ended 30 June 2010 of the Transport Accident Commission which comprises the comprehensive income statement, balance sheet, statement of changes in equity, cash fl ow statement, a summary of signifi cant accounting policies and other explanatory notes to and forming part of the fi nancial report, and the statement by chairman, chief executive offi cer and chief fi nance and accounting offi cer, has been audited.
The Board Member’s Responsibility for the Financial Report
The Board Members of the Transport Accident Commission are responsible for the preparation and the fair presentation of the fi nancial report in accordance with Australian Accounting Standards (including Australian Accounting Interpretations) and the fi nancial reporting requirements of the Financial Management Act 1994. This responsibility includes:
• establishing and maintaining internal controls relevant to the preparation and fair presentation of the fi nancial report that isfree from material misstatement, whether due to fraud or error
• selecting and applying appropriate accounting policies
• making accounting estimates that are reasonable in the circumstances.
Auditor’s Responsibility
As required by the Audit Act 1994, my responsibility is to express an opinion on the fi nancial report based on the audit,which has been conducted in accordance with Australian Auditing Standards. These Standards require compliance with relevant ethical requirements relating to audit engagements and that the audit be planned and performed to obtain reasonable assurance whether the fi nancial report is free from material misstatement.
An audit involves performing procedures to obtain audit evidence about the amounts and disclosures in the fi nancial report.The audit procedures selected depend on judgement, including the assessment of the risks of material misstatement of the fi nancial report, whether due to fraud or error. In making those risk assessments, consideration is given to the internal control relevant to the entity’s preparation and fair presentation of the fi nancial report in order to design audit procedures that are appropriate in the circumstances, but not for the purpose of expressing an opinion on the effectiveness of the Commissions internal control. An audit also includes evaluating the appropriateness of the accounting policies used, and the reasonablenessof accounting estimates made by the Board Members, as well as evaluating the overall presentation of the fi nancial report.
I believe that the audit evidence I have obtained is suffi cient and appropriate to provide a basis for my audit opinion.
77
Level 24, 35 Collins Street, Melbourne Vic. 3000
Telephone 61 3 8601 7000 Facsimile 61 3 8601 7010 Email [email protected] Website www.audit.vic.gov.au
Auditing in the Public Interest
Victorian Auditor -General’s Office
INDEPENDENT AUDITOR’S REPORT (CONTINUED)
Matters Relating to the Electronic Presentation of the Audited Financial Report
This auditor’s report relates to the fi nancial report published in both the annual report and on the website of the Transport Accident Commission for the year ended 30 June 2010. The Board Members of the Transport Accident Commission are responsible for the integrity of the website. I have not been engaged to report on the integrity of the website. The auditor’s report refers only to the statements named above. An opinion is not provided on any other information which may have been hyperlinked to or from these statements. If users of this report are concerned with the inherent risks arising from electronic data communications, they are advised to refer to the hard copy of the audited fi nancial report to confi rm the information included in the audited fi nancial report presented on the Transport Accident Commission website.
Independence
The Auditor-General’s independence is established by the Constitution Act 1975. The Auditor-General is not subject to direction by any person about the way in which his powers and responsibilities are to be exercised. In conducting the audit, the Auditor-General, his staff and delegates complied with all applicable independence requirements of the Australian accounting profession.
Auditor’s Opinion
In my opinion, the fi nancial report presents fairly, in all material respects, the fi nancial position of the Transport Accident Commission as at 30 June 2010 and its fi nancial performance and cash fl ows for the year then ended in accordance with applicable Australian Accounting Standards (including the Australian Accounting Interpretations), and the fi nancial reporting requirements of the Financial Management Act 1994.
MELBOURNE D D R Pearson
31 August 2010 Auditor-General
78
SECTION 1 - CORPORATE GOVERNANCEThis statement covers the main corporate governance practices that ensure the TAC is managed to achieve its mission, meet commitments to stakeholders and operate commercially.
Board of Management
The Chairman and the Board are nominated by the Minister and appointed by the Governor in Council. There are presently ninenon-executive directors, including the Chairman.
The Board has established clearly defi ned accountabilities and delegations for the Chief Executive Offi cer. Policies and procedures cover all aspects of the TAC’s activities and are reviewed regularly to ensure the TAC achieves its objectives regarding:
• Compliance with applicable laws and regulations
• Reliability of fi nancial reporting
• Safeguarding of assets
• Effectiveness and effi ciency of operations.
Director’s access to independent professional advice
Directors are entitled to seek independent professional advice in connection with their duties at the TAC’s expense, unless determined otherwise by the Board.
Confl ict of interest
If a Director has a direct or indirect pecuniary interest in a matter being considered by the Board, the Director must disclose the nature of the interest. Unless otherwise determined by the Minister or the Board, the Director must not be present during any deliberation of the Board in relation to the matter and must not take part in any decision of the Board.
Board Committees
Remuneration Committee
Members at 30 June 2010: Elana Rubin (Chair), Paul Barker and Christine McLoughlin.
Role:
• Remuneration Policy – establish and maintain a remuneration policy that meets the strategic goals of the TAC. The Committee will periodically review all policies covering fi xed remuneration, incentive remuneration, benefi ts, terms and conditions.
• Oversee the application of the remuneration policy for senior executives, ensuring the policy is consistent with the Government Sector Executive Remuneration Panel (GSERP) guidelines and policies as established from time to time.
• Annual Remuneration Review – to approve remuneration increases budget and the incentive remuneration budget for the TAC.
• Remuneration Compliance – to ensure that all remuneration policies and practices comply with the law and with TAC and government policy.
• Disclosure – to ensure that appropriate and required disclosure is made of Director and Executive remuneration, in accordance with regulatory requirements and good governance practices.
• Recruitment – to recruit the TAC’s Chief Executive Offi cer.
79
Audit and Risk Management Committee
Members at 30 June 2010: Geoff Hilton (Chair), Paul Barker, Julie Caldecott, Sonia Petering, Christine McLoughin and Maria Wilton all of whom are independent persons for the purpose of the Standing Directions of the Minister for Finance under the Financial Management Act 1994.
Role:
• Oversee an appropriate risk management framework and consider the effectiveness of the TAC’s risk management and internal controls.
• Provide oversight for the issues that potentially impact the TAC’s fi nancial reporting process of proposed regulatory, accountingor reporting initiatives.
• Consider the reliability, integrity and completeness of fi nancial information and the fi nancial reporting practices of the TAC presented by management.
• Monitor compliance with relevant laws, regulations and government directives and that accounting policies are in line with the Financial Management Act 1994, government guidelines and current Australian Accounting Standards.
• Monitor compliance with the TAC’s internal investment policies and procedures, the contractual arrangements with the VFMC and requirements of the Prudential Statement.
• Advise the Finance and Investment Strategies Committee of any matter or internal control weakness that impacts the committee’s area of responsibility.
• Review and recommend to the Board approval of the annual plan submitted by internal audit.
• Monitor that the objectivity and independence of internal and external audit is preserved by monitoring employment relationships, fi nancial relationships and the provision of non-audit services and other assessments as deemed necessary.
• Review management responses to internal and external audit reports, actions to correct any noted defi ciencies and monitor progress to correct defi ciencies.
• Evaluate the overall effectiveness of internal and external audit and recommend appointment and fees for the internal auditors to the Board.
• Implement the TAC’s annual internal audit plan and deal with issues raised by the TAC’s auditors (internal and external).
• Initiate and supervise, where appropriate, special reviews.
• Review and monitor the policies (including whistleblowers) for preventing and detecting fraud.
• Annually recommend to the Board an attestation to government that the TAC complies with the Victorian Government Risk Management Framework.
Financial and Investment Strategies Committee
Members at June 30 2010: Elana Rubin (Chair) and Bob Offi cer.
Role:
• Make recommendations (at least annually) to the Board on investment objectives in the context of overall balance sheet risk management and consistent with the capital, pricing and reserving policy set by Government.
• Monitor and make recommendations to the Board regarding balance sheet management issues.
• Make recommendations to the Board regarding amendments to the stock voting policy, and review VFMC reports to ensure voting activities in accordance with policy.
• Review the performance of the VFMC and other service providers in the context of the investment objective, service level agreements and other appropriate measures.
• Monitor the success of the investment strategy by reviewing fund performance compared to objectives, long-term targets and peer group.
The FISCO will also advise the Board in relation to other matters relevant to the management and performance reporting of the TAC’s investment fund and other fi nancial strategies as appropriate.
80
Marketing and Roads Safety Committee
Members as at June 30 2010: Bob Offi cer (Chair), Andrew Dyer and Sonia Petering.
Role:
• Review the strategies of the marketing, sponsorship and communications programs, ensuring the strategies are supported by sound business principles.
• Make recommendations to the Board on proposals which are beyond the delegated authority of the Chief Executive Offi cer.
Monitor the identifi cation and management of critical reputation and performance risks.
Health Issues Committee
Members at June 30 2010: Julie Caldecott (Chair) and Geoff Hilton.
Role:
• Review and challenge health care strategies and related business plans and monitor their progress as required.
• Oversee the potential impact on the agencies’ fi nancial positions of proposed health care initiatives, including fee setting and initiatives to infl uence service usage.
• Monitor purchasing approaches, relationships and interactions with the health care sector to ensure strong relationships with the external health care environment and to establish appropriate formal agreements where required.
• Monitor developments and trends in the health care sector to ensure that viability and service delivery risks and opportunities are appropriately identifi ed and that appropriate strategies are in place to mitigate risks.
• Ensure health care strategies and initiatives are directed toward achieving improved health, employment and social outcomes for clients and stakeholders.
• Monitor health care performance measures ensuring reasonableness of cost of care and quality of service delivery and outcomes.
• Monitor the performance of the agencies’ clinical panels and any other similar panels established to assess the effi ciency and value of clinical services provided by the agencies to clients, injured workers and stakeholders.
• Review and make recommendation on health care related research guidelines and priorities to the agencies, ensuring that they meet the agencies’ objectives.
• Monitor research strategies and ensure that these are addressing the Board’s objectives and measures, including return on investment.
• Examine any other health related issues referred by the Board.
81
Risk Management
The TAC has in place a risk management framework to ensure that the appropriate procedures are in place for the effective identifi cation, quantifi cation and management of risks.
The risk management framework details the roles of the Board and its Committees, the internal auditor and management.The Board is responsible for setting the risk priorities which are the major focus of the internal plan. The Audit and Risk Management Committee oversees the risk management framework and is responsible for ensuring the effectiveness and implementation of control strategies and operational practices.
Compliance with the Victorian Government Risk Management Framework
Standing Direction 4.5.5 of the Financial Management Act 1994 requires public sector agencies to provide an annual attestationof compliance with the risk management process requirements set out in the Victorian Government Risk Management Framework.
The Audit and Risk Management Committee of the Transport Accident Commission has considered the Statement by the Chief Executive Offi cer on compliance with the Victorian Government Risk Management Framework, the Executive Team internal attestation process and independent assessments from Internal Audit.
On this basis, I certify on behalf of the Board of the Transport Accident Commission that the Transport Accident Commission:
• Has risk management processes in place consistent with the Australian/New Zealand Risk Management Standard: AS/NZ 4360;
• Has an internal control system in place that enables the executive to understand, manage and satisfactorily control risk exposures; and
• The Audit and Risk Management Committee and the Executive Team have critically reviewed the risk profi le during the period 1 July 2009 to 30 June 2010.
Paul Barker
ChairTransport Accident Commission31 August 2010
SHARED VALUES AND GUIDING PRINCIPLES
Integrity
We will be open, honest and reliable in everything that we do, achieving and maintaining the highest levels of professional service to our stakeholders and each other.
Unity of purpose
We will work together to achieve our vision and mission. We will share experiences, knowledge and ideas to foster greater communication, interaction and cohesiveness within the organisation.
Dignity and respect
We will treat all people, inside and outside the organisation, with dignity and respect.
Innovation
We recognise the role innovation can play in the achieving the organisation’s vision. We will foster a culture that encourages employees to maximise their potential.
Accountability and responsibility
We will support and encourage employees to be responsible and accountable, and to make decisions within the scope of their role.
82
SECTION 2 – COMPLIANCE
This section includes the disclosures required by the Financial Management Act 1994 and the Transport Accident Act 1986.
Incorporation and ministerial responsibility
The TAC is a body corporate established under Section 10 of the Transport Accident Act 1986 (the Act) (No. 111 of 1986,reprint No. 11 dated 17 April 2008). The Act sets out the objectives, functions and powers of the TAC.
The Minister for Finance, WorkCover and the TAC is the Minister administering the Transport Accident Act 1986.
Ministerial directions
There were no Ministerial Directions given by the Minister for Finance, WorkCover and the TAC in the period 1 July 2009 to 30 June 2010.
The TAC’s objectives, functions, powers and accountability
Sections 11, 12, 13 and 14 of the Transport Accident Act 1986 set out the objectives, functions, powers and accountability of the TAC.
Objectives of the Commission (section 11)
• To manage the transport accident compensation scheme as effectively, effi ciently and economically as possible
• To ensure that appropriate compensation is delivered in the most socially and economically appropriate manner and as expeditiously as possible
• To ensure that the transport accident scheme emphasises accident prevention and effective rehabilitation
• To develop internal management structures and procedures that will enable it to perform its functions and exercise its powers effectively, effi ciently and economically
• To manage claims under the Accident Compensation Act 1985 as an authorised agent of the Victorian WorkCover Authority as effectively, effi ciently and economically as possible
• If appointed as an agent of a self-insurer under S.147A of the Accident Compensation Act 1985, to carry out the functions and powers of a self-insurer as effectively, effi ciently and economically as possible.
Functions of the Commission (section 12)
• To administer the Transport Accident Fund
• To receive and assess, and accept or reject, claims for compensation
• To defend proceedings relating to claims for compensation
• To pay compensation to persons entitled to compensation
• To determine transport accident charges
• To collect and recover transport accident charges
• To provide advice in relation to the transport accident scheme
• To provide funds for the program designed to secure the early and effective medical and vocational rehabilitation of persons injured as a result of transport accidents and for other rehabilitation programs for persons injured in transport accidents
• To collect and assess data and statistics in relation to transport accidents
• To provide advice to the Minister in relation to matters specifi cally referred to the Commission by the Minister and generally in relation to the administration of this Act and the compensation scheme under this Act
• To commercially exploit knowledge and expertise in compensation schemes and scheme administration
• To act as an authorised agent under section 23 of the Accident Compensation Act 1985
• If appointed, to act as an agent of a self-insurer under section 147A of the Accident Compensation Act 1985
• To carry out such other functions conferred on the Commission by this or any other Act
• To promote the prevention of transport accidents and safety in use of transport
• To promote, so far as possible, a program designed to secure the early and effective medical and vocational rehabilitation of people injured as a result of transport accidents to whom or on behalf of whom the Commission is or may become liable to make any payment under the Act.
83
Powers of the Commission (section 13)
• To do all things that are necessary or convenient to be done for, or in connection with, the performance of its functions and to enable it to achieve its objectives
• To enter into agreements or arrangements and settle or compromise differences or disputes with other persons
• To do all things necessary to be done in connection with the management of its interest in the assigned debt within the meaning of Part 2A of the Act, which deals with the assigned debts of the Pyramid Building Society, Countrywide Building Society and the Geelong Building Society
• To exercise other powers in relation to the assigned debt of the building societies on behalf of the Treasurer
• To apply for, obtain and hold intellectual property rights (including patents, copyrights, trade marks and registered designs)
• To enter into agreements or arrangements for the commercial exploitation within or outside Victoria of intellectual property rights and ancillary services on any terms or conditions as to royalties, lump sum payments or otherwise as the Commission may see fi t
• To enter into agreements or arrangements within or outside Victoria for the provision by the Commission of administration, management or information systems or services
• To do all things necessary or convenient to be done in connection with acting as an authorised agent of the Victorian WorkCover Authority under section 23 of the Accident Compensation Act 1985 and as an agent of a self-insurer under section 147A of that Act.
Accountability of the Commission (section 14)
The Commission must perform its functions and exercise its powers subject to the general direction and control of the Minister and in accordance with any specifi c written directions given by the Minister in relation to a matter or class of matters specifi ed in the directions.
Legislation
The following legislative changes have occurred in the period from 1 July 2009 to 30 June 2010:
• On 1 December 2009 Schedule 1 item 26 of the Relationships Amendment (caring Relationships) Act 2009, No.4/2009 amended the defi nition of domestic partner under the section 3 of the Act to include registered domestic relationships.
• On 1 January 2010 Schedule item 123 of the Criminal Procedure amendment (Consequential and Transitional Provisions) Act 2009, No. 68/2009 amended references to charges laid under sections 40A, 120 and 139 which were amended to charge sheet fi led and references to client legal privilege was incorporated into amendment to the application of legal professional privilege to include client legal privilege.
SUBORDINATE LEGISLATION
Regulations
The Regulations made during 2009/10 were:
• The Transport Accident (Impairment) Regulations 2010 commenced on 1 June 2010. These Regulations re-made the Transport Accident (Impairment) Regulations 1999 which were due to expire on 31 May 2010.
• The Transport Accident Amendment (Home Modifi cation Agreement) Regulations 2010 were amended to allow an increase in the threshold from $10,000 to $25,000 for home modifi cations.
Orders in Council
The Orders in Council made during 2009/10 were:
• The Transport Accident Charges Order (No.1) 2010 (Special Gazette 18 May 2010). This order fi xed the transport accident charges to apply during the 2010/11 fi nancial year. The order increased the transport accident charges for vehicles in all classes by the CPI.
• Declaration that the TAC Medical Excess not be indexed in the fi nancial year commencing 1 July 2010 (Gazette 1 July 2010 page 1506).This order provided that the TAC medical excess not be indexed on 1 July 2010 as provided by the Transport Accident Act 1986.
84
NATIONAL COMPETITION POLICY
Review of Legislative Restrictions
In accordance with its National Competition Policy commitments, the Government commissioned a review of Victoria’s transport accident compensation legislation in September 2000. The review identifi ed three main restrictions on competition: the compulsory nature of scheme; the TAC as a legislated monopoly; and centralised premium setting. To address centralised premium setting, the Minister for Finance, WorkCover and the TAC now has discretion to request the Essential Services Commission to provide an independent review of the TAC’s proposed premium each year.
Competitive Neutrality
Under Competitive Neutrality policy, the TAC is listed as a signifi cant business enterprise. In accordance with this policy, the TAC pays the full suite of Commonwealth and State taxes or tax equivalents. The TAC is not a net borrower in its own right and therefore is not subject to the Financial Accommodation Levy.
Victorian Industry Participation Policy (Vipp)
During 2009/10, the TAC commenced one contract to which the Victorian Industry Participation Policy Act 2003 applied.
Consultants
During 2009/10, there were no consultants engaged where the cost of each individual engagement was in excess of $100,000.
However, there were eight consultancies engaged during the fi nancial year at a total cost of $0.25 million. Total approved project fees and expenditure for 2009/10 exclude GST.
Building Act 1993
The TAC’s policy with respect to new building works, and alterations to existing buildings, is to comply with the Building Act 1993 as though the TAC were not exempt from compliance as a public authority (this is provided for in section 217 (3) of the Building Act 1993).
Some premises occupied by the TAC may have been constructed or altered under exemptions for public bodies which applied at the time.
The TAC is unaware of any material non-compliance with the current building standards for buildings of their nature and age.
Whistleblowers Protection Act 2001
The TAC encourages the reporting of known or suspected incidences of improper conduct or detrimental actions. Procedures have been established to facilitate disclosures of improper conduct by the TAC and its employees and to ensure that any matters disclosed are properly investigated and dealt with. The procedures provide for the protection from reprisals of persons making disclosures. Included in the procedures are the disclosure mechanisms, confi dentiality provisions and the roles and responsibilities of the designated protected disclosure coordinator, the protected disclosure offi cers, investigators and welfare managers.
During 2009/10 there were no disclosures or investigations of improper conduct or detrimental actions made to the TAC by staff or any referred to the TAC by the Ombudsman or other persons.
Environmental Performance
The TAC has a Green Offi ce policy focussed on protecting the environment and supporting sustainable outcomes.
During the year the TAC continued a number of environmentally sustainable initiatives, supported by an environmental committee,to reduce waste and improve resource effi ciency. Initiatives include:
• Achieving a 4.5 star energy effi ciency rated headquarters in Geelong
• Operating an environmental sustainability reporting system consistent with the Department of Sustainability and Environment and government policy through Resource Smart
• Operating an environmental steering committee to implement ‘green initiatives’ across the organisation
• Commissioning black water treatment to recycle up to 15,000 litres of water a day
• Using carbon neutral paper for all on-site copying and printing
• Using recycled paper for off-site printing
• Procurement of 25% green electricity
• Commissioning daylight harvesting at the headquarters in Geelong
• Commissioning automated blinds to reduce heat into the headquarters in Geelong
85
Miscellaneous Disclosure
To the extent applicable, the information required under Financial Reporting Direction 22 issued by the Minister for Finance under Section 8 of the Financial Management Act 1994 has been prepared and is available on request.
SCHEME NOTES
Service of documents
Section 130 of the Transport Accident Act 1986 sets out the method of service of documents on the TAC, namely, by personally serving an authorised offi cer at the TAC’s Melbourne offi ce. People wishing to effect service should attend the TAC’s Customer Service Centre, 60 Brougham Street, Geelong, and ask for an authorised offi cer to accept service.
Alternatively, an authorised offi cer of the TAC will give a written acknowledgment of service of process directed as follows:
Head of Claims PO Box 742GEELONG 3220
Ausdoc: DX 216079 Geelong
Please note that this is a voluntary process and that proof of posting is not proof of service. If an acknowledgment letter is not received within 10 days after sending process by mail, personal service should be attempted under section 130.
ACCESS TO INFORMATION
Freedom of Information
The TAC offi cers responsible for receipt and initial action on requests made under the Freedom of Information Act 1982 areMs Justine Adams, Ms Emily Smyth and Ms Ellen Jennings.
The TAC possesses paper-based, microfi che and electronic documents with respect to claims administration, and general administrative, fi nancial and investment functions.
During 2009/10:
• The TAC received 1020 Freedom of Information (FOI) requests for access to documents, compared with 824 during 2008/09
• Most requests related to personal documentation
• There were no requests for amendment to personal records
Routine documentation may be released without making a formal FOI request. Potential applicants should therefore fi rst request release of such documentation from the relevant staff member.
Should a formal FOI request be required, a request must be submitted in writing detailing the documents sought, as well as enclosing the statutory $23.40 application fee, preferably in the form of a cheque payable to “Transport Accident Commission”.
The statutory application fee of $23.40 is applicable for the period 1 July 2009 to 30 June 2010 in accordance with the Monetary Units Act 2004.
The fee will be waived for applicants seeking personal information who provide a copy of their current valid health care card or pensioner concession card.
There is no application fee for a request for amendment to personal records.
The TAC is an agency subject to the Freedom of Information Act 1982, and is therefore not subject to the direct access provisions of the Information Privacy Act 2000 and the Health Records Act 2001.
Further information about FOI is available from the TAC’s website: www.foi.tac.vic.gov.au and the Victorian Government’s FOI Online website: www.foi.vic.gov.au
Contact details for the TAC’s FOI section are as follows:
Freedom of Information Offi cerTransport Accident CommissionPO Box 742GEELONG VIC 3001Phone: 1300 654 329Fax: (03) 9656 9360Email: [email protected]

86
Medical reports for common law purposes
To facilitate clients in receiving legal advice, the TAC will, on request or as part of its agreed protocols, provide copies of medical reports commissioned by the TAC, independently of its normal FOI access arrangements.
Requests for access to medical reports should be directed to the relevant TAC claims offi cer or, where the reports relate to impairment assessments, to the relevant impairment offi cer. There is no fee for access to documents under this policy.
Subpoenas
All subpoenas should be addressed to ‘The Authorised Person’ and must be personally served on an authorised offi cer at the TAC’s offi ces at 60 Brougham Street, Geelong. The TAC prefers to have a minimum of 14 days notice prior to the return date of the subpoena.
PUBLICATIONS
The TAC produces and makes available the following publications:
Description Mode of access
A better approach to lifetime support Copy
About lifetime support Copy
About the TAC Copy/Internet
A career at the TAC Copy
Annual Transport Accident charges including GST and duty Copy
At home with the family Copy
Checklist of services available as part of vocational programs Copy
Choosing an Attendant Care Agency (information sheet) Copy
Choosing a residential care service Copy
Clinical framework for the delivery of health services Copy
Clinical justifi cation fl ow chart Copy
Community Group Programs (information sheet) Copy
Community services for families (information sheet) Copy
Community services (information sheet) Copy
Course of employment transport accident notes Copy
Daily support (information sheet) Copy
Drive Smart 2 (brochure) Copy
Drive Smart 2 CD-ROM (available to learner drivers) CD
Empower Copy/Internet
GST compliance Copy
HELP pack Copy
If you need further treatment (information sheet) Copy
Information for people with major injuries (Booklets 1 – 4) Copy
Information on TAC medical examinations (information sheet) Copy
Integration support billing information Copy
Loss of earnings capacity (information sheet) Copy
Make sure you’re right to drive: how to reduce the risk for yourself and others on the road Copy
Muck Up Day video and curriculum advice booklet Copy
Occupational physicians - helping you get back to work Copy/Internet
Occupational physiotherapists - helping you recover and get back to work Copy/Internet
87
Description Mode of access
Occupational physiotherapists list - metro Copy/Internet
Occupational physiotherapists list - regional Copy/Internet
Pharmacy expenses Copy
Physiotherapy (fees) Copy/Internet
Post-hospital support (information sheet) Copy
Preparing to go home - hospital discharge checklist Copy
Prosthetic and orthotics (fees) Copy/Internet
Public key infrastructure hospital staff Copy
Returning to work - information for employers Copy
Returning to work (information sheet) Copy
Residential care (information sheet) Copy
Ride Smart CD-ROM (available to learner motorcyclists) Copy
Road safety reports (monthly summary) Internet
Safe driving policy Copy
Save your skin. Don’t hit the road without full protective gear Copy
Self-purchasing your TAC services (information sheet) Copy
TAC Annual Reports Copy/Internet
TAC allied health billing standards Copy
TAC benefi ts for self-employed people Copy
TAC billing requirements Copy
TAC billing requirements for home, domestic and housekeeping services Copy
TAC dependency benefi ts – a guide for funeral directors Copy
TAC domestic services Copy
TAC equipment suppliers billing standards Copy
TAC Enterprise Agreement 2008-2011 Copy
TAC home modifi cations Copy
TAC home services Copy
TAC hospital services billing standards Copy
TAC housekeeping Copy
TAC income support Copy
TAC information for employers (information sheet) Copy
TAC information for people with soft tissue injuries Copy
TAC impairment benefi ts Copy
TAC impairment examination (information sheet) Copy
TAC medical billing standards Copy
TAC post-acute support services Copy
TAC prosthetics and orthotics billing standards Copy
TAC research charter Copy
TAC support when a person dies Copy
TAC vehicle modifi cations Copy
The TAC’s complaints process Copy
The Transport Accident Commission – the benefi ts of the TAC model for proposed injury insurance Copy
Therapy Support (information sheet) Copy
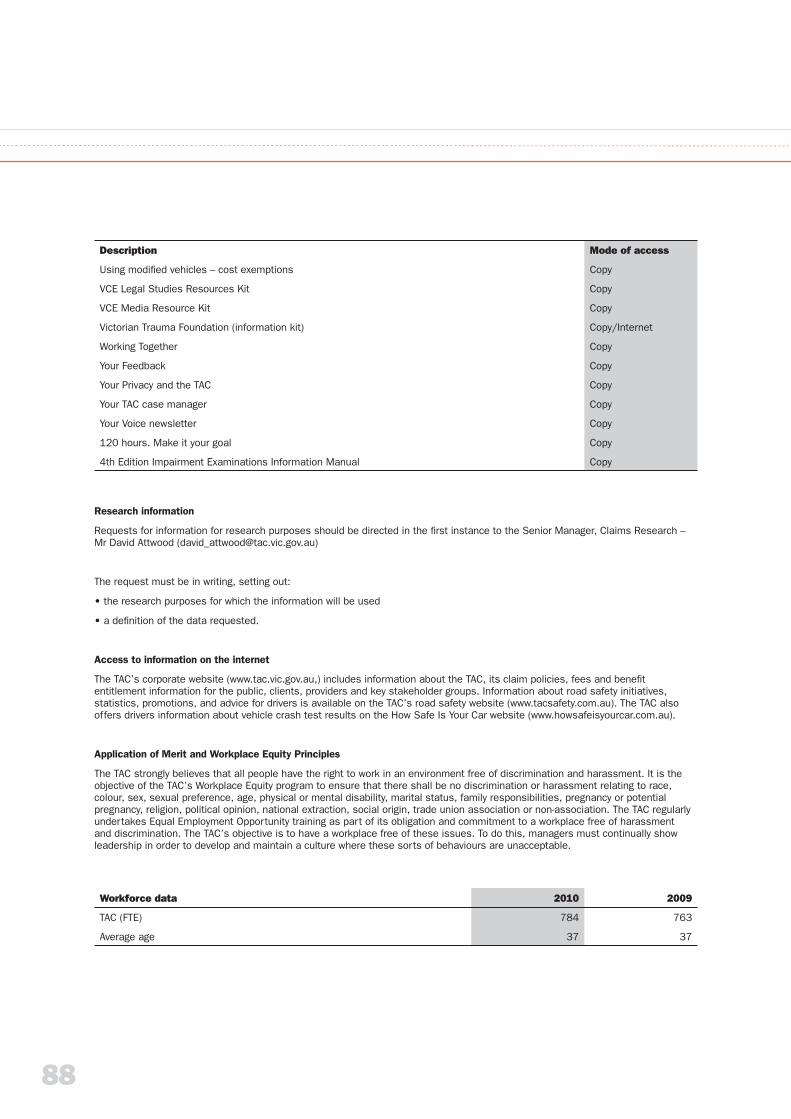
88
Description Mode of access
Using modifi ed vehicles – cost exemptions Copy
VCE Legal Studies Resources Kit Copy
VCE Media Resource Kit Copy
Victorian Trauma Foundation (information kit) Copy/Internet
Working Together Copy
Your Feedback Copy
Your Privacy and the TAC Copy
Your TAC case manager Copy
Your Voice newsletter Copy
120 hours. Make it your goal Copy
4th Edition Impairment Examinations Information Manual Copy
Research information
Requests for information for research purposes should be directed in the fi rst instance to the Senior Manager, Claims Research – Mr David Attwood ([email protected])
The request must be in writing, setting out:
• the research purposes for which the information will be used
• a defi nition of the data requested.
Access to information on the internet
The TAC’s corporate website (www.tac.vic.gov.au,) includes information about the TAC, its claim policies, fees and benefi t entitlement information for the public, clients, providers and key stakeholder groups. Information about road safety initiatives, statistics, promotions, and advice for drivers is available on the TAC’s road safety website (www.tacsafety.com.au). The TAC also offers drivers information about vehicle crash test results on the How Safe Is Your Car website (www.howsafeisyourcar.com.au).
Application of Merit and Workplace Equity Principles
The TAC strongly believes that all people have the right to work in an environment free of discrimination and harassment. It is the objective of the TAC’s Workplace Equity program to ensure that there shall be no discrimination or harassment relating to race, colour, sex, sexual preference, age, physical or mental disability, marital status, family responsibilities, pregnancy or potential pregnancy, religion, political opinion, national extraction, social origin, trade union association or non-association. The TAC regularly undertakes Equal Employment Opportunity training as part of its obligation and commitment to a workplace free of harassment and discrimination. The TAC’s objective is to have a workplace free of these issues. To do this, managers must continually show leadership in order to develop and maintain a culture where these sorts of behaviours are unacceptable.
Workforce data 2010 2009
TAC (FTE) 784 763
Average age 37 37
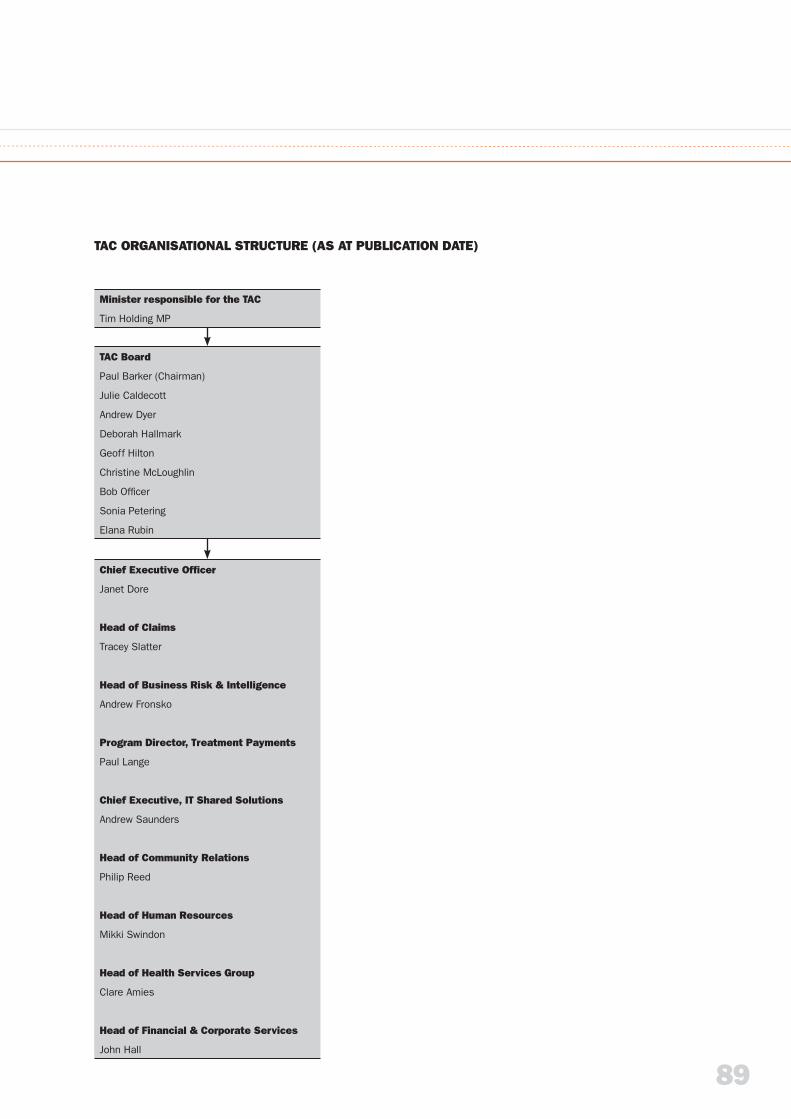
89
TAC ORGANISATIONAL STRUCTURE (AS AT PUBLICATION DATE)
Minister responsible for the TAC
Tim Holding MP
TAC Board
Paul Barker (Chairman)
Julie Caldecott
Andrew Dyer
Deborah Hallmark
Geoff Hilton
Christine McLoughlin
Bob Offi cer
Sonia Petering
Elana Rubin
Chief Executive Offi cer
Janet Dore
Head of Claims
Tracey Slatter
Head of Business Risk & Intelligence
Andrew Fronsko
Program Director, Treatment Payments
Paul Lange
Chief Executive, IT Shared Solutions
Andrew Saunders
Head of Community Relations
Philip Reed
Head of Human Resources
Mikki Swindon
Head of Health Services Group
Clare Amies
Head of Financial & Corporate Services
John Hall
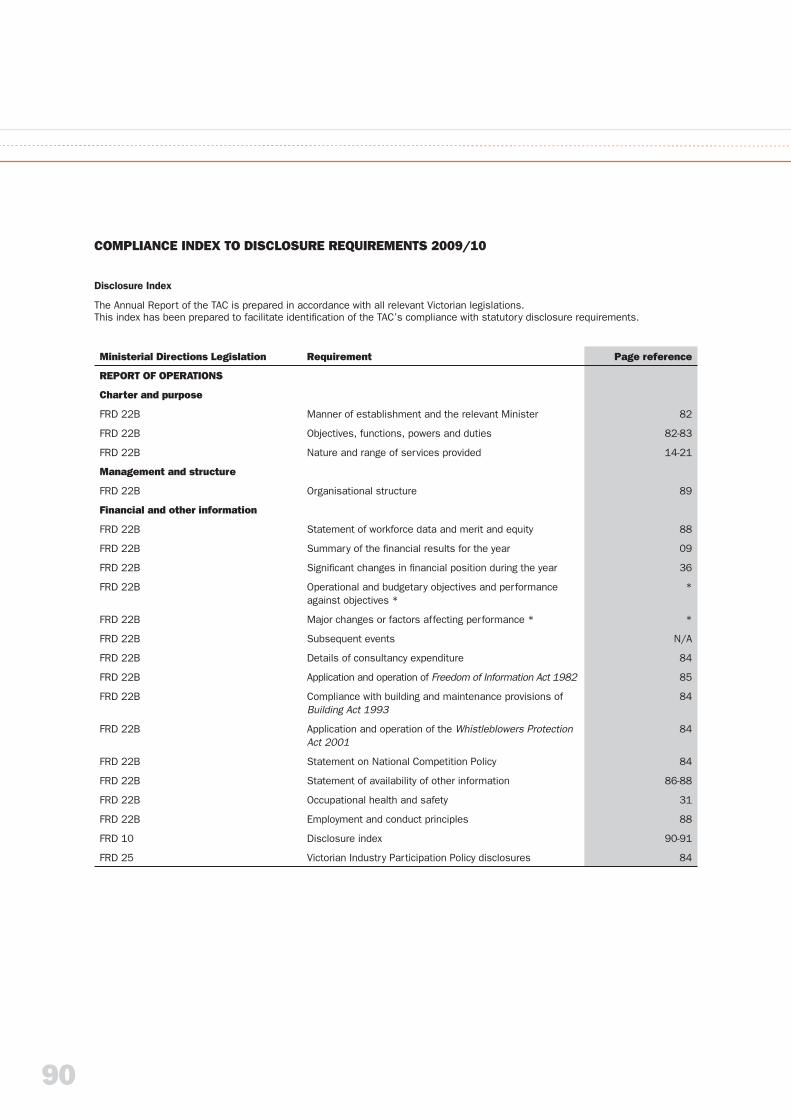
90
Ministerial Directions Legislation Requirement Page reference
REPORT OF OPERATIONS
Charter and purpose
FRD 22B Manner of establishment and the relevant Minister 82
FRD 22B Objectives, functions, powers and duties 82-83
FRD 22B Nature and range of services provided 14-21
Management and structure
FRD 22B Organisational structure 89
Financial and other information
FRD 22B Statement of workforce data and merit and equity 88
FRD 22B Summary of the fi nancial results for the year 09
FRD 22B Signifi cant changes in fi nancial position during the year 36
FRD 22B Operational and budgetary objectives and performance against objectives *
*
FRD 22B Major changes or factors affecting performance * *
FRD 22B Subsequent events N/A
FRD 22B Details of consultancy expenditure 84
FRD 22B Application and operation of Freedom of Information Act 1982 85
FRD 22B Compliance with building and maintenance provisions of Building Act 1993
84
FRD 22B Application and operation of the Whistleblowers Protection Act 2001
84
FRD 22B Statement on National Competition Policy 84
FRD 22B Statement of availability of other information 86-88
FRD 22B Occupational health and safety 31
FRD 22B Employment and conduct principles 88
FRD 10 Disclosure index 90-91
FRD 25 Victorian Industry Participation Policy disclosures 84
COMPLIANCE INDEX TO DISCLOSURE REQUIREMENTS 2009/10
Disclosure Index
The Annual Report of the TAC is prepared in accordance with all relevant Victorian legislations.This index has been prepared to facilitate identifi cation of the TAC’s compliance with statutory disclosure requirements.
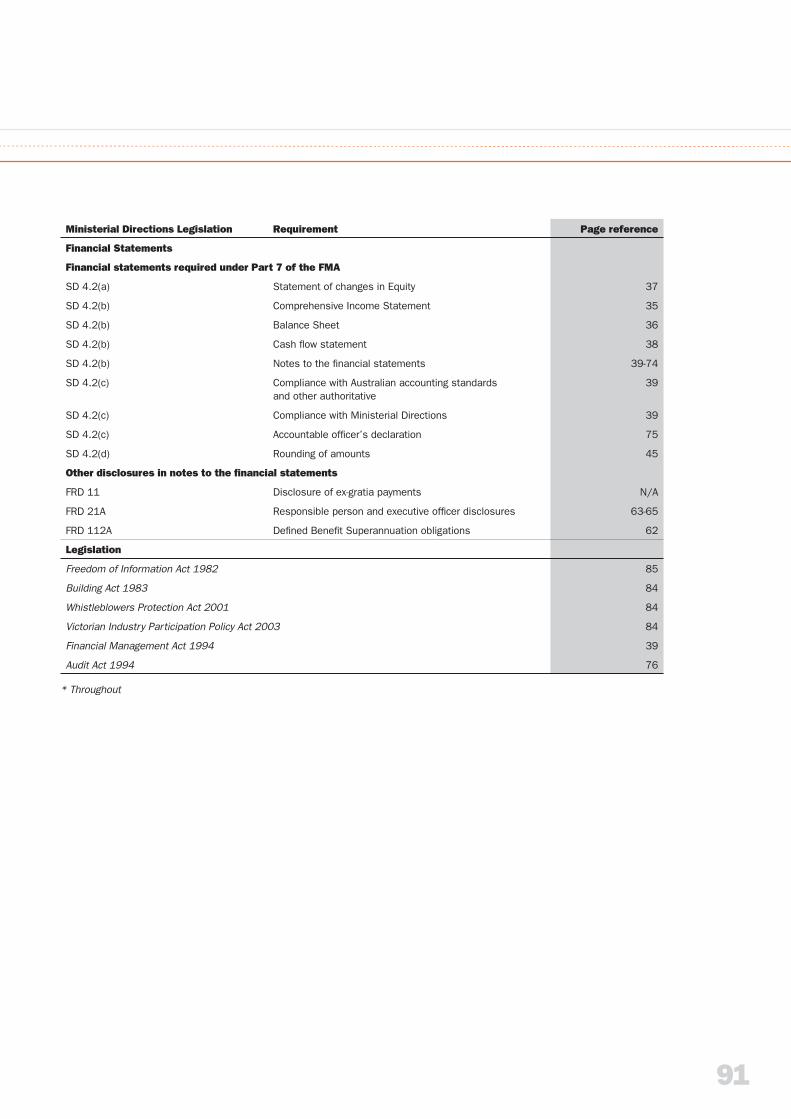
91
Ministerial Directions Legislation Requirement Page reference
Financial Statements
Financial statements required under Part 7 of the FMA
SD 4.2(a) Statement of changes in Equity 37
SD 4.2(b) Comprehensive Income Statement 35
SD 4.2(b) Balance Sheet 36
SD 4.2(b) Cash fl ow statement 38
SD 4.2(b) Notes to the fi nancial statements 39-74
SD 4.2(c) Compliance with Australian accounting standardsand other authoritative
39
SD 4.2(c) Compliance with Ministerial Directions 39
SD 4.2(c) Accountable offi cer’s declaration 75
SD 4.2(d) Rounding of amounts 45
Other disclosures in notes to the fi nancial statements
FRD 11 Disclosure of ex-gratia payments N/A
FRD 21A Responsible person and executive offi cer disclosures 63-65
FRD 112A Defi ned Benefi t Superannuation obligations 62
Legislation
Freedom of Information Act 1982 85
Building Act 1983 84
Whistleblowers Protection Act 2001 84
Victorian Industry Participation Policy Act 2003 84
Financial Management Act 1994 39
Audit Act 1994 76
* Throughout
Wipe off 5.Belt up, or suffer the pain.
If you drink, then drive, you’re a bloody idiot.
Don’t fool yourself, speed kills.
Only a little bit over? You bloody idiot.
What’s between you and the operating theatre?Don’t push fatigue. Pull over.Distracted drivers are dangerous.A 15 minute power nap could save your life.If you drive on drugs, you’re out of your mind.
Annual Report 2010
TRANSPORT ACCIDENT COMMISSION 60 Brougham Street, Geelong VIC 3220 • PO Box 742, Geelong VIC 3220 • Telephone 1300 654 329 • www.tac.vic.gov.au


