Annals of Nuclear Energy 101 (2017) 312–321
Contents lists available at ScienceDirect
Annals of Nuclear Energy
journal homepage: www.elsevier .com/locate /anucene
The neutronics scheme adopted for the HELIOS irradiation experiment inthe High Flux Reactor Petten
http://dx.doi.org/10.1016/j.anucene.2016.11.0170306-4549/� 2016 The Authors. Published by Elsevier Ltd.This is an open access article under the CC BY-NC-ND license (http://creativecommons.org/licenses/by-nc-nd/4.0/).
⇑ Corresponding author.E-mail address: [email protected] (E. D’Agata).
E. D’Agata a,⇑, C. Döderlein a, H. Tsige-Tamirat a, M. Oettingen b, R. Mutnuru c
a European Commission, Joint Research Centre, Institute for Energy and Transport (JRC-IET), P.O. Box 2, NL-1755 ZG Petten, The NetherlandsbAGH University of Science and Technology, al. A. Mickiewicza 30, 30-059 Krakow, PolandcNuclear Research and Consultancy Group (NRG), P.O. Box 25, NL-1755 ZG Petten, The Netherlands
a r t i c l e i n f o
Article history:Received 18 May 2016Received in revised form 26 October 2016Accepted 11 November 2016Available online 28 November 2016
a b s t r a c t
A dedicated neutronics computational scheme is a crucial tool in the preparation and the post-analysis ofan irradiation experiment, as it defines the key parameters of the experiment. The complex and verydynamic environment of a Materials Testing Reactor (MTR) core, on the other hand, represents a chal-lenging object for neutronics calculations. Within the framework of the HELIOS experiment conductedat the High Flux Reactor (HFR) in Petten (The Netherlands) in 2009 under the European ProjectEUROTRANS, a new neutronics scheme has been developed with the objective of finding the optimumbalance between accuracy and calculation performance. This scheme is based on the Monte-Carlo tech-nique and employs a two-level approach by separating the problem into overlapping spatial and tempo-ral domains. The underlying physical phenomena are presented, together with elements of validationwhich gives a further insight into the effects governing the neutron fluxes in the core.� 2016 The Authors. Published by Elsevier Ltd. This is anopenaccess article under the CCBY-NC-ND license
(http://creativecommons.org/licenses/by-nc-nd/4.0/).
1. Introduction
The preparation and accurate interpretation of the results of anirradiation experiment are important steps of an irradiation cam-paign. They requires a precise knowledge of the conditions of theirradiation conditions, particularly as it concerns the neutronenergy spectrum and the fission source distribution, to better pre-dict the behaviour of the experiment during the irradiation andunderstand exactly, at the end of the campaign, how the irradiatedmaterial behaved. The neutronics evaluations necessary to obtainthese data are complicated by the particularity of the core andthe operations of a MTR. Besides the high degree of materialheterogeneity and geometrical complexity within the core compo-nents, it is the dynamic core loading and the consequential fre-quent change in the environment of the irradiation device thatneed to be taken into account (insertion, extraction of control rods;reshuffling every cycle of the fuel elements, addition of otherexperiments in the core, etc. . .). Furthermore, the composition ofthe irradiated samples can evolve significantly over the durationof the irradiation, which may extend over several months. Thispaper presents the neutronics scheme developed for the interpre-tation of the HELIOS irradiation experiment, which has been con-ducted in the HFR reactor in Petten between April 2009 and
February 2010. After a short description of the HFR reactor andthe experiment in Section 2 and 3, the Monte-Carlo based schemeis presented in Section 4. Section 5 summarises the results of thecalculations and presents first elements of the experimental vali-dation. The conclusions and the outlook on further developments,round up the presentation. Finally, the new neutronics computa-tional scheme here presented for the HELIOS experiment, maybeconsidered as a general procedure and it can be adapted to anykind of irradiation experiments when detailed knowledge aboutirradiation conditions are available.
2. The High Flux Reactor in Petten
The High Flux Reactor (HFR) in Petten is a tank-in-pool typeirradiation reactor, cooled and moderated by light water and oper-ated at a power of 45 MWth. It is in operation since 1961 and useslow-enriched U3Si2 fuel since 2006. Besides performing a widerange of technological irradiations (Fütterer et al., 2009), the HFRis one of the major European production facility of radioisotopesfor medical applications (May and Moss, 2008).
The reactor core is composed of rectangular sub-assemblies,arranged in an 8 by 7 array (see Fig. 1), 62.0 by 74.0 cm wide.The core contains 33 standard fuel assemblies (7.2 � 8.0 cm),which consist each of 20 fuel plates (plate/meat thickness1.71/0.76 mm, gap width 1.5 mm, see Fig. 2) in an aluminium cas-ing. Cadmium wires with a diameter of 0.5 mm are fixed on the
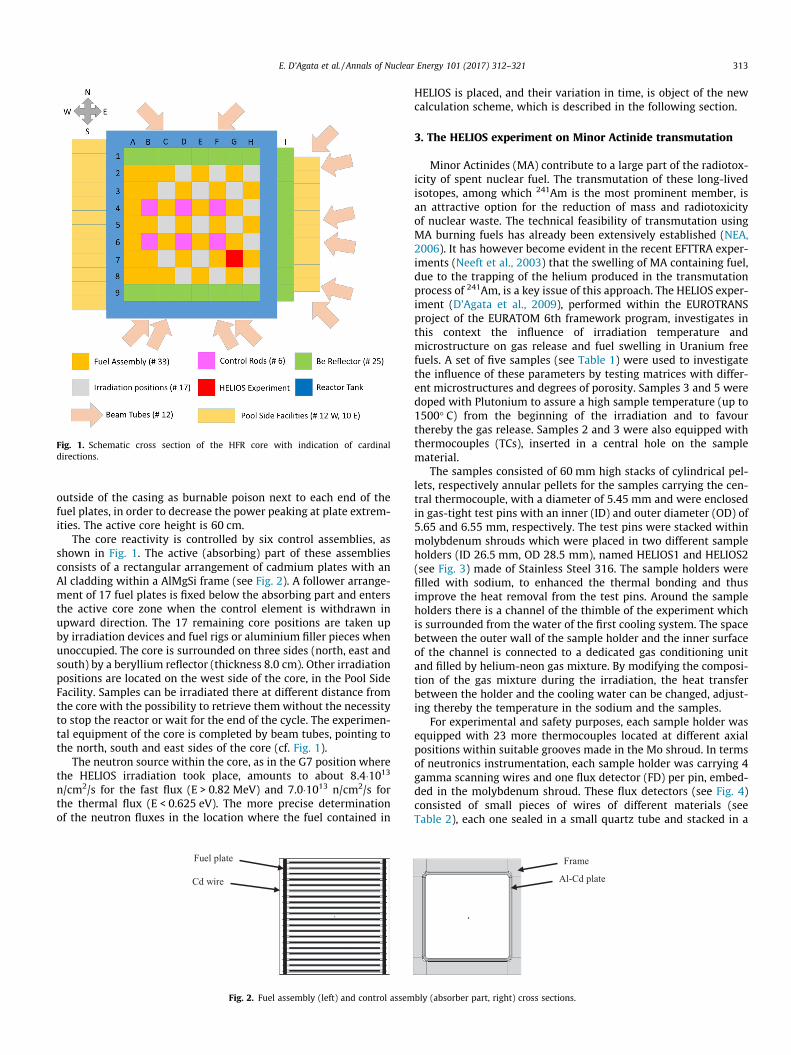
Fig. 1. Schematic cross section of the HFR core with indication of cardinaldirections.
E. D’Agata et al. / Annals of Nuclear Energy 101 (2017) 312–321 313
outside of the casing as burnable poison next to each end of thefuel plates, in order to decrease the power peaking at plate extrem-ities. The active core height is 60 cm.
The core reactivity is controlled by six control assemblies, asshown in Fig. 1. The active (absorbing) part of these assembliesconsists of a rectangular arrangement of cadmium plates with anAl cladding within a AlMgSi frame (see Fig. 2). A follower arrange-ment of 17 fuel plates is fixed below the absorbing part and entersthe active core zone when the control element is withdrawn inupward direction. The 17 remaining core positions are taken upby irradiation devices and fuel rigs or aluminium filler pieces whenunoccupied. The core is surrounded on three sides (north, east andsouth) by a beryllium reflector (thickness 8.0 cm). Other irradiationpositions are located on the west side of the core, in the Pool SideFacility. Samples can be irradiated there at different distance fromthe core with the possibility to retrieve them without the necessityto stop the reactor or wait for the end of the cycle. The experimen-tal equipment of the core is completed by beam tubes, pointing tothe north, south and east sides of the core (cf. Fig. 1).
The neutron source within the core, as in the G7 position wherethe HELIOS irradiation took place, amounts to about 8.4�1013n/cm2/s for the fast flux (E > 0.82 MeV) and 7.0�1013 n/cm2/s forthe thermal flux (E < 0.625 eV). The more precise determinationof the neutron fluxes in the location where the fuel contained in
Fuel plate
Cd wire
Fig. 2. Fuel assembly (left) and control assem
HELIOS is placed, and their variation in time, is object of the newcalculation scheme, which is described in the following section.
3. The HELIOS experiment on Minor Actinide transmutation
Minor Actinides (MA) contribute to a large part of the radiotox-icity of spent nuclear fuel. The transmutation of these long-livedisotopes, among which 241Am is the most prominent member, isan attractive option for the reduction of mass and radiotoxicityof nuclear waste. The technical feasibility of transmutation usingMA burning fuels has already been extensively established (NEA,2006). It has however become evident in the recent EFTTRA exper-iments (Neeft et al., 2003) that the swelling of MA containing fuel,due to the trapping of the helium produced in the transmutationprocess of 241Am, is a key issue of this approach. The HELIOS exper-iment (D’Agata et al., 2009), performed within the EUROTRANSproject of the EURATOM 6th framework program, investigates inthis context the influence of irradiation temperature andmicrostructure on gas release and fuel swelling in Uranium freefuels. A set of five samples (see Table 1) were used to investigatethe influence of these parameters by testing matrices with differ-ent microstructures and degrees of porosity. Samples 3 and 5 weredoped with Plutonium to assure a high sample temperature (up to1500� C) from the beginning of the irradiation and to favourthereby the gas release. Samples 2 and 3 were also equipped withthermocouples (TCs), inserted in a central hole on the samplematerial.
The samples consisted of 60 mm high stacks of cylindrical pel-lets, respectively annular pellets for the samples carrying the cen-tral thermocouple, with a diameter of 5.45 mm and were enclosedin gas-tight test pins with an inner (ID) and outer diameter (OD) of5.65 and 6.55 mm, respectively. The test pins were stacked withinmolybdenum shrouds which were placed in two different sampleholders (ID 26.5 mm, OD 28.5 mm), named HELIOS1 and HELIOS2(see Fig. 3) made of Stainless Steel 316. The sample holders werefilled with sodium, to enhanced the thermal bonding and thusimprove the heat removal from the test pins. Around the sampleholders there is a channel of the thimble of the experiment whichis surrounded from the water of the first cooling system. The spacebetween the outer wall of the sample holder and the inner surfaceof the channel is connected to a dedicated gas conditioning unitand filled by helium-neon gas mixture. By modifying the composi-tion of the gas mixture during the irradiation, the heat transferbetween the holder and the cooling water can be changed, adjust-ing thereby the temperature in the sodium and the samples.
For experimental and safety purposes, each sample holder wasequipped with 23 more thermocouples located at different axialpositions within suitable grooves made in the Mo shroud. In termsof neutronics instrumentation, each sample holder was carrying 4gamma scanning wires and one flux detector (FD) per pin, embed-ded in the molybdenum shroud. These flux detectors (see Fig. 4)consisted of small pieces of wires of different materials (seeTable 2), each one sealed in a small quartz tube and stacked in a
Frame
Al-Cd plate
bly (absorber part, right) cross sections.

Table 1Main characteristics of the HELIOS samples used for neutronic calculations.
Sample no Composition Density [g/cm3] Theoretical Density (TD) Measured [%] Final Density based on TD [g/cm3] Mass [g] Volume [cm3]
Pu Am241
1 MgO + Am2Zr2O7 0.66 91.50 3.96 5.54 1.402a (Am,Zr,Y)O2 0.70 92.60 5.91 7.71 1.313a (Pu,Am,Zr,Y)O2 0.41 0.74 89.70 5.95 7.77 1.314 (Am,Zr,Y)O2 + Mo 0.69 94.10 8.84 12.38 1.405 (Pu,Am)O2 + Mo 1.24 0.30 94.00 9.99 13.98 1.40
a Central thermocouple.
Fig. 3. Schematic view of HELIOS sample holders.
Fig. 4. Configuration of the flux detectors (FDs).
Table 2Flux detector (FD) materials.
FD material Approx. mass [mg]
NiCo (1 wt% Co) 0.07Fe 0.7Ti 1.0Nb 0.75
1 The vertical position was not significantly changed during the HELIOS irradiation,xcept for cycles 5 and 6 where the rig was lifted by 3–4 cm.
314 E. D’Agata et al. / Annals of Nuclear Energy 101 (2017) 312–321
stainless steel tube (£2.0 mm, length 25 mm). The FDs werelocated next to each fuel sample, with the steel tube fitted into acorresponding groove in the molybdenum tube, as to measure
the local irradiation flux of the sample. The detectors have beenanalysed by gamma spectroscopy after termination of the experi-ment (Mutnuru, 2010) to determine the fluence rate within thetest samples for their analysis.
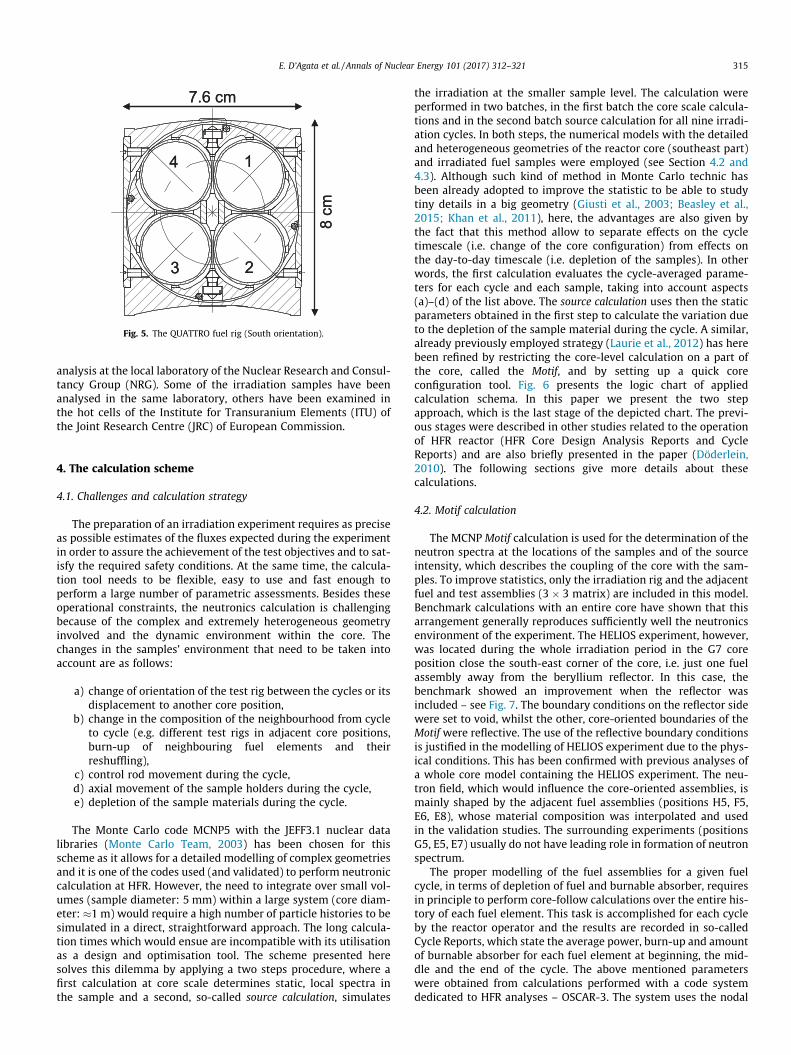
The HELIOS 1 and 2 sample holders were placed in the positions2 and 3, respectively, of a standard QUATTRO rig (see Fig. 5), posi-tions 1 and 4 being filled with aluminium dummies. The rig takesthe place of a fuel assembly in the HFR core (see below) andassures the sample holders to be cooled by the core’s coolant flow.The sample holders could be moved vertically during irradiation byup to 150 mm by means of the Vertical Displacement Unit, in orderto compensate for changes in vertical flux profile1. After each reac-tor cycle, which lasted between 22 and 31 days, the rig was rotatedhorizontally by 180� to reduce the influence of radial flux gradients.
The irradiation of the HELIOS experiment lasted 240 equivalentfull power days. After a cooling period, the sample holders wereextracted from the rig and disassembled. The gamma scanningwires and the flux detectors underwent gamma-spectroscopy
e
14
3 2
7.6 cm
8 cm
14
3 2
7.6 cm
8 cm
Fig. 5. The QUATTRO fuel rig (South orientation).
E. D’Agata et al. / Annals of Nuclear Energy 101 (2017) 312–321 315
analysis at the local laboratory of the Nuclear Research and Consul-tancy Group (NRG). Some of the irradiation samples have beenanalysed in the same laboratory, others have been examined inthe hot cells of the Institute for Transuranium Elements (ITU) ofthe Joint Research Centre (JRC) of European Commission.
4. The calculation scheme
4.1. Challenges and calculation strategy
The preparation of an irradiation experiment requires as preciseas possible estimates of the fluxes expected during the experimentin order to assure the achievement of the test objectives and to sat-isfy the required safety conditions. At the same time, the calcula-tion tool needs to be flexible, easy to use and fast enough toperform a large number of parametric assessments. Besides theseoperational constraints, the neutronics calculation is challengingbecause of the complex and extremely heterogeneous geometryinvolved and the dynamic environment within the core. Thechanges in the samples’ environment that need to be taken intoaccount are as follows:
a) change of orientation of the test rig between the cycles or itsdisplacement to another core position,
b) change in the composition of the neighbourhood from cycleto cycle (e.g. different test rigs in adjacent core positions,burn-up of neighbouring fuel elements and theirreshuffling),
c) control rod movement during the cycle,d) axial movement of the sample holders during the cycle,e) depletion of the sample materials during the cycle.
The Monte Carlo code MCNP5 with the JEFF3.1 nuclear datalibraries (Monte Carlo Team, 2003) has been chosen for thisscheme as it allows for a detailed modelling of complex geometriesand it is one of the codes used (and validated) to perform neutroniccalculation at HFR. However, the need to integrate over small vol-umes (sample diameter: 5 mm) within a large system (core diam-eter: �1 m) would require a high number of particle histories to besimulated in a direct, straightforward approach. The long calcula-tion times which would ensue are incompatible with its utilisationas a design and optimisation tool. The scheme presented heresolves this dilemma by applying a two steps procedure, where afirst calculation at core scale determines static, local spectra inthe sample and a second, so-called source calculation, simulates
the irradiation at the smaller sample level. The calculation wereperformed in two batches, in the first batch the core scale calcula-tions and in the second batch source calculation for all nine irradi-ation cycles. In both steps, the numerical models with the detailedand heterogeneous geometries of the reactor core (southeast part)and irradiated fuel samples were employed (see Section 4.2 and4.3). Although such kind of method in Monte Carlo technic hasbeen already adopted to improve the statistic to be able to studytiny details in a big geometry (Giusti et al., 2003; Beasley et al.,2015; Khan et al., 2011), here, the advantages are also given bythe fact that this method allow to separate effects on the cycletimescale (i.e. change of the core configuration) from effects onthe day-to-day timescale (i.e. depletion of the samples). In otherwords, the first calculation evaluates the cycle-averaged parame-ters for each cycle and each sample, taking into account aspects(a)–(d) of the list above. The source calculation uses then the staticparameters obtained in the first step to calculate the variation dueto the depletion of the sample material during the cycle. A similar,already previously employed strategy (Laurie et al., 2012) has herebeen refined by restricting the core-level calculation on a part ofthe core, called the Motif, and by setting up a quick coreconfiguration tool. Fig. 6 presents the logic chart of appliedcalculation schema. In this paper we present the two stepapproach, which is the last stage of the depicted chart. The previ-ous stages were described in other studies related to the operationof HFR reactor (HFR Core Design Analysis Reports and CycleReports) and are also briefly presented in the paper (Döderlein,2010). The following sections give more details about thesecalculations.
4.2. Motif calculation
The MCNP Motif calculation is used for the determination of theneutron spectra at the locations of the samples and of the sourceintensity, which describes the coupling of the core with the sam-ples. To improve statistics, only the irradiation rig and the adjacentfuel and test assemblies (3 � 3 matrix) are included in this model.Benchmark calculations with an entire core have shown that thisarrangement generally reproduces sufficiently well the neutronicsenvironment of the experiment. The HELIOS experiment, however,was located during the whole irradiation period in the G7 coreposition close the south-east corner of the core, i.e. just one fuelassembly away from the beryllium reflector. In this case, thebenchmark showed an improvement when the reflector wasincluded – see Fig. 7. The boundary conditions on the reflector sidewere set to void, whilst the other, core-oriented boundaries of theMotif were reflective. The use of the reflective boundary conditionsis justified in the modelling of HELIOS experiment due to the phys-ical conditions. This has been confirmed with previous analyses ofa whole core model containing the HELIOS experiment. The neu-tron field, which would influence the core-oriented assemblies, ismainly shaped by the adjacent fuel assemblies (positions H5, F5,E6, E8), whose material composition was interpolated and usedin the validation studies. The surrounding experiments (positionsG5, E5, E7) usually do not have leading role in formation of neutronspectrum.
The proper modelling of the fuel assemblies for a given fuelcycle, in terms of depletion of fuel and burnable absorber, requiresin principle to perform core-follow calculations over the entire his-tory of each fuel element. This task is accomplished for each cycleby the reactor operator and the results are recorded in so-calledCycle Reports, which state the average power, burn-up and amountof burnable absorber for each fuel element at beginning, the mid-dle and the end of the cycle. The above mentioned parameterswere obtained from calculations performed with a code systemdedicated to HFR analyses – OSCAR-3. The system uses the nodal

Fig. 6. Logic chart with calculation steps.
316 E. D’Agata et al. / Annals of Nuclear Energy 101 (2017) 312–321
method for neutron transport calculations and is equipped withspecific pre and post processing tools. Benchmarks on HFR core cal-culations performed during HEU/LEU conversion studies haveshown a good agreement between the results of the OSCAR-3 sys-tem and the REBUS code. The experimental validation of theOSCAR-3 system was performed by comparing numerical simula-tions and measurement of irradiated copper wires (Müller et al.,1994). For the use of this scheme, a particular reconstructionmethod has been developed which configures the different fuelassemblies in the MCNP-Motif problem according to the informa-tion of the Cycle Report and the corresponding core loadingscheme for each cycle. If the calculation concerns a future corewith a presumed configuration, the assembly compositions areautomatically interpolated from an existing stock of known assem-bly compositions.
The aforementioned reconstruction of the nuclide concentra-tion is accomplished by a dedicated Python code which uses differ-
ent algorithms for the fissile and burnable-poison nuclides as wellas the fission products. The concentration of fissile nuclides except235U is interpolated from the nuclide concentrations found in theassemblies of the MCNP sample problem, with the uranium andthe cadmium content as free parameters. The MCNP-model of afuel assembly, which models all fuel plates heterogeneously,divides the fuel into 8 vertical zones; the Cadmium wires are splitinto 4 radial and 8 axial zones. The assemblies modelled in thesample problem have been irradiated for different numbers ofcycles in the mean spectrum of the core and display therefore arepresentative nuclide vector and axial distribution of the burn-up. The interpolation for the cadmium burnable poison is straight-forward, as the total amount of the most important isotope 113Cd isgiven as input data. The fission and decay products are interpolatedfrom the output of a depletion calculation with the MCNPX code ofa standard fuel element. The applied algorithm creates thedensities of about 70 nuclides by linear interpolation between

Fig. 7. Differences in the normalised assembly power distribution of whole core and the results of Motif calculations.
Fig. 8. Thermal and fast neutron fluxes in the vicinity of samples 4 (beginning ofirradiation).
Fig. 9. Thermal and fast neutron fluxes in the vicinity of samples 5 (beginning ofirradiation).
E. D’Agata et al. / Annals of Nuclear Energy 101 (2017) 312–321 317
irradiation cycles, with the 235U mass in the assembly as freeparameter (Khan et al., 2011).
The purpose of the Motif calculation is the determination of theneutron spectra and source strength in the sample locations for thesubsequent source calculations. The samples, however, containstrong absorbers the concentration of which it changes with timeand dynamically perturb the neutron flux to which the samplesare exposed. This is shown in Figs. 8 and 9, which traces the calcu-lated fast and thermal flux in the vicinity of samples 4 and 5 at thebeginning of the irradiation as a function of the distance from thesample centre. For sample 5, which contains the highest amount ofPlutonium at the beginning of irradiation, the thermal flux isdepressed by about 30% whereas the fast flux is increased. In sam-ple 4, containing initially no Plutonium, the fast and thermal fluxdecreased by about 25%. This comparison illustrates the need totake into account, in some way, the depletion of the samples dur-ing irradiation. For the flux sampling calculations using Motifnumerical model, which postulates a separation of core/sampleeffects, the samples are therefore replaced by aluminium dum-mies. The flux is sampled on a cylindrical surface enclosing theinner part (£10 mm, height 60 mm) of the experiment (the sampleand the sodium surrounding it) with a MCNP type 2 and 5 tally inthe 172 XMAS energy groups structure.
The normalisation factor Ni of the Motif calculation is based onthe results of the core follow calculations, which provide theamount of power produced in the assemblies of the Motif calcula-tion Pi. With N0 as the normalisation factor for the HFR at 45MWth
nominal power (3.41�1018), the normalisation factor Ni is thengiven by
Ni ¼ PiN0
45MWð1Þ
The normalisation factor is necessary for the normalisation offlux-based tallies available in the MCNP/MCB codes to obtain thevalues of neutron fluxes impinging fuel samples. It is also used tocalculate source strengths for source calculations (see Section 4.3).The total normalisation factor N0 allows to couple the releasedpower with the neutron flux especially for the purpose of thenumerical modelling. It is applied to calculate neutron fluxes infuel assemblies, experiments and other devices located in the coreof HFR. The N0 was determined throughout the HEU/LEU conver-sion studies initiated in September 2005 and finished in May2006 by NRG (Valkó, 2005a).
4.3. The source calculation
The geometry model used for the source calculation is shown inFig. 10. It consists of the sample with the cladding and the sur-rounding sodium layer (£10 mm). The fuel in the sample is subdi-vided in 8 equivolumetric radial layers, each composed of anindividually depleting material. The flux sampled on the cylindricalsurface in Motif modelling (172 energy groups) was transferred tothe spherical surface (/80 mm) for MCB modelling. Test calcula-tions show negligible difference between MCB modelling with

Sodium
CladSample material (8 layers)
Sourcesurface
Fig. 10. Source calculation geometry in vertical (left) and horizontal section (right).
Flux detector
Molybdenumshroud
Na-fillingtube
Fig. 11. Detail of the test device modelling with the flux detector.
318 E. D’Agata et al. / Annals of Nuclear Energy 101 (2017) 312–321
cylindrical and spherical surface but the latter option has beenfound easier for numerical implementation. The sample is in thecentre of a void sphere which serves as source surface. For samples2 and 3, equipped with central thermocouples, the model wasadapted accordingly.
The depletion calculation is performed with the Monte CarloContinuous Energy Burn-up Code MCB code with JEFF3.1 nucleardata libraries (Cetnar, 2006a), which is a coupling of the MCNP5(Monte Carlo Team, 2003) radiation transport code with the Trans-mutation Trajectory Analysis code (TTA). The MCNP subroutinesare used for transport calculations and TTA solves the Batemanequations, i.e. the set of first order differential equations whichdescribe the transmutation and decay chains (Cetnar, 2006b). Typ-ically, the nuclear transmutation system consists of non-lineartransmutation chains. The MCB code solves this problem by usingthe linear chain method. The general non-linear transmutationchain is decomposed into a series of linear chains and then eachof them is solved separately. The obtained linear chains are calledtransmutation trajectories. Every transmutation trajectory con-tributes to the final density of a particular nuclide, but mass flowis not preserved on the single trajectory level because of branchingto non-linear chains. The mass flow balance criterion is preservedfor all trajectories together.
Benchmark calculations performed with MCB and the FISPACTcode (Forrest, 2003) within the framework of this scheme revealedconsiderable discrepancies in the prediction of the 242mAm produc-tion in the two codes (Oettingen and et al., 2012), specifically insystems having thermalized spectra, such as in the HFR. Conse-quently, an improved treatment of the 242Am/242mAm branchingratio method for thermal neutron spectra was implemented inthe MCB code.
The probability of isomer creation is described by the branchingratio which, in turn, depends on the incident neutron energy. InFISPACT the branching ratio up to the end of the resolved reso-nance range is represented by a constant value, while MCB appliesthe model of the effective branching ratio:
beff ¼R10 bmðEÞrcðEÞuðEÞdER10 rcðEÞuðEÞdE ð2Þ
where,bmðEÞ – energy-dependent branching ratio to the metastable state,rcðEÞ – energy-dependent neutron capture cross section on 241Am,uðEÞ – energy-dependent neutron flux.
The MCB code has options both for eigenvalue and fixed sourcecalculations. In the latter case, the system is normalized to theexternal source strengths (absolute flux values) providing onesource spectrum over all nine irradiation cycles. The neutron spec-trum in the XMAS 172 group structure impinging fuel samplesfrom Motif calculations was imposed on the source surface sur-rounding fuel samples. The average, external source strengths foreach fuel sample were calculated using Eq. (3).
Uo ¼P9
i¼1/i � Ni � tiP9
i¼1tið3Þ
where:/i – total neutron flux impinging on the samples from Motifcalculations,ti – length of irradiation cycle,Ni – partial normalisation factor calculated using (Eq. (1)).
The MCB depletion calculations divide the 240 days of irradia-tion in 14 time steps, sampling each one with 10�106 neutron his-tories. The whole calculation takes about 2 h on one 4-core 3 GHzcluster-node and achieves a statistical relative error of 0.002 in theflux tally over the sample volume.
5. Results
5.1. Test samples
The developed scheme provides all the information needed forthe preparation and the analysis of the irradiation experiment, asthe evolution of the power generated in the samples, the nuclideinventories, the specific activities and the dose rates. The compar-ison of the experimental results with the conventional pre-test cal-culations shows differences of less than 10% in the above listedquantities.
The conventional pre-test calculations were done by means ofthe MCNP code. In the applied full-core model, thirteen experimen-tal positions are filled with an idealized stainless steel experimentand four positions are filled with an idealized ‘flux trap experiment’(Khan et al., 2011). This core model was combined with a detailedmodel of theHELIOS experiments. The nuclear datawere taken fromJEF-2.2 for 27Al and 235U, and from ENDF/B-VI.5 for all othernuclides. The combination of the MCNP code with these nucleardata has been validated using many benchmark cases, as well asdedicated validation studies (Valkó, 2005a,b; Hogenbirk and vander Marck, 2002). The burn-up of the five samples in HELIOS wascalculated with the OCTOPUS code package, using a method thathas been verified explicitly for this purpose (Oppe and Kuijper,2004). The activation analysis was performed using FISPACT(Forrest, 2001). The position-averaged fluence rates calculated byMCNPhave been collapsed to theOSCAR-3 7-group structure,whichis used for the HFR cycle calculations presented in the Cycle Reports.
The post-irradiation examination (PIE) program of the HELIOSexperiment did not foresee a dissolution analysis for a measure-ment of the isotopic composition of the irradiated samples. Besidesvalidating the present scheme, such a measurement would havepermitted the validation of the improved treatment of the242mAm isomer creation in the MCB code. Consequently, other ele-ments of the experiments instrumentation were used to assess thevalidity of this scheme.
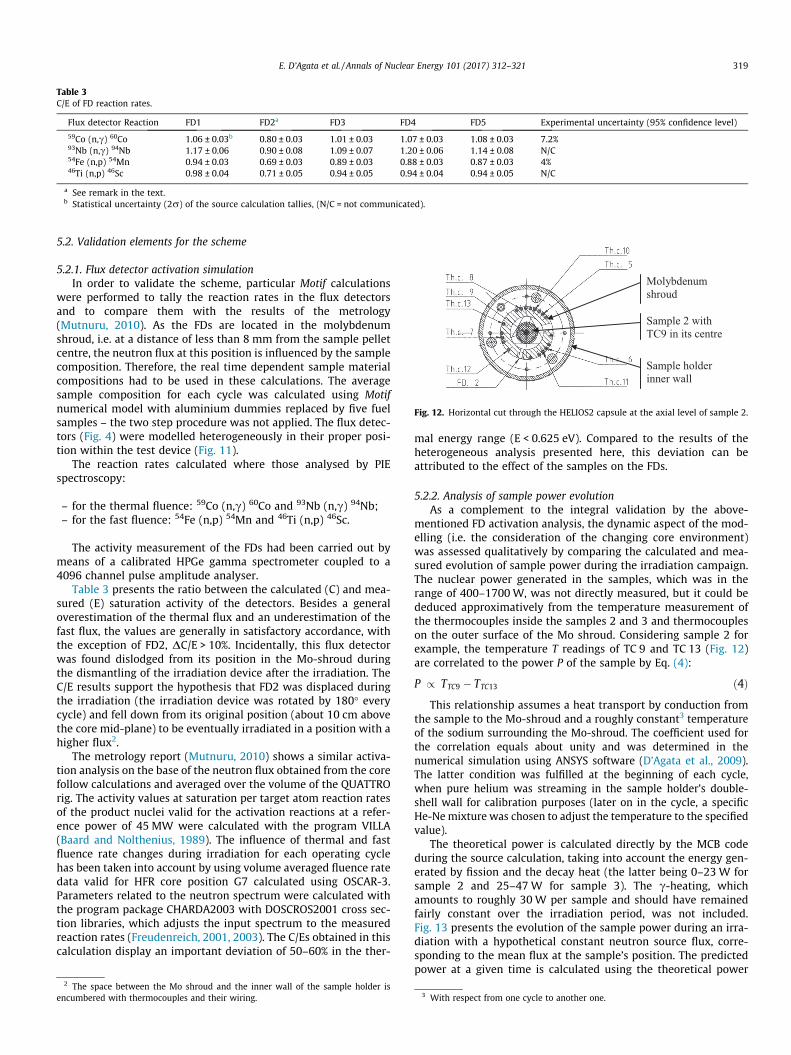
Table 3C/E of FD reaction rates.
Flux detector Reaction FD1 FD2a FD3 FD4 FD5 Experimental uncertainty (95% confidence level)
59Co (n,c) 60Co 1.06 ± 0.03b 0.80 ± 0.03 1.01 ± 0.03 1.07 ± 0.03 1.08 ± 0.03 7.2%93Nb (n,c) 94Nb 1.17 ± 0.06 0.90 ± 0.08 1.09 ± 0.07 1.20 ± 0.06 1.14 ± 0.08 N/C54Fe (n,p) 54Mn 0.94 ± 0.03 0.69 ± 0.03 0.89 ± 0.03 0.88 ± 0.03 0.87 ± 0.03 4%46Ti (n,p) 46Sc 0.98 ± 0.04 0.71 ± 0.05 0.94 ± 0.05 0.94 ± 0.04 0.94 ± 0.05 N/C
a See remark in the text.b Statistical uncertainty (2r) of the source calculation tallies, (N/C = not communicated).
Molybdenumshroud
Sample holderinner wall
Sample 2 withTC9 in its centre
Fig. 12. Horizontal cut through the HELIOS2 capsule at the axial level of sample 2.
E. D’Agata et al. / Annals of Nuclear Energy 101 (2017) 312–321 319
5.2. Validation elements for the scheme
5.2.1. Flux detector activation simulationIn order to validate the scheme, particular Motif calculations
were performed to tally the reaction rates in the flux detectorsand to compare them with the results of the metrology(Mutnuru, 2010). As the FDs are located in the molybdenumshroud, i.e. at a distance of less than 8 mm from the sample pelletcentre, the neutron flux at this position is influenced by the samplecomposition. Therefore, the real time dependent sample materialcompositions had to be used in these calculations. The averagesample composition for each cycle was calculated using Motifnumerical model with aluminium dummies replaced by five fuelsamples – the two step procedure was not applied. The flux detec-tors (Fig. 4) were modelled heterogeneously in their proper posi-tion within the test device (Fig. 11).
The reaction rates calculated where those analysed by PIEspectroscopy:
– for the thermal fluence: 59Co (n,c) 60Co and 93Nb (n,c) 94Nb;– for the fast fluence: 54Fe (n,p) 54Mn and 46Ti (n,p) 46Sc.
The activity measurement of the FDs had been carried out bymeans of a calibrated HPGe gamma spectrometer coupled to a4096 channel pulse amplitude analyser.
Table 3 presents the ratio between the calculated (C) and mea-sured (E) saturation activity of the detectors. Besides a generaloverestimation of the thermal flux and an underestimation of thefast flux, the values are generally in satisfactory accordance, withthe exception of FD2, DC/E > 10%. Incidentally, this flux detectorwas found dislodged from its position in the Mo-shroud duringthe dismantling of the irradiation device after the irradiation. TheC/E results support the hypothesis that FD2 was displaced duringthe irradiation (the irradiation device was rotated by 180� everycycle) and fell down from its original position (about 10 cm abovethe core mid-plane) to be eventually irradiated in a position with ahigher flux2.
The metrology report (Mutnuru, 2010) shows a similar activa-tion analysis on the base of the neutron flux obtained from the corefollow calculations and averaged over the volume of the QUATTROrig. The activity values at saturation per target atom reaction ratesof the product nuclei valid for the activation reactions at a refer-ence power of 45 MW were calculated with the program VILLA(Baard and Nolthenius, 1989). The influence of thermal and fastfluence rate changes during irradiation for each operating cyclehas been taken into account by using volume averaged fluence ratedata valid for HFR core position G7 calculated using OSCAR-3.Parameters related to the neutron spectrum were calculated withthe program package CHARDA2003 with DOSCROS2001 cross sec-tion libraries, which adjusts the input spectrum to the measuredreaction rates (Freudenreich, 2001, 2003). The C/Es obtained in thiscalculation display an important deviation of 50–60% in the ther-
2 The space between the Mo shroud and the inner wall of the sample holder isencumbered with thermocouples and their wiring. 3 With respect from one cycle to another one.
mal energy range (E < 0.625 eV). Compared to the results of theheterogeneous analysis presented here, this deviation can beattributed to the effect of the samples on the FDs.
5.2.2. Analysis of sample power evolutionAs a complement to the integral validation by the above-
mentioned FD activation analysis, the dynamic aspect of the mod-elling (i.e. the consideration of the changing core environment)was assessed qualitatively by comparing the calculated and mea-sured evolution of sample power during the irradiation campaign.The nuclear power generated in the samples, which was in therange of 400–1700W, was not directly measured, but it could bededuced approximatively from the temperature measurement ofthe thermocouples inside the samples 2 and 3 and thermocoupleson the outer surface of the Mo shroud. Considering sample 2 forexample, the temperature T readings of TC 9 and TC 13 (Fig. 12)are correlated to the power P of the sample by Eq. (4):
P / TTC9 � TTC13 ð4ÞThis relationship assumes a heat transport by conduction from
the sample to the Mo-shroud and a roughly constant3 temperatureof the sodium surrounding the Mo-shroud. The coefficient used forthe correlation equals about unity and was determined in thenumerical simulation using ANSYS software (D’Agata et al., 2009).The latter condition was fulfilled at the beginning of each cycle,when pure helium was streaming in the sample holder’s double-shell wall for calibration purposes (later on in the cycle, a specificHe-Nemixture was chosen to adjust the temperature to the specifiedvalue).
The theoretical power is calculated directly by the MCB codeduring the source calculation, taking into account the energy gen-erated by fission and the decay heat (the latter being 0–23W forsample 2 and 25–47W for sample 3). The c-heating, whichamounts to roughly 30W per sample and should have remainedfairly constant over the irradiation period, was not included.Fig. 13 presents the evolution of the sample power during an irra-diation with a hypothetical constant neutron source flux, corre-sponding to the mean flux at the sample’s position. The predictedpower at a given time is calculated using the theoretical power

Fig. 14. Measured and predicted power of sample nr 2.
Fig. 15. Measured and predicted power of sample nr 3.
Fig. 13. Theoretical evolution of the sample power for samples 2 and 3.
320 E. D’Agata et al. / Annals of Nuclear Energy 101 (2017) 312–321
at that time renormalising it with the flux calculated by thescheme.
Figs. 14 and 15 show the measured (estimated) and predictedpower for samples 2 and 3 at the beginning of each cycle. Thepower variations from one cycle to another are the product ofthe specific environment conditions (orientation of the test rig,control rod position, reactor power etc.) and the changing sampleproperties (depletion and transmutation of 241Am to Plutonium).Despite the very approximate nature of the power estimationmethod, it can be remarked that the predicted power is quitecoherent with the measured power, which is especially observablefor the second sample during all nine irradiation cycles. The thirdsample shows also quite good coherence for the cycles 1,2,3 and7, 8. In general, the coherence is better at the beginning of the cam-
paign within first three irradiation cycles for both considered sam-ples. Afterwards, some fluctuations occur, which may originatefrom the applied experimental and numerical setups due to thenovel nature of the method. Most probably causes are the changein the thermal properties of the sample and the decreasing sensi-tivity of the internal thermocouples under irradiation (Vitanzaand Stien, 1986). However, this must be proofed in a dedicatedintegral experiment. The comparison with the slow and small vari-ation due to the evolution of sample properties (Fig. 13) underlinesthe importance of taking into consideration the environmentconditions.
6. Conclusion and outlook
An efficient, rapid and easy to use neutronics scheme has beendeveloped to support the preparation and the analysis of irradia-tion experiments in the High Flux Reactor. The comparison withexperimental results from the HELIOS experiment shows a suffi-cient precision of the scheme. However, the studies performedwithin the framework of the present scheme development and val-idation has raised a number of topics that deserve further research:
� The comparisonwith activation codes hashighlighted the impor-tance of a refined modelling of the 241Am (n,c) 242/242mAmbranching ratio for thermal neutron spectra. This modellingmight be validated by benchmarking the scheme predictionsagainst the results of additional PIE of the HELIOS samples.
� The scheme validation demonstrated the feasibility and theinterest of a real-time measurement of the sample power. Themethod applied might be improved with dedicated instrumen-tation and/or particular experimental procedures, e.g. calibra-tion periods at the beginning and the end of the cycle.
� The strong radial flux gradient in the vicinity of Pu-containingsamples explains the shortcomings of volume averaged calcula-tion methods and helps to discern the limits of their domain ofapplicability.
References
Baard, J.H., Nolthenius H.J., 1989. Program description of VILLA, EnergieonderzoekCentrum Neterland, FYS/RASA-89/05, Petten.
Beasley, D.G. et al., 2015. Characterisation of the epithermal neutron irradiationfacility at the Portuguese research reactor using MCNP. Appl. Radiat. Isot. 99,186–192.
Cetnar, J., 2006. Development and applications of MCB – Monte Carlo ContinuousEnergy Burnup Code, WFiIS AGH Kraków, ISBN 83-921064-4-X.
Cetnar, J., 2006b. General solution of bateman equations for nuclear transmutations.Ann. Nucl. Energy 33, 640–645.
D’Agata, E., et al., HELIOS – The New Design of the Irradiation of U-free Fuels forAmericium Transmutation, Global 2009, paper 9052, SFEN, Paris, France,September 6–11, (2009).
Döderlein, Ch., 2010. User guide for the improved neutronics scheme for theinterpretation of irradiation experiments in the HFR, European Commission,Directorate General Joint Research Center, Institute for Energy, PUBSYJRC59903.
Forrest, R.A., 2001. FISPACT-2001: User manual (issue 1), UKAE FUS 450, AKAEAFusion Association, Abingdon UK.
Forrest, R.A., 2003. FISPACT-2003 User manual, EASY Documentation Series, UKAEAFUS 485.
Freudenreich, W.E., 2001. Neutron activation cross section library DOSCROS2001,NRG, MMI, Report 20689/01.40537/I, Petten.
Freudenreich, W.E., 2003. CHARDAT2003, Spectrum adjustment, Material damageand gas production, NRG, MMI, Report 21020/03.53753/I, Petten.
Fütterer, M.A. et al., 2009. Next generation fuel irradiation capability in the HighFlux Reactor Petten. J. Nucl. Mater. 392, 184–191.
Giusti, V. et al., 2003. Monte Carlo model of Studsvik BNCT clinical beam:description and validation. Med. Phys. 30 (12), 3107–3117.
Hogenbirk A., van der Marck S.C., Comparative validation results of JEFF-3T2, JEF-2.2, ENDF/B-VI.5, and JENDL-3.2 – Validation for criticality analyses, JEFDOC-911 (2002).
Khan, R. et al., 2011. Monte Carlo simulation of the thermal column and beam tubeof the TRIGA Mark II research reactor. Nucl. Eng. Des. 241 (8), 2859–2864.

E. D’Agata et al. / Annals of Nuclear Energy 101 (2017) 312–321 321
Laurie, M. et al., 2012. Results of the HFR-EU1fuel irradiation of INET and AVRpebbles in the HFR Petten. Nucl. Eng. Des. 251, 117–123.
May, R., Moss, R., 2009. Annual Report 2008 – Operation and Utilisation of the HighFlux Reactor, EUR 23952 EN (ISBN 978-92-79-12986-5), European Commission.
X-5 MONTE CARLO TEAM, 2003. MCNP – A General Monte Carlo N-ParticleTransport Code, Version 5, LA-CP-03-0245, LANL.
Müller, E.Z. et al., 1994. Development of a Core follow calculation system forresearch reactors. In: 9th Pacific Basin Nuclear conference, Sydney Australia.May 1-6, (1994).
Mutnuru, R.K., 2010. HELIOS 01 & 02 Irradiation (325-01 & 325-02), NeutronMetrology in the HFR, Internal NRG Technical Report (August 2010).
NEA, 2006. Physics and Safety of Transmutation Systems: A Status Report, ISBN 92-64-01082-3, OECD/NEA
Neeft, E. et al., 2003. The EFTTRA-T3 irradiation experiment on inert matrix fuels. J.Nucl. Mater. 320, 106–116.
Oettingen, M. et al., 2012. Comparative burn-up analysis of HELIOS experimentusing MCB and FISPACT codes. Nucl. Eng. Des. 242, 399–412.
Oppe J., Kuijper J.C., 2004. OCTOPUS_TNG Reference Guide, 20748/03.54103/C, NRG,Petten.
Valkó, J., 2005. Calculation of reactivity effects and reaction rates for the validationof calculational models – Phase 1, 251387/0460168/I NRG, Petten.
Valkó J., 2005. Calculation of activation reaction rates in the HFR – Validation ofcalculational models – Phase 2, 25138/05.64708/I, NRG, Petten.
Vitanza, C., Stien, T.E., 1986. Assessment of fuel thermocouple decalibration duringin-pile service. J. Nucl. Mater. 139, 11–18.


