
ARTICLE IN PRESS
0043-1354/$ - se
doi:10.1016/j.w
�Correspondfax: +4545 88 3
E-mail addr
Water Research 39 (2005) 1543–1552
www.elsevier.com/locate/watres
Anaerobic digestion of the organic fraction of municipal solidwaste: Influence of co-digestion with manure
Hinrich Hartmann, Birgitte K. Ahring�
The Environmental Microbiology/Biotechnology Research Group, Technical University of Denmark, BioCentrum-DTU, Building 227,
Soltofts Plads, DK-2800 Lyngby, Denmark
Received 28 April 2004; received in revised form 12 January 2005; accepted 1 February 2005
Available online 1 April 2005
Abstract
Anaerobic digestion of the organic fraction of municipal solid waste (OFMSW) was investigated in two thermophilic
(55 1C) wet digestion treatment systems R1 and R2. Initially OFMSW was co-digested with manure with a successively
higher concentration of OFMSW, at a hydraulic retention time (HRT) of 14–18 d and an organic loading rate (OLR) of
3.3–4.0 g-VS/l/d. Adaptation of the co-digestion process to a OFMSW:manure ratio of 50% (VS/VS) was established
over a period of 6 weeks. This co-digestion ratio was maintained in reactor R2 while the ratio of OFMSW to manure
was slowly increased to 100% in reactor R1 over a period of 8 weeks. Use of recirculated process liquid to adjust the
organic loading to R1 was found to have a beneficial stabilization effect. The pH rose to a value of 8 and the reactor
showed stable performance with high biogas yield and low VFA levels. The biogas yield from source-sorted OFMSW
was 0.63–0.71 l/g-VS both in the co-digestion configuration and in the treatment of 100% OFMSW with process liquid
recirculation. This yield is corresponding to 180–220m3 biogas per ton OFMSW. VS reduction of 69–74% was achieved
when treating 100% OFMSW. None of the processes showed signs of inhibition at the free ammonia concentration of
0.45–0.62 g-N/l.
r 2005 Elsevier Ltd. All rights reserved.
Keywords: Anaerobic; Co-digestion; Manure; Organic fraction of municipal solid waste; Process liquid; Recirculation
1. Introduction
Waste management has become of major concern
around the world during the recent 30 years. Sustainable
waste treatment concepts that favor waste recycling and
the recirculation of nutrients back to soil will have the
highest benefit for the environment (Lema and Omil,
2001; Sakai et al., 1996; Braber, 1995). Anaerobic
digestion (AD) of the organic fraction of municipal
solid waste (OFMSW) offers the advantage of both a net
e front matter r 2005 Elsevier Ltd. All rights reserve
atres.2005.02.001
ing author. Tel.: +4545 25 61 83;
2 76.
ess: [email protected] (B.K. Ahring).
energy gain by producing methane as well as the
production of a fertilizer from the residuals (Edelmann
et al., 2000; Sonesson et al., 2000; Hamzawi et al., 1999).
In Denmark, the aim is to use AD as the main waste
treatment process in the future with a capacity of
100,000 t of OFMSW by the year 2004 (Hartmann and
Ahring, 2004). The existing 20 centralized biogas plants
are the first option for the AD treatment of OFMSW in
co-digestion with manure. In 2002, only 50,000 t of
OFMSW were treated per year in nine biogas plants,
where up to 10% (vol.) of OFMSW was added in co-
digestion with manure (Hartmann and Ahring, 2004).
For the realization of the goal to treat 100,000 t by AD
in 2004, the ratio of OFMSW added has to be increased
d.

ARTICLE IN PRESSH. Hartmann, B.K. Ahring / Water Research 39 (2005) 1543–15521544
in the existing plants and the installation of additional
biogas plants for the treatment of OFMSW alone may
be another option. Generally, OFMSW is a very
attractive waste for the biogas plants as they are
dependent on the addition of organic waste with a high
biogas potential. The biogas yield from raw manure
alone is only 20–30m3/t and the operation of the plant is
only economically feasible when biogas yields higher
than 30m3/t of treated material can be achieved (Danish
Energy Agency, 1995). As the amount of industrial
organic waste is limited in Denmark, there will be a high
demand for OFMSW with a biogas potential of more
than 100m3/t, especially with an expansion of the
existing net of biogas plants. Adding OFMSW will,
however, change the process characteristics due to the
different characteristics of OFMSW compared to
manure: it has a low water content, a low pH and it
can have low concentrations of nutrients, when it
consists of high ratio of, e.g. garden waste (Rivard et
al., 1989, 1990). For high ratios of food waste, OFMSW
can, however, also contain high concentrations of
proteins, which can lead to inhibition by ammonia
especially when process liquid is recirculated (Gallert
and Winter, 1997). Furthermore, OFMSW can contain
considerable amounts of heavy metals and xenobiotic
compounds (Hartmann and Ahring, 2003; Braber,
1995).
The goal of the present work was to investigate how a
thermophilic wet digestion system will react when
adding OFMSW in a ratio of 50% (VS/VS) to the
manure in the co-digestion process. Finally, the adapta-
tion of the system to 100% of OFMSW using
recirculated process liquid was investigated. Results of
the reduction of xenobiotics have been previously
studied (Hartmann and Ahring, 2003). The wet diges-
tion system was preferred in order to achieve a well-
mixed process in a conventional continuously stirred
tank reactor (CSTR) and to make the results directly
applicable in the Danish large-scale biogas reactors.
2. Methods
2.1. Waste characterization
OFMSW used in this investigation came from the
municipality of Grindsted (Denmark) where OFMSW is
source-sorted in the households in paper bags and co-
digested together with sewage sludge at the municipal
wastewater plant. Samples were taken after the on-site
shredder device, further homogenized in an industrial
meat mincer and stored at �18 1C until used as feeding
substrate. Two different batches of homogenized
OFMSW were fed into the reactors R1 and R2, batch
1 before day 217 and batch 2 after day 217. Character-
ization of the waste was performed by analysis of TS,
VS, and COD according to standard methods (APHA et
al., 1992). The composition of the OFMSW with regard
to hemicellulose, cellulose and lignin was determined in
triplicates in batch 1 by sequential fiber analysis
according to the method of Goehring and van Soest
(1970). The biogas potential of OFMSW collected in
batch 1 and cow manure in different co-digestion ratios
were measured in triplicate batch experiments with
inoculum from reactor R1, treating OFMSW in co-
digestion with manure. OFMSW and cow manure,
diluted to a concentration of 5% VS, was filled into
100ml batch vials in different ratios equivalent to a total
amount of 1 g-VS. After adding 15ml inoculum and
10ml of tap water the vials were flushed with a gas
mixture of 80% N2 and 20% CO2 before closing the
vials. The vials were incubated at 55 1C for 60 d.
Methane production was monitored every 3–4 d by
analysis of CH4 concentration in the headspace using
gas chromatography with flame ionization detection.
The CH4 production was standardized by sampling the
same volume (0.2ml) from the batch vials under
pressure as from a 30% CH4 standard under standard
conditions (1 bar, 20 1C). At a pressure higher than 2 bar
in the vials, the pressure was released and the amount of
CH4 released was determined by the difference of the
amount of CH4 in the vials before and after release. The
biogas potential was determined after 44 d of incuba-
tion, after which no significant increase in methane
production was observed.
2.2. Reactor set-up
The treatment process was investigated in two 4.5 l
lab-scale reactors R1 and R2 with an active volume of
3.0 l operated under thermophilic conditions (55 1C).
Each reactor was fed three times a day with a total
feeding volume of 170–210ml/d, resulting in a hydraulic
retention time (HRT) of 14–18 d. OFMSW and manure
were diluted in a ratio of 1:5 and 1:1.43, respectively, to
reach an influent VS concentration of 6% for both
substrates, resulting in an organic loading rate (OLR) of
3.3–4.0 g-VS/l/d. New influent was prepared every 3–4 d
and stored in 1 l glass vessels, which were stirred for
2min before feeding. The reactors were stirred for
15min in intervals of 15min. Effluent from the reactors
was collected in 1 l Erlenmeyer vessels. For recirculation
of process liquid in reactor R1 the effluent was collected
during a period of 3–4 d, centrifuged at 4000 rpm for
30min and the supernatant was decanted and used for
dilution of OFMSW for the influent (Fig. 1). After
centrifugation 9271% of the total effluent mass was
recovered in the liquid phase, containing 3473% and
2574% of the total effluent TS and VS, respectively.
Depending on volume loss by sampling and fluctuations
in feeding volume, the ratio of the supernatant of the
effluent, which was used as process liquid, to the whole

ARTICLE IN PRESS
2
3
4
5
1
1b 1c
1a
1 2
3
4
5
1c
1a
4a
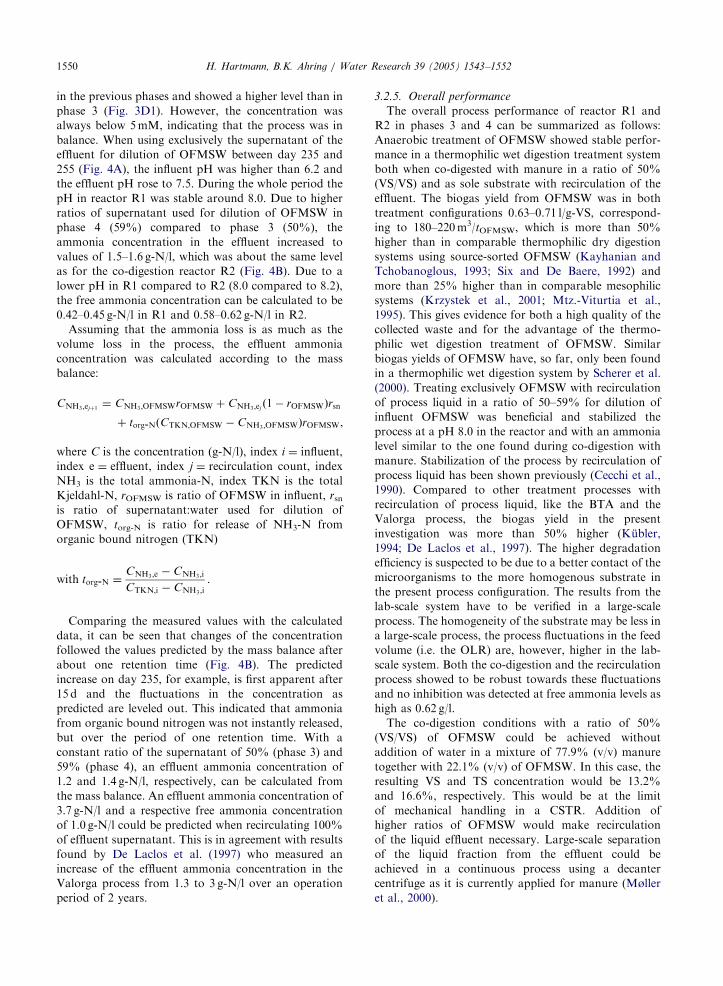
Fig. 1. Reactor set-up for co-digestion (left) and treatment of 100% OFMSW with recirculation of process water (right): (1) influent
storage vessel; (1a) OFMSW; (1b) manure; (1c) water; (2) influent pump for reactor; (3) thermophilic reactor with heating jacket and
mechanical stirrer; (4) storage vessel for effluent; (4a) supernatant of effluent after centrifugation and (5) gas meter.
Table 1
Average process parameters in the different experimental phases
Parameter Phase 1 (days 0–83) Phase 2 (days 84–139) Phase 3 (days 140–216) Phase 4 (days 217–330)
50% OFMSW R1, R2 100% OFMSW R1 Recirculation R1 Batch 2 OFMSW
HRT (d)
R1 15.5 (2.2) 13.5 (2.8) 17.0 (5.5) 17.7 (7.7)
R2 15.3 (1.2) 17.5 (3.7) 17.9 (4.4) 16.0 (2.9)
OLR (g-VS/l/d)
R1 3.5 (0.4) 4.0 (1.0) 3.3 (1.1) 3.4 (1.2)
R2 3.6 (0.3) 3.4 (0.7) 3.3 (0.8) 3.3 (0.6)
%Rec.
R1 — — 50 59
%Rec.: ratio of effluent supernatant to total liquid volume used for dilution of influent OFMSW; standard deviation in brackets.
H. Hartmann, B.K. Ahring / Water Research 39 (2005) 1543–1552 1545
liquid added for dilution of influent OFMSW varied
between 23% and 100% and was in average 50% and
59% in the experimental phases, when recirculation was
applied (Table 1).
The reactor experiment was divided in four phases
(Table 1). In phase 1 (days 0–83) both reactors R1 and
R2 were initially loaded with cow manure for 10 d and
then adapted to a higher load of OFMSW by an increase
of the OFMSW ratio in 5% steps (on VS basis) every
3–4 d. After one month both reactors were running with
50% (VS/VS) OFMSW for a period of 42 d (2.7HRT).
R2 was further used in phases 2–4 as control reactor
maintaining a co-digestion ratio of 50% (VS/VS)
OFMSW until the end of the experiment. From day 84
to 139 (phase 2) the OFMSW ratio in reactor R1 was
increased to 100% and from day 116 to 139 OFMSW
was added after dilution with water. Use of the liquid
fraction of the effluent for dilution of OFMSW before
feeding of R1 was started on day 140. Since a new batch
of OFMSW was used from day 217, the last experi-
mental period was divided into phase 3 (days 140–216)
and phase 4 (days 217–330). HRT and OLR were in
average 13.5–17.9 d and 3.3–4.0 g-VS/l/d, respectively.
The variations were due to variations of the pumping
volume caused by the inhomogeneity of the substrate.
Process parameters are displayed in Table 1 as averages
of the whole period of phases 3 and 4 and of the periods
of phases 1 and 2, when the reactors were fed with a
constant mixture of 50% OFMSW:(VS/VS) and 100%
OFMSW, respectively.
2.3. Monitoring parameters
Biogas production was measured by liquid displacement
gas measurement systems connected to the headspace of
the effluent vessels, logging the gas production automati-
cally in 10ml intervals. The methane content of the biogas
was analyzed by gas chromatography as previously

ARTICLE IN PRESS
NDF
(non-soluble)
(%ofVS)
NDF–ADF
(hemicellulose)
(%ofVS)
ADF–ADL
(cellulose)(%
ofVS)
ADL(lignin)
(%ofVS)
36.6(2.1)
13.1(3.5)
5.0(0.4)
18.5(0.9)
——
——
——
——
standarddeviationinbrackets.
H. Hartmann, B.K. Ahring / Water Research 39 (2005) 1543–15521546
described by Sørensen et al. (1991). The methane yield in
the reactors was calculated as average over a period of
3–4d as YCH4¼ sumðml CH4Þprod=sumðg-VSÞfeed: The
process performance was monitored by volatile solids
(VS) reduction, volatile fatty acids (VFA) concentration,
pH, and ammonia formation. VS reduction was deter-
mined as difference in VS concentration in the influent
times influent volume and VS concentration in the effluent
times effluent volume. TS, VS, pH and ammonia in the
influent and effluent of the reactor system were determined
according to standard methods (APHA et al., 1992). The
ratio of free ammonia to total ammonia was calculated
according to Anthonisen et al. (1976):
Free-NH3
Total-NH3¼
10pH
10pH þ 1=Ka
¼10pH
10pH þ e6344=ð273þTÞ
where T is the temperature in 1C.
The single VFA’s acetate, propionate, isobutyrate and
butyrate were analyzed by gas chromatography as
described by Sørensen et al. (1991).
Table2
CharacteristicsofOFMSWandmanureusedinthereactorexperiment
TS(%)
VS(%)
COD
(g/kg)
Total-N
(g/kg)
Total-N
(g/kg-TS)
NH3-N
(g/kg)
OFMSW
Batch1
35.6(0.10)
30.7(0.17)
431(9.3)
6.3(0.46)
17.7
1.0(0.10)
Batch2
33.6(0.49)
30.7(0.16)
——
——
Manure
11.5(0.45)
8.5(0.03)
—4.6(0.06)
40.0
3.0(0.02)
NDF:neutraldetergentfiberfraction,ADF:aciddetergentfiberfraction,ADL:aciddetergentligninfraction,
3. Results and discussion
3.1. Waste characteristics
VS concentration in the two batches of OFMSW used
for the experiment was 31% with a VS/TS ratio of
86–91% and a COD/VS ratio of 1.4 (Table 2). The
collected waste was, furthermore, characterized by only
1% (w/w) of impurities (plastic, metal, glass). This high
purity of the waste shows the high efficiency of the waste
collection concept in the municipality of Grindsted. The
total nitrogen content of OFMSW was higher than that
of the manure used, but lower per kg dry matter,
meaning that manure contributed to more nitrogen
during co-digestion of equal amounts of manure and
OFMSW. The free ammonia concentration was three
times lower for OFMSW than for manure.
In the batch experiment, a methane yield of 0.40 l/g-
VS of OFMSW was found (Fig. 2), which was 82% of
the maximal theoretical yield of 0.49 l/g-VS, calculated
from the COD content of OFMSW. The methane yield
in the co-mixture of OFMSW and manure increased
linearly with higher ratios of OFMSW, showing no signs
of inhibition or nutrient deficiency at high OFMSW
ratios (Fig. 2). With a methane content of 60% in the
biogas, the maximal biogas yield was 0.82 l/g-VS. This
was close to the theoretical biogas yield of 0.81 l/g-VS,
which was calculated by Scherer et al. (2000), based on a
composition of 3% fat (1.42 l/g-TS), 13% protein (0.89 l/
g-TS), 17% cellulose (0.96 l/g-TS), 8.5% lignin (0.0 l/g-
TS) and 58.5% carbohydrates (0.84 l/g-TS).
The biodegradability of the OFMSW used, deter-
mined by the batch experiment, was much higher than

ARTICLE IN PRESS
200
250
300
350
400
0% 10% 20% 30% 40% 50% 60% 70% 80% 90%100%
Ratio of VS from OFMSW to total VS in mixture with manure
Bio
gas
po
ten
tial
aft
er 4
4 d
ays
of
incu
bat
ion
(m
lCH
4/g
-VS
)
Fig. 2. Methane yield of OFMSW and manure in different
mixtures in batch experiment after 44 d of incubation (55 1C).
H. Hartmann, B.K. Ahring / Water Research 39 (2005) 1543–1552 1547
the one, which can be calculated from the relationship
between lignin content and biodegradable fraction
found by Chandler et al. (1980) giving a biodegradable
fraction of 38% of VS. This indicated that the lignin
content was generally lower than the 19%, which was
determined in the fiber analysis.
3.2. Reactor experiment
3.2.1. Phase 1: Start-up to a ratio of OFMSW:manure of
50%
The methane yield increased with higher ratios of
OFMSW from 0.20 l/g-VS when feeding only manure, to
0.34 l/g-VS in the 50% co-digestion ratio (Fig. 3A1 and
A2). The methane yield was equivalent to the methane
yield found in the batch test. Due to the acidity of
OFMSW the pH of the influent dropped from 7.3 of
pure manure to 6.3 in the 50% (VS/VS) co-digestion
mixture (Fig. 3D1 and D2). The pH in both reactors,
however, dropped only from 8.5 to 8.0, showing that the
co-digestion system was well buffered. Accordingly, the
pH in the effluent stabilized at values of 7.6–7.8 at the
end of phase 1. The VFA profile showed for both
reactors a stable performance with total VFA concen-
trations below 8mM after an initial transitory increase
in VFA (Fig. 3C1 and C2) which is typical for start-up
of an anaerobic process when the balance of the
hydrolytic bacteria, fermentative bacteria and methano-
gens has not stabilized yet (Ahring, 1994). The further
increase of the ratio of OFMSW did not show signs of
process instability. The fluctuation of the methane yield
was due to fluctuation in the feed volume and the waste
composition of the single waste loads.
3.2.2. Phase 2: Increasing the OFMSW ratio to 100% in
reactor R1
Loading R1 with a higher ratio of OFMSW showed
an increase in methane yield and VS reduction up to an
average value of 0.46 l/g-VS and 73%, respectively, on
average in the last period of phase 2 (1.8HRT) when
100% OFMSW diluted by addition of water, was fed to
the reactor (Fig. 3A1 and B1, Table 3). These high
values for the methane yield and the VS reduction were
signs for a high content of biodegradable organic matter
in the substrate. Parallel to the drop of the influent pH
of R1 down to 4.0–4.5, the effluent pH declined to 7.0
(Fig. 3D1). Reactor R2 showed generally stable
performance with low VFA concentration (Fig. 3C2),
and about the same methane yield and VS reduction as
in phase 1 (Fig. 3A2 and B2). The biogas yield and the
VS reduction in R1, operating on 100% OFMSW, were
28% and 23%, respectively, higher than during co-
digestion with manure in R2 (Table 3).
3.2.3. Phase 3: Recirculation of process liquid in reactor
R1
When starting the recirculation of process liquid in R1
on day 140, using exclusively the supernatant of the
effluent for dilution of OFMSW, a slight increase of
VFA concentration and a drop of methane yield below
0.40 l/g-VS was detected (Fig. 3C1 and A1). The same
process disturbance was, however, also seen in reactor
R2 (Fig. 3A2 and C2), indicating that the process
disturbance was related to the feeding of both reactors
rather than the start of recirculation in R1. In general,
low VFA concentrations in R1 showed stable reactor
performance. The methane yield and VS reduction
showed some variations and were, in average, lower
than at the end of phase 2. The average biogas yield was,
however, still higher than in the batch experiment and
biogas yield and VS reduction in R1 were 14% and
25%, respectively, higher than found in R2 (Table 3).
Dilution of OFMSW with a high ratio of supernatant
showed an instant buffering effect with an increase in the
influent pH above 6.0 (Fig. 3D1). The effluent pH
stabilized at a higher level of 7.2, showing beneficial
effect of recirculation of the effluent for the pH
stabilization of the process.
The ammonia load of R1 increased successively with
recirculation of the effluent (Fig. 4) and the concentra-
tion in the effluent increased from 0.6 to 1.0 g/l, which
corresponded to a level of 0.28 g/l of free ammonia in the
reactor (55 1C, pH 8.0).
3.2.4. Phase 4: Using a second batch of OFMSW
The feed of a new batch of OFMSW in phase 4
(6.4HRT for R1 and 7.1HRT for R2) showed a lower
average of 0.38 l/g-VS than in phase 3 (Fig. 3A1 and
Table 3). The VS reduction, however, increased by 5%
compared to phase 3 (Fig. 3B1 and Table 3). The same
can be seen for the co-digestion in R2 (Fig. 3A2 and B2),
indicating that batch 2 of OFMSW had a lower content
of high yielding organic matter (fat, protein, cellulose).
VFA concentration fluctuated more during phase 4 than

ARTICLE IN PRESS
Reactor R1 Reactor R2
Phase 1 2 3 4 1 2 3 4
0
100
200
300
400
500
600
0 28 56 84 112 140 168 196 224 252 280 308 336
Day
measuredexpected
-> Recirculation100%OFMSW
50%OFMSW Batch 2
(A1)
0
100
200
300
400
500
600
0 28 56 84 112 140 168 196 224 252 280 308 336
Day
measuredexpected
50%OFMSW Batch 2
(A2)
0102030405060708090
100
0 28 56 84 112 140 168 196 224 252 280 308 336
Day(B1)
0102030405060708090
100
0 28 56 84 112 140 168 196 224 252 280 308 336
Day(B2)
02468
101214161820
0 28 56 84 112 140 168 196 224 252 280 308 336
Day(C1)
02468
101214161820
0 28 56 84 112 140 168 196 224 252 280 308 336Day(C2)
4.0
4.5
5.0
5.5
6.0
6.5
7.0
7.5
8.0
8.5
9.0
0 28 56 84 112 140 168 196 224 252 280 308 336Day
pH
(D1)
4.0
4.5
5.0
5.5
6.0
6.5
7.0
7.5
8.0
8.5
9.0
0 28 56 84 112 140 168 196 224 252 280 308 336
Day
pH
ReactorEffluentInfluent
(D2)
CH
4 yi
eld
(m
l/g-V
S)
VS
red
uct
ion
(%
)T
ota
l VF
A (
mM
)
CH
4 yi
eld
(m
l/g-V
S)
VS
red
uct
ion
(%
)T
ota
l VF
A (
mM
)
Reactor EffluentInfluent
Fig. 3. Biogas yield (A1, A2), VS reduction (B1, B2), VFA concentration (C1, C2) and pH (D1, D2) in reactor R1 (left) and R2 (right);
expected biogas yield in A1 and A2 is according to the methane yield found in the batch experiment (Fig. 2).
H. Hartmann, B.K. Ahring / Water Research 39 (2005) 1543–15521548

ARTICLE IN PRESS
Table 3
Average performance parameters in the different experimental phases
Parameter Phase 1 (days 0–83) Phase 2 (days 84–139) Phase 3 (days 140–216) Phase 4 (days 217–330)
CH4 yield (l/g-VS)
R1 0.34 (0.03) 0.46 (0.05) 0.42 (0.05) 0.38 (0.08)
R2 0.35 (0.01) 0.36 (0.03) 0.37 (0.04) 0.34 (0.04)
%CH4R1 64.2 (1.1) 59.7 (0.2) 59.4 (1.4) 60.6 (2.0)
R2 64.6 (0.6) 62.8 (1.6) 63.0 (1.3) 62.8 (1.9)
VS reduction (%)
R1 56.0 (12.8) 73.1 (7.0) 69.0 (8.6) 74.3 (8.2)
R2 54.2 (5.7) 59.5 (4.4) 55.3 (6.0) 56.4 (9.9)
PH effluent
R1 7.5 (0.1) 7.0 (0.1) 7.2 (0.1) 7.3 (0.2)
R2 7.5 (0.1) 7.4 (0.0) 7.4 (0.1) 7.2 (0.1)
%CH4: methane content in biogas; standard deviation in brackets.
0%
10%
20%
30%
40%
50%
60%
70%
80%
90%
100%
0 28 56 84 112 140 168 196 224 252 280 308 336
Day
0.00
0.25
0.50
0.75
1.00
1.25
1.50
1.75
2.00
2.25
2.50
0 28 56 84 112 140 168 196 224 252 280 308 336
Day
Effluent R1Effluent R2Eff R1 calc.
% s
up
ern
atan
tN
H3
in e
fflu
ent
(g-N
/l)
(A)
(B)
Fig. 4. Ratio of supernatant to total liquid volume used for dilution of influent OFMSW of R1 (A) and ammonia concentration in the
effluent of R1 and R2 (B); Eff R1 calc. is the calculated NH3 concentration in the effluent.
H. Hartmann, B.K. Ahring / Water Research 39 (2005) 1543–1552 1549
ARTICLE IN PRESSH. Hartmann, B.K. Ahring / Water Research 39 (2005) 1543–15521550
in the previous phases and showed a higher level than in
phase 3 (Fig. 3D1). However, the concentration was
always below 5mM, indicating that the process was in
balance. When using exclusively the supernatant of the
effluent for dilution of OFMSW between day 235 and
255 (Fig. 4A), the influent pH was higher than 6.2 and
the effluent pH rose to 7.5. During the whole period the
pH in reactor R1 was stable around 8.0. Due to higher
ratios of supernatant used for dilution of OFMSW in
phase 4 (59%) compared to phase 3 (50%), the
ammonia concentration in the effluent increased to
values of 1.5–1.6 g-N/l, which was about the same level
as for the co-digestion reactor R2 (Fig. 4B). Due to a
lower pH in R1 compared to R2 (8.0 compared to 8.2),
the free ammonia concentration can be calculated to be
0.42–0.45 g-N/l in R1 and 0.58–0.62 g-N/l in R2.
Assuming that the ammonia loss is as much as the
volume loss in the process, the effluent ammonia
concentration was calculated according to the mass
balance:
CNH3 ;ejþ1¼ CNH3 ;OFMSWrOFMSW þ CNH3 ;ej
ð1� rOFMSWÞrsn
þ torg-NðCTKN;OFMSW � CNH3 ;OFMSWÞrOFMSW,
where C is the concentration (g-N/l), index i ¼ influent,
index e ¼ effluent, index j ¼ recirculation count, index
NH3 is the total ammonia-N, index TKN is the total
Kjeldahl-N, rOFMSW is ratio of OFMSW in influent, rsnis ratio of supernatant:water used for dilution of
OFMSW, torg-N is ratio for release of NH3-N from
organic bound nitrogen (TKN)
with torg-N ¼CNH3 ;e � CNH3 ;i
CTKN;i � CNH3 ;i.
Comparing the measured values with the calculated
data, it can be seen that changes of the concentration
followed the values predicted by the mass balance after
about one retention time (Fig. 4B). The predicted
increase on day 235, for example, is first apparent after
15 d and the fluctuations in the concentration as
predicted are leveled out. This indicated that ammonia
from organic bound nitrogen was not instantly released,
but over the period of one retention time. With a
constant ratio of the supernatant of 50% (phase 3) and
59% (phase 4), an effluent ammonia concentration of
1.2 and 1.4 g-N/l, respectively, can be calculated from
the mass balance. An effluent ammonia concentration of
3.7 g-N/l and a respective free ammonia concentration
of 1.0 g-N/l could be predicted when recirculating 100%
of effluent supernatant. This is in agreement with results
found by De Laclos et al. (1997) who measured an
increase of the effluent ammonia concentration in the
Valorga process from 1.3 to 3 g-N/l over an operation
period of 2 years.
3.2.5. Overall performance
The overall process performance of reactor R1 and
R2 in phases 3 and 4 can be summarized as follows:
Anaerobic treatment of OFMSW showed stable perfor-
mance in a thermophilic wet digestion treatment system
both when co-digested with manure in a ratio of 50%
(VS/VS) and as sole substrate with recirculation of the
effluent. The biogas yield from OFMSW was in both
treatment configurations 0.63–0.71 l/g-VS, correspond-
ing to 180–220m3/tOFMSW, which is more than 50%
higher than in comparable thermophilic dry digestion
systems using source-sorted OFMSW (Kayhanian and
Tchobanoglous, 1993; Six and De Baere, 1992) and
more than 25% higher than in comparable mesophilic
systems (Krzystek et al., 2001; Mtz.-Viturtia et al.,
1995). This gives evidence for both a high quality of the
collected waste and for the advantage of the thermo-
philic wet digestion treatment of OFMSW. Similar
biogas yields of OFMSW have, so far, only been found
in a thermophilic wet digestion system by Scherer et al.
(2000). Treating exclusively OFMSW with recirculation
of process liquid in a ratio of 50–59% for dilution of
influent OFMSW was beneficial and stabilized the
process at a pH 8.0 in the reactor and with an ammonia
level similar to the one found during co-digestion with
manure. Stabilization of the process by recirculation of
process liquid has been shown previously (Cecchi et al.,
1990). Compared to other treatment processes with
recirculation of process liquid, like the BTA and the
Valorga process, the biogas yield in the present
investigation was more than 50% higher (Kubler,
1994; De Laclos et al., 1997). The higher degradation
efficiency is suspected to be due to a better contact of the
microorganisms to the more homogenous substrate in
the present process configuration. The results from the
lab-scale system have to be verified in a large-scale
process. The homogeneity of the substrate may be less in
a large-scale process, the process fluctuations in the feed
volume (i.e. the OLR) are, however, higher in the lab-
scale system. Both the co-digestion and the recirculation
process showed to be robust towards these fluctuations
and no inhibition was detected at free ammonia levels as
high as 0.62 g/l.
The co-digestion conditions with a ratio of 50%
(VS/VS) of OFMSW could be achieved without
addition of water in a mixture of 77.9% (v/v) manure
together with 22.1% (v/v) of OFMSW. In this case, the
resulting VS and TS concentration would be 13.2%
and 16.6%, respectively. This would be at the limit
of mechanical handling in a CSTR. Addition of
higher ratios of OFMSW would make recirculation
of the liquid effluent necessary. Large-scale separation
of the liquid fraction from the effluent could be
achieved in a continuous process using a decanter
centrifuge as it is currently applied for manure (Møller
et al., 2000).

ARTICLE IN PRESSH. Hartmann, B.K. Ahring / Water Research 39 (2005) 1543–1552 1551
4. Conclusions
Adaptation of the thermophilic AD process to
OFMSW in co-digestion with manure was established
at a ratio of 50% (VS/VS) over a period of 6 weeks.
Addition of higher ratios of OFMSW and AD treatment
solely of OFMSW was achieved after dilution with tap
water and with recirculation of process liquid. Both the
co-digestion process and the treatment of 100%
OFMSW with recirculation of process liquid showed
stable operation despite fluctuations in the feed volume.
The biogas yield from the source-sorted OFMSW used
was 0.63–0.71 l/g-VS in both configurations, corre-
sponding to 180–220m3 biogas per ton waste. VS
reduction of 69–74% was achieved when treating
100% OFMSW. Recirculation of process liquid showed
a beneficial effect on the process performance with a
stabilization of the pH. Using the liquid effluent of the
process for dilution of the influent OFMSW in a ratio of
59% resulted in an ammonia level in the effluent of 1.5 g-
N/l, which was similar to the values found during co-
digestion with manure. Both reactor systems showed no
signs of inhibition at the corresponding free ammonia
concentration of 0.45–0.62 g-N/l.
Acknowledgements
We would like to thank Thomas Andersen for
excellent technical assistance and Mads Torry-Smith
for proofreading of the manuscript. This project was
supported by Grants from the Research Program of The
Danish Energy Council, no. 1383/99-0009.
References
Ahring, B.K., 1994. Status on science and application of
thermophilic anaerobic digestion. Water Sci. Technol. 30
(12), 241–249.
American Public Health Association (APHA), American Water
Works Association (AWWA), and Water Environment
Federation (WAE), 1992. In: Greenberg, A.E., Clesceri,
L.S., Trussel, R.R. (Eds.), Standard Methods for the
Examination of Water and Waste Water (18th ed.).
Anthonisen, A.C., Loehr, R.C., Prakasam, T.B.S., Srinath,
E.G., 1976. Inhibition of nitrification by ammonia and
nitrous acid. J. Water Pollut. Control Fed. 48, 835–849.
Braber, K., 1995. Anaerobic digestion of municipal solid waste:
a modern waste disposal option on the verge of break-
through. Biomass Bioenergy 9 (1–5), 365–376.
Cecchi, F., Marcomini, A., Pavan, P., Fazzini, G., Mata-
Alvarez, J., 1990. Anaerobic digestion of municipal solid
waste. Biocycle 31 (6), 42–43.
Chandler, A.J., Jewell, W.J., Gossett, J.M., van Soest, P.J.,
Robertson, J.B., 1980. Predicting methane fermentation
biodegradability. In: Proceedings of the Biotechnology and
Bioengineering Symposium no. 10, pp. 93–107
Danish Energy Agency, 1995. Progress Report on the Economy
of Centralized Biogas Plants. The Biomass Section of the
Danish Energy Agency.
De Laclos, H.F., Desbois, S., Saint-Joly, C., 1997. Anaerobic
digestion of municipal solid organic waste: Valorga full-
scale plant in Tilburg, the Netherlands. Water Sci. Technol.
36 (6–7), 457–462.
Edelmann, W., Schleiss, K., Joss, A., 2000. Ecological,
energetic and economic comparison of anaerobic digestion
with different competing technologies to treat biogenic
wastes. Water Sci. Technol. 41 (3), 263–273.
Gallert, C., Winter, J., 1997. Mesophilic and thermophilic
anaerobic digestion of source-sorted organic wastes: effect
of ammonia on glucose degradation and methane produc-
tion. Appl. Microbiol. Biotechnol. 48 (3), 405–410.
Goehring, H.K., van Soest, P.J., 1970. Forage fiber analysis
(apparatus, reagents, procedures, and some applications).
In: USDA US (Ed.), Agricultural Handbook No. 379,
Agricultural Research Service. US Government Printing
Service, Washington, DC.
Hamzawi, N., Kennedy, K.J., McLean, D.D., 1999. Review of
applications of high-solids anaerobic digestion to solid
waste management. J. Solid Waste Technol. Manage. 26 (3),
119–132.
Hartmann, H., Ahring, B.K., 2003. Phthalic acid esters found
in municipal organic waste: enhanced anaerobic degrada-
tion under hyper-thermophilic conditions. Water Sci.
Technol. 48 (4), 175–183.
Hartmann, H., Ahring, B.K., 2004. Efficiency of the anaerobic
treatment of the organic fraction of municipal solid waste:
collection and pretreatment. Waste Manage. Res. 22 (1),
35–41.
Kayhanian, M., Tchobanoglous, G., 1993. Innovative 2-stage
process for the recovery of energy and compost from the
organic fraction of municipal solid waste (MSW). Water
Sci. Technol. 27 (2), 133–143.
Krzystek, L., Ledakowicz, S., Kahle, H.J., Kaczorek, K., 2001.
Degradation of household biowaste in reactors. J. Biotech-
nol. 92 (2), 103–112.
Kubler, H., 1994. Experiments of thermophilic digestion of
municipal organic waste. Mull Abfall 26 (8), 478–488 (in
German).
Lema, J.M., Omil, F., 2001. Anaerobic treatment: a key
technology for a sustainable management of wastes in
Europe. Water Sci. Technol. 44 (8), 133–140.
Møller, H.B., Lund, I., Sommer, S.G., 2000. Solid–liquid
separation of livestock slurry: Efficiency and cost. Bior-
esour. Technol. 74 (3), 223–229.
Mtz.-Viturtia, A., Mata-Alvarez, J., Cecchi, F., 1995. 2-phase
continuous anaerobic digestion of fruit and vegetable
wastes. Resour. Conserv. Recycling 13 (3–4), 257–267.
Rivard, C.J., Vinzant, T.B., Adney, W.S., Grohmann, K., 1989.
Waste to energy—nutrient requirements for aerobic and
anaerobic digestion. J. Environ. Health 52 (2), 96–100.
Rivard, C.J., Vinzant, T.B., Adney, W.S., Grohmann, K.,
Himmel, M.E., 1990. Anaerobic digestibility of 2 processes
municipal solid waste materials. Biomass 23 (3), 201–214.
Sakai, S., Sawell, S.E., Chandler, A.J., Eighmy, T.T., Kosson,
D.S., Vehlow, J., van der Sloot, H.A., Hartlen, J., Hjelmar,

ARTICLE IN PRESSH. Hartmann, B.K. Ahring / Water Research 39 (2005) 1543–15521552
O., 1996. World trends in municipal solid waste manage-
ment. Waste Manage. 16 (5–6), 341–350.
Scherer, P.A., Vollmer, G.R., Fakhouri, T., Martensen, S.,
2000. Development of a methanogenic process to degrade
exhaustively the organic fraction of municipal ‘‘grey waste’’
under thermophilic and hyperthermophilic conditions.
Water Sci. Technol. 41 (3), 83–91.
Six, W., De Baere, L., 1992. Dry anaerobic conversion of
municipal solid waste by means of the Dranco process.
Water Sci. Technol. 25 (7), 295–300.
Sonesson, U., Bjorklund, A., Carlsson, M., Dalemo, M., 2000.
Environmental and economic analysis of management
systems for biodegradable waste. Resour. Conserv. Recy-
cling 28, 29–53.
Sørensen, A.H., Winther-Nielsen, M., Ahring, B.K., 1991.
Kinetics of lactate, acetate and propionate in unadapted
and lactate-adapted thermophilic, anaerobic sewage
sludge—the influence of sludge adaptation for start-up of
thermophilic UASB reactors. Appl. Microbiol. Biotechnol.
34 (6), 823–827.


