An Integrative Model of Information Systems Spending GrowthAuthor(s): Vijay Gurbaxani and Haim MendelsonSource: Information Systems Research, Vol. 1, No. 1 (MARCH 1990), pp. 23-46Published by: INFORMSStable URL: http://www.jstor.org/stable/23010962 .
Accessed: 25/06/2014 00:39
Your use of the JSTOR archive indicates your acceptance of the Terms & Conditions of Use, available at .http://www.jstor.org/page/info/about/policies/terms.jsp
.JSTOR is a not-for-profit service that helps scholars, researchers, and students discover, use, and build upon a wide range ofcontent in a trusted digital archive. We use information technology and tools to increase productivity and facilitate new formsof scholarship. For more information about JSTOR, please contact [email protected].
.
INFORMS is collaborating with JSTOR to digitize, preserve and extend access to Information SystemsResearch.
http://www.jstor.org
This content downloaded from 195.78.109.96 on Wed, 25 Jun 2014 00:39:07 AMAll use subject to JSTOR Terms and Conditions
An Integrative Model of Information Systems Spending Growth
Vijay Gurbaxani
Haim Mendelson
Graduate School of Management
University of California Irvine, California 92717
Graduate School of Business
Stanford University
Stanford, California 94305
This paper develops a model of the growth of information systems expendi tures in the United States. The model incorporates two major factors that
influence the rate and pattern of spending growth—the diffusion of techno
logical innovation and the effect of price on the demand for computing. Traditional studies have focused on the role of innovation while ignoring the effects of price on the growth process. We show that while information
systems expenses initially grew following an S-curve, more recent growth has converged to an exponential pattern. These patterns are consistent
with our integrative price-adjusted S-curve growth model.
Information systems expenditures—Budget—Diffusion of innovation—Demand for computing—Computing costs
1. Introduction
The growth rate of information systems (hereafter IS) expenditures in the U.S.
has been and continues to be extremely rapid. The data processing (DP)
industry now accounts for approximately 2% of the GNP; the stock of information
technology capital represents roughly 7% of total U.S. capital stock (BEA 1989); and firms in information intensive sectors of the economy such as banking and
finance spend over 4% of their revenues on IS. Noting that the industry was
virtually nonexistent a half century ago, it becomes apparent that the rate of
adoption and use of information technology by organizations is unparalleled by any other industry. While information technology is undisputedly one of the most
important innovations of recent times, few theoretical or empircal studies have focused on its diffusion (Swanson 1989) and, in particular, quantified its growth. An IS expenditures reflect the patterns of technology adoption and use, an analysis of the trends governing them provides an understanding of the underlying factors that drive the growth process.
This paper analyzes the growth of IS expenditures over time. Clearly, these
expenditures are driven by the demand for information technology. We suggest
1047-7047/90/0101/0023/S01.25 Copyright © 1990, The Institute of Management Sciences
Information Systems Research 1:1 23
This content downloaded from 195.78.109.96 on Wed, 25 Jun 2014 00:39:07 AMAll use subject to JSTOR Terms and Conditions
Gurbaxani • Mendelson
that there are two major factors that influence this demand. The first is the
diffusion of technological innovation, including the effects of learning, and the second is the effect of price. We hypothesize that in the early years of computing, the diffusion effects dominated the dynamics of spending growth. That is, the
growth in these years was driven primarily by the development of previously unconsidered applications in firms that had adopted information technology and
by the entry of new users into the user base. However, even as users gain experience with the technology and the application portfolio matures, expenditures continue to grow as a result of rapidly declining costs of computing. This occurs because the trends in the price-performance of hardware technology have made it cost-effective for organizations to automate a constantly increasing set of tasks. As we shall show, even though the cost of performing any specific task has decreased over time, the development of new applications resulted in continually larger outlays on IS.
The growth of information processing may be analyzed from the perspective of the diffusion of innovation literature. Studies in this area focus on the effects of behavioral and social influences on the timing of adoption of an innovation, whereas the impact of economic factors such as price is often ignored. While demand functions always express the quantity demanded as a function of price, suggesting the obvious importance of this variable in general, its omission is even more significant in the case of information technology, where the price decline has been so rapid for so long. Our goal here is to develop an integrative model which
incorporates both social and economic factors as they apply to IS spending growth. The considerable influence of the declining costs of computing on the growth of
DP expenditures was strongly indicated in our earlier research (Gurbaxani and Mendelson 1987, 1988), where it was shown that most of the recent (1976-1984)
growth in these expenses could be attributed to the price trend. A formal model was developed wherein a DP manager maximized the net value of information services to the organization by determining the optimal investment in both hard ware and software-development in each period. DP was modeled using a produc tion-function approach with hardware and software-development effort as the
inputs.1 Since we were studying budget allocation when IS management practice had matured, our primary interest was in examining steady-state behavior. Our results showed that even in the absence of diffusion and learning effects, the
optimal investment policy corresponding to the current trend of exponentially decreasing costs (Phister 1979, Mendelson 1990) results in the exponential growth of these budgets. Thus, while it is important to focus on the role of innovation in
studying the growth of computing, incorporating the effects of price and the
corresponding steady-state behavior is necessary for the development of a compre hensive model of IS spending.
In this paper, we propose an integrative model which accommodates two
patterns of growth in different periods: (i) an early transient period, when users
gain familiarity with information technology and its applications, and (ii) a steady state growth period, when DP expenditures continue to grow steadily as a result of the decreasing prices. As the technology and its users mature, the transient
'The model is reviewed in §3.
24 Information Systems Research 1:1
This content downloaded from 195.78.109.96 on Wed, 25 Jun 2014 00:39:07 AMAll use subject to JSTOR Terms and Conditions
Integrative Model of Information Systems Spending Growth
behavior in period (i) converges to the steady-state behavior in period (ii). Our model generates hypotheses which are tested using aggregate IS spending data collected by Phister (1979) and the International Data Corporation (IDC). The
empirical tests support our integrative model and provide estimates of its parame ters.
The outline of this paper is as follows. In §2, we discuss the diffusion of innovation from the social and behavioral perspectives and derive its implications for IS spending growth. Our integrative model is presented in §3. The data used in our empirical work are described in §4. §5 analyzes the data and tests the existence of a price effect, and our concluding remarks are in §6.
2. The Diffusion of Innovation and 5-Curves Information technology, broadly defined, is one of the most important innova
tions of the last three decades, if not the most important. Thus, it is useful to apply existing theories of the diffusion of innovation to study its growth pattern over time. Researchers of the innovation process such as Rogers (1962, 1983) and
Rogers and Shoemaker (1971) have demonstrated that most innovations follow well-defined patterns in diffusing through society. These patterns are described by diffusion models which represent the level and spread of the innovation among a
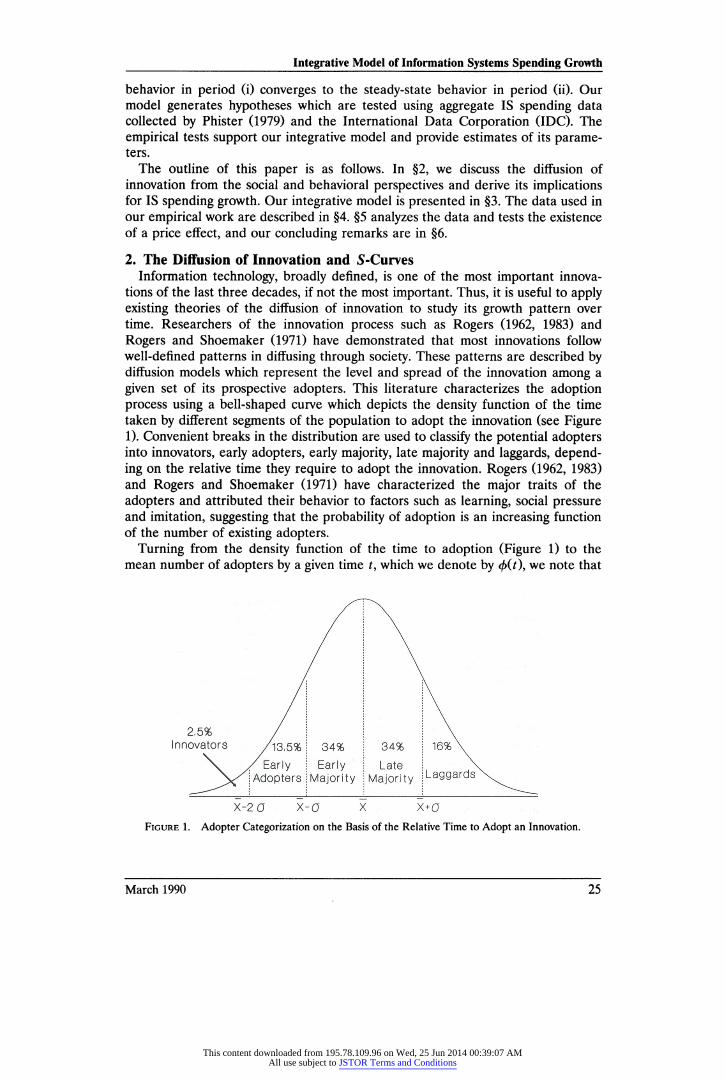
given set of its prospective adopters. This literature characterizes the adoption process using a bell-shaped curve which depicts the density function of the time taken by different segments of the population to adopt the innovation (see Figure 1). Convenient breaks in the distribution are used to classify the potential adopters into innovators, early adopters, early majority, late majority and laggards, depend ing on the relative time they require to adopt the innovation. Rogers (1962, 1983) and Rogers and Shoemaker (1971) have characterized the major traits of the
adopters and attributed their behavior to factors such as learning, social pressure and imitation, suggesting that the probability of adoption is an increasing function of the number of existing adopters.
Turning from the density function of the time to adoption (Figure 1) to the mean number of adopters by a given time t, which we denote by 4>(t), we note that
Figure 1. Adopter Categorization on the Basis of the Relative Time to Adopt an Innovation.
March 1990 25
This content downloaded from 195.78.109.96 on Wed, 25 Jun 2014 00:39:07 AMAll use subject to JSTOR Terms and Conditions
Gurbaxani • Mendelson
the latter is proportional to the integral of the former up to time t. But if the
density function is bell-shaped, its integral will be S-shaped. Thus, the expected number of adopters depicts an S-shaped function of time. Indeed, most existing models of new-product growth operationalize these ideas using an S-shaped curve which depicts product sales as a function of time (cf. Mansfield 1961, Bass 1969, Kotler 1987, to name a few; Mahajan and Muller 1979 provide a comprehensive review). The different product-growth models differ in their diffusion model
assumptions and result in different functional forms of the S-curve The
general demand patterns implied by them are, however, similar, as can be seen from the following definition.
Definition. The real function 4>(t), defined for t > 0, is called an S-curve if
(i) is twice differentiate for all t; (ii) <f>(t) > 0 for all t; (iii) <f>Xt) > 0 for all t; (iv) <f>(t) is bounded; and
(v) There exists some time T such that > 0 for all t < T, and <£"(?) < 0 for all t > T.
Conditions (ii) and (iv) state that the S-curve (e.g., expenditures or sales) is
always nonnegative and can never exceed some upper bound. Condition (iii) states that the S-curve is nondecreasing. As for condition (v), recall that we have
interpreted the derivative of the S-curve, as the bell-shaped curve of Figure 1. But a bell-shaped curve is a curve that has a positive slope up to its peak and then—a negative slope. Thus, the derivative of the bell-shaped curve which is 4>"(t), must be positive up to some point (which is T in (v) above) and then becomes negative.
Swanson (1989) was the first to develop a theory that specifically examines the nature of innovation among IS organizations. Swanson studies both the likelihood and timing of the adoption of information technology innovations by a given organization and their evolution as they diffuse among organizations. He suggests that the major determinants of the timing of adoption and the pattern of evolution are the characteristics of the innovation and the organizational setting. He pro poses a typology of IS innovations based on their primary use, characterizes the nature of the organizational context and relates the evolution of the innovation of these two factors. He illustrates his model using the examples of data administra
tion, material requirements planning and the information center. Huff and Munro (1985) studied the strategies and mechanisms used to identify,
assess and adopt new information technology. Among their models, they adopt Rogers' phases of innovation, splitting the adoption phase into two parts: imple mentation and diffusion. With this modification, they show how Rogers' general results apply to the case of information technology. Brancheau and Wetherbe (1989) also applied the general theory of diffusion to the case of spreadsheet software, showing its validity in this case. Ball, Dambolena and Hennessey (1987/88) applied the theory to the adoption of large DBMS. Interestingly, they relate the innovation process to Nolan's (1973) S-shaped curve, tying the general theory of diffusion to the IS context. Zmud (1982, 1984) uses innovation theory to
26 Information Systems Research 1:1
This content downloaded from 195.78.109.96 on Wed, 25 Jun 2014 00:39:07 AMAll use subject to JSTOR Terms and Conditions
Integrative Model of Information Systems Spending Growth
study the diffusion of modern software practices among software-development groups.
Consistent with these studies, we apply the general results from the diffusion of innovation literature to the case of IS spending growth. These results imply that IS
expenditures should grow according to an S-curve. To operationalize this notion, we have to specify the functional form of the S-curve. Our analysis of IS spending will employ three functional forms for the S-curve, The first two—the
Gompertz and the Logistic curves—are widely used in the diffusion and new-prod uct planning literature (cf. Mansfield 1961, Hendry 1972, Mahajan and Muller
1979). A third form for cf>(t) is the modified exponential form used by Lucas and Sutton (1977) in their analysis of IS budgets. Obviously, these curves satisfy the five conditions in our definition of an S-curve. We briefly outline additional useful
properties of each of these S-curves below.
1. The Gompertz Curve: For the Gompertz curve, defined by
<f>(T) = K • AbT, (1)
the growth increments of the logarithms of decline by a constant percentage b. When both A and b are between 0 and 1, 4>(T) is an increasing S-curve which
tends to the upper bound K as T -* °°. The Gompertz curve reaches its maximum
growth rate when <f>(T) = K/e, i.e.,—when <f>(T) reaches about 37% of its upper bound. Hendry (1972) applied the Gompertz curve to study the growth of durable
products in the U.K., and Lackman (1977) used it to study the growth of a new
plastic product. 2. The Logistic Curve: For the Logistic curve, defined by
<2)
the first differences between the reciprocals of <f>(T) decline by a constant
percentage. For A > 0 and 0 < b < 1, the Logistic is an increasing S-curve which tends to the limit l/K as T -» «. The maximum growth rate is achieved when
cfr(T) = 1 /(2K), that is, when the S-curve reaches 50% of its limiting value, and the growth rate function is symmetric around this maximum value. This functional
form was used by Mansfield (1961) and Blackman (1974) to study the diffusion of
several technological innovations. 3. The Modified-Exponential Curve: The modified-exponential function used by
Lucas and Sutton (1977) is given by
4>(T) = ea~b/T. (3)
This curve depicts an increasing S-curve for b > 0. The growth rate is maximized
at T = b/2, when 4>(T) is at l/e2 of its limiting value (ea). These three S-curves
will be used in the sequel to quantify the effects of information technology diffusion on aggregate spending.
While we focus on the diffusion of innovation at the aggregate economy-wide level, a related body of work (cf. Nolan 1973 as well as the references cited above)
March 1990 27
This content downloaded from 195.78.109.96 on Wed, 25 Jun 2014 00:39:07 AMAll use subject to JSTOR Terms and Conditions
Gurbaxani • Mendelson
suggests that the diffusion of information technology within firms also leads to
5-shaped budget growth. The relationship between firm-level and economy-wide diffusion process is not surprising—in fact, we show below that the aggregation of S-curves is itself an S-curve.
Theorem. Let 4>,(t), i = 1,2,..., N be S-curves, and let
*(0 = E u0 (4) i=i
be the sum of these S-curves. Then <t>(0 is an S-curve.
The proof of the above theorem is immediate, since the defining conditions
(i)-(v) are preserved under linear transformations. Since <!>(?) is obtained from the functions $,-(f) by simple addition, the result follows. This theorem implies that if the pattern of growth of DP budgets in individual organizations is 5-shaped, then the aggregate growth curve should also be 5-shaped.
3. An Integrative Model of IS Spending Growth The role of price in determining the quantity demanded of a good or service is
central to economic theory. In fact, by their very definition, demand functions
express the quantity demanded as a function of price. The percentage change in the quantity demanded for a 1% change in price is termed the price elasticity of demand. Previous estimates of the elasticity of demand for computer hardware
suggest that a 10% decrease in price will increase the quantity demanded by roughly 14.5% (Chow 1967), showing that the demand for computing is very elastic. Since the costs of computing have been decreasing dramatically, one might expect that a considerable share of IS spending growth is due to price effects. This
suggests that models that seek to explain the growth in computing expenditures should take the price effect into account.
The need to include the impact of price in diffusion models has been acknowl
edged in the marketing literature in a different context (see Bass 1980, Dolan and Jeuland 1981 and Bass and Bultez 1982). This literature views the adoption of innovations from the producer's perspective, and derives implications for their
optimal multi-period strategic pricing policies. These models explicitly recognize the effects of price on the rate of adoption of the innovation by the consumer
population. Specifically, the probability density function describing the time to
adoption of the new product (see Figure 1) depends both on the interactions between members of the population in learning about and responding to the
innovation, and on the rate at which the price of the product changes over time.
Empirical analyses of the adoption of consumer durables (Bass 1980) demonstrate the considerable influence of price on the demand for the new product, although none of the goods studied exhibit the price-performance trends of information
technology. It becomes clear that models of the adoption and use of information
technology must incorporate both aspects to properly study this process. We begin our analysis with a brief review of our earlier research (Gurbaxani and
Mendelson 1987, hereafter G-M), where a formal model related DP spending to the cost and value of information services. DP was modeled as a multiperiod
28 Information Systems Research 1:1
This content downloaded from 195.78.109.96 on Wed, 25 Jun 2014 00:39:07 AMAll use subject to JSTOR Terms and Conditions
Integrative Model of Information Systems Spending Growth
production process with two inputs, hardware and software-development effort, with the output being information services. A production function was used to transform the inputs into the output. The decision problem was to determine the
optimal investment in hardware capacity and software development effort by dynamically maximizing the net value of information services to the organization. The model enables an analysis of the dependence of the growth rate of the input quantities on the characteristics of the production function and on the cost trends of hardware and software. The results show that the shifting costs are important determinants of the optimal input mix and of the pattern of overall investment in DP.
The G-M model is quite general, and it can be applied to analyze the behavior of IS budgets under a variety of conditions. For example, the underlying produc tion function is generally specified, and its parameters can be allowed to vary in each period. Thus, the model can be used to study transient phenomena by choosing a time-dependent production function or to study steady-state or mature
phenomena where the parameters of the production function are held constant over time.
The model was applied to the particular case where the production of informa tion services is in steady-state and can be characterized by the Cobb-Douglas production function. It was shown that the currently observed trend of exponen tially decreasing costs (Phister 1979, Mendelson 1990) results in the exponential growth of IS expenditures over time. The analysis revealed that as the costs of hardware decrease more rapidly than those of software-development, DP man
agers substitute hardware for software effort. Thus, there is a continuously increas
ing ratio of available hardware to software effort in DP installations, effected
primarily through the use of software tools that reduce software effort at the cost of increased hardware capacity.2 The result was that the overall cost of undertak
ing any particular information system activity decreased over time. Since the demand for computing tasks is highly elastic, the lower costs resulted in an increase in the quantity of these tasks demanded, with a rate of increase that was faster than the rate of decline of computing costs. The net result is that (real) DP
expenditures continue to grow at an exponential rate. The G-M result of exponential budget growth at a constant rate is restricted to
the case where the production of information services has reached steady-state.
Mathematically, steady-state implies that the parameters of the production function will be the same in every period, and only the cost parameters (and
consequently the optimal production mix) change over time. Thus, steady-state production assumes that the production function is stable over time while the actual input mix varies with the changes in factor costs. The production of information services can reach such a steady-state when the nature of the technol
ogy is well understood and users have acquired adequate management experience with it. It is, therefore, reasonable to expect that steady-state production will be
achieved only following a transient learning and development period correspond
ing to the diffusion of information technology discussed earlier. This calls for a
model which integrates the diffusion effects with the price effects.
2 For a detailed discussion of this substitution, see Gurbaxani and Mendelson (1987).
March 1990 29
This content downloaded from 195.78.109.96 on Wed, 25 Jun 2014 00:39:07 AMAll use subject to JSTOR Terms and Conditions

Gurbaxani • Mendelson
In this paper, we propose an integrative model which assumes that the underly
ing process of IS spending growth is 5-shaped, but the rate of growth is also affected by the costs of computing. Our model predicts that if the costs of
computing were to remain constant, spending would in fact grow according to an 5-curve. However, as these costs continue to decrease, DP expenditures should
continue to grow even when the technology has matured. Thus, the model
encompasses both the pure diffusion model and the G-M model as limiting cases: as the technology and the user practices evolve, the transient 5-curve behavior that occurs in the early periods converges to the steady-state exponential behavior in the maturity period.
To derive our model, consider first the case where the demand for computing is stable over time, which corresponds to our steady-state growth period. The demand curve represents a downward-sloping relation between the quantity in
period t, qt, and the period-f price Pr Assuming a constant-elasticity demand
curve, this relation has the functional form
where D is a scale constant and (1 + a) is the elasticity of demand. The demand for computing is known to be highly elastic, implying that a > 0 (Chow 1967). Given the demand function (5), spending in period T, Br, is given by
If the demand curve shifts over time, the constant D has to be replaced by a function of time, DT= <f>(T). Then, we obtain
where the function <f>(T) describes the pattern of demand shift over time. In §2, we showed that most models of the adoption and diffusion of innovation
predict that such processes will result in 5-curve behavior. We therefore suggest that the function <f>(T) will be 5-shaped and hypothesize that the Gompertz, Logistic and modified exponential forms discussed in §2 are reasonable representa tions for the function <fr(T).
Our hypothesis (6) implies that the behavior of the spending series Br over time
depends not only on the 5-shaped multiplier (f>(T), but also on the behavior of the
price series PT. It is well known that the costs of hardware and software-develop ment decline exponentially over time at constant rates (see Mendelson 1990, Fedorowicz 1981, G-M 1987, Phister 1979, Cale et al. 1977). Thus, we have
Pt = Po ' yT f°r some y < 1, and substitution in (6) yields
qT = D-P^1+a\ (5)
BT =
PT •
qT = D ■
PT".
Bt — <t>(T) • PTa, (6)
Bt = P0"« • 4>(T) ■ y-"T
which can be written in the form
BT=f(T)-e"T. (7)
30 Information Systems Research 1:1
This content downloaded from 195.78.109.96 on Wed, 25 Jun 2014 00:39:07 AMAll use subject to JSTOR Terms and Conditions
Integrative Model of Information Systems Spending Growth
where the constant multiplier has been absorbed into the function f(T), and A = — a log y.
Note that equation (7) is an integrative functional specification that encompasses both the initial S-curve behavior and the recent exponential pattern observed in G-M. In particular, when a is equal to zero, A = 0 and equation (7) reduces to the
pure S-curve BT=f(T), representing only the diffusion effects. On the other
hand, when f{T) becomes flat (for large T) and A > 0, equation (7) states that DP
budgets grow exponentially, as in G-M, reflecting the effects of the price decline. We now have two competing hypotheses on IS spending growth over time. The
first is the traditional hypothesis that spending growth follows an S-curve. Our alternative hypothesis is that aggregate spending follows a price-adjusted S-curve as in (7). That is, in the early stages of development of the industry, the pattern of
growth is largely determined by transient factors and the resulting growth is still
S-shaped. In later stages, as users mature in their understanding and use of the
technology, the price effects dominate and spending tends to grow exponentially over time at a constant rate. Our tests apply and compare the three aforemen tioned functional forms of the S-curve, <f>(T), with their price-adjusted counter
parts. In particular, we test the hypothesis that the price effect is significant in
determining the growth of IS spending. The analysis also determines whether the
industry reached a steady state and if it did, how the three models depict its
nature.
4. The Data We use two sources of data in our study. They are the International Data
Corporation (IDC) and the book, Data Processing Technology and Economics
(Phister 1979). IDC publishes the results of an annual survey on user spending in
their publication, Electronic Data Processing/Industry Report. Phister (1979) has
compiled the data in his book, which includes the most comprehensive collection of statistics on the DP industry, using a variety of sources, including IDC. While
several organizations collect user spending data, only the two listed above provide consistent time-series data which permit the analysis of spending trends.
IDC is the premier source of data on the DP industry. They maintain an online database that records information on a large number of installations, representing
over 80% of the general purpose computers installed in the U.S. This database has
provided them with an unparalleled ability to monitor computing trends in user
organizations. IDC publishes its estimates of DP spending by the aggregate of user
organizations in the U.S. in its publication, Electronic Data Processing/Industry
Report. IDC bases its results on an annual survey of user organizations in the U.S.
that asks for detailed information on IS spending. The survey population of user
organizations is a representative sample of the total user population. IDC extrapo lates the results of its survey to the entire U.S. computer user population to derive
its estimates of the aggregate expenditures. These estimates are cross-checked with
the results of other surveys, studies and published data. For example, IDC also
compiles statistics on hardware shipments that can be related to the corresponding hardware spending amounts. Additionally, IDC attempts to ensure the consistency of its results between years. The questionnaire used in the survey asks IS execu
tives to report actual expenses for the previous and current years and estimated
March 1990 31
This content downloaded from 195.78.109.96 on Wed, 25 Jun 2014 00:39:07 AMAll use subject to JSTOR Terms and Conditions
Gurbaxani • Mendelson
spending in the subsequent year. Survey respondents are asked to provide spend ing data by line-item or by major spending categories if the more detailed information is unavailable. The categories are systems hardware including main
frames, minis and microcomputers, data entry and data communications equip ment, communication line charges, software, services, supplies and overhead
expenses. While the data do not capture all of the personal computer expenditures outside the domain of IS departments, the tangible part of these costs is typically included in the budget.3
While the IDC data is clearly the best available, some limitations should be noted. First, accurate responses to the survey questions require considerable effort on the part of the respondent. Moreover, some organizations treat the data as
highly sensitive. IDC provides confidentiality of the responses by agreeing to
publish the results only in the aggregate. The difficulty in compiling such a dataset is reflected in the observation that IDC constantly checks its data and sometimes has to revise its earlier estimates. Finally, IDC does not provide detailed informa tion on its sample of surveyed firms and on the methodology used in extrapolating the survey results to the entire user population. On the other hand, IDC is the most authoritative source of data on the DP industry as evidenced by the large number of citations of their research in the literature. In fact, the Bureau of Economic Analysis, a premier data repository of the U.S. Government, uses IDC data in computing its dataset. A second source of data used in our analysis is Phister (1979).
As with any secondary data-analysis, the approach taken here is to do the best
possible with the available data by using the appropriate analytical tools, while
keeping in mind the underlying limitations (see G-M 1989 on general issues involved in the analysis of secondary data sets). The limitations due to reporting errors and subjective estimates by the survey respondents are well within the realm of formal statistical analysis. When the number of respondents is large, as is the case here, the sampling errors average out, leading to smaller deviations of the
aggregate data points relative to their means. Further, the impact of the random errors is endogenous to the analysis: with high error terms, the estimated variances will be large, resulting in insignificant test-statistics. As will be seen later, the level of significance of the test statistics obtained here is very high.
Our data consist of aggregate expenditures by DP departments in the U.S. The data for the years 1960-1978 is from Phister (1979, Table II.3.25a, line 60). These data were combined from the IDC, which spans the 1972-1987 period.4 The data from the two sources were converted to 1972 dollars, dividing by the GNP implicit price deflator for each year. Due to the different accounting techniques and inclusion criteria, there were differences between Phister's (1979) budgets and those reported by IDC. However, the correlation coefficient between the two
spending series in the overlapping period (1972-78) was 0.987, indicating that one series is essentially a linear transformation of the other. We used the correspond
3 A A major cost component which cannot be included in the spending data is users' costs, and in
particular, the cost of users' time (Mendelson 1985). 4In the last three years, IDC did not collect the detailed budget breakdown by line-item. This
breakdown, however, is not necessary for our analysis.
32 Information Systems Research 1:1
This content downloaded from 195.78.109.96 on Wed, 25 Jun 2014 00:39:07 AMAll use subject to JSTOR Terms and Conditions
Integrative Model of Information Systems Spending Growth
Year, T
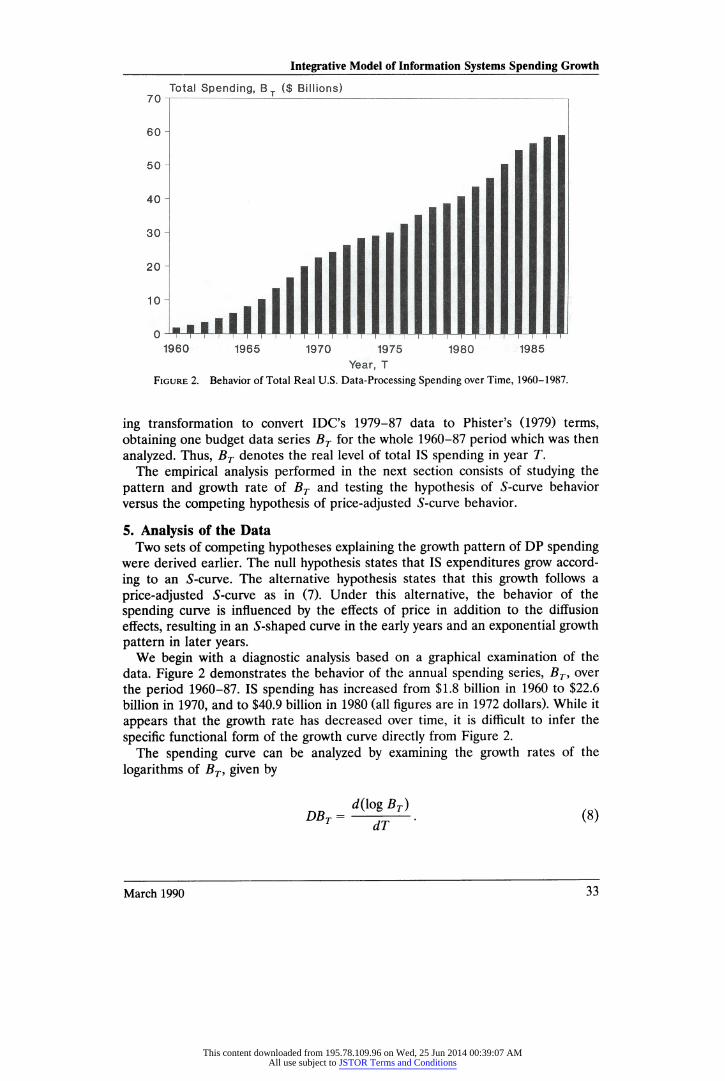
Figure 2. Behavior of Total Real U.S. Data-Processing Spending over Time, 1960-1987.
ing transformation to convert IDC's 1979-87 data to Phister's (1979) terms,
obtaining one budget data series BT for the whole 1960-87 period which was then
analyzed. Thus, BT denotes the real level of total IS spending in year T. The empirical analysis performed in the next section consists of studying the
pattern and growth rate of BT and testing the hypothesis of 5-curve behavior
versus the competing hypothesis of price-adjusted 5-curve behavior.
5. Analysis of the Data Two sets of competing hypotheses explaining the growth pattern of DP spending
were derived earlier. The null hypothesis states that IS expenditures grow accord
ing to an S-curve. The alternative hypothesis states that this growth follows a
price-adjusted 5-curve as in (7). Under this alternative, the behavior of the
spending curve is influenced by the effects of price in addition to the diffusion
effects, resulting in an 5-shaped curve in the early years and an exponential growth pattern in later years.
We begin with a diagnostic analysis based on a graphical examination of the
data. Figure 2 demonstrates the behavior of the annual spending series, BT, over
the period 1960-87. IS spending has increased from $1.8 billion in 1960 to $22.6 billion in 1970, and to $40.9 billion in 1980 (all figures are in 1972 dollars). While it
appears that the growth rate has decreased over time, it is difficult to infer the
specific functional form of the growth curve directly from Figure 2.
The spending curve can be analyzed by examining the growth rates of the
logarithms of BT, given by
d(log Bt)
~dT DBt = — . (8)
March 1990 33
This content downloaded from 195.78.109.96 on Wed, 25 Jun 2014 00:39:07 AMAll use subject to JSTOR Terms and Conditions
Gurbaxani • Mendelson
J3—EL □
/ \ \ -R
60 62 64 66 68 70 72 74 76 78 80 82 84 86
Year, T
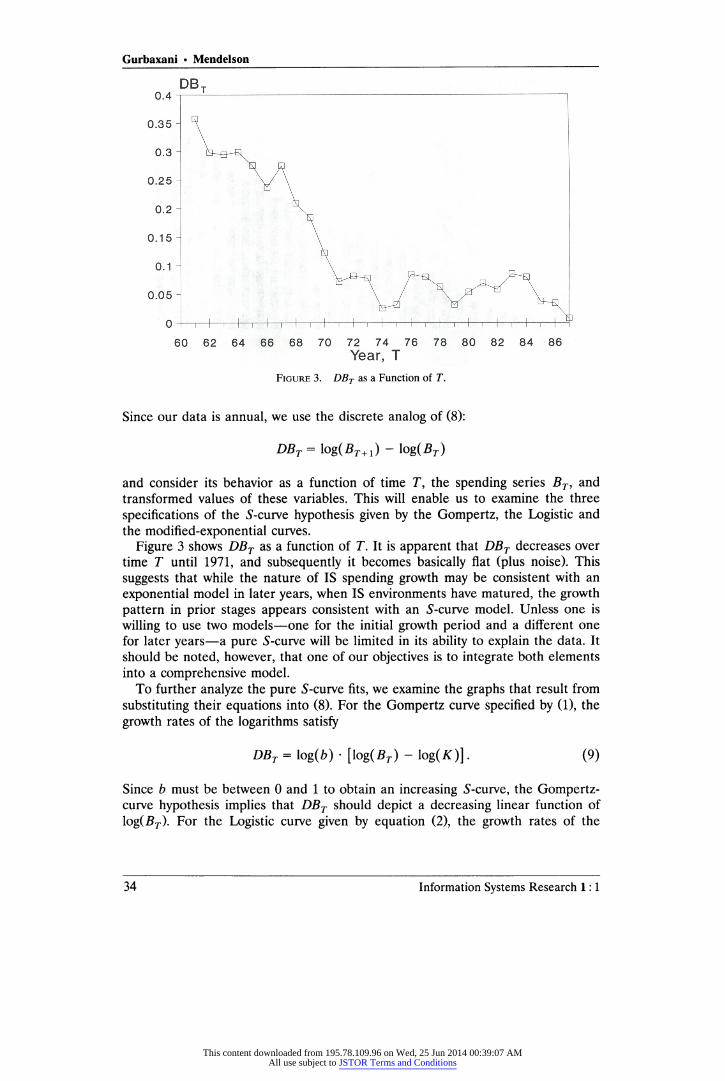
Figure 3. DBT as a Function of T.
Since our data is annual, we use the discrete analog of (8):
DBT = log(By-+1) —
Iog(Br)
and consider its behavior as a function of time T, the spending series BT, and transformed values of these variables. This will enable us to examine the three
specifications of the S-curve hypothesis given by the Gompertz, the Logistic and
the modified-exponential curves.
Figure 3 shows DBT as a function of T. It is apparent that DBT decreases over time T until 1971, and subsequently it becomes basically flat (plus noise). This
suggests that while the nature of IS spending growth may be consistent with an
exponential model in later years, when IS environments have matured, the growth
pattern in prior stages appears consistent with an 5-curve model. Unless one is
willing to use two models—one for the initial growth period and a different one for later years—a pure S-curve will be limited in its ability to explain the data. It should be noted, however, that one of our objectives is to integrate both elements into a comprehensive model.
To further analyze the pure S-curve fits, we examine the graphs that result from
substituting their equations into (8). For the Gompertz curve specified by (1), the
growth rates of the logarithms satisfy
DBT = log(b) • [log(Br) - log(/Q]. (9)
Since b must be between 0 and 1 to obtain an increasing 5-curve, the Gompertz curve hypothesis implies that DBT should depict a decreasing linear function of
log(Br). For the Logistic curve given by equation (2), the growth rates of the
34 Information Systems Research 1:1
This content downloaded from 195.78.109.96 on Wed, 25 Jun 2014 00:39:07 AMAll use subject to JSTOR Terms and Conditions
Integrative Model of Information Systems Spending Growth
dbt 0.4
□ □ □ □ □
D □
□
rS □ ® □
~i—i—i—i—r
1000 10000 100000
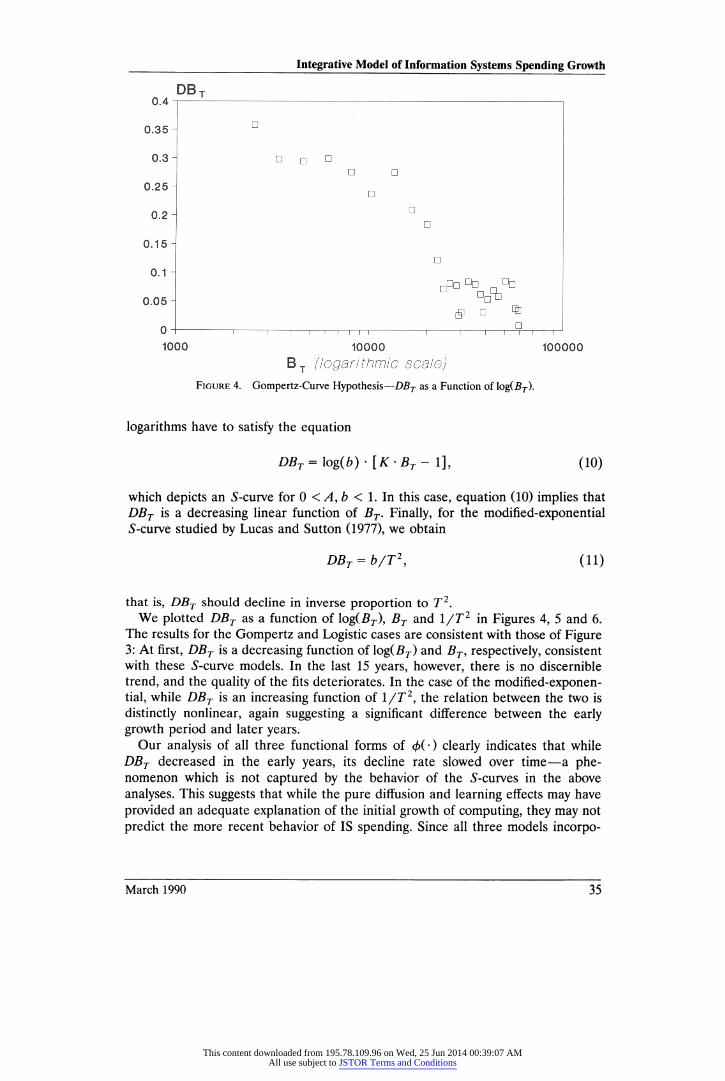
Bt (logarithmic scale) Figure 4. Gompertz-Curve Hypothesis—DBT as a Function of log( fiT).
logarithms have to satisfy the equation
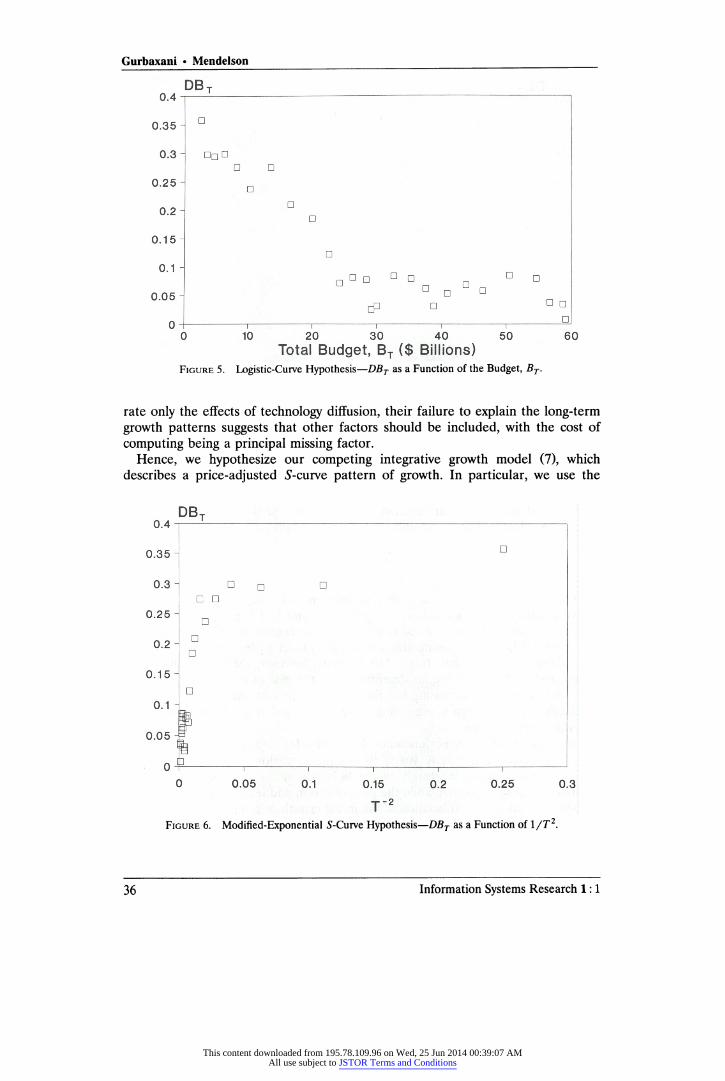
DBt = \og(b) ■ [K Bt- 1] (10)
which depicts an S-curve for 0 < A, b < 1. In this case, equation (10) implies that
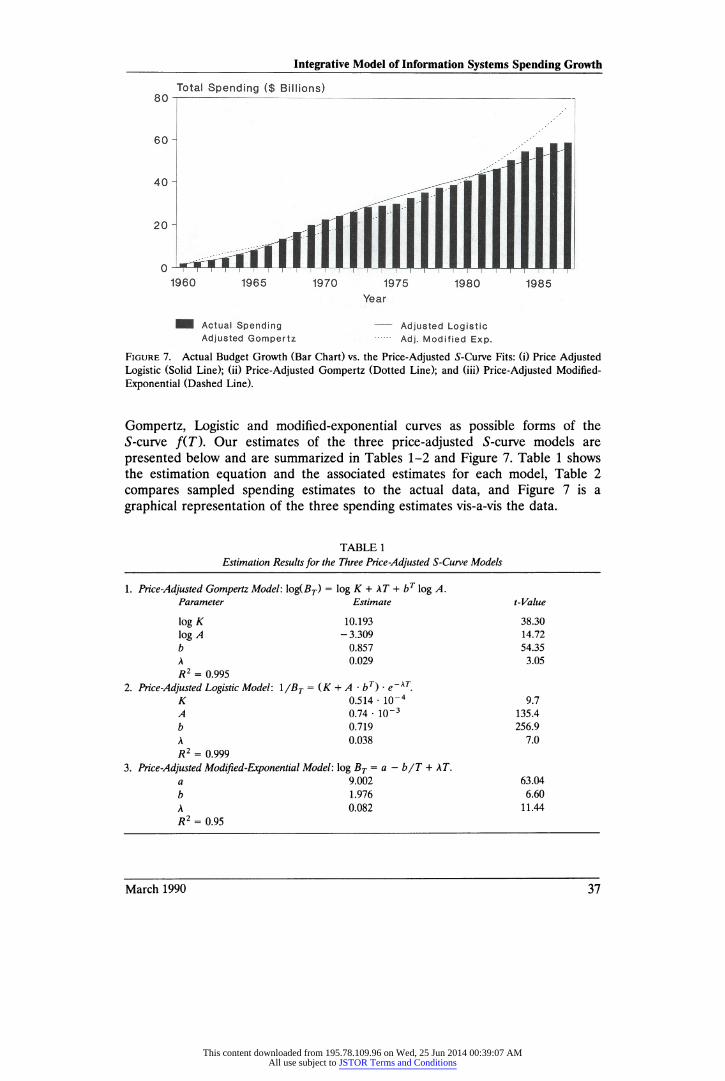
DBt is a decreasing linear function of Br. Finally, for the modified-exponential ■S-curve studied by Lucas and Sutton (1977), we obtain
that is, DBt should decline in inverse proportion to T2.
We plotted DBT as a function of log(Br), BT and 1/T2 in Figures 4, 5 and 6. The results for the Gompertz and Logistic cases are consistent with those of Figure 3: At first, DBT is a decreasing function of \og(Br) and BT, respectively, consistent with these S-curve models. In the last 15 years, however, there is no discernible trend, and the quality of the fits deteriorates. In the case of the modified-exponen tial, while DBt is an increasing function of 1/T2, the relation between the two is
distinctly nonlinear, again suggesting a significant difference between the early growth period and later years.
Our analysis of all three functional forms of </>(■) clearly indicates that while
DBT decreased in the early years, its decline rate slowed over time—a phe nomenon which is not captured by the behavior of the S-curves in the above
analyses. This suggests that while the pure diffusion and learning effects may have
provided an adequate explanation of the initial growth of computing, they may not
predict the more recent behavior of IS spending. Since all three models incorpo
March 1990 35
DBT = b/T2, (11)
This content downloaded from 195.78.109.96 on Wed, 25 Jun 2014 00:39:07 AMAll use subject to JSTOR Terms and Conditions
Gurbaxani • Mendelson
dbt 0.4 t
□□ □
□ o
□
□
□
qD 0 D D □ ° n □ D □
CP Q □ D
□
10 20 30 40 50
Total Budget, BT ($ Billions) Figure 5. Logistic-Curve Hypothesis—DBT as a Function of the Budget, BT.
rate only the effects of technology diffusion, their failure to explain the long-term growth patterns suggests that other factors should be included, with the cost of
computing being a principal missing factor.
Hence, we hypothesize our competing integrative growth model (7), which describes a price-adjusted S-curve pattern of growth. In particular, we use the
0.4 DB-,
0.35 -
0.3 "
0.25
0.2 ~\
0.15
0.1
0.05 f.
0
□ □
□
□ □
0.05 0.1
□
i i i
0.15 0.2 0.25
T"2
Figure 6. Modified-Exponential S-Curve Hypothesis—DBT as a Function of l/T2.
36 Information Systems Research 1:1
This content downloaded from 195.78.109.96 on Wed, 25 Jun 2014 00:39:07 AMAll use subject to JSTOR Terms and Conditions
Integrative Model of Information Systems Spending Growth
Total Spending ($ Billions) 80 t
60
40
20
0
1960 1965 1970
Actual Spending Adjusted Gompertz
1975
Year
1980 1985
Adjusted Logistic Adj. Modified Exp.
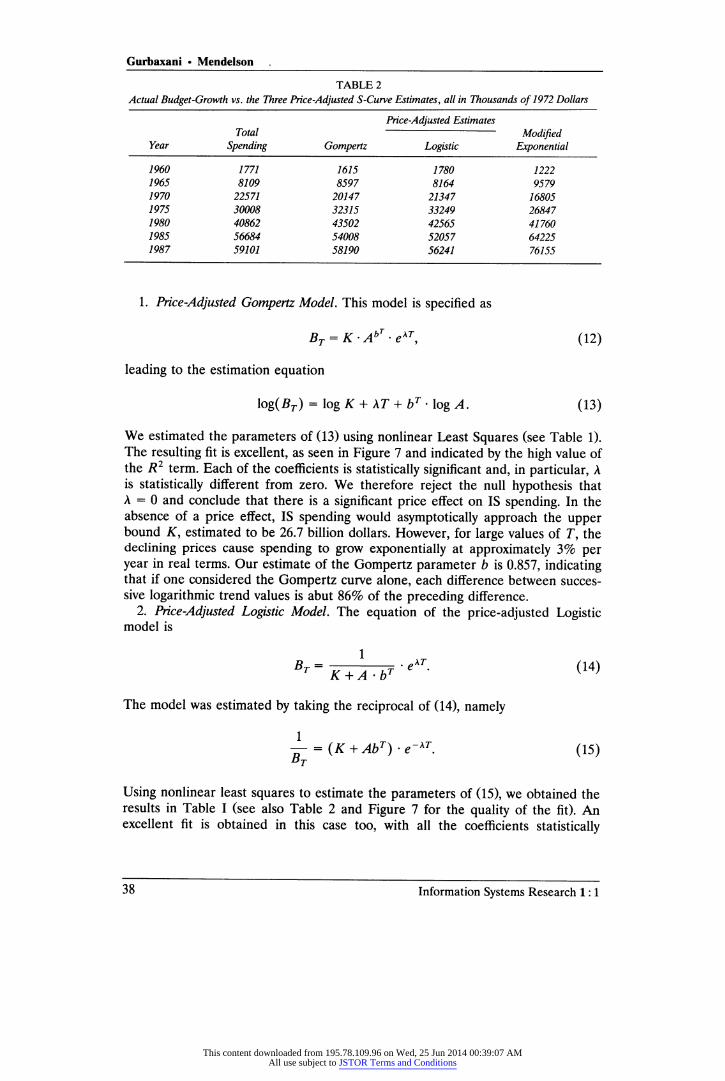
Figure 7. Actual Budget Growth (Bar Chart) vs. the Price-Adjusted 5-Curve Fits: (i) Price Adjusted
Logistic (Solid Line); (ii) Price-Adjusted Gompertz (Dotted Line); and (iii) Price-Adjusted Modified
Exponential (Dashed Line).
Gompertz, Logistic and modified-exponential curves as possible forms of the S-curve f(T). Our estimates of the three price-adjusted S-curve models are
presented below and are summarized in Tables 1-2 and Figure 7. Table 1 shows the estimation equation and the associated estimates for each model, Table 2
compares sampled spending estimates to the actual data, and Figure 7 is a
graphical representation of the three spending estimates vis-a-vis the data.
TABLE 1
Estimation Results for the Three Price-Adjusted S-Curve Models
1. Price-Adjusted Gompertz Model, log(Br) = log K + XT + b log A.
Parameter Estimate t-Value
log K 10.193 38.30
log A -3.309 14.72
b 0.857 54.35
A 0.029 3.05
R2 = 0.995
2. Price-Adjusted Logistic Model: 1 /Br = (K + A ■ bT) ■ e~Ar.
K 0.514 • 10~4 9.7
A 0.74 • 10~3 135.4
b 0.719 256.9
A 0.038 7.0
R2 = 0.999
3. Price-Adjusted Modified-Exponential Model: log BT = a — b/T + XT.
a 9.002 63.04
b 1.976 6.60
A 0.082 11.44
R2 = 0.95
March 1990 37
This content downloaded from 195.78.109.96 on Wed, 25 Jun 2014 00:39:07 AMAll use subject to JSTOR Terms and Conditions
Gurbaxani • Mendelson
TABLE 2
Actual Budget-Growth vs. the Three Price-Adjusted S-Curve Estimates, all in Thousands of 1972 Dollars
Year
Total
Spending Gompertz
Price-Adjusted Estimates
Logistic
Modified Exponential
1960 1771 1615 1780 1222 1965 8109 8597 8164 9579 1970 22571 20147 21347 16805 1975 30008 32315 33249 26847 1980 40862 43502 42565 41760 1985 56684 54008 52057 64225 1987 59101 58190 56241 76155
1. Price-Adjusted. Gompertz Model. This model is specified as
BT = K Ab -eXT, (12)
leading to the estimation equation
Iog(Br) = log K + \T + bT • log A. (13)
We estimated the parameters of (13) using nonlinear Least Squares (see Table 1). The resulting fit is excellent, as seen in Figure 7 and indicated by the high value of the R2 term. Each of the coefficients is statistically significant and, in particular, A is statistically different from zero. We therefore reject the null hypothesis that A = 0 and conclude that there is a significant price effect on IS spending. In the absence of a price effect, IS spending would asymptotically approach the upper bound K, estimated to be 26.7 billion dollars. However, for large values of T, the declining prices cause spending to grow exponentially at approximately 3% per year in real terms. Our estimate of the Gompertz parameter b is 0.857, indicating that if one considered the Gompertz curve alone, each difference between succes sive logarithmic trend values is abut 86% of the preceding difference.
2. Price-Adjusted Logistic Model. The equation of the price-adjusted Logistic model is
Bt = r ■ ekT. (14) T K +A-bT v '
The model was estimated by taking the reciprocal of (14), namely
-}- = (K+AbT)e->T. (15)
Using nonlinear least squares to estimate the parameters of (15), we obtained the results in Table I (see also Table 2 and Figure 7 for the quality of the fit). An excellent fit is obtained in this case too, with all the coefficients statistically
38 Information Systems Research 1:1
This content downloaded from 195.78.109.96 on Wed, 25 Jun 2014 00:39:07 AMAll use subject to JSTOR Terms and Conditions
Integrative Model of Information Systems Spending Growth
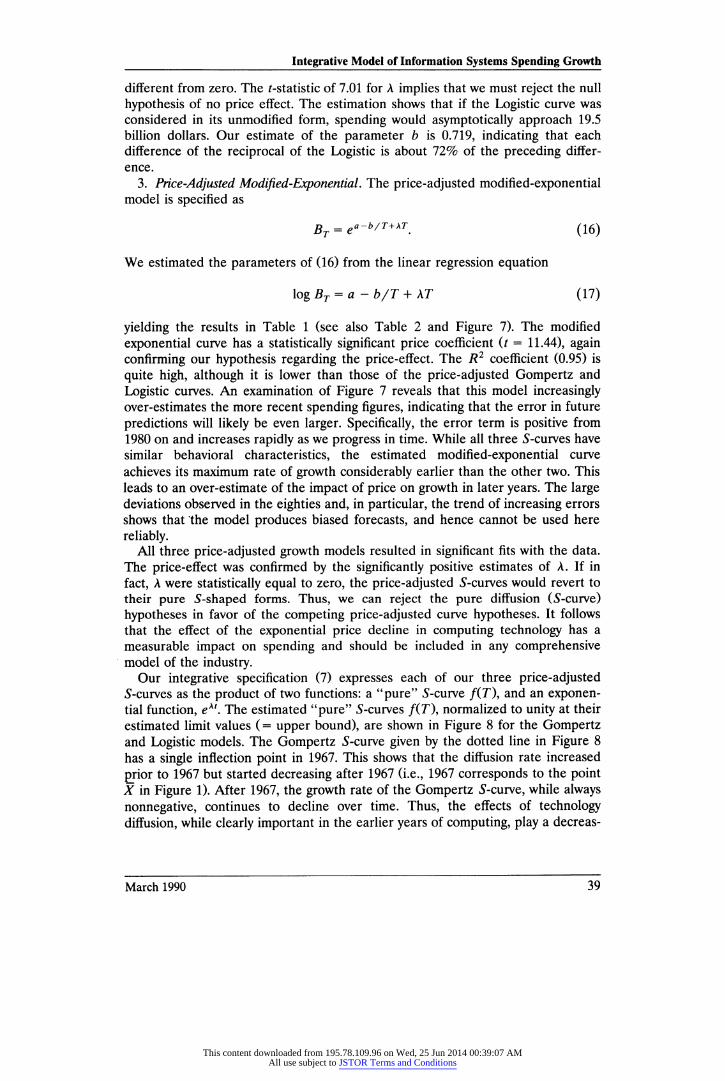
different from zero. The f-statistic of 7.01 for A implies that we must reject the null
hypothesis of no price effect. The estimation shows that if the Logistic curve was considered in its unmodified form, spending would asymptotically approach 19.5 billion dollars. Our estimate of the parameter b is 0.719, indicating that each difference of the reciprocal of the Logistic is about 72% of the preceding differ ence.
3. Price-Adjusted Modified-Exponential. The price-adjusted modified-exponential model is specified as
We estimated the parameters of (16) from the linear regression equation
yielding the results in Table 1 (see also Table 2 and Figure 7). The modified
exponential curve has a statistically significant price coefficient (t = 11.44), again confirming our hypothesis regarding the price-effect. The R2 coefficient (0.95) is
quite high, although it is lower than those of the price-adjusted Gompertz and
Logistic curves. An examination of Figure 7 reveals that this model increasingly over-estimates the more recent spending figures, indicating that the error in future
predictions will likely be even larger. Specifically, the error term is positive from 1980 on and increases rapidly as we progress in time. While all three 5-curves have similar behavioral characteristics, the estimated modified-exponential curve
achieves its maximum rate of growth considerably earlier than the other two. This leads to an over-estimate of the impact of price on growth in later years. The large deviations observed in the eighties and, in particular, the trend of increasing errors shows that the model produces biased forecasts, and hence cannot be used here
reliably. All three price-adjusted growth models resulted in significant fits with the data.
The price-effect was confirmed by the significantly positive estimates of A. If in
fact, A were statistically equal to zero, the price-adjusted 5-curves would revert to their pure 5-shaped forms. Thus, we can reject the pure diffusion (5-curve)
hypotheses in favor of the competing price-adjusted curve hypotheses. It follows that the effect of the exponential price decline in computing technology has a
measurable impact on spending and should be included in any comprehensive model of the industry.
Our integrative specification (7) expresses each of our three price-adjusted 5-curves as the product of two functions: a "pure" 5-curve f(T), and an exponen tial function, ek<. The estimated "pure" 5-curves f(T), normalized to unity at their
estimated limit values (= upper bound), are shown in Figure 8 for the Gompertz and Logistic models. The Gompertz 5-curve given by the dotted line in Figure 8
has a single inflection point in 1967. This shows that the diffusion rate increased
prior to 1967 but started decreasing after 1967 (i.e., 1967 corresponds to the point X in Figure 1). After 1967, the growth rate of the Gompertz 5-curve, while always
nonnegative, continues to decline over time. Thus, the effects of technology diffusion, while clearly important in the earlier years of computing, play a decreas
Bt = e"-b/T+\T (16)
log Bt = a - b/T + XT (17)
March 1990 39
This content downloaded from 195.78.109.96 on Wed, 25 Jun 2014 00:39:07 AMAll use subject to JSTOR Terms and Conditions
Gurbaxani • Mendelson
S-curve, f(T)
1960 1965 1970 1975 1980 1985 Year
Gompertz f Logistic f
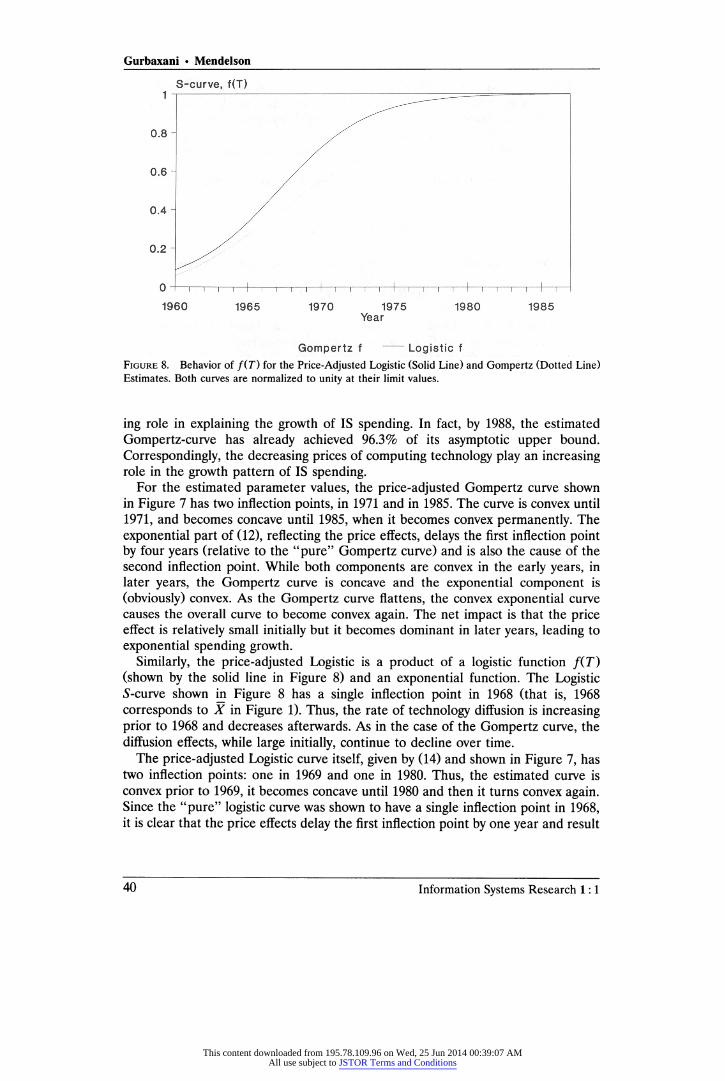
Figure 8. Behavior of f(T) for the Price-Adjusted Logistic (Solid Line) and Gompertz (Dotted Line) Estimates. Both curves are normalized to unity at their limit values.
ing role in explaining the growth of IS spending. In fact, by 1988, the estimated
Gompertz-curve has already achieved 96.3% of its asymptotic upper bound.
Correspondingly, the decreasing prices of computing technology play an increasing role in the growth pattern of IS spending.
For the estimated parameter values, the price-adjusted Gompertz curve shown in Figure 7 has two inflection points, in 1971 and in 1985. The curve is convex until
1971, and becomes concave until 1985, when it becomes convex permanently. The
exponential part of (12), reflecting the price effects, delays the first inflection point by four years (relative to the "pure" Gompertz curve) and is also the cause of the second inflection point. While both components are convex in the early years, in later years, the Gompertz curve is concave and the exponential component is
(obviously) convex. As the Gompertz curve flattens, the convex exponential curve
causes the overall curve to become convex again. The net impact is that the price effect is relatively small initially but it becomes dominant in later years, leading to
exponential spending growth. Similarly, the price-adjusted Logistic is a product of a logistic function f(T)
(shown by the solid line in Figure 8) and an exponential function. The Logistic S-curve shown in Figure 8 has a single inflection point in 1968 (that is, 1968
corresponds to X in Figure 1). Thus, the rate of technology diffusion is increasing prior to 1968 and decreases afterwards. As in the case of the Gompertz curve, the diffusion effects, while large initially, continue to decline over time.
The price-adjusted Logistic curve itself, given by (14) and shown in Figure 7, has two inflection points: one in 1969 and one in 1980. Thus, the estimated curve is convex prior to 1969, it becomes concave until 1980 and then it turns convex again. Since the "pure" logistic curve was shown to have a single inflection point in 1968, it is clear that the price effects delay the first inflection point by one year and result
40 Information Systems Research 1:1
This content downloaded from 195.78.109.96 on Wed, 25 Jun 2014 00:39:07 AMAll use subject to JSTOR Terms and Conditions
Integrative Model of Information Systems Spending Growth
in an additional inflection point. In the early years, both components are convex, whereas in later years the "pure" Logistic is concave and the exponential compo nent is convex. Thus, stable exponential growth dominates the behavior of DP
budgets in later years, while the diffusion effects prevail in the early years. The
"pure" Logistic curve f(T) has achieved 99.9% of its limiting value by 1988,
suggesting that virtually all future growth will be due to the price-effect. Next, we consider the growth rates of the price-adjusted curves, given by
d(logBT) d(log/(:r)) dT
= dT
<18)
From equation (18), the instantaneous percentage spending growth is the sum of the S-curve growth, <i(log(f(T)))/dT, and the constant A which reflects the
price-induced growth. Considering first the price-adjusted Logistic estimate, A is
0.03799, implying a constant annualized growth of 3.87% per year.5 The growth rate of the logistic curve changes over time: In 1960, it was 0.296, implying that the instantaneous growth rate due to technology diffusion was 29.6%, or that 88% of the total growth was due to diffusion. In 1970, IS spending grew at 13%, of which 9.2% (or about 70% of the total) was due to technology diffusion and the balance —to the price effect. In 1980, spending grew by 4.3%, of which only one half of one percent (or 11% of the total) was due to diffusion effects, and in 1988 the diffusion effect results in a growth rate of only 0.03%. These trends are apparent from Figure 8. It is clear that over time, the effects of technology diffusion have decreased to the point where they have become negligible, and the current growth pattern is exponential.
The price-adjusted Gompertz curve shows a similar pattern. Here, the instanta neous growth rate is A = 0.029 with an annualized growth rate of 2.97 percent. This model shows that in 1960, IS spending grew at an instantaneous rate of
46.75%, of which 43.78% (or 93.65% of the total growth) were due to technology diffusion. In 1970, spending grew at 12.1% per year, of which 9.3% (or 77% of the
total) were due to the 5-curve effects and the remainder—to the price effects. In
1980, technology diffusion accounts for 1.9 percent (39% of the total) and in 1988, for one half of one percent, or 14% of the total. The effects of the diffusion of
technology in this case can also be inferred from Figure 8. While the similarities between the two cases are evident, there are some
differences. Recall from §2 that the Logistic curve traces a growth rate that is
symmetric about its maximum, which occurs when the budget has reached 50% of its limit value (as predicted by the 5-curve alone), whereas the Gompertz curve achieves its maximum rate of growth at around 37 percent of its equilibrium level.
Figure 8 indicates that while the Logistic curve is virtually flat from the early eighties, the Gompertz curve is still increasing, albeit slowly, in the same period. Thus, the estimated Gompertz curve reaches its Maturity Stage later than the
Logistic curve. Correspondingly, a smaller share of the budget growth in later years is attributed to the price effects under the Gompertz model compared to the
Logistic. This is why the price-adjusted Logistic model gives rise to a higher
sThe annualized percentage growth rate is given by eK - 1.
March 1990 41
This content downloaded from 195.78.109.96 on Wed, 25 Jun 2014 00:39:07 AMAll use subject to JSTOR Terms and Conditions
Gurbaxani • Mendelson
estimate of A (i.e., more of the growth is attributed to the price effects) and it
correspondingly predicts a slightly faster rate of growth in later years than the
price-adjusted Gompertz model. These results have several important implications. The first of these differenti
ates the dynamics of the computer industry from other industries: Even as the
industry matures, expenditures continue to grow exponentially, in stark contrast to
industries where S-curve behavior prevails. This is a direct outcome of the rapidly decreasing costs of computer hardware, which continue to drive the growth of DP.
This result also has obvious implications for the sales projections of the industry. A
second implication is that by the mid-eighties, IS has achieved stable practices for
the management and use of information technology. If in fact this were not the
case, we would expect to see continuing evidence of transient behavior. Our
empirical evidence suggests that the transient effects are vanishing, implying that users passed the learning stages and achieved maturity. It also lends credence to
the proposition that the developments in information technology, though rapid, have been incremental, and that current growth is driven primarily by the response to changes in the supply side rather than by demand shifts.
Our model also has implications for forecasting the magnitude of IS expendi tures into the future. In the absence of an underlying model, standard prediction techniques can lead to erroneous forecasts. We compare the predictions of our
model with two popular methodologies—linear and exponential extrapolation. Using the observed expenditures in 1970 and in 1980, we first predict spending for 1987 (the latest data point) and compare the forecasts with the observed data.
Linear extrapolation would predict the 1987 expenditures to be 53.67 billion
dollars, exponential growth predicts 61.91 billion dollars, the price-adjusted Gom
pertz curve predicts 58.19 billion dollars and the price-adjusted Logistic model
predicts 56.24 billion dollars. When compared with the observed value of 59.10
billion dollars, it is seen that the price-adjusted Gompertz curve provides the best
estimate. The price-adjusted Logistic curve is the next best and the exponential model provides an estimate of slightly lower quality, whereas the linear model
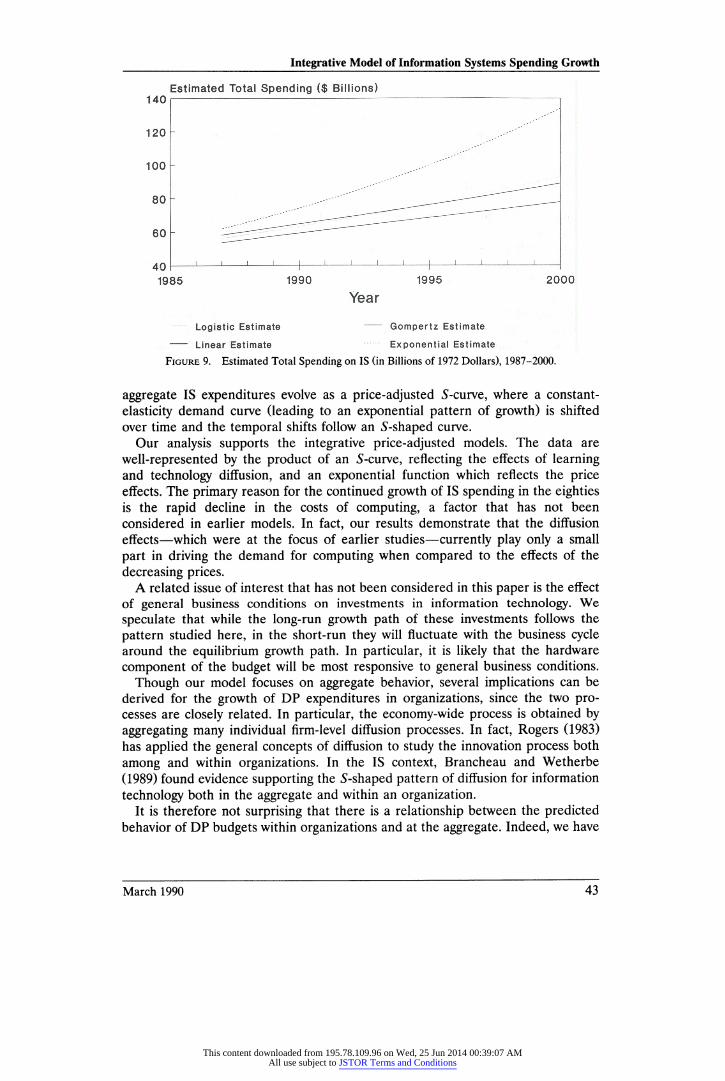
significantly under-estimates the observed value. For longer-term predictions, the differences become more pronounced, as shown
in Figure 9. As seen in the figure, linear extrapolation significantly under-estimates
spending while the exponential growth model would over-estimate spending in all
periods. The Logistic and Gompertz models result in predictions that are within a
few percentage points of each other. The longer term predictions of the Logistic model from 1995 on are slightly higher (up to 4% in the year 2,000) than those of
the Gompertz model, since the Logistic model attributes a larger share of the
growth to the price-effect. Aside from these small differences, however, the two
price-adjusted model forecasts are similar, while they differ considerably from the
linear and exponential extrapolations. These results demonstrate the value of an
underlying model of growth in providing reliable forecasts.
6. Concluding Remarks This paper proposes and tests an integrative model of IS spending growth which
incorporates the effects of price on the demand for computing with those of
learning and diffusion. We suggest that in response to the prevailing cost trends,
42 Information Systems Research 1:1
This content downloaded from 195.78.109.96 on Wed, 25 Jun 2014 00:39:07 AMAll use subject to JSTOR Terms and Conditions
Integrative Model of Information Systems Spending Growth
Estimated Total Spending ($ Billions)
Logistic Estimate
Linear Estimate
Gompertz Estimate
Exponential Estimate
Figure 9. Estimated Total Spending on IS (in Billions of 1972 Dollars), 1987-2000.
aggregate IS expenditures evolve as a price-adjusted S-curve, where a constant
elasticity demand curve (leading to an exponential pattern of growth) is shifted over time and the temporal shifts follow an S-shaped curve.
Our analysis supports the integrative price-adjusted models. The data are
well-represented by the product of an S-curve, reflecting the effects of learning and technology diffusion, and an exponential function which reflects the price effects. The primary reason for the continued growth of IS spending in the eighties is the rapid decline in the costs of computing, a factor that has not been considered in earlier models. In fact, our results demonstrate that the diffusion effects—which were at the focus of earlier studies—currently play only a small
part in driving the demand for computing when compared to the effects of the
decreasing prices. A related issue of interest that has not been considered in this paper is the effect
of general business conditions on investments in information technology. We
speculate that while the long-run growth path of these investments follows the
pattern studied here, in the short-run they will fluctuate with the business cycle around the equilibrium growth path. In particular, it is likely that the hardware
component of the budget will be most responsive to general business conditions.
Though our model focuses on aggregate behavior, several implications can be
derived for the growth of DP expenditures in organizations, since the two pro cesses are closely related. In particular, the economy-wide process is obtained by
aggregating many individual firm-level diffusion processes. In fact, Rogers (1983) has applied the general concepts of diffusion to study the innovation process both
among and within organizations. In the IS context, Brancheau and Wetherbe
(1989) found evidence supporting the S-shaped pattern of diffusion for information
technology both in the aggregate and within an organization. It is therefore not surprising that there is a relationship between the predicted
behavior of DP budgets within organizations and at the aggregate. Indeed, we have
March 1990 43
This content downloaded from 195.78.109.96 on Wed, 25 Jun 2014 00:39:07 AMAll use subject to JSTOR Terms and Conditions
Gurbaxani • Mendelson
proved in §2 that the pattern of growth that results from the aggregation of
5-curves is also an 5-curve. Thus, the rejection of 5-curve behavior for the
economy as a whole also rejects the hypothesis that individual firms generally experience an 5-curve pattern of budget growth. This result is consistent with that of Lucas and Sutton (1977), who rejected the 5-curve hypothesis using data from 29 counties in California.
We believe that the drivers of the adoption and diffusion of information
technology both within a firm and in the economy are similar. We therefore
suggest that the growth of IS budgets within a firm will also be driven by transient factors such as organizational learning in the early periods, with later growth being due primarily to price effects. This suggests that models (such as Nolan's stage hypothesis) based on the diffusion of innovation in organizations should be
expanded to account for economic factors and, in particular—price. From this
perspective, IS managers had to manage two distinct forms of growth—one characterized by significant organizational learning relating to the introduction of new technology, and the second pertaining to steady but rapid growth. As dis cussed by Nolan (1973, 1979) and Cash, McFarlan and McKenney (1988), the
appropriate management practices in these different phases can be quite different. Our results have significant implications for the suppliers of information tech
nology, who are provided with a means of forecasting future growth. While traditional 5-curve models suggest that suppliers in a mature market should
anticipate low growth as penetration levels approach saturation and should there fore focus primarily on the demand for replacement goods and related services such as maintenance, our results demonstrate that in the computer industry, vendors can plan for continued long-run growth. This has significant implications for the acquisition of inputs to the suppliers' manufacturing process such as plant capacity and manpower, as well as the direction and focus of research efforts related to the development of new products. We show that rather than become
stagnant like some other industries, the IS industry is expected to continue to
grow, suggesting that research, development and new investment are called for. In conclusion, we would like to emphasize the importance of integrating social,
behavioral and economic factors in MIS research. Our results show that the use of theories from different disciplines leads to the development of insights that are less
likely to obtain from the use of a single reference discipline (Mendelson 1987).
Hopefully, this paper provides an example of the value of such integration.
Acknowledgements. Partial financial support by the IBM Program of Support for Education in Management of Information Systems is gratefully acknowledged. The authors also thank the Information Systems Research Associate Editor and referees for many constructive suggestions.*
*Charles H. Kriebel, Associate Editor. This paper was received on July 6, 1988 and has been with the authors 7 months for 2 revisions.
References Ball, L. D., I. G. Dambolena, and H. D. Hennessey, "Identifying Early Adopters of Large Software
Systems," Data Base, 19, 1 (1987/88), 21-27.
Bass, F. M., "A New Product Growth Model for Consumer Durables," Management Sci., 15 (January 1969), 215-227.
44 Information Systems Research 1:1
This content downloaded from 195.78.109.96 on Wed, 25 Jun 2014 00:39:07 AMAll use subject to JSTOR Terms and Conditions
Integrative Model of Information Systems Spending Growth
, "The Relationship Between Diffusion Rates, Experience Curves, and Demand Elasticities for Consumer Durable Technological Innovations," J. Business, 53, 3, 2 (1980), S52-S67.
and A. V. Bultez, "A Note on Optimal Strategic Pricing of Technological Innovations,"
Marketing Sci., 1 (Fall 1982), 41-63.
Blackman, A. W., Jr., "The Market Dynamics of Technological Substitutions," Technological Forecast
ing and Social Change, 6 (1974), 41-63.
Brancheau, J. C. and J. C. Wetherbe, "End-User Computing and Knowledge Work: Managing the
Introduction of New Information Technology," CIO J., (Spring 1989).
Bureau of Economic Analysis, "The National Income and Product Accounts of the United States,"
Washington, D.C., 1989.
Cale, E. G., et al., "Price/Performance Patterns of U.S. Computer Systems," Comm. ACM, 22, 4
(April 1979), 225-233.
Cash, J. I„ Jr., F. W. McFarlan and J. L. McKenney, Corporate Information Systems Management, Irwin,
Homewood, IL, 1988.
Chow, G. C., "Technological Change and the Demand for Computers," Amer. Economic Rev., 57
(1967), 1117-1130.
Dolan, R. J. and A. P. Jeuland, "Experience Curves and Dynamic Demand Models: Implications for
Optimal Pricing Strategies," J. Marketing, 45 (Winter 1981), 52-62.
Federowicz, J., "Comments on Price/Performance of U.S. Computer Systems," Comm. ACM, 24, 9
(September 1981), 585-586.
Gurbaxani, V. and H. Mendelson, "Software and Hardware in Data Processing Budgets," IEEE Trans.
Software Engineering, SE-13, 9 (September 9), 1010-1017.
, "Data-Processing Budget Shares: An Empirical Analysis," Working paper, University of
Rochester William E. Simon Graduate School of Business Administration, 1988.
, "The Use of Secondary Analysis in MIS Research," Proc. Harvard/UCI Workshop on
Survey Research in MIS, Harvard Business School Press, forthcoming (1989).
Hendry, I. C., "The Three-Parameter Approach to Long Range Forecasting," Long Range Planning, 40-45.
Huff, S. L. and M. C. Munro, "Information Technology Assessment and Adoption: A Field Study," MIS Quart., (December 1985), 327-338.
Kotler, P. and A. R. Andreasen, Strategic Marketing for Nonprofit Organizations (3rd Ed.), Prentice-Hall,
Englewood Cliffs, NJ, 1987.
Lackman, C. L., "Gompertz Curve Forecasting: A New Product Application," J. Market Res. Soc., 20, 1
(October 1977), 45-47.
Lucas, H. C. and J. A. Sutton, "The Stage Hypothesis 5-Curve: Some Contradictory Evidence," Comm.
ACM, 20 (1977), 254-259.
Mahajan, V. and E. Muller, "Innovation Diffusion and New-Product Growth Models in Marketing," J.
Marketing, 43 (October 1979), 55-68.
Mansfield, E., "Technical Change and the Rate of Imitation," Econometrica, 29 (October 1961), 741-766.
Mendelson, H., "Pricing Computer Services: Queueing Effects," Comm. ACM, 28 (1985), 312-321.
, "Competing Reference Disciplines for MIS Research," Proc. Eighth Internat. Conf. Infor mation Systems, Pittsburgh, PA, 1987, 455-458.
, The Economics of Information Systems Management, Prentice Hall, Englewood Cliffs, NJ,
forthcoming, 1990.
Nolan, R. L., "Managing the Computer Resource: A Stage Hypothesis," Comm. ACM, 16 (1973), 399-405.
, "Controlling the Cost of Data Services," Harvard Business Rev., (July-August 1977),
114-124.
, "Managing the Crisis in Data Processing," Harvard Business Rev., (March/April 1979),
115-126.
Phister, M., Jr., Data Processing and Economics, Santa Monica Publishing Company and Digital Press,
1979.
Rogers, E. M., Diffusion of Innovations, The Free Press, New York, 1962.
, Diffusion of Innovations (Third Ed.), The Free Press, New York, 1983.
March 1990 45
This content downloaded from 195.78.109.96 on Wed, 25 Jun 2014 00:39:07 AMAll use subject to JSTOR Terms and Conditions
Gurbaxani • Mendelson
Rogers, E. M. and F. F. Shoemaker, Communications of Innovations: A Cross-Cultural Approach, The
Free Press, New York, 1971.
Sharpe, W. F., The Economics of Computers, Columbia University Press, 1969.
Swanson, E. B., "Innovation Among Information Systems Organizations," Working paper, Anderson
Graduate School of Management, UCLA, Los Angeles, California, 1989.
Zmud, R. W., "Diffusion of Modern Software Practices: Influence of Centralization and Formalization,"
Management Sci., 28, 12 (December 1982), 1421-1431.
, "An Examination of 'Push-Pull' Theory Applied to Process Innovation in Knowledge Work," Management Sci., 30, 6 (June 1984), 727-738.
46 Information Systems Research 1:1
This content downloaded from 195.78.109.96 on Wed, 25 Jun 2014 00:39:07 AMAll use subject to JSTOR Terms and Conditions


