Water Research 38 (2004) 3645–3650
ARTICLE IN PRESS
*Correspond
46-222-4713.
E-mail addr
(B. Mattiasson)
0043-1354/$ - se
doi:10.1016/j.w
An automated spectrophotometric system for monitoringbuffer capacity in anaerobic digestion processes
Tor Gunnar Jantsch, Bo Mattiasson*
Department of Biotechnology, Center for Chemistry and Chemical Engineering, Lund University, P.O. Box 124, SE-221 00 Lund, Sweden
Received 7 October 2003; received in revised form 7 May 2004; accepted 12 May 2004
Abstract
Anaerobic digestion is a suitable method for the treatment of wastewater and organic wastes, yielding biogas as a
useful by-product. A common way of preventing instability problems and avoiding acidification in anaerobic digesters
is to keep the organic load to the digester far below its maximum capacity. An improved way of operating digesters
would be to use monitoring and control systems for increased organic load under controlled conditions such that the
digester performance is improved. The partial alkalinity, which indicates the bicarbonate concentration, has in many
cases been found to be a suitable parameter to monitor. Here, an automated monitoring system for alkalinity
measurements is described. It is shown to be applicable for measuring a wide range of bicarbonate concentrations. The
system shows potential for monitoring anaerobic digesters as it responds to the alkalinity of digester effluent, as well as
being stable over a relatively long time span with few maintenance requirements.
r 2004 Elsevier Ltd. All rights reserved.
Keywords: Automated monitoring; Buffer capacity; Alkalinity; Spectrophotometric; Anaerobic digestion
1. Introduction
Anaerobic biological treatment of wastewater has
several advantages over aerobic treatment processes
such as lower sludge production and a valuable by-
product; methane. Despite these obvious advantages,
the use of anaerobic treatment is not as widespread as it
could be and one reason for this is its reputation of
instability during start-up and operation.
The anaerobic biodegradation of organic matter to
biogas is conducted by a consortium of microbial groups
with a high degree of interdependence. The methano-
genic organisms (pH optimum: 6.5 to 7.5) are considered
to be the most sensitive organisms in this consortium
ing author. Tel.: +46-46-222-8264; fax: +46-
ess: [email protected]
.
e front matter r 2004 Elsevier Ltd. All rights reserve
atres.2004.05.010
and are also the slowest growing organisms in the
degradation chain. This implies that unfavourable
conditions such as organic overload, unfavourable pH
or presence of toxic compounds will cause instability
and be observed as elevated concentrations of metabo-
lites in the metabolic chain preceding the action of the
methanogens. One group of metabolic intermediates
that is especially of high significance is the volatile
fatty acids (VFAs). Increased concentration of VFAs
may lead to a decrease in the buffering bicarbonate
concentration, as the bicarbonate becomes protonated
and is released as carbondioxide gas. The pH of the
reactor may decrease to levels below the optimal for the
methanogenic organisms, thereby escalating the instabil-
ity problem. Upon instability, the loading to the process
may have to be stopped for prolonged periods of time to
facilitate degradation of the VFAs and recovery of the
metabolic balance in the reactor. In severe cases the
instability may cause acidification of the reactor with
complete inhibition of the methanogenic activity. Such a
d.
ARTICLE IN PRESS
Nomenclature
Abbreviations
VFA volatile fatty acids
pKa �log[acid dissociation constant]TA total alkalinity
PA partial alkalinity
T.G. Jantsch, B. Mattiasson / Water Research 38 (2004) 3645–36503646
situation makes it necessary to remove the reactor
content and to start up the reactor again.
A common way of avoiding instability problems is to
operate the anaerobic digestion process at an organic
loading rate which is far below the maximum capacity of
the system. A more economically favourable way of
operating a digester and avoiding instability problems
would be to monitor and control the process. An ideal
monitoring and control system would detect instability
and imply countermeasures to compensate for the
instability. The monitoring system should be online,
automated, robust and give early indications of in-
stability in the process. Some process indicators, which
traditionally have been used for monitoring, are the gas
production rate, gas composition, pH, alkalinity and
concentrations of VFAs. Liquid-phase parameters (pH,
alkalinity, VFA) reflect the environment of the micro-
organisms and therefore, often give a faster response
than gas-phase parameters (gas composition and pro-
duction rate). pH is commonly used as a process
indicator, but the effectiveness of using this as a control
parameter is strongly dependent on the alkalinity, i.e.
buffering capacity of the process (Ahring et al., 1995).
The alkalinity is mainly dependent on the bicarbonate
and VFA-concentrations (�log[acid dissociation con-
stant] (pKa) values of 6.35 and 4.75, respectively), and in
some processes the ammonium concentration (pKa-
value of 9.4). The most important buffering species
within the optimal pH for the methanogenic organisms
is the bicarbonate and therefore it is of interest to
develop methods to monitor it.
The total alkalinity (TA) (alkalinity to a pH of 4.3)
has been used for monitoring anaerobic processes but is
considered as an insensitive indicator of process
instability. As shown by the pKa-values of bicarbonate
and VFAs, measurements of TA will reflect both the
levels of VFAs and bicarbonate. Upon instability, the
increase in VFA concentrations will cause a decrease in
bicarbonate concentration resulting in a constant TA-
value (Jenkins et al., 1991). Partial alkalinity (PA)
(alkalinity to a pH of 5.75) reflects mostly the
bicarbonate concentration and has been found to be a
valuable tool for process monitoring (Bjornsson, 2000).
More sophisticated titration techniques have been
developed for the determination of VFA and bicarbo-
nate concentrations (Moosbrugger et al., 1993). On-line
methods for monitoring of bicarbonate concentrations
have been developed based on sample saturation with
carbon dioxide and acidification to release bicarbonate
as carbon dioxide with subsequent gas-pressure or
gas-flow determination (Hawkes et al., 1993; Rozzi
and DiPinto, 1994). Also online methods based on other
principles such as titration have been developed (Powell
and Archer, 1989; Almeida et al., 2001).
Previously, a new spectrophotometric method for
alkalinity measurements based on pH indicators has
been used for process monitoring of different anaerobic
digester systems (Bjornsson et al., 2001; Jantsch and
Mattiasson, 2003). The aim of this investigation was to
construct and characterise a fully automated system for
monitoring of anaerobic digestion processes based on
the new spectrophotometric method.
2. Materials and methods
2.1. Titrimetric alkalinity
The titrimetric alkalinity was measured as PA
by titration to pH 5.75 with standardised 0.1M HCl
by using a TitraLabTM 80 titrator (Radiometer,
Copenhagen, Denmark). The results are reported as g
CaCO3 1�1.
2.2. Automated alkalinity monitoring system
The principle for the monitoring system is that a pH
indicator is used to spectrometrically determine the pH
of a mixture of the sample and an acid. When the pH of
the mixture is 5.75, the mixing ratio between the sample
and the acid is compared to mixing ratios of the
standard samples and used to determine the PA of
the sample. Upon changes in bicarbonate concentrations
of the samples, this is reflected in a change in the mixing
ratio between the sample and the acid.
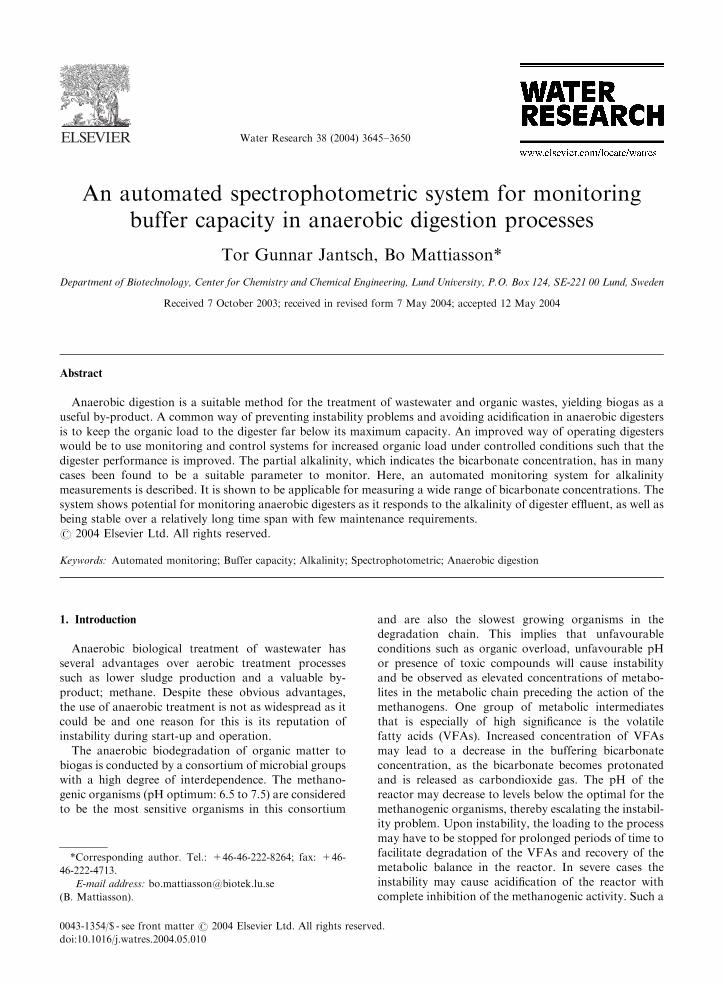
The monitoring system was based on a method
described by Jantsch and Mattiasson (2003) and is
schematically presented in Fig. 1. The spectrophot-
ometer and the pumps were controlled and data were
collected by Fieldpoint modules (National Instruments,
USA) connected via ethernet to a PC. The PC program
for control, data collection and data handling was
developed in the Labview program (National Instru-
ments, USA).
The solutions of sample and acid were delivered by
peristaltic pumps (Alitea, Sweden) fitted with Tygon
tubings. The peristaltic pump caused fluctuations of the
flow and these fluctuations were dampened by an air
filled syringe fitted into the line just after the pump.
Teflon tubing (outer diameter lmm, inner diameter
ARTICLE IN PRESS
WasteMixing coil Spectro-
photometerSample
Acid
Pump
Pump
PC
Fig. 1. Automated system for monitoring buffering capacity.
T.G. Jantsch, B. Mattiasson / Water Research 38 (2004) 3645–3650 3647
0.75mm) was used for connecting tubes and mixing coil.
The confluence point was constructed of a Teflon
polymer Tee (Scantech, Sweden). The tube connections
were made of silicone rubber tubing. An Ultrospec 1000
spectrophotometer (Pharmacia Biotech, Sweden)
equipped with a SOG 1.0 flow cell (Starna) was used
for detection.
A flow of the sample was continuously mixed with a
flow of degassed acid (20 or 25mM HCl) containing
methylred pH-indicator (5mg l�1). The mixture was
pumped continuously through the flow cell in the
spectrophotometer.
Determination of PA by the system was based on the
measurement of the spectral properties of the indicator,
that is, the absorbance of the yellow and red colours of
the pH indicator Methylred. The absorbance maxima
for the protonated (red) and unprotonated (yellow) were
438 and 516 nm, respectively, and these were used as the
wavelengths for measurement.
For each wavelength the absorbance was monitored
for l50 s (five measurements per second) as the mixture
flowed through the flow cell. The absorbance value was
averaged for the 150 s. The total measurement time for
each sample was two times 150 s; 5min.
The ratio between the absorbances at the two
wavelengths was used to indicate the pH of the mixture.
A ratio of 2.30 indicated a pH of 5.75 in the mixture.
The ratios 2.20 and 2.40 indicated pHs of 5.7 and 5.9,
respectively. For a measurement to be valid, a pH range
of the mixture of 5.7 to 5.9 was set. If the pH of the
mixture went outside this range, the measurement was
considered to be invalid because it deviated too far from
the desired value of 5.75. The mixing ratio was recorded
as sensor response.
To make the pH-value approach the desired pH, the
mixing ratio for the subsequent sample was adjusted by
controlling the speed of the pumps. The size of
adjustment depended on the deviation from the desired
pH-value.
pH ¼ pKaþHCO�3 =H2CO3: ð1Þ
From Eq. (1), the ratio HCO3�/H2CO3 can be calculated.
For the ideal mixture of sample and acid, the pH is
5.75 which gives a HCO3�/H2CO3-ratio of 0.251. At the
same mixing ratio, the pH of the mixture will decrease to
5.7 if the bicarbonate concentration of the sample
decreases by 2.5%. Likewise, at the same mixing ratio
the pH will increase to 5.9 if the bicarbonate concentra-
tion of the sample increases by 8.3%. This implies that if
the bicarbonate concentration in the sample is decreas-
ing by 2.5% or increasing by 8.3% before the next
sample is taken, the next measurement will be valid, that
is, within the range. If the changes are higher than the
limits, then the measurement will be out of range and the
system will require one or more measurements with
adjustment of the mixing ratio for the pH of the mixture
to be within the range again.
2.3. Characterisation of the system
The response of the monitoring system towards
samples of Na2CO3 (5, 10, 15, 20 and 25mM) was
tested.
Anaerobic digester samples were filtered online from
a full-scale anaerobic digester treating municipal
sludge. The filter was a nylon cloth (gap size: 20 mm)inserted into a pipeline where the reactor content were
circulated from the bottom of the reactor, through a
heat exchanger and to the top of the reactor. The
samples were diluted with distilled water or spiked with
Na2CO3-solution and measured using the monitoring
system.
The stability of the system during a 5-day period was
investigated. Different standard samples were monitored
continuously in the system during the period.
The system was applied to monitor a full-scale
anaerobic digester. The feed to the digester consisted
of a mixture of municipal wastewater sludge and potato-
processing waste. An overload situation was induced by
overloading the digester with a pulse of potato-proces-
sing waste that corresponded to 20% of the normal daily
load of the digester (Jantsch, 2003).
3. Results and discussion
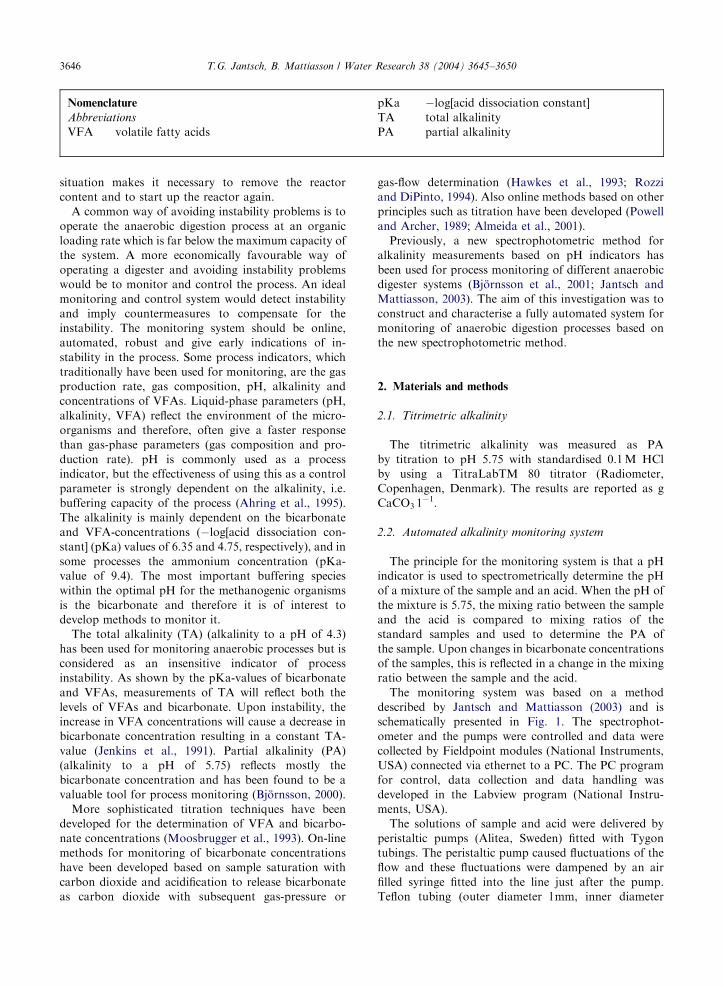
The linear relationship between the concentration of
Na2CO3 in standard solutions and the response of the
monitoring system is illustrated in Fig. 2. In the
concentration range 5–25mM Na2CO3 the monitoring
system response had a regression analysis correlation
coefficient (R2) of 0.9965. The resolution of the system
was defined as two times the standard deviation for the
sample series that had the highest standard deviation,
and when inserted in the regression analysis linearity
formulae, this gave a resolution of 1.44mM Na2CO3.
Guwy et al. (1994) found the range 5 to 50mM
NaHCO3 with an accuracy of 7.5% (0.38–3.8mM) in
a response time of 30min in an automated system based
on gas flow measurements from an acidified sample.
ARTICLE IN PRESS
0
2
4
6
8
10
12
14
0 5 10 15 20 25 30
Na2CO3 [mM]
Mo
nit
ori
ng
sys
tem
res
po
nse
Fig. 2. Monitoring system response as a function of Na2CO3concentration in standard solutions with linear regression
analysis (y ¼ 05008x � 0:3213; R2 ¼ 0:9863). Error bars depict95% confidence interval for the system response (3 to 7
measurements).
0
2
4
6
8
10
12
14
16
18
Titrimetric partial alkalinity [g CaCO3 l-1]
Mo
nit
ori
ng
sys
tem
res
po
nse
0 1 2 3 4
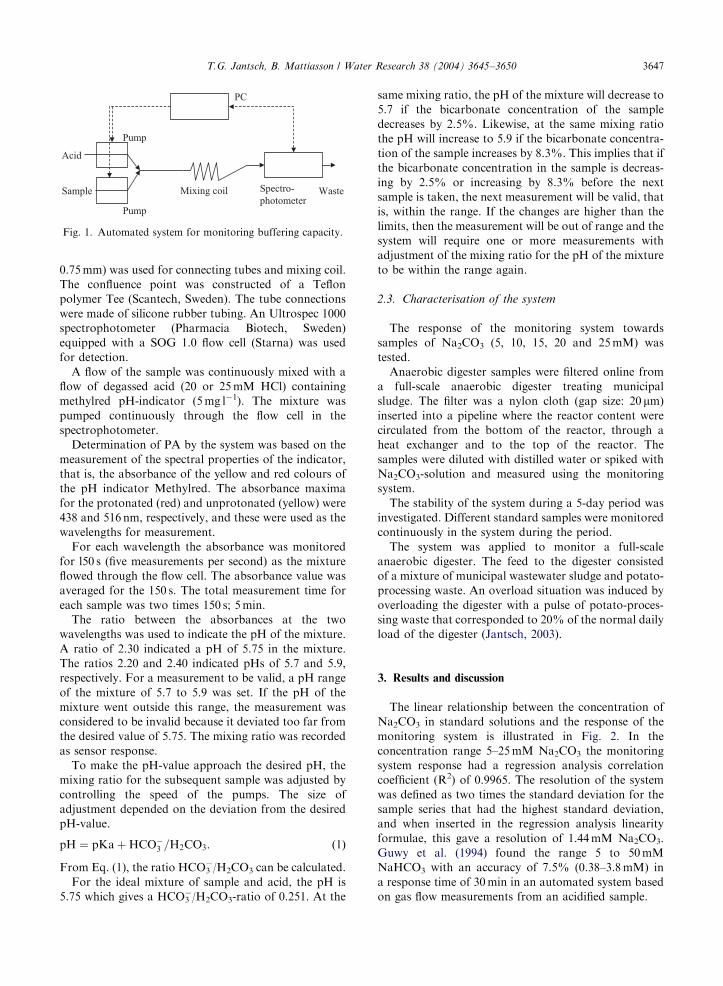
Fig. 3. Monitoring system response as a function of titrimetric
partial alkalinity of diluted and spiked digester effluent sample
with linear regression analysis (y ¼ 5:4068x � 1:0508;R2 ¼ 0:9863). X-error bars depict 95% confidence intervals
for titrimetric measurements in duplicates; y-error bars depict
95% confidence interval for system response in triplicates.
0
2
4
6
8
10
12
-1
Time [days]
Mo
nit
ori
ng
sys
tem
res
po
nse
10 15
20 25
30
30 1 2 4 5 6
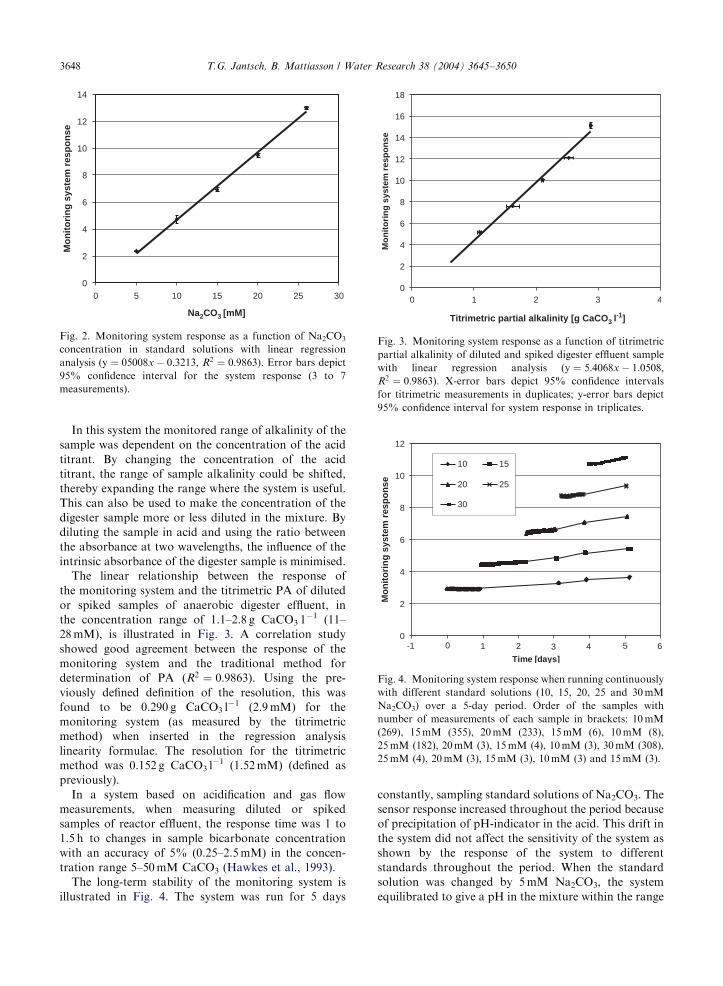
Fig. 4. Monitoring system response when running continuously
with different standard solutions (10, 15, 20, 25 and 30mM
Na2CO3) over a 5-day period. Order of the samples with
number of measurements of each sample in brackets: 10mM
(269), 15mM (355), 20mM (233), 15mM (6), 10mM (8),
25mM (182), 20mM (3), 15mM (4), 10mM (3), 30mM (308),
25mM (4), 20mM (3), 15mM (3), 10mM (3) and 15mM (3).
T.G. Jantsch, B. Mattiasson / Water Research 38 (2004) 3645–36503648
In this system the monitored range of alkalinity of the
sample was dependent on the concentration of the acid
titrant. By changing the concentration of the acid
titrant, the range of sample alkalinity could be shifted,
thereby expanding the range where the system is useful.
This can also be used to make the concentration of the
digester sample more or less diluted in the mixture. By
diluting the sample in acid and using the ratio between
the absorbance at two wavelengths, the influence of the
intrinsic absorbance of the digester sample is minimised.
The linear relationship between the response of
the monitoring system and the titrimetric PA of diluted
or spiked samples of anaerobic digester effluent, in
the concentration range of 1.1–2.8 g CaCO3 1�1 (11–
28mM), is illustrated in Fig. 3. A correlation study
showed good agreement between the response of the
monitoring system and the traditional method for
determination of PA (R2 ¼ 0:9863). Using the pre-
viously defined definition of the resolution, this was
found to be 0.290 g CaCO3 l�1 (2.9mM) for the
monitoring system (as measured by the titrimetric
method) when inserted in the regression analysis
linearity formulae. The resolution for the titrimetric
method was 0.152 g CaCO3 l�1 (1.52mM) (defined as
previously).
In a system based on acidification and gas flow
measurements, when measuring diluted or spiked
samples of reactor effluent, the response time was 1 to
1.5 h to changes in sample bicarbonate concentration
with an accuracy of 5% (0.25–2.5mM) in the concen-
tration range 5–50mM CaCO3 (Hawkes et al., 1993).
The long-term stability of the monitoring system is
illustrated in Fig. 4. The system was run for 5 days
constantly, sampling standard solutions of Na2CO3. The
sensor response increased throughout the period because
of precipitation of pH-indicator in the acid. This drift in
the system did not affect the sensitivity of the system as
shown by the response of the system to different
standards throughout the period. When the standard
solution was changed by 5mM Na2CO3, the system
equilibrated to give a pH in the mixture within the range
ARTICLE IN PRESS
4
5
6
7
8
9
10
11
12
13
15.10. 19:12 16.10. 19:12 17.10. 19:12 18.10. 19:12
Time (date, hours)
Mo
nit
orin
g s
yste
m r
esp
on
se
Overload
Calibration series
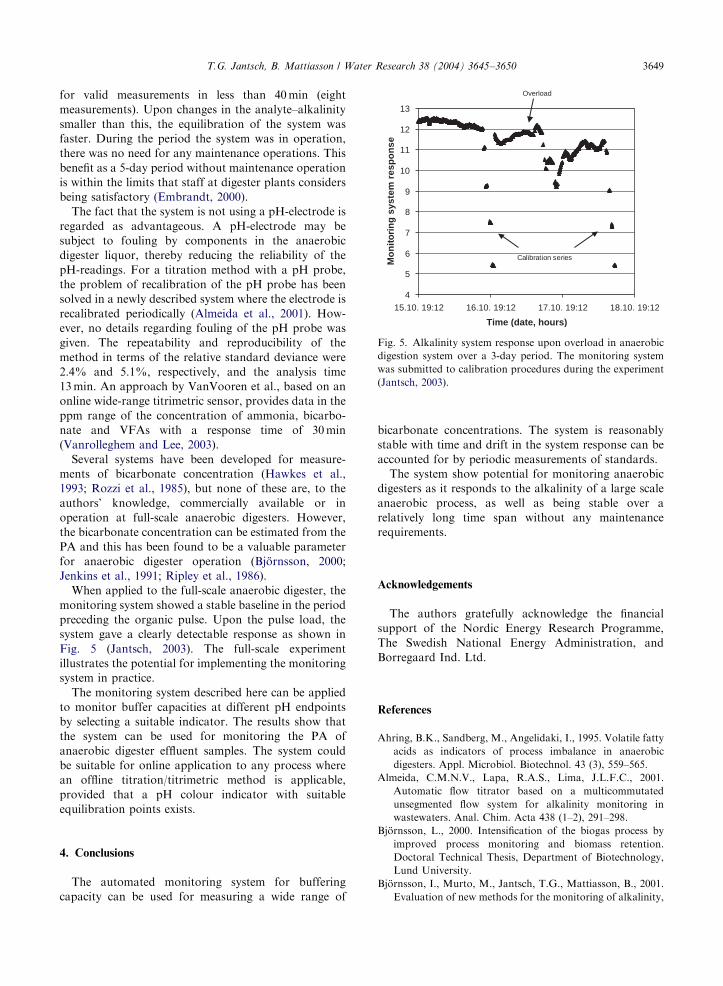
Fig. 5. Alkalinity system response upon overload in anaerobic
digestion system over a 3-day period. The monitoring system
was submitted to calibration procedures during the experiment
(Jantsch, 2003).
T.G. Jantsch, B. Mattiasson / Water Research 38 (2004) 3645–3650 3649
for valid measurements in less than 40min (eight
measurements). Upon changes in the analyte–alkalinity
smaller than this, the equilibration of the system was
faster. During the period the system was in operation,
there was no need for any maintenance operations. This
benefit as a 5-day period without maintenance operation
is within the limits that staff at digester plants considers
being satisfactory (Embrandt, 2000).
The fact that the system is not using a pH-electrode is
regarded as advantageous. A pH-electrode may be
subject to fouling by components in the anaerobic
digester liquor, thereby reducing the reliability of the
pH-readings. For a titration method with a pH probe,
the problem of recalibration of the pH probe has been
solved in a newly described system where the electrode is
recalibrated periodically (Almeida et al., 2001). How-
ever, no details regarding fouling of the pH probe was
given. The repeatability and reproducibility of the
method in terms of the relative standard deviance were
2.4% and 5.1%, respectively, and the analysis time
13min. An approach by VanVooren et al., based on an
online wide-range titrimetric sensor, provides data in the
ppm range of the concentration of ammonia, bicarbo-
nate and VFAs with a response time of 30min
(Vanrolleghem and Lee, 2003).
Several systems have been developed for measure-
ments of bicarbonate concentration (Hawkes et al.,
1993; Rozzi et al., 1985), but none of these are, to the
authors’ knowledge, commercially available or in
operation at full-scale anaerobic digesters. However,
the bicarbonate concentration can be estimated from the
PA and this has been found to be a valuable parameter
for anaerobic digester operation (Bjornsson, 2000;
Jenkins et al., 1991; Ripley et al., 1986).
When applied to the full-scale anaerobic digester, the
monitoring system showed a stable baseline in the period
preceding the organic pulse. Upon the pulse load, the
system gave a clearly detectable response as shown in
Fig. 5 (Jantsch, 2003). The full-scale experiment
illustrates the potential for implementing the monitoring
system in practice.
The monitoring system described here can be applied
to monitor buffer capacities at different pH endpoints
by selecting a suitable indicator. The results show that
the system can be used for monitoring the PA of
anaerobic digester effluent samples. The system could
be suitable for online application to any process where
an offline titration/titrimetric method is applicable,
provided that a pH colour indicator with suitable
equilibration points exists.
4. Conclusions
The automated monitoring system for buffering
capacity can be used for measuring a wide range of
bicarbonate concentrations. The system is reasonably
stable with time and drift in the system response can be
accounted for by periodic measurements of standards.
The system show potential for monitoring anaerobic
digesters as it responds to the alkalinity of a large scale
anaerobic process, as well as being stable over a
relatively long time span without any maintenance
requirements.
Acknowledgements
The authors gratefully acknowledge the financial
support of the Nordic Energy Research Programme,
The Swedish National Energy Administration, and
Borregaard Ind. Ltd.
References
Ahring, B.K., Sandberg, M., Angelidaki, I., 1995. Volatile fatty
acids as indicators of process imbalance in anaerobic
digesters. Appl. Microbiol. Biotechnol. 43 (3), 559–565.
Almeida, C.M.N.V., Lapa, R.A.S., Lima, J.L.F.C., 2001.
Automatic flow titrator based on a multicommutated
unsegmented flow system for alkalinity monitoring in
wastewaters. Anal. Chim. Acta 438 (1–2), 291–298.
Bjornsson, L., 2000. Intensification of the biogas process by
improved process monitoring and biomass retention.
Doctoral Technical Thesis, Department of Biotechnology,
Lund University.
Bjornsson, I., Murto, M., Jantsch, T.G., Mattiasson, B., 2001.
Evaluation of new methods for the monitoring of alkalinity,
ARTICLE IN PRESST.G. Jantsch, B. Mattiasson / Water Research 38 (2004) 3645–36503650
dissolved hydrogen and the microbial community in
anaerobic digestion. Water Res. 35 (12), 2833–2840.
Embrandt, K., 2000. Ellinge Wastewater Treatment Plant,
Ellinge, Sweden.
Guwy, A.J., Hawkes, D.L., Hawkes, F.R., Rozzi, A.G., 1994.
Characterization of a prototype industrial on-line analyzer
for bicarbonate/carbonate monitoring. Biotechnol. Bioeng.
44 (11), 1325–1330.
Hawkes, E.R., Guwy, A.J., Rozzi, A.G., Hawkes, D.L., 1993.
A new instrument for on-line measurement of bicarbonate
alkalinity. Water Res. 27 (1), 167–170.
Jantsch, T.G., 2003. Reactor applications and process monitor-
ing for improved anaerobic digestion. Doctoral Technical
Thesis, Department of Biotechnology, Lund University.
Jantsch, T.G., Mattiasson, B., 2003. A simple spectrophoto-
metric method based on pH-indicators for monitoring
partial and total alkalinity in anaerobic processes. Environ.
Technol. 24 (9), 1061–1067.
Jenkins, S.R., Morgan, J.M., Zhang, X., 1991. Measuring the
usable carbonate alkalinity of operating anaerobic digesters.
Res. J. Water Pollut. Con. F. 63 (1), 28–34.
Moosbrugger, R.E., Wentzel, M.C., Ekame, G.A., Marais,
G.R., 1993. A 5 pH point titration method for determining
the carbonate and SCFA weak acid/bases in anaerobic
systems. Water Sci. Technol. 28 (2), 237–245.
Powell, G.E., Archer, D.B., 1989. On-line titration method
for monitoring buffer capacity and total volatile fatty
acid levels in anaerobic digesters. Biotechnol. Bioeng. 33,
570–577.
Ripley, L.E., Boyle, W.C., Converse, J.C., 1986. Improved
alkalimetric monitoring for anaerobic digestion of
high-strength wastes. J. Water Pollut. Con. F. 58 (5),
406–411.
Rozzi, A., DiPinto, A.C., 1994. Start-up and operation of
anaerobic digesters with automatic bicarbonate control.
Biores. Technol. 48, 215–219.
Rozzi, A., DiPinto, A.C., Brunetti, A., 1985. Anaerobic process
control by bicarbonate monitoring. Environ. Technol. Lett.
6, 594–601.
Vanrolleghem, P.A., Lee, D.S., 2003. On-line monitoring
equipment for wastewater treatment processes: state of the
art. Water Sci. Technol. 47 (2), 1–34.


