6.C.a Clinical waste incineration
EMEP/EEA emission inventory guidebook 2009 1
Category Title
NFR: 6.C.a Clinical waste incineration
SNAP: 090207 Incineration of hospital wastes
ISIC:
Version Guidebook 2009
Coordinator Carlo Trozzi Contributing authors (including to earlier versions of this chapter) Jessica Sully and Mike Woodfield
6.C.a Clinical waste incineration
EMEP/EEA emission inventory guidebook 2009 2
Contents 1 Overview...................................................................................................................................3 2 Description of sources...............................................................................................................3
2.1 Process description ..............................................................................................................3 2.2 Techniques ..........................................................................................................................4 2.3 Emissions ............................................................................................................................5 2.4 Controls ...............................................................................................................................5
3 Methods.....................................................................................................................................6 3.1 Choice of method ................................................................................................................6 3.2 Tier 1 default approach........................................................................................................7 3.3 Tier 2 technology-specific approach ...................................................................................8 3.4 Tier 3 emission modelling and use of facility data............................................................16
4 Data quality.............................................................................................................................18 4.1 Completeness ....................................................................................................................18 4.2 Avoiding double counting with other sectors....................................................................18 4.3 Verification........................................................................................................................18 4.4 Developing a consistent time series and recalculation ......................................................18 4.5 Uncertainty assessment .....................................................................................................19 4.6 Inventory quality assurance/quality control QA/QC .........................................................19 4.7 Gridding ............................................................................................................................19 4.8 Reporting and documentation............................................................................................19
5 Glossary ..................................................................................................................................19 6 References...............................................................................................................................21 7 Point of enquiry.......................................................................................................................21
6.C.a Clinical waste incineration
EMEP/EEA emission inventory guidebook 2009 3
1 Overview This section includes the volume reduction, by combustion, of hospital wastes. Principally, this section covers the emissions from chimneys and ductwork because of the availability of measurement data.
In some cases hospital waste is combusted in municipal waste incinerators, or in ‘hazardous waste incinerators’ along with hazardous/chemical wastes from industrial processes. Users of this chapter should be aware of the potential for double counting of activity data with this chapter and the chapters about industrial and domestic/municipal wastes (chapters 6.C.b, Industrial waste incineration, and 6.C.c, Municipal waste incineration, respectively).
Care must be taken to prevent double counting of emissions reported here and in the relevant combustion chapter in 1.A. All the activities and emission factors with regard to the incineration of waste are explained in the waste incineration sector (6.C). If there is heat recovery in the incineration process, it is good practice to report the emission in the relevant combustion sector in the combustion section (1.A). If no heat recovery is applied, it is good practice to report the emission in the waste incineration sector (6.C).
When reporting in the combustion source categories, the emission factors provided in this chapter must be recalculated in terms of g/GJ (or equivalent energy units) by multiplying with the heating value of the waste. However, this heating value depends strongly on the kind of waste that is being burned. Therefore, the composition of the waste must be known in this case.
The relative proportion of emissions contributed by hospital waste incineration varies between pollutants. The process is likely to be a source (0.1-1 % of total European emissions) of some persistent organic pollutants (POPs), such as polychlorinated dibenzo-dioxins and polychlorinated dibenzo-furans (PCDD/Fs), hexachlorobenzenes (HCBs), trichloroethylene (TRI), tetrachloroethylene (PER), trichloroethane (TCE), polycyclic aromatic hydrocarbons (PAHs) and some heavy metals (HM) such as cadmium, mercury, etc. (European Topic Centre on Air Emissions (ETC/AEM)-CITEPA-RISOE 1997).
Emissions of compounds such as volatile organic compounds (VOCs), sulphur dioxide and nitrogen oxides (NOx, N2O) and particulate matter (PM) from hospital waste incineration are unlikely to contribute significantly to total emissions (< 0.1 %), while substances such as sulphur hexafluoride (SF6), hydrofluorocarbons (HFCs) or perfluorocarbons (PFCs) are generally not relevant (ETC/AEM-CITEPA-RISOE 1997).
2 Description of sources
2.1 Process description Hospital waste may be identified as ‘specific hospital waste’ and ‘other hospital waste’. Specific hospital waste includes human anatomic remains and organ parts, waste contaminated with bacteria, viruses and fungi, and larger quantities of blood.
Incineration of hospital wastes has been banned in some European countries. In countries where the process is allowed, for the most part incinerators are currently small facilities located on-site at hospitals. However, there is generally a move towards larger, centralised facilities.
6.C.a Clinical waste incineration
EMEP/EEA emission inventory guidebook 2009 4
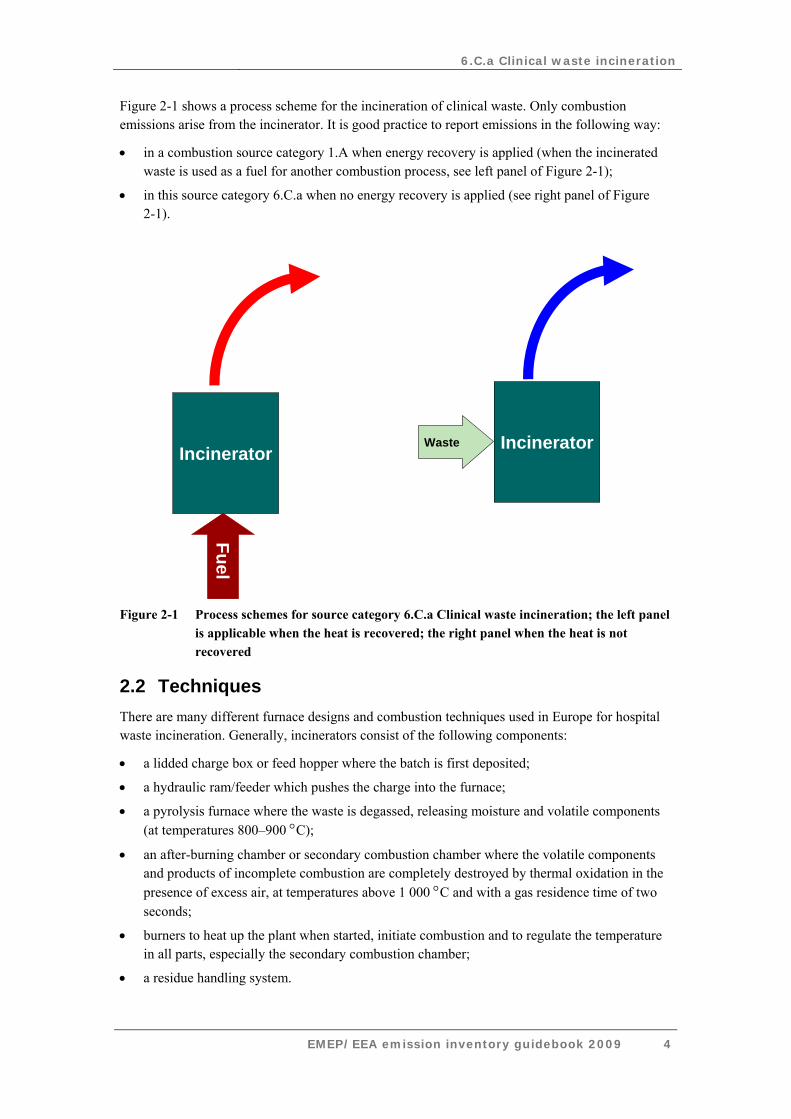
Figure 2-1 shows a process scheme for the incineration of clinical waste. Only combustion emissions arise from the incinerator. It is good practice to report emissions in the following way:
• in a combustion source category 1.A when energy recovery is applied (when the incinerated waste is used as a fuel for another combustion process, see left panel of Figure 2-1);
• in this source category 6.C.a when no energy recovery is applied (see right panel of Figure 2-1).
IncineratorWaste
Fuel
Incinerator
Figure 2-1 Process schemes for source category 6.C.a Clinical waste incineration; the left panel
is applicable when the heat is recovered; the right panel when the heat is not recovered
2.2 Techniques There are many different furnace designs and combustion techniques used in Europe for hospital waste incineration. Generally, incinerators consist of the following components:
• a lidded charge box or feed hopper where the batch is first deposited;
• a hydraulic ram/feeder which pushes the charge into the furnace;
• a pyrolysis furnace where the waste is degassed, releasing moisture and volatile components (at temperatures 800–900 °C);
• an after-burning chamber or secondary combustion chamber where the volatile components and products of incomplete combustion are completely destroyed by thermal oxidation in the presence of excess air, at temperatures above 1 000 °C and with a gas residence time of two seconds;
• burners to heat up the plant when started, initiate combustion and to regulate the temperature in all parts, especially the secondary combustion chamber;
• a residue handling system.
6.C.a Clinical waste incineration
EMEP/EEA emission inventory guidebook 2009 5
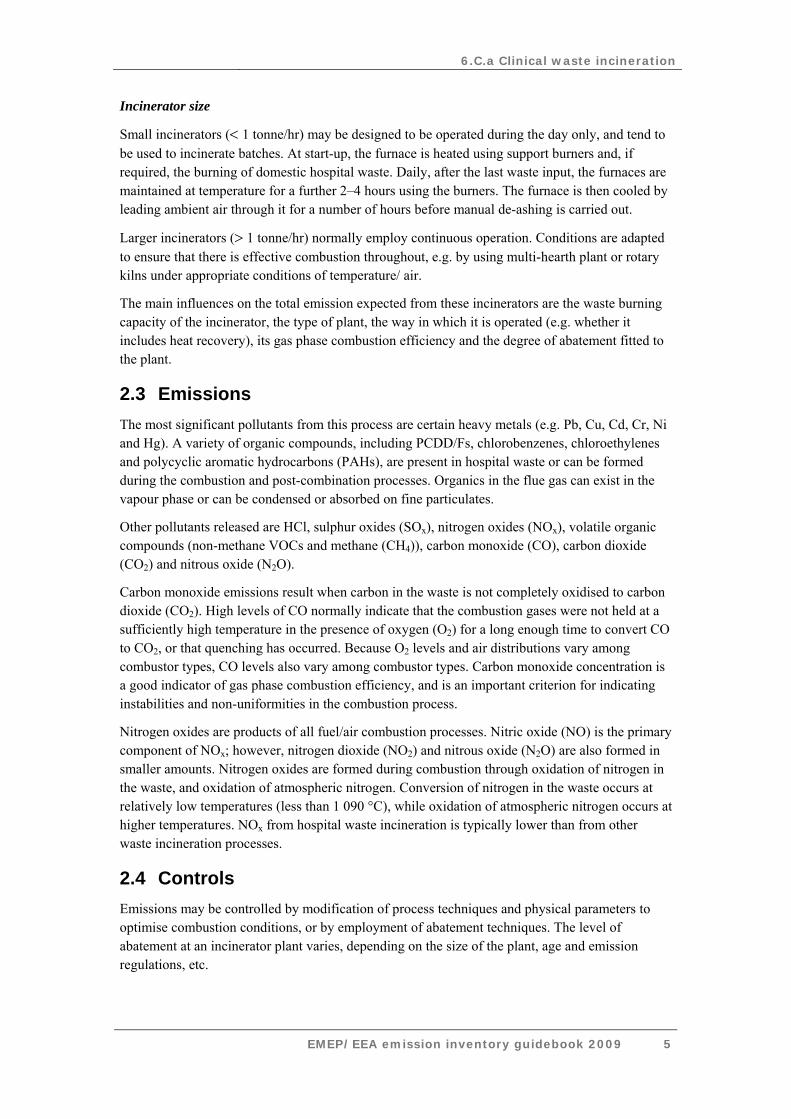
Incinerator size
Small incinerators (< 1 tonne/hr) may be designed to be operated during the day only, and tend to be used to incinerate batches. At start-up, the furnace is heated using support burners and, if required, the burning of domestic hospital waste. Daily, after the last waste input, the furnaces are maintained at temperature for a further 2–4 hours using the burners. The furnace is then cooled by leading ambient air through it for a number of hours before manual de-ashing is carried out.
Larger incinerators (> 1 tonne/hr) normally employ continuous operation. Conditions are adapted to ensure that there is effective combustion throughout, e.g. by using multi-hearth plant or rotary kilns under appropriate conditions of temperature/ air.
The main influences on the total emission expected from these incinerators are the waste burning capacity of the incinerator, the type of plant, the way in which it is operated (e.g. whether it includes heat recovery), its gas phase combustion efficiency and the degree of abatement fitted to the plant.
2.3 Emissions The most significant pollutants from this process are certain heavy metals (e.g. Pb, Cu, Cd, Cr, Ni and Hg). A variety of organic compounds, including PCDD/Fs, chlorobenzenes, chloroethylenes and polycyclic aromatic hydrocarbons (PAHs), are present in hospital waste or can be formed during the combustion and post-combination processes. Organics in the flue gas can exist in the vapour phase or can be condensed or absorbed on fine particulates.
Other pollutants released are HCl, sulphur oxides (SOx), nitrogen oxides (NOx), volatile organic compounds (non-methane VOCs and methane (CH4)), carbon monoxide (CO), carbon dioxide (CO2) and nitrous oxide (N2O).
Carbon monoxide emissions result when carbon in the waste is not completely oxidised to carbon dioxide (CO2). High levels of CO normally indicate that the combustion gases were not held at a sufficiently high temperature in the presence of oxygen (O2) for a long enough time to convert CO to CO2, or that quenching has occurred. Because O2 levels and air distributions vary among combustor types, CO levels also vary among combustor types. Carbon monoxide concentration is a good indicator of gas phase combustion efficiency, and is an important criterion for indicating instabilities and non-uniformities in the combustion process.
Nitrogen oxides are products of all fuel/air combustion processes. Nitric oxide (NO) is the primary component of NOx; however, nitrogen dioxide (NO2) and nitrous oxide (N2O) are also formed in smaller amounts. Nitrogen oxides are formed during combustion through oxidation of nitrogen in the waste, and oxidation of atmospheric nitrogen. Conversion of nitrogen in the waste occurs at relatively low temperatures (less than 1 090 °C), while oxidation of atmospheric nitrogen occurs at higher temperatures. NOx from hospital waste incineration is typically lower than from other waste incineration processes.
2.4 Controls Emissions may be controlled by modification of process techniques and physical parameters to optimise combustion conditions, or by employment of abatement techniques. The level of abatement at an incinerator plant varies, depending on the size of the plant, age and emission regulations, etc.
6.C.a Clinical waste incineration
EMEP/EEA emission inventory guidebook 2009 6
Generally, there are three types of plant (LUA, 1997):
• type 1 plants are small on-site plants without abatement technology;
• type 2 plants are larger on-site facilities equipped with de-dusting systems;
• type 3 plants are incinerators which comply with the hazardous waste directive.
There are also a large number of facilities, which are intermediate between types 2 and 3, with varying levels of abatement.
Mainly for economic reasons, in recent years there has been a move towards larger, modern plant. Such plant includes emission abatement equipment, which aim to ensure compliance with emission regulations, addressing the three main environmental impacts of waste incineration/ products of incomplete combustion: acid gas, heavy metal and dioxin emissions. Typical approaches used include:
• good combustion practice — optimal conditions of time/ temperature/ turbulence/ air to ensure complete oxidation of products of incomplete combustion;
• wet scrubbers (acid gas removal);
• fabric filters (particle control);
• electrostatic precipitators (particle control);
• semi-dry scrubbers/spray absorber systems (acid gas removal);
• dry sorbent injection systems (acid gas removal);
• adsorption using activated carbon/activated lignite coke (PCDD/F and mercury removal).
These control systems are described in subsection 3.2 of the present chapter. These systems are usually needed in combination.
3 Methods
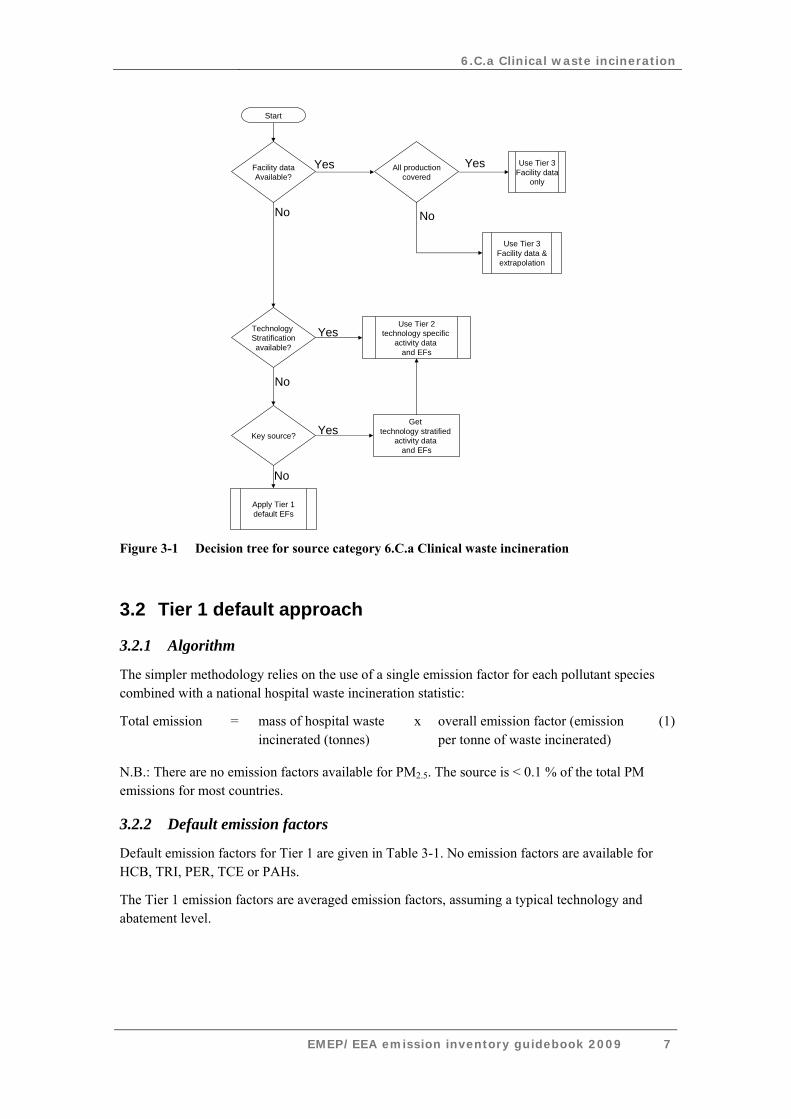
3.1 Choice of method Figure 3-1 presents the procedure to select the methods for estimating emissions from incineration of clinical waste. The basic ideas behind this procedure are:
• if detailed information is available, use it;
• if the source category is a key category, a Tier 2 or better method must be applied and detailed input data must be collected. The decision tree directs the user in such cases to the Tier 2 method, since it is expected that it is more easy to obtain the necessary input data for this approach than to collect facility level data needed for a Tier 3 estimate;
• the alternative of applying a Tier 3 method, using detailed process modelling, is not explicitly included in this decision tree. However, detailed modelling will always be done at facility level and results of such modelling could be seen as ‘facility data’ in the decision tree.
6.C.a Clinical waste incineration
EMEP/EEA emission inventory guidebook 2009 7
Start
Facility dataAvailable?
All productioncovered
Use Tier 3Facility data
only
Technology Stratificationavailable?
Use Tier 2technology specific
activity data and EFs
Key source?
Get technology stratified
activity data and EFs
Apply Tier 1default EFs
Yes Yes
Yes
Yes
No
No
No
No
Use Tier 3Facility data &extrapolation
Figure 3-1 Decision tree for source category 6.C.a Clinical waste incineration
3.2 Tier 1 default approach
3.2.1 Algorithm
The simpler methodology relies on the use of a single emission factor for each pollutant species combined with a national hospital waste incineration statistic:
Total emission = mass of hospital waste incinerated (tonnes)
x overall emission factor (emission per tonne of waste incinerated)
(1)
N.B.: There are no emission factors available for PM2.5. The source is < 0.1 % of the total PM emissions for most countries.
3.2.2 Default emission factors
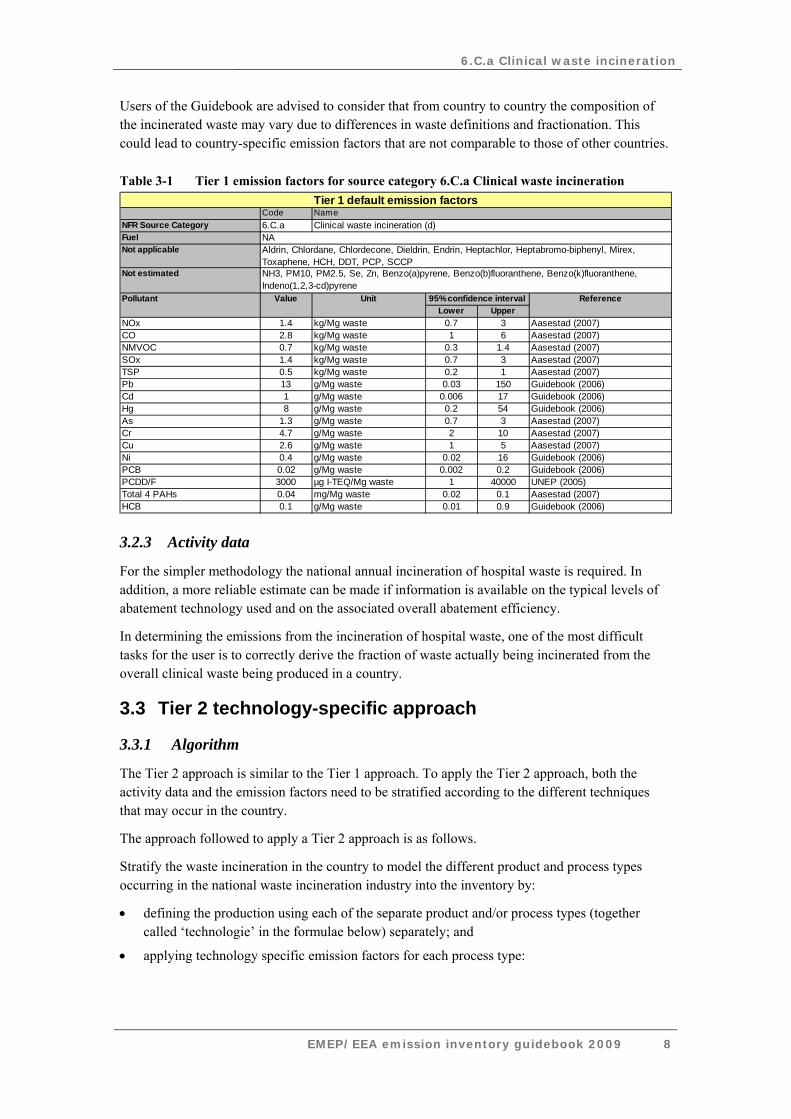
Default emission factors for Tier 1 are given in Table 3-1. No emission factors are available for HCB, TRI, PER, TCE or PAHs.
The Tier 1 emission factors are averaged emission factors, assuming a typical technology and abatement level.
6.C.a Clinical waste incineration
EMEP/EEA emission inventory guidebook 2009 8
Users of the Guidebook are advised to consider that from country to country the composition of the incinerated waste may vary due to differences in waste definitions and fractionation. This could lead to country-specific emission factors that are not comparable to those of other countries.
Table 3-1 Tier 1 emission factors for source category 6.C.a Clinical waste incineration
CodeNFR Source Category 6.C.aFuelNot applicable
Not estimated
Lower UpperNOx 1.4 kg/Mg waste 0.7 3 Aasestad (2007)CO 2.8 kg/Mg waste 1 6 Aasestad (2007)NMVOC 0.7 kg/Mg waste 0.3 1.4 Aasestad (2007)SOx 1.4 kg/Mg waste 0.7 3 Aasestad (2007)TSP 0.5 kg/Mg waste 0.2 1 Aasestad (2007)Pb 13 g/Mg waste 0.03 150 Guidebook (2006)Cd 1 g/Mg waste 0.006 17 Guidebook (2006)Hg 8 g/Mg waste 0.2 54 Guidebook (2006)As 1.3 g/Mg waste 0.7 3 Aasestad (2007)Cr 4.7 g/Mg waste 2 10 Aasestad (2007)Cu 2.6 g/Mg waste 1 5 Aasestad (2007)Ni 0.4 g/Mg waste 0.02 16 Guidebook (2006)PCB 0.02 g/Mg waste 0.002 0.2 Guidebook (2006)PCDD/F 3000 µg I-TEQ/Mg waste 1 40000 UNEP (2005)Total 4 PAHs 0.04 mg/Mg waste 0.02 0.1 Aasestad (2007)HCB 0.1 g/Mg waste 0.01 0.9 Guidebook (2006)
Reference
NA
Tier 1 default emission factorsName
Pollutant
Clinical waste incineration (d)
Aldrin, Chlordane, Chlordecone, Dieldrin, Endrin, Heptachlor, Heptabromo-biphenyl, Mirex, Toxaphene, HCH, DDT, PCP, SCCPNH3, PM10, PM2.5, Se, Zn, Benzo(a)pyrene, Benzo(b)fluoranthene, Benzo(k)fluoranthene, Indeno(1,2,3-cd)pyrene
Value Unit 95% confidence interval
3.2.3 Activity data
For the simpler methodology the national annual incineration of hospital waste is required. In addition, a more reliable estimate can be made if information is available on the typical levels of abatement technology used and on the associated overall abatement efficiency.
In determining the emissions from the incineration of hospital waste, one of the most difficult tasks for the user is to correctly derive the fraction of waste actually being incinerated from the overall clinical waste being produced in a country.
3.3 Tier 2 technology-specific approach
3.3.1 Algorithm
The Tier 2 approach is similar to the Tier 1 approach. To apply the Tier 2 approach, both the activity data and the emission factors need to be stratified according to the different techniques that may occur in the country.
The approach followed to apply a Tier 2 approach is as follows.
Stratify the waste incineration in the country to model the different product and process types occurring in the national waste incineration industry into the inventory by:
• defining the production using each of the separate product and/or process types (together called ‘technologie’ in the formulae below) separately; and
• applying technology specific emission factors for each process type:
6.C.a Clinical waste incineration
EMEP/EEA emission inventory guidebook 2009 9
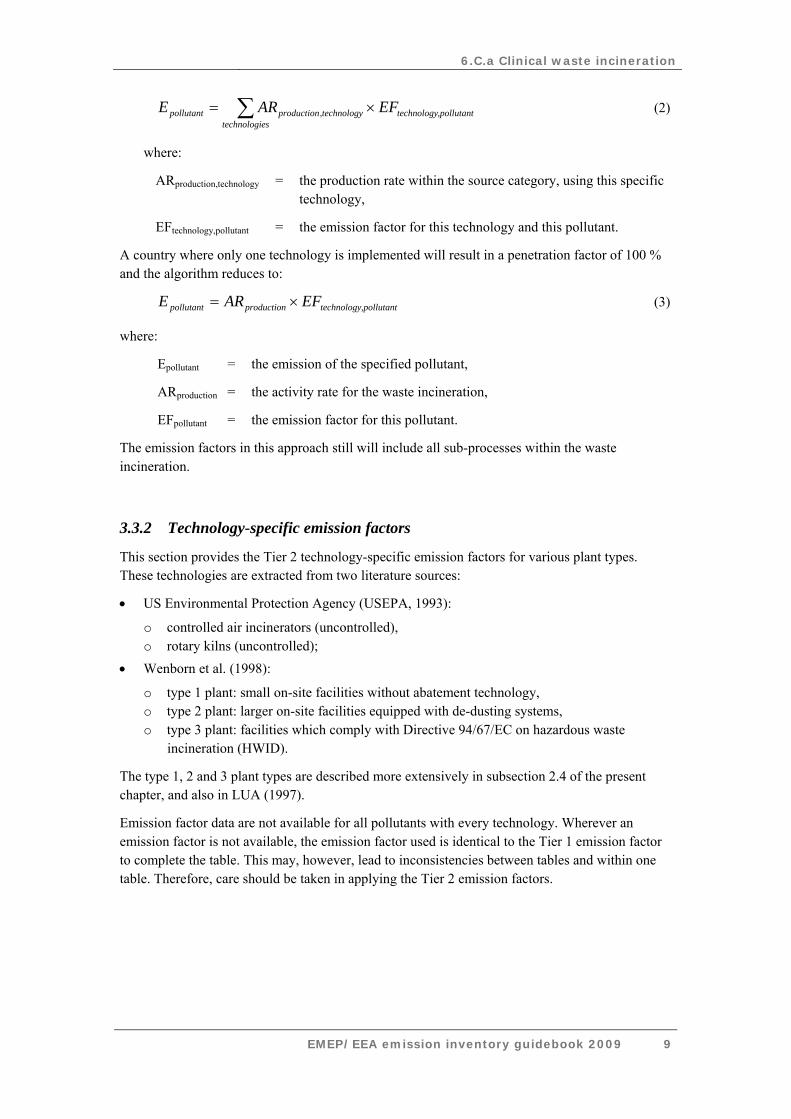
∑ ×=estechnologi
,pollutanttechnologytechnologyproductionpollutant EFARE , (2)
where:
ARproduction,technology = the production rate within the source category, using this specific technology,
EFtechnology,pollutant = the emission factor for this technology and this pollutant.
A country where only one technology is implemented will result in a penetration factor of 100 % and the algorithm reduces to:
,pollutanttechnologyproductionpollutant EFARE ×= (3)
where:
Epollutant = the emission of the specified pollutant,
ARproduction = the activity rate for the waste incineration,
EFpollutant = the emission factor for this pollutant.
The emission factors in this approach still will include all sub-processes within the waste incineration.
3.3.2 Technology-specific emission factors
This section provides the Tier 2 technology-specific emission factors for various plant types. These technologies are extracted from two literature sources:
• US Environmental Protection Agency (USEPA, 1993):
o controlled air incinerators (uncontrolled), o rotary kilns (uncontrolled);
• Wenborn et al. (1998):
o type 1 plant: small on-site facilities without abatement technology, o type 2 plant: larger on-site facilities equipped with de-dusting systems, o type 3 plant: facilities which comply with Directive 94/67/EC on hazardous waste
incineration (HWID).
The type 1, 2 and 3 plant types are described more extensively in subsection 2.4 of the present chapter, and also in LUA (1997).
Emission factor data are not available for all pollutants with every technology. Wherever an emission factor is not available, the emission factor used is identical to the Tier 1 emission factor to complete the table. This may, however, lead to inconsistencies between tables and within one table. Therefore, care should be taken in applying the Tier 2 emission factors.
6.C.a Clinical waste incineration
EMEP/EEA emission inventory guidebook 2009 10
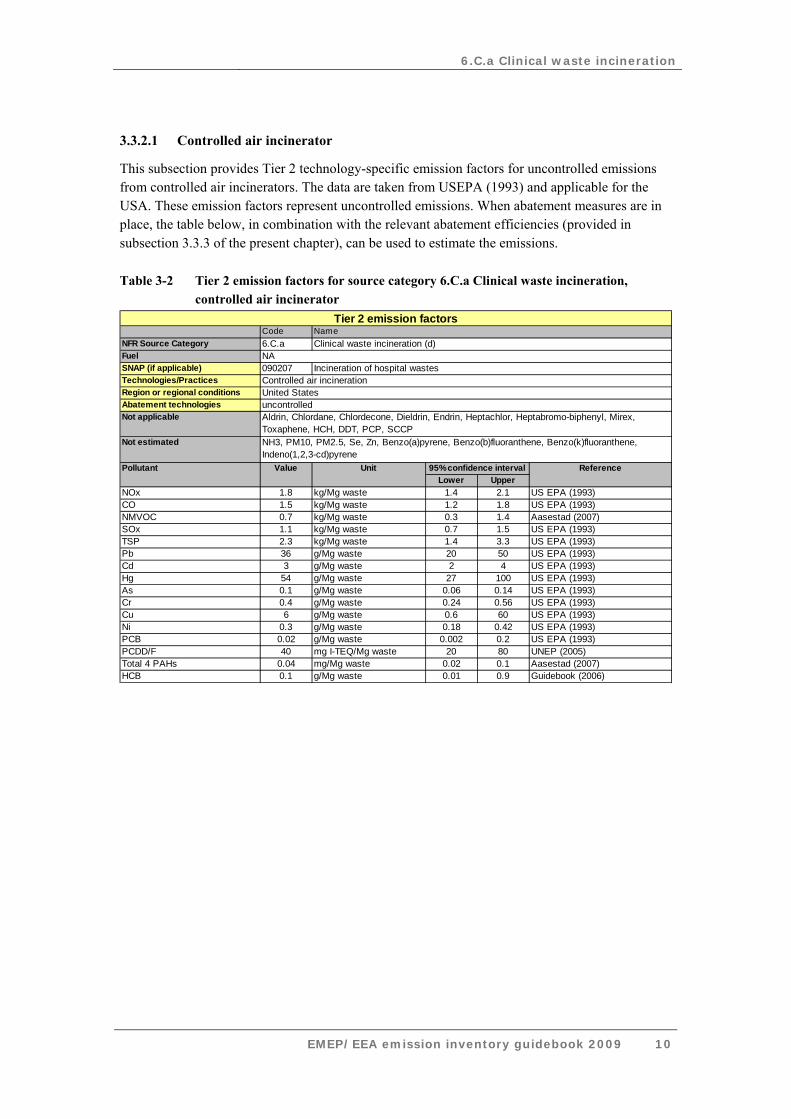
3.3.2.1 Controlled air incinerator
This subsection provides Tier 2 technology-specific emission factors for uncontrolled emissions from controlled air incinerators. The data are taken from USEPA (1993) and applicable for the USA. These emission factors represent uncontrolled emissions. When abatement measures are in place, the table below, in combination with the relevant abatement efficiencies (provided in subsection 3.3.3 of the present chapter), can be used to estimate the emissions.
Table 3-2 Tier 2 emission factors for source category 6.C.a Clinical waste incineration, controlled air incinerator
CodeNFR Source Category 6.C.aFuelSNAP (if applicable) 090207Technologies/PracticesRegion or regional conditionsAbatement technologiesNot applicable
Not estimated
Lower UpperNOx 1.8 kg/Mg waste 1.4 2.1 US EPA (1993)CO 1.5 kg/Mg waste 1.2 1.8 US EPA (1993)NMVOC 0.7 kg/Mg waste 0.3 1.4 Aasestad (2007)SOx 1.1 kg/Mg waste 0.7 1.5 US EPA (1993)TSP 2.3 kg/Mg waste 1.4 3.3 US EPA (1993)Pb 36 g/Mg waste 20 50 US EPA (1993)Cd 3 g/Mg waste 2 4 US EPA (1993)Hg 54 g/Mg waste 27 100 US EPA (1993)As 0.1 g/Mg waste 0.06 0.14 US EPA (1993)Cr 0.4 g/Mg waste 0.24 0.56 US EPA (1993)Cu 6 g/Mg waste 0.6 60 US EPA (1993)Ni 0.3 g/Mg waste 0.18 0.42 US EPA (1993)PCB 0.02 g/Mg waste 0.002 0.2 US EPA (1993)PCDD/F 40 mg I-TEQ/Mg waste 20 80 UNEP (2005)Total 4 PAHs 0.04 mg/Mg waste 0.02 0.1 Aasestad (2007)HCB 0.1 g/Mg waste 0.01 0.9 Guidebook (2006)
Tier 2 emission factorsNameClinical waste incineration (d)
NAIncineration of hospital wastes
Controlled air incinerationUnited StatesuncontrolledAldrin, Chlordane, Chlordecone, Dieldrin, Endrin, Heptachlor, Heptabromo-biphenyl, Mirex, Toxaphene, HCH, DDT, PCP, SCCPNH3, PM10, PM2.5, Se, Zn, Benzo(a)pyrene, Benzo(b)fluoranthene, Benzo(k)fluoranthene, Indeno(1,2,3-cd)pyrene
Pollutant Value Unit 95% confidence interval Reference
6.C.a Clinical waste incineration
EMEP/EEA emission inventory guidebook 2009 11
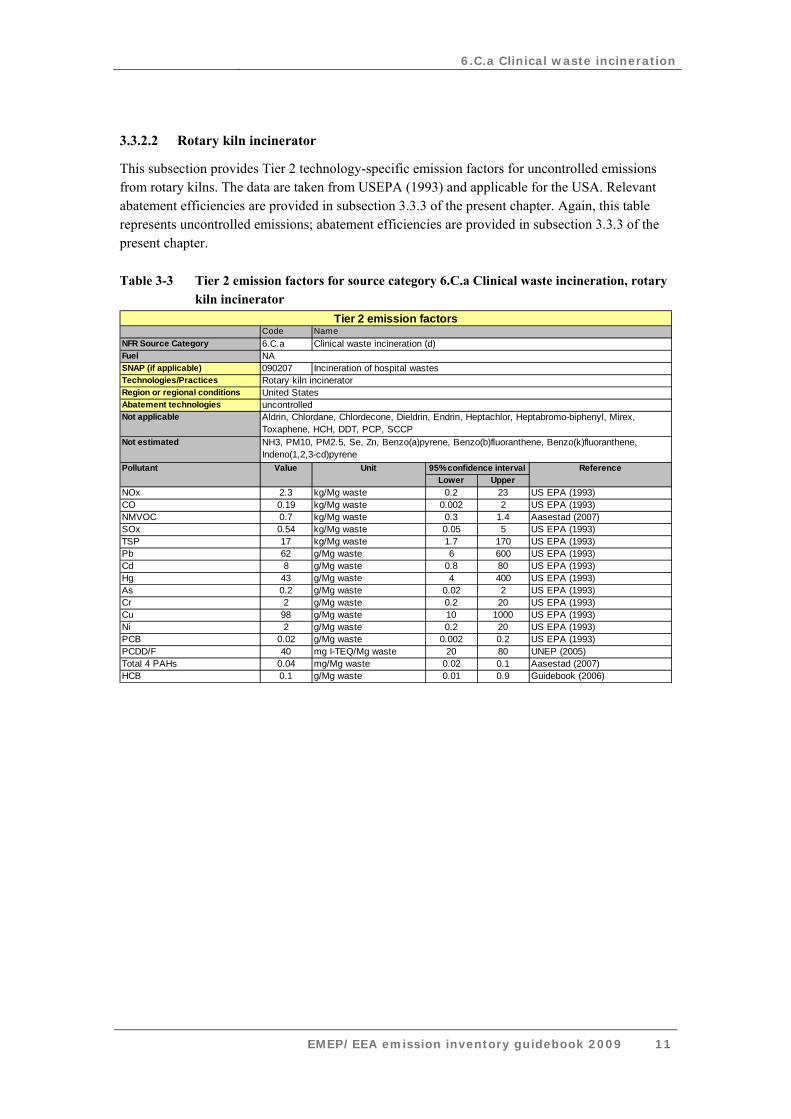
3.3.2.2 Rotary kiln incinerator
This subsection provides Tier 2 technology-specific emission factors for uncontrolled emissions from rotary kilns. The data are taken from USEPA (1993) and applicable for the USA. Relevant abatement efficiencies are provided in subsection 3.3.3 of the present chapter. Again, this table represents uncontrolled emissions; abatement efficiencies are provided in subsection 3.3.3 of the present chapter.
Table 3-3 Tier 2 emission factors for source category 6.C.a Clinical waste incineration, rotary kiln incinerator
CodeNFR Source Category 6.C.aFuelSNAP (if applicable) 090207Technologies/PracticesRegion or regional conditionsAbatement technologiesNot applicable
Not estimated
Lower UpperNOx 2.3 kg/Mg waste 0.2 23 US EPA (1993)CO 0.19 kg/Mg waste 0.002 2 US EPA (1993)NMVOC 0.7 kg/Mg waste 0.3 1.4 Aasestad (2007)SOx 0.54 kg/Mg waste 0.05 5 US EPA (1993)TSP 17 kg/Mg waste 1.7 170 US EPA (1993)Pb 62 g/Mg waste 6 600 US EPA (1993)Cd 8 g/Mg waste 0.8 80 US EPA (1993)Hg 43 g/Mg waste 4 400 US EPA (1993)As 0.2 g/Mg waste 0.02 2 US EPA (1993)Cr 2 g/Mg waste 0.2 20 US EPA (1993)Cu 98 g/Mg waste 10 1000 US EPA (1993)Ni 2 g/Mg waste 0.2 20 US EPA (1993)PCB 0.02 g/Mg waste 0.002 0.2 US EPA (1993)PCDD/F 40 mg I-TEQ/Mg waste 20 80 UNEP (2005)Total 4 PAHs 0.04 mg/Mg waste 0.02 0.1 Aasestad (2007)HCB 0.1 g/Mg waste 0.01 0.9 Guidebook (2006)
Tier 2 emission factorsNameClinical waste incineration (d)
NAIncineration of hospital wastes
Rotary kiln incineratorUnited StatesuncontrolledAldrin, Chlordane, Chlordecone, Dieldrin, Endrin, Heptachlor, Heptabromo-biphenyl, Mirex, Toxaphene, HCH, DDT, PCP, SCCPNH3, PM10, PM2.5, Se, Zn, Benzo(a)pyrene, Benzo(b)fluoranthene, Benzo(k)fluoranthene, Indeno(1,2,3-cd)pyrene
Pollutant Value Unit 95% confidence interval Reference
6.C.a Clinical waste incineration
EMEP/EEA emission inventory guidebook 2009 12
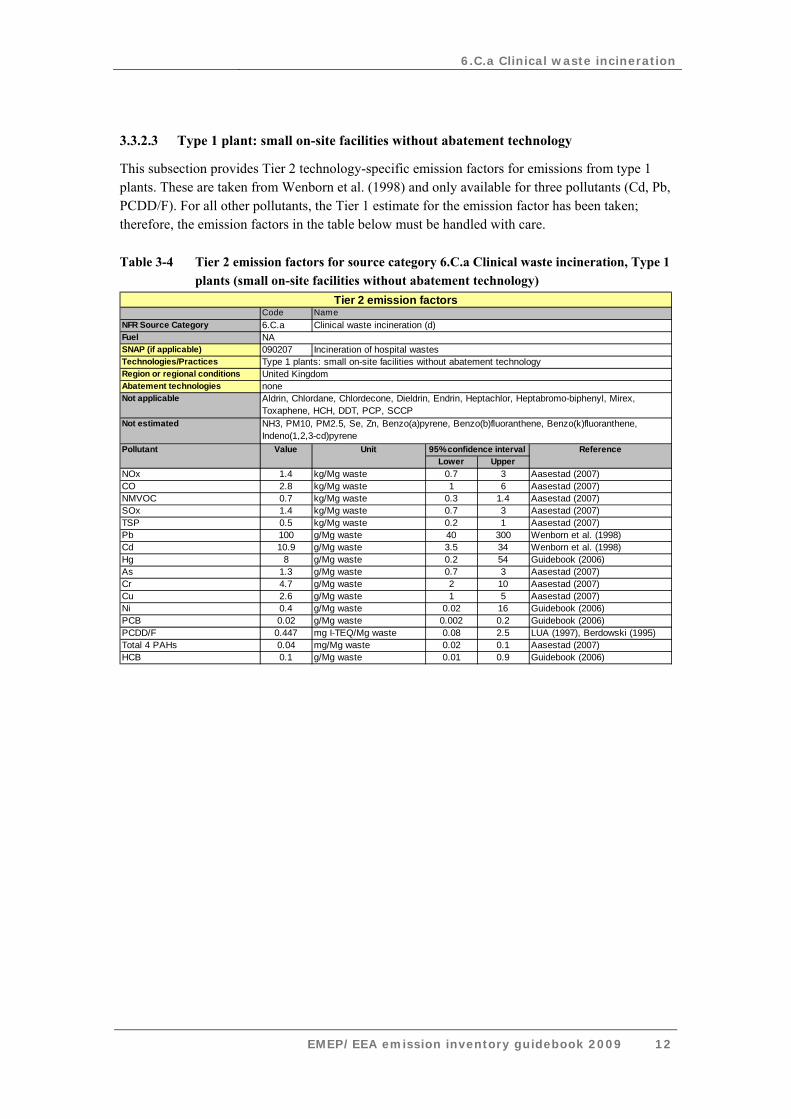
3.3.2.3 Type 1 plant: small on-site facilities without abatement technology
This subsection provides Tier 2 technology-specific emission factors for emissions from type 1 plants. These are taken from Wenborn et al. (1998) and only available for three pollutants (Cd, Pb, PCDD/F). For all other pollutants, the Tier 1 estimate for the emission factor has been taken; therefore, the emission factors in the table below must be handled with care.
Table 3-4 Tier 2 emission factors for source category 6.C.a Clinical waste incineration, Type 1 plants (small on-site facilities without abatement technology)
CodeNFR Source Category 6.C.aFuelSNAP (if applicable) 090207Technologies/PracticesRegion or regional conditionsAbatement technologiesNot applicable
Not estimated
Lower UpperNOx 1.4 kg/Mg waste 0.7 3 Aasestad (2007)CO 2.8 kg/Mg waste 1 6 Aasestad (2007)NMVOC 0.7 kg/Mg waste 0.3 1.4 Aasestad (2007)SOx 1.4 kg/Mg waste 0.7 3 Aasestad (2007)TSP 0.5 kg/Mg waste 0.2 1 Aasestad (2007)Pb 100 g/Mg waste 40 300 Wenborn et al. (1998)Cd 10.9 g/Mg waste 3.5 34 Wenborn et al. (1998)Hg 8 g/Mg waste 0.2 54 Guidebook (2006)As 1.3 g/Mg waste 0.7 3 Aasestad (2007)Cr 4.7 g/Mg waste 2 10 Aasestad (2007)Cu 2.6 g/Mg waste 1 5 Aasestad (2007)Ni 0.4 g/Mg waste 0.02 16 Guidebook (2006)PCB 0.02 g/Mg waste 0.002 0.2 Guidebook (2006)PCDD/F 0.447 mg I-TEQ/Mg waste 0.08 2.5 LUA (1997), Berdowski (1995)Total 4 PAHs 0.04 mg/Mg waste 0.02 0.1 Aasestad (2007)HCB 0.1 g/Mg waste 0.01 0.9 Guidebook (2006)
noneAldrin, Chlordane, Chlordecone, Dieldrin, Endrin, Heptachlor, Heptabromo-biphenyl, Mirex, Toxaphene, HCH, DDT, PCP, SCCPNH3, PM10, PM2.5, Se, Zn, Benzo(a)pyrene, Benzo(b)fluoranthene, Benzo(k)fluoranthene, Indeno(1,2,3-cd)pyrene
Pollutant Value Unit 95% confidence interval Reference
NAIncineration of hospital wastes
Type 1 plants: small on-site facilities without abatement technologyUnited Kingdom
Tier 2 emission factorsNameClinical waste incineration (d)
6.C.a Clinical waste incineration
EMEP/EEA emission inventory guidebook 2009 13
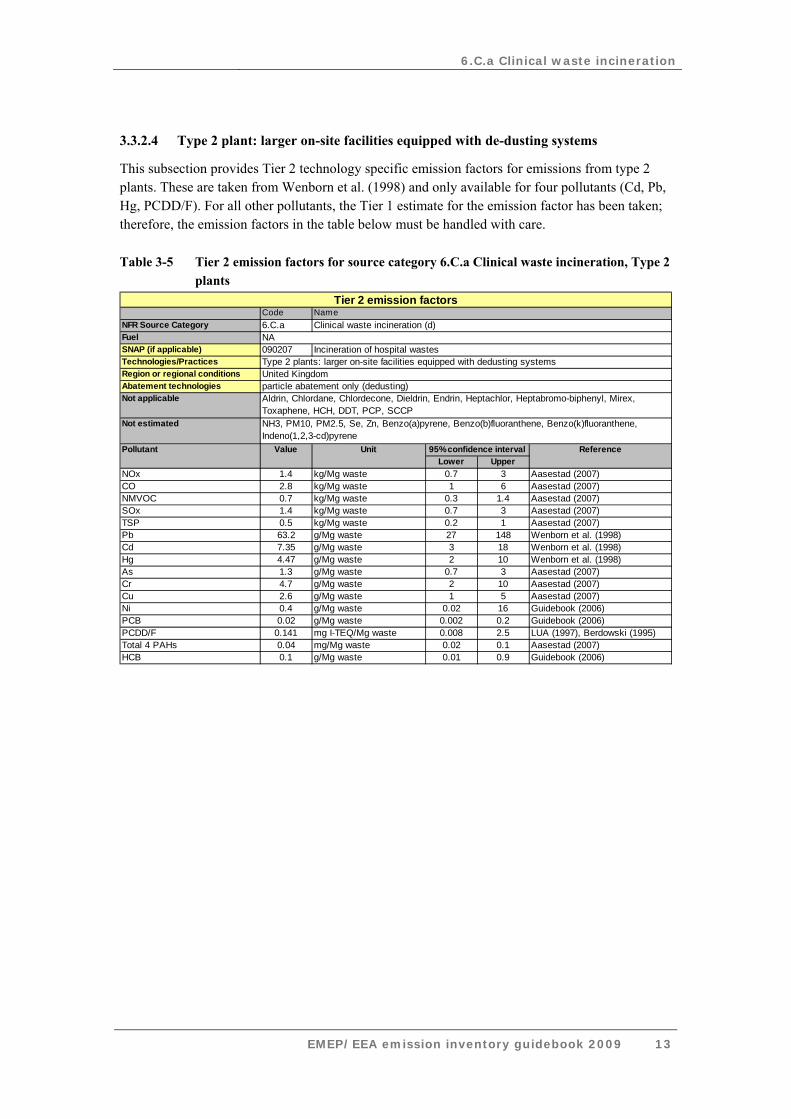
3.3.2.4 Type 2 plant: larger on-site facilities equipped with de-dusting systems
This subsection provides Tier 2 technology specific emission factors for emissions from type 2 plants. These are taken from Wenborn et al. (1998) and only available for four pollutants (Cd, Pb, Hg, PCDD/F). For all other pollutants, the Tier 1 estimate for the emission factor has been taken; therefore, the emission factors in the table below must be handled with care.
Table 3-5 Tier 2 emission factors for source category 6.C.a Clinical waste incineration, Type 2 plants
CodeNFR Source Category 6.C.aFuelSNAP (if applicable) 090207Technologies/PracticesRegion or regional conditionsAbatement technologiesNot applicable
Not estimated
Lower UpperNOx 1.4 kg/Mg waste 0.7 3 Aasestad (2007)CO 2.8 kg/Mg waste 1 6 Aasestad (2007)NMVOC 0.7 kg/Mg waste 0.3 1.4 Aasestad (2007)SOx 1.4 kg/Mg waste 0.7 3 Aasestad (2007)TSP 0.5 kg/Mg waste 0.2 1 Aasestad (2007)Pb 63.2 g/Mg waste 27 148 Wenborn et al. (1998)Cd 7.35 g/Mg waste 3 18 Wenborn et al. (1998)Hg 4.47 g/Mg waste 2 10 Wenborn et al. (1998)As 1.3 g/Mg waste 0.7 3 Aasestad (2007)Cr 4.7 g/Mg waste 2 10 Aasestad (2007)Cu 2.6 g/Mg waste 1 5 Aasestad (2007)Ni 0.4 g/Mg waste 0.02 16 Guidebook (2006)PCB 0.02 g/Mg waste 0.002 0.2 Guidebook (2006)PCDD/F 0.141 mg I-TEQ/Mg waste 0.008 2.5 LUA (1997), Berdowski (1995)Total 4 PAHs 0.04 mg/Mg waste 0.02 0.1 Aasestad (2007)HCB 0.1 g/Mg waste 0.01 0.9 Guidebook (2006)
particle abatement only (dedusting)Aldrin, Chlordane, Chlordecone, Dieldrin, Endrin, Heptachlor, Heptabromo-biphenyl, Mirex, Toxaphene, HCH, DDT, PCP, SCCPNH3, PM10, PM2.5, Se, Zn, Benzo(a)pyrene, Benzo(b)fluoranthene, Benzo(k)fluoranthene, Indeno(1,2,3-cd)pyrene
Pollutant Value Unit 95% confidence interval Reference
NAIncineration of hospital wastes
Type 2 plants: larger on-site facilities equipped with dedusting systemsUnited Kingdom
Tier 2 emission factorsNameClinical waste incineration (d)
6.C.a Clinical waste incineration
EMEP/EEA emission inventory guidebook 2009 14
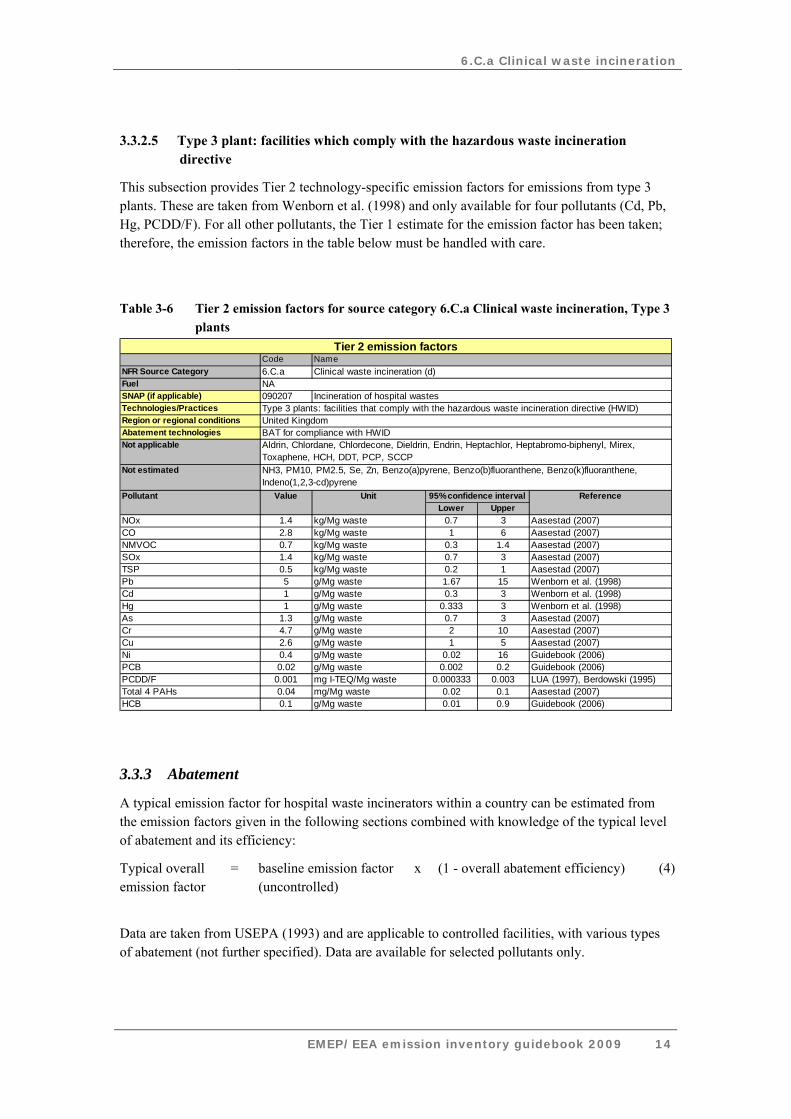
3.3.2.5 Type 3 plant: facilities which comply with the hazardous waste incineration directive
This subsection provides Tier 2 technology-specific emission factors for emissions from type 3 plants. These are taken from Wenborn et al. (1998) and only available for four pollutants (Cd, Pb, Hg, PCDD/F). For all other pollutants, the Tier 1 estimate for the emission factor has been taken; therefore, the emission factors in the table below must be handled with care.
Table 3-6 Tier 2 emission factors for source category 6.C.a Clinical waste incineration, Type 3 plants
CodeNFR Source Category 6.C.aFuelSNAP (if applicable) 090207Technologies/PracticesRegion or regional conditionsAbatement technologiesNot applicable
Not estimated
Lower UpperNOx 1.4 kg/Mg waste 0.7 3 Aasestad (2007)CO 2.8 kg/Mg waste 1 6 Aasestad (2007)NMVOC 0.7 kg/Mg waste 0.3 1.4 Aasestad (2007)SOx 1.4 kg/Mg waste 0.7 3 Aasestad (2007)TSP 0.5 kg/Mg waste 0.2 1 Aasestad (2007)Pb 5 g/Mg waste 1.67 15 Wenborn et al. (1998)Cd 1 g/Mg waste 0.3 3 Wenborn et al. (1998)Hg 1 g/Mg waste 0.333 3 Wenborn et al. (1998)As 1.3 g/Mg waste 0.7 3 Aasestad (2007)Cr 4.7 g/Mg waste 2 10 Aasestad (2007)Cu 2.6 g/Mg waste 1 5 Aasestad (2007)Ni 0.4 g/Mg waste 0.02 16 Guidebook (2006)PCB 0.02 g/Mg waste 0.002 0.2 Guidebook (2006)PCDD/F 0.001 mg I-TEQ/Mg waste 0.000333 0.003 LUA (1997), Berdowski (1995)Total 4 PAHs 0.04 mg/Mg waste 0.02 0.1 Aasestad (2007)HCB 0.1 g/Mg waste 0.01 0.9 Guidebook (2006)
BAT for compliance with HWIDAldrin, Chlordane, Chlordecone, Dieldrin, Endrin, Heptachlor, Heptabromo-biphenyl, Mirex, Toxaphene, HCH, DDT, PCP, SCCPNH3, PM10, PM2.5, Se, Zn, Benzo(a)pyrene, Benzo(b)fluoranthene, Benzo(k)fluoranthene, Indeno(1,2,3-cd)pyrene
Pollutant Value Unit 95% confidence interval Reference
NAIncineration of hospital wastes
Type 3 plants: facilities that comply with the hazardous waste incineration directive (HWID) United Kingdom
Tier 2 emission factorsNameClinical waste incineration (d)
3.3.3 Abatement
A typical emission factor for hospital waste incinerators within a country can be estimated from the emission factors given in the following sections combined with knowledge of the typical level of abatement and its efficiency:
Typical overall emission factor
= baseline emission factor (uncontrolled)
x (1 - overall abatement efficiency) (4)
Data are taken from USEPA (1993) and are applicable to controlled facilities, with various types of abatement (not further specified). Data are available for selected pollutants only.
6.C.a Clinical waste incineration
EMEP/EEA emission inventory guidebook 2009 15
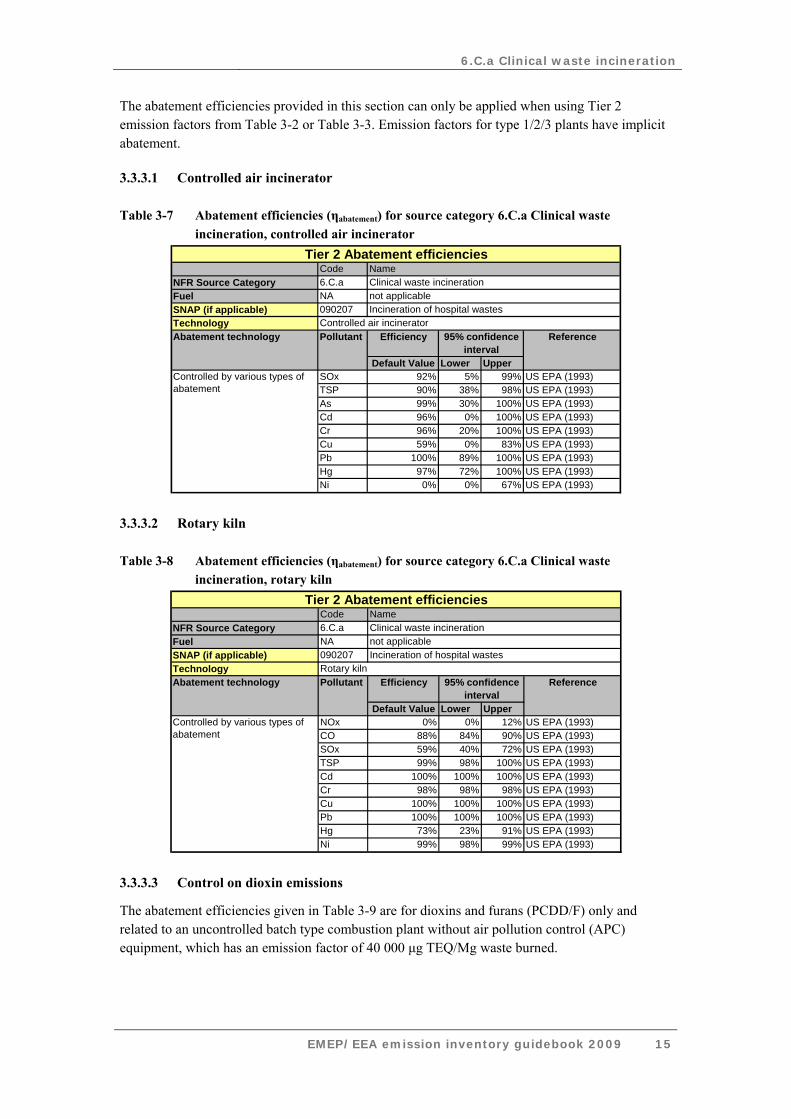
The abatement efficiencies provided in this section can only be applied when using Tier 2 emission factors from Table 3-2 or Table 3-3. Emission factors for type 1/2/3 plants have implicit abatement.
3.3.3.1 Controlled air incinerator
Table 3-7 Abatement efficiencies (ηabatement) for source category 6.C.a Clinical waste incineration, controlled air incinerator
CodeNFR Source Category 6.C.aFuel NASNAP (if applicable) 090207Technology
Efficiency
Default Value Lower UpperSOx 92% 5% 99% US EPA (1993)TSP 90% 38% 98% US EPA (1993)As 99% 30% 100% US EPA (1993)Cd 96% 0% 100% US EPA (1993)Cr 96% 20% 100% US EPA (1993)Cu 59% 0% 83% US EPA (1993)Pb 100% 89% 100% US EPA (1993)Hg 97% 72% 100% US EPA (1993)Ni 0% 0% 67% US EPA (1993)
Tier 2 Abatement efficiencies
Clinical waste incinerationnot applicable
Name
Controlled by various types of abatement
Incineration of hospital wastesControlled air incinerator
ReferenceAbatement technology Pollutant 95% confidence interval
3.3.3.2 Rotary kiln
Table 3-8 Abatement efficiencies (ηabatement) for source category 6.C.a Clinical waste incineration, rotary kiln
CodeNFR Source Category 6.C.aFuel NASNAP (if applicable) 090207Technology
Efficiency
Default Value Lower UpperNOx 0% 0% 12% US EPA (1993)CO 88% 84% 90% US EPA (1993)SOx 59% 40% 72% US EPA (1993)TSP 99% 98% 100% US EPA (1993)Cd 100% 100% 100% US EPA (1993)Cr 98% 98% 98% US EPA (1993)Cu 100% 100% 100% US EPA (1993)Pb 100% 100% 100% US EPA (1993)Hg 73% 23% 91% US EPA (1993)Ni 99% 98% 99% US EPA (1993)
Tier 2 Abatement efficiencies
Clinical waste incinerationnot applicable
Name
Controlled by various types of abatement
Incineration of hospital wastesRotary kiln
ReferenceAbatement technology Pollutant 95% confidence interval
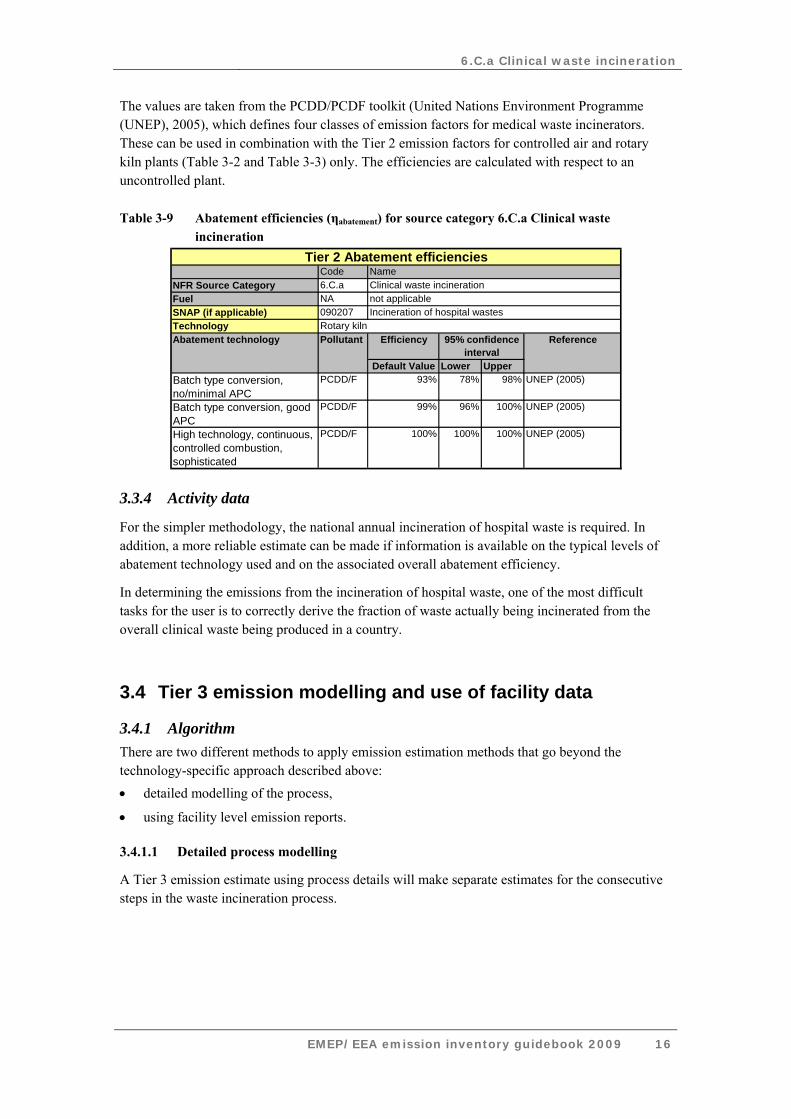
3.3.3.3 Control on dioxin emissions
The abatement efficiencies given in Table 3-9 are for dioxins and furans (PCDD/F) only and related to an uncontrolled batch type combustion plant without air pollution control (APC) equipment, which has an emission factor of 40 000 μg TEQ/Mg waste burned.
6.C.a Clinical waste incineration
EMEP/EEA emission inventory guidebook 2009 16
The values are taken from the PCDD/PCDF toolkit (United Nations Environment Programme (UNEP), 2005), which defines four classes of emission factors for medical waste incinerators. These can be used in combination with the Tier 2 emission factors for controlled air and rotary kiln plants (Table 3-2 and Table 3-3) only. The efficiencies are calculated with respect to an uncontrolled plant.
Table 3-9 Abatement efficiencies (ηabatement) for source category 6.C.a Clinical waste incineration
CodeNFR Source Category 6.C.aFuel NASNAP (if applicable) 090207Technology
Efficiency
Default Value Lower UpperBatch type conversion, no/minimal APC
PCDD/F 93% 78% 98% UNEP (2005)
Batch type conversion, good APC
PCDD/F 99% 96% 100% UNEP (2005)
High technology, continuous, controlled combustion, sophisticated
PCDD/F 100% 100% 100% UNEP (2005)
Tier 2 Abatement efficiencies
Clinical waste incinerationnot applicable
Name
Incineration of hospital wastesRotary kiln
ReferenceAbatement technology Pollutant 95% confidence interval
3.3.4 Activity data
For the simpler methodology, the national annual incineration of hospital waste is required. In addition, a more reliable estimate can be made if information is available on the typical levels of abatement technology used and on the associated overall abatement efficiency.
In determining the emissions from the incineration of hospital waste, one of the most difficult tasks for the user is to correctly derive the fraction of waste actually being incinerated from the overall clinical waste being produced in a country.
3.4 Tier 3 emission modelling and use of facility data
3.4.1 Algorithm There are two different methods to apply emission estimation methods that go beyond the technology-specific approach described above: • detailed modelling of the process,
• using facility level emission reports.
3.4.1.1 Detailed process modelling
A Tier 3 emission estimate using process details will make separate estimates for the consecutive steps in the waste incineration process.
6.C.a Clinical waste incineration
EMEP/EEA emission inventory guidebook 2009 17
3.4.1.2 Facility level data
Where facility-level emission data of sufficient quality (see General Guidance chapter 6, Inventory management, improvement and QA/QC, in part A) are available, it is good practice to indeed use these data. There are two possibilities:
• the facility reports cover all waste incineration in the country;
• facility-level emission reports are not available for all incineration plants in the country.
If facility-level data cover waste incineration in the country, it is good practice to compare the implied emission factors (reported emissions divided by the national incineration) with the default emission factor values or technology-specific emission factors. If the implied emission factors are outside the 95 % confidence intervals for the values given below, it is good practice to explain the reasons for this in the inventory report
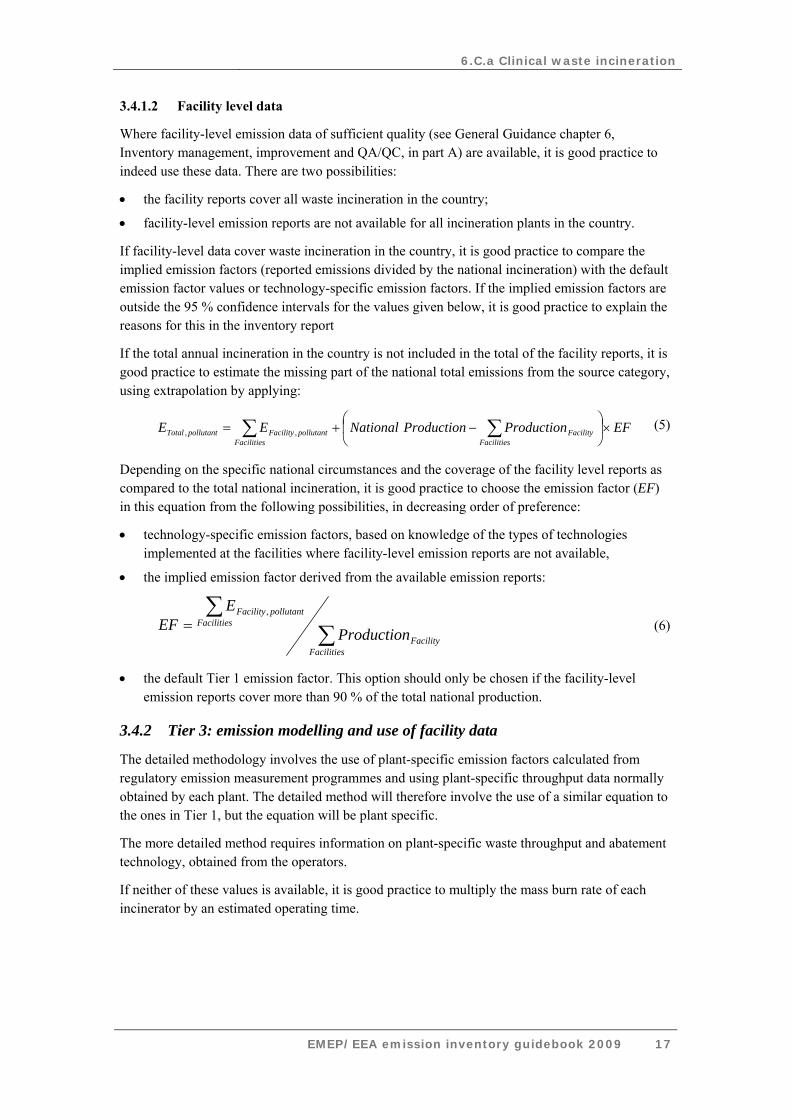
If the total annual incineration in the country is not included in the total of the facility reports, it is good practice to estimate the missing part of the national total emissions from the source category, using extrapolation by applying:
EFProductionProductionNationalEEFacilities
FacilityFacilities
pollutantFacilitypollutantTotal ×⎟⎠
⎞⎜⎝
⎛−+= ∑∑ ,,
(5)
Depending on the specific national circumstances and the coverage of the facility level reports as compared to the total national incineration, it is good practice to choose the emission factor (EF) in this equation from the following possibilities, in decreasing order of preference:
• technology-specific emission factors, based on knowledge of the types of technologies implemented at the facilities where facility-level emission reports are not available,
• the implied emission factor derived from the available emission reports:
∑∑
=
FacilitiesFacility
FacilitiespollutantFacility
Production
EEF
,
(6)
• the default Tier 1 emission factor. This option should only be chosen if the facility-level emission reports cover more than 90 % of the total national production.
3.4.2 Tier 3: emission modelling and use of facility data
The detailed methodology involves the use of plant-specific emission factors calculated from regulatory emission measurement programmes and using plant-specific throughput data normally obtained by each plant. The detailed method will therefore involve the use of a similar equation to the ones in Tier 1, but the equation will be plant specific.
The more detailed method requires information on plant-specific waste throughput and abatement technology, obtained from the operators.
If neither of these values is available, it is good practice to multiply the mass burn rate of each incinerator by an estimated operating time.
6.C.a Clinical waste incineration
EMEP/EEA emission inventory guidebook 2009 18
3.4.3 Activity data The more detailed method requires information on plant-specific waste throughput and abatement technology, obtained from the operators. There is normally a record kept of tonnage burnt as incinerator operators charge waste generators on that basis.
4 Data quality
4.1 Completeness Care should be taken to include emissions from waste incineration either in this source category, or in the relevant 1.A combustion chapter. It is good practice to check if this is indeed the case.
4.2 Avoiding double counting with other sectors Care should be taken not do double count emissions from waste incineration. It is good practice to check that emissions not included in this source category (because the heat from the incineration is recovered and the waste is subsequently used as a fuel) are reported in the relevant 1.A combustion chapter.
4.3 Verification
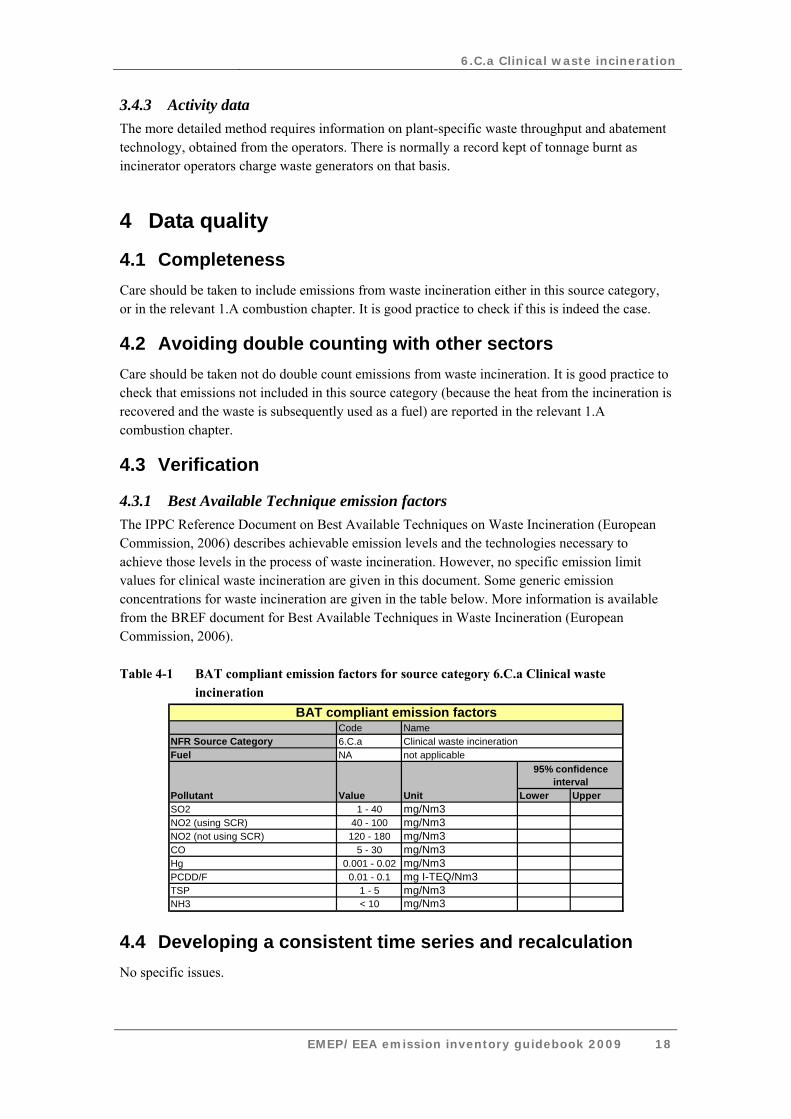
4.3.1 Best Available Technique emission factors The IPPC Reference Document on Best Available Techniques on Waste Incineration (European Commission, 2006) describes achievable emission levels and the technologies necessary to achieve those levels in the process of waste incineration. However, no specific emission limit values for clinical waste incineration are given in this document. Some generic emission concentrations for waste incineration are given in the table below. More information is available from the BREF document for Best Available Techniques in Waste Incineration (European Commission, 2006).
Table 4-1 BAT compliant emission factors for source category 6.C.a Clinical waste incineration
CodeNFR Source Category 6.C.aFuel NA
Lower UpperSO2 1 - 40 mg/Nm3NO2 (using SCR) 40 - 100 mg/Nm3NO2 (not using SCR) 120 - 180 mg/Nm3CO 5 - 30 mg/Nm3Hg 0.001 - 0.02 mg/Nm3PCDD/F 0.01 - 0.1 mg I-TEQ/Nm3TSP 1 - 5 mg/Nm3NH3 < 10 mg/Nm3
BAT compliant emission factorsNameClinical waste incinerationnot applicable
Pollutant Value Unit
95% confidence interval
4.4 Developing a consistent time series and recalculation No specific issues.
6.C.a Clinical waste incineration
EMEP/EEA emission inventory guidebook 2009 19
4.5 Uncertainty assessment It is good practice to consider that from country to country the composition of the incinerated waste may vary due to differences in waste definitions and fractionation. This could lead to country-specific emission factors that are not comparable to those of other countries.
4.5.1 Emission factor uncertainties
Emission factors are likely to vary considerably between different incinerators, depending on the operating conditions and on which of the many combinations of gas cleaning equipment is in use on the plant. The variability at just a single plant for PCDD/Fs, for example, can be an order of magnitude between different sampling periods. The ranges in emission factors and the data quality ratings (mainly C, D or E) demonstrate the high uncertainty.
4.5.2 Activity data uncertainties
No specific issues.
4.6 Inventory quality assurance/quality control QA/QC No specific issues.
4.7 Gridding No specific issues.
4.8 Reporting and documentation No specific issues.
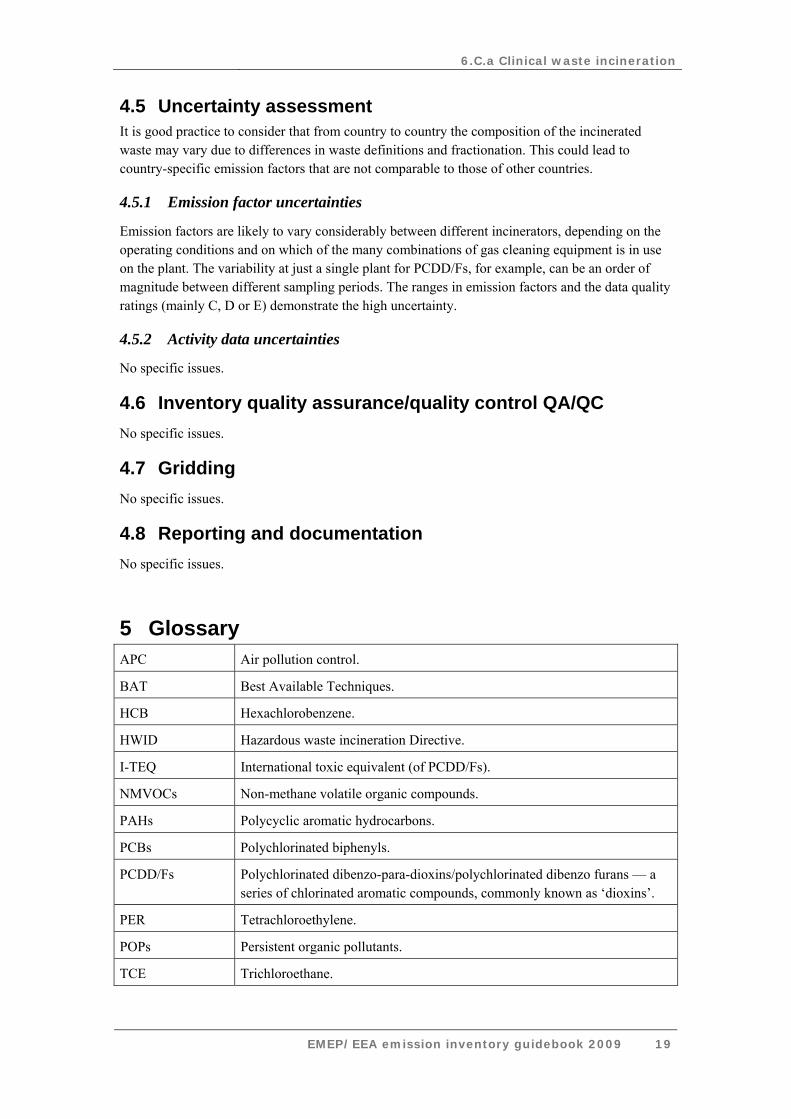
5 Glossary APC Air pollution control.
BAT Best Available Techniques.
HCB Hexachlorobenzene.
HWID Hazardous waste incineration Directive.
I-TEQ International toxic equivalent (of PCDD/Fs).
NMVOCs Non-methane volatile organic compounds.
PAHs Polycyclic aromatic hydrocarbons.
PCBs Polychlorinated biphenyls.
PCDD/Fs Polychlorinated dibenzo-para-dioxins/polychlorinated dibenzo furans — a series of chlorinated aromatic compounds, commonly known as ‘dioxins’.
PER Tetrachloroethylene.
POPs Persistent organic pollutants.
TCE Trichloroethane.

6.C.a Clinical waste incineration
EMEP/EEA emission inventory guidebook 2009 20
TRI Trichloroethylene.
Adsorption using activated carbon/ activated lignite coke
Several different technologies have been developed for dioxin and mercury control. These systems can also be fairly effective at removing HCl and SO2 and act as a useful polisher for these acid gases.
Controlled air incinerators
Also known as modular-starved air incinerators, are commonly used units, which consist of two stages. During the first stage (starved air section), the air-to-fuel ratio is kept low to promote drying and volatilisation at temperatures of ∼ 800–900 °C. In the second stage (secondary combustion chamber), excess air is added and temperatures elevated to > 1 000 °C by support burners to ensure complete gas phase combustion. The relatively low bed temperature and combustion air velocities mean that metal species tend to remain in the bed and, together with particulates, are less likely to be entrained in the flue gases than with other types of incinerator (e.g. excess air incinerators).
Electrostatic precipitators (ESP)
Use the principle of electrostatic attraction to remove entrained particles from the flue gases. They consist of rows of discharge electrodes (wires or thin metal rods), through which a high voltage is applied, and which run between an array of parallel rows of metal plates which collect the charged particles (note: not very common in clinical waste incinerators).
Energy recovery The removal of heat from the exhaust gases so as to provide heat and/or electricity for use in the plant or elsewhere.
Excess air incinerators
Also referred to as batch incinerators, are typically small modular units consisting of a series of internal chambers and baffles. They are usually operated batch wise, but can be operated continuously. Excess air incinerators generally consist of two main chambers; a primary combustion chamber where drying and volatilisation occurs and a secondary chamber to ensure complete gas phase combustion. These plant are operated at lower temperatures than controlled air incinerators (secondary chamber temperature ~ 900 °C), with complete combustion promoted by maintaining excess air levels of up to 300 % throughout (usually ~ 100 % for burning pathological waste only).
Fabric filters Consist of semi-permeable material in the form of bags or sleeves, which trap particles and are mounted in an airtight housing (baghouse) which is divided into a number of compartments. Fabric filters are also used as a second stage in acid-gas control systems.
Rotary kiln Waste is fed into a slightly inclined, rotating, refractory-lined drum which acts as a grate surface. The rotating action of the drum mixes it with air supplied through the walls.
Semi-dry scrubbers/ spray absorber systems (spray drying)
Make use of an alkaline reagent slurry (usually calcium hydroxide) which is introduced into the flue gases as a spray of fine droplets. The acid gases are absorbed into the aqueous phase on the surface of these droplets and neutralised to form a dry product, which is collected in an electrostatic

6.C.a Clinical waste incineration
EMEP/EEA emission inventory guidebook 2009 21
precipitator or fabric filter. Spray absorbers tend to use a reaction tower; of the several different designs available, the gas suspension absorber is the most commonly employed in hospital waste incinerators. This involves a re-circulation of particulate matter and unreacted lime back into the reaction tower.
Wet scrubbers Remove acid gases (e.g. HCl, HF and SO2) by washing the flue gases in a reaction tower. Designed to provide a high gas-liquid contact. In the first stage, the gases are quenched by water sprays to remove HCl, HF, some particulates and some heavy metals. In the second stage, calcium hydroxide or another suitable alkali is used to remove SO2 and any remaining HCl.
6 References Aasestad K. (eds.) (2007). Norwegian Emission Inventory 2007.
Berdowski J.J.M., Veldt C., Baas J., Bloos J.P.J., Klein A.E. (1995). Technical paper to the OSPARCOM-HELCOM-UNECE emission inventory of heavy metals and persistent organic pollutants. Report No TNO-MEP-R95/247.
ETC/AEM-CITEPA-RISOE (1997). Selected nomenclature for air pollution for Corinair94 inventory (SNAP 94), version 1.0.
European Commission (2006). Integrated Prevention and Pollution Control. Reference Document Best Available Techniques for waste incineration, August 2006.
Guidebook (2006). EMEP/Corinair Emission Inventory Guidebook, version 4 (2006 edition), published by the European Environmental Agency. Technical report No 11/2006. Available via http://reports.eea.europa.eu/EMEPCORINAIR4/en/page002.html.
LUA (1997). The Identification of Relevant Industrial Sources of Dioxins and Furans in Europe (The European Dioxin Inventory).
UNEP (2005). Standardized Toolkit for Identification and Quantification of Dioxin and Furan Releases, United Nations Environment Programme.
USEPA (1985). Compilation of Air Pollutant Emission Factors. Volume 1. Stationary Point and Area Sources, fourth edition, USEPA, AP-42, September 1985.
USEPA (1993). Compilation of Air Pollutant Emission Factors AP42, fifth edition and supplements.
Wenborn M.J., Coleman P.J., Passant N.R., Salway A.G., Lymberidi E. (1998). Future UK Emissions of Persistent Organic Pollutants, Cadmium, Lead and Mercury.
7 Point of enquiry Enquiries concerning this chapter should be directed to the relevant leader(s) of the Task Force on Emission Inventories and Projection’s expert panel on combustion and industry. Please refer to the TFEIP website (www.tfeip-secretariat.org/) for the contact details of the current expert panel leaders.


