
Methane production by anaerobic digestion of wastewater and solid wastesT.Z.D. de Mes, A.J.M. Stams, J.H. Reith and G. Zeeman1
4
4.1 Introduction
Anaerobic conversion of organic materials andpollutants is an established technology for envi-ronmental protection through the treatment ofwastes and wastewater. The end product is biogas–a mixture of methane and carbon dioxide–,which is a useful, renewable energy source.Anaerobic digestion is a technologically simpleprocess, with a low energy requirement, used toconvert organic material from a wide range ofwastewater types, solid wastes and biomass intomethane. A much wider application of the tech-nology is desirable in the current endeavourstowards sustainable development and renewableenergy production. In the 1980’s several projectswere initiated in The Netherlands to produce bio-
gas from wastes. Many projects were terminateddue to insufficient economic viability. Currently,the production of methane from wastes is recei-ving renewed attention as it can potentially redu-ce CO2 emissions via the production of renewableenergy and limit the emission of the greenhousegas methane from especially animal manure. Thistrend is supported by the growing market demandfor ‘green’ energy and by the substantial optimisa-tion of anaerobic digestion technologies in thepast decades, especially the development ofmodern ‘high rate’ and co-digestion systems.
The aim of this chapter is to review and evaluatethe various anaerobic digestion technologies toestablish their potential for methane production,aimed at broadening the range of waste streams
- 58 -
1Corresponding author: see list of contributors
AbstractAnaerobic digestion is an established technology for the treatment of wastes and wastewater. The finalproduct is biogas: a mixture of methane (55-75 vol%) and carbon dioxide (25-45 vol%) that can be usedfor heating, upgrading to natural gas quality or co-generation of electricity and heat. Digestion installa-tions are technologically simple with low energy and space requirements. Anaerobic treatment systemsare divided into 'high-rate' systems involving biomass retention and 'low-rate' systems without biomassretention. High-rate systems are characterised by a relatively short hydraulic retention time but longsludge retention time and can be used to treat many types of wastewater. Low-rate systems are general-ly used to digest slurries and solid wastes and are characterised by a long hydraulic retention time, equalto the sludge retention time. The biogas yield varies with the type and concentration of the feedstockand process conditions. For the organic fraction of municipal solid waste and animal manure biogasyields of 80-200 m3 per tonne and 2-45 m3 per m3 are reported, respectively. Co-digestion is an impor-tant factor for improving reactor efficiency and economic feasibility. In The Netherlands co-digestion isonly allowed for a limited range of substrates, due to legislation on the use of digested substrate in agri-culture. Maximising the sale of all usable co-products will improve the economic merits of anaerobictreatment. Furthermore, financial incentives for renewable energy production will enhance the compe-titiveness of anaerobic digestion versus aerobic composting. Anaerobic digestion systems currently ope-rational in Europe have a total capacity of 1,500 MW, while the potential deployment in 2010 is esti-mated at 5,300-6,300 MW. Worldwide a capacity up to 20,000 MW could be realised by 2010.Environmental pressures to improve waste management and production of sustainable energy as well asimproving the technology’s economics will contribute to broader application.

used for biogas production. The principles ofanaerobic digestion are outlined in Section 4.2. InSection 4.3 anaerobic digestion technologies andtheir application for specific waste streams are dis-cussed. An overview of solid wastes and wastewa-ter streams available for anaerobic digestion inThe Netherlands is presented in Section 4.4. InSection 4.5 the utilisation of biogas as a renewableenergy source is highlighted, including the current and potential share of bio-methane in TheNetherlands. The economics of anaerobic diges-tion are discussed in Section 4.6. The status ofinternational developments is presented inSection 4.7. Conclusions and perspectives forfurther development are presented in Section 4.8.
4.2 Basic principles of anaerobic digestion
4.2.1 Principle of the processAnaerobic microbiological decomposition is aprocess in which micro-organisms derive energyand grow by metabolising organic material in anoxygen-free environment resulting in the produc-tion of methane (CH4). The anaerobic digestionprocess can be subdivided into the following fourphases, each requiring its own characteristicgroup of micro-organisms:
• Hydrolysis: conversion of non-soluble biopolymers to soluble organic compounds
• Acidogenesis: conversion of soluble organic compounds to volatile fatty acids (VFA) and CO2
• Acetogenesis: conversion of volatile fatty acids to acetate and H2
• Methanogenesis: conversion of acetate and CO2 plus H2 to methane gas
A simplified schematic representation of anaero-bic degradation of organic matter is given asFigure 1. The acidogenic bacteria excrete enzymesfor hydrolysis and convert soluble organics tovolatile fatty acids and alcohols. Volatile fattyacids and alcohols are then converted by acetoge-nic bacteria into acetic acid or hydrogen and carbon dioxide. Methanogenic bacteria then useacetic acid or hydrogen and carbon dioxide toproduce methane.
For stable digestion to proceed it is vital thatvarious biological conversions remain sufficientlycoupled during the process, to prevent the accu-mulation of intermediate compounds. For exam-ple, an accumulation of volatile fatty acids willresult in a decrease of pH under which conditionsmethanogenesis cannot occur anymore, which
- 59 -
Amino acids sugars Free long chainfatty acids + glycerol
Volatile fatty acids, alcohol
Methanecarbon dioxide
ammonia
Hydrolysis
Acidogenesis
Acetogenesis
Methanogenesis
Acetic acid
Suspended, colloidal organic matter
protein carbohydrate lipid
Hydrogen carbon dioxide
Figure 1. Simplified schematic representation of the anaerobic degradation process [1].

results in a further decrease of pH. If hydrogenpressure becomes too high, further reduced vola-tile fatty acids are formed, which again results ina decrease of pH.
4.2.2 Environmental factors affecting anaerobic digestion
As anaerobic digestion is a biological process, it isstrongly influenced by environmental factors.Temperature, pH and alkalinity and toxicity areprimary control factors.
Controlled digestion is divided in psychrophilic(10-20 ºC), mesophilic (20-40 ºC), or thermophilic(50-60 ºC) digestion. As bacterial growth and con-version processes are slower under low tempera-ture conditions, psychrophilic digestion requires along retention time, resulting in large reactorvolumes. Mesophilic digestion requires less reac-tor volume. Thermophilic digestion is especiallysuited when the waste(water) is discharged at ahigh temperature or when pathogen removal is animportant issue. During thermophilic treatmenthigh loading rates can be applied. Anaerobicdigestion can occur at temperatures as low as 0°C,but the rate of methane production increases withincreasing temperature until a relative maximumis reached at 35 to 37° C [2]. At this temperaturerange mesophilic organisms are involved. Therelation between energy requirement and biogasyield will further determine the choice of tempe-rature. At higher temperatures, thermophilic bac-teria replace mesophilic bacteria and a maximummethanogenic activity occurs at about 55°C orhigher.
The first steps of anaerobic digestion can occur ata wide range of pH values, while methanogenesisonly proceeds when the pH is neutral [2]. For pHvalues outside the range 6.5 - 7.5, the rate ofmethane production is lower. A sufficient amountof hydrogen carbonate (frequently denoted asbicarbonate alkalinity) in the solution is impor-tant to maintain the optimal pH range requiredfor methanogenesis.
Several compounds exhibit a toxic effect at exces-sive concentrations such as VFA's, ammonia,cations such as Na+, K+ and Ca++, heavy metals,
sulphide and xenobiotics, which adversely affectmethanogenesis.
4.2.3 Methane production potentialThe Chemical Oxygen Demand (COD) is used toquantify the amount of organic matter in wastestreams and predict the potential for biogas pro-duction. The oxygen equivalent of organic matterthat can be oxidised, is measured using a strongchemical oxidising agent in an acidic medium. During anaerobic digestion the biodegradableCOD present in organic material is preserved inthe end products, namely methane and the newlyformed bacterial mass. In case an organic compound (CnHaObNd) is com-pletely biodegradable and would be completelyconverted by the anaerobic organism (sludge yieldis assumed to be zero) into CH4, CO2 and NH3,the theoretical amount of the gases produced canbe calculated according to the Buswell equation (1):
CnHaObNd + (n-a/4 - b/2 +3d/4) H2O →(n/2 +a/8 -b/4 -3d/8) CH4 + (n/2-a/8+b/4+3d/8) CO2 + dNH3 (equation 1)
The quantity of CO2 present in the biogas gene-rally is significantly lower than follows from theBuswell equation. This is because of a relativelyhigh solubility of CO2 in water and part of theCO2 may become chemically bound in the waterphase.Another widely used parameter of organic pollution is the Biological Oxygen Demand(BOD). This method involves the measurement ofdissolved oxygen used by aerobic microorganismsin biochemical oxidation of organic matter during5 days at 20 °C. A very useful parameter to evaluate substrates foranaerobic digestion is the anaerobic biodegradabi-lity and hydrolysis constant [3]. The total anaero-bic biodegradability is measured by the totalamount of methane produced during a retentiontime of at least 50 days. The gas yield depends on factors such as digesti-bility of the organic matter, digestion kinetics, theretention time in the digester and the digestiontemperature. By controlling conditions such astemperature, humidity, microbial activity andwaste properties, the process can be optimised.
- 60 -

4.2.4 Requirements for anaerobic digestion
Unlike aerobic wastewater treatment systems, theloading rate of anaerobic reactors is not limited bythe supply of a reagent, but by the processingcapacity of the microorganisms. Therefore, it isimportant that a sufficiently large bacterial mass isretained in the reactor. For low rate systems thelatter is achieved by applying a sufficiently longretention time. For high rate systems the retentionof biomass is increased in comparison with theretention of the liquid. The following conditionsare essential for high rate anaerobic reactors [2]:• A high concentration of anaerobic bacterial
sludge must be retained under high organic (>10 kg/m3/day) and high hydraulic (>10 m3/m3/day) loading conditions.
• Maximum contact must occur between the incoming feedstock and the bacterial mass.
• Also minimal transport problems should be experienced with respect to substrate compounds, intermediate and end products.
The base for design of anaerobic digestion systemsis the slowest step during digestion, which is usually the conversion of biodegradable non-dissolved organic solids into soluble compounds.This process is described as hydrolysis, and istemperature dependent.
Sludge Retention Time (SRT) is an importantparameter. When too short, methanogenesis willnot occur [4], and the reactor will acidify as aresult. An SRT of at least 15 days is necessary toensure both methanogenesis, sufficient hydrolysisand acidification of lipids at 25 °C [4]. At lowertemperature the SRT should be longer, as thegrowth rate of methanogens and the hydrolysisconstant decrease with temperature. To ensure thesame effluent standards, the SRT should be increa-sed. In completely mixed systems, the SRT isequal to the HRT, while in systems with inbuiltsludge retention, the SRT is higher than the HRT.For the particular Upflow Anaerobic Sludge Bed(UASB) system, the required reactor volume ensu-ring a sufficient SRT is calculated according toequation 2. This equation is applied for wastewaterwith a high concentration of suspended solids,and for systems that are not hydraulically limited [5]:
in which:CODSSin = COD of suspended solids in the influent (g/l)X = sludge concentration in the reactor (g VSS/l);(1 g VSS=1.4 g COD)R = fraction of the CODSS removedH = fraction of the removed CODSS, which ishydrolysed at the imposed SRT
4.2.5 Advantages and disadvantages of anaerobic treatment
Advantages of anaerobic treatment are numerousand can be summarised as follows [1,6]:• provision of energy source through methane
recovery;• anaerobic treatment processes generally
consume little energy. At ambient temperature the energy requirements are in the range 0.05-0.1 kWh/m3 (0.18-0.36 MJ/m3), depending on the need for pumping and recycling effluent;
• reduction of solids to be handled; excess sludge production on the basis of biodegradableCOD in anaerobic treatment is significantly lower compared to aerobic processes;
• facilitation of sludge dewatering;• raw waste stabilisation;• relatively odour free end-product;• almost complete retention of the fertiliser
nutrients nitrogen (N), phosphate (P) and potassium (K);
• modern anaerobic treatment processes can handle very high loads, exceeding values of 30 g COD/l/day at ca. 30 °C and up to 50 g COD/l/day at ca. 40 °C for medium strength mainly soluble wastewater;
• anaerobic sludge can be preserved for prolonged periods without any feeding;
• the construction costs are relatively low;• the space requirements of anaerobic treatment
are lower than conventional systems.
During anaerobic treatment biodegradable com-pounds are effectively removed, leaving a numberof reduced compounds in the effluent, as well asammonium, organic N-compounds, sulphide,organic P-compounds and pathogens. Dependingon the further use a complementary treatmentstep is needed.
- 61 -
(equation 2)HRT = (CODSSin) *R* (1-H) * SRTx

The disadvantages of anaerobic treatment aresummarised below [1]:• the high sensitivity of methanogenic bacteria to
a large number of chemical compounds. In many cases anaerobic organisms are capable of adapting to these compounds;
• the first start-up of an installation without thepresence of proper seed sludge can be time-consuming due to the low growth yield ofanaerobic bacteria;
• when treating waste (water) containing sulphurous compounds, the anaerobic treatmentcan be accompanied by odour due to the formation of sulphide. An effective solution to this problem is to employ a micro-aerophilic post-treatment step, to convert sulphide to elemental sulphur.
4.3 The technology of anaerobic digestion
Anaerobic treatment is divided in 'low rate' sys-tems, in which long hydraulic retention times areapplied, and 'high rate' systems, in which hydrau-lic retention time is relatively short. Low rate sys-tems are mainly used for waste streams such asslurries and solid waste, which require a long timefor sufficient anaerobic degradation. High ratesystems are mainly used for wastewater. Theretention time of sludge in a low rate system isequal to the hydraulic retention time. In high ratesystems however, the sludge retention timeshould be much higher than the hydraulic reten-tion time. In essence, all high-rate processes havea mechanism either to retain bacterial sludge massin the reactor or to separate bacterial sludge fromthe effluent and return it to the reactor. High ratesystems are divided in two categories:1) systems with fixed bacterial films on solid
surfaces; 2) systems with a suspended bacterial mass
where retention is achieved through external or internal settling.
Examples of low rate systems are: Batch,Accumulation, Plug flow and ContinuouslyStirred Tank Reactor (CSTR) systems. Examples ofhigh rate systems are: Contact Process, AnaerobicFilter, Fluidised Bed and Upflow Anaerobic
Sludge Bed (UASB) / Expanded Granular SludgeBed (EGSB) [7].
4.3.1 Systems for treatment of solid waste and slurries
Systems used to digest solid waste are classifiedaccording to the percentage of Total Solids (TS) inthe waste stream [8]:15-25% low solids anaerobic digestion:
wet fermentation;>30% high solids anaerobic digestion:
dry fermentation.
Figure 2 shows a schematic overview of digestionsystems for slurries and solid wastes. Examples ofexisting plants are also shown, the processes ofwhich are discussed later in detail.During wet fermentation, slurry is digested; so thetechniques for digestion of solid waste during wetfermentation and the digestion of slurries arecomparable. Most digesters comprise a singlereactor vessel (one phase system), but it is alsopossible to split microbial digestion into two phases, which can be operated in separate reactorvessels. Many types of reactors have been develop-ed, based on the processes described above for thetreatment of different types of wastes. They can bebroadly categorised as low-solids, high-solids andmulti-stage systems.
Plants used to treat organic solid waste are listedin Appendix I. This highlights the development ofthe technology and only includes plants proces-sing more than 2,500 tonnes of slurry or solidwaste per year. Appendix I includes wet fermenta-tion and dry fermentation principles, both are dis-cussed in the following sections and the techni-ques most commonly used are explained.
4.3.1.1 Wet fermentation systemsThe most common form of low-solids reactor isthe Continuously Stirred Tank Reactor (CSTR).Feed is introduced into the reactor, which is stir-red continuously to ensure complete mixing ofthe reactor contents. At the same time an equalquantity of effluent is removed from the reactor.Retention time within the reactor can be variedaccording to the nature of the feedstock and pro-cess temperature applied, which is typically in therange of 2 - 4 weeks. Such systems have a lowoperating expenditure [8].
- 62 -

The CSTR is generally used for treatment of slur-ries with a TS percentage of approximately 2-10%.The influent concentration range applicable forCSTR’s is determined by:• gas yield in relation to the energy requirement
for heating;• possibility of mixing the reactor content.CSTR systems are applied in practice for treatinganimal manure, sewage sludge, household waste,agricultural wastes, faeces, urine and kitchenwaste or mixtures of these substrates. Mixing creates a homogeneous substrate, preven-ting stratification and formation of a surface crust,and ensures solids remain in suspension. Bacteria,substrates and liquid consequently have an equalretention time resulting in SRT is equal to HRT.
Digester volume ranges from around 100 m3 toseveral thousand cubic metres, often with reten-tion times of 10-20 days, resulting in daily capa-cities of 6 m3 to 400 m3 [9]. Examples of CSTRdigesters with different mixing and heating sys-tems are shown in Figure 3.
Plug-flow digesters use slurries, e.g. almost undi-luted manure and have a total suspended solidsconcentration of 10-12% TS [11]. The basic dige-ster design is a long trough (Figure 4), often builtbelow ground level with a gas tight but expanda-ble cover. At low TS concentration problems with floating and settling layers can appear [12]. Thisproblem can be solved using vertical mixing insidethe pipe. In this particular process, anaerobic
stages such as hydrolysis and methanogenesis areseparated over the length of the pipe. At first,hydrolysis mainly occurs, whereas later in theprocess methanogenesis takes place at full veloci-
ty. Using this system, the SRT is equal to the HRT.These systems are frequently used to treat slurrieswith a high fraction of suspended solids, as thehydrolysis of particulate matter is rate-limiting [3]hence only low loading rates can be applied.
- 63 -
Digestion
Wet Dry
continuous continuous
completely mixed
thermo thermo
thermo
mesothermo thermo mesomeso
meso completely mixed
plugflow
batch
BTAVAGRON
PaquesBiothane
VALORGA DRANCOKompogas
Biocel
thermo meso
batch
thermo meso
fed batch
Accumulationsystems (AC)
meso
plugflow
Figure 2. Schematic overview of digestion systems for slurries and solid waste. Commercial plants are indicated in italics.
influent
effluent
gas
influent
effluent
gas
Biogasrecirculation
influent
effluent
gas
influent
effluent
gas
Biogasrecirculation
gasgas
Figure 3. Schematic diagram of a CSTR system, mechani-cally stirred (top) and stirred by biogas recirculation (bottom) [10].
Figure 4. Schematic diagram of a plug flow digester.

In a batch system (Figure 5) the digester is filledat the start of the process. A disadvantage of thesystem is that a separate influent tank and effluenttank are needed. Batch systems are used as high-solids systems resulting in an equal SRT and HRT.It is advisable to leave approximately 15% of thecontents to speed up the start-up of the process.In a batch system, treating mainly suspended soli-ds, the different processes like hydrolysis, acidifi-cation and methanogenesis will not occur at thesame rate. At first, time is needed to bring the sus-pended solids into a soluble form before it can beconverted further to methane. The balancebetween the different processes at the start-up willdepend on the percentage of inoculum applied.For solid waste digestion, liquid recirculation isapplied to ensure sufficient contact between bac-terial biomass and substrate. Instead of a separate storage tank for the effluent,a combination of digestion and storage can beachieved in one tank. An Accumulation System(AC) is continuously fed and characterised by anincreasing effective reactor volume with time. Thereactor is almost completely emptied leaving 10-15% as inoculum. This system is the simplest sys-tem for on-site application of slurry digestion. Afurther facility, to normal storage consists of
equipment for collection and use of the producedbiogas and equipment is needed to optimise theprocess temperature, such as isolation and/orheating. The use of an AC-system is suitable whenlong-term storage is required. This type of systemis mainly used on farms for the storage/digestionof manure, and is also used to digest faeces andurine in DeSaR (Decentralised Sanitation and Re-
Use) systems [13]. The AC-system has also beentested on a small scale for solid manure digestionat thermophilic conditions for on-site energy pro-duction.
Wet digestion also has been carried out in a num-ber of commercial and pilot-scale plants: • AVECON or Waasa process, Vaasa, Finland
[14], [15];• VAGRON, Groningen, The Netherlands [16]
named CiTech in Appendix I;• Bigadan process, Denmark and Sweden [17],
[18].
There are four AVECON process plants inEurope (one under construction), that can treat3,000 - 85,000 tonnes per annum. The processcan be operated at both thermophilic and meso-philic temperatures; the plant at Vaasa operatesboth systems in parallel. The thermophilic processhas a retention time of 10 days compared to 20days in the mesophilic process. The process hasbeen tested on a number of waste types includinga mixture of mechanically separated municipalsolid waste/sewage sludge and operates in a solidsrange of 10-15%. The reactor is a single vessel,which is sub-divided internally to provide a pre-digestion chamber. Pumping biogas through thebase of the reactor carries out mixing. The opera-tional performance indicates that gas productionis in the range 100-150 m3/tonne of bio-wasteadded, with a volume reduction of 60%, weightreduction 50-60% and a 20-30% internal con-sumption of biogas. Aerobic composting, depen-dent on waste quality, can be used for post-treat-ment of the digested material.
At the VAGRON plant in Groningen (see Figure11) the organic residual fraction is separatedmechanically from the municipal solid waste stream and digested. At VAGRON, the temperaturein the fermentation tanks is approximately 55 ºC,resulting in thermophilic fermentation. The washed Organic Waste Fraction (OWF) remainsin the tank for approximately 18 days, duringwhich time approximately 60% of the organicmaterial is converted into methane producing atotal of 125 m3 of biogas per tonne OWF.
- 64 -
effluent
15% seed sludge
Biogasrecycle Biogas
Figure 5. Schematic diagram of a batch reactor.

The Krüger company developed the BigadanProcess in Denmark. The system is used to treat amixture of livestock manure, organic industrialwaste and household waste. This way of digestingis called co-digestion. More than 20 plants are inoperation in Denmark. In Kristianstad in Sweden,the same process is used, operating since 1996.The digester is fed with manure, organic house-hold waste and industrial waste. The industrialwaste includes gastrointestinal waste from abat-toirs and bio-sludge from a distillery, as well aspotato and carrot waste. The solid waste is auto-matically fed into a coarse shredder and cut intopieces of approximately 80 mm. After a magneticseparator has removed metals, a fine shreddercuts the waste into 10 mm pieces before beingmixed with manure and bio-sludge. The mixtureis transported to a primary mixing tank. Afterhomogenisation, the biomass is pumped into twopasteurisation tanks at 70 °C. Via a heat exchangerthe slurry enters a stirred digester, which operatesat 38 °C with a hydraulic retention time of 20-24days. The daily amount of biomass digested isapproximately 200 tonnes producing 8,000-9,000Nm3 biogas/day. The total yearly input is approxi-mately 70,000 tonnes corresponding to approxi-mately 20,000 MWh/year. Approximately 10% ofthe biogas is used for operation of the plant.
4.3.1.2 Dry fermentation systemsHigh-solids anaerobic digestion systems havebeen developed to digest solid wastes (particular-ly municipal solid waste or MSW) at solids con-tents of 30% or above. High-solids systems enablethe reactor size to be reduced, require less processwater and have lower heating costs. A number of commercial and pilot scale plants have beendeveloped including:• the Valorga process [15], [19], [20];• the Dranco process [15], [20], [21];• the Kompogas process [15], [20];• the Biocel process [15], [22], [23].
The Valorga system, a semi-continuous one-stepprocess, was developed in France. The installationat Amiens combines four mesophilic high-solidsreactors with the incineration of residues andnon-digested matter. Mixing within the reactor iscarried out by reverse circulation under pressureof a small proportion of biogas. In the installation
in Tilburg, before entering the anaerobic step, theseparately collected VFY waste is screened andthen crushed to decrease particle size to below 80mm. After crushing, the waste is intensivelymixed with part of the excess process water andheated by steam injection. The biogas producedhas a methane content of 55-60%. The biogas canbe purified to a methane content of 97% which isthen fed into the gas network (Tilburg plant),used to produce steam for an industrial process(Amiens) or for heating and electricity production(Engelskirchen). The specific methane yield isbetween 220 - 250 m3/tonne of total volatile solids(TVS) fed to the digester or between 80 - 160m3/tonne of waste fed, depending on waste charac-teristics. The process operates at solids contentstypically ca. 30% with residence times between18-25 days. The waste is diluted in order to keepthe TS content of the mixture at approximately 30%.
The Dranco (Dry Anaerobic Composting) sys-tem was developed in Gent, Belgium. The systemoperates at high solids content and thermophilictemperatures. Feed is introduced daily at the topof the reactor, and digested material is removedfrom the base at the same time. Part of the digestedmaterial is recycled and serves as inoculation material, while the remainder is de-watered toproduce organic compost material. There is nomixing within the reactor, other than that broughtabout by downward plug-flow movement of thewaste. The total solids content of the digesterdepends on the waste material source but is in therange 15 - 40%. Reactor retention time is between15 - 30 days, the operating temperature is in therange 50 - 58 °C and the biogas yield is between100 - 200 m3 / tonne of waste feedstock.
The Kompogas system is a high-solids thermo-philic digestion system developed in Switzerland.The reaction vessel is a horizontal cylinder intowhich feed is introduced daily. Movement ofmaterial through the digester is in a horizontalplug-flow manner with digested material beingremoved from the far end of the reactor afterapproximately 20 days. An agitator within thereaction vessel mixes the material intermittently.The digested material is de-watered, with some ofthe press water being used as an inoculum sourceand the remainder being sent to an anaerobic
- 65 -

wastewater treatment facility that also producesbiogas.
The Biocel process is a high-solids batch processoperated at mesophilic temperatures. Wastes aremixed with inoculum before being sealed intounstirred batch reactors. Wastes are kept withinthe digestion vessel until biogas production ceases. Leachate produced during the digestionprocess is heated and recirculated through thewaste. A full-scale plant at Lelystad in TheNetherlands commenced operation in September1997. It processes 50,000 tonnes per year ofSource Separated organic fraction of MunicipalSolid Waste (SS-MSW) yielding energy and compost. The retention time is approximately 21 days [23].
4.3.1.3 Two-phase digestion systemsThe idea of two- and multi-stage systems is thatthe overall conversion process of the waste streamto biogas is mediated by a sequence of biochemi-cal reactions which do not necessarily share thesame optimal environmental conditions [20]. Theprinciple involves separation of digestion, hydro-lysis and acidogenesis from the acetogenesis andmethanogenesis phases. Optimising these reac-tions separately in different stages or reactorsleads to a larger overall reaction rate and biogasyield [24]. Concentrated slurries and waste with ahigh lipid concentration should preferably be treated in a one-stage digester for two reasons. (1)Lipids will not be hydrolysed in the absence ofmethanogenic activity. (2) The possible decreaseof the lipid-water interface in the first stage of atwo-stage sludge digester can result in a longerSRT in the second stage [25]. Moreover hydrolysisand acidification of proteins and carbohydratesare not promoted by acidogenic conditions [4].
There are two kinds of two-phase digestion sys-tems, one in which the different stages are separa-ted, based on a wet fermentation, and one basedon dry fermentation, in which only the percolateexperiences a second methanogenic stage. Thefirst system operates on dilute materials, with atotal solids content of less than 10%. Unlike con-ventional low-solids digestion systems, whichoperate within a single reaction vessel, multi-phase liquid systems separate the digestion pro-
cess into two or more stages, each taking place ina separate reaction vessel. Systems include:• The BTA-process [15];• The BRV process [15], [20].
The BTA-process was developed in Germany as athree-phase liquid system for digestion of theorganic fraction of MSW [15]. The waste is mixedwith recycled process water before entering anacidification reactor. In this vessel, soluble organicmaterial such as sugars and starch are rapidly con-verted into organic acids. The waste is then de-watered, and the liquid portion fed into a fixed-film methane reactor. The solids, containingpolysaccharides such as cellulose are then mixedwith more process water and fed into a hydrolysisreactor, where hydrolysis and acidification of themore resistant fibres takes place. After hydrolysis,waste is once more de-watered, the liquid effluentis fed into the methane reactor, and the solid frac-tion is removed and used as compost. Effluentfrom the methane reactor is used as process waterto slurry incoming wastes.
The BRV system was developed in Switzerlandand is an aerobic/anaerobic conversion system.The anaerobic phase is the Kompogas system,described earlier [15].
There is also a system, which consists of a dry fer-mentation stage followed by a liquid methanoge-nic stage. A number of different systems havebeen developed that use this configuration andthey have been described as 'leach-bed' or perco-lation systems. Again a number of systems havebeen described but most apply the same principle.An example is the Biothane-AN system [15], inwhich solid wastes are placed batch-wise (at ahigh-solids concentration) into a reaction vessel.Process water is percolated through the waste,hydrolysis takes place and the resultant percolateis fed into a methane reactor. Effluent from themethane reactor is then recirculated through thehydrolysis vessel to generate further percolate.Normally, a series of batch hydrolysis vessels willfeed a single methane reactor, to ensure a constantsupply of percolate to the methane reactor.
- 66 -

4.3.2 Systems for wastewater treatment
High Rate Anaerobic Treatment systems (Figure 6,7, 8), like the UASB (Upflow Anaerobic SludgeBed) reactor, Anaerobic Filter and the ContactProcess, are unfit for the digestion of concentratedslurries but suitable for diluted and concentratedwastewater and can be part of a multi-stage sys-tem. The sludge retention time is longer than thehydraulic retention time, as the sludge is retainedin the reactor by using internal settler systems orexternal settlers with sludge recycling or fixationof biomass on support material. In single-phasehigh rate systems, all anaerobic stages take placeat the same time.
High rate systems are most suitable for waste streams with a low suspended solids content.Different types, used world-wide for the treatmentof wastewater are [1], [26]:• Contact process; Biobulk-system by Biothane
[27];• Upflow Anaerobic Sludge Bed (UASB);• Anaerobic Fixed Film Reactor (AFFR);• Fixed film Fluidised Bed system;• Expanded Granular Sludge Bed (EGSB);• Hybrid systems;• Anaerobic Filter (AF).
Biobulk is a conventional anaerobic contact pro-cess, with sludge recirculation, applicable for
- 67 -
Sludge
Influent
Gas
Degassifier
Effluent
Solids recycle
sludge
Figure 6. Schematic diagram of a UASB. Figure 7. Schematic diagram of an Anaerobic Filter (AF).
Figure 8. Schematic diagram of an Anaerobic Contact (AC) process.
Gas
Effluent
sludge
Influent
Gas
Effluent
Influent

waste streams containing high strength COD /BOD concentrations and fats, oils and grease con-centrations higher than 150 mg/l. Biobulk is a'medium loaded' system with volumetric loadingof 2-5 kg/COD/m3/day.The Biobulk Continuously Stirred Tank Reactor(CSTR) has specially-designed mixing capabilityto ensure the wastewater is in constant contactwith the biomass. The process is applied in ice cream plants andother food processing facilities which dischargeeffluents high in biodegradable fats and oils.Removal efficiencies with this technology havebeen found to consistently average above 90%with respect to COD and BOD and close to 75%with respect to the organic fraction of TSS.
The Upflow Anaerobic Sludge Bed (UASB) con-cept was developed in the late 1960’s atWageningen University in The Netherlands. TheDutch beet sugar firm, CSM, developed the basictechnology for wastewater treatment in several
sugar factories. Companies such as Paques andBiothane carried out further development of thesystem on a commercial basis (Figure 9).The key to the commercialisation step was thedesign and engineering of simple but efficientinternal topworks (settler) to effectively degasifythe biomass and ensure its retention in the reactorvessel. Wastewater enters the bottom of the reactorvessel through an inlet distribution system andpasses upward through a dense anaerobic sludgebed. Soluble COD is then converted to biogas,which is rich in methane and an upward circulationof water, establishing well-settleable sludge. Thespecially constructed settler sections allow aneffective degasification so sludge particles devoidof attached gas bubbles, sink to the bottom establishing a return downward circulation (seealso Figure 6). Upward flow of gas-containing sludge through theblanket combined with return downward flow ofdegassed sludge creates continuous convection.This ensures effective contact of sludge and waste-water without the need for any energy consuming
- 68 -
Figure 9. UASB reactor at Cerestar, Sas van Gent, The Netherlands. Photo by courtesy of Biothane SystemsInternational.

mechanical or hydraulic agitation within the reac-tor. The unique design of the reactor allows ahighly active biomass concentration in relation tosoluble organic solids passing through the sludgebed and is responsible for the very high loadingrate (short hydraulic retention time), which canbe readily achieved. When the UASB is applied forwastewater containing suspended solids (likesewage), flocculent sludge will grow rather thangranular sludge [1]. Flocculent sludge can alsoresult in sufficient sludge retention for removal oforganic material.A successful version of this concept is theInternal Circulation (IC) reactor, characterisedby biogas separation in two stages in a reactorwith a high height/diameter ratio and gas-driveninternal effluent circulation (Figure 10). The ICsystem can process high upflow liquid and gasvelocities, which enables treatment of lowstrength effluents at short hydraulic retentiontimes, and treatment of high strength effluents athigh volumetric loading rate. In recent years ICtechnology has been successfully applied at fullscale on a variety of industrial wastewater types [28].
The Expanded Granular Sludge Bed (EGSB)process incorporates the sludge granulation con-cept of UASB’s. The main improvement of theEGSB system, trademarked ‘Biobed’ (by the com-pany Biothane), compared to other types ofanaerobic fluidised or expanded bed technologiesis the elimination of carrier material as a mecha-nism for biomass retention within the reactor.This process is therefore perceived either as anultra high rate UASB or a modified conventionalfluidised bed. Applications for Biobed includewastewater from breweries, chemical plants, fer-mentation industries and pharmaceutical indus-tries. This system is designed to operate at highCOD loading; it is very space efficient, requiring asmaller footprint size than a UASB system.
Anaerobic Fixed Film Reactors (AFFR) containa mixed population of bacteria immobilised onthe surfaces of support medium, and have beensuccessfully applied in the treatment of high-strength effluent treatment [29].
The hybrid system was developed to overcomethe problems in UASB and AF systems. In an AF
reactor, the presence of dead zones and channel-ling in the lower part of the filter generally occurs.In UASB systems sludge washout may be a pro-blem when the wastewater contains large fractionsof suspended solids. The hybrid system combinesboth the fixed bed system (at the top of the reac-tor) with the UASB system. The filter zone in thehybrid reactor has as well a physical role for bio-mass retention as biological activity contributingto COD reduction [30].
4.4 Waste streams
The various types of waste streams which can bedigested for the recovery of energy in the form ofmethane, can be divided as follows:
1. Solid wastes:- domestic wastes, such as separately collected
Vegetable, Fruit and Yard waste (VFY);- organic residual fraction after mechanical
separation of integral collected householdwaste (grey waste);
- agricultural wastes (crop residues); - manure.
- 69 -
Figure 10. Schematic diagram of Internal Circulation (IC)reactor. Courtesy of Paques Biosystems B.V.

2. Waste slurries:- liquid manure; - sewage sludge; - urine and faeces; - industrial waste (e.g. fat-, slaughterhouse and
fish wastes).3. Wastewater:- industrial wastewater (especially from the food
and beverage industry);- domestic wastewater (sewage).
4.4.1 Vegetable, Fruit and Yard waste and organic residual of Municipal Solid Waste
Vegetable, Fruit and Yard (VFY) waste is the orga-nic fraction of domestic solid waste and containsthe following components [31]:• leaves, peels and remains of vegetables, fruits,
potatoes;• all food remains;
• egg-shells, cheese-rinds;• shells of nuts;• coffee-filters, tea-leaves and tea-bags;• cut flowers, indoor plants (without clod),
grass, straw and leaves;• small lop waste and plant material from
gardens (no soil);• manure of pets, pigeons, rabbits (no cat's box
grit).
In The Netherlands, VFY waste is mainly compos-ted, but there are two installations in which VFYwaste is digested, one in Tilburg (Valorga) and onein Lelystad (Biocel). Grey waste is treated inGroningen (Vagron; Figure 11).
A second plant has been constructed inHeerenveen and is now in the start-up phase. Acomparison of the three plants based on measure-ments from practice is given in Figure 12. The
- 70 -
Figure 11. Vagron plant (Groningen) for separation and digestion of the organic fraction of MSW. Photo by courtesy ofVagron BV.

methane content in the biogas is 55-70% [15].The highest amount of biogas per tonne biowasteis produced in the Vagron plant, operated at ther-mophilic conditions. The other plants are opera-ted under mesophilic conditions. Moreover theorganic waste fraction is collected in a differentmanner. The organic fraction treated in theValorga plant contains a low amount of yardwaste. Valorga and Biocel are both dry fermenta-tion processes, the main differences being that theValorga system employs mixing using reverse cir-culation of the biogas, while in the Biocel processonly leachate circulation is employed. MoreoverBiocel is a batch system while Valorga is a conti-nuous system. The retention time in the Biocel isapproximately 21 days, in the Vagron and Valorgaplant approximately 18 days. A more detailed
scheme of the Vagron plant is given in AppendixIII.
4.4.2 Agricultural wastesAgricultural wastes contain remains of the processsuch as cut flowers, bulbs, verge grass, potatoes,chicory, ensilaged weed etc. This type of waste issuitable for re-use after fermentation, as the typeof waste collected is 'cleaner' than ordinary VFY[34].
4.4.3 Manure and liquid manureIn The Netherlands approx. 35 on-farm manuredigestion installations were in operation in theperiod 1978 to 1993. In 1993, only four installa-tions still remain operational [31]. In 1995, theonly central digester, a medium scale demonstra-
- 71 -
Input: 1000 kg biowaste
Biogas70 kg
Aerobic post treatment30 kg
Vaporized water120 kg
Compost products500 kg
Wastewater230 kg
Non-recyclables50 kg
BIOCEL plant Lelystadanaerobic digestion35-40°C
Input: 1000 kg biowaste
Biogas102,5 kg
Vaporized water? kg
Compost products687,5 kg
Wastewater? kg + 45 kg
Rest165 kg
Valorga plant Tilburganaerobic digestion40°C
Input: 1000 kg biowaste
Water (? not known yet)
Biogas125 kg
Vaporized water? kg
Compost products250 kg
Wastewater? kg + 265 kg
Rest360 kg
VAGRON plant Groningenanaerobic digestion52°C
Figure 12. Mass-balances for the three operating digestion plants on the organic fraction of Municipal Solid Waste. DataVagron from [33], data Valorga from [32], Biocel scheme adapted from [23].

tion plant at Daersum was closed down. The full-scale plant, named PROMEST in Helmond where600,000 tonnes animal manure was processed peryear was also closed in the same period. The PRO-MEST processing plant consisted of anaerobicdigestion followed by separation of liquid /solidsand treatment of the liquid, in order to produce
clean water and granulated fertilisers. Untilrecently manure digestion was not taken in opera-tion in The Netherlands. Farm scale digestersbecame too expensive and labour intensive andfarmers were not willing to pay for manure pro-cessing in the central digesters. In summary thereasons are [35]:
- 72 -
Figure 13. Biogas plant for manure digestion Praktijkcentrum Sterksel, The Netherlands. Photo by courtesy of www.energieprojecten.com.
TABLE 1. Typical composition of the influent pig and dairy cattle manure in The Netherlands and in Switzerland (All values are given in kg/m3) [7].
The Netherlands Switzerland SwitzerlandDairy Cattle Dairy Cattle Pig
Total Solids 85.4 83 43Volatile Solids 74.7 73 74NH4
+-N 2.2 1.5 1.9Total COD 101 - -Dissolved COD 27.6 - -VFA (COD) 11.1 2.6 7.4pH 7.5 7.4 7.2

• Low return for biogas and electricity (low prices);
• Strict regulation for the application of co-digestion. Co-digestion can increase the gas yield per m3 reactor content per day, but legislation prevented the application of digested co-substrates on agricultural fields [36];
• Insufficient collaboration effort between the agricultural sector, energy sector and the waste sector to introduce this technique.
The situation has improved since 1997 due to thefollowing development [35]:• Increased price for disposal of organic waste
due to the ban on organic matter landfill;• Higher prices for renewable energy;• The need for selective manure distribution due
to stronger manure legislation;• Lower capital/investments costs due to lower
interest rates and fiscal incentives;
Digestion of manure is economically efficientwhen mixed with other organic waste streams,like VFY waste, left-over feed, roadside grass, oldfrying fat etc. This technique is called co-digestionand widely used in Denmark. In Denmark a spe-cific biogas production of ca. 37 m3 per tonne ofbiomass is achieved using co-digestion, whileonly using manure approximately 20 m3 pertonne biomass is produced. At the ResearchInstitute for Animal Husbandry in Lelystad (TheNetherlands) a study has been conducted on thefeasibility of anaerobic manure digestion for indi-vidual Dutch dairy and pig farms. The mostimportant conclusion of the report is that manuredigestion can be economically viable given a suffi-ciently large farm and economic feasibility isdependent on the market value of electricity. Thereduction of CO2 emission is also emphasised.Given these trends, manure digestion will becomean increasingly interesting option in the comingyears. At present several demonstration plants areoperational in The Netherlands, which apply co-digestion, limited to plant materials, for exampleat a dairy farm in Nij Bosma Zathe, in Leeuwardenand at a pig farm in Sterksel, Brabant (see Figure13). The volume of the digester is dependent onthe concentration of the manure. A higher con-centration ensures less volume is needed to applythe same hydraulic retention time and biogas pro-
duction. The concentration of manure is depen-dent on the method used to clean out stables. A typical composition of pig and dairy cattlemanure in The Netherlands and Switzerland isshown in Table 1. Concentrations have beenincreased as a result of reduction in 'spilling'water. The biodegradability can also vary with thekind of manure. The biodegradability of dairymanure is much lower due to the very efficientdigestive track of ruminants. In digestion of pig-slurry about 40% of the COD will be con-verted to methane-COD [37], while in the dige-stion of cow slurry this is approximately 25% [7].The methane content of the biogas varies between55-70% [38]. An overview of initiatives in TheNetherlands for manure digestion is given asAppendix IV.
4.4.4 Sewage sludgeSewage sludge contains primary sludge as a resultof a pre-settling stage of sewage and secondarysludge as a result of sludge growth during aerobicwastewater treatment. To stabilise sludge beforefurther treatment, anaerobic digestion is com-monly used. In The Netherlands in 2001 approxi-mately 100 one-step digesters were in operation[39]. The average process conditions are summa-rised in Table 2. From a theoretical point of viewapproximately 50 large sewage treatment plants(capacity higher than 50,000 p.e.) in TheNetherlands could improve efficiency if anaerobicdigestion was applied [39]. Typical values for theamount of total solids in the influent are 4% to 6% [40]. Due to a high number of one-stepdigestion installations in the Netherlands not performing at optimum conditions with respect to biogas production, Royal Haskoning B.V. performed research to optimise these conditions[40]. One of the conclusions was that process factors such as retention time, loading rate andmixing have a larger influence on the degradationof organic material than temperature.Optimisation of these factors can lead to an increase in biogas production of approximately25%.
The dry matter of sludge contains approximately70% organic matter. During digestion this can bereduced to approximately 45%. As a result of thisreduction and the increased de-waterability
- 73 -

the final sludge volume after de-watering is decreased. The digestion of aerobic biomass(secondary sludge) is limited due to slow dyingand lysis of aerobic microbial cells. In TheNetherlands the further treatment, after digestion,is mainly dewatering and incineration of the solidfraction. The latter represents the largest cost inthe treatment of domestic sewage. Digested sewage sludge cannot be used in agriculture as aresult of heavy metals pollution.
4.4.5 Industrial waste slurry and wastewater
Industrial wastewater is heterogeneous, both incomposition and volume. Effluents from the Food& Beverage (F&B) industry contain the highestconcentration of organic compounds [41].Anaerobic wastewater treatment is widely appliedin this branch of industry as in the Pulp and Paperindustry, as is shown in Table 3 and Figure 14.
TABLE 3. World-wide application of high rate anaerobicsystems adapted from a vendor’s database [26].
Application Number of plants
Breweries and beverages 304Distilleries and fermentation 206Chemical 61Pulp and paper 130Food 371Landfill leachate 20Undefined/unknown 70Total in database 1,162
Food and Beverage industryThe most important Food and Beverage industriescan be summarised [41]:• Slaughterhouses and meat-processing • Dairy• Fish-processing• Starch-processing• Sugar• Edible oil • Beverages and distilleries• Fruit and vegetable processing• Coffee processing
As each process involves different compounds andthe majority of these industries do not operatecontinuously over a 24 hour period each waste-water characteristic shown below will vary withtime:1.Volume (varying from 0.1-175 m3/tonne
product);2.BOD/COD concentration and ratio
(BOD 30-40 g/l; COD 70-80 g/l);3.pH (in the range 3-12);4.Temperature (10-100 °C);5.Concentration of nutrients, chemicals,
detergents.If the wastewater does not contain a large percen-tage of suspended solids, a high rate system isusually applied. Otherwise removal of solids in aprimary treatment system can be applied. Thesesolids can be treated, e.g. to produce animal feedor fertiliser, or can be digested separately or, in theworst case, incinerated. When solids are notremoved in advance, the HRT should be increasedso a sufficient SRT is provided [5].
- 74 -
TABLE 2. Typical process parameters of sludge digestion installation in The Netherlands, minimum, maximum andaverage value [40].
Parameter Minimum value Maximum value Average
Digester Volume (m3) 450 26,464 3,963Temperature (ºC) 30 35 33HRT (days) 11 77 31Influent Dry matter (kg/day) 512 55,000 6,641Influent Organic matter (kg/day) 255 41,250 4,581Loading (kg dry matter/m3/day) 0.53 4.66 1.52Removed (kg dry matter/m3/day) 0.10 1.40 0.54Gas production (m3 CH4/day) 74 13,000 1,216Gas production (m3 CH4/kg dry matter input ) 0.116 2.063 0.682

An overview of the characterisation and anaerobicbiodegradability of different industrial wastewaterstreams is given as Appendix II.
4.4.6 Domestic wastewaterDomestic wastewater is composed of differentflows, which can be discharged separately or com-bined:1.Black water: Wastewater from flushing the
toilet contains faeces, urine and cleansing materials. Black water contains a high number of pathogens. The concentration of this waste stream is dependent on the amount of flushingwater used. In 'conventional' European and northern American toilets about 10 litres per flush is used. Poor-flush toilets use 2-5 litres per flush and modern vacuum toilets only use ca. 1 litre per flush.
2.Grey water: Wastewater from in-house usage such as bathing, washing and cleansing does not contain excreta and therefore less patho-gens and little nutrients (N, P, K). Volumes andconcentration are strongly dependent on waterconsumption patterns and waste handling.
3.Combined wastewater: Both black and grey water combined with urban run-off water, such as rain and drain water.
Combined wastewater is too diluted in westerncountries to be treated anaerobically; it wouldtake more energy to heat the wastewater than theamount of methane formed. Treatment at lowtemperatures is possible but long HRT's are neces-sary, in order to provide sufficient SRT for hydro-lysis and methanogenesis. Recently, new technolo-gies for treatment of raw domestic sewage at low
- 75 -
TABLE 4. Composition of raw sewage in various cities in the world. The sewage is mainly of domestic origin [44]
Characteristic Pedregal, Cali, Bennekom, Accra, Brazil Colombia The Netherlands Ghana
Total Suspended Solids (TSS mg/l) 429 215 160 980Volatile Suspended Solids (VSS mg/l) 252 107 70 769BOD (mg/l) 368 95 230 879COD (mg/l) 727 267 525 1546Total Nitrogen (mg N/l) 44 24 75 93Total Phosphorus 11 1.3 18 16Alkalinity 388 120 350 491
Various7%
Food40%
Chemicals7%
Pulp and paper9%
Distillery12%
Brewery and soft drinks
25%
UASB60%
CSTR10%
EGSB10%
Anaerobicfilter8%
Lagoon6%
Hybrid4%
Fluidised Bed2%
Figure 14. Industries using Anaerobic Digestion for wastewater pre-treatment and types of AD systems used for indus-trial wastewater pre-treatment plants [42].

temperatures have been developed and tested onpilot scale [30], [43]. In developing countriesanaerobic treatment of domestic sewage is anappropriate technology as temperatures are favou-rable. Several full-scale UASB systems are appliedin South America, India, and recently Ghana(West Africa). The composition of sewage is givenin Table 4. The maximum anaerobic bio-degradability of domestic sewage is 74% [30]
Wastewater quality and quantityA large fraction of domestic wastewater compo-nents, viz. organics, nitrogen, phosphorus, potas-sium and pathogens are produced in small volu-mes, viz. as faeces plus urine. The latter is shownin Figures 15 and 16. The diagrams show that85% nitrogen, 2% organic matter, 46% phospho-rus and 62% potassium present in domestic waste-water originates from the urine, while 11.5% nitrogen, 52% organic matter, 35% phosphorusand 25% potassium originates from faeces. Themean production of faeces plus urine amounts to
1.5 l per person per day. This volume contains96.5% nitrogen, 54% organic matter, 81% phos-phorus (when no phosphorus is used in washingpowders) and 97% potassium produced per per-son per day. Moreover, faeces contain the largestamount of pathogens. All these compounds arediluted with clean water when flushing toilets andmoreover when shower and bath water, washingwater and kitchen water are added, before ente-ring the sewer. In the sewer rainwater is alsoadded. Finally a large volume of water is trans-ported to the wastewater treatment system, wherethe different compounds should be removed, con-suming a large amount of energy when conven-tional aerobic treatment is applied. The formerclearly shows that separation of toilet wastewater(black water) can prevent the pollution of otherwastewater streams (grey water) with organics,nutrients and other salts and pathogens.The section Environmental Technology ofWageningen University researches the separatecollection, transport and treatment of black and
- 76 -
Figure 15. Organic matter (g COD) and Nitrogen (g) produced in domestic wastewater per person per day [45].
Faeces53.7 (52%)
Urine11 (85%)
Faeces1.5 (12%)
Urine2 (2%)
Meals preparation17 (17%)
Meals preparation,washing clothes
0.12 (1%)Washing clothes
24.4 (24%)
Personal care5.25 (5%)
Personal care0.32 (2%)
COD
Urine2.5 (62%)
Grey water0.5 (13%)
Faeces1.0 (25%)
Urine 0.8 (47%)
Grey water0.3 (18%)
Faeces0.6 (35%)
Potassium
Nitrogen
Phosphate
Figure 16. Potassium (g) and phosphate (g) produced in domestic sewage per person per day [45].

grey water. The concept will be demonstrated in2005. In Germany the concept is already appliedin practice at a few locations, for example in a newhousing estate in Lübeck.
4.5 Utilisation of biogas as a renewable energy source
4.5.1 IntroductionBiogas or landfill gas is primarily composed ofmethane (55-75 vol%), and carbon dioxide (25-45 vol%) with smaller amounts of H2S (0-1.5 vol%) and NH3 (0-0.05 vol%). The gas mixture issaturated with water vapour and may contain dustparticles and trace amounts of H2, N2, CO andhalogenated compounds depending on the feed-stock and process conditions [46]. The fuel valueof biogas containing 55-75 vol % methane rangesbetween 22–30 MJ/Nm3 (Higher Heating Value)and 19-26 MJ/Nm3 (Lower Heating Value) respectively.
Biogas can be utilised for the production of heat,co-generation of electricity and heat (CHP) or forupgrading to natural gas or fuel gas quality. A partof the biogas energy is utilised on site to providefor the internal energy requirement of the plant(digester heating, pumps, mixers etc.). The amount of energy used for plant operationranges between 20 and 50% of the total biogasenergy contents depending on climate and techni-cal specifications. For systems treating solid bio-wastes internal energy use is around 20%. In [47]a biogas plant in Germany is described treating26,000 tonnes of fruit and vegetable wastes and4,000 tonnes of park wastes per year. The plantproduces 2.8 Million Nm3 of biogas per year (60vol% methane) with a total energy content of16,650 MWh. The biogas is converted in a CHPsystem into electricity (35%) and heat (50%) with15% energy loss. The energy balance indicatesthat the plant consumes 23% of the energy contentof the total biogas production. The electricity surplusfor export to the grid amounts to 3,510 MWh/yearor 21% of the biogas energy content [47].In the remaining part of this section techniquesfor utilisation and upgrading of biogas and land-fill gas are described, including the required puri-fication processes. For reviews the reader is refer-red to [46], [48], [49].
4.5.2 Generation of heat and combined heat and power generation (CHP)
Heat production in gas heater systemsHeat production in gas heater/boiler systems doesnot require a high gas quality [46]. Reduction ofthe H2S content to below 1,000 ppm is recom-mended to prevent corrosion. Furthermore it isadvisable to condense the water vapour in the gasto prevent interference with the gas nozzles.Removal of water will also remove a substantialamount of the H2S [46].
Gas engine and gas turbine CHP systems The utilisation of biogas in internal combustionengines ('gas engines') is a long established tech-nology. Engine sizes range from 45 kWe in smallplants to several MWe in large biogas plants orlandfill sites. Mostly used in large-scale applica-tions are diesel engines rebuilt to spark ignited gasengines or dual fuel engines with 8-10% dieselinjection [46]. Small-scale CHP systems (< 45kWe) reach an electrical efficiency of 29% (sparkignition) and 31% (dual fuel engine). Larger en-gines can reach an electrical efficiency of 38%[46]. Up to 50% of the biogas energy content isconverted to heat which can partly be recoveredfrom the exhaust gas (high temperature heat) andthe cooling water and oil cooling (lower tempera-ture heat) [48], [49]. Energy losses are about 15%.Utilisation of biogas in gas engines may requireremoval of H2S, NH3 and particles depending onmanufacturers’ specifications (see Table 5). Gas engine CHP systems have a higher electricalefficiency than gas turbine CHP systems andlower specific investment costs. Maintenancecosts for gas engines are higher than for turbines.The use of gas turbines in CHP systems may bemore economical in applications with a large,constant high value heat requirement (> 110 ºC)or in large installations of several MWe’s capacity[49]. A restriction of gas turbines is the limitedflexibility with varying gas flows because a redu-ced gas inflow leads to a decreased efficiency [48].
Fuel cell CHP systemsFuel cells make use of direct electrochemical con-version of the fuel with oxygen to generate elec-tricity and heat with near-zero emissions. The fuel(methane in the case of biogas) is converted to
- 77 -

hydrogen by the action of a catalyst or high tem-perature steam reforming. The H2 is then electro-chemically converted to electricity and heat.Water and CO2 are the main by-products. Thepotential electrical efficiency is > 50% while thethermal efficiency is approx. 35%. For utilisationof biogas two fuel cell types are most relevant forthe near future. Phosphoric acid fuel cells (PAFC)are at present applied in a number of 200 kW to2 MW power plants operating on natural gas witha practical electrical efficiency of 41% [46]. ThePAFC operates at approx. 200 ºC which allowsusable heat recovery. Utilisation of biogas in aPAFC requires near-complete removal of sulphi-des and halogenated compounds [46], [50]. InJapan a 200 kWe PAFC is used in a brewery forconversion of biogas from wastewater effluent[51]. Before entering the fuel cell the biogas ispurified in a pre-treatment section composed of adesulphuriser, an ammonia/salt removing unit, abuffer tank and a gas analyser. Impurities are ade-quately removed while at the same time CO2 isremoved from the gas. The overall conversion effi-ciency (electricity + heat) is 80% [51]. SolidOxide Fuel Cells (SOFC) operate at temperatures> 900 ºC. The SOFC has a relatively high toleran-ce for impurities, although it also requires near-complete removal of sulphides and halogens. Thehigh operating temperature allows direct methaneconversion and recovery of high temperatureheat. The attainable electrical efficiency on naturalgas is > 40%. In The Netherlands the utilisation ofbiogas from animal manure in an SOFC system iscurrently being explored at farm scale [52]. The utilisation of biogas in fuel cells is an impor-tant strategy to enhance the efficiency of electrici-ty generation. A substantial cost reduction of fuelcells is however required for large-scale applica-tion. The conversion of fermentation gases in fuelcells is being explored in ‘BFCNet’: ‘Network onBiomass Fermentation Towards Usage in FuelCells’ [53]. The objectives of BFCNet includeR&D and demonstration, and the development ofstandards on EU level.
4.5.3 Upgrading of biogas and landfill gas to natural gas and vehicle fuel quality
Upgrading of biogas and landfill gas to natural gasstandards and delivery to the (local) natural gas
network is a common practice. In The Netherlands45% of the produced landfill gas was upgraded tonatural gas quality in 1995 [48]. Landfill gas is thefinal product from biodegradation of organicmaterials present in landfill sites and consistsmainly of methane (50-60 vol%) and carbondioxide (40-45 vol%). It further contains sulphur(0-200 mg/m3) and chlorinated and fluorinatedhydrocarbons. The Higher Heating Value is 20-24MJ/m3 [48]. To reach natural gas quality the land-fill gas undergoes extensive dewatering, removalof sulphur components in a bed charged withimpregnated active carbon or iron oxide, andremoval of halogens by absorption in an activecarbon bed. Further upgrading involves changingthe composition of the gas by separating the maincomponents methane and carbon dioxide in ahigh calorific (methane rich) and a low calorific(methane poor) gas flow in order to attain a calo-rific value and 'Wobbe index' similar to naturalgas. Upgrading technologies include chemicalabsorption, Pressure Swing Adsorption and mem-brane separation. Before delivery to the grid thegas must be free from solid and fluid componentsand it must be pressurised [48]. Upgrading of bio-gas from controlled digestion makes use of similartechnology.Upgrading of biogas to transport fuel quality iscommon practice in several European countries(including Sweden, the Czech Republic, France),the USA and New Zealand. World wide 23 facili-ties for production and upgrading of biogas totransport fuel standards were in operation in 1999[46]. Sweden produces an amount of biogas of1,35 TWh/year primarily in sewage treatmentplants and also in landfill sites and industrial was-tewater treatment plants. Approximately 100GWh/year (10 Million m3) are currently used asvehicle fuel. Based on experiences gained fromprojects with municipal fleets of busses and taxis,the Swedish program now aims for commercialexpansion of vehicle fleets and infrastructure for(upgraded) biogas refuelling stations [54].Upgraded biogas can be used in existing enginesand vehicles suitable for natural gas. At presentapprox. 1.5 million natural gas fuelled vehiclesare in use world wide. Sulphur, water and parti-cles must be removed to prevent corrosion andmechanical engine damage. Carbon dioxide mustbe removed to reach a required methane content
- 78 -

of 96 - 97 vol%. The gas is compressed and storedat a pressure of 250 bar for distribution, using thesame technology as for compressed natural gas[46].
Demands for the removal of components differdepending on the biogas application. Indicativequality requirements for several applications aresummarised in Table 5.
4.5.4 Purification technologiesRaw biogas should be treated to prevent corrosionof installed equipment or to achieve adequatequality standards for use as a natural gas substitu-te or transport fuel. An overview of available tech-niques for biogas treatment is provided in Table 6.
4.6 The economics of anaerobic digestion
4.6.1 IntroductionIn assessing the economic viability of biogas pro-grams, it is useful to distinguish between threemain areas of application:
1) Anaerobic treatment of household waste(water)a) DeSaR (Decentralised Sanitation and
Reuse); including community-on-site anaerobic treatment of domestic waste(water) and organic household waste
b) central digestion of the organic fraction of household wastei) source separated at the household
- 79 -
TABLE 5. Indicative gas quality requirements for various applications. Sources: [46], [48], [49].
Component: H2S CO2 Halogens Dust H2O
(Cl, F; particles
landfill gas)
Utilisation:
Gas heater/boiler < 1000 ppm 1) Removal
advisable
Gas engine Minimum LHV 3) Cl and F3) Humidity 3)
13-21 MJ/m3 60-80 mg/m3 < 70-80%
- per 10 kWh (LHV) input3) < 1150 – 2000 mg < 50 mg/m3
- per m3 of biogas3) < 700-1200 mg/m3 < 30 mg/m3
Fuel cells
- Phosphoric Acid Fuel Cell < 10 ppm4 Near-complete Removal
- Solid Oxide Fuel Cel < 10 ppm4) removal required required
Vehicle fuel 5) Max. 23 mg/Nm3 Max. 3 vol% Removal Max. 32
required mg/Nm3
Natural gas quality6) Sulphur < 5mg/m3 7) Cl < 5mg/ m3 Removal Dew point
required at –10ºC
1) removal required if input limits are exceeded2) data provided by Jenbacher (2002) per 10 kWh (LHV) gas input for gas engines ranging between 300-3000 kW; data were calculated
per m3 biogas assuming 60 vol% methane. The maximum allowable NH3 concentration is 55 mg/10 kWh [49]. If an NOx (and CO) catalyst is used to purify the engines’ exhaust gases, near-complete removal of halogens from the biogas is required.
3) according to ref. [48].4) preferably lower i.e. < 1 ppm.5) specifications for transport fuel used in Sweden. From ref. [46].6) natural gas composition in The Netherlands. From ref. [48].7) removal (to about 5 vol%) required to attain suitable combustion value and Wobbe index.

ii) mechanically separated c) digestion of sewage sludge at a central
sewage treatment plant2) Anaerobic digestion of manure
a) on-farm digestion for energy productionb) central digestion for energy productionc) central digestion and further processing
(recovery/removal of nutrients from the liquid phase)
3) Anaerobic treatment of industrial wastewaterand waste
In this section mainly 1b, central digestion of theorganic fraction of household waste, and 2,anaerobic digestion of manure, are discussed. Ineach case, the economic feasibility of individualfacilities depends largely on whether output in theform of gas (for cooking, lighting, heating andelectricity generation) and solid and liquid by-products (for use as fertiliser/soil conditioner,fishpond or animal feed) can substitute for fuels,fertilisers or feeds, previously purchased. Forexample, a plant has a good chance of being eco-nomically viable when farmers or communities
previously paid substantial percentages of theirincomes for fuels (e.g. gas, kerosene, coal), fertili-sers (e.g., nitrates or urea) or soil conditioners.The economics may also be attractive in farmingand industry, where considerable cost is experien-ced in disposing manure, solid wastes and efflu-ents. In these cases, the output can be sold orused to reduce energy and disposal costs,repaying the original capital investment. In caseswhen the community is charged for treatment ofwastes the digestion process may be of greatfinancial importance. When the products do notgenerate income or reduce cash outflow the eco-nomic viability of a biogas plant decreases. Forexample when cooking fuels such as wood ordung can be collected at zero cost or where thecost of commercial fuel is so low that the marketfor biogas is limited. Technical, social and econo-mic factors, government support, institutionalarrangements, and the general level of commercialactivity in the construction of biogas plants andrelated equipment are highly interrelated [56].This section focuses on the economic aspects of
- 80 -
TABLE 6. Overview of techniques used for biogas treatment [55].
Compound removed Technique PrincipleWater/Dust Demister Physical
Cyclone separator "Moisture trap "Water trap "Cooling in combination with demister "Absorption to silica "Glycol drying unit "
H2S Air oxygen dosing1) BiologicalFeCl3 dosing to digester slurry ChemicalAdsorption to Fe2O3 pellets Physical-chemicalAbsorption with caustic solution "Absorption with iron solution "Absorption closed loop systems "Membrane separation PhysicalBiological filters BiologicalActivated carbon filtration Physical-chemicalMolecular sieves Physical
CO2 Pressure swing adsorption Physical-chemicalMembrane separation PhysicalAbsorption techniques Physical-chemical
1) The H2S content can be reduced by adding a small amount of air at the end of the digestion process.

anaerobic digestion of manure and solid organicwastes, which are currently undergoing new developments and rapid expansion.
4.6.2 Anaerobic digestion of manureThe Danish Biogas Programme [57] is an excellent example of what can be achievedthrough an ambitious and consistent governmentpolicy and is therefore discussed in some detailhere. In Denmark 20 centralised biogas plants areoperational for treatment of animal manure [58],[59], [60]. The plants mostly employ thermophi-lic co-digestion (52-53 ºC) with approx. 25%organic wastes mainly from food processingindustries. These include animal wastes such asintestinal contents (27%), fat and flotation sludgefrom food or fodder processing (53%) and wastesfrom fruit & vegetable processing, dairies andother industries. In the biogas plants manure andorganic waste are mixed and digested for 12-25days. The biogas is utilised for combined heat andpower generation. Heat is usually distributed indistrict heating systems, while electricity is sold tothe power grid. The digestate is returned to thefarms for use as fertiliser. In 1998 a total of 1Million tonnes of manure (slurry) were treated incentralised biogas plants and 325,000 tonnes ofother wastes, yielding a total of 50.1 Million m3
biogas at an average gas yield of 37 m3 per m3 ofbiomass [59]. Whereas the normal yield is 20 m3
of biogas per m3 of manure slurry, co-digestionthus adds considerably to biogas production andeconomic feasibility. Techno-economic data for 6centralised biogas plants in Denmark [59] aresummarised in Table 7.
The development of centralised biogas plants inDenmark was made possible in a framework ofgovernmental renewable energy policy, economicincentives and legislative pushes. The latter inclu-de the obligation for a 6-9 month manure storagecapacity, restrictions on manure application onland and on landfilling of organic wastes.Economic incentives include government invest-ment grants, low interest rate long-term loans (20years), energy tax exemptions and subsidies onelectricity produced from biogas (DKK 0.27 orEuro 0.04 /kWh in 1998; [58]). Another impor-tant factor is that heat sales are possible throughwidely available district heating networks for 6-9
months per year. The plants are operated mostlyby co-operatives involving farmers, municipalitiesand/or private organisations. The investment costs for the 6 plants in Table 7(including digesters, storage, transport vehiclesand CHP units) range between Euro 870–1,265/m3 digester capacity (average: Euro 1,070/m3)and Euro 48 - 87/tonne processing capacity (average: Euro 65/tonne). This value is low ascompared to e.g. a recently built manure proces-sing biogas plant in The Netherlands (25,000 ton-nes/year; Euro 160/tonne). The larger scale of theplants (70,000-140,000 tonnes/year) and limitedinvestments for wastewater treatment possiblycauses the lower specific investments of theDanish plants. The digested slurry of the Danishplants is returned to the farmers as organic fertili-ser, while for the Dutch plant further processing isapplied.The net energy production of the six plants inTable 7 (producing a total of 23.5 million Nm3
of biogas/year) is estimated at 29,900 MWhe electricity/year and 170 TJ heat/year. The totalinvestment costs per kWe electricity (estimatedfrom Table 7) is around Euro 9,000/kWe. This ishowever an overestimation because the plantsproduce heat as well. The total biogas productionin centralised plants in Denmark [59] is approx.50 million Nm3/ year with an estimated electrici-ty generation of 63,600 MWhe/year and 360,000TJ /year of heat.In 1998 most of the operational Danish plantsproduced an income at or above the break-evenlevel [58]. The income consists of energy sales andgate fees minus operating costs. The total treat-ment costs (manure and additional wastes) fortransport and anaerobic digestion are aroundEuro 8/m3 with an income of Euro 7/m3 fromenergy sales [60]. Approximately half of the inco-me for energy sales is derived from subsidies(exemption of energy taxation, refunding system).The net treatment costs are Euro 1.4/m3 [60].Economic feasibility depends on the co-digestionof food processing wastes, both through theenhanced biogas production and gate fees chargedfor industrial wastes of Euro 7-13 m3. Accordingto [60] this is highly competitive –under Danishconditions– with incineration including wastedeposit tax (Euro 54-74/tonne) and composting(Euro 40-50/tonne).
- 81 -
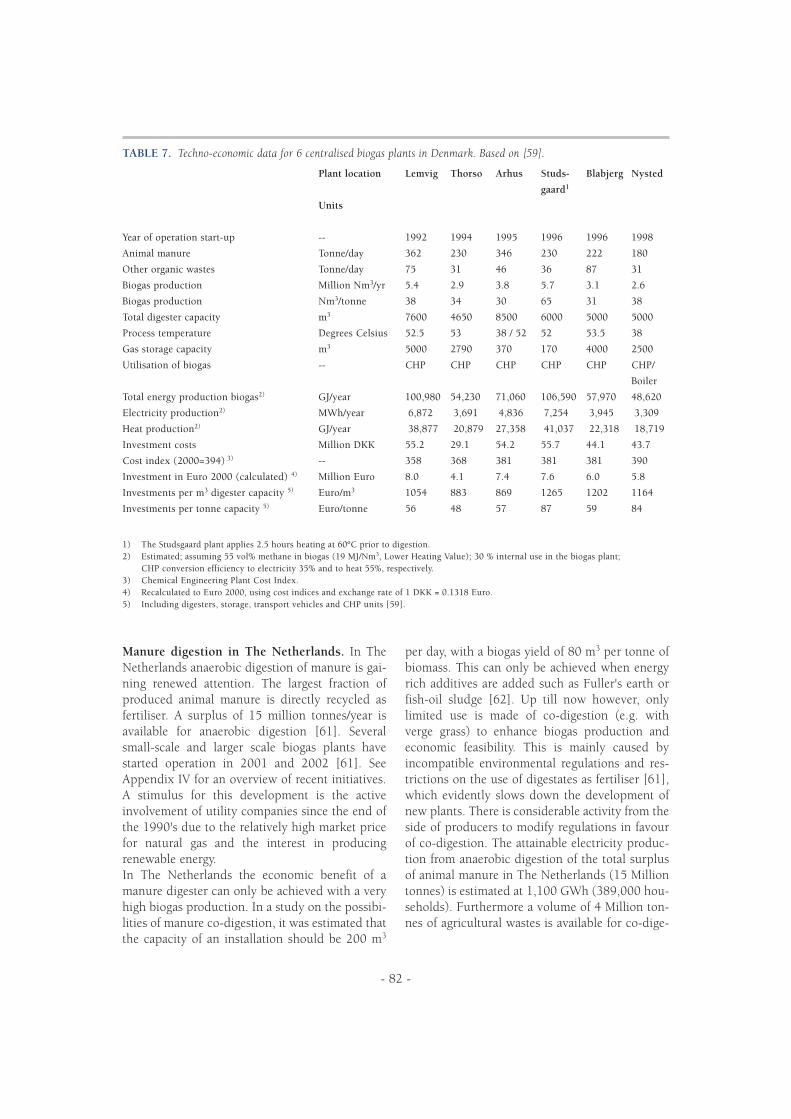
Manure digestion in The Netherlands. In TheNetherlands anaerobic digestion of manure is gai-ning renewed attention. The largest fraction ofproduced animal manure is directly recycled asfertiliser. A surplus of 15 million tonnes/year isavailable for anaerobic digestion [61]. Severalsmall-scale and larger scale biogas plants havestarted operation in 2001 and 2002 [61]. SeeAppendix IV for an overview of recent initiatives.A stimulus for this development is the activeinvolvement of utility companies since the end ofthe 1990's due to the relatively high market pricefor natural gas and the interest in producing renewable energy. In The Netherlands the economic benefit of a manure digester can only be achieved with a veryhigh biogas production. In a study on the possibi-lities of manure co-digestion, it was estimated thatthe capacity of an installation should be 200 m3
per day, with a biogas yield of 80 m3 per tonne ofbiomass. This can only be achieved when energyrich additives are added such as Fuller's earth orfish-oil sludge [62]. Up till now however, onlylimited use is made of co-digestion (e.g. withverge grass) to enhance biogas production andeconomic feasibility. This is mainly caused byincompatible environmental regulations and res-trictions on the use of digestates as fertiliser [61],which evidently slows down the development ofnew plants. There is considerable activity from theside of producers to modify regulations in favourof co-digestion. The attainable electricity produc-tion from anaerobic digestion of the total surplusof animal manure in The Netherlands (15 Milliontonnes) is estimated at 1,100 GWh (389,000 hou-seholds). Furthermore a volume of 4 Million ton-nes of agricultural wastes is available for co-dige-
- 82 -
TABLE 7. Techno-economic data for 6 centralised biogas plants in Denmark. Based on [59].
Plant location Lemvig Thorso Arhus Studs- Blabjerg Nysted
gaard1
Units
Year of operation start-up -- 1992 1994 1995 1996 1996 1998
Animal manure Tonne/day 362 230 346 230 222 180
Other organic wastes Tonne/day 75 31 46 36 87 31
Biogas production Million Nm3/yr 5.4 2.9 3.8 5.7 3.1 2.6
Biogas production Nm3/tonne 38 34 30 65 31 38
Total digester capacity m3 7600 4650 8500 6000 5000 5000
Process temperature Degrees Celsius 52.5 53 38 / 52 52 53.5 38
Gas storage capacity m3 5000 2790 370 170 4000 2500
Utilisation of biogas -- CHP CHP CHP CHP CHP CHP/
Boiler
Total energy production biogas2) GJ/year 100,980 54,230 71,060 106,590 57,970 48,620
Electricity production2) MWh/year 6,872 3,691 4,836 7,254 3,945 3,309
Heat production2) GJ/year 38,877 20,879 27,358 41,037 22,318 18,719
Investment costs Million DKK 55.2 29.1 54.2 55.7 44.1 43.7
Cost index (2000=394) 3) -- 358 368 381 381 381 390
Investment in Euro 2000 (calculated) 4) Million Euro 8.0 4.1 7.4 7.6 6.0 5.8
Investments per m3 digester capacity 5) Euro/m3 1054 883 869 1265 1202 1164
Investments per tonne capacity 5) Euro/tonne 56 48 57 87 59 84
1) The Studsgaard plant applies 2.5 hours heating at 60ºC prior to digestion.2) Estimated; assuming 55 vol% methane in biogas (19 MJ/Nm3, Lower Heating Value); 30 % internal use in the biogas plant;
CHP conversion efficiency to electricity 35% and to heat 55%, respectively.3) Chemical Engineering Plant Cost Index.4) Recalculated to Euro 2000, using cost indices and exchange rate of 1 DKK = 0.1318 Euro.5) Including digesters, storage, transport vehicles and CHP units [59].

stion, which could generate an additional 470GWh of electricity, for 159,000 households [61]. A regional installation for anaerobic digestion andfurther processing of pig manure is operational inElsendorp, The Netherlands since 2001. Thisinstallation processes 25,000 tonnes of pig manu-re per year and produces 1.6 Million kWh of elec-tricity (sufficient for 500 households), 7,500 ton-nes of mineral concentrates for use as substitutefertiliser and 17,500 tonnes of clean water. Thegate fee for manure is Euro 16-18/m3, which issimilar to alternative manure treatment options[61]. Biogas plant 'De Scharlebelt' at Nijverdalstarted operation in 2002 [63]. This plant has acapacity of 25,000 tonnes/year (70 tonnes/day)and makes use of thermophilic (50 ºC) co-dige-stion of pig manure and verge grass. The totaldigester capacity is 1,500 m3. The total invest-ment costs were Euro 4 Million (or Euro160/tonne processing capacity and Euro 6,700/kWe) including storage, CHP unit (600 kWe) andmembrane filtration units for effluent post treat-ment and production of mineral concentrates.The digestate is mechanically separated into a‘humus’ fraction and a liquid fraction, which isprocessed further by means of ultrafiltration andreverse osmosis to produce mineral concentratesand clean water. The biogas is used for the processand the generation of 3 Million kWh of electricityper year (1,000 households). In [64] the invest-ment costs per kWe for biogas plants producing(only) electricity from animal wastes is estimatedat Euro 4,400–6,600/kWe (recalculated to Euro2000) for a 1 MWe plant.The cost of biogas produced in small-scale (80m3) manure digesting systems on farm level inThe Netherlands is estimated at Euro 19/GJ basedon data in [38]. Through the use of larger scalesystems and economic optimisation a cost reduc-tion to approx. Euro 9/GJ is considered feasible.Calculations based on data from the USA [65]even suggest a possible future biogas cost of Euro5/GJ for large-scale farms.
4.6.3 Anaerobic digestion of solid biowastes
The main competitors for anaerobic digestion ofsolid wastes are landfilling and composting. Due
to legislation landfilling is already restricted insome countries. Since the European Union is stri-ving towards a substantial reduction of landfillingin the near future1, composting remains as themain competitor on the longer term. Organic resi-dues from agricultural industry, nowadays used asanimal feed, could become available for anaerobicdigestion in the future.Composting is a widely used technique, offering aroute for recycling organic matter and nutrientsfrom the organic fraction of municipal solid wasteand other biowastes. Composting is however anenergy consuming process (approximately 30-35kWh is consumed per tonne of input waste),while anaerobic digestion is a net energy produ-cing process (100-150 kWh per tonne of inputwaste) [14]. This evidently makes anaerobic digestion the preferred processing route because itproduces renewable energy (biogas) whilenutrients are preserved for recycling as well. In a1994 IEA study [66] the economics of municipalsolid waste treatment in The Netherlands by com-posting and anaerobic digestion were comparedbased on a 1992 study by Haskoning. The analy-sis showed somewhat higher treatment costs foranaerobic digestion (Euro 80-35/tonne for a capacity range of 20,000-120,000 tonne/year)than for composting (Euro 60-30/tonne). Thestudy concludes that co-digestion with animalmanure could lead to significantly lower costs andthat the cost difference between composting andanaerobic digestion is very sensitive to the valueof the produced electricity [66]. This illustratesthe significance of financial incentives for renew-able energy production as a tool for enhancing thecompetitiveness of biogas plants. Similar cost estimates are provided in [67] for anaerobic dige-stion of source separated organic fraction of muni-cipal waste (SS-MSW) and mixed waste (MW;separated at the plant) in North America. Thecapital cost of an SS-MSW facility varies betweenUS $ 635 and $ 245/tonne of design capacity forplants between 10,000 and 100,000 tonnes/year.The capital cost of mixed waste facilities is higherbecause of the need for a sorting system and ran-ges between $ 690 and $ 265/tonne. The projec-ted, net annual costs (incl. capital and operatingcosts, labour and revenues from the sale of biogas
- 83 -
1 In the proposed EC Landfill Directive the targets for landfilling (relative to the 1993 situation) are reductions to 50% (2005) and 25%(2010) respectively.

and cured digestate for soil conditioning) rangebetween $ 107 and $ 46/tonne for SS-MSW plantsand $ 135 - $ 63/tonne for MW plants in the10,000 to 100,000 ton/year capacity range [67].The higher costs of anaerobic treatment in com-parison to aerobic composting of solid waste aresubscribed to the cost of the required water treat-ment in anaerobic digestion plants in [68]. Thelatter reference describes a model, consisting oftwo layered economic and technical sub-models.The results of model calculations indicate that fullanaerobic treatment is indeed higher in costs thanaerobic composting. Lowest costs are achieved atcombined anaerobic/aerobic treatment. Suchcombined treatment systems are more competiti-ve though the net gas yield will be somewhatlower. Only drastic increases in energy prices oreco-tax would move the system with minimumcosts to more anaerobic conversion.
In [47] a detailed techno-economic evaluation isgiven for an anaerobic digestion system inGermany, processing 26,000 tonnes of fruit andvegetable waste and 4,000 tonnes of green wastesfrom parks. The biogas is converted in a CHP sys-tem to electricity and heat, which is partly usedfor the process, and an electricity surplus for
export to the grid (3,510 MWh/year). The totalinvestment of the plant (including CHP) is 13,2Million Euro (or Euro 440/tonne processing capa-city). The gross treatment costs were estimated atEuro 80/tonne and net at Euro 72/tonne includingsales of electricity. According to the study thesetreatment costs are competitive in the Germanmarket compared to modern composting systems[47]. The investments are similar for anaerobicdigestion plants for source separated organicwaste (SS-MSW) and agro-wastes in TheNetherlands which were estimated at Euro300/tonne capacity (excluding CHP) in the rangebetween 25,000 to 100,000 tonne/year [69].Assuming a 30% share of CHP in the investmentcosts the total installed costs (including CHP)would be around Euro 400/tonne processingcapacity. The average costs for anaerobic treat-ment of source separated organic fraction ofmunicipal waste in various systems (Biocel,Valorga, Dranco) were estimated at Euro 75/tonne excluding energy sales [69]. In TheNetherlands the composting costs are mainlydependent on the type of material, especially thedry matter concentration. For verge grass forexample the costs of composting are on the orderof Euro 50/tonne, while the composting costs for
- 84 -
Figure 17. Trends in treatment costs for anaerobic digestion of MSW and biowastes in Europe (ktpa = kilo tonne peryear) [42].
Plant Capacity ktpa
Gate
Fee
Eur
o/t
200
180
160
140
120
100
80
60
40
20
00v 20 40 60 80 100 120 140
1992
1994
1996
Power (1992)
Power (1994)
Power (1996)

woody materials may be somewhat lower i.e. Euro25-40/tonne. Comparison with the data providedabove shows that the costs of anaerobic digestionare still somewhat higher than for composting.
The trends in treatment cost in Europe per tonneof MSW and biowaste for different scales areshown in Figure 17. The figure clearly shows thatthe costs of anaerobic digestion are increasinglycompetitive with composting. Overlooking the international situation there areclear differences between countries in anaerobicdigestion plant costs as was shown in [70]. Thecost of biogas (per GJ) is highest for Austria andSwitzerland, while Germany and Italy are chea-pest [70]. The difference between these cheaperplants and more expensive ones has been redu-ced, due to higher gas yields from the latter.
Economic impacts of digestate utilisation andeffluent disposalThe disposal and/or re-use of digestates and liquideffluents originating from anaerobic digestionprocesses is an important economic issue for allbiogas programs. Deposition of liquid and otherorganic wastes in landfills will be phased out inthe near future in the EU. Evidently the recoveryand re-use of nutrients (N,P,K) is an importantadvantage of anaerobic digestion in addition tothe recovery of energy because it contributes indi-rectly to a reduction of greenhouse gas emissions(especially CO2 and N2O). In plants treating solidbiowastes and/or manure, the solid fraction is inmany cases mechanically separated from the pro-cess liquor and matured into a compost product.The market value of these compost type productsas a soil conditioner or fertiliser depends on thecompliance with the governing quality standardsespecially with respect to the concentration ofheavy metals, but also on the guarantee of apathogen and seed free product. For digestatesfrom the mechanically separated organic fractionof MSW (separation at the plant) the heavy metalcontent is a critical issue [66]. Digestates from theorganic fraction of source separated MSW cancomply with the quality standards much moreeasily. The digested slurry from manure (co-)digestionmay be recycled as fertiliser without much treat-ment, as is the case in the Danish biogas plants
[59]. The digestate is sufficiently sanitised in thethermophilic digestion and care is taken that indi-vidual farmers receive a balanced amount ofnutrients. Alternatively, the solid fraction of manure digestates may be recovered as a compost-type product while the remaining nutrients arerecovered in the form of re-usable mineral con-centrates by means of membrane or other techno-logy, as is the case in the new manure processingbiogas plants in The Netherlands [62], [63]. In thisapproach an acceptable water quality for dischargeor even re-use is achieved, but investment andmaintenance costs will increase considerably.Latter systems are mainly attractive for processingof excess manure, which cannot be used in thedirect environment of the farm. Dry minerals canbe transported over larger distances. In all proces-sing plants the remaining liquid effluents must bedisposed off. Discharge to external (communal orother) wastewater treatment plants may involveconsiderable costs for transport and treatmentcharges, depending on the effluent quality [71]. Inmany cases pre-treatment is required to reduceespecially BOD, COD, VFA and nitrogen/ammo-nia levels prior to disposal. To reduce these costsan on-site effluent post-treatment system may beadvantageous. Commonly used techniques include aeration, de-nitrification and reverseosmosis [71].
The role of financial incentives for renewableenergy productionAs discussed above, financial incentives in thecontext of renewable energy production play animportant role for enhancing the competitivenessof biogas plants, particularly versus composting.A recent overview [72] on the status and promo-tion of renewable energy in the EU countries pro-vides the following information relevant for bio-gas plants. The average investment costs for bio-gas plants for electricity generation have beenreduced from Euro 7,000–8,000/kWe (in 1990) toEuro 3,000-5,000/kWe (2000). The investmentcosts for electricity production from landfill gashave remained constant (Euro 1,000/kWe) overthe period 1980-2000. The costs for electricityproduced from biogas (2000) range between Euro0.1 and 0.22/kWh, while electricity from landfillgas is produced for Euro 0.04 - 0.07/kWh. Thereview also provides an overview of promotion
- 85 -

strategies in the EU [72]. These strategies include'voluntary approaches' such as 'green electricitytariffs' paid by consumers and 'green labels'.Furthermore a number of regulatory, price drivenstrategies are in place in the EU either 'investmentfocused' (tax rebates and incentives) or 'genera-tion based'. A widely used form of the latter is the'feed-in tariff', which is the price per unit of elec-tricity that a utility or supplier has to pay for rene-wable electricity to private generators ('produ-cers'). In 2000 the highest feed-in tariffs for elec-tricity from biogas and landfill gas were in force inAustria (up to Euro 0.12/kWh), Germany (up toEuro 0.1/kWh), Denmark (Euro 0.08/kWh) andGreece (Euro 0.06/kWh) [72]. As discussed beforethe biogas program in Denmark has been success-ful through a combination of legislative measuresand financial incentives (tax exemp-tion, invest-ment subsidies). Similarly, the rapid expansion of biogas plants for (especially) manure digestion in Germany in recent years has beengreatly stimulated by financial incentives that areguaranteed for long periods (20 years).
4.6.4 ConclusionsFrom this section the following conclusions canbe drawn. Small-scale decentralised biogas plants(e.g on a farm level) can be economically feasiblethrough savings on energy costs and sales of sur-plus electricity. Larger-scale centralised biogasplants for (co-)digestion of manure (with or with-out further processing) and/or bio-wastes andmunicipal solid waste require gate fees for econo-mic viability and depend to a larger extent onsales of energy and other products, such as miner-al concentrates or digestates for use as fertiliser.Therefore, in the foreseeable future, gate fees willremain an important element for economic feasi-bility of larger scale centralised biogas plants.Economic feasibility of larger biogas plants can beoptimised through continued technology deve-lopment including the enhancement of biogasproduction (co-digestion, pre-treatment) and areduction of capital investments and operatingcosts. The past decades have already seen sub-stantial improvements in these two fields.Important elements for enhancing overall econo-mic feasibility for solid waste and manure proces-sing units with anaerobic treatment as the core-technology, are the development of cost effective
technologies for effluent post treatment and reco-very of mineral concentrates. The combinedanaerobic treatment/ aerobic composting of solidwaste could be applied to reduce the cost of addi-tional water treatment. Treatment of wastes in biogas plants is nearingcompetitiveness towards composting, which willstrongly increase renewable energy production.On the short and medium term legislative andfinancial incentives are an important driver foreconomic feasibility of biogas plants of all scales.Several measures are already in place includingthe reduction of landfill deposition and financialincentives in the context of renewable energy poli-cy. Continuation and broadening of support forbiogas plants is logical because anaerobic diges-tion clearly offers advantages over composting,landfilling and incineration in the form of renew-able energy production, reduction of greenhousegas emissions and the possibility for full re-use ofnutrients. It is evident that government programs aimed atincreasing the share of renewable energy andgreenhouse gas reduction will have an importantimpact on the expansion of anaerobic digestion.
4.7 International status of anaerobic digestion
Worldwide, more than 125 anaerobic digestionplants are in operation using municipal solidwaste or organic industrial waste as their principalfeedstock. Their total annual processing capacityis over five Million tonnes, with a potential ofgenerating 600 MW of electricity [42].Throughout the world, more than 1,300 vendor-supplied systems are in operation or under con-struction for the treatment of sewage sludge [42].More than 2,000 anaerobic systems are also inoperation for the treatment of industrial wastewa-ter and landfill leachates [26]. Anaerobic diges-tion systems currently operational in Europe havea total capacity of 1,500 MW, while the potentialfor 2010 is estimated at 5,300-6,300 MW.Worldwide installed capacity could reach up to20,000 MW by 2010 [64,77] (Figure 18).Deployment rates are the highest in Asia, due togovernmental programs in China an India inclu-ding the construction of millions of small-scaledigesters. A rapid expansion of anaerobic diges-
- 86 -

tion is expected, especially in developing coun-tries, where there is a demand for low cost, reliableplants, which can be locally manufactured [64].
Although anaerobic digestion is a proven techni-que for a variety of waste streams, there are somebarriers to expanded and commercialised biogasproduction. The most important barriers to over-come are listed in a study on viable energy pro-duction and waste recycling from anaerobic diges-tion of manure and other biomass materials [73]:• Energy prices and access to energy markets• Poor data on economics• Low energy yield
• Bad reputation due to unsuccessful plants• Lack of information about environmental,
agricultural and other non-energy advantages• Lack of co-operation between relevant
sectors/parties• Legal obstacles
In The Netherlands most renewable energy is deri-ved from incineration of organic waste, while only9% originates from controlled anaerobic digestion(Table 8 and Figure 19). Not all substrates are sui-table for digestion, for example, only the organicpart of MSW is suitable, and the digestion of largeamounts of wood is also not possible. There are
- 87 -
25000
20000
15000
10000
5000
0
1995 2000 Year
Inst
alle
d ca
paci
ty (M
W)
2005 2010
EU
World
Figure 18. Deployment of anaerobic digestion and estimate of future potential. Adapted from [64, 77].
TABLE 8. Total amount of energy produced from biomass in The Netherlands in 1998. The number of installations wasapprox. 1,170. [74].
UnitConsumed by installations Electric power 518 MW
Heat 18,665 MWAvoided amount of primary fossil fuel Waste incineration 23.3 PJ
Wood incineration 9.3 PJLandfill gas 2.1 PJAnaerobic Digestion 3.6 PJTotal 38.3 PJ
Delivered as Electricity 2,743 GWhNatural gas 1.9 PJHeat 12.0 PJ
Avoided CO2 emission 2,451 Ktonne

- 88 -
sources, which undergo a less favourable treat-ment in terms of energy consumption, for whichcontrolled anaerobic digestion would be anoption. Nowadays most of organic municipalwaste (VFY) is composted. Part of the domesticsewage sludge is incinerated without prior diges-tion. The amount of energy generation from wasteis increasing over the years, but the amount con-tributed by anaerobic digestion remains approxi-mately the same (Figure 19).
Only 2% of biogas produced originates from VFY,as there are only two large plants digesting sepa-
rated VFY and only one plant (Vagron,Groningen) that treats the organic fraction ofMSW in The Netherlands (Figure 20). A secondplant (located in Heerenveen) for treating theorganic fraction of MSW is currently commencingoperation. The contribution of manure digestionis thus far very low (approximately 2%) but isexpected to increase in the near future. A combi-nation of these types of waste streams (co-diges-tion) can lead to higher biogas production [62].As The Netherlands produces a large amount ofmanure (Table 10) co-digestion would be a pro-mising technique.
TABLE 9. Gas production and energy generation from anaerobic digestion in The Netherlands in 1996 [74].
Number of installations Ca. 225
Used by installations Electrical power 21 MWHeat 42 MW
Gas production Total 280 million m3
Sewage treatment 191 million m3
Industry 78 million m3
Manure 5 million m3
VFY 5 million m3
Delivered as Electricity 106 GWhHeat 0.8 PJNatural gas 1.2 PJ
Saved primary energy 3.1 PJAvoided CO2 emission 141 ktonne
Figure 19. Total amount of energy produced from biomass in The Netherlands over the years 1989-1998 [74].
40
1989
Avoi
ded
use
of fo
ssil
fuel
(PJ)
Year
35
30
25
20
15
10
5
1990 1991 1992 1993 1994 1995 1996 1997 19980
Waste incineration Landfill gas Digestion Wood incineration

- 89 -
Industry28%
VFY2%
Manure2%
Sewagetreatment(sludge)
68% Heat33%
Substitutionnatural gas
50%
Electricity17%
Figure 20. Contribution of different substrates to biogasproduction (280 million m3) in The Netherlands in 1996.
Figure 21. Utilisation of the biogas produced in The Netherlands in 1996 [74].
Organicbiological
75%
Wood8%
Paper13%
Synthetic4%
Organic sludge18%
Other69%
Inorganic sludge18%
Division of organic waste from industry in 1998 in The Netherlands. Total amount organic waste: 3,970 ktonne.
Division of sludge produced by industry in 1998 in TheNetherlands. Total amount of sludge: 1,419 ktonne.
Figure 22. Organic solid waste from industry in The Netherlands in 1998.
Figure 23. Produced water treatment sludge from industryin The Netherlands in 1998.
TABLE 10. Total manure production in The Netherlands in the period 1994-2000 [75].
Year Total produced manure (organic matter). Excluding meadow manure.In kg*1,000
1994 4,208,7391995 4,263,7201996 4,206,7801997 4,125,6361998 4,075,1871999 4,039,9652000 3,906,441
The realisation of 'centralised' treatment facilitieswill require additional infrastructure, as manurehas to be collected from the farm and returned
after treatment to the farm for use as fertiliser. Inorder to prevent the spreading of disease, treat-ment should include the removal of pathogens bye.g. thermophilic treatment. Potential feedstocks for anaerobic digestion inThe Netherlands are summarised in Table 11. Atthe moment of the 1,457,000 tonnes of VFY pro-duced each year in The Netherlands, approxima-tely 102,000 tonne is digested and 1,355,000tonne is treated by other means. Anaerobic treat-ment of the latter amount could produce 15-23MW of electricity assuming that one tonne of bio-waste can produce approximately 100-150 kWh.Based on the VAGRON process, operating at52ºC, the amount of potential electricity produc-tion is 18 MW, accounting for heat loss, electricalconversion and consumption by the plant.

- 90 -
TABLE 11. Possible sources for anaerobic digestion for the generation of methane in The Netherlands [62], updatedwith values (*) for 2000 [75]
Source
Municipal wasteMarket gardening
Maintenance greeneryMaintenance ditches/canals Flavour industry
Onion processing industry Vegetable proc. Industry Fruitproc. IndustryPulp and paper IndustrySlaughterhouses
Dairy industry
Fish proc. Industry
Oil and grease industryStarch and fodder industryTrade/services/etc.Catering/homes/etc.Other industrial treatment plants
TOTAL
Waste stream
VFYStalks/leafWithdrawn vegetablesTomato-stalksWithdrawn fruitWithdrawn ornamental plantsCabbage leafChicory wasteRoadside grassWasteOrganic wasteSlurry from onion oilFilter bedSorting wasteOrganic biologicalActivated sludge(primary) sludgesludge grease catcherflotation sludgeslaughter waste/blood/hairunborn manurepurification sludgeorganic biologicalpurification sludgeorganic biologicalFuller's earthPurification sludgeOrganic biologicalOSS-waste 1)
Swill 2)
Purification sludge
Production(tonne/year)
*1,457,000231,500
51,00045,00021,000
485100,000
87,500600,000150,000110,000
11,5004,000
60,000*4,806,000
*3,000*330,000
10,000*44,000
*617,00095,000*8,000
*129,000*1,000
*31,00015,000
*20,000*2,674,000
290,000107,800
1,600,000
14,194,300
Dry matter(%)
3015
6.515121018205012
99
5013
4055
100
15100100
205-7
Ash content(%)
3510
919
510111020
51015
5
15
28
1) organic fraction of office, shops and services waste, like canteen waste2) organic waste of catering industry and kitchens of homes, barracks, etc

Another potential source for anaerobic digestionis solid waste from industry. In the Food andBeverage industry, producing most organic waste,solid organic waste streams or slurries are mostlyused as fodder. The amount of organic waste fromindustry can be seen in Figure 22 and Figure 23.
4.8 Conclusions and perspectives for further development
Anaerobic digestion is a proven technique and atpresent applied to a variety of waste (water) streams but world wide application is still limitedand a large potential energy source is being ne-glected. Moreover some potential sources, whichare now treated otherwise, are an excellent sub-strate for anaerobic treatment and could contribu-te to renewable energy production rather thanconsuming energy during treatment.
Although The Netherlands is a leading country inthe application of anaerobic treatment of indus-trial and agricultural wastewater, the anaerobicdigestion of slurries and solid waste for energyproduction is scarcely applied. In other Europeancountries like Germany, Austria, Switzerland andDenmark hundreds of installations are currentlyin operation, showing that technical obstacles andbarriers have been overcome. The limited applica-tion of anaerobic digestion for energy productionfrom slurries and solid wastes in The Netherlandscan, amongst others, be contributed to relativelylow natural gas prices. An important difference ismoreover the widespread application of co-diges-tion in other European countries, which signifi-cantly improves the economic efficiency of ananaerobic digestion system by increasing the gasproduction per m3 reactor content. In TheNetherlands, co-digestion is thus far restricteddue to legislation. Nowadays a limited range ofsubstrates, mainly plant material, is allowed forco-digestion. However the addition of high-ener-gy substrates like lipids, slaughterhouse wastes orfish-wastes, to manure digesters could substan-tially increase the gas yield and therefore the eco-nomical feasibility of manure digestion. Whereco-digestion is applied on a larger scale a largesustainable energy potential becomes available.
Small-scale decentralised biogas plants (e.g. on a
farm level) can be economically feasible throughsavings on energy costs and sales of surplus elec-tricity. Larger-scale centralised biogas plants for(co-) digestion of manure (with or without furtherprocessing) and/or bio-wastes and municipal solidwaste require gate fees for economic viability anddepend to a larger extent on sales of energy andother products, such as mineral concentrates ordigestates for use as fertiliser. Maximising the saleof all usable co-products will thus influence theeconomic merits of an anaerobic treatment sys-tem. In the foreseeable future, gate fees willremain an important element for economic feasi-bility of larger scale biogas plants. Economic feasi-bility can be optimised through continued tech-nology development including the enhancementof biogas production (co-digestion, pre-treat-ment) and a reduction of capital investments andoperating costs. In the short and medium term legislative andfinancial incentives are an important driver foreconomic feasibility of biogas plants. Besides this,legislation can contribute to a formal considera-tion of the true cost of various energy options.Several measures are already in place includingthe reduction of landfill deposition and financialincentives in the context of renewable energy poli-cy. The government now stimulates anaerobicdigestion of slurries, as it provides 'green energy'.Another aspect, especially related to the applica-tion of controlled anaerobic digestion of animalmanure, is the reduction of spontaneous methaneemissions that occur during storage of raw manure. In The Netherlands, a large governmentalprogram aimed at the prevention emission of non-CO2 greenhouse gases such as CH4 stimulates(among others) the application of animal manuredigestion.
The trend in treatment costs in Europe per tonneof MSW and biowaste for different scales showsthat the costs of anaerobic digestion are increas-ingly competitive with composting. Importantelements for enhancing overall economic feasibili-ty of solid waste and manure processing unitswith anaerobic treatment as the core-technology,are the development of cost effective technologiesfor effluent post treatment and recovery of mine-ral concentrates. Combined anaerobic treatment/aerobic composting of solid wastes could be
- 91 -
applied to reduce the cost of additional watertreatment, though lower gas yields will be theresult.
The development of anaerobic conversion techni-ques has shown that more and more substrates,which originally were not considered for anaero-bic treatment, are anaerobically digested today.Diluted, low temperature streams or wastewaterwith high temperatures and wastewater with toxicand/or xenobiotic components appear to be suita-ble for anaerobic treatment and lead to stable endproducts. Anaerobic treatment is a proven techni-que from an environmental and economic view-point. The technology is relatively new, and inmany countries application is still in an initialphase. It is of utmost importance to establishdemonstration projects in many parts of the worldto show the environmental and economic benefitsand provide the necessary confidence in the tech-nique. Once demonstrated, anaerobic treatmentwill become its own advertisement.The application of anaerobic treatment of domes-tic sewage is so far limited to tropical countries.Large UASB systems are being applied for thispurpose in Asia and South America. Recently thefirst UASB system for domestic sewage in Africawas installed in Ghana. In low and medium tem-perature regions the technique is not applied inpractice. New developments in high rate anaero-bic treatment systems can lead to wider applica-tion of anaerobic treatment of conventionally col-lected domestic sewage even at low temperatures.The strong dilution of domestic sewage in the pre-sent collection and transport system of domesticsewage is one of the main difficulties, especially atlow temperature conditions. Considering thecomposition and concentration of the variouswaste steams produced in the household, illustra-tes the possibilities of applying new sanitationconcepts to enable reuse of energy, water and fer-tiliser values. Nearly three billion people in theworld do not have effective sanitation at their dis-posal. The central sanitation systems developed inthe industrial world are too expensive and toocomplex to be used world wide. In November2000, the technical expert consultation on‘Appropriate and Innovative WastewaterManagement for Small Communities in EMR coun-tries’, organised by the World Health Organisation
(WHO) in Amman, Jordan concluded that:‘Decentralised Sanitation and Reuse (DeSaR) is theonly achievable and environmentally friendlyoption for countries in the Middle East region.’
The DeSaR concept [76] focuses on the separatecollection, transportation and decentralised pro-cessing of concentrated domestic waste streams(faeces plus urine or ‘night soil’ and kitchenwaste) and the diluted wastewater streams (‘greywater’). Faeces, urine and kitchen waste containpotential energy, which can be recovered byanaerobic digestion, and -in addition- nutrientswhich can be recovered for use as agricultural fer-tiliser. Here lies an important key that, with theimplementation of DeSaR will allow the energyand nutrient cycle to be closed. The introductionof DeSaR means the transition to a new paradigm.This transition can only become successful whenstimulated by governments via for exampledemonstration projects in new housing estates orlarge buildings.
4.9 Abbreviations
AF Anaerobic FilterAFFR Anaerobic Fixed Film ReactorAC Accumulation reactorBOD Biological Oxygen Demand (mg O2/l)COD Chemical Oxygen Demand (mg O2/l)CSTR Continuously Stirred Tank ReactorDeSaR Decentralised Sanitation and Re-useEGSB Expanded Granular Sludge BedF&B Food and BeverageFOG Fat, Oil and Grease (mg/l)HRT Hydraulic Retention Time (hours or days)IC Internal Circulation reactorMSW Municipal Solid WasteOSS-waste Organic fraction of Office, Shops and
Services wasteOWF Organic Waste Fractionp.e. population equivalentP&P Pulp and PaperRDF Refuse Derived FuelSRT Sludge Retention Time (hours or days)SS-MSW Source Separated Municipal Solid WasteSTP Sewage Treatment PlantTS Total Solids (mg/l) or (%)TSS Total suspended solids (mg/l)TVS Total Volatile Solids (mg/l)
- 92 -

UASB Upflow Anaerobic Sludge BedVFA Volatile Fatty Acids (mg/l)VFY Vegetable, Fruit and Yard Waste VS Volatile Solids (mg/l) or (%)VSS Volatile Suspended Solids (mg/l)
4.10 References
1. Lettinga, G., L.W. Hulshoff-Pol, and G. Zeeman, Lecture notes: Biological Wastewater Treatment; Part I Anaerobic Wastewater Treatment. 1999, Wageningen University and Research: Wageningen, The Netherlands.
2. Lettinga, G. and A.C. Haandel, Anaerobic digestion for energy production and environmental protection, in Renewable energy; Sources for fuels and electricity, T.B. Johansson, et al., Editors. 1993, Island press, California: London. p. 817-839.
3. Sanders, W., Anaerobic Hydrolysis during digestion of complex substrates. PhD-thesis, 2001. Sub-department of Environmental Technology. Wageningen University and Research Center, Wageningen, The Netherlands.
4. Miron, Y., G. Zeeman, J.B. van Lier , G. Lettinga, The role of sludge retention time in the hydrolysis and acidification of lipids, carbohydrates and proteins during digestion of primary sludge in CSTR systems. Water resources, 2000. 34(5): p. 1705-1713.
5. Zeeman, G. and G. Lettinga, The role of anaerobic digestion of domestic sewage in closing the water and nutrient cycle at community level. Water Science and Technology, 1999. 39(5): p. 187-194.
6. Gerbens, S. and G. Zeeman, Cost-effective methane and nitrous oxide emission reduction technologies for animal waste, 1999. Wageningen Agricultural University: Wageningen, The Netherlands.
7. Zeeman, G., Mesophilic and psychrophilic digestion of liquid manure, Sub-department of Environmental Technology. 1991, PhD-thesis, Wageningen University and Research: Center, Wageningen.
8. Southampton-University, Anaerobic digestion of solid wastes.2001, University of Southampton.
9. Waybright, R.C., On-farm utilization of animal wastes. 1991, Philadelphia Society for promoting agriculture.
10. Bruce, A.M. Stabilization of sewage sludges and liquid animal manures by mesophilic anaerobic digestion-an overview. in Processing and use of organic sludge and liquid agricultural wastes. 1985. Rome, Italy.
11. Hayes, T.D., W.J. Jewell, S. Dell'Orto, K.J. Fanfoni, A.P. Leuschner and D.F. Sherman, Anaerobic digestion of cattle manure, in Anaerobic digestion, D.A. Stafford, B.I. Wheatley, and D.E. Hughes, Editors. 1979.
12. Bruins, W.J., Biogas uit rundveemest. 1984, Publikatie,-Proefstation-voor-de-Rundveehouderij,-Schapenhouderij-en-Paardenhouderij. p. 15.
13. Zeeman, G., W.T.M. Sanders, and G. Lettinga, Feasibility of the on-site treatment of sewage and swill in large buildings.Water Science and Technology, 2000. 41(1): p. 9-16.
14. Braber, K., Anaerobic Digestion of Municipal Solid Waste: A modern waste disposal option on the verge of breakthrough.Biomass and Bioenergy, 1995. 9(1-5): p. 365-376.
15. Jong, H.B.A.d., W.F. Koopmans, and A.v.d. Kniff, Conversietechnieken voor GFT-afval; Ontwikkelingen in 1992. 1993, Haskoning, Novem and RIVM: Nijmegen, The Netherlands.
16. Vagron, http://www.vagron.nl/html/uk/procesvagron.htm. 2000.
17. Hjort-Gregersen, K., Sustainable Handling and Utilisation of
Manure and Organic Waste Resources: The Centralised Plant Approach. http://www.sjfi.dk, 2000.
18. Cadett, IEA, and OECD, Co-digestion of Manure with Industrialand Household Waste. Technical Brochure, 2000. No. 118.
19. Saint-Joly, C., S. Debois, and J.-P. Lotti, Determinant impact of waste collection and composition on anaerobic digestion performance: industrial results. Water Science and Technology, 2000. 41(3): p. 291-297.
20. Vandivere, P., et al. Biodiversity of solid waste digestors. in Anaerobic digestion for sustainable development; Papers of the Farewell seminar of Prof. dr. ir. Gatze Lettinga. 2001. Wageningen, The Netherlands.
21. Baere, L.D., Anaerobic Digestion of solid waste: state-of-the-art.Water Science and Technology, 2000. 41(3): p. 283-290.
22. Brummeler-ten, E., Dry anaerobic digestion of the organic fraction of Municipal Solid Waste, Sub-Department of Environmental Technology. 1993, PhD thesis, Wageningen University: Wageningen, The Netherlands.
23. Brummeler-ten, E., Full scale experience with the BIOCEL process. Water Science and Technology, 2000. 41(3): p. 299-304.
24. Gosh, S., et al. Pilot-scale gasification of MSW by high-rate and two-phase anaerobic digestion. in International symposium on Anaerobic Digestion of Solid Waste. 1999. Barcelona: Association Water Quality.
25. Zeeman, G. and W. Sanders, Potential of anaerobic digestion of complex waste(water). Water Science and Technology, 2001. 44(8): p. 115-122.
26. Frankin, R.J. Full scale experiences with anaerobic Treatment of Industrial Wastewater. in Anaerobic digestion for sustainable development; Papers of the Farewell seminar of Prof. dr. ir. Gatze Lettinga. 2001. Wageningen, The Netherlands.
27. Biothane, http://www.biothane.com/anaerobic.html. 2001.28. Driessen, W. and P. Yspeert, Anaerobic Treatment of Low,
Medium and High Strength Effluent in the Agro-industry. Water Science and Technology, 1999. 40(8): p. 221-228.
29. Chua, H. and J.P.C. Fung, Hydrodynamics in the packed bed of anaerobic fixed film reactor. Water Science and Technology, 1996. 33(8): p. 1-6.
30. Elmitwalli, T.A., Anaerobic treatment of domestic sewage at low temperature, 2000, PhD-thesis, Wageningen University: Wageningen, The Netherlands.
31. Cuwco, coordinatiecommissie uitvoering wet verontreiniging oppervlaktewateren; GFT-afvalverwerking, een inventariserende nota. 1994, CUWVO werkgroep VI: Den Haag, The Netherlands.
32. Fruteau-de-Laclos, H., S. Desbois, and C. Saint-Joly, AnaerobicDigestion of Municipal solid organic waste: valorga full-scale plant in Tilburg, The Netherlands. Water Science and Technology, 1997. 36(6-7): p. 457-462.
33. Vagron, Energy and mass balance. 2001, http://www.vagron.nl/html/nl/massa.htm.
34. Heidemij, Biocel, droge vergisting van vaste afvalstoffen (450 m3
pilot-installatie te 't Zand). 1992, Novem, Nederlandse maatschappij voor Energie en Milieu BV, RIVM, Rijksinstituut voor Volksgezondheid en Milieuhygiëne: Arnhem, The Netherlands.
35. ad-nett, Status of Anaerobic Digestion for Animal Waste in The Netherlands. 1997, http://www.ad-nett.org/html/netherlands.html.
36. Schomaker, A.H.H.M., Centrale zuivering van kalvergier met terugwinning van waardevolle bestanddelen. 1987, vakgroep Milieutechnologie, Landbouwuniversiteit Wageningen: Wageningen, The Netherlands.
37. Velsen, A.M.F., van, Anaerobic digestion of piggery waste. 1981, PhD-thesis, Wageningen University: Wageningen, The Netherlands.
- 93 -

38. Nijssen, J.M.A., S.J.F. Antuma, and A.T.J.v. Scheppingen, Perspectieven mestvergisting op Nederlandse Melkveebedrijven.Vol. 122. 1997, Lelystad: Praktijkonderzoek Rundvee Schapen en Paarden (PR).
39. Schomaker, A., Extra vergistingsstap van zuiveringsslib veel-belovend voor grotere rioolwaterzuiveringen. 2001, Royal Haskoning.
40. Haskoning, Optimalisatie energiehuishouding slibgistingsinstal-laties; Verhoging van de gasproduktie door verbetering van de menging. Novem rapport in het kader van EWAB-programma, nr. 9431. 1994, Nijmegen: Haskoning B.V.
41. Lexmond, M.J. and G. Zeeman, Potential of controlled anaerobic wastewater treatment in order to reduce the global emissions of the greenhouse gases methane and carbon dioxide.1995, University of Wageningen: Wageningen, The Netherlands.
42. IEA, Biogas and More!; Systems and Markets Overview of Anaerobic digestion. 2001, International Energy Agency (IEA).
43. Mahmoud, N.J.A., Anaerobic pre-treatment of sewage under low temperature (15°C) conditions in an integrated UASB-digester system, Sub-Department of Environmental Technology. 2002, PhD-thesis, Wageningen University: Wageningen, The Netherlands.
44. Haandel, A.v. and G. Lettinga, Anaerobic sewage treatment: A practical guide for regions with a hot climate. 1994, England: Wiley Publishers.
45. Kujawa-Roeleveld, K., G. Zeeman, and G. Lettinga, Decentrale Sanitatie en Hergebruik op Gebouwniveau (DESAH). 2000, Wageningen Universiteit, Haskoning Ingenieurs- en Architectenbureau, Biothane International, Milieu Platform Zorgsector (MPZ).: Wageningen, The Netherlands.
46. Wellinger, A. and A. Lindberg, Biogas upgrading and utilisation.IEA Bioenergy, 1999. Task 24: Energy from biological conversion of organic waste.
47. Brinkman, J. and C.E. Schultz, Anaërobe verwerking van organische afvalstoffen met behulp van het PRETHANE®-RUDAD®-BIOPAQ® proces. 1997, Novem/EWAB 53340/1010.
48. Grontmij, Guidebook on landfill gas extraction and utilisation.Novem contract number 258320/0020, ed. G.C. engineers. 1997.
49. Jenbacher, Cogeneration with gas engines. 2002, Brochure Jenbacher Energie A.G. See website: http://www.jenbacher.com.
50. Sandelli, G.J. and R.J. Spiegel, Fuel cell energy recovery from landfill gas. Journal of Power Sources, 1992. 37: p. 255-264.
51. Caddett, J.N.T., Fuel Cell CHP using biogas from brewery effluent. Caddett Renewable Energy Newsletter, 1999(July): p. 14-16.
52. Website Energy research Centre of The Netherlands, http://www.ecn.nl/sf/index.en.html.
53. BFCNet, Biomass fermentation towards usage in fuel cells. An ESF Scientific Network, Website http://www.bfcnet.info/ or European Science Foundation: http://www.esf.org.
54. Losciale, M.G. Technical experience and conclusions from introduction of biogas as a vehicle fuel in Sweden. In 12th European Conference on Biomass for Energy, Industry and Climate Protection, 17-21 June 2002, Amsterdam, The Netherlands, pp. 1124–1127.
55. Schomaker, A.H.H.M., et al., Anaerobic Digestion of Agro-Industrial Wastes: Information networks; Technical Summary on Gas Treatment. 2000, Haskoning en Novem: Nijmegen, The Netherlands.
56. Marchaim, U., Biogas processes for sustainable development.1992, Rome, Italy: Food and Agriculture Organization of the United Nations (FAO).
57. Danish-Biogas-Programme, Website: http://www.biogasdk.dk.58. Danish-Institute-of-Agricultural-and-Fisheries-Economics,
Centralised Biogas Plants - Integrated Energy Production, Waste Treatment and Nutrient Redistribution Facilities. 1999.
59. University-of-Southern-Denmark, Danish Centralised Biogas Plants - Plant descriptions. 2000, Bioenergy Department, University of Southern Denmark.
60. DEA, Progress Report on the Economy of Centralized Biogas Plants. 1995, Danish Energy Agency.
61. Koppejan, J. and E. Annevelink, Energie uit het landelijk gebied- Het gebruik van agrarische reststromen voor duurzame energie-opwekking. 2002, Novem report 2DEN-02.16.
62. Boo-de, W., T. Schomaker, and A. Moen, Vergisting van dierlijkemest met energierijke additieven (Deense praktijk en Nederlandseperspectieven). Novem B.V in het kader van het EWAB-programma. Vol. nr. 9315. 1993, The Netherlands.
63. Biomassavergisting De Scharlebelt. in Praktijkdag DE: Duurzame Energiedag Nederland 2002 (8 oktober 2002). 2002. Floriade, Vijfhuizen, The Netherlands
64. EU, http://europa.eu.int/comm/energy_transport/atlas/htmlu/as.html.65. Nelson, C. and J. Lamb, Final Report: Haubenschild Farms
Anaerobic Digester. 2000,http://www.misa.umn.edu/%7Emnproj/pdf/hauby%20final3.pdf.
66. IEA, Biogas from Municipal solid waste - Overview of systems and markets for anaerobic digestion of MSW. 1994, IEA Bioenergy agreement.
67. Whyte, R. and Perry, A rough guide to anaerobic digestion costs and MSW diversion. BioCycle, 2001. October: p. 30-33.
68. Hamelers, H.V.M. Anaerobic versus aerobic treatment of solid waste: a matter of sustainability? in Anaerobic digestion for sustainability in waste (water) treatment and re-use. 2002. Moscow, Russia: Department of Chemical Enzymology, Chemistry Faculty, Moscow State University.
69. Doorn-van, J. and K. Hemmes, Internal reports. 1999/2000, Unit Biomass, Energy research Centre of The Netherlands (ECN).
70. Higham, I., Economics of anaerobic digestion of agriculural waste, in AEA Technology Environment. 1998, http://www.ad-nett.org/html/economics.html.
71. Evans, G., Anaerobic Digestion (AD), in Biowaste and BiologicalWaste Treatment, Evans G, Editor. 2001, James & James Science Publishers Ltd: London, UK. p. Chapter 6, 89-117.
72. Haas, R. et-al., Review report on Promotion Strategies for electricity from renewable energy sources in EU countries. 2001.
73. Tafdrup, S., Viable energy production and waste recycling from anaerobic digestion of manure and other biomass materials. Biomass and Bioenergy, 1995. 9(1-5): p. 303-314.
74. Biomasster, Energie uit afval en biomassa in Nederland 1998.1998.
75. CBS, Centraal bureau voor Statistiek, 2000. Website http://www.cbs.nl/nl/statline/index.htm
76. Zeeman,G & Lettinga, G. (2001). Objectives of DESAR-Decentralised Sanitation and Reuse. 30. Abwassertechnisches Seminar 13. DECHEMA-Fachgespräch Umweltschutz DESAR Kleine Kläranlagen und Wasserwiederverwendung. Berichte aus Wassergüte- und Abfallwirtschaft. Technische Universität München.
77. ‘Biogas Market Undeveloped’, 2003. Short news item about Frost and Sullivan research company report on the European biogas market. Renewable Energy World, May-June 2003, p. 37.
- 94 -

- 95 -
Location
Bergheim-SiggerwiesenBöheimkirchenEferdingFeldbachFrastanzGrazHirsdorf HollabrunnKainsdorfKoblachLeesternauLustenauMayerhofenRoppenSalzburgWelsWesterwesede
BrechtBrechtGent
Newmarket
ArhusBlaabjergBlåhøjDavinde FangelFilskovGrindstedHashøjHodsagerLemvigLintrupNystedRevingeRibeSindingSnertingeStudsgårdThorsøVaast-FjellardVegger Vester Hjermitslev
Appendix I Operating anaerobic digestion plants of commercial scale.
All plants have a processing capacity > 2,500 t.p.a. (tonnes/year). MSBW = Municipal Solid Biodegradable Waste; OIW= Organic Industrial Waste; Biosolids = sewage sludge.
Feedstock
MSBWBiowaste, AgriculturalOIWMSBWOIWMSBWBiowaste, AgriculturalOIWBiowaste, Agricultural, OIWMSBWBiowasteBiowasteBiowaste, AgriculturalBiowasteOIW, BiosolidsBiowasteAgricultural, OIW
BiowasteBiowasteMSBW
Biowaste, OIW
Biowaste, Agricultural, OIWAgricultural, OIWAgricultural, OIWAgricultural, OIWAgricultural, OIWAgricultural, OIWBiowaste, BiosolidsAgricultural, OIWAgricultural, OIWAgricultural, OIWAgricultural, OIWBiowaste, Agricultural, OIWAgricultural, OIWAgricultural, OIWBiowaste, Agricultural, OIWAgricultural, OIWBiowaste, Agricultural, OIWAgricultural, OIWBiowaste, Agricultural, OIWAgricultural, OIWAgricultural, OIW
Country
Austria
Belgium
Canada
Denmark
System
DrancoArge BiogasEntecAATEntecDrancoEntecEntecEntecAATKompogasKompogasArge BiogasKompogasAATLINDEEntec
DrancoDrancoAAT
BTA
C.G. JensenBWSC/BioscanNIRASKrügerKrügerNIRASKrügerKrügerNIRASBWSCKrüger/BioscanKrügerBioscanKrügerHerning MunicipalNIRASHerning MunicipalBWSCNIRASJYSK BiogasKrüger
Scale t.p.a.
20,0005,0007,500
11,00017,000
11,00014,00015,000
8,00010,000
2,50010,000
160,00015,000
5,000
20,00035,000
182,000
150,000
125,000113,000
30,00010,00053,00027,00040,00053,00017,500
144,000190,000100,000
15,300147,000
45,00043,000
130,000110,000
55,00019,00017,000
Date
19931996198419981985199019941983199519931997199619972001199919961986
199219991999
2000
199519961997198819891995199719941993199219901998198919901988199619961994199719861984

Location
Vaasa
Amiens
AlzeyBaden-BadenBassumBehringenBottropBraunschweigBuchenDietrichsdorf-VolkenschwandEllertEngelskirchenErkheimFinsterwaldFrankfurtFreiburgFürstenwaldeGanderkeseeGröden-SchradenGroß MühlingenGroß PankowHeppenheimHertenHimmelkronHerschfeldeKahlenburgKarlsruheKaufbeurenKemptenKirchstockachLemgoMichaelisdonnMünchenMünchen/EittingMünsterNeukirchenNordhausenOldenburgPastitz/RügenRadebergRegensburgRodingSagard/Island RügenSchwabachSchwanebeckSimmernWadern-LockweilerWittmundZobes
Feedstock
MSBW
MSBW
BiowasteBiowaste, BiosolidsGrey wasteAgricultural, OIWBiowasteBiowasteGrey wasteBiowaste, OIW
BiowasteBiowasteBiowaste, OIWBiowaste, AgriculturalBiowasteBiowasteBiowaste, OIWBiowasteAgricultural, OIWBiowaste, Agricultural, OIWAgricultural, OIWBiowaste, OIWBiowasteAgricultural, OIWOIWMSBWBiowasteBiowaste, OIWBiowasteBiowasteBiowaste, OIWAgricultural, OIWBiosolids, OIWBiowasteBiowasteAgricultural, BiowasteBiowasteAgricultural, OIWAgricultural, OIWBiosolids, Biowaste, OIWBiowasteBiowasteBiowaste, Agricultural, OIWBiowasteBiowaste, AgriculturalBiowasteBiowaste, OIWAgricultural, OIWBiowaste, Agricultural, OIW
Country
Finland
France
Germany
System
Waasa/Wabio
Valorga
KompogasBTADranco LINDEWabioKompogasISKABTA
EntecValorgaBTASchwartung UHDEKompogasValorgaLINDEANMHaase EnergietechnicDSDAlusteel/NNRLINDEIMKAATAATWehrle/BiopercolatBTABTAKompogasBTALINDEKrügerSchwarting UHDEKompogasBTA/RoedigerAATHaaseKrügerBioplanLINDETBW/BiocompAATLINDEBTA/ATUHaaseKompogasBTAKrügerDSD
Scale t.p.a.
15,000
85,000
24,0005,000
16,50023,000
6,50020,00020,00017,000
5,00035,00011,00090,00015,00036,00085,000
3,000110,000
42,0007,700
33,00018,000
2,8003,600
20,000800
2,50010,00025,00038,00035,00086,40024,00020,00055,00016,00020,000
100,00056,00012,000
7,00048,00012,00050,00010,00020,000
120,00020,000
Date
1994
1988
20001993199719961995199720011995
199719981997199520001999199819951995199619941999199819951997200119961992199519972000199519871997199719981999199219971999199619961996199619991997199819961986

- 97 -
Location
Bogor
Bastia/BrettonaBellariaMarscianoThiene
Kagoshima
BredaBredaGroningenLelystadTilburg
La Coruña
BoråsHelsingborgKalmarKilKristianstadLaholmLinköpingUppsalaVanersborg
AarbergBaarBachenbülachFrauenfeldGenevaMuhenNiederuzwilOtelfingenRümlangSamstagernVilleneuveVolketswilVuiteboeufWädenswil
Zaporozhstol
Greenboro, NCMoorfield, WVPrinceton, NC
Feedstock
OIW
Agricultural, OIWMSBWAgricultural, OIWAgricultural, OIW
Biowaste, Agricultural
NiowasteOIWGrey wasteBiowasteBiowaste
OIW
MSBWAgricultural, OIWAgricultural, OIWMSBWMSBW, Agricultural, OIWAgricultural, OIWAgricultural, OIWMSBW, Agricultural, OIWMSBW
BiowasteBiowasteBiowaste, YardBiowaste, OIWBiowasteAgricultural, OIWBiowasteBiowasteBiowaste, YardBiowaste, YardBiowasteBiowaste, YardAgricultural, OIWOIW
Agricultural, OIW
Yard wastesBiowaste/Agricultural/BiosolidsAgricultural, OIW
Country
Indonesia
Italy
Japan
Netherlands
Spain
Sweden
Switzerland
Ukraine
USA
System
Dranco
RPAIonics ItalbiaSPIKIKlos
Dranco
PaquesPaquesCiTecHeidemij, BiocelValorga
AAT
YIT/VMTNSRVBB Viak/LäckebyCiTecKrügerKrügerPuracVBB Viak/LäckebyYIT/VMT
DrancoLINDEKompogasRom-OPURValorgaLINDEKompogasKompogasKompogasKompogasDrancoKompogasLINDEEntec
Krüger
DEESEnviro-controlDEES
Scale t.p.a.
30,0004,000
300,00060,000
10,00025,00085,00035,00052,000
34,000
9,00020,00025,000
3,00073,00037,000
105,00030,00020,000
11,0006,000
10,00015,00010,000
5,00013,00012,000
8,50010,00010,00010,000
6,9005,000
12,000
30,0003,0003,500
Date
19861982198819881990
1998
19921987199919971994
1993
199519961998199819971992199719972000
19971994199419992000198619971996199219951999200019861997
1992
200019961999

- 98 -
Appendix II Characteristics of various types of industrial wastewater [41].
Branch of industry Raw wastewater characteristics (max) Anaerobic Reference
degradability
BOD5 (mg/l) COD (mg/l) (m3 CH4/kg COD removed)
Food & Beverage
Slaughterhouses
Meat 450-1500 IWACO 1991
500-1500 IWACO 1991
490-650 1500-2200 Sayed 1987
"low strength" 1100 1440 82.7% of CODtot inf. Nunez and Martinez 1999
"medium strength" 1400 2500 82.7% of CODtot inf. Nunez and Martinez 1999
"high strength" 2400 4200 82.7% of CODtot inf. Nunez and Martinez 1999
Poultry 250-3700 IWACO 1991
350-500 IWACO 1991
370-620 Middelbrooks 1979
1000-2100 1500-3500 Eremektar, Cokgor et al. 1999
meat processing 100-300 IWACO 1991
1300 IWACO 1991
1880 Campos, Foresti et al. 1986
Dairy
Dairy products 300-10000 IWACO 1991
480-2500 IWACO 1991
52000 0.36 Hickey and Owens 1981
12000-35000 0.27-0.3 Li, Sutton et al. 1982
2200-10000 0.1-0.395 Boening and Larsen 1982
3560-4250 0.08-0.29 Viraraghavan, Kikkeri et al 1990
cheese whey 12000 20000 0.55 Yilmazer and Yenigun 1999
egg processing 3000-3200 5000-6900 Middlebrooks 1979
150 IWACO 1991
1400-3000 IWACO 1991
Fish
Fish processing 350-3500 IWACO 1991
5000 IWACO 1991
20000-53600 Veiga, Mendez et al. 1992
3000-4200 4800-6400 Nair 1990
84-32700 Middlebrooks, 1979
1830-12230 75-80% of CODtot inf. Palenzuela 1983
18500-55200 75-95% of CODtot inf. Soto, Mendez et al. 1991
Tuna 29500 72-76% of CODtot inf. Punal and Lema 1999
mussel cooking 18500 86-95% of CODtot inf. Punal and Lema 1999
Pulp & Paper
Pulping
Thermo mechanical pulping 1000-4500 67-87% of CODtot inf. Sierra-Alvarez 1999
Chemo-thermo mechanical
pulping 6000-13000 Sierra-Alvarez 1999
Chemical 5000-6000 85-90% of CODtot inf. Kroiss, Svardal et al. 1985
paper making 1500 3000 Hulshoff-Pol and Lettinga 1986

Appendix II (continued) Characteristics of various types of industrial wastewater.
Branch of industry Raw wastewater characteristics (max) Anaerobic Reference
degradability
BOD5 (mg/l) COD (mg/l) (m3 CH4/kg COD removed)
Grain & Starch
Grain 240-500 IWACO 1991
225-14600 Middlebrooks, 1979
Maize 5700-11900 5300-24900 Krings, Donnerhack et al. 1992
8100 IWACO 1991
Patatoes 4900 5700 Krings et al 1992
500-1500 IWACO 1991
Wheat 18600-37500 21700-52500 Krings et al 1992
4700 IWACO 1991
Sugar
250 IWACO 1991
930 IWACO 1991
15-1900 60-4400 Barnes, Forster et al. 1984
480-9000 0.33 Chen, Li et al. 1982
4000-6000 6000-10000 Austermann Haun, Meyer
et al. 1999
Edible oil and Grease
100-2000 IWACO 1991
500-5000 IWACO 1991
500-6700 Middlebrooks, 1979
31300-31800 69700-72000 75-80% of CODtot inf. Tsonis and Grigoropoulos 1988
Beverages/Distilleries
Soft drink 180-370 IWACO 1991
380-660 Middlebrooks, 1979
500 1400 89%COD/96% BOD
removal Craveiro, Soares et al. 1986
6000 0.41 Hickey and Owens 1981
Breweries 750 IWACO 1991
750-3000 IWACO 1991
1600 Middlebrooks, 1979
1500 2500 92%COD/99% BOD
removal Craveiro et al. 1986
1500 2300 Austermann-Haun et al 1999
Distilleries 100 IWACO 1991
15000 IWACO 1991
480-9000 Middlebrooks, 1979
19800-25000 45000-65000 Costa, Rocha et al. 1986
8700-9500 0.348 Frostell 1982
12000-20000 Austermann-Haun et al 1999
Fruit/Vegetable processing
Fruit/Vegetable processing 1900 IWACO 1991
Vegetables 200-800 IWACO 1991
Potato 5000 80% of CODtot infl. Zoutberg and Eker 1999
Coffee 1250 IWACO 1991
9400-15000 Calzada, Rolz et al. 1986
3000 4000 Hajipakkos 1982

Adapted from the Vagron website http://www.vagron.nl/html/nl/massa.htm.
Separating waste results in the reuse of more than50% of the incoming waste stream. Only about42% of the waste is incinerated.
- 100 -
A total of 2.5 MWe of electric energy is produced,about one third of which is used internally. Theremainder is supplied to the public electricitynetwork. About 3.6 MWh of thermal energy isproduced, which is used to heat process water andcreate steam. In total, the conversion of bio-methane into energy (electricity + heat) achievesan energy yield of 85%.
OWF: Organic Waste Fraction
Appendix III Energy and mass balance of the VAGRON installation treatinggrey waste
Input grey waste100%
230 kton/a
SEPARATION
WASHING
DIGESTION
Digestate10%23 kton/a
Suppl.6,2%
12.7 kton/a
Steam3.1 kton/a
Biogas5%10 kton/a
Waste water(to fit by experience)
Waste water(to fit by experience)
Water (to fit by experience)
Sand 4.4%9 kton/a
Inert raw matial10% 23 kton/a
RDF42%97 kton/a
Paper/plastic15%35 kton/a
Ferrous + non-ferrous3%7 kton/a
OWF40%
92 kton/a
WashedOWF

- 101 -
Not used18300 Gj/a
Own useSteam
9200 GJ/a
Own usewarm water15400 GJ/a
Not used37800 GJ/a
Own use17400 GJ/a
Warm water53200 GJ/a
Steam27500 GJ/a
To public grid39100 GJ/a
Loss24200 GJ/a
Biogas161400 GJ/a
Combined heat andpower plant
2520 kWe
Electr.56500GJ/a
Heat80700GJ/a

- 102 -
Appendix IV Operational manure digesters in The Netherlands [61,63].
Location Description of project Capacity Start-up date
Elsendorp Regional digestion of 25,000 tonnes of pig manure per year. The installation produces 1,600 GWh of electricity/yr, 1,600 GWhe / September7,500 tonnes of mineral concentrates and 17,500 tonnes of year 2001clean water. Supplier: Biorek Agro B.V.
Goutum Farm-scale digester at Praktijkcentrum Nije Bosma Zathe. Capacity: 900 m3 cattle manure /year (+ 900 planned). FebruaryCo-digestion with green maize. 2001Supplier: Biogas Nederland BV
Nijverdal Regional, thermophilic (co)digestion of 22,000/3,000 tonne pig manure / roadside grass at "De Scharlebelt". Biogas is used for Combined Heat and Power production. Composting of solid fraction of digestate. The liquid fraction is processed 600 kWe Februaryby ultra filtration and reverse osmosis to produce mineral CHP – unit 2002concentrates and clean water.Supplier: Wolter & Dros Biowatt B.V.
Miste Farm-scale co-digestion of 1,000 m3/year pig and chicken manure with green maize, cabbage and fodder beets. JanuaryJ. Leemkuil. Supplier: WISA. 2001
Sterksel Digester at testing farm for pigs (Praktijkcentrum Sterksel).Capacity 4,500 m3/year pig manure. Biogas is used in 37 kW January37 kWe CHP unit. Supplier: Ecogas international B.V. CHP unit 2002


