
Grado en Ingeniería
Asignatura: Estadística
Tema 3: Control Estadístico de Procesos (SPC)- IN ENGLISH
Grado en IngenierGrado en Ingenieríía a
Asignatura: EstadAsignatura: Estadíísticastica
Tema 3: Control EstadTema 3: Control Estadíístico de Procesos (SPC)stico de Procesos (SPC)-- IN ENGLISHIN ENGLISH
Grado en Ingeniería. Estadística. Tema 3
Grado en Ingeniería. Estadística. Tema 3Número de transparencia: 2
Statistical Process Control (SPC)StatisticalStatistical ProcessProcess Control (SPC)Control (SPC)
IntroductionThe variability of a production process
Assignable causesNon-assignable causes
Control by variablesThe capability of a process. Capability indexControl by variables graphsInitial study of a process. Determining the capacityMonitorization process
Control by attributes

Grado en Ingeniería. Estadística. Tema 3Número de transparencia: 3
SPC. IntroductionSPC. SPC. IntroductionIntroduction
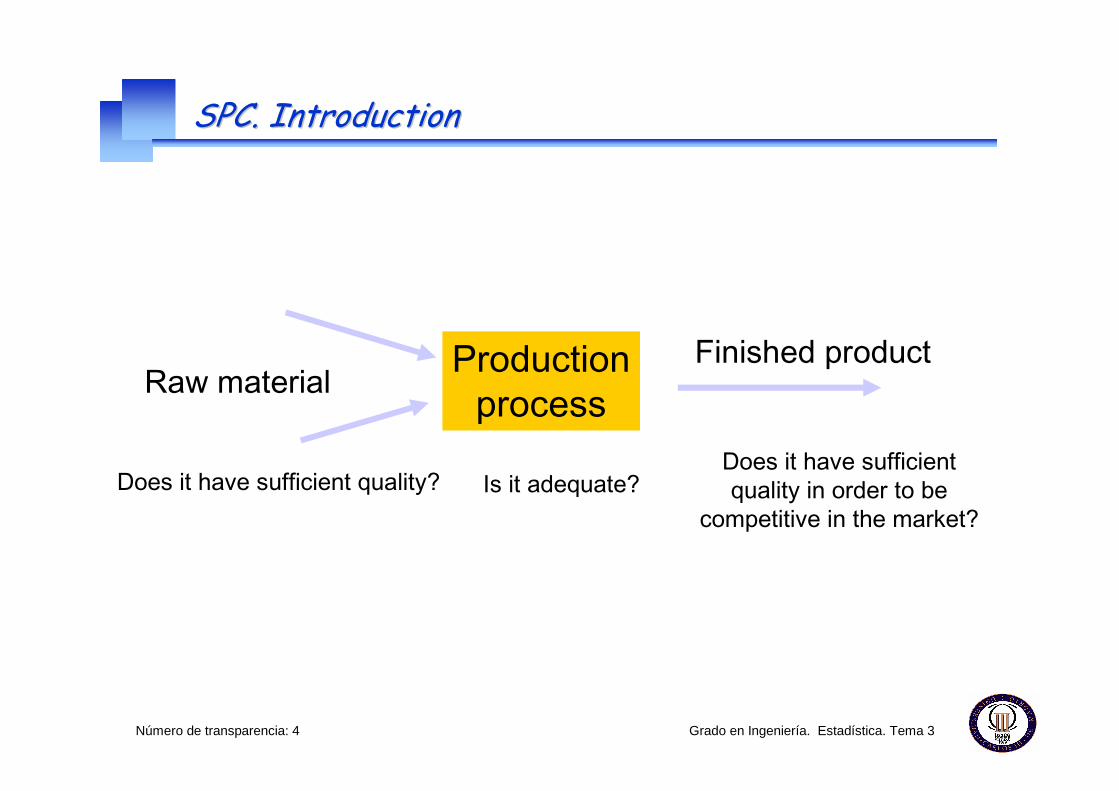
ProductionprocessRaw material
Finished product
Grado en Ingeniería. Estadística. Tema 3Número de transparencia: 4
Does it have sufficient quality? Is it adequate?Does it have sufficientquality in order to be
competitive in the market?
SPC. IntroductionSPC. SPC. IntroductionIntroduction
ProductionprocessRaw material
Finished product

Grado en Ingeniería. Estadística. Tema 3Número de transparencia: 5
OBJECTIVE
To test that the process is operating under optimum conditions
To obtain information that allows the process to be improved
HOW?
Measurement during the production process
Specified measurement intervals
Graphical representation of the evolution of a quality characteristic
SPC. IntroductionSPC. SPC. IntroductionIntroduction

Grado en Ingeniería. Estadística. Tema 3Número de transparencia: 6
SPC. IntroductionSPC. SPC. IntroductionIntroduction
Suppose X is the variable of interest (for example: length).Periodic samples of X are takenIn the control graphs the evolution of a statistic of X is plotted. (For example, the sample mean)
1x 2x 3x
Upper control limit
Lower control limit
If any point is outside the control limits, or if non-random behaviour is observed, this isevidence that the process is not operating under optimum conditions.

Grado en Ingeniería. Estadística. Tema 3Número de transparencia: 7
Statistical Process control. TYPES:
By variables (ranges): we analyze a measureable characteristic
of the production (for example, the diameter of an axis)
By attributes (defective / non-comforming fraction): we analyze
a qualitative characteristic of the production (for example: accept /
defect)
SPC. IntroductionSPC. SPC. IntroductionIntroduction

Grado en Ingeniería. Estadística. Tema 3Número de transparencia: 8
Statistical Process Control (SPC)StatisticalStatistical ProcessProcess Control (SPC)Control (SPC)
IntroductionThe variability of a production process
Assignable causesNon-assignable causes
Control by variablesThe capacity of a process. Capability indexControl by variables graphsInitial study of a process. Determining the capacityMonitorization process
Control by attributes

Grado en Ingeniería. Estadística. Tema 3Número de transparencia: 9
SPC. Variability of a processSPC. SPC. VariabilityVariability ofof a a processprocess
PROCESS CHARACTERISTICS:
VARIABILITY: two outputs never the same.
REPEATABILITY: the capability of production with a “stable” level ofquality
processinputs outputs

Grado en Ingeniería. Estadística. Tema 3Número de transparencia: 10
SPC. Variability of a processSPC. SPC. VariabilityVariability ofof a a processprocess
VARIABILITY: Even though an exhaustive relationship of the causes of the
variablity cannot be given, it is interesting to classify as either causes assignable
to specific factors (and therefore controllable) and unassignable causes.
ASSIGNABLE CAUSES �
Produced by important factors that can be controlled in order to maintain
them at acceptable levels. The appear sporadically.
They produce unstable, significant and UNPREDICTABLE variability
NON-ASSIGNABLES CAUSES �
Produced by secondary factors whose effect is not considered significant.
They are a permanent and inherent part of the production process.
They produce stable, non-significant, accepted and PREDICTABLE
variablity

Grado en Ingeniería. Estadística. Tema 3Número de transparencia: 11
PROCESS IN CONTROL:PROCESS IN CONTROL:PROCESS IN CONTROL:PROCESS IN CONTROL:We say a process is IN CONTROL when only
non-assignable causes are present
NON- ASIGNABLES CAUSES � stable, non-significant, PREDICTABLE variability
SPC. Variability of a processSPC. SPC. VariabilityVariability ofof a a processprocess
The control graphs allow thepresence of assignable
causes in the process to be detected

Grado en Ingeniería. Estadística. Tema 3Número de transparencia: 12
Statistical Process Control (SPC)StatisticalStatistical ProcessProcess Control (SPC)Control (SPC)
IntroductionThe variability of a production process
Assignable causesNon-assignable causes
Control by variablesThe capability of a process. Capability indexControl by variables graphsInitial study of a process. Determining the capacityMonitorization process
Control by attributes

Grado en Ingeniería. Estadística. Tema 3Número de transparencia: 13
SPC. Capacity of a processSPC. SPC. CapacityCapacity ofof a a processprocess
PREMISE:
The characteristic of production that we control (for example: thediameter of an axis, the packaged weight …) follows a normal distribution WHEN the process is under control.
X � N (µ, σ)
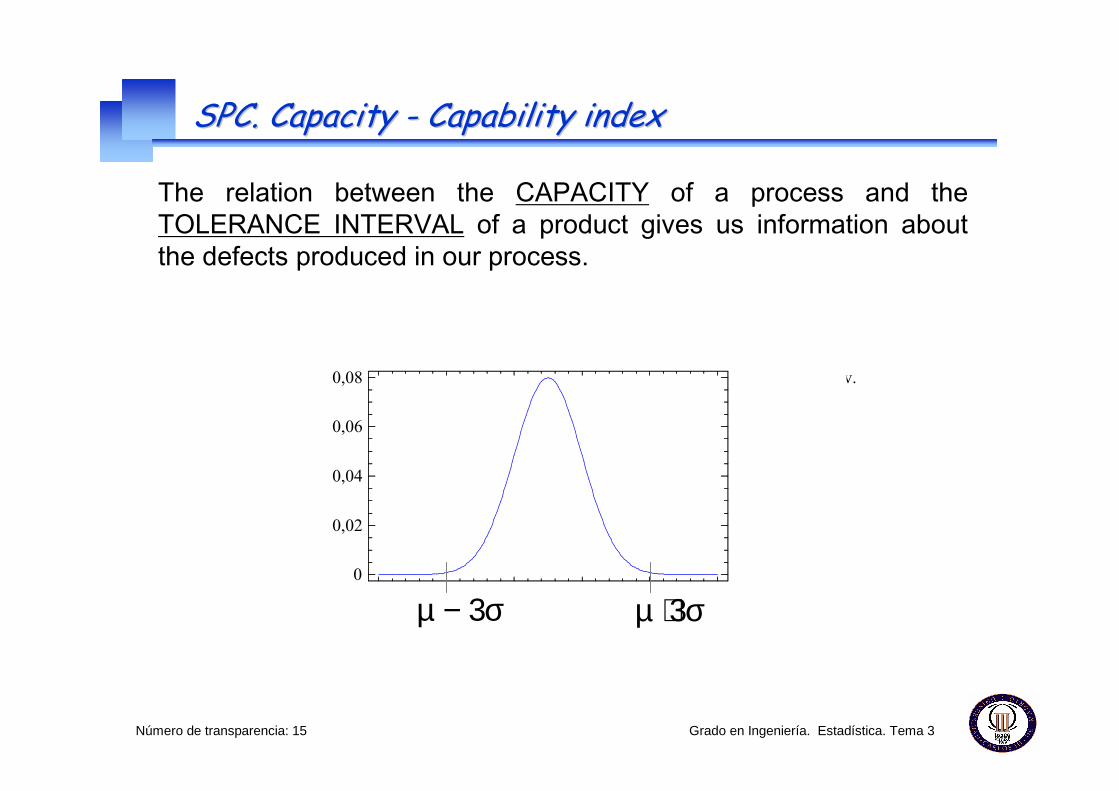
Almost all of the production (99.7%) will be in the interval:
(µ − 3σ ; µ + 3σ)
We call CAPACITY over the previous interval
CAPACITY = 6σ

Grado en Ingeniería. Estadística. Tema 3Número de transparencia: 14
SPC. Capacity of a processSPC. SPC. CapacityCapacity ofof a a processprocess
PROBLEMNot all of the products that we produce can be valid.
We only accept those that satisfy given specifications.
ToleranceToleranceToleranceTolerance intervalintervalintervalinterval:::: set of values of X that are considered to be
admissable or acceptable.
PRODUCT TOLERANCE INTERVAL (LT2 – LT1)
LT1 LT2
This is defined by the client, or on occasions by the designer of the product or the personresponsable for the process (it often represents an objective value, θ, and an acceptable error, L):
θ ± L
Grado en Ingeniería. Estadística. Tema 3Número de transparencia: 15
The relation between the CAPACITY of a process and theTOLERANCE INTERVAL of a product gives us information aboutthe defects produced in our process.
Mean,Std. dev.1,5
Normal Distribution
x
density
-24 -14 -4 6 16 26
0
0,02
0,04
0,06
0,08
µ − 3σ µ + 3σ
SPC. Capacity - Capability indexSPC. SPC. CapacityCapacity -- CapabilityCapability indexindex

Grado en Ingeniería. Estadística. Tema 3Número de transparencia: 16
Mean,Std. dev.1,5
Normal Distribution
x
density
-24 -14 -4 6 16 26
0
0,02
0,04
0,06
0,08
µ − 3σ µ + 3σ
LT1 LT2
SPC. Capacity - Capability indexSPC. SPC. CapacityCapacity -- CapabilityCapability indexindex
The relation between the CAPACITY of a process and theTOLERANCE INTERVAL of a product gives us information aboutthe defects produced in our process.

Grado en Ingeniería. Estadística. Tema 3Número de transparencia: 17
Mean,Std. dev.1,5
Normal Distribution
x
density
-24 -14 -4 6 16 26
0
0,02
0,04
0,06
0,08
µ − 3σ µ + 3σ
LT1 LT2 DEFECTS!!
SPC. Capacity - Capability indexSPC. SPC. CapacityCapacity -- CapabilityCapability indexindex
The relation between the CAPACITY of a process and theTOLERANCE INTERVAL of a product gives us information aboutthe defects produced in our process.

Grado en Ingeniería. Estadística. Tema 3Número de transparencia: 18
Mean,Std. dev.1,5
Normal Distribution
x
density
-24 -14 -4 6 16 26
0
0,02
0,04
0,06
0,08
µ − 3σ µ + 3σ
LT2LT1
SPC. Capacity - Capability indexSPC. SPC. CapacityCapacity -- CapabilityCapability indexindex
The relation between the CAPACITY of a process and theTOLERANCE INTERVAL of a product gives us information aboutthe defects produced in our process.

Grado en Ingeniería. Estadística. Tema 3Número de transparencia: 19
Mean,Std. dev.1,5
Normal Distribution
x
density
-24 -14 -4 6 16 26
0
0,02
0,04
0,06
0,08
µ − 3σ µ + 3σ
LT2LT1 NO DEFECTS!!
SPC. Capacity - Capability indexSPC. SPC. CapacityCapacity -- CapabilityCapability indexindex
The relation between the CAPACITY of a process and theTOLERANCE INTERVAL of a product gives us information aboutthe defects produced in our process.

Grado en Ingeniería. Estadística. Tema 3Número de transparencia: 20
Mean,Std. dev.1,5
Normal Distribution
x
density
-24 -14 -4 6 16 26
0
0,02
0,04
0,06
0,08
µ − 3σ µ + 3σLT1 LT2
SPC. Capacity - Capability indexSPC. SPC. CapacityCapacity -- CapabilityCapability indexindex
The relation between the CAPACITY of a process and theTOLERANCE INTERVAL of a product gives us information aboutthe defects produced in our process.

Grado en Ingeniería. Estadística. Tema 3Número de transparencia: 21
Mean,Std. dev.1,5
Normal Distribution
x
density
-24 -14 -4 6 16 26
0
0,02
0,04
0,06
0,08
µ − 3σ µ + 3σLT1 LT2
FEWDEFECTS
SPC. Capacity - Capability indexSPC. SPC. CapacityCapacity -- CapabilityCapability indexindex
The relation between the CAPACITY of a process and theTOLERANCE INTERVAL of a product gives us information aboutthe defects produced in our process.

Grado en Ingeniería. Estadística. Tema 3Número de transparencia: 22
The CAPABILITY INDEX is the relation between the CAPACITYof the process and the TOLERANCE INTERVAL of the product:
CI =LT2 – LT16 σ
CI < 1 Defects!! Inspection of all the units
Mean,Std. dev.1,5
Normal Distribution
x
density
-24 -14 -4 6 16 26
0
0,02
0,04
0,06
0,08
CI > 1 Few defects. Less rigorous inspection
Mean,Std. dev.1,5
Normal Distribution
xdensity
-24 -14 -4 6 16 26
0
0,02
0,04
0,06
0,08
SPC. Capacity - Capability indexSPC. SPC. CapacityCapacity -- CapabilityCapability indexindex

Grado en Ingeniería. Estadística. Tema 3Número de transparencia: 23
SPC. Capacity - Capability indexSPC. SPC. CapacityCapacity -- CapabilityCapability indexindex
Example:We manufacture metallic pieces. The weight of the pieces is a qualityvariable.
The person responsible for the process establishes a tolerance interval of(0.76 ± 0.02) kg.We suppose that when the process is under control the weight of the pieceshas a normal distribution with mean 0.76 and standard deviation 0.028
We require:1. The probability that a piece will be defective
2. The capability index
3. If the machine’s operation changed, and this increased the process mean by 0.02kg, what would the proportion of defective products be?
4. If the machine’s operation changed, and this increased the standarddeviation by 0.01kg (without a change in the mean), what would theproportion of defective products be?

Grado en Ingeniería. Estadística. Tema 3Número de transparencia: 24
Statistical Process Control (SPC)StatisticalStatistical ProcessProcess Control (SPC)Control (SPC)
IntroductionThe variability of a production process
Assignable causesNon-assignable causes
Control by variablesThe capability of a process. Capability indexControl by variables graphsInitial study of a process. Determining the capacityMonitorization process
Control by attributes

Grado en Ingeniería. Estadística. Tema 3Número de transparencia: 25
Control charts for rangesControl Control chartscharts forfor rangesranges
The presence of assignablecauses produces a change eitherin the mean or the standarddeviation, or in both. These implyan increase in the proportion ofdefective articles.
The control charts for rangesallow the process to be monitoredin order to detect the presence ofassignable causes
Mean,Std. dev.
17,2
20,2
Normal Distribution
x
density
0 5 10 15 20 25 30
0
0,04
0,08
0,12
0,16
0,2
Mean,Std. dev.
17,2
17,5
Normal Distribution
x
density
-8 2 12 22 32 42
0
0,04
0,08
0,12
0,16
0,2
Mean,Std. dev.
17,2
20,5
Normal Distribution
x
density
-5 5 15 25 35 45
0
0,04
0,08
0,12
0,16
0,2

Grado en Ingeniería. Estadística. Tema 3Número de transparencia: 26
Control charts for rangesControl Control chartscharts forfor rangesranges
In order to monitor the process, we take samples periodically andplot the evolution of the samplemean and the sample range (orthe standard deviation)
If the mean or the range (or thestandard deviation) exceeds theestablished control limits on thechart, or a non-random behaviouris seen, ….
then we have statistical evidencethat the mean or the variance ofthe process has changed.
That is:the process is not in control
X-bar Chart for Col_1
Subgroup
X-bar
CTR = 74,00
UCL = 74,01
LCL = 73,99
0 5 10 15 20 25
73,98
73,99
74
74,01
74,02
Range Chart for Col_2
0 5 10 15 20 25
Subgroup
0
0,01
0,02
0,03
0,04
0,05
Range
CTR = 0,02
UCL = 0,05
LCL = 0,00

Grado en Ingeniería. Estadística. Tema 3Número de transparencia: 27
Control charts for ranges. - Justification.Control Control chartscharts forfor rangesranges. . -- JustificationJustification..
Graphical justification of the means
Thus if the process is in control, the sample mean is in the interval with a probability of 99.7% ,
Therefore, we establish control chart limits for the mean:
−=
=
+=
nLCL
CL
nUCL
σµ
µ
σµ
3
3
),( σµNX → controlunder ),(n
NXσµ → Controlunder
-5 -3 -1 1 3 5
0
0,1
0,2
0,3
0,4
n
σµ 3+n
σµ 3−
0.997
X
n
σµ 3±

Grado en Ingeniería. Estadística. Tema 3Número de transparencia: 28
Statistical Process Control (SPC)StatisticalStatistical ProcessProcess Control (SPC)Control (SPC)
IntroductionThe variability of a production process
Assignable causesNon-assignable causes
Control by variablesThe capability of a process. Capability indexControl by variables graphsInitial study of a process. Determining the capacityMonitorization process
Control by attributes

Grado en Ingeniería. Estadística. Tema 3Número de transparencia: 29
SPC. Initial study: Determining the capabilitySPC. SPC. InitialInitial studystudy: : DeterminingDetermining thethe capabilitycapability
IMPORTANT:We will determine the capacity of a process when the PROCESS
is IN CONTROL (i.e, there is only variability due to non-assignablecauses),PROCEDURE:1. Take data (samples) from the process:
2. The samples are plotted on the control charts.3. We check that all of the samples come from a situation that isin control (and we reject those that are not). 4. We calculate the capability using the σ of the samples“in control”
CAPABILITY = 6 σ
kknkkk
n
n
sxxxx
sxxxx
sxxxx
or r
or r
or r
k21
22222212
11112111
,),...,,(
....
,),...,,(
,),...,,(
,,,
,,,
,,,
→
→
→

Grado en Ingeniería. Estadística. Tema 3Número de transparencia: 30
SPC. Initial study: Determining the capabilitySPC. SPC. InitialInitial studystudy: : DeterminingDetermining thethe capabilitycapability
We check that all the samples come from a situation “in control” (wereject those that are not)
1st:
2nd:
nx
σ)3+
nx
σ)3−
2d
R=σ)
k
xx
i∑=k
rR
i∑=
x
ir i sample value,minimum- valuemaximum
RD4
R
RD3
Chart of means Chart of ranges

Grado en Ingeniería. Estadística. Tema 3Número de transparencia: 31
SPC. Initial study: Determining the capabilitySPC. SPC. InitialInitial studystudy: : DeterminingDetermining thethe capabilitycapability
3rd:Means Ranges
nx
σ)3+
nx
σ)3−
x
RD4
R
RD3

Grado en Ingeniería. Estadística. Tema 3Número de transparencia: 32
SPC. Initial study: Determining the capabilitySPC. SPC. InitialInitial studystudy: : DeterminingDetermining thethe capabilitycapability
3rd:Means Ranges
NOT IN CONTROL
nx
σ)3+
nx
σ)3−
x
RD4
R
RD3

Grado en Ingeniería. Estadística. Tema 3Número de transparencia: 33
SPC. Initial study: Determining the capabilitySPC. SPC. InitialInitial studystudy: : DeterminingDetermining thethe capabilitycapability
3rd:Means Ranges
NOT IN CONTROL
We eliminate the samples that are not in control, and we calculate thecapacity as: CAPABILITY = 6
4th:
nx
σ)3+
nx
σ)3−
x
RD4
R
RD3
σ)

Grado en Ingeniería. Estadística. Tema 3Número de transparencia: 34
We eliminate the samples that are not in control, and we calculate thecapacity as: CAPABILITY = 6
SPC. Initial study: Determining the capabilitySPC. SPC. InitialInitial studystudy: : DeterminingDetermining thethe capabilitycapability
3ºMeans Standard deviations
NOT IN CONTROL
ALTERNATIVE
nx
σ)3+
nx
σ)3−
x
2c
s=σ)
σ)
SB4
S
SB3
4th:

Grado en Ingeniería. Estadística. Tema 3Número de transparencia: 35
Statistical Process Control (SPC)StatisticalStatistical ProcessProcess Control (SPC)Control (SPC)
IntroductionThe variability of a production process
Assignable causesNon-assignable causes
Control by variablesThe capability of a process. Capability indexControl by variables graphsInitial study of a process. Determining the capacityMonitorization process
Control by attributes

Grado en Ingeniería. Estadística. Tema 3Número de transparencia: 36
SPC. Process monitoringSPC. SPC. ProcessProcess monitoringmonitoring
Once the capability of the process has been determined we can define the control charts that enable us to monitor the process.
MONITORING
Take samples at regular intervals.
Look for abnormal behaviour.
X-bar Chart for PESO LINEA
Subgroup
X-bar
CTR = 99,98
UCL = 100,46
LCL = 99,50
0 10 20 30 40
99,4
99,6
99,8
100
100,2
100,4
100,6
Range Chart for PESO LINEA
0 10 20 30 40
Subgroup
0
0,3
0,6
0,9
1,2
1,5
1,8
Range
CTR = 0,84
UCL = 1,77
LCL = 0,00
Not only a point outside the control lines gives us statistical evidence ofNOT IN CONTROL,-also non-random like behaviour ofthe points

Grado en Ingeniería. Estadística. Tema 3Número de transparencia: 37
SPC. Process monitoringSPC. SPC. ProcessProcess monitoringmonitoring
MONITORING:
We divide the control chart into three zones of equal size
A(3σ); B(2σ); C(σ)
σ
σ
2σ
2σ
3σ
3σ A
A
B
B
C
C

Grado en Ingeniería. Estadística. Tema 3Número de transparencia: 38
SPC. Process monitoringSPC. SPC. ProcessProcess monitoringmonitoring
We define the following types of behaviour abnormal:
Points outside zone A.
σ
σ
2σ
2σ
3σ
3σ A
A
B
B
C
C

Grado en Ingeniería. Estadística. Tema 3Número de transparencia: 39
SPC. Process monitoringSPC. SPC. ProcessProcess monitoringmonitoring
We define the following types of behaviour abnormal:
Three consecutive points either inside or outside zone A.
σ
σ
2σ
2σ
3σ
3σ A
A
B
B
C
C

Grado en Ingeniería. Estadística. Tema 3Número de transparencia: 40
SPC. Process monitoringSPC. SPC. ProcessProcess monitoringmonitoring
We define the following types of behaviour abnormal:
Four out of five consecutive points either in or outsidezone B.
σ
σ
2σ
2σ
3σ
3σ A
A
B
B
C
C

Grado en Ingeniería. Estadística. Tema 3Número de transparencia: 41
SPC. Process monitoringSPC. SPC. ProcessProcess monitoringmonitoring
We define the following types of behaviour abnormal:
“Run”: Eight consecutive points on the same side of thecentral line
σ
σ
2σ
2σ
3σ
3σ A
A
B
B
C
C

Grado en Ingeniería. Estadística. Tema 3Número de transparencia: 42
SPC. Process monitoringSPC. SPC. ProcessProcess monitoringmonitoring
We define the following types of behaviour abnormal:
Tendency: continuous movement towards the upper orlower zone.
σ
σ
2σ
2σ
3σ
3σ A
A
B
B
C
C

Grado en Ingeniería. Estadística. Tema 3Número de transparencia: 43
SPC. Process monitoringSPC. SPC. ProcessProcess monitoringmonitoring
We define the following types of behaviour abnormal:
Change of level
σ
σ
2σ
2σ
3σ
3σ A
A
B
B
C
C

Grado en Ingeniería. Estadística. Tema 3Número de transparencia: 44
SPC. Process monitoringSPC. SPC. ProcessProcess monitoringmonitoring
We define the following types of behaviour abnormal:
Systematic variability.
σ
σ
2σ
2σ
3σ
3σ A
A
B
B
C
C

Grado en Ingeniería. Estadística. Tema 3Número de transparencia: 45
SPC. Process monitoringSPC. SPC. ProcessProcess monitoringmonitoring
We define the following types of behaviour abnormal:
Cycles.
σ
σ
2σ
2σ
3σ
3σ A
A
B
B
C
C

Grado en Ingeniería. Estadística. Tema 3Número de transparencia: 46
SPC. Process monitoringSPC. SPC. ProcessProcess monitoringmonitoring
We define the following types of behaviour abnormal:
Over-stability.
σ
σ
2σ
2σ
3σ
3σ A
A
B
B
C
C

Grado en Ingeniería. Estadística. Tema 3Número de transparencia: 47
Example: Control chartExampleExample: Control : Control chartchart
We want to control a packaging process of a cosmetic product fromthe packaged weight.
1. Initial study of the process: the determination of the process capability. 20 samples are taken of size 5. Shortly, we will present the resultsobtained using Statgraphics
2. Process monitoring: It is decided to monitor the process in order todetect the presence of assignable causes. Samples of size 5 are takenevery hour and the mean and the range are plotted on a control chart. Shortly, we will present the results obtained using Statgraphics.

Grado en Ingeniería. Estadística. Tema 3Número de transparencia: 48
Example: Control chart – Initial studyExampleExample: Control : Control chartchart –– InitialInitial studystudyInitial study of the process: the determination of the process capability. 20 samples are taken of size 5.
Statgraphics. Menu: Special / Quality control / Variable Control Chart / X-bar and R …(Size = 5)Right button: Select “Initial study”.

Grado en Ingeniería. Estadística. Tema 3Número de transparencia: 49
Example: Control chart – Initial studyExampleExample: Control : Control chartchart –– InitialInitial studystudyInitial study of the process: the determination of the process capability. 20 samples are taken ofsize 5.
1. We plot the 20 samples on the control chart.
2. We eliminate all the samples that are outside the control lines
3. Using the remaining samples we estimate the parameters of the normal distribution.
X-bar Chart for PESO
0 4 8 12 16 20
Subgroup
99
99,3
99,6
99,9
100,2
100,5
100,8
X-bar
CTR = 100,01
UCL = 100,51
LCL = 99,50
Range Chart for PESO
0 4 8 12 16 20
Subgroup
0
0,4
0,8
1,2
1,6
2
2,4
Range
CTR = 0,88
UCL = 1,85
LCL = 0,00
X-bar Chart for PESO
Subgroup
X-bar
CTR = 99,99
UCL = 100,43
LCL = 99,55
0 4 8 12 16 20
99
99,3
99,6
99,9
100,2
100,5
100,8
Range Chart for PESO
Subgroup
Range
CTR = 0,76
UCL = 1,61
LCL = 0,00
0 4 8 12 16 20
0
0,4
0,8
1,2
1,6
2
2,4
Estimates---------Process mean = 99,9908Process sigma = 0,326455

Grado en Ingeniería. Estadística. Tema 3Número de transparencia: 50
Example: Control chart - Process monitoringExampleExample: Control : Control chartchart -- ProcessProcess monitoringmonitoringInitial study of the process: the determination of the process capability. 20 samples are taken ofsize 5. Statgraphics.
Menu: Special / Quality control / Variable Control Chart / X-bar and R …Right button: Select “Control to Standard”.“Specific Parameters” – we enter those estimated in the initial study
---------Process mean = 99,9908Process sigma = 0,326455
Grado en Ingeniería. Estadística. Tema 3Número de transparencia: 51
Example: Control chart - Process monitoringExampleExample: Control : Control chartchart -- ProcessProcess monitoringmonitoring
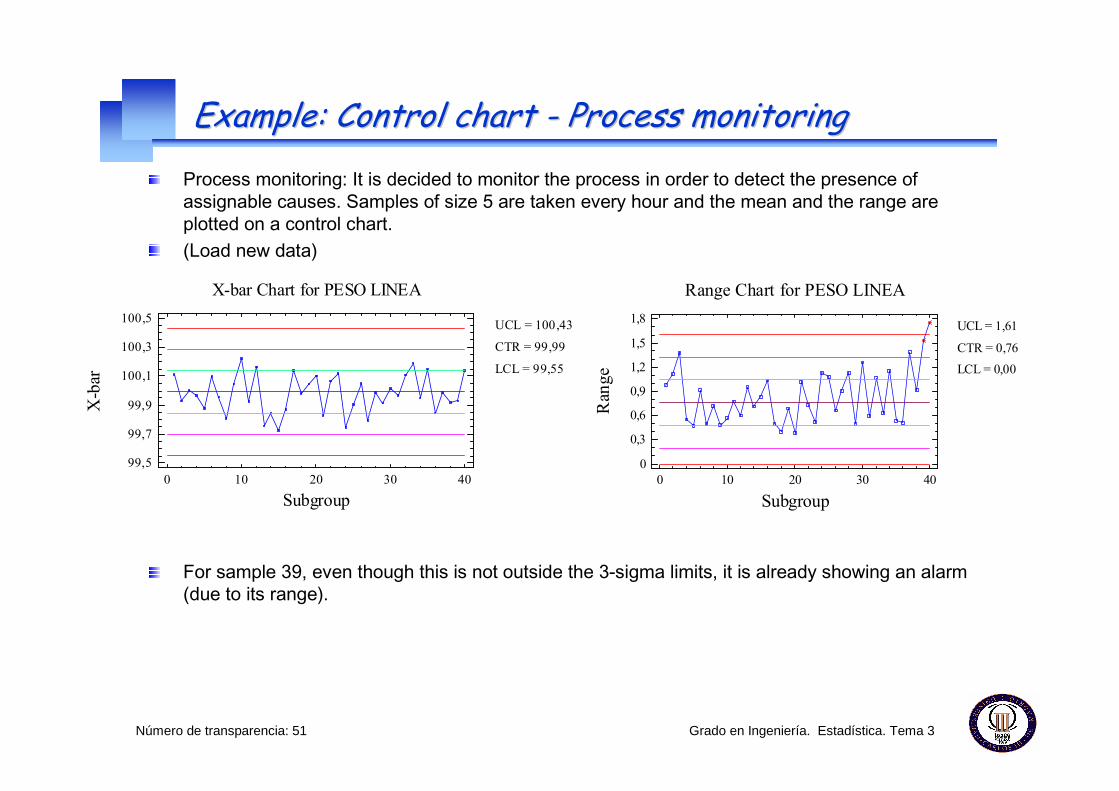
Process monitoring: It is decided to monitor the process in order to detect the presence ofassignable causes. Samples of size 5 are taken every hour and the mean and the range are plotted on a control chart. (Load new data)
For sample 39, even though this is not outside the 3-sigma limits, it is already showing an alarm(due to its range).
X-bar Chart for PESO LINEA
Subgroup
X-bar
CTR = 99,99
UCL = 100,43
LCL = 99,55
0 10 20 30 40
99,5
99,7
99,9
100,1
100,3
100,5
Range Chart for PESO LINEA
Subgroup
Range
CTR = 0,76
UCL = 1,61
LCL = 0,00
0 10 20 30 40
0
0,3
0,6
0,9
1,2
1,5
1,8

Grado en Ingeniería. Estadística. Tema 3Número de transparencia: 52
Statistical Process Control (SPC)StatisticalStatistical ProcessProcess Control (SPC)Control (SPC)
IntroductionThe variability of a production process
Assignable causesNon-assignable causes
Control by variablesThe capability of a process. Capability indexControl by variables graphsInitial study of a process. Determining the capacityMonitorization process
Control by attributes

Grado en Ingeniería. Estadística. Tema 3Número de transparencia: 53
Control charts for attributesControl Control chartscharts forfor attributesattributes
Acceptable/Defective
Record of simple data (less cost!)
Easier to count defects than calculate the mean andstandard deviation
Samples sizes are normally greater
Only necessary to plot one control chart
np Chart for TAPONADO
0 4 8 12 16 20
Subgroup
0
2
4
6
8
np
CTR = 1,75
UCL = 5,54
LCL = 0,00

Grado en Ingeniería. Estadística. Tema 3Número de transparencia: 54
Control charts for attributesControl Control chartscharts forfor attributesattributes
Chart for the NUMBER of defects in the sample : NP-chart
Chart for the PROPORTION of defects in the sample : P-chart
−+=
=
−+=
n
pppLCL
pCL
n
pppUCL
)(
)(
13
13
−−=
=−+=
)(
)(
pnpnpLCL
npCL
pnpnpUCL
13
13
np Chart for Col_5
0 5 10 15 20 25 30
Subgroup
0
4
8
12
16
20
24
np
CTR = 11,57
UCL = 20,51
LCL = 2,62
p Chart for Col_6
0 5 10 15 20 25 30
Subgroup
0
0,1
0,2
0,3
0,4
0,5
p
CTR = 0,23
UCL = 0,41
LCL = 0,05

Grado en Ingeniería. Estadística. Tema 3Número de transparencia: 55
SPC for attributes. Determining the process capabilitySPC SPC forfor attributesattributes. . DeterminingDetermining thethe processprocess capabilitycapability
If we call the proportion of defects of a process, p, thenthe CAPABILITY OF THE PROCESS is defined as
CAPABILITY = 1 – p
To determine the capacity means to determine theproportion of defects, p, in controlled conditions
Premises:
1. The proportion of defective components is stable in thelong-term
2. The fact that each component is defective is independentof whether the previous or next component is defective

Grado en Ingeniería. Estadística. Tema 3Número de transparencia: 56
SPC for attributes. Determining the process capabilitySPC SPC forfor attributesattributes. . DeterminingDetermining thethe processprocess capabilitycapability
Process:
1. We take samples and count the number of defects thatoccur in each
2. We estimate the proportion of defects
3. We check that all of the samples come from a controlledsituation (and we reject/do not use those that do not). We plot the number of defects in a control chart.

Grado en Ingeniería. Estadística. Tema 3Número de transparencia: 57
Example - Determining the process capabilityExampleExample -- DeterminingDetermining thethe processprocess capabilitycapability
We want to control the “capping” process of bottles using the number of defects detected. It isrequired to calculate the process capability of the capping with samples of size 20 using thevariable “taponado”
Statgraphics. Menu: Special/Quality control / Attributes Control Chart / np-chartSubgroup sizes = 20Right button : Select “Initial study”.

Grado en Ingeniería. Estadística. Tema 3Número de transparencia: 58
Example - Determining the process capabilityExampleExample -- DeterminingDetermining thethe processprocess capabilitycapability
1.1.1.1. WeWeWeWe estimateestimateestimateestimate pppp
08.0=p)
np - Initial Study for TAPONADO
Number of subgroups = 20Subgroup size = 20,00 subgroups excluded
np Chart--------UCL: +3,0 sigma = 5,54103Centerline = 1,75LCL: -3,0 sigma = 0,0
1 beyond limits
Estimates---------Mean np = 1,75Sigma = 1,26368
( np / p = 0.0875 )

Grado en Ingeniería. Estadística. Tema 3Número de transparencia: 59
Example - Determining the process capabilityExampleExample -- DeterminingDetermining thethe processprocess capabilitycapability
2. 2. 2. 2. WeWeWeWe calculatecalculatecalculatecalculate thethethethe control control control control chartchartchartchart andandandand wewewewe plotplotplotplot thethethethe samplessamplessamplessamples....WeWeWeWe eliminateeliminateeliminateeliminate thethethethe samplessamplessamplessamples thatthatthatthat are are are are outsideoutsideoutsideoutside thethethethe control control control control limitslimitslimitslimits
=−−=
===−+=
0)1(3
75.1
54.5)1(3
ppnpnLCS
pnLC
ppnpnLCS
)))
)
)))
np Chart for TAPONADO
Subgroup
np
CTR = 1,75
UCL = 5,54
LCL = 0,00
0 4 8 12 16 20
0
2
4
6
8
We must eliminate sample 11 because it is outside thecontrol limits

Grado en Ingeniería. Estadística. Tema 3Número de transparencia: 60
Example - Determining the process capabilityExampleExample -- DeterminingDetermining thethe processprocess capabilitycapability
3. 3. 3. 3. WeWeWeWe eliminateeliminateeliminateeliminate samplesamplesamplesample 11 11 11 11 ((((StatgraphicsStatgraphicsStatgraphicsStatgraphics: : : : ExcludeExcludeExcludeExclude / / / / automaticautomaticautomaticautomatic))))
TheTheTheThe restrestrestrest are are are are insideinsideinsideinside thethethethe limitslimitslimitslimits
np Chart for TAPONADO
Subgroup
np
CTR = 1,42
UCL = 4,87
LCL = 0,00
0 4 8 12 16 20
0
2
4
6
8
07110.=p) Processcapability = 0.93
Estimates---------Mean np = 1,42105Sigma = 1,14895

Grado en Ingeniería. Estadística. Tema 3Número de transparencia: 61
SPC for attributes. Process monitoringSPC SPC forfor attributesattributes. . ProcessProcess monitoringmonitoring
Samples are taken periodically
The number of defective components are plotted on a control chart
Any point outside the comtrol limits, or any non-randombehaviour is an indication of statistical evidence that theprocess is not in control. (The same as we did forcontrol of variables)

Grado en Ingeniería. Estadística. Tema 3Número de transparencia: 62
Example. Process monitoringExampleExample. . ProcessProcess monitoringmonitoring
It is required to control a bottle capping process the number of defects detected. For this, wetake a sample of size 20 every hour. Now we show how to obtain the control chart for the numberof defects
Which samples do not demonstrate statistical control?Statgraphics.
Menu: Special/Quality control / Attributes Control Chart / np-chartData: TAPONADO LINEASubgroup size = 20Right button: Select “control to Standard”. “Specify parameter” , np=20*0.07=1.4

Grado en Ingeniería. Estadística. Tema 3Número de transparencia: 63
Example. Process monitoringExampleExample. . ProcessProcess monitoringmonitoring
np Chart for TAPONADO LINEA
Subgroup
np
CTR = 1,42
UCL = 4,87
LCL = 0,00
0 4 8 12 16 20
0
2
4
6
8
10
12np Chart--------UCL: +3,0 sigma = 4,82316Centerline = 1,4LCL: -3,0 sigma = 0,0
It is required to control a bottle capping process the number of defects detected. For this, wetake a sample of size 20 every hour. Now we show how to obtain the control chart for the numberof defects
Which samples do not demonstrate statistical control?Statgraphics.
Menu: Special/Quality control / Attributes Control Chart / np-chartData: TAPONADO LINEASubgroup size = 20Right button: Select “control to Standard”. “Specify parameter” , np=20*0.07=1.4


