ISBN: 978-1-912116-05-8$175 / £125 / €150www.preqin.com
2018PREQIN GLOBALPRIVATE EQUITY &VENTURE CAPITALREPORT
SAMPLE PAGES
© Preqin Ltd. 2018 / www.preqin.com2
CONTENTS
PREQIN’S PRIVATE EQUITY DATA
Preqin’s private equity data has helped thousands of private equity professionals raise capital, identify investment opportunities, develop new business and form new partnerships. Constantly updated by a team of dedicated analysts, this comprehensive resource provides the most up-to-date information on all areas of private equity.
www.preqin.com/privateequity
CEO’s Foreword - Mark O’Hare 4
1: 2018 PREQIN GLOBAL PRIVATE EQUITY & VENTURE CAPITAL REPORT
Keynote Address: Finding Opportunity in the Current Market - Johannes Huth, KKR
6
2: OVERVIEW OF THE PRIVATE EQUITY & VENTURE CAPITAL INDUSTRY
Private Equity in Context 10
Private Equity: 2017 in Numbers 14
Private Equity in 2018 - Christopher Elvin, Preqin 15
Diversity as a Long-Term Strategy - Bronwyn Bailey, American Investment Council
16
The UK Policy Agenda in 2018 - Gurpreet Manku, BVCA 17
Beyond Alpha: Five Top LP Issues for 2018 - Jennifer Choi, ILPA
18
3: ASSETS UNDER MANAGEMENT AND DRY POWDER
Deployment Is Key - Moose Guen, MVision 20
Assets under Management and Dry Powder 22
4: FUNDRAISING
Moving from Strategic Thinking to Investment - Stanislas Cuny, Amundi
26
Longhold Funds - The Next Wave of Private Equity Innovation? - Michael Murphy, Credit Suisse Private Fund Group
28
Ample Room for Private Equity Investors in Turkey - Arda Ermut, Invest in Turkey
30
2017 Fundraising Market 31
Funds in Market 34
In Focus: Regional Fundraising 36
North American Fundraising 37
European Fundraising 38
Asian Fundraising 39
Rest of World Fundraising 40
5: FUND MANAGERS
Ready or Not: ESG Is Coming - Chris Ferguson, Preqin Solutions
42
Fund Manager Outlook for 2018 44
Fund Manager Views on Investor Appetite 46
First-Time Fund Managers 47
Largest Fund Managers 50
Compensation and Employment 52
6: ALTERNATIVE STRUCTURES
Alternative Structures 54
7: PERFORMANCE
Mitigating the Performance Impact of Subscription Credit Facilities - Oliver Gottschalg, PERACS
58
Performance Overview 61
PrEQIn Private Equity Quarterly Index 63
Horizon Returns 64
Private Equity Returns for Public Pension Funds 65
Private Equity Performance Benchmarks 66
Consistent Performing Fund Managers 68
8: INVESTORS
Pre-Fundraising Checklist: Have You Outgrown Counsel? - Clay Deniger, Capstone Partners
72
Evolution of the Investor Universe 73
Investor Appetite for Private Equity in 2018 76
Sample Investors to Watch in 2018 79
2018 PREQIN GLOBAL PRIVATE EQUITY & VENTURE CAPITAL REPORT - SAMPLE PAGES
3
DATA PACK FOR 2018 PREQIN GLOBAL PRIVATE EQUITY & VENTURE CAPITAL REPORT
The data behind all of the charts and infographics featured in this report is available to purchase in Excel format. Ready-made charts and graphs are also available, and can be used for marketing materials, presentations or company reports.
www.preqin.com/gper
How Investors Source and Select Funds 80
Largest Investors by Region 81
Largest Investors by Type 82
9: INVESTMENT CONSULTANTS
Investment Consultant Outlook for 2018 84
10: FUND TERMS AND CONDITIONS
Fund Terms and Conditions 88
11: BUYOUT
The New Imperatives for Deal Origination - Hugo Parson & Frank Reynolds, EY
92
Buyout Fundraising 93
Buyout Fund Managers 94
Buyout Performance Benchmarks 95
Private Equity-Backed Buyout Deals 97
Deal Flow by Type, Value and Industry 99
Private Equity-Backed Buyout Exits 100
Industry Focus: Industrials 101
Industry Focus: Information Technology 102
Industry Focus: Consumer & Retail 103
Largest Buyout Deals and Exits 104
12: VENTURE CAPITAL
Venture Capital Fundraising 106
Venture Capital Fund Managers 107
Venture Capital Performance Benchmarks 108
Venture Capital Deals 110
Deal Flow by Stage and Industry 112
Venture Capital Exits 113
Industry Focus: Internet 114
Industry Focus: Software 115
Industry Focus: Telecoms 116
Largest Venture Capital Deals and Notable Exits 117
13: GROWTH
Growth Fundraising 120
Growth Fund Managers 122
Growth Performance Benchmarks 123
Growth Deals 124
14: FUNDS OF FUNDS
Fund of Funds Fundraising 126
Fund of Funds Managers 127
Fund of Funds Performance Benchmarks 128
15: SECONDARY MARKET
Overview of the Secondary Market 130
Secondaries Fundraising 133
Secondary Fund of Funds Managers 134
Direct Secondaries 135
Intermediaries 136
16: SERVICE PROVIDERS
Placement Agents 138
Fund Administrators 141
Fund Auditors 142
Law Firms: Fund Formation 143
Law Firms: Transactions 144
2018 PREQIN GLOBAL PRIVATE EQUITY & VENTURE CAPITAL REPORT - SAMPLE PAGES
© Preqin Ltd. 2018 / www.preqin.com6
1. 2018 PREQIN GLOBAL PRIVATE EQUITY & VENTURE CAPITAL REPORT
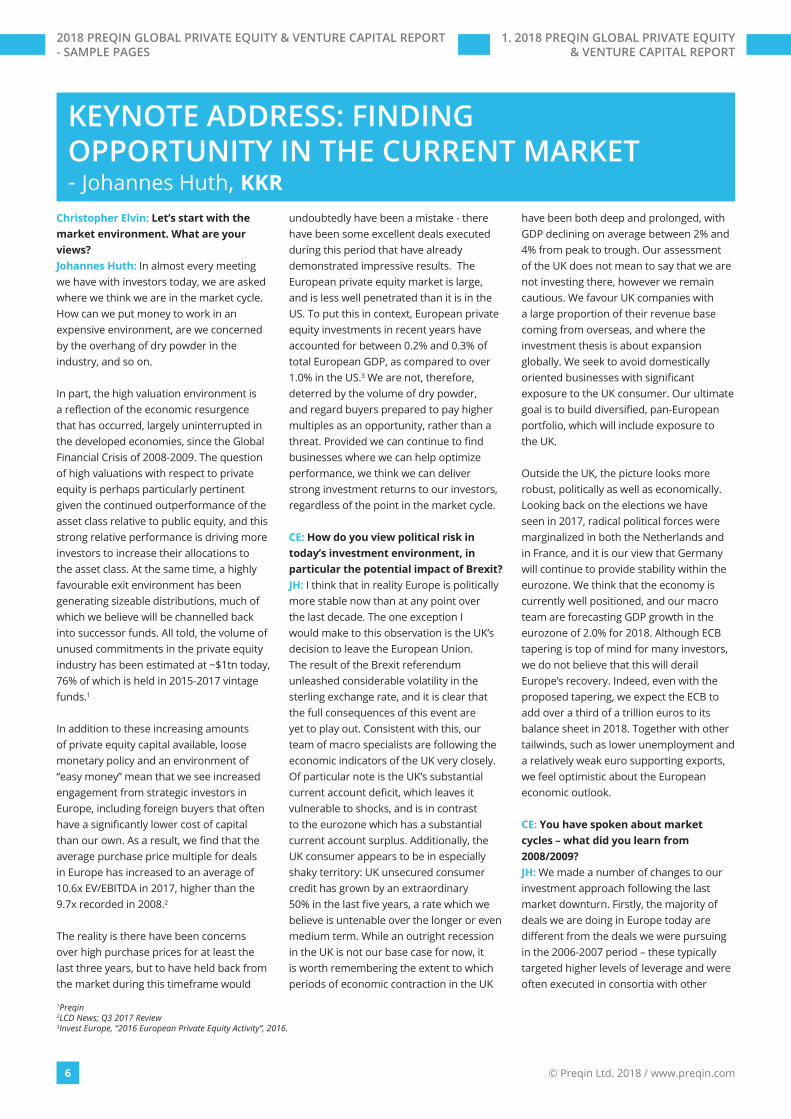
Christopher Elvin: Let’s start with the market environment. What are your views?Johannes Huth: In almost every meeting we have with investors today, we are asked where we think we are in the market cycle. How can we put money to work in an expensive environment, are we concerned by the overhang of dry powder in the industry, and so on.
In part, the high valuation environment is a reflection of the economic resurgence that has occurred, largely uninterrupted in the developed economies, since the Global Financial Crisis of 2008-2009. The question of high valuations with respect to private equity is perhaps particularly pertinent given the continued outperformance of the asset class relative to public equity, and this strong relative performance is driving more investors to increase their allocations to the asset class. At the same time, a highly favourable exit environment has been generating sizeable distributions, much of which we believe will be channelled back into successor funds. All told, the volume of unused commitments in the private equity industry has been estimated at ~$1tn today, 76% of which is held in 2015-2017 vintage funds.1
In addition to these increasing amounts of private equity capital available, loose monetary policy and an environment of “easy money” mean that we see increased engagement from strategic investors in Europe, including foreign buyers that often have a significantly lower cost of capital than our own. As a result, we find that the average purchase price multiple for deals in Europe has increased to an average of 10.6x EV/EBITDA in 2017, higher than the 9.7x recorded in 2008.2
The reality is there have been concerns over high purchase prices for at least the last three years, but to have held back from the market during this timeframe would
undoubtedly have been a mistake - there have been some excellent deals executed during this period that have already demonstrated impressive results. The European private equity market is large, and is less well penetrated than it is in the US. To put this in context, European private equity investments in recent years have accounted for between 0.2% and 0.3% of total European GDP, as compared to over 1.0% in the US.3 We are not, therefore, deterred by the volume of dry powder, and regard buyers prepared to pay higher multiples as an opportunity, rather than a threat. Provided we can continue to find businesses where we can help optimize performance, we think we can deliver strong investment returns to our investors, regardless of the point in the market cycle.
CE: How do you view political risk in today’s investment environment, in particular the potential impact of Brexit?JH: I think that in reality Europe is politically more stable now than at any point over the last decade. The one exception I would make to this observation is the UK’s decision to leave the European Union. The result of the Brexit referendum unleashed considerable volatility in the sterling exchange rate, and it is clear that the full consequences of this event are yet to play out. Consistent with this, our team of macro specialists are following the economic indicators of the UK very closely. Of particular note is the UK’s substantial current account deficit, which leaves it vulnerable to shocks, and is in contrast to the eurozone which has a substantial current account surplus. Additionally, the UK consumer appears to be in especially shaky territory: UK unsecured consumer credit has grown by an extraordinary 50% in the last five years, a rate which we believe is untenable over the longer or even medium term. While an outright recession in the UK is not our base case for now, it is worth remembering the extent to which periods of economic contraction in the UK
have been both deep and prolonged, with GDP declining on average between 2% and 4% from peak to trough. Our assessment of the UK does not mean to say that we are not investing there, however we remain cautious. We favour UK companies with a large proportion of their revenue base coming from overseas, and where the investment thesis is about expansion globally. We seek to avoid domestically oriented businesses with significant exposure to the UK consumer. Our ultimate goal is to build diversified, pan-European portfolio, which will include exposure to the UK.
Outside the UK, the picture looks more robust, politically as well as economically. Looking back on the elections we have seen in 2017, radical political forces were marginalized in both the Netherlands and in France, and it is our view that Germany will continue to provide stability within the eurozone. We think that the economy is currently well positioned, and our macro team are forecasting GDP growth in the eurozone of 2.0% for 2018. Although ECB tapering is top of mind for many investors, we do not believe that this will derail Europe’s recovery. Indeed, even with the proposed tapering, we expect the ECB to add over a third of a trillion euros to its balance sheet in 2018. Together with other tailwinds, such as lower unemployment and a relatively weak euro supporting exports, we feel optimistic about the European economic outlook.
CE: You have spoken about market cycles – what did you learn from 2008/2009? JH: We made a number of changes to our investment approach following the last market downturn. Firstly, the majority of deals we are doing in Europe today are different from the deals we were pursuing in the 2006-2007 period – these typically targeted higher levels of leverage and were often executed in consortia with other
KEYNOTE ADDRESS: FINDING OPPORTUNITY IN THE CURRENT MARKET- Johannes Huth, KKR
1Preqin 2LCD News; Q3 2017 Review3Invest Europe, “2016 European Private Equity Activity”, 2016.
2018 PREQIN GLOBAL PRIVATE EQUITY & VENTURE CAPITAL REPORT - SAMPLE PAGES
7
financial sponsors. This sometimes comes as a surprise to people, but in contrast to our reputation for “mega-buyout” deals, our average equity cheque since 2009 has been €200m. Over the same period, our average entry leverage has been relatively conservative, at 3.3x net debt/EBITDA. That said, we can leverage our balance sheet and established co-investment program to enable us to review a very broad spectrum of opportunities, and will still consider large deals – like the recent carve-out of the spreads business from Unilever. However, our most typical deal today is in what we term the “upper mid-market”, or roughly between €500m and €2bn in enterprise value. We think this is an attractive area of the market given the wealth of deal flow we see, and because this size of business is often best positioned to benefit from the resources that we can bring as a partner.
Secondly, we deepened our local footprint in our core European markets and established local investment and portfolio management committees. We still have global representation on these committees in the form of KKR’s co-founders, Henry Kravis and George Roberts, and co-president, Joe Bae; however, the majority of both committees are members of our European teams. I believe this helps to ensure deeper accountability from the investment team, and means that our local expertise is genuinely shaping our investment decisions.
Beyond these enhancements to our investment approach and process, we have proactively developed significant resources that can help support our investment businesses. I have mentioned our macro team already, who bring a very important dimension to our understanding of each opportunity we consider. They provide a top-down perspective that helps identify investment themes and secular
trends, and they assist with portfolio construction, where their work can help us avoid unintended overexposure to key macro risks. Additional capabilities include the incorporation of ESG criteria into our investment screening and management practices, an area in which we believe we have become thought leaders for the industry.
CE: How is KKR positioning itself for investment opportunities in Europe today? JH: Our starting point is always asking: what can we bring to an investment beyond being simply providers of capital? We have an experienced private equity team in Europe, but KKR also has a wealth of resources globally that we believe make us better investors and more attractive partners to the businesses we invest in. For example, we have one of the largest private equity businesses in the US and Asia; we have a group of operating experts, KKR Capstone, with over 50 people worldwide; and we have a network of over 100 portfolio companies globally, with approximately $100bn in annual revenues, which can help our European companies gain access to new markets.
We think that the power of our firm-wide resources makes us an attractive partner to businesses, and we see this thesis being proved out in our deal track record. Over two-thirds of the portfolio companies we have invested in since 2009 have been partnership transactions, where a family owner, founding entrepreneur or corporate shareholder has rolled a significant portion of their stake in a business into a new partnership with us. We work together with our partners to implement value creation initiatives that impact top-line growth as well as EBITDA margin expansion, support accretive M&A, and utilize our global footprint to help internationalize local
European businesses. Often, we find that we are selected as the partner of choice by the owners of a company on the basis of the toolkit that we can bring, even in instances where we are not offering the highest price.
CE: What do you believe the main challenges are for LPs looking to invest in 2018?JH: Investors drafting their asset allocation plans for 2018 face difficult choices about where to find the best risk-adjusted returns for their capital. As a practitioner of private equity, I think that the continued outperformance of private equity relative to public equity makes as strong a case as any for allocations to the asset class. I think another important point is that consistent and disciplined deployment to funds across vintages is critical, given how notoriously difficult it is to time markets. One of the advantages of illiquid funds is that they are structured to invest across market cycles, in our case over investment periods of six years, so by committing to a given vintage investors should get some comfort from the fact that not all their capital is being put at risk on day one.
In my view, one of the greater potential challenges to investors in 2018 will actually be getting access to the right managers. We have seen record volumes of capital distributed to investors, the demand for re-ups has been high and target allocations are growing. Many limited partners are placing pressure on managers not to drastically increase the size of their funds, but at the same time we have also had the experience, in KKR’s most recent series of private equity fundraises globally, of having to cut back on investor allocations. As such, I believe that some growth of fund size – within reason – is appropriate, as this is a reflection of the continued (and in our view sustainable) growth of the private equity industry as it continues to perform and evolve.
KKRKKR is a leading global investment firm that manages multiple alternative asset classes, including private equity, energy, infrastructure, real estate, credit and, through its strategic manager partnerships, hedge funds. KKR aims to generate attractive investment returns by following a patient and disciplined investment approach, employing world-class people, and driving growth and value creation with KKR portfolio companies. KKR invests its own capital alongside its partners' capital and provides financing solutions and investment opportunities through its capital markets business.
www.kkr.com
1. 2018 PREQIN GLOBAL PRIVATE EQUITY & VENTURE CAPITAL REPORT
2018 PREQIN GLOBAL PRIVATE EQUITY & VENTURE CAPITAL REPORT - SAMPLE PAGES

© Preqin Ltd. 2018 / www.preqin.com14
2. OVERVIEW OF THE PRIVATE EQUITY & VENTURE CAPITAL INDUSTRY
PRIVATE EQUITY: 2017 IN NUMBERS$453bnAggregate capital raised by 921 private equity funds closed in 2017.
95%of investors felt their private equity investments met or exceeded their expectations in 2017.
$233bnTotal capital distributed in H1 2017, following the record $520bn distributedin 2016.
4,191Number of private equity-backed buyout deals completed in 2017, for an aggregate $347bn.
$2.83tnPrivate equity assets under management as at June 2017, an all-time high.
53%of investors plan to increase their allocation to private equity over the longer term, a record proportion.
88%of investors consider valuations to be the greatest challenge facing the private equity industry in the year ahead.
$182bnAggregate value of 11,145 venture capital deals completed in 2017, an all-timehigh.
FUNDRAISING
EXPECTATIONS
AUM
DISTRIBUTIONS
BUYOUT
LP APPETITE
VEN
TU
RE CAPITAL
LP C
ONCERNS
2018 PREQIN GLOBAL PRIVATE EQUITY & VENTURE CAPITAL REPORT - SAMPLE PAGES

4. FUNDRAISING
15
PRIVATE EQUITY IN 2018- Christopher Elvin, Preqin
In my introduction to last year’s report I wrote “private equity is well positioned
for another strong year in 2017,” and that “fundraising has rarely looked so appealing”. Hindsight is a wonderful thing; however, it is fair to say that 2017 surpassed my expectations, particularly in terms of fundraising and the continued growth of the industry. Total AUM for the asset class now stands at $2.83tn as at June 2017 (the latest data available), an increase of $248bn since the end of 2016.
UNPRECEDENTED PERIOD FOR FUNDRAISINGWhile many in the industry anticipated 2017 would be another strong year for private equity fundraising, I suspect few would have predicted that 2017 would witness the largest amount of capital ($453bn) raised in any year. Not only was a record amount of capital raised but the speed and success with which fund managers raised their capital was unparalleled: of the funds to reach a final close, 30% spent less than six months in market and 79% of funds met or exceeded their fundraising target. 2017 marked the fifth consecutive year in which private equity fundraising has surpassed $300bn; even in the build-up to the GFC, only three consecutive years (2006-2008) saw fundraising surpass $300bn, which illustrates the unprecedented period of private equity fundraising that we are in.
Despite the success that many fund managers are having, one of the clear, persisting trends within the industry is the growing concentration of capital among fewer funds. Although a record amount of capital was raised in 2017, 322 fewer funds reached a final close than in 2016, resulting in the average fund size increasing to $535mn from $384mn. In short, the gap between the haves and have nots is widening – first-time funds accounted for just 6% of capital secured by funds in 2017.
CONCERNS PERSIST OVER HIGH PRICESPreqin’s survey results show that entry prices for assets have been at the forefront
of investors’ and fund managers’ minds for the past three years. This concern has reached new highs though as we move into 2018, with the latest survey results showing that 88% of LPs and 62% of GPs perceive pricing, and the impact it may have on future returns, to be the biggest challenge facing the private equity industry in 2018.
Despite these concerns, strong fundraising and the resulting rise in dry powder levels meant that the number of private equity-backed buyout deals completed in 2017 remained on par with the past four years, with over 4,000 deals completed. Aggregate deal value increased slightly on 2016 to $347bn; however, this still represents a 19% fall from 2015 and less than half of the value seen back in 2007. Venture capital, however, saw fewer transactions completed in 2017 (11,145), but the value of transactions increased by 28% compared to 2016 to reach an all-time high of $182bn.
While high pricing is common to most asset classes today, many GPs remain confident in their ability to innovate and find value. LPs, however, appear to be more pessimistic: 34% of LPs expect current valuations to result in lower returns in the longer term.
ONGOING MARKET EVOLUTION Given the illiquid and long-term nature of private equity, change within the asset class can sometimes appear somewhat slow paced; however, we are probably in a period when there has never been so much change.
We have seen GPs expand their offerings to include multi-product strategies, long-life funds and, more recently, using the secondary market to extend ownership of assets. Meanwhile, ESG and responsible investment practices have come to the fore and there is a real focus among fund managers to provide excellent returns to their investors by building best-practice businesses. LPs too are innovating and becoming increasingly sensitive around
anything that impacts net performance, and are set to increase their use of alternative structures to access the asset class.
2017 witnessed further fines from the SEC to private equity firms for inaccurate disclosure of fees as well as new reporting guidelines from ILPA over the use of subscription credit lines by GPs. Demand for even greater transparency, particularly surrounding fees paid by LPs, is only going to continue. We are also in a period of extraordinary technological advancement which is having a significant impact on private equity firms, both in terms of the underlying portfolio companies that they are looking to invest in but also from an internal operations and reporting standpoint.
OUTLOOK FOR 2018With dry powder levels now exceeding $1tn, bull market conditions and increased competition from direct investors, high entry prices for assets look set to continue for the foreseeable future.
The reality is that fund managers will have to continue to put capital to work irrespective of market conditions, and while exit activity has declined for three consecutive years, more than a third of fund managers expect exit activity to increase in the next 12 months; a further 50% expect exit activity to remain at the same level.
Despite concerns over the impact of high pricing on future returns, Preqin’s investor survey results show LPs remain satisfied with the returns their private equity portfolios are delivering and continue to have an avid appetite for the asset class. While H1 2017 data shows that net distributions are not at the levels seen between 2014 and 2016, they continue to exceed capital calls and increase LP liquidity. As a result, 2018 is likely to be another very strong fundraising year – a given if SoftBank Vision Fund reaches a final close!
2. OVERVIEW OF THE PRIVATE EQUITY & VENTURE CAPITAL INDUSTRY
2018 PREQIN GLOBAL PRIVATE EQUITY & VENTURE CAPITAL REPORT - SAMPLE PAGES
4. FUNDRAISING
31
2017 FUNDRAISING MARKET
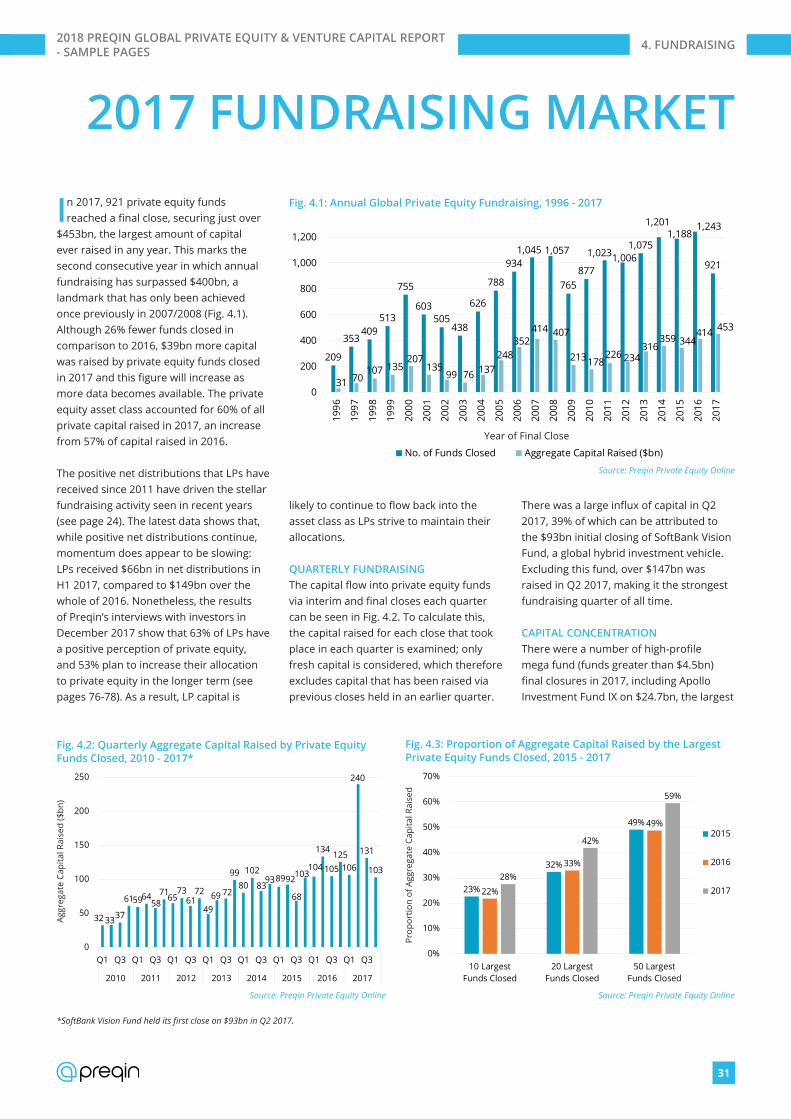
In 2017, 921 private equity funds reached a final close, securing just over
$453bn, the largest amount of capital ever raised in any year. This marks the second consecutive year in which annual fundraising has surpassed $400bn, a landmark that has only been achieved once previously in 2007/2008 (Fig. 4.1). Although 26% fewer funds closed in comparison to 2016, $39bn more capital was raised by private equity funds closed in 2017 and this figure will increase as more data becomes available. The private equity asset class accounted for 60% of all private capital raised in 2017, an increase from 57% of capital raised in 2016.
The positive net distributions that LPs have received since 2011 have driven the stellar fundraising activity seen in recent years (see page 24). The latest data shows that, while positive net distributions continue, momentum does appear to be slowing: LPs received $66bn in net distributions in H1 2017, compared to $149bn over the whole of 2016. Nonetheless, the results of Preqin’s interviews with investors in December 2017 show that 63% of LPs have a positive perception of private equity, and 53% plan to increase their allocation to private equity in the longer term (see pages 76-78). As a result, LP capital is
likely to continue to flow back into the asset class as LPs strive to maintain their allocations.
QUARTERLY FUNDRAISINGThe capital flow into private equity funds via interim and final closes each quarter can be seen in Fig. 4.2. To calculate this, the capital raised for each close that took place in each quarter is examined; only fresh capital is considered, which therefore excludes capital that has been raised via previous closes held in an earlier quarter.
There was a large influx of capital in Q2 2017, 39% of which can be attributed to the $93bn initial closing of SoftBank Vision Fund, a global hybrid investment vehicle. Excluding this fund, over $147bn was raised in Q2 2017, making it the strongest fundraising quarter of all time.
CAPITAL CONCENTRATIONThere were a number of high-profile mega fund (funds greater than $4.5bn) final closures in 2017, including Apollo Investment Fund IX on $24.7bn, the largest
32 3337
61596458
716573
6172
4969 72
9980
102
83938992
68
103104
134
105125
106
240
131
103
0
50
100
150
200
250
Q1 Q3 Q1 Q3 Q1 Q3 Q1 Q3 Q1 Q3 Q1 Q3 Q1 Q3 Q1 Q3
2010 2011 2012 2013 2014 2015 2016 2017
Source: Preqin Private Equity Online
Aggr
egat
e Ca
pita
l Rai
sed
($bn
)
Fig. 4.2: Quarterly Aggregate Capital Raised by Private Equity Funds Closed, 2010 - 2017*
23%
32%
49%
22%
33%
49%
28%
42%
59%
0%
10%
20%
30%
40%
50%
60%
70%
10 LargestFunds Closed
20 LargestFunds Closed
50 LargestFunds Closed
2015
2016
2017
Source: Preqin Private Equity Online
Prop
ortio
n of
Agg
rega
te C
apita
l Rai
sed
Fig. 4.3: Proportion of Aggregate Capital Raised by the Largest Private Equity Funds Closed, 2015 - 2017
209
353409
513
755
603505
438
626
788
9341,045 1,057
765877
1,0231,0061,075
1,2011,188
1,243
921
31 70107 135
207135
99 76 137248
352414 407
213178226 234
316359 344
414 453
0
200
400
600
800
1,000
1,200
1996
1997
1998
1999
2000
2001
2002
2003
2004
2005
2006
2007
2008
2009
2010
2011
2012
2013
2014
2015
2016
2017
No. of Funds Closed Aggregate Capital Raised ($bn)
Source: Preqin Private Equity Online
Year of Final Close
Fig. 4.1: Annual Global Private Equity Fundraising, 1996 - 2017
*SoftBank Vision Fund held its first close on $93bn in Q2 2017.
2018 PREQIN GLOBAL PRIVATE EQUITY & VENTURE CAPITAL REPORT - SAMPLE PAGES
© Preqin Ltd. 2018 / www.preqin.com66
2018 PREQIN GLOBAL PRIVATE EQUITY & VENTURE CAPITAL REPORT - SAMPLE PAGES
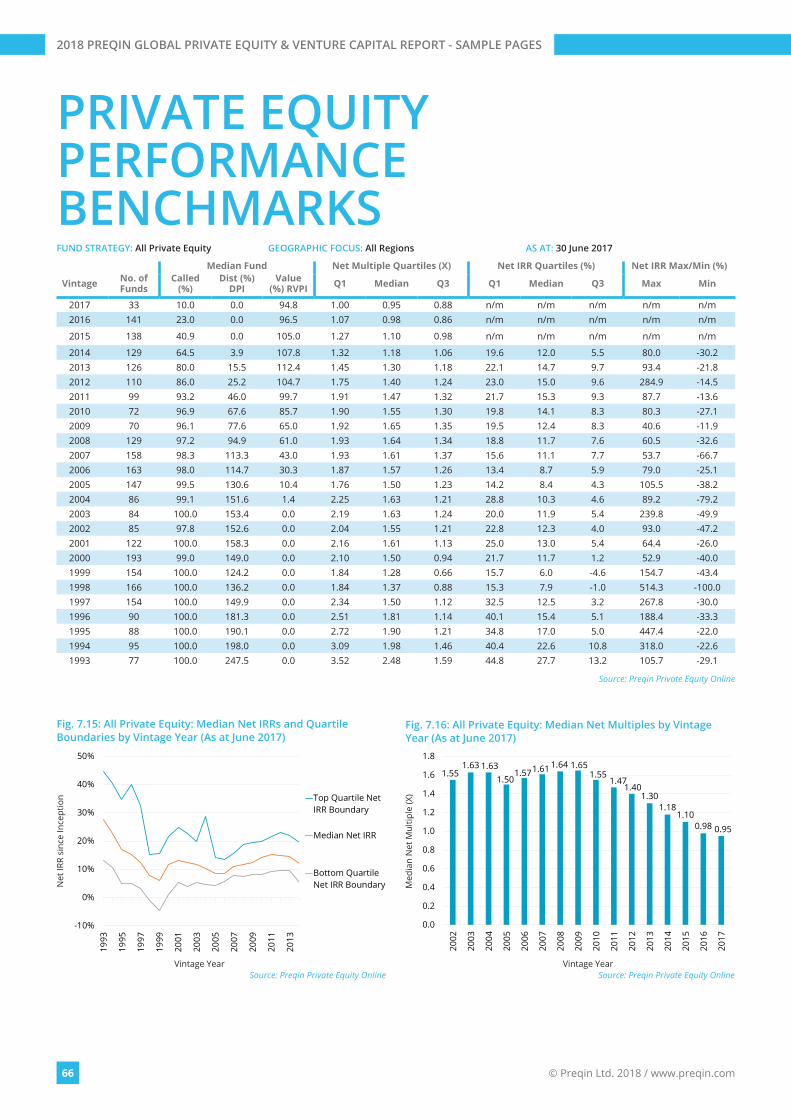
PRIVATE EQUITY PERFORMANCE BENCHMARKSFUND STRATEGY: All Private Equity GEOGRAPHIC FOCUS: All Regions AS AT: 30 June 2017
Median Fund Net Multiple Quartiles (X) Net IRR Quartiles (%) Net IRR Max/Min (%)
Vintage No. of Funds
Called (%)
Dist (%) DPI
Value (%) RVPI Q1 Median Q3 Q1 Median Q3 Max Min
2017 33 10.0 0.0 94.8 1.00 0.95 0.88 n/m n/m n/m n/m n/m2016 141 23.0 0.0 96.5 1.07 0.98 0.86 n/m n/m n/m n/m n/m
2015 138 40.9 0.0 105.0 1.27 1.10 0.98 n/m n/m n/m n/m n/m
2014 129 64.5 3.9 107.8 1.32 1.18 1.06 19.6 12.0 5.5 80.0 -30.22013 126 80.0 15.5 112.4 1.45 1.30 1.18 22.1 14.7 9.7 93.4 -21.82012 110 86.0 25.2 104.7 1.75 1.40 1.24 23.0 15.0 9.6 284.9 -14.52011 99 93.2 46.0 99.7 1.91 1.47 1.32 21.7 15.3 9.3 87.7 -13.62010 72 96.9 67.6 85.7 1.90 1.55 1.30 19.8 14.1 8.3 80.3 -27.12009 70 96.1 77.6 65.0 1.92 1.65 1.35 19.5 12.4 8.3 40.6 -11.92008 129 97.2 94.9 61.0 1.93 1.64 1.34 18.8 11.7 7.6 60.5 -32.62007 158 98.3 113.3 43.0 1.93 1.61 1.37 15.6 11.1 7.7 53.7 -66.72006 163 98.0 114.7 30.3 1.87 1.57 1.26 13.4 8.7 5.9 79.0 -25.12005 147 99.5 130.6 10.4 1.76 1.50 1.23 14.2 8.4 4.3 105.5 -38.22004 86 99.1 151.6 1.4 2.25 1.63 1.21 28.8 10.3 4.6 89.2 -79.22003 84 100.0 153.4 0.0 2.19 1.63 1.24 20.0 11.9 5.4 239.8 -49.92002 85 97.8 152.6 0.0 2.04 1.55 1.21 22.8 12.3 4.0 93.0 -47.22001 122 100.0 158.3 0.0 2.16 1.61 1.13 25.0 13.0 5.4 64.4 -26.02000 193 99.0 149.0 0.0 2.10 1.50 0.94 21.7 11.7 1.2 52.9 -40.01999 154 100.0 124.2 0.0 1.84 1.28 0.66 15.7 6.0 -4.6 154.7 -43.41998 166 100.0 136.2 0.0 1.84 1.37 0.88 15.3 7.9 -1.0 514.3 -100.01997 154 100.0 149.9 0.0 2.34 1.50 1.12 32.5 12.5 3.2 267.8 -30.01996 90 100.0 181.3 0.0 2.51 1.81 1.14 40.1 15.4 5.1 188.4 -33.31995 88 100.0 190.1 0.0 2.72 1.90 1.21 34.8 17.0 5.0 447.4 -22.01994 95 100.0 198.0 0.0 3.09 1.98 1.46 40.4 22.6 10.8 318.0 -22.61993 77 100.0 247.5 0.0 3.52 2.48 1.59 44.8 27.7 13.2 105.7 -29.1
Source: Preqin Private Equity Online
-10%
0%
10%
20%
30%
40%
50%
1993
1995
1997
1999
2001
2003
2005
2007
2009
2011
2013
Top Quartile NetIRR Boundary
Median Net IRR
Bottom QuartileNet IRR Boundary
Source: Preqin Private Equity Online
Net
IRR
sinc
e In
cept
ion
Vintage Year
Fig. 7.15: All Private Equity: Median Net IRRs and Quartile Boundaries by Vintage Year (As at June 2017)
1.551.63 1.63
1.501.571.61 1.64 1.65
1.551.47
1.401.30
1.181.10
0.98 0.95
0.0
0.2
0.4
0.6
0.8
1.0
1.2
1.4
1.6
1.8
2002
2003
2004
2005
2006
2007
2008
2009
2010
2011
2012
2013
2014
2015
2016
2017
Source: Preqin Private Equity Online
Med
ian
Net
Mul
tiple
(X)
Vintage Year
Fig. 7.16: All Private Equity: Median Net Multiples by Vintage Year (As at June 2017)

© Preqin Ltd. 2018 / www.preqin.com76
INVESTOR APPETITE FOR PRIVATE EQUITY IN 2018Preqin surveyed over 250 institutional
investors in private equity in December 2017 to determine their satisfaction with the asset class, their key concerns and their plans for the year ahead. Although the majority (63%) of investors have a positive perception of private equity at present, this is a 21-percentage-point decrease from the results of December 2016’s survey (84%). This is perhaps unsurprising given that the survey results also showed that 37% of LPs feel portfolio companies are currently overpriced and a market correction is imminent or likely in the next 12 months.
INVESTOR EXPECTATIONSDespite this, the same proportion (95%) of LPs feel that their private equity investments have met or exceeded their expectations in 2017 as in 2016, with a two-percentage-point rise in the proportion with surpassed expectations (Fig. 8.10). Strong performance resulting in high distributions back to LPs has helped to sustain positive investor sentiment – when asked about the performance of their private equity investments over the past three years, over a third (38%) of investors stated that their expectations had been exceeded, and a further 57% reported that their expectations had been met.
Investor sentiment with respect to venture capital is less optimistic: the proportion of LPs with a positive perception of the strategy has decreased from 41% in 2016’s survey to 34% in 2017, and the proportion of LPs with a negative perception has increased to 23% from 10% the previous year.
Furthermore, venture capital investments have fallen short of expectations according to 29% of those surveyed, although this is perhaps unsurprising given the higher risk profile of venture capital investments.
9%
9%
10%
10%
16%
18%
30%
39%
40%
88%
0% 20% 40% 60% 80% 100%
Regulation
Transparency
Governance
Availability/PricingPerformance
Volatility/Uncertaintyin Global Markets
of Debt Financing
Deal Flow
Fees
Exit Environment
Valuations
Source: Preqin Investor Interviews, December 2017Proportion of Respondents
Fig. 8.12: Investor Views on the Key Issues for Private Equity in 2018
15% 11% 8% 6% 5% 5%
74% 77%75%
64% 71% 69%
11% 13% 17%30% 24% 26%
0%
10%
20%
30%
40%
50%
60%
70%
80%
90%
100%
Dec-12 Dec-13 Dec-14 Dec-15 Dec-16 Dec-17
ExceededExpectations
Met Expectations
Fallen Short ofExpectations
Source: Preqin Investor Interviews, December 2012 - 2017
Prop
ortio
n of
Res
pond
ents
Fig. 8.10: Extent to Which Investors Feel Their Private Equity Fund Investments Have Lived up to Expectations over the Past 12 Months, 2012 - 2017
INVESTORS’ PERCEPTION OF PRIVATE EQUITY PERFORMANCE IN THE PAST
THREE YEARS
Exceeded ExpectationsMet ExpectationsFallen Short of Expectations
38%
57%
5%
8% 2% 3% 5% 6% 9%
9%11% 12%
18% 15%16%
29%43%
49% 37%30%
35%
54%43%
37% 40%49%
40%
0%
10%
20%
30%
40%
50%
60%
70%
80%
90%
100%
Dec-12 Dec-13 Dec-14 Dec-15 Dec-16 Dec-17
Public Market+4.1% and over
Public Market+2.1% to 4%
Public Market+2%
Same as PublicMarket
Source: Preqin Investor Interviews, December 2012 - 2017
Prop
ortio
n of
Res
pond
ents
Fig. 8.11: Investors’ Return Expectations for Their Private Equity Portfolios, 2012 - 2017
8. INVESTORS2018 PREQIN GLOBAL PRIVATE EQUITY & VENTURE CAPITAL REPORT - SAMPLE PAGES
© Preqin Ltd. 2018 / www.preqin.com104
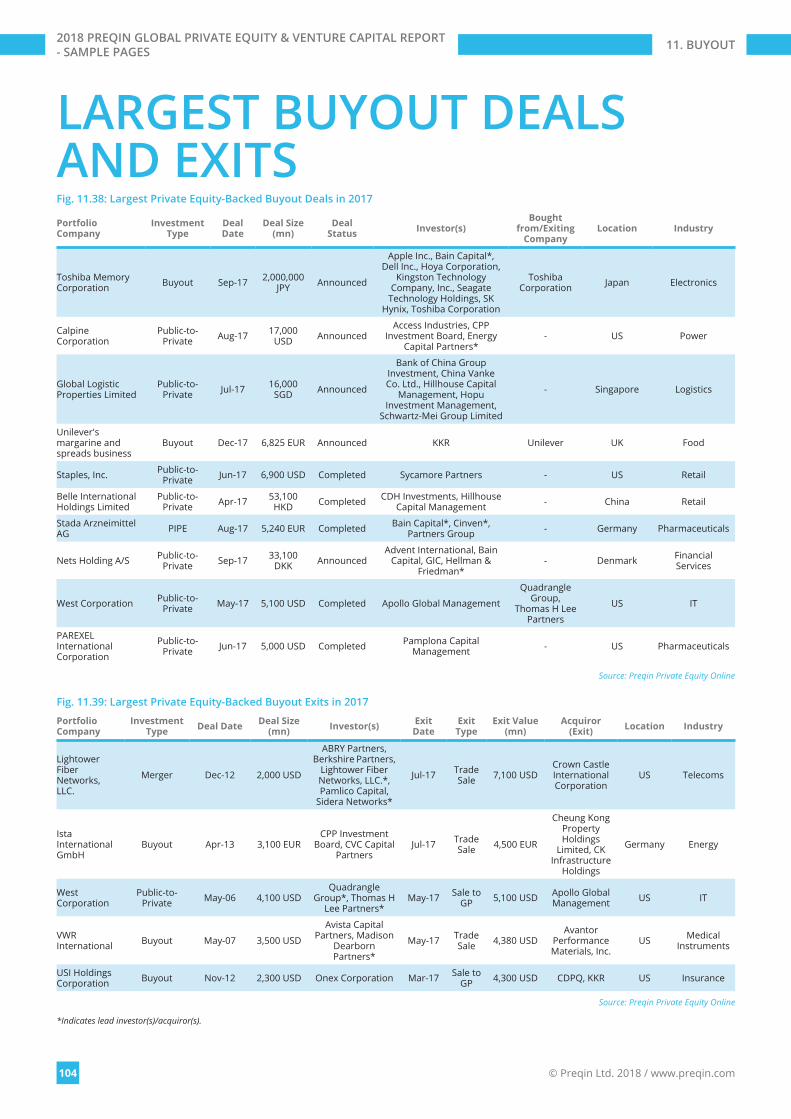
LARGEST BUYOUT DEALS AND EXITSFig. 11.38: Largest Private Equity-Backed Buyout Deals in 2017
Portfolio Company
Investment Type
Deal Date
Deal Size (mn)
Deal Status Investor(s)
Bought from/Exiting
CompanyLocation Industry
Toshiba Memory Corporation Buyout Sep-17 2,000,000
JPY Announced
Apple Inc., Bain Capital*, Dell Inc., Hoya Corporation,
Kingston Technology Company, Inc., Seagate
Technology Holdings, SK Hynix, Toshiba Corporation
Toshiba Corporation Japan Electronics
Calpine Corporation
Public-to-Private Aug-17 17,000
USD AnnouncedAccess Industries, CPP
Investment Board, Energy Capital Partners*
- US Power
Global Logistic Properties Limited
Public-to-Private Jul-17 16,000
SGD Announced
Bank of China Group Investment, China Vanke Co. Ltd., Hillhouse Capital
Management, Hopu Investment Management,
Schwartz-Mei Group Limited
- Singapore Logistics
Unilever's margarine and spreads business
Buyout Dec-17 6,825 EUR Announced KKR Unilever UK Food
Staples, Inc. Public-to-Private Jun-17 6,900 USD Completed Sycamore Partners - US Retail
Belle International Holdings Limited
Public-to-Private Apr-17 53,100
HKD Completed CDH Investments, Hillhouse Capital Management - China Retail
Stada Arzneimittel AG PIPE Aug-17 5,240 EUR Completed Bain Capital*, Cinven*,
Partners Group - Germany Pharmaceuticals
Nets Holding A/S Public-to-Private Sep-17 33,100
DKK AnnouncedAdvent International, Bain
Capital, GIC, Hellman & Friedman*
- Denmark Financial Services
West Corporation Public-to-Private May-17 5,100 USD Completed Apollo Global Management
Quadrangle Group,
Thomas H Lee Partners
US IT
PAREXEL International Corporation
Public-to-Private Jun-17 5,000 USD Completed Pamplona Capital
Management - US Pharmaceuticals
Source: Preqin Private Equity Online
Fig. 11.39: Largest Private Equity-Backed Buyout Exits in 2017
Portfolio Company
Investment Type Deal Date Deal Size
(mn) Investor(s) Exit Date
Exit Type
Exit Value (mn)
Acquiror (Exit) Location Industry
Lightower Fiber Networks, LLC.
Merger Dec-12 2,000 USD
ABRY Partners, Berkshire Partners,
Lightower Fiber Networks, LLC.*, Pamlico Capital,
Sidera Networks*
Jul-17 Trade Sale 7,100 USD
Crown Castle International Corporation
US Telecoms
Ista International GmbH
Buyout Apr-13 3,100 EURCPP Investment
Board, CVC Capital Partners
Jul-17 Trade Sale 4,500 EUR
Cheung Kong Property Holdings
Limited, CK Infrastructure
Holdings
Germany Energy
West Corporation
Public-to-Private May-06 4,100 USD
Quadrangle Group*, Thomas H
Lee Partners*May-17 Sale to
GP 5,100 USD Apollo Global Management US IT
VWR International Buyout May-07 3,500 USD
Avista Capital Partners, Madison
Dearborn Partners*
May-17 Trade Sale 4,380 USD
Avantor Performance Materials, Inc.
US Medical Instruments
USI Holdings Corporation Buyout Nov-12 2,300 USD Onex Corporation Mar-17 Sale to
GP 4,300 USD CDPQ, KKR US Insurance
Source: Preqin Private Equity Online
*Indicates lead investor(s)/acquiror(s).
11. BUYOUT2018 PREQIN GLOBAL PRIVATE EQUITY & VENTURE CAPITAL REPORT - SAMPLE PAGES
© Preqin Ltd. 2018 / www.preqin.com110
VENTURE CAPITAL DEALS
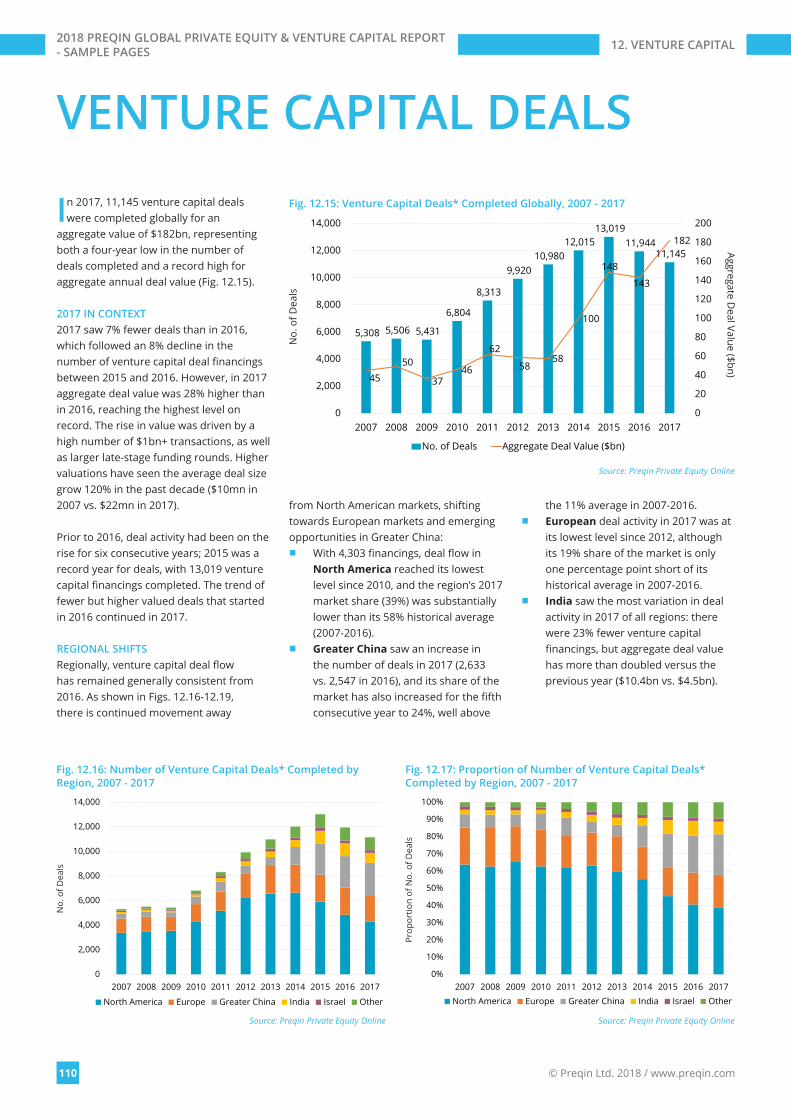
In 2017, 11,145 venture capital deals were completed globally for an
aggregate value of $182bn, representing both a four-year low in the number of deals completed and a record high for aggregate annual deal value (Fig. 12.15).
2017 IN CONTEXT 2017 saw 7% fewer deals than in 2016, which followed an 8% decline in the number of venture capital deal financings between 2015 and 2016. However, in 2017 aggregate deal value was 28% higher than in 2016, reaching the highest level on record. The rise in value was driven by a high number of $1bn+ transactions, as well as larger late-stage funding rounds. Higher valuations have seen the average deal size grow 120% in the past decade ($10mn in 2007 vs. $22mn in 2017).
Prior to 2016, deal activity had been on the rise for six consecutive years; 2015 was a record year for deals, with 13,019 venture capital financings completed. The trend of fewer but higher valued deals that started in 2016 continued in 2017.
REGIONAL SHIFTSRegionally, venture capital deal flow has remained generally consistent from 2016. As shown in Figs. 12.16-12.19, there is continued movement away
from North American markets, shifting towards European markets and emerging opportunities in Greater China:
■ With 4,303 financings, deal flow in North America reached its lowest level since 2010, and the region’s 2017 market share (39%) was substantially lower than its 58% historical average (2007-2016).
■ Greater China saw an increase in the number of deals in 2017 (2,633 vs. 2,547 in 2016), and its share of the market has also increased for the fifth consecutive year to 24%, well above
the 11% average in 2007-2016. ■ European deal activity in 2017 was at
its lowest level since 2012, although its 19% share of the market is only one percentage point short of its historical average in 2007-2016.
■ India saw the most variation in deal activity in 2017 of all regions: there were 23% fewer venture capital financings, but aggregate deal value has more than doubled versus the previous year ($10.4bn vs. $4.5bn).
5,308 5,506 5,431
6,804
8,313
9,920 10,980
12,015 13,019
11,944 11,145
4550
3746
62
5858
100
148
143
182
0
20
40
60
80
100
120
140
160
180
200
0
2,000
4,000
6,000
8,000
10,000
12,000
14,000
2007 2008 2009 2010 2011 2012 2013 2014 2015 2016 2017
No. of Deals Aggregate Deal Value ($bn)
Source: Preqin Private Equity Online
No.
of D
eals
Fig. 12.15: Venture Capital Deals* Completed Globally, 2007 - 2017
0
2,000
4,000
6,000
8,000
10,000
12,000
14,000
2007 2008 2009 2010 2011 2012 2013 2014 2015 2016 2017
North America Europe Greater China India Israel Other
Source: Preqin Private Equity Online
No.
of D
eals
Fig. 12.16: Number of Venture Capital Deals* Completed by Region, 2007 - 2017
0%
10%
20%
30%
40%
50%
60%
70%
80%
90%
100%
2007 2008 2009 2010 2011 2012 2013 2014 2015 2016 2017
North America Europe Greater China India Israel Other
Source: Preqin Private Equity Online
Prop
ortio
n of
No.
of D
eals
Fig. 12.17: Proportion of Number of Venture Capital Deals* Completed by Region, 2007 - 2017
Aggregate Deal Value ($bn)
12. VENTURE CAPITAL2018 PREQIN GLOBAL PRIVATE EQUITY & VENTURE CAPITAL REPORT - SAMPLE PAGES
The 2018 Preqin Global Alternatives Reports are the most detailed and comprehensive reviews of the alternative assets industry available, offering exclusive insight into the latest developments in the private equity, hedge fund, real estate, infrastructure, private debt and natural resources asset classes.
■ Access in-depth analysis and comprehensive statistics, helping you to understand the latest trends in fundraising, performance, investors, deals, fund managers, secondaries, fund terms, placement agents, consultants, law firms and much more.
■ View historical data alongside the most important industry developments. Read contributions from some of the industry’s leading figures.
■ Improve your presentations, marketing materials and company reports. ■ Discover the most important players in every area of the industry. ■ Answer key questions: Who is investing? How much has been raised? Where are the centres of
activity? Where is the capital going? What are the biggest deals? What is the outlook for the industry?
2018 PREQIN GLOBAL ALTERNATIVES REPORTS
For more information visit: www.preqin.com/reports
PAYMENT DETAILS: SHIPPING DETAILS:
Cheque enclosed (cheque payable to ‘Preqin’) Name:________________________________
Telephone:________________________________
Charge my: Visa Firm:________________________________
Email:________________________________
Mastercard Job Title:________________________________
Amex Address:________________________________
Please invoice me ________________________________
Currency: USD GBP EUR ________________________________
Card Number:________________________________
City:________________________________
Name on Card:________________________________
State:________________________________
Expiration Date:________________________________
Post/Zip:________________________________
Security Code:________________________________
Country:________________________________
COMPLETED ORDER FORMSPost (to Preqin):
NEW YORKOne Grand Central Place60 E 42nd StreetSuite 630New YorkNY 10165Tel: +1 212 350 0100Fax: +1 440 445 9595
LONDON3rd FloorVintners’ Place68 Upper Thames StreetLondonEC4V 3BJTel: +44 (0)20 3207 0200Fax: +44 (0)870 330 5892
SINGAPOREOne Finlayson Green#11-02Singapore049246
Tel: +65 6305 2200Fax: +65 6491 2240
SAN FRANCISCOOne Embarcadero CenterSuite 2850San FranciscoCA 94111
Tel: +1 415 316 0580 Fax: +1 440 445 9595
HONG KONGLevel 9, Central Building1-3 Pedder StreetCentral, Hong Kong
Tel: +852 3892 0200
American Express, four-digit code printed on the front of the card.
Visa and Mastercard, last three digits printed on the signature strip.
2018PREQIN GLOBALREAL ESTATEREPORT
ISBN: 978-1-907012-97-6$175 / £125 / €150www.preqin.com
2018PREQIN GLOBALINFRASTRUCTUREREPORT
ISBN: 978-1-907012-97-6$175 / £125 / €150www.preqin.com
2018PREQIN GLOBALPRIVATE DEBTREPORT
ISBN: 978-1-907012-97-6$175 / £125 / €150www.preqin.com
2018PREQIN GLOBALNATURAL RESOURCESREPORT
ISBN: 978-1-907012-97-6$175 / £125 / €150www.preqin.com
2018PREQIN GLOBALHEDGE FUNDREPORT
ISBN: 978-1-907012-97-6$175 / £125 / €150www.preqin.com
2018PREQIN GLOBALPRIVATE EQUITY &VENTURE CAPITALREPORT
ISBN: 978-1-907012-97-6$175 / £125 / €150www.preqin.com
I would like to purchase:
PRINTName First Copy Each Additional Copy Quantity Data Pack* Private Equity & Venture Capital $175/£125/€150 $90/£65/€75 $300/£215/€260
Hedge Funds $175/£125/€150 $90/£65/€75 $300/£215/€260
Real Estate $175/£125/€150 $90/£65/€75 $300/£215/€260
Infrastructure $175/£125/€150 $90/£65/€75 $300/£215/€260
Private Debt $175/£125/€150 $90/£65/€75 $300/£215/€260
Natural Resources $175/£125/€150 $90/£65/€75 $300/£215/€260
All Six Titles (25% Saving!) $785/£560/€675 $395/£280/€340 $1,350/£965/€1,160
Shipping Costs: $40/£10/€25 for single publication $20/£5/€12 for additional copies
(Shipping costs will not exceed a maximum of $60/£15/€37 per order when all shipped to same address. If shipped to multiple addresses then full postage rates apply for additional copies.)
If you would like to order more than 10 copies of one title, please contact us for a special rate
DIGITALName Single-User Licence Each Additional Copy Quantity Enterprise Licence** Data Pack* Private Equity & Venture Capital $175/£125/€150 $90/£65/€75 $1,000/£715/€860 $300/£215/€260
Hedge Funds $175/£125/€150 $90/£65/€75 $1,000/£715/€860 $300/£215/€260
Real Estate $175/£125/€150 $90/£65/€75 $1,000/£715/€860 $300/£215/€260
Infrastructure $175/£125/€150 $90/£65/€75 $1,000/£715/€860 $300/£215/€260
Private Debt $175/£125/€150 $90/£65/€75 $1,000/£715/€860 $300/£215/€260
Natural Resources $175/£125/€150 $90/£65/€75 $1,000/£715/€860 $300/£215/€260
All Six Titles (25% Saving!) $785/£560/€675 $395/£280/€340 $4,500/£3,215/€3,860 $1,350/£965/€1,160
*Data packs feature all the chart and league table data in an Excel file. Must be purchased alongside the associated report.**Enterprise Licence allows for team-wide digital access.Please note all prices quoted throughout are exclusive of sales taxes.


