
1
Landscaping and Horticultural Service Industry

2
Susan Harwood Training Grant
• “to provide training and education programs for employers and workers on the recognition, avoidance, and prevention of safety and health hazards in their workplaces.”
3
DISCLAIMER• This material was produced under grant
number 46C6-HT21 from the Occupational Safety and Health Administration, U.S. Department of Labor. It does not necessarily reflect the views or policies of the U.S. Department of Labor, nor does mention of trade names, commercial products, or organizations imply endorsement by the U.S. Government.
4
OSHA: Target Industry Profile
http://www.osha.gov/dep/industry_profiles/p_profile-078.pdf
5
OSHA: Target Industry Profile
• Industries with at least 5,000 total injury and illness cases in Calendar Year (CY) 2000;
• Industries with a lost workday injury/illness rate (LWDII) of 3.0 or greater in CY 2000;
• Industries not in construction; • Industries with no more than 30% of injuries and
illnesses involving days away from work caused by ergonomic events; and
• Industries with at least 50% of injuries and illnesses involving days away from work so severe as to result in at least six days away from work.
6
Related Work Activities
• Landscape design and architecture; • Soil preparation and grading; • Irrigation systems; • Tree, shrub and lawn planting; • Hardscape construction including:
– retaining walls, pathways and patios;
• Lawn care and landscape maintenance;• Tree trimming and line clearance.
7
OSHA Potential Hazards of Landscaping Industry
• Sprains and strains
• Electrical hazards
• Noise
• Heat stress
• Falls
• Struck-by
• Manual handling of landscaping tools and materials
• Working in proximity to overhead power lines
• Powered equipment such as chainsaws, chippers, and trenchers
• Working for extended periods of time outdoors
• Working from bucket trucks, working in trees
• Working around motor vehicles, overhead hazards
8
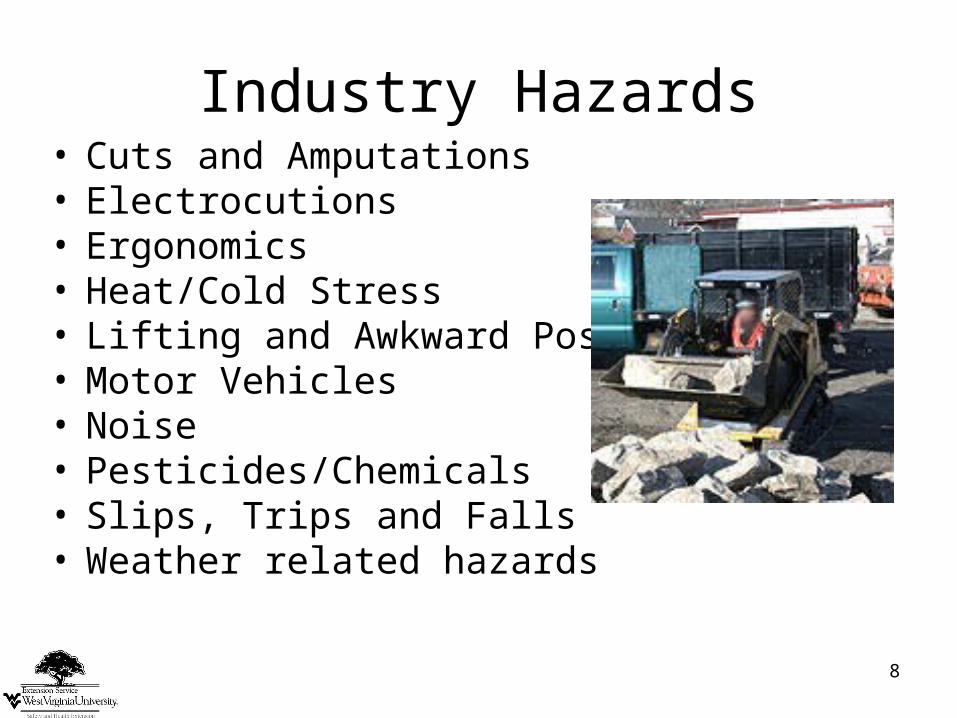
Industry Hazards• Cuts and Amputations • Electrocutions• Ergonomics • Heat/Cold Stress • Lifting and Awkward Postures • Motor Vehicles • Noise • Pesticides/Chemicals • Slips, Trips and Falls • Weather related hazards
9
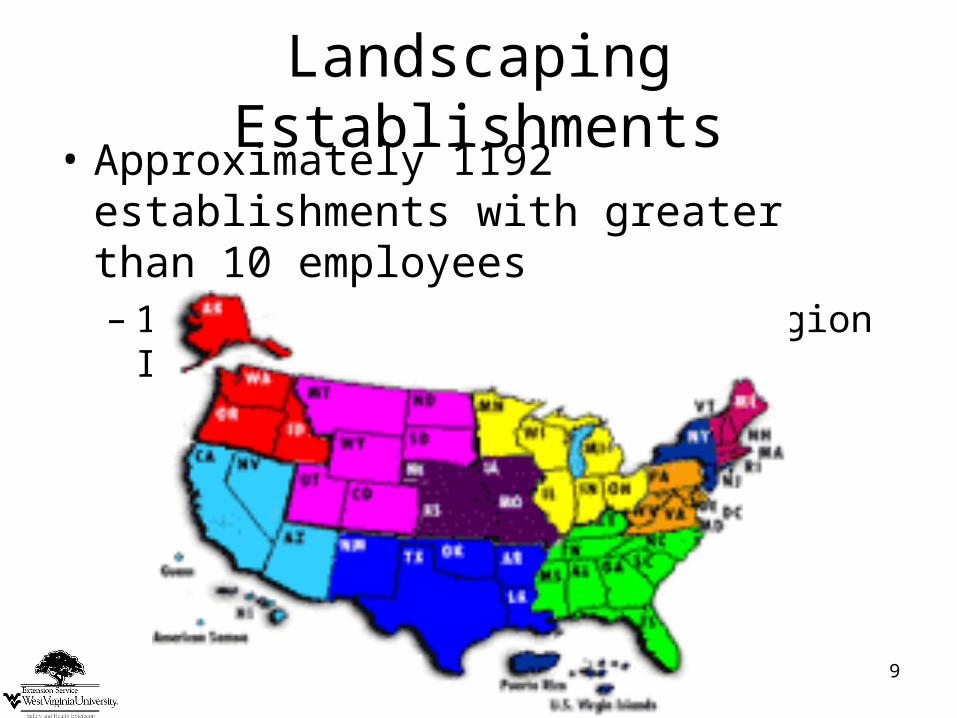
Landscaping Establishments• Approximately 1192 establishments with
greater than 10 employees– 101 establishments in OSHA region III
10
Standard Industrial Classification
• Major Group 07: Agricultural Services– Industry Group 078: Landscape And
Horticultural Services • 0781 Landscape Counseling and Planning• 0782 Lawn and Garden Services• 0783 Ornamental Shrub and Tree Services
11
• Landscape and horticultural services can be separated into three main segments and each area must comply with both the general industry standards (29 CFR 1910) and the construction industry standards (29 CFR 1926) depending upon the activity being performed.
12
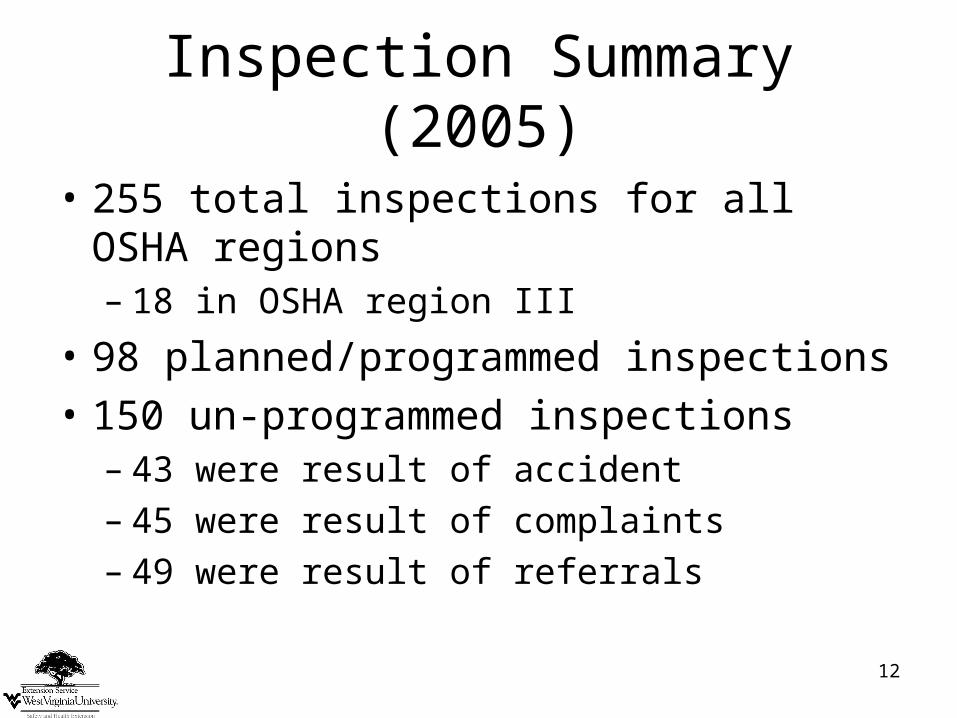
Inspection Summary (2005)
• 255 total inspections for all OSHA regions– 18 in OSHA region III
• 98 planned/programmed inspections
• 150 un-programmed inspections– 43 were result of accident– 45 were result of complaints– 49 were result of referrals
13
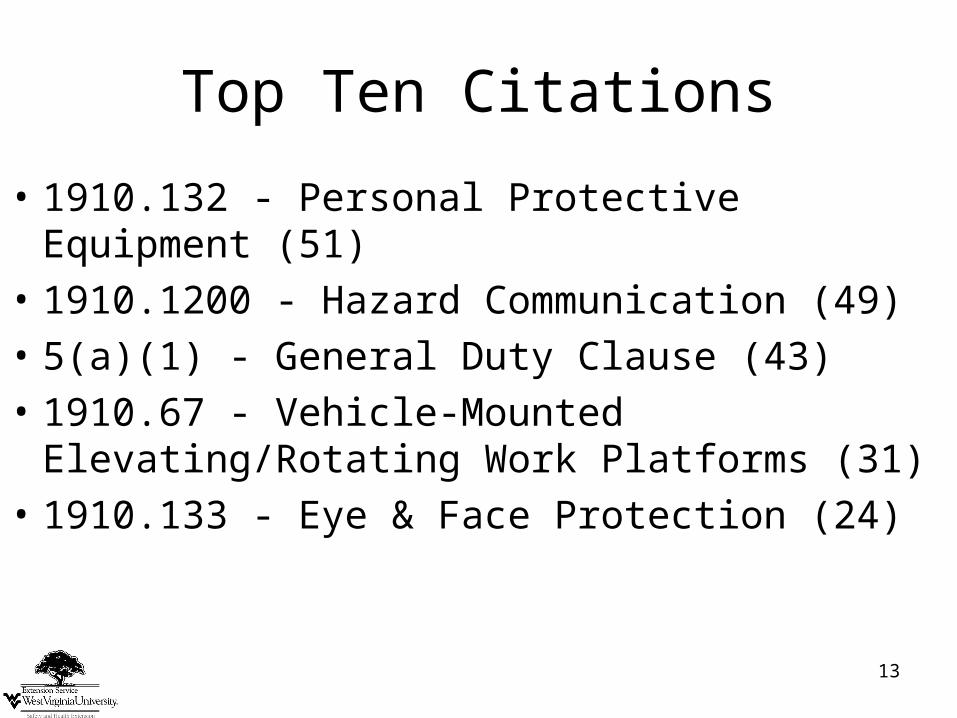
Top Ten Citations
• 1910.132 - Personal Protective Equipment (51)
• 1910.1200 - Hazard Communication (49)
• 5(a)(1) - General Duty Clause (43)
• 1910.67 - Vehicle-Mounted Elevating/Rotating Work Platforms (31)
• 1910.133 - Eye & Face Protection (24)
14
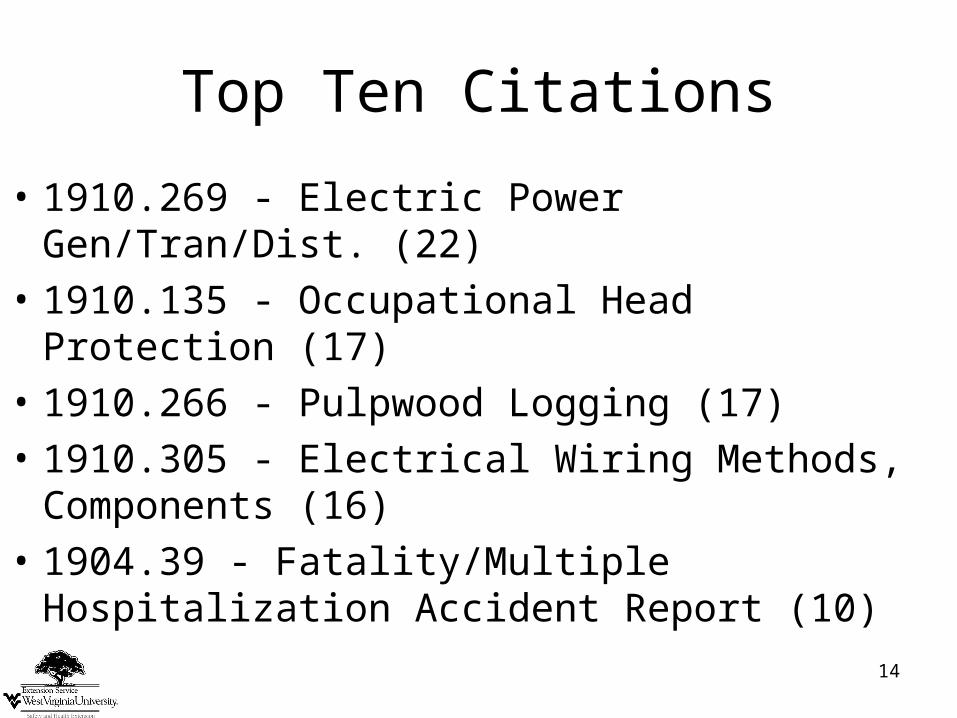
Top Ten Citations
• 1910.269 - Electric Power Gen/Tran/Dist. (22)
• 1910.135 - Occupational Head Protection (17)
• 1910.266 - Pulpwood Logging (17)
• 1910.305 - Electrical Wiring Methods, Components (16)
• 1904.39 - Fatality/Multiple Hospitalization Accident Report (10)

15
Injury Statistics (2003)
• All recorded cases: 11,500
Sprains, strains 34.7%
Fractures 4.9%
Cuts, punctures 16.7%
Bruises 8.3%
Multi trauma total 4.6%
Back pain total 5.8%
Back pain/hurt back Only 2.2%
All others 22.6%
16
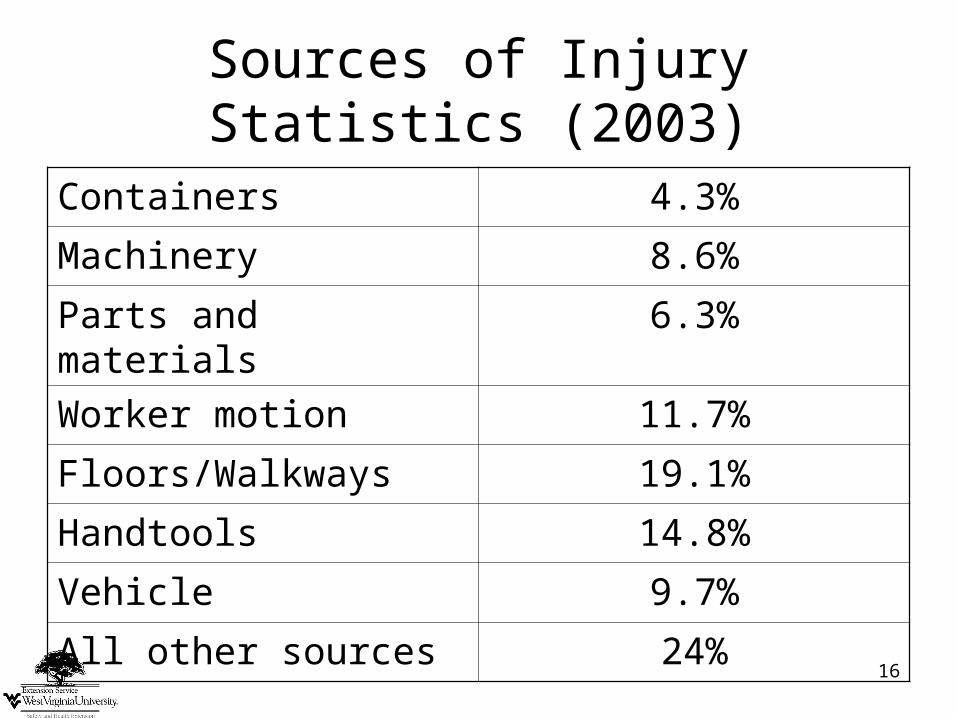
Sources of Injury Statistics (2003)
Containers 4.3%
Machinery 8.6%
Parts and materials 6.3%
Worker motion 11.7%
Floors/Walkways 19.1%
Handtools 14.8%
Vehicle 9.7%
All other sources 24%
17
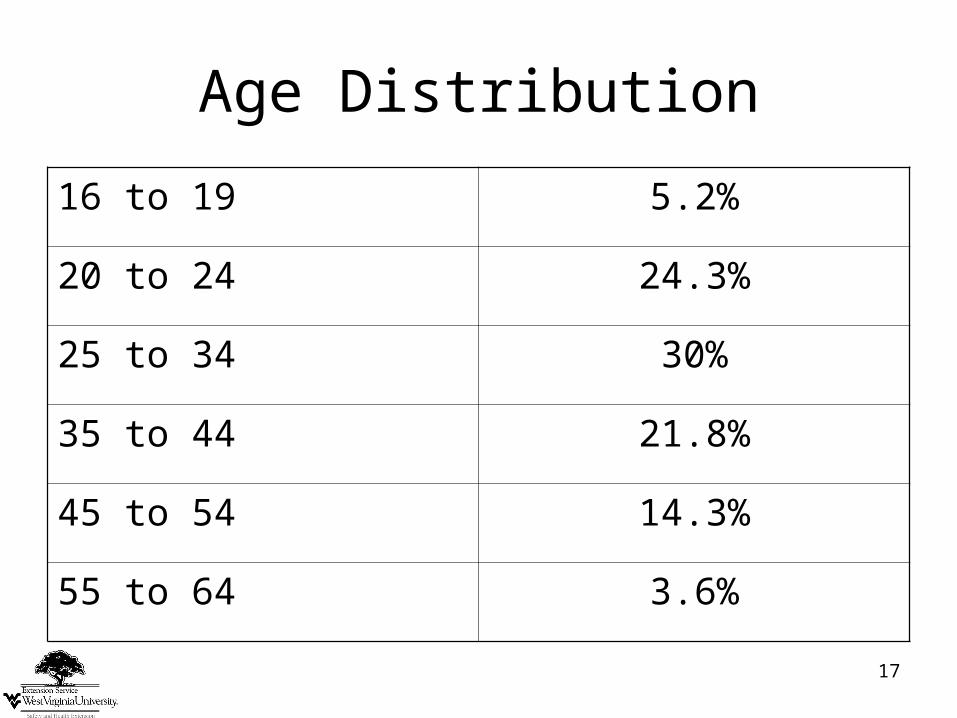
Age Distribution
16 to 19 5.2%
20 to 24 24.3%
25 to 34 30%
35 to 44 21.8%
45 to 54 14.3%
55 to 64 3.6%
18
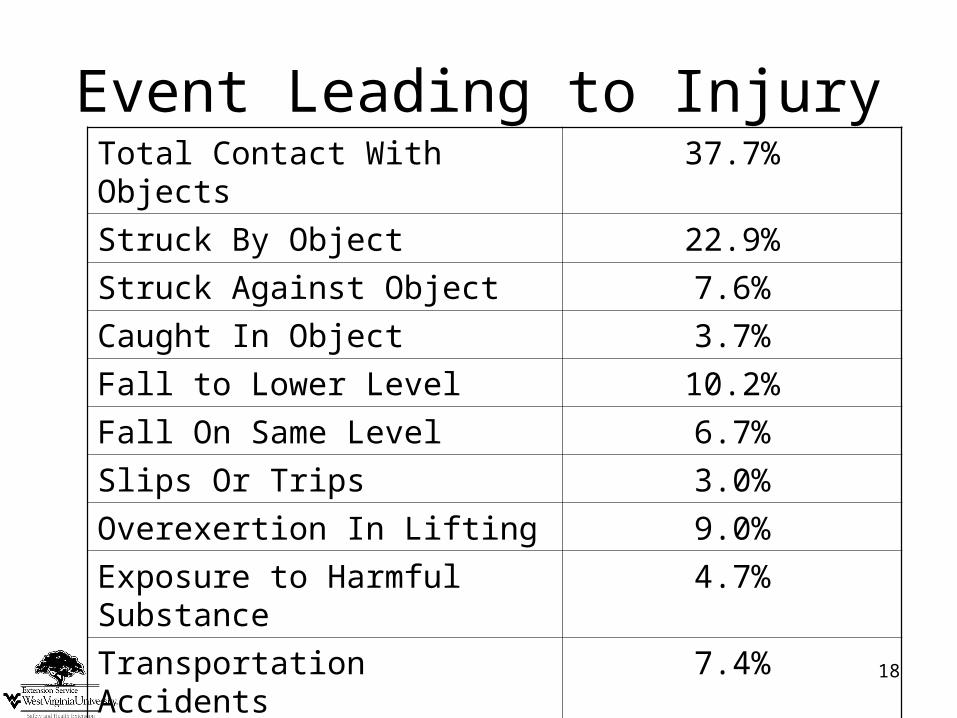
Event Leading to InjuryTotal Contact With Objects 37.7%
Struck By Object 22.9%
Struck Against Object 7.6%
Caught In Object 3.7%
Fall to Lower Level 10.2%
Fall On Same Level 6.7%
Slips Or Trips 3.0%
Overexertion In Lifting 9.0%
Exposure to Harmful Substance 4.7%
Transportation Accidents 7.4%
All other events 11.2%
19
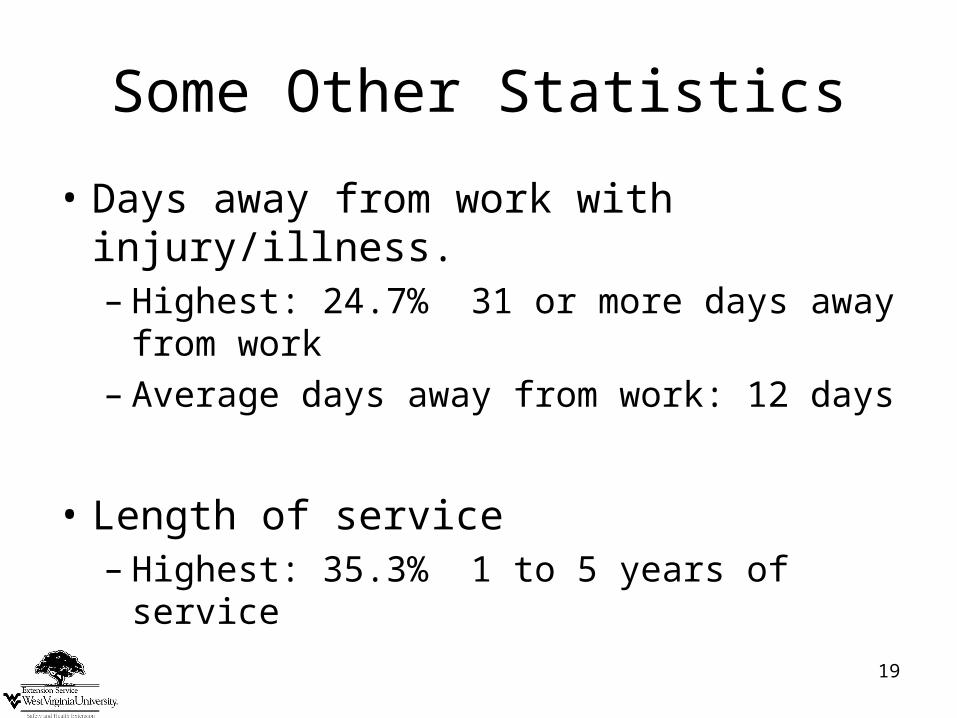
Some Other Statistics
• Days away from work with injury/illness.– Highest: 24.7% 31 or more days away from
work– Average days away from work: 12 days
• Length of service– Highest: 35.3% 1 to 5 years of service


![Landscaping Ideas [Read-Only]counties.agrilife.org/karnes/files/2011/08/landscaping-ideas.pdf · Landscaping Ideas. Landscaping Ideas. Landscaping Blunders. Landscaping Blunders](https://cdn.vdocuments.mx/doc/165x107/5fdae2a2d6608009004e5f9d/landscaping-ideas-read-only-landscaping-ideas-landscaping-ideas-landscaping.jpg)