© 1991-2010 00391878CV
Macro Asset PerspectiveMacro Asset Perspective®
A Wealth Accumulation SeminarA Wealth Accumulation Seminar

© 1991-2010 00391878CV
Presented byPresented by
Vanessa DiegoVanessa DiegoAgent, New York Life Insurance CompanyAgent, New York Life Insurance Company
WA Lic# 745908WA Lic# 745908
Seattle G.O, (Seattle West Campus) 500 Yale Ave. N Seattle G.O, (Seattle West Campus) 500 Yale Ave. N Suite 400 Seattle, WA 98109Suite 400 Seattle, WA 98109
Presented forPresented for
This seminar is for informational purposes only. Neither New York Life Insurance This seminar is for informational purposes only. Neither New York Life Insurance Company, its subsidiaries, nor any of its agents are in the business of offering tax, Company, its subsidiaries, nor any of its agents are in the business of offering tax, legal or accounting advice. You should consult with your own professional advisors legal or accounting advice. You should consult with your own professional advisors
for tax, legal or accounting advice.for tax, legal or accounting advice.

© 1991-2010 00391878CV
Today’s Agenda
Charting Your Course with Charting Your Course with MAPMAP
““Wonder” of Tax Deductible Wonder” of Tax Deductible InvestingInvesting
Annual Asset ReallocationAnnual Asset Reallocation
A Financial EKGA Financial EKG

© 1991-2010 00391878CV
A Financial EKG

© 1991-2010 00391878CV
Financial EKG Financial EKG WorksheetWorksheetCurrent AgeCurrent Age
Desired Retirement Desired Retirement AgeAgeYears to Accomplish Years to Accomplish GoalGoalCurrent IncomeCurrent Income
Anticipated Rate of Anticipated Rate of ReturnReturnMonthly ContributionMonthly Contribution
Desired Retirement Desired Retirement IncomeIncome
5 More 5 More YearsYears
5 Less Years5 Less Years
404065652525
$80,000$80,000
8%/5%8%/5%$1,367$1,367
$60,000$60,000
$882$882 $2,185$2,185
$60K$60K
$30K$30K
$15K$15K
$120$120KK
$240$240KK
$1,200,000
55 7272)
1144
Income from Income from workingworking
Income from assetsIncome from assetsAccumulation Phase
Conservation Phase
Hypothetical example for illustrative purposes only.

© 1991-2010 00391878CV
A Wealth Accumulation A Wealth Accumulation Strategy Strategy
Macro Asset Perspective®®

© 1991-2010 00391878CV
MAP is designed to give you a visual picture of where assets can be placed and why.

© 1991-2010 00391878CV
The vertical arrangement of boxes represents the concept of vertical diversification.
s s
M M
A A
Paper Assets
Real Wealth
A A

© 1991-2010 00391878CV
Your personal diversification depends upon such factors as your age, risk tolerance and holding period.s s
M M
A A
Paper Assets
Real Wealth

© 1991-2010 00391878CV
A Wall Street “Rule of Thumb” suggests a percentage of assets equal to one’s age below the line. s s
M M
A A
Paper Assets
Real Wealth

© 1991-2010 00391878CV
One of the primary objectives of vertical diversification over time is to convert “paper assets” into “real wealth.”
s s
M M
A A
Paper Assets
Real Wealth
Vertical diversification has been touted for decades.

© 1991-2010 00391878CV
Recently another issue has emerged.- The concept of horizontal diversification.
That is, diversification between tax treatments.
s s
M M
A A
Paper Assets
Real Wealth
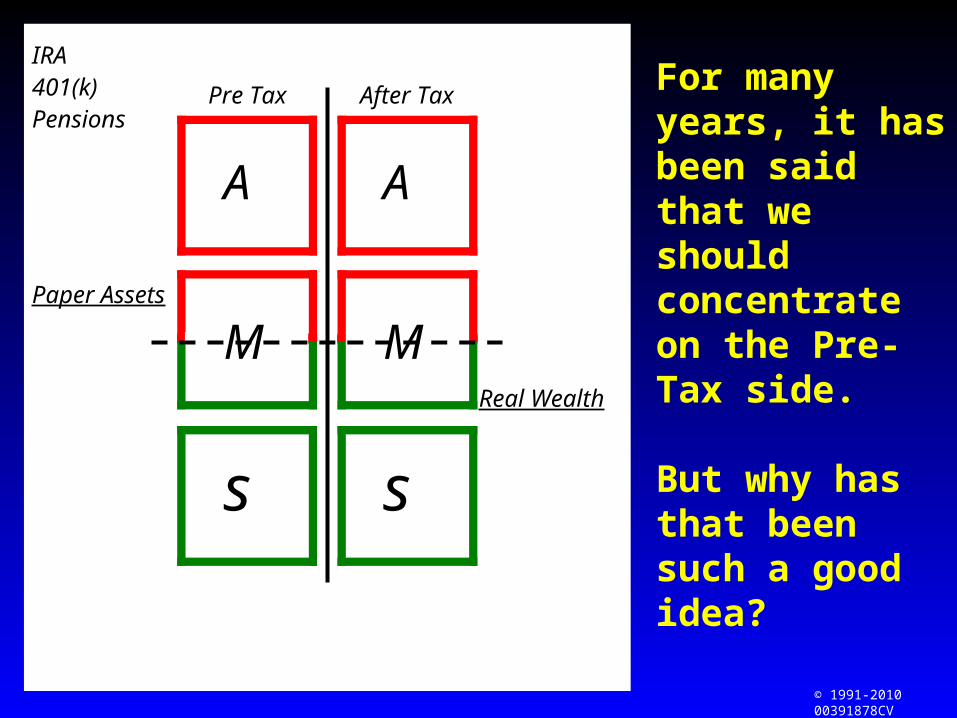
IRA401(k)Pensions
Pre Tax After Tax
© 1991-2010 00391878CV
For many years, it has been said that we should concentrate on the Pre-Tax side.
But why has that been such a good idea?
s s
M M
A A
Paper Assets
Real Wealth
IRA401(k)Pensions
Pre Tax After Tax

© 1991-2010 00391878CV
The top marginal tax bracket* in the eighties was 70 percent* *and there were 15 different brackets.
s s
M M
A A
Paper Assets
Real Wealth
IRA401(k)Pensions
Pre Tax After Tax
$100,000
$80,000
25%-28%
70%
*Your MTB or marginal tax rate is the rate (%) at which your last dollar (last increment) of income is taxed.
**Source: Federal tax code 1981

© 1991-2010 00391878CV
Deferring taxes at 25 or 28 percent, to pay them later in a higher tax bracket would be a major mistake. s s
M M
A A
Paper Assets
Real Wealth
IRA401(k)Pensions
Pre Tax After Tax
70%
$100,000
$80,000
25%-28%

© 1991-2010 00391878CV
Don’t run out and cancel your 401(k) as some may be suggesting.
The pre-tax side can still be a great place to accumulate wealth if used properly.
s s
M M
A A
Paper Assets
Real Wealth
IRA401(k)Pensions
Pre Tax After Tax
70%
$100,000
$80,000
25%-28%
100%Taxable Income
Tax-Free
Income
$40,000 $40,00015% 0%
71/2%

© 1991-2010 00391878CV
When you defer taxes at one bracket to pay them later in a lower bracket you make the pre-tax side work as it was intended to.
s s
M M
A A
Paper Assets
Real Wealth
IRA401(k)Pensions
Pre Tax After Tax
70%
$100,000
$80,000
25%-28%
100%Taxable Income
Tax-Free
Income
$40,000 $40,00015% 0%
71/2%
Let’s see how to accomplish this.

© 1991-2010 00391878CV
The advantages found below-the-line are not generally needed on the pre-tax side.
s s
M M
A A
Paper Assets
Real Wealth
IRA401(k)Pensions
Pre Tax After Tax
70%
$100,000
$80,000
25%-28%
100%Taxable Income
Tax-Free
Income
$40,000 $40,00015% 0%
71/2%
SafeLiquidTax Advantage

© 1991-2010 00391878CV
Historically, assets that have kept pace with inflation, or exceeded it, have been found above-the-line.
s s
M M
A A
Paper Assets
Real Wealth
IRA401(k)Pensions
Pre Tax After Tax
70%
$100,000
$80,000
25%-28%
100%Taxable Income
Tax-Free
Income
$40,000 $40,00015% 0%
71/2%
SafeLiquidTax Advantage

© 1991-2010 00391878CV
The first rule of accumulation is simple –
s s
M M
A A
Paper Assets
Real Wealth
IRA401(k)Pensions
Pre Tax After Tax
70%
$100,000
$80,000
25%-28%
100%Taxable Income
Tax-Free
Income
$40,000 $40,00015% 0%
71/2%
SafeLiquidTax Advantage
*Take the free money.Be sure to maximize any employer matching in pre-tax plans.Above-the-line is the key area on the Pre-Tax side.

© 1991-2010 00391878CV
The advantages that were of little value on the pre-tax side, have great value on the after-tax side.
s s
M M
A A
Paper Assets
Real Wealth
IRA401(k)Pensions
Pre Tax After Tax
70%
$100,000
$80,000
25%-28%
100%Taxable Income
Tax-Free
Income
$40,000 $40,00015% 0%
71/2%
SafeLiquidTax Advantage
*
*
© 1991-2010 00391878CV
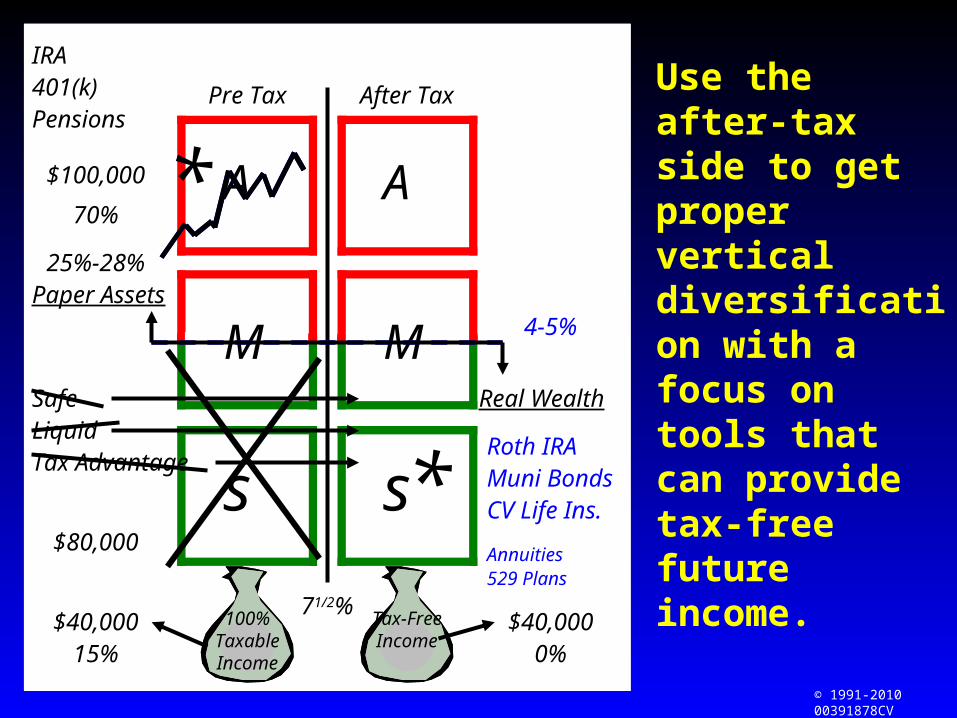
Use the after-tax side to get proper vertical diversification with a focus on tools that can provide tax-free future income.
s s
M M
A A
Paper Assets
Real Wealth
IRA401(k)Pensions
Pre Tax After Tax
70%
$100,000
$80,000
25%-28%
100%Taxable Income
Tax-Free
Income
$40,000 $40,00015% 0%
71/2%
SafeLiquidTax Advantage
*
*Roth IRAMuni BondsCV Life Ins.
Annuities529 Plans
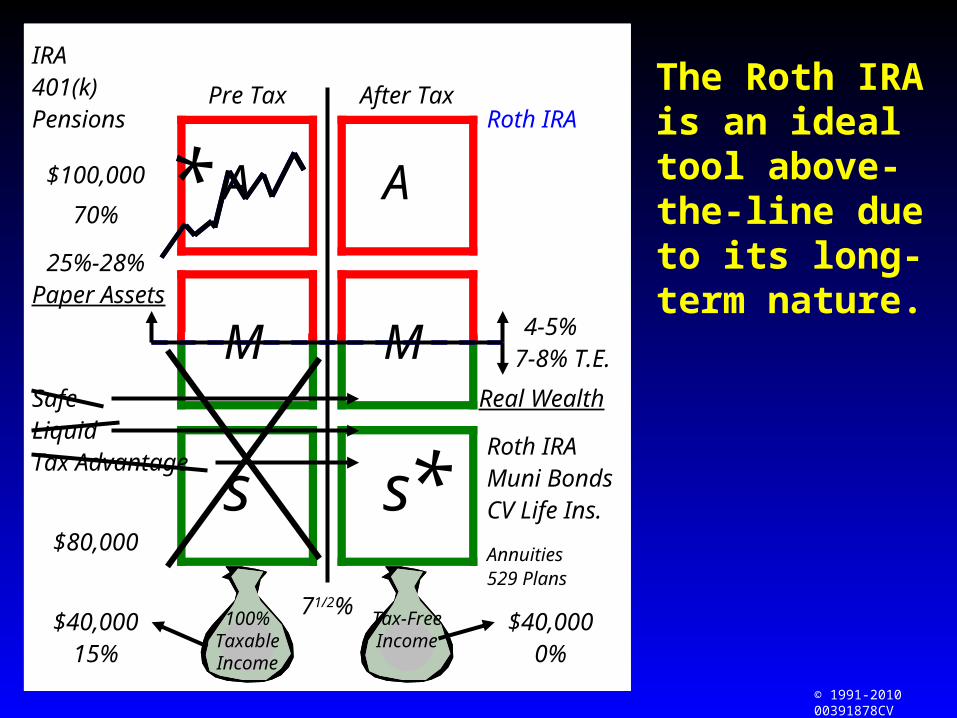
4-5%

© 1991-2010 00391878CV
4 or 5 percent, tax-free, may be the equivalent of 7 or 8 percent taxable, depending upon your tax bracket.
s s
M M
A A
Paper Assets
Real Wealth
IRA401(k)Pensions
Pre Tax After Tax
70%
$100,000
$80,000
25%-28%
100%Taxable Income
Tax-Free
Income
$40,000 $40,00015% 0%
71/2%
SafeLiquidTax Advantage
*
*Roth IRAMuni BondsCV Life Ins.
Annuities529 Plans
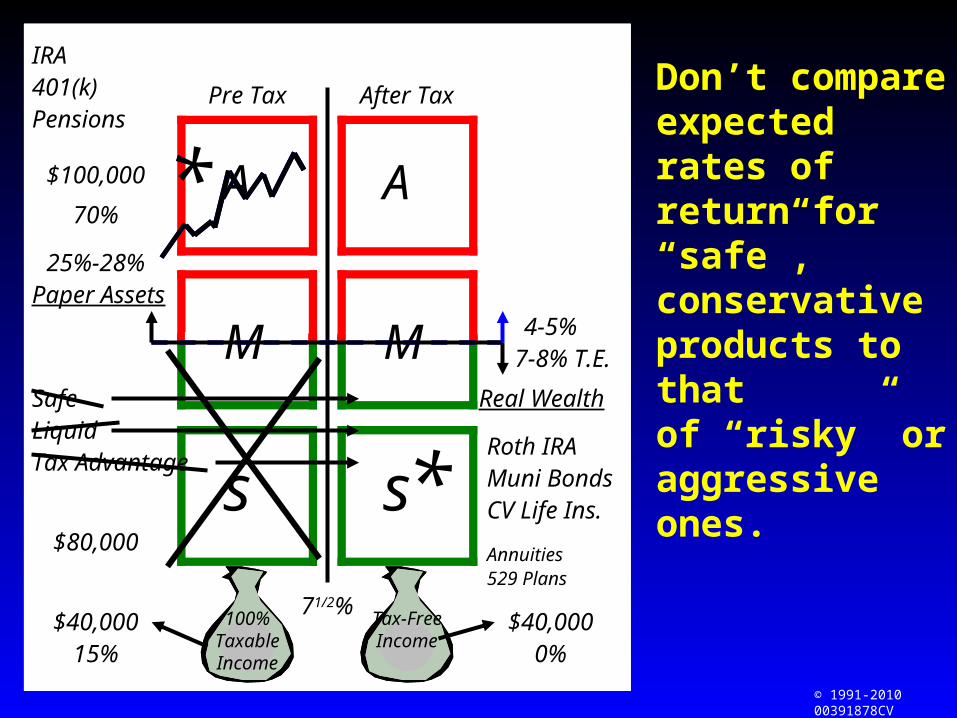
4-5%7-8% T.E.
© 1991-2010 00391878CV
Don’t compare expected rates of return for “safe”, conservative products to that of “risky” or aggressive ones.
s s
M M
A A
Paper Assets
Real Wealth
IRA401(k)Pensions
Pre Tax After Tax
70%
$100,000
$80,000
25%-28%
100%Taxable Income
Tax-Free
Income
$40,000 $40,00015% 0%
71/2%
SafeLiquidTax Advantage
*
*Roth IRAMuni BondsCV Life Ins.
Annuities529 Plans
4-5%7-8% T.E.
© 1991-2010 00391878CV
The Roth IRA is an ideal tool above-the-line due to its long-term nature.
s s
M M
A A
Paper Assets
Real Wealth
IRA401(k)Pensions
Pre Tax After Tax
70%
$100,000
$80,000
25%-28%
100%Taxable Income
Tax-Free
Income
$40,000 $40,00015% 0%
71/2%
SafeLiquidTax Advantage
*
*Roth IRAMuni BondsCV Life Ins.
Annuities529 Plans
4-5%7-8% T.E.
Roth IRA

© 1991-2010 00391878CV
Aside from the Roth, we are not generally looking for tax-free income above-the-line, but potential growth with a secondary consideration for tax advantages such as long-term capital gains.
s s
M M
A A
Paper Assets
Real Wealth
IRA401(k)Pensions
Pre Tax After Tax
70%
$100,000
$80,000
25%-28%
100%Taxable Income
Tax-Free
Income
$40,000 $40,00015% 0%
71/2%
SafeLiquidTax Advantage
*
*Roth IRAMuni BondsCV Life Ins.
Annuities529 Plans
4-5%7-8% T.E.
Roth IRAStock Mkt.Real Estate
© 1991-2010 00391878CV
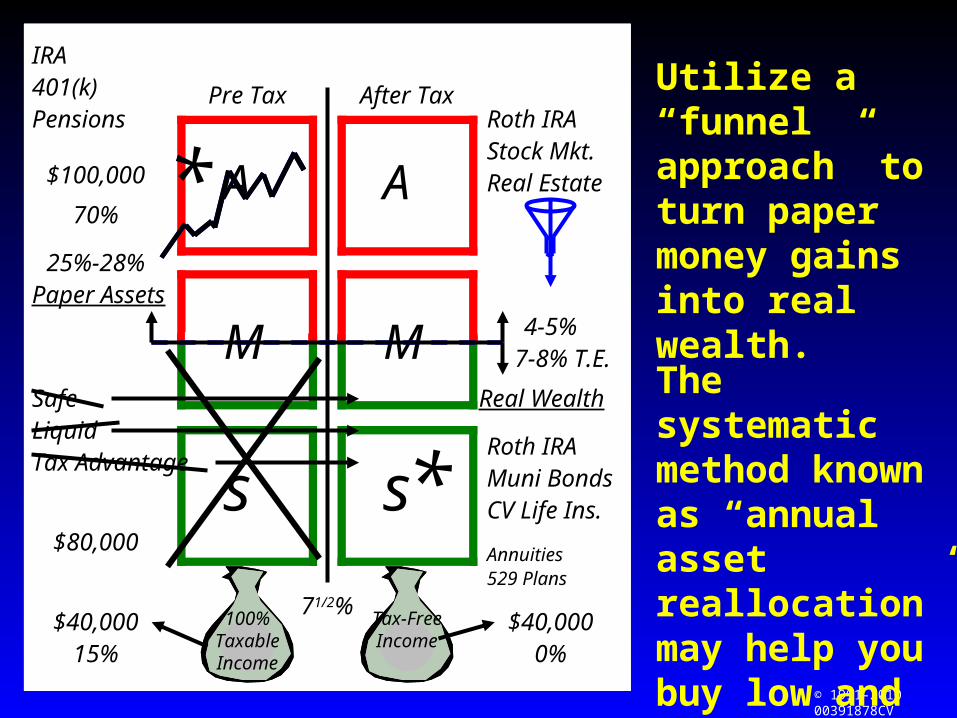
Utilize a “funnel approach” to turn paper money gains into real wealth.
s s
M M
A A
Paper Assets
Real Wealth
IRA401(k)Pensions
Pre Tax After Tax
70%
$100,000
$80,000
25%-28%
100%Taxable Income
Tax-Free
Income
$40,000 $40,00015% 0%
71/2%
SafeLiquidTax Advantage
*
*Roth IRAMuni BondsCV Life Ins.
Annuities529 Plans
4-5%7-8% T.E.
Roth IRAStock Mkt.Real Estate
The systematic method known as “annual asset reallocation” may help you buy low and sell high.

© 1991-2010 00391878CV
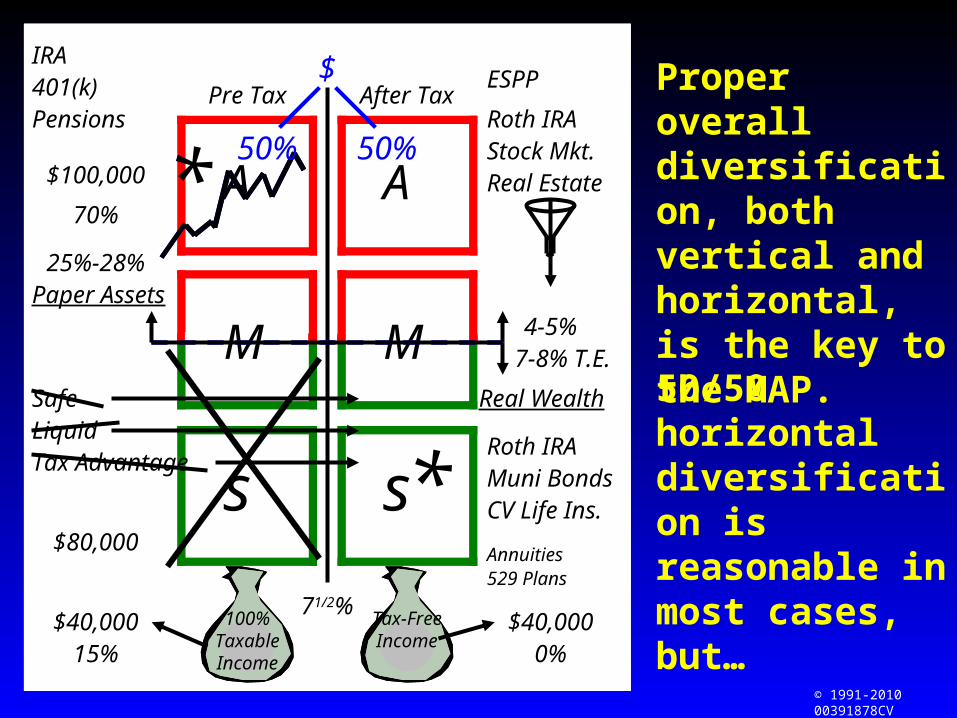
Possibly the best tool for the “funnel approach” is an Employee Stock Purchase Plan (ESPP).
s s
M M
A A
Paper Assets
Real Wealth
IRA401(k)Pensions
Pre Tax After Tax
70%
$100,000
$80,000
25%-28%
100%Taxable Income
Tax-Free
Income
$40,000 $40,00015% 0%
71/2%
SafeLiquidTax Advantage
*
*Roth IRAMuni BondsCV Life Ins.
Annuities529 Plans
4-5%7-8% T.E.
Roth IRAStock Mkt.Real Estate
ESPP
An ESPP with a 15 percent discount provides a guaranteed minimum return-on-investment of 17.6 percent*.
*15 divided by 85 equals 17.6%
© 1991-2010 00391878CV
Proper overall diversification, both vertical and horizontal, is the key to the MAP.
s s
M M
A A
Paper Assets
Real Wealth
IRA401(k)Pensions
Pre Tax After Tax
70%
$100,000
$80,000
25%-28%
100%Taxable Income
Tax-Free
Income
$40,000 $40,00015% 0%
71/2%
SafeLiquidTax Advantage
*
*Roth IRAMuni BondsCV Life Ins.
Annuities529 Plans
4-5%7-8% T.E.
Roth IRAStock Mkt.Real Estate
ESPP$
50% 50%
50/50 horizontal diversification is reasonable in most cases, but…

© 1991-2010 00391878CV
Those desiring high retirement income may want to lean heavier toward the after-tax side to avoid paying taxes later at higher income tax rates.
s s
M M
A A
Paper Assets
Real Wealth
IRA401(k)Pensions
Pre Tax After Tax
70%
$100,000
$80,000
25%-28%
100%Taxable Income
Tax-Free
Income
$40,000 $40,00015% 0%
71/2%
SafeLiquidTax Advantage
*
*Roth IRAMuni BondsCV Life Ins.
Annuities529 Plans
4-5%7-8% T.E.
Roth IRAStock Mkt.Real Estate
ESPP$
50% 50%
50%
In most cases, the pre-tax side can be entirely above-the-line.

© 1991-2010 00391878CV
Use the after-tax side to maintain the desired overall vertical diversification percentages.
s s
M M
A A
Paper Assets
Real Wealth
IRA401(k)Pensions
Pre Tax After Tax
70%
$100,000
$80,000
25%-28%
100%Taxable Income
Tax-Free
Income
$40,000 $40,00015% 0%
71/2%
SafeLiquidTax Advantage
*
*Roth IRAMuni BondsCV Life Ins.
Annuities529 Plans
4-5%7-8% T.E.
Roth IRAStock Mkt.Real Estate
ESPP$
50% 50%
50%
25-50%
0-25%
75%
25%

© 1991-2010 00391878CV
A Wealth Accumulation A Wealth Accumulation Strategy Strategy
Macro Asset Perspective®

© 1991-2010 00391878CV
The “Wonder” of Tax-Deductible Investing

© 1991-2010 00391878CV
RobertRobertTax-Deductible Tax-Deductible
401(k)401(k)
RobertaRobertaNon-Deductible Roth Non-Deductible Roth
IRAIRA
Annual AvailableAnnual AvailableContributionContribution
Tax Tax Paid Paid Account Balance Day Account Balance Day
11If Accessed Day If Accessed Day 22Tax PaidTax Paid
Net Balance Day 2Net Balance Day 2
Balance at Balance at RetirementRetirementIf Liquidated at If Liquidated at RetirementRetirementTax PaidTax Paid
Net Retirement Net Retirement BalanceBalancePost Retirement Post Retirement
Cash FlowCash FlowAnnual WithdrawalAnnual Withdrawal
Tax PaidTax Paid
Net Retirement Cash Net Retirement Cash FlowFlow
004,0004,000
1,001,00003,0003,000
1,0001,0003,0003,000
003,0003,000
400,00400,0000
300,00300,0000
100,00100,0000300,00300,0000
00300,00300,00
0040,00040,000 30,00030,00010,00010,00030,00030,000
0030,00030,000
6,0006,00034,00034,000
15%15%14,00014,000 35%35%
26,00026,000
$4,000$4,000
25%25%
10,00010,00030,00030,000
25%25%

© 1991-2010 00391878CV
Cash Flow ComparisonCash Flow ComparisonRobertRobert RobertaRoberta
$100,000$100,000Salary:Salary:
401(k) 401(k) Contribution:Contribution: $4,000$4,000
$96,000$96,000Taxable Income: Taxable Income:
$24,000$24,000Hypothetical Hypothetical Tax: Tax:
$72,000$72,000Net Spendable:Net Spendable:
$100,000$100,000Salary:Salary:
Hypothetical Hypothetical Tax: Tax: $25,000$25,000
$75,000$75,000After-Tax After-Tax Income:Income:
$3,000$3,000Roth Contribution:Roth Contribution:
$72,000$72,000Net Net Spendable:Spendable:

© 1991-2010 00391878CV
Annual Asset Reallocation

© 1991-2010 00391878CV
AA BB CC
Buy Buy HighHigh
Sell Sell LowLow
Buy Buy LowLow
Sell Sell HighHigh
CCCC
Annual Asset Reallocation
BalanceBalance
Re-Re-BalanceBalance

© 1991-2010 00391878CV
AA BB CCCCCC DDDD
Company Stock
Component
© 1991-2010 00391878CV
Macro Asset PerspectiveMacro Asset Perspective®®
A Wealth Accumulation SeminarA Wealth Accumulation Seminar


