double, double toil and trouble€¦ · stream of unconsciousness 14 bitcoin 14 the 17-year cycle...
TRANSCRIPT
DOUBLE, DOUBLE TOIL AND TROUBLE
2017 LETTER TO CLIENTS
WICKED VALUATIONS, BUBBLES IN MONETARY
POLICY AND PASSIVE INVESTING
PLUS: BERKSHIRE – CHARMED BY THE TAX DEED
February 11, 2018

2
CONTENTS
DOUBLE, DOUBLE TOIL AND TROUBLE
WICKED VALUATIONS, BUBBLES IN MONETARY POLICY AND PASSIVE INVESTING
PLUS: BERKSHIRE – CHARMED BY THE TAX DEED
IN THE LETTER – INTRODUCTION 6
MARKET VALUATION FLASHES DANGER 7
They Say You Only Know it was a Bubble After the Fact…Hmmm… 7
THE GREAT MONETARY POLICY UNWIND 10
QE to QT – Gimme Back My Bullets 10
Fiscal Policy Joins the Tightening Race; Will Foreign Central Bankers Leap In? 13
STREAM OF UNCONSCIOUSNESS 14
Bitcoin 14
The 17-Year Cycle Theory 14
INTRINSIC VALUE UPDATE – THE ONGOING CASE FOR ACTIVE MANAGEMENT 15
The 2000 Report Usefully Projected the Long-Range Result 15
Robbing a Little from Peter, But Paul Will be Fine 18
On Cash and Intrinsic Value 20
Fundamentally Different: The Semper Portfolio and the S&P 500, Side by Side 21
Why We Don’t Own the Index 28
ACTIVITY V. PASSIVITY – THE COMING PASSIVE INVESTING UNWIND 29
The Argument for Passive Investing 29
Superinvestors 31
Go with the Flow 32
The Nail in the Passive Investing Coffin – Price Doesn’t Matter…Until it Does 37
Active Shouldn’t Mean Activity: Common Threads Among the New Superinvestors 40

3
BERKSHIRE HATHAWAY: CHARMED BY THE TAX DEED AND OTHER RUMINATIONS 45
Tax Code Mini-Primer; The Tax Bill Formerly Known as… 46
The Impact of the Tax Bill at Berkshire 49
Cash Taxes 52
Operating Segments 53
Berkshire Hathaway: Ten-Year Expected Return 61
Berkshire Hathaway Intrinsic Value Update 63
2017 Year-End Intrinsic Value by Methodology 64
Berkshire’s Dual Yardsticks of Intrinsic Value: “Removing” the Goalposts 70
Summary on Berkshire and Intrinsic Value 72
SUMMARY 73
APPENDIX 75
Appendix A – Key Business Segment Information – Berkshire 2017 Expected 75
Appendix B - Tables 76
Methodologies and Support for Calculating Intrinsic Value for Berkshire 76
Income Statement GAAP Adjustments to Economic Earnings 76
Sum of the Parts Basis – 2017 Expected 76
Net Income Basis – 2017 Expected 76
2017 Est IV at Normalized 18x TTM Net Income Before and After Tax Change 76
Two-Pronged Basis 77
Simple Per-Share Price to Book Value Basis – “A” Share Data 77
Appendix C – Capital Expenditures and Depreciation; Deferred Tax Liabilities 78
Appendix D – Down the Rabbit Hole We Go 79
Moving the Goalposts at Berkshire – What Changed and How it was Presented 79
(Reprinted From 2016 Year-End Letter)
Copyright© 2018 By Christopher P. Bloomstran
All Rights Reserved

4
February 11, 2018
2017 LETTER TO CLIENTS
DOUBLE, DOUBLE TOIL AND TROUBLE
WICKED VALUATIONS, BUBBLES IN MONETARY POLICY AND PASSIVE INVESTING
PLUS: BERKSHIRE – CHARMED BY THE TAX DEED
SCENE I. The Federal Reserve. March the Third, 2009. In the middle, a boiling cauldron.
Thunder. Enter the three Witches, Alan, Ben and Janet First Witch Alan Thrice the brinded cat hath mew'd. Second Witch Ben Thrice and once the hedge(fund)-pig whined. Third Witch Janet Keynes cries 'Tis time, 'tis time. First Witch Alan Round about the cauldron go;
In the poison'd entrails throw. Toad, that under cold stone Days and nights has thirty-one Swelter'd venom sleeping got, Boil thou first i' the charmed pot. ALL Double, double toil and trouble; Fire burn, and cauldron bubble.
Second Witch Ben The Illustrated Library Shakespeare
Cool it with a baboon's blood, Then the charm is firm and good.
Enter BROOM-HILLDARY to the other three Witches
BROOM-HILLDARY O well done! I commend your pains; And every one shall share i' the gains; And now about the cauldron sing, Live elves and fairies in a ring, Enchanting all that you put in.
Music and a song: 'Black spirits’
BROOM-HILLDARY retires

5
Second Witch Ben By the pricking of my thumbs, Something wicked this way comes. Open, locks, Whoever knocks!
Enter MACTRUMP
How now, you secret, black, and midnight hags! What is't you do?
ALL A deed without a name.
Albrecht Dürer
A deed without a name, indeed…
Not yet invented, the cauldron of poison’d monetary entrails came to be known as Quantitative Easing,
QE for short. The witches’ elixir produced its desired effect.
From the nadir of the financial crisis, at the devilish 666 on 03/06/09, the Standard & Poor’s 500 has
since doubled. And doubled again. The index went out 2017 at 2674. Toil and trouble…
“No one may buy or sell save one who has the mark, or name of the beast, or the number of his
name. That number is 666.” – Revelation 13:17-18
Is it too much concocting to blend The Bard’s “The Scottish Play” with the Book of Revelation and the
wizards at the Federal Reserve to explain the last nine years’ “buying and selling”? More buying than
selling, really…
The sum of the digits 666 is 18. The sum of the digits at the date of the low is 18. Here we are in the year
18. Hmmm…Lest we get ourselves marked with an obsession with the underworld (last year’s letter
invoked the Rolling Stones’ Sympathy for the Devil), let’s quickly broom off to what’s brewing. Next
year, we vow to do something saintlier, perhaps blessing the letter, “Holy S_ _ t! The Market was Up
Another 20%!” Come to think of it, if that comes to pass, we’re more likely to seal our fate with
something appropriate like Van Halen’s Running with the Devil…
6
IN THE LETTER - INTRODUCTION
Berkshire Hathaway, our largest investment holding by far, wields enormous “hidden” earning power and
value. Our most recent two year-end letters discussed why. The situation got even better with the passage
of tax reform in December. We think Berkshire may be the single largest beneficiary of the tax bill, so
we dig into the company yet again. Included are updates to our ten-year expected returns and our
appraisal methodologies for estimating intrinsic value, followed by an overview of how the tax code
materially improves the moving parts within the holding company. We make several ongoing upward and
downward adjustments to Berkshire’s reported income each year to reflect economic earning power. The
adjustment results in adding nearly $10 billion to net income today. Thanks to tax reform, an additional
increase of more than $3 billion in after-tax earning power is created by the tax changes applied across the
moving parts that constitute Berkshire. Combining our GAAP adjustments with new earning power
derived from tax reform, Berkshire is thus worth at least $200 billion more than would be
determined by simple use of reported earnings and former tax rates.
I know the prospect of diving right into taxes sounds exciting, but we’ll save the best for last. Instead, the
letter begins by comparing current stock market conditions with those at past market peaks and troughs.
Valuations are at extremes only seen at major market tops, with some measures at records.
From there we examine a reversal underway in monetary policy, shifting from accommodative to tight.
Easy money helped drive asset prices higher. Conditions are heading the other direction. Quantitative
Easing has become Quantitative Tightening, and policy interest rates are on the rise. Combined with what
is now a tightening fiscal climate from tax cuts, potential ramifications for the economy and the stock
market are foreboding. When valuations are overlaid, the climate is hostile.
Next, the intrinsic value approach used in our investment process is updated. The portfolio is embedded
with critical fundamental and valuation advantages. A side by side common size comparison with the
S&P 500 is used to illustrate disparities of quality and value.
That discussion on intrinsic value moves to a thematic look at passive versus active investing. Passive
flows are distorting valuations across much of the domestic and global stock market. A great deal of risk
is building. Included are the results of a flow analysis that is distorting returns, prices and index
weightings. A mind-blowing chart summarizes the point that passive investing, despite the logic and
seeming efficiency of its use, has run so far that a terrible prospective outcome is likely.
Finally, we conclude the letter with the jump back into Berkshire. A ten-year forecast of expected returns,
its improved tax position, and an update to our intrinsic value methods and estimate of intrinsic value are
discussed. Despite the shares climbing more than 50% over the last two years, considerable value remains
and prospective returns versus the “market” look particularly rewarding.
We considered including a comparison between General Electric and one of our favorite holdings, the
Norwegian branded consumer goods company, Orkla. Both are involved in de-conglomeratizing (new
word), one doing it well, the other, er, not so well. We had this penciled in as a topic early last year, but
given GE’s header of late, decided against what would look either like cherry picking or kicking a down
dog. Thus, How to Shrink a Conglomerate is saved for another day. Perhaps the subject company will be
a certain small Omaha-based enterprise. It’s too bad we moved on. The GE/Orkla contrast would have
mixed riveting topics like accounting quality, capital allocation, acquisition treatment, pension issues,
compensation, and intrigue.
Something wicked this way comes…

7
MARKET VALUATION FLASHES DANGER
They Say You Only Know it was a Bubble After the Fact…Hmmm…
Terror reigned when the S&P 500 touched 666 in 2009. The index had lost nearly 60% of its value. Many
stocks had declined by far more. Who would have guessed that not quite nine years later the index would
double twice? Fear no longer grips the land. Instead, sentiment is as positive as it has ever been. When
smooth sailing is the forecast, it’s usually a good time for caution. We don’t know if we are sitting at the
edge of a cliff or not. The market may or may not be at a peak. But at times like these, it’s good to
examine the historical record, particularly as things looked at what were peaks and troughs. Figures for
the first six rows are for the S&P 500.
100 Years of Peaks and Troughs
9/29
Peak
7/32
Low
3/37
Peak
4/42
Low
2/66
Peak
8/82
Low
3/00
Peak
10/02
Low
10/07
Peak
3/09
Low
Y/E
2017
S&P 500 34 4 20 7 102 102* 1527 777 1565 666 2673
After-Tax Profit Margin 8.9% -3.2% 6.4% 6.6% 6.7% 4.0% 7.4% 5.8% 9.4% -0.1% 10.2%
Price to Op Earnings (TTM) 26 NMF 8 7 18 8 33 19 22 NMF 23
Price to Earnings (CAPE) 30 4 23 9 25 7 44 23 28 15 32
Price to Sales 2.31 0.48 0.51 0.46 1.20 0.32 2.13 1.11 1.57 0.666 2.23
Price to Book Value 3.0 0.3 2.2 0.8 2.4 0.9 7.7 2.3 6.0 1.5 3.3
Dividend Yield 3.0% 17.5% 3.7% 8.7% 2.9% 6.1% 1.0% 2.0% 1.7% 4.0% 1.8%
Market Cap All Stocks 93.3B 15.3B 66.2B 32.4B 624B 1.1T 14.0T 7.0T 15.9T 7.0T 28.9T
GDP 103.7B 58.8B 91.9B 162B 789B 3.3T 9.9T 11.0T 14.6T 14.4T 19.7T
Market Cap to GDP 90% 26% 72% 20% 79% 33% 141% 64% 109% 49% 147%
Total Credit Market Debt 175B 150B 159B 227B 1.12T 5.2T 26.7T 32.2T 51.2T 54.6T 69.0T
Total Credit Market Debt / GDP 169% 255% 173% 140% 142% 158% 264% 293% 352% 380% 350%
US Government Bond Yield 3.4% 3.5% 2.6% 1.9% 4.6% 14.6% 5.9% 4.7% 4.9% 3.5% 2.7%
US Discount Rate 6.0% 2.5% 1.5% 1.0% 4.5% 10.75% 5.5% 1.25% 5.0% 0.75% 2.0%
Inflation (CPI) 0.6% -9.9% 3.6% 10.9% 3.7% 11.0% 3.4% 1.6% 2.9% -0.4% 2.0%
Unemployment Rate 2.3% 24.9% 11.7% 4.9% 4.2% 10.8% 3.9% 6.0% 5.0% 9.9% 4.1%
*A peak price can equal the subsequent trough price following 17 years, especially when marked by high inflation
We took the liberty of shading red the column on the right, which shows year-end figures. We have no
idea if this is a market peak. However, on the premise that a trough can’t follow a trough, we went ahead

8
with the alternating color scheme! The metrics fit a peak, though. If you were wondering, the choice of
colors tried to convey what you would do at a stop light. Green means go. Red means stop.
Scan through how different measures like price to earnings, price to sales, price to book value, dividend
yields look at peaks and at troughs. While there are outlier single figures (the price to sales at the 1937
peak – impacted by a very low P/E on earnings that had recovered considerably), the numbers at lows
have lots in common as do they at highs.
One yardstick has been a particularly valuable gauge of long-term value. Market capitalization to Gross
Domestic Product has been one of our favorite measures of value for a quarter century and has even been
mentioned by Warren Buffett as a great metric. However, the ratio is materially flawed in two aspects – it
fails to capture the proportion of business done in an economy by private businesses as opposed to
publicly traded businesses. It also fails to adjust for the proportion of business done abroad by public
companies. The amount of business done by public companies and by those public companies abroad are
both far higher now than in 1929, for example, when the measure signaled the market peak preceding an
89% stock market decline and the Great Depression that ensued. By upwardly adjusting the ratio over
time to overcome the deficiencies, the ratio continues as an invaluable measure of value.
We highlight the ratio as a proxy for where valuation may rest today. Few would argue that early 2000
wasn’t one of the great market peaks and bubbles. In March 2000, GDP registered $10 trillion, while
stocks amounted to $14.1 trillion as measured by the broadly inclusive Wilshire 5000, a record 141% of
GDP (we ran a version of the table above in our 2001 year-end letter which had stocks at 210% of GDP,
erroneously including all US listings, another flaw in the way the ratio had been applied in the past, which
included foreign direct listings, ADR’s and investment fund shares). Fast forward almost 18 years and
GDP has finally doubled to just under $20 trillion. Stocks have nearly doubled as well. Despite stocks
only compounding at 5.3% per year for the entire period, it’s hard to make the case that they are now
cheap. GDP doubled. Stocks doubled. For most of the past 18 years they were far below that measure.
When Alan, Ben and Janet gathered ’round the boiling cauldron on March 6, 2009, the market wallowed
at only half of GDP. From there it doubled twice. Stocks today hover at a new all-time high 147% of
GDP, surpassing the former record seen at the 2000 peak.
You can explain away that this isn’t a bubble or a peak. Yes, profit margins are now at a new all-time
high of 10.2%, way above the 2000 peak level of 7.4%. We talked about profit margins last year.
Importantly, returns on equity and on capital are in fact lower today than in 2000. Much of the higher
profit margin can be explained by far lower interest rates on leveraged corporate balance sheets. As
measured by price to sales, today’s 223% surpasses the 213% seen in 2000 and is a stone’s throw from
1929’s record 231%. Based on the market’s move in early January the price to sales record will fall.
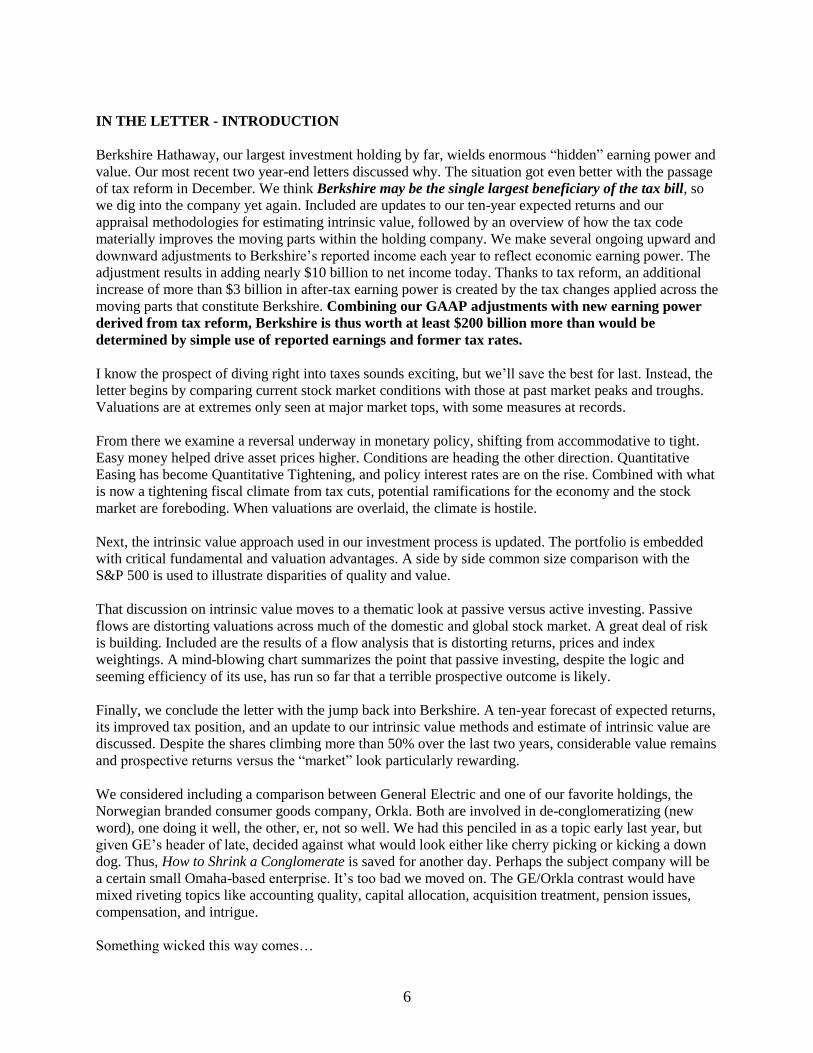
A frequently used price to earnings measure, credited to Yale professor Robert Shiller, uses a 10-year
average of trailing earnings, which smooths out some cyclicality from using point in time data (Ben
Graham suggested using an average of five or ten years’ earnings due to volatility in one-year numbers,
so the measure should really be the Graham P/E). While shy of 2000’s record, today’s Cyclically
Adjusted P/E (CAPE) has passed 1929’s peak and is now the second highest on record.
9
Price to Earnings (Using Cyclically Adjusted P/E: 10-Year Average)
Source: multpl.com
We’ll leave valuation alone and move into the letter. Forget single measures like price to sales, which is
now at a record but pushed higher by higher profit margins (meaning the P/E must be lower now than in
2000 if price to sales are comparable). Instead, ask yourselves this question. If stocks were at a peak in
2000 at 141% of GDP, are they less expensive today at 147%?
An odd aside. I just did the math on the price to sales ratio at the low in 2009 using quarterly data from
S&P’s website. My calculator reads 0.666. Spotify plays in the background and, no kidding, Iron
Maiden’s The Number of the Beast just came on. I took a picture of the iPad screen as a memento.
One more sidebar. In updating the chart from our year-end 2001 letter, with several new columns
representing a subsequent low, peak, low and now perhaps a peak, its sobering to realize how much time
has passed. When you have multiple cycles under your belt and look in the mirror, you realize the mirror
tells the truth...
A caveat regarding the use of historical yardsticks of value in determining the present situation: These
measures include known peaks and troughs, which are often correlated with economic peaks and troughs.
We have a depression (1929 to 1941) that included cratered stocks, a cratered economy, low interest rates
and sky-high unemployment. We have an inflationary period (1973 to 1982) with cratered stocks, a weak
economy, very high interest rates and high unemployment. What we don’t have as a comparator is a
period involving hyper-inflation. You will have to look abroad and generally backwards in time to see
how the moving parts in an economy fare during such an episode. With debt levels over 350% of GDP,
painting a rosy picture isn’t easy. If the globe’s central bank witches have poison’d the cauldron, where
the outcome is an inflationary spiral, then all bets regarding valuation are off.
(Will this end badly…?)

10
THE GREAT MONETARY POLICY UNWIND
QE to QT – Gimme Back My Bullets
Monetary policy via expansion of the Federal Reserve’s balance sheet during and after the financial crisis,
with similar expansions by the Fed’s European, Japanese and Chinese cousins, perhaps explain some of
the reflation in asset prices. The support is turning into resistance, and the possibility of a reversal in asset
prices and in the economy is the topic at hand.
All was quiet on the Western Front until the financial crisis. At year-end 2007, the Fed’s assets totaled
about $850 billion, less than 6% of GDP, and consisted largely of short-term US treasury debt. Then the
shooting started. By late 2014, after their third round of quantitative easing (QE), the Fed’s balance sheet
totaled $4.5 trillion, 25% of GDP, and now consists largely of longer-duration US government debt and
mortgages. The Fed balance sheet had been flat since 2014 at the $4.5 trillion level until the fourth quarter
of 2017, when as announced, their large holdings of Treasury and mortgage debt are now being reduced.
Across the pond, the PhD’s of global central banking have also ballooned their respective balance sheets,
with the European Central Bank’s (ECB) rising from $1.5 trillion (US dollars used for comparison) to
$5.5 trillion, 38% of Euro area GDP, and the Bank of Japan’s (BOJ) from $1 trillion to $4.8 trillion, a
staggering 93% of Japanese GDP, up from 20% in 2007. While in the US, bond buying by the Fed (which
is essentially QE defined – large scale asset purchases), has paused since late 2014, the globe’s bankers
have continued their money printing operations. $3 trillion of the ECB’s expansion and $2.3 trillion of the
BOJ’s have taken place since the Fed stopped buying bonds at the end of 2014.
QE, a massive expansion of each central bank’s open market operations, was coupled with more
conventional expansionary monetary policy also taken to an extreme. Across the globe, short-term policy
interest rates were set at zero or below to combat the financial crisis. Nowhere in the history of finance
outside of the last decade can you find an example of interest rates less than zero. These combined
monetary operations, experiments really, helped push the value of risk assets higher. Even with the global
economy seemingly on stable footing post-crisis, the Federal Reserve effectively financed the entire
federal budget deficit for several years. By absorbing the borrowing needs of the US Treasury, risk
assets could be allocated to stocks, real estate, corporate debt, etc.
In addition to buying government debt and mortgages, foreign central banks remarkably purchased
private corporate debt to stimulate economies. The BOJ has even been buying equity ETF’s since 2010,
and now owns 75% of Japan-listed ETF’s and almost 3% of Japanese stock market capitalization. By
2013 the Swiss National Bank held assets close to 100% of Swiss GDP. Fully 12% of its reserves were in
foreign stocks. Purchases are made worldwide with the creation of new yen, euros, Swiss francs, pounds
and dollars.
Most asset classes have broached record highs by conventional fundamental metrics of valuation. Debt
levels across the globe are no lower relative to GDP than they were pre-crisis. In the US, total credit
market debt remains above 350% of GDP. But what happens when the vastly expansionary monetary
initiatives reverse course? To what extent will a draining of the unprecedented liquidity impact economies
and asset prices? What happens when you drain the cauldron?
Beginning in October, the Fed began allowing maturing debt to roll off its balance sheet, $6 billion of
Treasuries and $4 billion of mortgage agencies, a total of $10 billion per month during the fourth quarter.
The pace will increase by $30 billion quarterly through the fourth quarter of this year. Quantitative Easing
has become Quantitative Tightening. Previously the Fed would replace maturing debt with new debt,
maintaining the size of its asset holdings. New York Fed President William Dudley said the Fed was
11
likely to shrink the balance sheet by $1 trillion to $2 trillion, much less than its purchases of $3.7 trillion
from 2007 to 2014. Baby steps, right? We have no idea how this reversal in the Fed’s balance sheet plays
out. The increase was unprecedented and so will be the reversal.
In addition to shifting from QE to QT, the Fed has also reversed course conventionally and is now further
tightening monetary policy by raising its short-term interest rate target. Think about interest rate increases
as the Fed reloading its pistol. You need ammo if you are going to a gun fight, and when rates were taken
to zero, the Fed was out of bullets. It needs to reload to fight the next slowdown, and if rates are zero it
has no bullets (that’s how we got QE). The Fed raised its target for Fed Funds by 0.25% five times so far
since December 2015. It’s target range for Fed Funds is now 1.25% to 1.50%, and has signaled another
two to three 0.25% hikes this year. Will rising short-term interest rates and a shrinking Fed balance sheet
combine to slow the economy and weaken asset prices?
Rising interest rates come with rising interest payments. A 3% increase across the yield curve ultimately
raises interest payments by 3% as debt matures and is refinanced. On $69 trillion in credit market debt
outstanding, a 3% increase in the interest burden is $2.1 trillion, or more than 10% of GDP. $2.1 trillion
also equals roughly all pre-tax corporate profits in the US. Think about that. Far-fetched to assume a 3%
increase across the curve? As recently as August 2007, prior to the financial crisis, the entire US Treasury
curve was flat at 5%, from the 1-month bill all the way to the 30-year bond. In 2000, the Treasury curve
ranged from 6.3% at the short end to 6.7% on the long bond.
Fundamental investors like to pronounce they don’t think about macroeconomics. It’s all about
researching companies they say. We’re with you, brothers and sisters. However, if there was one
economic chart to pay attention to, the one presented below of changes in the Fed’s discount rate is it.
Every major stock market decline and every recession in the last 100 years was preceded by the Federal
Reserve raising short term interest rates by enough to provide the pin to prick the balloon. Note the
emphasis on every. Yes, there have been periods where the Fed raised rates and a recession didn’t ensue.
Everyone knows the famous saw about the stock market having predicted nine of the past five recessions!
That may be true, that rising rates don’t necessarily cause a recession. But as an investor you must be
aware that every major stock market decline occurred on the heels of a tightening phase by the Fed. More
importantly, there have been no substantive Fed tightening phases that did not end with a stock market
decline.
1919…1929…1937...1970…1973…1980…1982…1987…1990…1994…2000…2007…The Fed raised
rates five times since December 2015 and states its intent to continue. We don’t know much about pattern
recognition, but…

12
Source: Federal Reserve Bank of St. Louis
The following chart from Ned Davis Research (Ned is a legendary technical analyst, and his firm has
great research and charts) illustrates a Three Steps and a Stumble “rule” attributed to Edson Gould, one of
the pioneers of technical analysis (I admit to having several friends, Ned among them, who are full-
fledged market technicians, and though never having seen them in robes around a cauldron, have seen
them consume copious cauldrons at the Red Mill, with my assistance, of course). In the 1960’s, Gould
observed that, “whenever the Federal Reserve raises either the federal funds target rate, margin
requirements, or reserve requirements three times without a decline, the stock market is likely to suffer a
substantial, perhaps serious, setback.”
We don’t know about the rule, per se. We have studied all major US market declines in the last 100 years,
and in every case the Fed had substantively raised its short-term policy rates leading up to the decline.
Three may or may not be a significant number to the outcome. What likely matters is the direction of rates
and the magnitude of the change. Again, we are on the fifth hike and counting.
Source: Ned Davis Research

13
Since the advent of QE during the financial crisis, central banks have proven willing to layer on
subsequent rounds of bond buying when asset prices decline or economies weaken. We had three
iterations in the US. A reasonable assumption would be that at the first sign of trouble, the Fed will halt
rate increases, and if conditions worsen, will introduce QE 4, then QE 5, etc…
A concern may be in the political composition of the Fed. As a group they are dovish, inclined to more
active and interventionist policy (Keynes cries 'Tis time, 'tis time). The new Fed Chairman, Jerome Powell,
while not a PhD, falls into this camp. Public comments suggest perhaps the Fed governors generally
aren’t fans of the current executive branch. We’d hope that personal political views wouldn’t bleed into
policy making. A cynic would worry that policy makers may not be opposed to seeing the handiwork of
tightening policy harm asset values, and by extension, political adversaries, particularly those foolish
enough to take credit for a rising tide. Do they continue raising rates and shrinking the balance sheet, even
in the face of falling asset values and a weakening economy? It would go against the grain of their
mindset. After all, without their elixir, the economy wouldn’t have made it out of the financial crisis. Who
knows how dovish or hawkish the Fed winds up being in the near term, but we are tasked with thinking
about all risk, whatever its form. Regardless, the economy may not be as durable as currently expected.
The growth rate of the supply of money (measured by M2) has declined now for two years, and its three-
month rolling growth rate is a low 3.9%. The velocity of money (the rate at which money turns over, or
passes from one holder to the next in an economy) has been in decline since before the 2000 bubble and is
now 1.43, at levels last seen during the Great Depression and World War II. A slowing money supply
coupled with a falling and low velocity of money is not good for GDP growth. After all, from Econ 101,
everyone must remember that M2 x Velocity = GDP. The St. Louis Fed calculates the money supply, M2
at $13.8 trillion at year-end. With velocity at 1.43, GDP is $19.7 trillion. What impact QT and rising rates
have on the money supply we can’t be certain. Our bet would be on a further slowing. If the growth rate
in M2 continues to slow, and the velocity of money continues to slow, the growth rate of GDP must slow.
If money and velocity slow enough, we will have a recession.
Fiscal Policy Joins the Tightening Race; Will Foreign Central Bankers Leap In?
On top of what is now tightening monetary policy, Congress passed its tax cut for households and
businesses in December. To the extent lower taxes translate to lower federal revenue, unless we cut
government spending, deficits will rise. Deficits are financed with new net borrowing by the US Treasury.
QE saw the Fed effectively purchase nearly all US Treasury debt issuance for a time. The Fed is now the
single largest holder of US Treasury debt, owning more than foreign central banks. With the Fed, for
now, no longer in the bond buying business, but rather net selling its debt holdings, who will lend needed
capital to the US Treasury, especially if the deficit is growing? The answer can only be private investors,
those same investors who were able to allocate capital to assets other than Treasuries when the Fed was
scarfing up issuance. Now we have not only tight monetary policy with QT and rising interest rates, but
tight fiscal policy as well. If we expand government spending, as promised on infrastructure and on social
programs as a compromise, the deficit could expand very rapidly.
For global capital markets, even with the Fed out of the bond buying game
since late 2014, foreign central bankers continued to run their presses. They
continue sucking up bonds (and even ETF’s and stocks). The pace must
inevitably slow, and at some point, reverse course (as now in the US). The ECB
announced it will begin halving the rate at which it buys bonds, though
maintaining its negative policy interest rates for now. Interest rates remain at
zero or below across parts of European and Japanese yield curves. Policy rates
remain negative in Sweden, Switzerland, Denmark and in Japan. Rates have
14
been negative out to 10-year maturities in places as developed as Germany, even on when-issued
borrowings. If the global economy stays strong, at a point monetary policy, in both QE and the setting of
short-term policy rates, will reverse globally. With the ECB already slowing its bond buying, the latter
half of this year and into 2019 may be interesting if global monetary policy shifts from expansionary to
tight.
Conventional yardsticks of fundamental valuation are flashing red warning signals. Asset prices are at
record valuations by many measures. Credit spreads are extremely tight. And now we have both
tightening US monetary and fiscal policy late in an economic cycle. Watch for global central bankers to
follow suit.
(This may end badly…)
STREAM OF UNCONSCIOUSNESS
Bitcoin
One token comment.
We borrowed our name when launching the firm, at the height of the tech bubble in 1998, from 1637’s
Tulipomania. 361 years from now, in 2378, we envision the launching of a new investment firm named
Bitcoin. Its founders will spend the rest of their careers explaining where they came up with the unusual
name for their firm. Maybe they will call the new firm Semper Bitcoin Investments Group…
(This will end badly…)
The 17-Year Cycle Theory
Some investment “strategists” have long talked about a “classic” 17-year cycle between market peaks and
troughs, and why it repeats. A bull market ran from 1949 to 1966. The market then peaked in 1966 and
reached a deep nadir in 1982. 17 years and 17% per year later, the market peaked again in early 2000.
Fast forward to today. It looked for much of the last 17 years that the theory would hold. In fact, stocks
have compounded at only 5.3% per year, but have nearly doubled from the last peak. So, 17 years beyond
the 2000 peak, is this a trough? Either the market is going to go down a WHOLE BUNCH real soon, or its
time for the theorists to head back to the drawing board for a new small-sample theory.
(Let’s get out of the water before this letter ends badly…)

15
INTRINSIC VALUE UPDATE – THE ONGOING CASE FOR ACTIVE MANAGEMENT
The 2000 Report Usefully Projected the Long-Range Result
In March 2000, we developed a report that contrasts the weighted average intrinsic valuation, discount
from our appraisal of intrinsic value, normalized earnings and earnings yield, dividend yield and expected
return of our portfolio with the S&P 500. Now, more than 17 years removed from what may be described
as one of the great investment bubbles, the report continues to demonstrate utility. With market valuations
again stretched, it is an invaluable output of our investment process.
The first Intrinsic Value Report we ran was published on March 31, 2000. We needed a tool to contrast
our modestly undervalued portfolio with market averages that were in a bubble and dangerously
expensive. We possessed both a relative and an absolute valuation advantage. Even so, the pressure to
own overvalued technology was intense, and we weren’t willing to compromise our philosophy. The
report drew on our core assumption that, over time, if we’ve assessed profitability properly, we should
earn the earnings yield of the portfolio, then at 6.4% per year, not even allowing for future growth. In
addition, we also expect to earn the closing of any discount to our appraisals of intrinsic value, which in
early 2000 implied another 2% to 3% per-year as the discount accreted upward to our appraisal for each
holding. How accurate was the projection? Our stocks earned 9.1% per year since the running of the first
report through year-end 2017.
By contrast, the S&P 500 index had an earnings yield of 2.5% at March 31, 2000, and needed to fall
roughly 60% to attain our estimate of fair value. As such, the earnings yield of 2.5% was the base case
expectation for the annual return of the index for a long, long time, and a case could be made for the
index spending substantial time in negative territory, which it did. Since March of 2000, the index
returned 5.4% annually, and has yet to work off much of the excessive valuation that existed 18 years
ago. Incidentally, the 5.4% annualized return is the highest it’s been when compounding from March
2000. It required the index climbing straight up in the last few years to push the average annual return to
5.4%. The annualized gain a year ago was only 4.4%. Much of the period was spent in the red.
The S&P 500 wasn’t alone in terms of being overvalued. From March 31, 2000, the MSCI All Country
World Index returned 4.8% annually and the then and now red-hot NASDAQ Composite, FANG’s and
all, compounded at all of 2.4%.
It’s remarkable that we find ourselves staring at valuations that rival the 2000 peak. You would think
these would be once in a lifetime milestones. Memories are short. A takeaway for those passively
16
invested or index-hugging: It is very difficult making money when the price paid is high. By our math,
the market today still needs to fall by somewhere between a third and half to reach fair value.
We wonder how pension funds assuming returns of 7% or more, or endowments helping subsidize faculty
and tuition, or the retired couple having assumed they could live on 6-7% or more of their nest egg per
year will fare from this point forward. It may be likely that result fall short of expectations again, much as
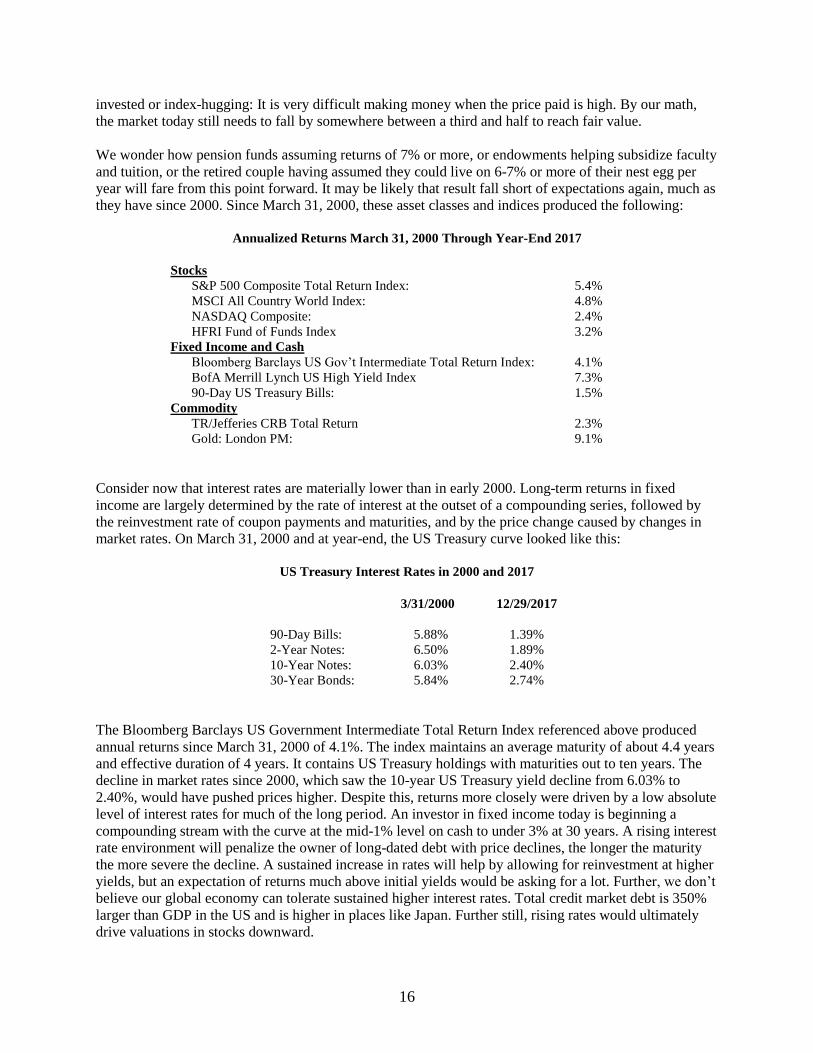
they have since 2000. Since March 31, 2000, these asset classes and indices produced the following:
Annualized Returns March 31, 2000 Through Year-End 2017
Stocks
S&P 500 Composite Total Return Index: 5.4%
MSCI All Country World Index: 4.8%
NASDAQ Composite: 2.4%
HFRI Fund of Funds Index 3.2%
Fixed Income and Cash
Bloomberg Barclays US Gov’t Intermediate Total Return Index: 4.1%
BofA Merrill Lynch US High Yield Index 7.3%
90-Day US Treasury Bills: 1.5%
Commodity
TR/Jefferies CRB Total Return 2.3%
Gold: London PM: 9.1%
Consider now that interest rates are materially lower than in early 2000. Long-term returns in fixed
income are largely determined by the rate of interest at the outset of a compounding series, followed by
the reinvestment rate of coupon payments and maturities, and by the price change caused by changes in
market rates. On March 31, 2000 and at year-end, the US Treasury curve looked like this:
US Treasury Interest Rates in 2000 and 2017
3/31/2000 12/29/2017
90-Day Bills: 5.88% 1.39%
2-Year Notes: 6.50% 1.89%
10-Year Notes: 6.03% 2.40%
30-Year Bonds: 5.84% 2.74%
The Bloomberg Barclays US Government Intermediate Total Return Index referenced above produced
annual returns since March 31, 2000 of 4.1%. The index maintains an average maturity of about 4.4 years
and effective duration of 4 years. It contains US Treasury holdings with maturities out to ten years. The
decline in market rates since 2000, which saw the 10-year US Treasury yield decline from 6.03% to
2.40%, would have pushed prices higher. Despite this, returns more closely were driven by a low absolute
level of interest rates for much of the long period. An investor in fixed income today is beginning a
compounding stream with the curve at the mid-1% level on cash to under 3% at 30 years. A rising interest
rate environment will penalize the owner of long-dated debt with price declines, the longer the maturity
the more severe the decline. A sustained increase in rates will help by allowing for reinvestment at higher
yields, but an expectation of returns much above initial yields would be asking for a lot. Further, we don’t
believe our global economy can tolerate sustained higher interest rates. Total credit market debt is 350%
larger than GDP in the US and is higher in places like Japan. Further still, rising rates would ultimately
drive valuations in stocks downward.

17
High yield debt produced returns of 7.3% over the period since March 2000. Recent returns have been
very strong, thanks to declining and low nominal interest rates and, more importantly, to collapsing credit
spreads relative to US Treasury securities. Spreads are generally widest during times of stress, when
bankruptcies and restructurings are high. They are lowest at times of robust economic conditions. When
they get too tight, any future widening comes with falling prices relative to bonds with less credit risk.
The higher yields reflect lower credit quality, and the BofA Merrill Lynch US High Yield Index is
comprised of bonds rated below investment grade (using an average of the three main ratings agencies). A
portion of high-yield bond issuers fail and restructure debt over time, so the higher interest rates are
supposed to compensate investors for that inevitable risk. Tight spreads leave less cushion. At a spread of
3.58% at year-end, the cushion is historically very tight:
Now couple the tight credit spread with low absolute yields on high-yield debt:
*Data represents the effective yield of the BofA Merrill Lynch US High Yield Master II Index **FRED is Federal Reserve Economic Data, by the Federal Reserve Bank of St. Louis – they have great data and charts:
fred.stlouisfed.org
The nominal effective yield at year-end 2017 was 5.78%, not far above the record low of 5.16% in June
2014. Combine the low absolute yield with a low spread and the prospect for high returns isn’t there. An
investor is assuming all the credit risk but is being compensated very little, both absolutely and relatively.
18
The price paid for stocks relative to earnings is the price to earnings ratio, P/E, and its inverse, E/P,
measures the yield to an investor from ownership. P/E’s for the major indices are north of 20 times, which
places the earnings yield south of 5%. We mentioned the earnings yield for the S&P 500 at 4.3% (and
even lower if normalized earnings are below current levels). The MSCI All Country World Index trades
at 20.8 times, which gives it an earnings yield of 4.8%. The NASDAQ, turbo-charged by a new crop of
tech fliers, closed 2017 at a P/E of 26.3, making the earnings yield 3.8%. The good news for techies is
that despite having only earned 2.35% annually since March 2000, you are starting with a far higher 3.8%
earnings yield today. The Naz in 2000 sported a P/E of 242 times at its March 10 peak, which worked out
to an earnings yield of 0.41%! I’m being a little tongue in cheek with this measure. There were many
more companies in 2000 devoid of profits, which inflated the number considerably. I remember that when
excluding those companies with no earnings (a passive investor can’t do this), the P/E was a more
“reasonable” 100 or so…
In a nutshell, with far lower interest rates, tight credit spreads, equity prices again stretched (low earnings
yields), systemic debt levels far higher, a much older and aging population, less nominal growth, very
crowded private equity and venture capital worlds, and low cap rates in real estate, the returns
experienced since March 2000 may be a decent proxy for expectations henceforth. Recent returns
over the last several years have outpaced underlying fundamentals across nearly all asset classes. Perhaps
expectations are too high. If you are an investor expecting returns of 6% or more from most asset classes
you are likely to be disappointed. If you find yourself today underfunded by a substantial margin relative
to your cash flow requirements or liabilities, then your experience may wind up being horrific. If you
couldn’t get your balance sheet to a solid footing by now, then how do you expect to fund liabilities in a
world of prospectively muted returns? Something’s gotta give. It always does.
Robbing a Little from Peter, But Paul Will be Fine
The Semper Augustus stock portfolio traded at year-end 2015 for a competitively low 12.1 times
normalized earnings which gave us an earnings yield of 8.2%. If our businesses produce profits consistent
with our analysis, then the earnings yield effectively becomes our base expected return over a ten to
fifteen-year horizon. Additionally, our stocks traded at 80% of intrinsic value, which allowed for 25%
upside to fair value as the discount accretes over time. At 80% of intrinsic, we’d expect to earn an
additional 2-3% per year in addition to the earnings yield. Adding these together, our long-range expected
annual return from year-end 2015 was about 10.2 to 11.2% (about 2-3% above the earnings yield – not
meant to imply precision that doesn’t exist).
Our stocks generated total returns of 27.6% in 2016 and 18.0% in 2017, a cumulative 50.6%. You would
naturally assume that most of the discount to intrinsic value, which two years ago valued our stocks at 80
cents on the dollar, would have been “used up”, pulling future returns forward. By simple math, our
stocks should now be at 120% of intrinsic value if there had been no underlying business growth. With
business growth, they would be at 95%. The expected annual return going forward would mostly consist
of the current earnings yield. So, where are we now?
The stock portfolio is now priced at 13.7 times normalized earnings, giving us a 7.3% earnings yield,
which becomes our new base case return expectation for a ten to fifteen-year horizon. Importantly, our
stocks still trade at a sizable 83% discount to intrinsic value, giving us 21% additional upside over time as
the gap closes.
Despite stocks up 18% in 2017, the portfolio was similarly valued a year ago. How can a healthy discount
to intrinsic value remain? A portion of the long-range expected return was surely used up thanks to
outsized returns over the two years (our businesses are growing nowhere near as fast as the stocks did

19
since year-end 2015). Adding a similar 2-3% per year accretion of the discount, our long-range expected
annualized return is now logically a bit lower, 9.3% to 10.3% versus 10.2% to 11.2% as calculated two
years ago. We therefore shaved about one percent from the expected long-term annual expected return.
The shave is largely due to the expansion in the portfolio’s P/E from 12.1 times to 13.7 times, effectively
accounting for 13% of the cumulative 50.6% earned. As we asked last year, “But where did the rest of the
gain come from, and why is the portfolio still similarly undervalued?”
The answer, cover your ears academicians and passive fanboys, is thanks to active management.
We have been net sellers over the last two years, but continue to find opportunity in new places. As
should be the case in the world of value, we think our sales have been at full prices with purchases at
discounts. Activity serves to keep portfolio valuation reasonable.
Long-held portfolio holdings in CNA Financial, Johnson and Johnson and Leucadia National were all
sold for price reasons last year. In the case of Leucadia, while we think Jefferies is an outstanding
company and we have great admiration for Richard Handler, we really don’t want to own investment
banks. We also eliminated our position in Chicago Bridge and Iron, which is troubled by not only an
industry slowdown but by questionable decision making at the top. While seemingly cheap, the stock may
or may not recover over time. We chalked up the loss to the mistake column and moved on to better
businesses and better managements. Beyond the eliminations, most sale activity involved trimming
position sizes back in current holdings as prices approached appraisals, advancing faster than underlying
value. In total, we trimmed seven holdings.
On the acquisition front, three new companies were acquired, each outstanding and made attractive
pricewise during the year for specific reasons. Dollar General, Nike and Seacor Marine are now in the
portfolio. We have long admired Dollar General and Nike. Both suffered temporary (we think) price
declines due to disruption, or at least the threat of disruption in their respective industries. Dollar General
is dealing with a period of weak food prices and the threat of online competition. Their low-cost position
as a premier discount retailer and initiative-driven management entrench that position, make the business
a wonderful portfolio addition. Nike also is facing disruption to distribution channels and a growing
competitive threat posed by Adidas. The price weakened enough to allow establishment of a small initial
position. In both cases, we’d like to own more. We acquired Seacor Marine after it was spun off mid-year
by Seacor. They are a niche offshore oil service business and have seen their assets and business idled by
the downturn in energy prices and in drilling activity. They were spun-off with a high-quality balance
sheet and in our opinion will add to their asset base opportunistically and are in a great position to benefit
from any sustained improvement in offshore activity.
Combining activity over the past two years, we added five new holdings and eliminated nine others.
Actively managing around ever-changing appraisals in a significant number of holdings over the years
has added lots of value and meaningful dollars to returns.
Time is generally required for investment decisions to bear fruit. We think it is a huge advantage to have
the patience, and patient clients, to allow prices to ultimately reflect underlying fundamentals. The active
versus passive debate is raging again, and when it comes to activity, we fundamentally side with the
passive crowd. We have often said, “Active management done well shouldn’t involve high activity.”
Enough value-accreting activity is necessary to outperform, but that level rarely can be manic.
Activity serves to keep portfolio quality high and prices low, and compared to the vast majority of active
investors, are far from hyper. Turnover over nineteen years averaged 13% annually. We don’t know how
some folks can turn over portfolios annually, or more frequently, and possibly expect to add long-term
value.
20
Our valuation advantage, both relative and absolute, is nearly as great today as it was in March 2000. The
S&P 500 trades for more than 23.4 times trailing earnings, with its earnings yield somewhere between
3.0% and 4.3%, depending on the earnings number used. With our 7.3% earnings yield, we are invested
with at least a 3% annual advantage just on an earning power basis. Add to the earnings yield differential
our portfolio needing to appreciate 21% to intrinsic value, where the market needs to fall somewhere
between a third and half. We like where we sit. We tend to the conservative, but regardless, believe our
stocks can perhaps double the return of the market over a sufficiently long horizon. It’s the beauty of low-
turnover, active management, particularly in the value style, grounded in price and quality.
On Cash and Intrinsic Value
Cash is a drag. We were net sellers for the past two years. Portfolio cash will drag against investment
results during periods when equity returns exceed cash yields. Rising cash balances dragged on
performance by the percentage of cash held. A roughly 20% cash position cost about 6% of return in
2016, shaving returns to 21% on average. In 2017, our cash balance across accounts approached 27% and
dragged equity returns down from 18% to about 13% before fees.
When we calculate expected returns by combining earnings yields with the expected closing of the
discount to intrinsic value, we exclude returns from cash in the calculation. Depending on how quickly we
put today’s cash to work, and how fully invested we remain over time will dictate the difference between
equity results and portfolio results. When we value Berkshire Hathaway, we assume an optionality
premium for a portion of their cash holdings, which assumes Berkshire will at some point put their cash to
productive use. We think about our cash the same way.
Clients should always be curious as to plans for cash. We do not like having lots of cash lying around, but
we also preach patience. We are fans of buying low, which requires low prices. Sometimes we’ll wait for
more attractive entry points, despite the existence of portfolio positions at undervalued prices. Some
clients have mandates requiring staying closer to fully invested. We have processes in place to accomplish
this. For those of you where we manage all or most of your assets, we are content, at least for the time
being, to allow process to work and expect to get cash more fully invested in our portfolio businesses.
As a point of reflection, in our almost 20 years running Semper Augustus, cash has never helped us. Cash
balances held during the 2000-2002 bear market hurt results because while the S&P 500 fell 50% and the
NASDAQ Composite more than 80%, our stocks made money and outperformed cash yields by a wide
margin over the period. We would have been better off fully invested. We built some cash during 2004 as
we transitioned from the smaller and mid cap businesses that had done so well during the 2000 to 2002
debacle to larger cap undervalued names. Our stocks, and the market, were up a bunch that year, and cash
balances were a drain on results. We were fully invested by late 2007, and despite losing far less than the
markets during the 2008 bear market, didn’t have cash as a helping offset. Our outperformance was the
result of owning better businesses at low prices, coupled with very high levels of portfolio activity (for us
at least) as we took advantage of abundant opportunity during the crisis. Most recently, the cash raised for
process in the last few years, as discussed, has been an anchor on returns.
We are getting to be old dogs. Wisdom ideally comes with age. Although they say you can’t teach an old
dog new tricks, we hope we are learning. We may make a resolution that once we get today’s liquid
reserves invested that we will swear off cash for good. We think cash on hand today will be deployed at
even better prices and yields than available at present. The trick is getting it to work soon enough and at
low enough prices to have warranted its existence in the first place.

21
Fundamentally Different: The Semper Portfolio and the S&P 500, Side by Side
Last year’s letter contained a section dedicated to the belief that return on capital is the essence of good
investing, discussing the irrelevance of the profit margin in an absolute sense. We argued that changes in
the amount of incremental capital required to produce a dollar of profits, and the return on that
incremental capital, is far more important.
To illustrate the importance of return on capital against an arbitrary amount of profit relative to sales, an
example that I had used when talking to business students about investing was presented. The example
contrasted two unnamed businesses and progressed through a comparison of common size financial
income statement and balance sheet measures, and ultimately a series of returns.
The “surprise” revealed one of the companies as the McLane Company, a wholesale food and non-food
distributor wholly owned by Berkshire Hathaway. Berkshire had bought the business for $1.5 billion from
Wal-Mart in 2003 and has operated and grown it for 14 years. The competitor business in the illustration,
once revealed, was no business but rather an aggregation of the S&P 500 as though it were a single
business. It’s a great way to compare companies across and within industries, as well as a company to an
index. It was clear in the result that Berkshire had paid a great price for McLane, and despite a razor-thin
margin structure common of many distributors, earned good returns on both original and incremental
capital over time. Berkshire can buy good businesses at prices and on terms not available to most.
However, for those not lucky enough to be Berkshire, you don’t have to be settle for a passive index.
We paint a picture with our intrinsic value report which concludes we maintain a valuation advantage
versus major indices. We tell you we own good businesses, but thought a common size aggregation of our
businesses would be illustrative. So, we will again present an updated common size overview of the S&P,
and this year compare it not to McLane again but to a snapshot of the Semper portfolio at year-end.
The flow of how we presented Company A last year versus Company B was well received. We’ll
incrementally present data points for the two “companies” and do away with the surprise at the end since
we already identified the businesses being contrasted.
As an aside, shortly after publishing last year’s letter I realized a grave conflation, having Mel Hall, a
former professional baseball player, not Monty Hall, the host of Let’s Make a Deal, reveal the identities
of the companies behind their respective doors. The transposition was a disaster because after his baseball
career, Mel Hall went on to a life in prison, serving many consecutive life terms for being a very bad,
very sick individual. Then I read recently that Monty Hall, the game show host, sadly passed away in
September at the young age of 96. RIP. They took the wrong Hall. This year, the fact checkers are
charged with verifying pithy stabs at humor, and with leaving the numbers alone.
Let’s begin the comparison with figures from the income statement:
Income Statement Figures S&P 500 Semper
Sales $100 $100
Earnings Before Interest and Taxes (EBIT) 14.7 17.8
Interest Paid 2.0 0.9
Pre-Tax Profit 12.7 17.0
Tax Rate 25.7% 22.5%
After-Tax Profit 9.4 13.1
Dividends 4.2 3.1
Retained Earnings 5.2 10.1 Figures are rounded and may appear off

22
These numbers aren’t enough information alone to make any kind of an investment decision, but are
integral to analysis. Our businesses possess a higher margin structure than the amalgamation of the
businesses comprising the S&P 500, but without knowing how much capital is involved in producing the
margins displayed, are of little utility. What is interesting is that the after-tax profit margin of 9.43% is a
record high for the index. We are using reported profits as opposed to operating profits, the difference
representing write-offs and writedowns (the people who invented grammar must have decided that a
write-off, which eliminates an asset value, is much more severe than a writedown, which is only partial,
thus requiring a hyphen in the case of the former). Index profits for 2017 excluding charges look to be
about $124.99, which translates to a margin of 10.7%, also a record high. Incidentally, seeing some large
charges here in early 2018 (GE for example), the reported profit number may fall short of our projection
(except for revaluations of deferred tax assets and liabilities, which for some businesses will be enormous
The other item to note in the above display of income statement figures is the proportion of profits
distributed to shareholders as dividends and those retained by the companies. We’ll say more about the
ratio later, but for now know that at 45%, the payout ratio is as high as it’s been since 1994 (except for the
brief period in late 2008 and early 2009 when profits were depressed and even negative on a reported
basis). In the olden days, the proportion of profits distributed to shareholders was much higher, averaging
above 60% from 1900 through the early 1960’s. From the early 1960’s onward, payouts steadily declined,
falling as low as 17% of profits in 2011. The period involved high levels of capital spending and R&D,
even augmented after the peak in interest rates in 1981 with increasing leverage. Since the 2008-2009
financial crisis, we have seen little economic growth, a plateauing of total credit market debt as a
percentage of GDP, and slight use of capital toward productive ends like capital spending and R&D.
Perhaps viable investment projects don’t exist in an overleveraged economy? As such, since 2011,
payouts have marched steadily higher to today’s 45%. What’s the right way to think about payouts? Many
businesses and their managements do a terrible job of capital allocation. In cases where capital can’t be
intelligently invested at good returns, shareholders would be far better off with dividends and payouts
more in line with the higher levels seen in the first two-thirds of the previous century.
In the Semper portfolio you can see a far greater proportion of after-tax profits retained rather than paid as
dividends. We reap only 23% of profits from dividends. Much of the difference can be attributed to our
large investment in Berkshire, which retains all profits and reinvests at acceptable rates of return. There
aren’t many managements that understand their role as capital allocators. Berkshire may be the best that
ever was. The balance of our companies, on average, do a very good job on this front. In fact, as we
survey the managements of the companies we own, we have never had a better roster of management
teams. As a group, they are uniquely good.
As a point on methodology, we aren’t presenting multiple years of figures or data. In the case of both the
index, and most certainly with ours, changing portfolio composition due to additions and deletions will
skew and make somewhat irrelevant comparisons from period to period. As an example, if we sold
Costco in one year, which operates with 12.5% gross and 2% net profit margins, and replaced it with a
company like Richemont the following year, with 65% gross and 15% net margins, the increase in margin
structure would appear dramatic if each position had a meaningful size representation in the portfolio. A
year over year comparison might appear as though there was margin growth taking place, which may not
have been the case. Each business may have mid-teens returns on capital invested, but comparing margin
structure against each other doesn’t lend to relevance. We tried to make that case last year with our
comparison of McLane, which operates with net margins of less than 1%. We think McLane produces
good returns on capital for Berkshire, but to look at a margin and say it’s good or bad makes no sense
without comparing the margin to the capital employed.
23
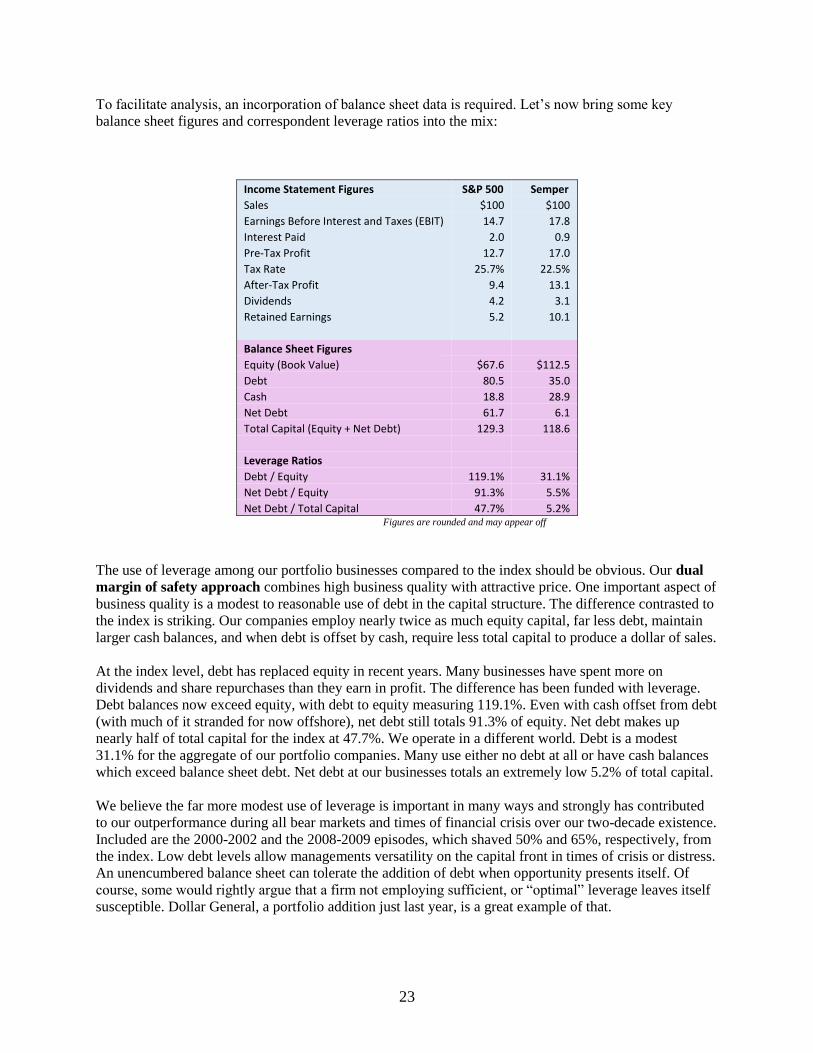
To facilitate analysis, an incorporation of balance sheet data is required. Let’s now bring some key
balance sheet figures and correspondent leverage ratios into the mix:
Income Statement Figures S&P 500 Semper
Sales $100 $100
Earnings Before Interest and Taxes (EBIT) 14.7 17.8
Interest Paid 2.0 0.9
Pre-Tax Profit 12.7 17.0
Tax Rate 25.7% 22.5%
After-Tax Profit 9.4 13.1
Dividends 4.2 3.1
Retained Earnings 5.2 10.1
Balance Sheet Figures Equity (Book Value) $67.6 $112.5
Debt 80.5 35.0
Cash 18.8 28.9
Net Debt 61.7 6.1
Total Capital (Equity + Net Debt) 129.3 118.6
Leverage Ratios Debt / Equity 119.1% 31.1%
Net Debt / Equity 91.3% 5.5%
Net Debt / Total Capital 47.7% 5.2% Figures are rounded and may appear off
The use of leverage among our portfolio businesses compared to the index should be obvious. Our dual
margin of safety approach combines high business quality with attractive price. One important aspect of
business quality is a modest to reasonable use of debt in the capital structure. The difference contrasted to
the index is striking. Our companies employ nearly twice as much equity capital, far less debt, maintain
larger cash balances, and when debt is offset by cash, require less total capital to produce a dollar of sales.
At the index level, debt has replaced equity in recent years. Many businesses have spent more on
dividends and share repurchases than they earn in profit. The difference has been funded with leverage.
Debt balances now exceed equity, with debt to equity measuring 119.1%. Even with cash offset from debt
(with much of it stranded for now offshore), net debt still totals 91.3% of equity. Net debt makes up
nearly half of total capital for the index at 47.7%. We operate in a different world. Debt is a modest
31.1% for the aggregate of our portfolio companies. Many use either no debt at all or have cash balances
which exceed balance sheet debt. Net debt at our businesses totals an extremely low 5.2% of total capital.
We believe the far more modest use of leverage is important in many ways and strongly has contributed
to our outperformance during all bear markets and times of financial crisis over our two-decade existence.
Included are the 2000-2002 and the 2008-2009 episodes, which shaved 50% and 65%, respectively, from
the index. Low debt levels allow managements versatility on the capital front in times of crisis or distress.
An unencumbered balance sheet can tolerate the addition of debt when opportunity presents itself. Of
course, some would rightly argue that a firm not employing sufficient, or “optimal” leverage leaves itself
susceptible. Dollar General, a portfolio addition just last year, is a great example of that.

24
Leading up to the financial crisis, Dollar General was unlevered. At the outset of 2007, it had about $200
million in balance sheet debt that was offset by $200 million in cash. Of course, as a retailer it used
operating leases, but in their case the underlying real estate was (and is) so cheap that the lease burden
was far from onerous. Dollar General’s terrific returns on capital didn’t go unnoticed, and the business
was taken over for a short 2 ½ year period by KKR and its sidekick, Goldman Sachs. The preponderance
of the “deal” was funded with debt, management was handsomely rewarded with vested options and
shares, capital was stripped from the company, and when KKR and Goldman underwrote their own IPO
of the company in 2009, the emerging balance sheet was far from pristine. It was saddled with nearly $5
billion of on balance sheet debt, at insanely high coupons, payable and redeemable at insane premiums to
par, to, you guessed it, KKR and the sidekick. Dollar General’s management has since worked the
leverage down, but we suppose will never run the balance sheet as cleanly again. That is, unless they want
to repeat the 2007-2009 capital grab.
So, we run our discipline at Semper with a risk averse approach, tolerant of only modest debt. Our
companies are so much less leveraged, the benefit can be seen when analyzing what really matters: profit.
Here are the measures of profitability that drive the process here. Again, it’s not the absolute level of a
profit margin, or an operating, or a gross margin. It’s how much earning power exists on the capital
invested in a business. Let’s examine the important profitability measures:
Income Statement Figures S&P 500 Semper
Sales $100 $100
Earnings Before Interest and Taxes (EBIT) 14.7 17.8
Interest Paid 2.0 0.9
Pre-Tax Profit 12.7 17.0
Tax Rate 25.7% 22.5%
After-Tax Profit 9.4 13.1
Dividends 4.2 3.1
Retained Earnings 5.2 10.1
Balance Sheet Figures Equity (Book Value) $67.6 $112.5
Debt 80.5 35.0
Cash 18.8 28.9
Net Debt 61.7 6.1
Total Capital (Equity + Net Debt) 129.3 118.6
Leverage Ratios Debt / Equity 119.1% 31.1%
Net Debt / Equity 91.3% 5.5%
Net Debt / Total Capital 47.7% 5.2%
Profitability Ratios EBIT / Total Capital 11.4% 15.0%
Return on Equity 14.0% 11.7%
Return on Total Capital 8.4% 11.6% Figures are rounded and may appear off

25
For the index, equity (book value) is probably understated, and among many of its component companies
has little meaning. With numerous businesses, equity is severely understated. With some, assets are
carried at historic and depreciated cost (shrinking book value relative to inflated earning power). In other
cases, write-offs and writedowns have reduced asset and correspondent equity values. With numerous
others, share repurchases at increasing premiums to book value drive book value increasingly lower (a
$1 repurchase at book reduces cash by a dollar and book value by an equal dollar; repurchases for less
than $1 are accretive to book value, reducing cash by a dollar but increasing book value by the discount
paid to book value; finally, repurchases for more than $1 reduce book value by more than the dollar paid).
All the described reasons for GAAP book values understating economic book value work to produce a
higher return on equity than should perhaps be the case. When this exists, then a sizable differential
between return on equity and return on capital may be justified. Typically, however, a large disparity
between returns on equity and on capital is due to leverage in the capital structure. While equity may be
understated, there is a truth about the other form of capital – debt is rarely misstated; its value is known
with certainty, particularly by the party to whom it is owed.
You can see in the index ratios that a sizable disparity exists between the returns on equity and on net
capital. The companies comprising the index earn a high 14.0% on equity. The use of nearly as much net
debt as equity in the capital structure drives the return on net capital (which is return on equity plus net
debt), to 8.4%. The return would be even lower without offsetting debt with cash.
Our 11.7 % return on equity is lower than the 14.0% earned by the index. So, is the index more attractive
because of a higher ROE? Far from it. Because our businesses are so lightly levered, our return on net
capital at 11.6% is nearly the same as our return on equity. Our companies earn far more on their invested
capital, which we think is a huge advantage. We also possess far higher EBIT on total capital invested. I’d
argue that the quality of the equity capital of our portfolio businesses is much higher. We don’t own
businesses with ongoing and sizable serial write-offs and writedowns. To the extent our managements
repurchase stock, they tend to do so with a more price conscious approach. Berkshire, as our largest
holding, is a terrific example of that, but it’s consistent across the portfolio. It is reasonable to conclude
the returns of our portfolio businesses are more reliably accurate than those of the index, which are
overstated by some material degree.
It’s also important to note that despite book values being understated on average for the index, returns on
equity and on capital have been in steady decline for at least 25 years. ROE’s on reported (after charges)
earnings averaged north of 16% during the 1990’s, and a couple percent higher for operating (difference
due to the write-offs and writedowns). Many would argue the decline in returns is a natural by-product of
a lower interest rate environment, that hurdle rates and returns on projects and other uses of capital are
lower. We wouldn’t disagree. But there is also a strong case to be made that the declines are also due to a
misallocation of capital. Surely one driver of declining returns is the repurchase of large amounts of
company shares at steadily increasing valuations. ROE’s are also overstated when using operating
earnings. Managements will have you compare profits before write-offs and writedowns against book
values that have been written down over time. Naturally you want a high numerator and a low
denominator if you want to make your ROE look good. Fool me once, shame on me; fool me twice…

26
Now let’s finally bring in price and valuation by putting the entire side-by-side comparison together:
Income Statement Figures S&P 500 Semper Sales $100 $100 Earnings Before Interest and Taxes (EBIT) 14.7 17.8 Interest Paid 2.0 0.9 Pre-Tax Profit 12.7 17.0 Tax Rate 25.7% 22.5% After-Tax Profit 9.4 13.1 Dividends 4.2 3.1 Retained Earnings 5.2 10.1
Balance Sheet Figures Equity (Book Value) $67.6 $112.5 Debt 80.5 35.0 Cash 18.8 28.9 Net Debt 61.7 6.1 Total Capital (Equity + Net Debt) 129.3 118.6
Leverage Ratios Debt / Equity 119.1% 31.1% Net Debt / Equity 91.3% 5.5% Net Debt / Total Capital 47.7% 5.2%
Profitability Ratios EBIT / Total Capital 11.4% 15.0% Return on Equity 14.0% 11.7% Return on Total Capital 8.4% 11.6%
Key Valuation Figures Price (Market Value) $220.3 $180.5 Price / Sales 2.2 1.8 Price / Book Value 3.3 1.6 Price / Earnings 23.4 13.7 Earnings Yield (Earnings / Price) 4.3% 7.3% Dividend Yield 1.8% 1.7% Retained Earnings Yield 2.5% 5.6% Dividend Payout Ratio 45.0% 23.2% Enterprise Value / EBIT 19.2 10.5
Figures are rounded and may appear off
By any valuation yardstick the portfolio is much more favorably valued than the index. Our stocks trade
at 1.8 times sales, lower than the new record 2.2 times, and for that we have businesses that produce much
more profit per dollar of sales. That translates into a P/E of 13.7 times versus 23.4 times. The index is
nearly twice as expensive on a price to book basis, so when adjusting for the premium paid to book,
nullifies much more than the 2.3% return on equity differential.
The inverse of the P/E is the earnings yield, and it’s one of the most important numbers in investing. Our
P/E of 13.7 equates to an earnings yield of 7.3% versus a more modest yield of 4.3% derived from the
index’s 23.4 multiple, meaning we have 70% more profitability for each dollar invested at today’s prices.
The importance of this can best be seen with an illustration.

27
Compare $1 million invested in our stock portfolio with $1 million invested in the S&P 500. Each $1
million invested generates the following earnings, which are then either distributed as dividends or
retained and invested by the companies:
S&P 500 Semper Difference
Dollars Invested $1,000,000 $1,000,000
Earnings $42,800 $72,800 $30,000
Dividends Received $18,300 $16,900 $(1,400)
Earnings Retained $24,500 $55,900 $31,400
Our businesses generate a full 3% higher earnings yield which is derived solely based on stock prices
relative to earnings. A lower P/E means higher earnings. In dollars, each $1 million invested has an
additional $30,000 in profits working for our benefit. It total, we have $72,800 in profits for each $1
million invested against only $42,800 earned from ownership of the index. Because our earnings are so
much greater, despite our much lower payout ratio, we receive nearly as many dividends in dollars,
earning $16,900 per year, only $1,400 less than would be paid to us from the index. But crucially, we
have $55,900 being retained and invested for our benefit, a huge $31,400 more than the amount retained
by the index members.
Now for the kicker. The $55,900 being retained on our behalf as shareholders is being invested at an
unleveraged 11.6% return on capital. The index has a smaller $24,500 (less than half of our retained
earnings) “theoretically” being invested at an 8.4% return on capital, a rate in decline for a quarter
century.
Why “theoretically”? You know from the payout ratio that an index investor is getting nearly half, 45%,
of their 4.3% earnings yield as dividends at a current rate of 1.8%. What’s happening with the remaining
2.5%? You would presume it’s being invested at the current 8.4% return on capital. But it’s not. In the
last five years, all company profits not distributed to shareholders as dividends have been spent buying
back stock. Today’s earnings yield of 4.3% is half of the headline return on capital. Any repurchase at a
P/E above 11.9 is “invested” at an earnings yield below the 8.4% return on capital. A repurchase today at
23.4 times reaps the 4.3% earnings yield. In our opinion, most repurchases, despite being labeled
returning capital to shareholders, are really destroying capital for shareholders.
We understand the argument that CEO’s and CFO’s are simply arbitraging the cost of debt capital. If you
can borrow long-term at 3%, your after-tax cost of borrowing was only 2/3’s of that (65% really, at a 35%
tax rate – moving to 21% thanks to tax reform). Call it 2%. Why not buy back stock at a 4.3% earnings
yield? We get it. It’s being done accretively relative to the cost of debt. We get that. It’s driving down
returns on capital, but in a very low interest rate world, why not? We get that, too. But it doesn’t make
sense, particularly at extreme valuations.
What we really get is how most top brass are compensated. Salary. Bonus. Use of jet. Life insurance.
Check, check, check and check. The real dough, however, is in option and restricted stock grants, which
both gain in value as the stock price moves up. Options, of course, aren’t cash, so we are instructed by
management to exclude any cost of granting those as an expense. “Move whatever silly charge GAAP
accounting makes us include to the pro-forma adjusted presentation.” “My stock is trading at 40 times
28
earnings? No problem. The consultant tells me shareholders believe a repurchase is good for them. Buy
them in at a 2.5% earnings yield. The EPS will be up. The stock will go up. Let’s get my options in the
money, honey!” Color us jaded.
What’s amazing is how little bang for the buck repurchases are getting. In 2011, with repurchases running
at a $300 billion annual rate for the S&P 500, share buybacks retired about 3% of outstanding market
capitalization per year. More recently, with repurchases averaging more than $500 billion annually, the
retirement is only buying about 2% of market cap per year. At some point, what was great for
shareholders is now costing them money. But captains of industry, who spend scant few years at the
helm, on average, have little incentive to think long-term about return on capital when their horizon to get
crazy rich spans the short-term. Stock buybacks, regardless how expensive, are a buy ticket. They reduce
shares outstanding and are accretive to earnings per share, period. That they are made at absolute levels
which drive profits properly measured downward is largely irrelevant.
We are comfortable that the retained earnings of our portfolio companies are mostly being invested at
acceptable returns. The reinvestment of retained earnings is one of the most important jobs of the
managers of public companies that retain shareholder profit. Assessing how well they invest those
retained profits is one of our most important jobs as investors. We have several companies in the fold
investing large quantities of money at great returns on capital expenditures, in projects, infrastructure,
capacity, equipment, facilities, distribution, you name it. Further intelligent investment in R&D, people,
and advertising, while not capital spending per se, can yield great returns. Many investments are being
made at returns of 20% or more. Berkshire is investing in aggregate at 10% (we think) and it’s an
unlevered 10%. They have many projects with returns exceeding that. Some large, regulated investments
come with mid-to-high, single-digit stable returns.
Why We Don’t Own the Index
If we owned the S&P 500 we’d probably be ill from watching companies squander capital. We’d own
companies with aggressive accounting that write down assets to boost returns on equity and capital. We’d
have shares being bought at prices that we would never pay. We’d own businesses with huge unfunded
pension funds that have little chance to earn enough on their plan assets to fund plan liabilities. We’d own
companies that exclude one legitimate expense after another from their “pro-forma” or “adjusted” earning
presentations. No thanks. We may not own businesses that stand to grow as fast as some index darlings.
Perhaps that’s why the index trades at 23.4 to profits against our 13.7; but we have $73,000 in earning
power per $1 million working for us against $43,000 for the market. Our relative advantage is as great as
it was at the last peak in 2000. Our absolute expected returns are even greater.
Long-term returns will gravitate to the return on invested capital. An investor should initially earn the
earnings yield, making the price paid crucial to the result. We are beginning at 7.3% today. Over time,
results will trend to the return on capital and on the reinvested capital of the business. In our case the
return on capital is 11.6%. Returns on reinvested capital are at least that high, perhaps higher. Many of
our businesses have increasing returns on equity and on capital over time and we expect that to continue.
The index on the other hand is beginning with a 4.3% earnings yield. Returns should trend to its 8.4%
return on net capital, which has been in decline for 25 years, except we think returns on reinvested capital,
for the time being at least, are being made at lower returns thanks to share repurchases at high prices. If
the math regarding the index doesn’t add up and isn’t compelling, then there exists a solution…
29
ACTIVITY V. PASSIVITY – THE COMING PASSIVE INVESTING UNWIND
The proportion of the stock market passively owned and flowing into passive investment strategies are at
records. The concept of passive investing is simple, efficient and grounded in logic. However, a good idea
taken to excess can produce a terrible outcome. The price paid for an investment is a key determinant of
outcome. Microsoft on January 1, 2000 was a different investment at $60 than three years later at $20.
Berkshire Hathaway was a different investment in 1998 at $80,000 than it was two years later at $40,000.
The price paid is the initial bracketing endpoint in a compounding series. The same business at twice or
thrice the price can’t be as nice. An index holder owns the whole index – every component at the
prevailing price, regardless of quality or price. No exclusions. We saw this picture show in the 1990’s and
it ended badly. Money is funneling into the largest of index components, pushing valuations and index
weights to extremes. Risk is mounting in passive portfolios, and it’s largely of the passive investor’s own
making.
The Argument for Passive Investing
The argument for passive investing goes like this:
• One, investing is a zero-sum game. Because the “market” is comprised of all investors, the
returns of all investors will equal the market return. For any investor, or even for any position that
outperforms the market, there will be an offsetting manager or position that underperforms by a
like amount. There can be no excess return. It matters not the asset class, geography or segment,
regardless how “inefficient”, the sum of all investors’ returns is the market return.
• Two, the zero-sum game, being the market, is before costs, therefore, if you are destined to get
the market return, why incur frictional costs? The aggregate sum of all investors, earning the
market return before fees and costs, will earn exactly less than the market return by the sum of all
fees and costs. These costs aren’t small, by the way. Fred Schwed wrote, “Where are the
Customers’ Yachts” in 1940. His was a fair question.
• Three, while there have been, and very well may be, investors that outperform the market, they
are few and far between. And even though they are out there, how in the world would you go
about finding them? Because it’s too difficult, you shouldn’t bother trying.
• And four, 3B really, none other than Warren Buffett himself, possessing one of the greatest
records of investment outperformance extant, proclaims that the average investor ought to own an
index fund. If it’s good enough for Warren Buffett, then…
Regarding points one and two, we are in complete agreement. Both are mathematical certainties. The
market is the market is the market, and each investor is but a bit in the game. There is no doubt that the
aggregate of all investors combined investment results will equal the gross market return minus all fees,
costs and expenses. It doesn’t matter whether we are talking about large-cap US stocks, US T-bills, or
micro-cap growth companies in countries beginning with the letter Z (there must be an ETF for this). The
30
greater the expenses, the greater the performance hurdle, with time as the leveler. Fees, as do returns,
compound, and they are difficult to overcome over time, even for good investors.
Point three has a ton of validity. We have always said that of the few investors that can outperform over
long-periods of time, how is it that their clients found them? Was it skill or diligence on their part, or was
it luck, or fate, or was it buy high, sell low? What if the ability to outperform has run its course, and
clients coming in late to the party will reap inferior results? You can see this throughout the record books.
Many of the great track records attracted the most capital after periods of outperformance. Clients, like
too many investors, buy high and sell low.
Further validating the argument behind point three, even if a client is smart enough, or lucky enough, or
fortunate enough, to find one of the great investors, what’s to say they have the patience to finish the race.
The great track records are not produced in linear fashion, and are far from consistent. Outperforming
over many market cycles is not done each year, or every three years, or five years, or ten years. There are
long periods of underperformance that go with every outstanding track record. All the great investors
have had clients leave them after periods of underperforming. Walter Schloss, who compiled one of the
all-time brilliant track records, shrugged as he was losing clients in the late 1990’s because he was
underperforming and wouldn’t give them the tech and internet exposure they felt they needed. He had
seemingly “lost his touch” and was out of touch with modern thinking. Many that fired him had been
clients for decades, having invested with him since the 1950’s and 1960’s. It must be expected that long-
term outperformance will come with durations of underperformance, perhaps as much as half of the time
over short-term intervals. As the intervals lengthen, periods of underperforming recede. At the end of the
day, we all know what happened with the tech bubble. It ended badly.
On point four, we have heard Mr. Buffett’s opinion regarding passive investing and index funds for many
years. It is sound advice, applied correctly and by those who need it. It makes complete sense for an
individual investor or a family, at the outset of adulthood and a lifetime of saving, to begin an investing
program that regularly deposits savings into a low-cost index fund, the S&P 500 being the most
mentioned, the most indexed, and most efficiently done. With ongoing purchases, the strategy of dollar
cost averaging will at times make purchases at low prices, fair at others, and at times, high. It’s not a
strategy requiring thought or expertise, and if practiced with discipline and a willingness to not override
the program due to emotion, should produce a good long-run result. Avoiding otherwise large and
compounding fees and expenses becomes an enormous advantage over time against those up against the
zero-sum game. One of the hurdles to clear with this strategy is overcoming emotion. Refraining from
action during times of crisis, and with no one there to “talk you off the ledge”, the temptation to sell when
times get tough is a very real risk to the success of the entire program. How many investors do you know
that sold everything in 1974, or 1987, or 2002, or 2009? We’ve met plenty. And of those, most have
rushed back in, but only after sustained recoveries, when the appearance of risk has receded.
The advice to index has been taken up by a widening swath of the investment world. We see more and
more large institutional investors who have decided to index their “core”, or their large cap US, or many
other facets of the equity and fixed income worlds. We are now seeing indexed private equity (there exists
one “S&P Listed Private Equity Index” that happens to have a negative total return since its March 2007
launch). Many households are taking up indexing as well. The problem is, many are just now getting
around to doing so in the last handful of years, some only very recently. There are enormous flows of
capital away from active managers, many of the value persuasion (the only type we know of to have
produced the great long-run track records). When the herd stampedes, danger rises.
International investing has seen huge inflows. Emerging market investors have also been major recipients
of new cash flows in the last two years. By size, emerging markets are tiny. Large flows produce large
results. It should be no surprise that emerging market equities led the field last year in the performance

31
derby, with the MSCI Emerging Markets Index up 37.3%. If you were “in” for the last two years, you had
a good experience. If you are only now following the emerging herd abroad, there remains less value. Did
the underlying emerging businesses themselves grow intrinsically by 37.3% in a year? Large flows can
impart a momentum effect, driving narrowing prices in certain assets higher. Often, those allocating
capital don’t even realize they are contributing to momentum-induced returns. Many are simply reacting
to a fear or envy of not having an allocation in microcaps in countries beginning with Z, especially if all
the other kids are already there and making money. The mindset breeds mediocrity at best, and ultimately
can be a dangerous thing. How many university endowments decided to jump on the “Yale model” and
initiate alternative programs just prior to the financial crisis? How many of those same funds
subsequently backed away for being so badly burned?
Those now dedicating allocations of their “core” to the S&P 500, the granddaddy of the passive world,
own the index we described in the previous section. You own a 4.3% earnings yield, businesses that
are highly leveraged with declining returns on equity and capital, and who are reinvesting the
slightly more than half of profits at returns ranging from mediocre to capital destroying. If a fund
was indexing the core for 30 years, and had been investing dividends and employee, tax, charitable,
saving or whatever form of contribution or savings regularly, both at low and at high prices, then that’s
one thing. How many are newly “actively” allocating to a passive index at record valuations? How much
more risk is being taken than is assumed?
Mr. Buffett’s advice makes sense for the long-term saver, particularly at the outset of an investment
lifetime. If you have a large amount of capital today, making the active decision to invest passively, is a
terrifically dangerous proposition, especially if you are reallocating capital away from areas that may be
more reasonably valued.
Superinvestors
Mr. Buffett wrote a well-known article in 1984 titled, “The Superinvestors of Graham-and-Doddsville”.
It was the summary of a speech he gave at Columbia to commemorate the 50th anniversary of the
publication of Security Analysis, which was written during the Great Depression following the 1929-1932
stock market crash (which shaved 89% from the stock market and a sizable chunk of the authors’ net
worth). Ben Graham and David Dodd’s Security Analysis is the bible for value investors. It has been
published in 6 editions with numerous updates and printings of each over the years. I own multiple copies
of all editions save the first, which was published in two printings. If anyone has a copy of the 1934 first
edition laying around to no good use, I’d be happy to take it off your hands. I’d take either printing, why
be choosy? Some people collect buttons and beer cans, others collect fire trucks. To each his own. I
collect Security Analysis...Moving on, the “Superinvestors” article extolled the virtues of value investing
properly done. In it, Mr. Buffett challenged the then new academic dogma of market efficiency and its
scientifically sounding “Efficient Market Hypothesis”, which hypothesized and presumed to prove that in
an efficient market an investor can obtain no information that would allow them to beat the market. The
theory concluded that, at all times, security prices reflect all known information, legally obtained or
otherwise, and are thus always perfectly reflective of fair value. The theory laid the foundation for passive
investing.
Superinvestors otherwise “proved” that good investors did indeed exist, and identified nine investors that
had outperformed by wide margins over long periods. One of the primary characteristics among the nine
was an adherence to the belief in “discrepancies between price and value”. There was no conformity
among the individual portfolios. Each owned different investments, and earned their sizable
outperformance over different periods. Each also suffered durations, some rather long, of not only
relatively underperforming but of outright losing money. Some even declined more than the market

32
during the devastating 1973-1974 bear market. The article also noted that size of capital becomes a
hurdle, noting,
“Size is the anchor of performance. There is no question about it. It doesn’t mean you can’t do
better than average when you get larger, but the margin shrinks. And if you ever get so you’re
managing two trillion dollars, and that happens to be the amount of the total equity valuation in
the economy, don’t think that you’ll do better than average!”
On point before the advent of indexing, eh? Beyond the article, which was also published as an appendix
to at least one of the editions of Ben Graham’s, The Intelligent Investor (the best investment book ever
written for the lay person), Mr. Buffett has made clarifying remarks about his advice regarding indexing
and passive investing. He duly notes that outperformance can’t be accomplished without certain elements.
It requires devoted work and proper wiring, which involves a willingness to deviate from the herd or the
crowd. Outside of a value-based approach, there aren’t approaches that have the right orientation.
Go with the Flow
Over the years, we have kept an eye on the flow of funds among asset classes and within the equity
markets. It’s not easy, and we don’t spend much time with the exercise, but there is utility in having an
idea of where money is moving.
It’s easy to draw faulty conclusions regarding investment flows. For example, it’s been widely reported
that numerous classes of owners of equities have been selling their stock portfolios for years, as
evidenced by declining direct ownership of individual securities and by net redemptions out of stock
mutual funds. Over the most recent four quarters ended September 30, households, equity mutual funds,
institutional investors and international investors were all net sellers of stocks by a combined $280
billion. It gets broadcast that these investors are fleeing the US stock market. But if flows into EFT’s are
considered as an offset, with investors perhaps moving from active strategies to passive, you get a
different picture. ETF’s attracted $350 billion over the same period, so a net $70 billion was directed into
an asset class that is conventionally passive (though as money moves from ETF to ETF, somebody is
making an active decision with passive investments). You could make the case that flows to the ETF
world are done with less, or little, concern for valuation, with no attempt to capture a disparity that may
exist between price and underlying value.
Net corporate issuance is another component in gauging net flows to or from stocks. In our years of
observing the markets and studying its history, we have drawn the conclusion that from the end of the
Great Depression through the mid-1990’s, share repurchases were made at times when management felt
their shares were undervalued. Commensurately, companies raised capital when markets were strong and
offerings could be priced on attractive terms to the issuer. During the tech run-up in the late 1990’s, an
increasing number of offerings took place in technology, media and telecommunications, and ultimately
in the fanciful internet world, which ultimately destroyed capital because the capital raised wasn’t put to
productive use. During the same period, tech companies were also issuing large amounts of stock to
management and employees through stock options. Then, option grants weren’t treated as a corporate
expense. As stock prices bubbled upward and option shares were exercised, the dilution across the market
was high. Our client letters from the time quantified some of the effect. To offset the dilution, and to drive
share prices higher, thus making the option holders wealthier, companies spent cash at increasingly high
and ultimately outrageous prices to buy back shares. The lunacy on both ends, both with issuance by dot
coms and repurchases by tech companies, largely offset each other from a flow standpoint.
Somewhere around 2003 or 2004, the mantra of share repurchases as beneficial to shareholders took hold.
The issuance of equity to management never slowed, though when FAS 123(R) compelled the expensing

33
of stock options grants beginning in 2005, a good chunk of grants shifted to restricted shares, which come
without a strike price (which requires payment and can exceed the the share price at times) and simply
vest for the grantee over time. It is a truism that a share purchase, everything else held constant, would
push up stock prices. With the mantra of being good for shareholders coupled with enriching the wallets
and purses of management, buybacks took off. Since 2004, repurchases just for the companies in the S&P
500 averaged over $400 billion annually, hitting annual highs near $600 billion immediately before the
financial crisis and again in the last two years. In too few cases are shares bought back with a motivation
of price to value in mind. Recessions and times of crisis hammer this point home.
During the 2008-2009 crisis, as shares fell on average by 65%, repurchases dried up, falling from a $600
billion annual rate to about $100 billion, this despite stocks being as undervalued as at any time since
1991, in our opinion. Share issuance, on the other hand, rose dramatically, and it wasn’t because prices
were high and capital could be had on attractive terms. It was because companies were strapped,
particularly in the finance industry. Banks, brokers and insurers were insolvent, some technically and
others for real, and needed capital to strengthen balance sheets and meet capital requirements. Four of the
ten largest component members in the S&P 500 at year-end 2006 were technically bankrupt within two
years. All four recapitalized with equity holders suffering permanent loss to massive dilution. The
financial sector has been a net capital raiser since the crisis.
All other industries have been net repurchasers, with the recent exception of the energy sector, which has
seen capital lost and destroyed by low energy prices killing returns on what was a massive amount of
capital spending leading up to 2014. The net takeaway is that for too many companies, and for much
of the broad market, a buy high sell low reality has been underway for nearly a decade and a half.
Net share retirement has averaged about $300 billion annually, with the lone 2008-2009 outlier which saw
net issuance of about $300 billion at rock bottom prices. It’s counterintuitive and remarkable at the same
time.
Earlier in the letter we showed returns on various asset classes since March 2000. Hedge funds have
produced mediocrity for many years. It should come as no surprise that investors redeemed $112 billion
in 2016, which totaled about 3.5% of their $3.2 trillion in assets. Flows appear to have stabilized this year,
but returns continue to lag the stock market, with the HFRI Fund of Funds Composite up 7.7% in 2017
and averaging 4.0% for five years. The Barclay Hedge Fund Index posted better returns (perhaps due to
one less layer of fees), returning 10.6% for the year and 6.0% as a five-year average. The S&P 500
returned 21.8% last year and averaged 15.8% over five.
Across the range of indices for the year, large dwarfed small and growth trounced value. The large cap
Russell 1000 Growth Index beat the large cap Russell 1000 Value Index 30.2% to 13.7%. In small cap,
the Russell 2000 Growth beat the Russell 2000 Value 22.2% to 7.8%. It feels more and more like the late
1990’s. There are even companies adding “Crypto” or “Bitcoin” to their name and seeing their stocks
shoot instantly upward. That of course isn’t a flow issue, just a lack of brain issue.
One data point or long-term series we’d love to see is how much of the stock market, both in the US and
abroad, is and has been indexed. If anyone has good information, please share! The Financial Times
reported in September 2016 that passive funds accounted for a third of mutual fund assets in the US, up
from a quarter over three years. We presume the percentage is at a record today, and would have
presumed the same thing in 1998, the last time we saw pervasive popularity among passivity. S&P Dow
Jones Indices reports that of the $22.9 trillion US market cap, there is $7.8 trillion benchmarked to the
S&P 500, with index assets comprising about $2.2 trillion of the total, about 10%. They list 95 “index
linked products” on their website that directly track the index, which don’t include the myriad mutual
index funds, such as Vanguard’s, which also try to replicate the index. On top of that are “active”
products such as “Smart Beta” that tweak index construction rules to try to add modest outperformance
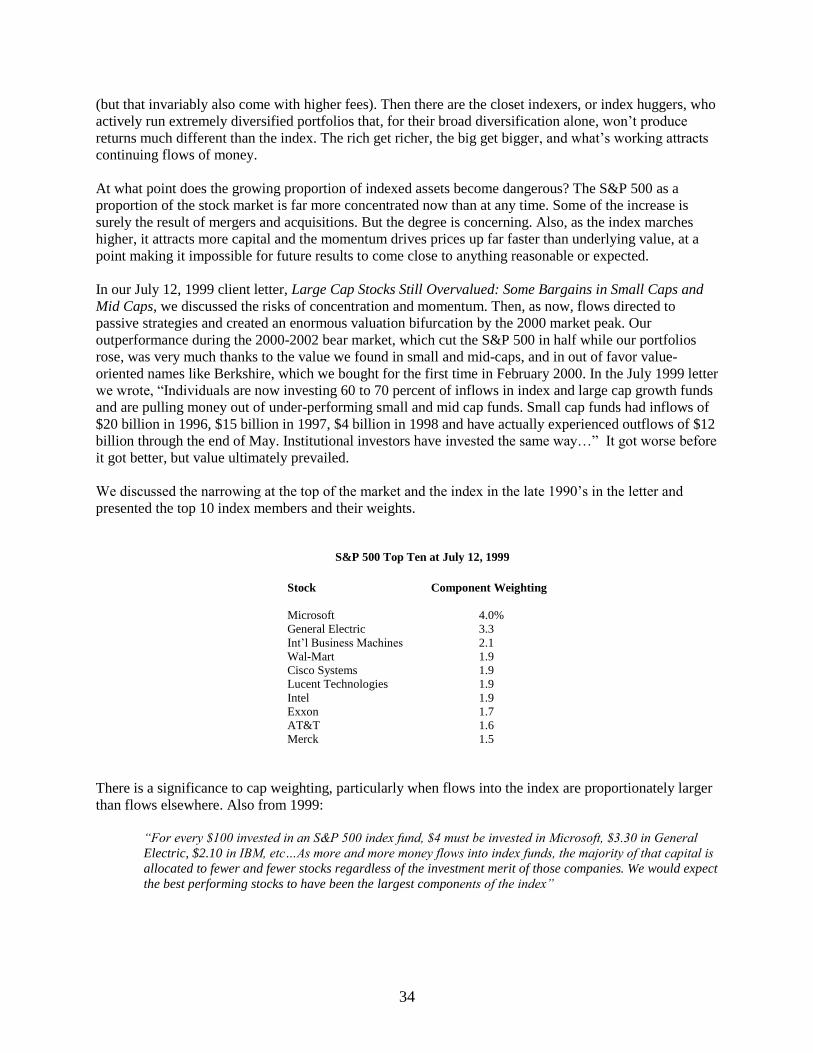
34
(but that invariably also come with higher fees). Then there are the closet indexers, or index huggers, who
actively run extremely diversified portfolios that, for their broad diversification alone, won’t produce
returns much different than the index. The rich get richer, the big get bigger, and what’s working attracts
continuing flows of money.
At what point does the growing proportion of indexed assets become dangerous? The S&P 500 as a
proportion of the stock market is far more concentrated now than at any time. Some of the increase is
surely the result of mergers and acquisitions. But the degree is concerning. Also, as the index marches
higher, it attracts more capital and the momentum drives prices up far faster than underlying value, at a
point making it impossible for future results to come close to anything reasonable or expected.
In our July 12, 1999 client letter, Large Cap Stocks Still Overvalued: Some Bargains in Small Caps and
Mid Caps, we discussed the risks of concentration and momentum. Then, as now, flows directed to
passive strategies and created an enormous valuation bifurcation by the 2000 market peak. Our
outperformance during the 2000-2002 bear market, which cut the S&P 500 in half while our portfolios
rose, was very much thanks to the value we found in small and mid-caps, and in out of favor value-
oriented names like Berkshire, which we bought for the first time in February 2000. In the July 1999 letter
we wrote, “Individuals are now investing 60 to 70 percent of inflows in index and large cap growth funds
and are pulling money out of under-performing small and mid cap funds. Small cap funds had inflows of
$20 billion in 1996, $15 billion in 1997, $4 billion in 1998 and have actually experienced outflows of $12
billion through the end of May. Institutional investors have invested the same way…” It got worse before
it got better, but value ultimately prevailed.
We discussed the narrowing at the top of the market and the index in the late 1990’s in the letter and
presented the top 10 index members and their weights.
S&P 500 Top Ten at July 12, 1999
Stock Component Weighting
Microsoft 4.0%
General Electric 3.3
Int’l Business Machines 2.1
Wal-Mart 1.9
Cisco Systems 1.9
Lucent Technologies 1.9
Intel 1.9
Exxon 1.7
AT&T 1.6
Merck 1.5
There is a significance to cap weighting, particularly when flows into the index are proportionately larger
than flows elsewhere. Also from 1999:
“For every $100 invested in an S&P 500 index fund, $4 must be invested in Microsoft, $3.30 in General
Electric, $2.10 in IBM, etc…As more and more money flows into index funds, the majority of that capital is
allocated to fewer and fewer stocks regardless of the investment merit of those companies. We would expect
the best performing stocks to have been the largest components of the index”

35
We segmented the index to illustrate the narrowing at the top, and noted that if the index were equal
weighted, the index return in 1998 would have only been 10.8%, instead of its 27.7% cap weighted
return:
Component of S&P 500 Returns for 1998
Largest 10 stocks +38.5%
Largest 100 stocks +31.4%
Next 100 largest stocks +13.8%
Middle 100 stocks +7.1%
Smallest 100 stocks -3.6%
The market had been narrowing for four and a half years, ultimately peaking about nine months later in
March 2000. In looking at the list from 1999, we knew not only did the market go on to produce the 5.0%
annual returns we discussed earlier (from March 2000), but we thought it would be enlightening to see
how each of the top ten stocks did since our July 1999 letter:
Returns from July 12, 1999 to December 29, 2017
Stock Total return Annual return
Microsoft 100.2% 3.8%
General Electric -18.4 -1.1
IBM 44.7 2.0
Wal-Mart 147.5 5.0
Cisco Systems 30.8 1.5
Lucent Tech* -95.6 -34.4
Intel 67.1 2.8
Exxon Mobil 191.7 6.0
AT&T* 12.7 0.7
Merck* 26.3 1.3
S&P 500 123.3 4.5 *Excludes Medco spin from Merck, Agere from
Lucent, Comcast and AT&T Wireless from AT&T
How many investors, particularly those invested in index funds, would have predicted these results over
the next 18 ½ years? Remember our assumption that you would earn the earnings yield over a very long
horizon? On our conservatively stated earnings, the earnings yield for the S&P 500 at 40.5 times earnings
was 2.5% in early 2000. Using reported earnings of just over 30 times, the earnings yield was 3.2%. The
index returned 4.5%. Microsoft earned 3.8% per year, spending much of the period underwater. GE is
negative. IBM got you 2.0% per year. Cisco only recently is in the black and provided 1.5% annually.
Lucent was a washout, costing you 95% of your money. Only Wal-Mart and Exxon produced returns that
barely exceeded the modest 4.5% index return. Exxon was the best of the bunch producing a 6% annual
return. By the way, for most of the 10 companies, results were far worse from the end of 1999 and
certainly from March 31, 2000, when we first published our intrinsic value report.
So, this is ancient history, right? Not to be repeated?

36
Here’s the current top 10 list, with weightings and total return in 2017:
12/31/2017 S&P 500 Index Weight and One-Year Return
Stock Index Weight 2017 Total Return
Apple 3.8% 48.5%
Microsoft 2.9% 40.7%
Amazon 2.0% 56.0%
Facebook 1.8% 55.4%
Berkshire Hathaway 1.7% (float adjusted) 21.9%
Johnson & Johnson 1.6% 24.4%
JP Morgan 1.6% 26.7%
Exxon Mobil 1.6% -3.8%
Alphabet C 1.4% 35.6%
Alphabet A 1.4% 32.9%
Bank of America 1.3% 35.7%
S&P 500 100.0% 21.8%
Finally, you can see the degree to which flows drove performance at the top of the index, just as they did
as shown above in 1998:
Component of S&P 500 2017 Total Return *
Largest 5 stocks +45.3%
Largest 10 stocks +32.2%
Largest 25 stocks +29.9%
Largest 100 stocks +24.5%
2nd 100 largest stocks +22.0%
3rd 100 largest stocks +17.0%
4th 100 largest stocks +14.2%
Smallest 100 stocks - 1.1% *Uses beginning weights
The concentration of return at the top end of the index looked very much like the distribution from 1998.
The largest names captured the largest flows and posted the greatest returns. All down the line, as market
caps were smaller, so were returns. The five biggest names returned a whopping 45.3%. The 100 largest
earned 24.5%, beating the overall index return of 21.8%. The second largest 100 members matched the
index return at 22.0%. Below the top 200 names, you trailed the average, and the smallest 100 stocks lost
money, falling 1.1%. The smallest 100 in 1998 fell as well. We observe this distribution at the top of the
heap and see danger building for index holders.
The big get bigger and attract more of the flows, when the flows are coming in. Our methodology in
calculating the returns used beginning weights. Thus, those stocks that outperformed the index have
higher component weightings at year-end 2017 than they did at the beginning of the year. Apple is now
the largest. Thanks to its 48.5% return during the year, its weight rose from 3.2% to 3.8% by year-end.
Amazon rose to 2.0% from 1.5%. Facebook from 1.4% to 1.8%. Microsoft is back to the number two
position. It was king in 1999 at 4.0%, peaking on January 1, 2000 at 5.0%. It fell out of the top ten and is
now back to 2.9%. Did you ever blow up a balloon as a kid and have it finally pop? With each final
breath, you knew it was going to explode in your face, just not with which breath. This one…This
one…This BAM!

37
Think long and hard about what kind of returns you expect as an index fund investor over the next
decade, or over the next 18 ½ years. How will today’s top 10 fare? How many of the top 10 will still be
there? Will one lose 95% of its value, as Lucent did. The pat answer from an index fund investor should
be that these things are unknowable, and for that you should index. You get what you pay for. Today’s
top ten components comprise 21% of the index, just about their representation in 1999. Will the leaders
march ahead as they did in 2017, with the four biggest members up between 41% and 56%?
Recall the logic, or lack of, that for every $100 invested, $3.80 must now go to Apple shares. $2.90 must
be allocated to Microsoft. Amazon gets two bucks, Facebook a buck eighty, and so on. It does not matter
the price to value. It does not matter if the business will go bankrupt. If it’s in the index you must own it,
in the proportion at which it exists. The more money gravitates to the index, away from other pools or
strategies, the higher the largest components will rise. Somewhere between then and now, the amount of
momentum-induced concentrated risk rises. At a point, prices are no longer reflective of fundamentals. To
a passive investor, it matters not. It matters quite a bit to us, however, and it presents opportunity.
At the writing of the July 1999 letter, we had never bought a share of any of the names. From the peak,
the S&P 500 fell by half and the NASDAQ by over 80%. With the bursting of the bubble and the passage
of time, underlying business value in many cases finally caught up with and moved ahead of share prices,
creating value, and in some cases opportunity. We ultimately purchased five of the 1999 top ten. Value
moved from small and mid cap businesses to large cap names. Our experience in all five has been terrific,
far better than the returns earned by holders at the 1999 letter date! The aim of active value investing
after all is to buy low and sell high. We subsequently owned Microsoft, Wal-Mart and Merck, often
trimming positions as they became dear and adding to them as they got cheap. All three have been sold
for price reasons. We also picked up and still own Exxon Mobil and Intel, and likewise have a successful
history of trimming and adding to each position. Both have most recently been trimmed and are well
below peak portfolio weightings, also for price reasons.
Of the current top ten list, we only own Berkshire and Exxon Mobil. It appears both finished at the
bottom of the top ten performance derby last year, with Exxon posting a decline for the year. Both are
well above our average cost.
We see a lot of parallels with the lunacy that prevailed in 1999. Party they did that year.
The Nail in the Passive Investing Coffin – Price Doesn’t Matter…Until it Does
The huge outperformance, seen above in 1998 and again in 2017 in the S&P 500, leads to the question
about how pervasively indexing is affecting the broad stock market. Are vast inflows into non-S&P 500
index strategies and products favoring the largest index components as well? We know how prevalent
ETF, index fund, institutional and retail flows into passive products are. Large cap active investors have
been replaced en masse with a passive approach. The hypothesis is the same distortive effect may be
taking place among other indices. Because the S&P 500 is likely drawing the preponderance of flows,
perhaps the effect may not be as great. We examined what was happening within other indices to test the
hypothesis, using beginning-year 2017 index weights and running cap-weighted groupings for ten
additional indices. The equity indices span growth and value, large, mid and small cap, as well as global
and international. Returns were calculated using weighted performance for the same size groupings as had
been done for the S&P 500. We reasoned you might see some of the same effect, but in indices that badly
trailed like the Russell 1000 Value and the Russell 2000 Value, that any effect may not be apparent, or
even reversed, especially if money was departing value.

38
The results are stunning. Words can’t do justice to the degree to which passive investing is now in an
epic bubble, with money funneling into a narrowing group of names. Behold the insanity.
2017 Index Returns Distributed by Largest Members and Quintiles
Index
Total
Return
Largest
5
Largest
10
Largest
25
Largest
Quintile
2nd
Quintile
Middle
Quintile
4th
Quintile
Smallest
Quintile
MSCI Emerging
Market 37.3 68.0 62.5 55.9 45.0 39.1 25.1 25.0 2.5
Russell 1000
Growth 30.2 45.2 44.5 38.9 38.5 25.6 23.8 12.9 -2.0
MSCI EAFE 25.0 20.2 22.3 21.7 22.5 20.6 23.6 20.6 6.7
MSCI ACWI 24.0 49.2 46.7 34.5 26.9 25.2 22.7 21.0 10.5
Russell 2000
Growth 22.2 93.3 85.1 55.4 32.6 14.4 9.2 -7.2 -23.2
S&P 500 21.8 45.3 34.3 29.9 24.5 22.0 17.0 14.2 -1.1
Russell 1000 21.7 45.3 34.3 29.9 32.3 20.2 25.6 12.9 -18.1
Russell Midcap 18.5 42.0 35.3 29.9 24.0 20.4 14.8 8.6 -11.3
Russell 2000 14.7 76.3 73.0 54.5 36.2 19.3 4.4 -3.1 -18.6
Russell 1000 Value 13.7 26.5 19.2 14.4 16.4 14.5 19.2 7.6 -10.9
Russell 2000 Value 7.8 45.6 33.9 15.1 16.6 9.2 1.6 -0.4 -18.5
Source: Bloomberg Raw Data; SAI Calculations; Index components derived from ETF Index Holdings; Component weights using year-end 2016
weights.
Returns for the two international indices, MSCI EM and MSCI EAFE are in US Dollars. The global index, MSCI ACWI, is just under half international, and is also in US Dollars. The dollar declined against most currencies during 2017. The returns for each index in local currency
terms would have been lower by the amount of the decline in the US Dollar.
Wow! I never would have guessed that passive index flows could create this kind of unnatural disparity
across every major equity index! The five largest stocks in each index dwarfed everything else. The ten
largest trounced the twenty-five largest. Performance was heavily skewed to the largest quintile on down
the line. Even among value indices, which badly trailed growth and international, the largest index
components posted huge positive returns, with the smallest badly negative. We know that institutional
flows have favored international equities over domestic, explaining the big returns posted by the
respective international and global indices. We also know that flows to growth and away from value have
been going on for some time, just as taken place in the late 1990’s. But the belief would have been that
flows headed abroad and to growth investors would be allocated to active investors and strategies. The
reality is that many active investors don’t stray far from their “benchmarks”, and their portfolios wind up
looking a lot like whatever index they are supposed to be beating. The skew seen in the table is
unbelievable.
If passive investing created distortions in the late 1990’s that led to 17 years of poor returns for the largest
members of the S&P 500 (and for the index), then prospective mediocrity may be the best case.
Among the two international and one global index, the returns listed are US dollar based. The currency
declined against most major currencies in 2017, which helped the reported returns here. The broad US

39
Dollar Index (DXY) lost 10% for the year. The MSCI Emerging Market Index and MSCI EAFE would
have likely seen negative returns in their bottom quintiles.
Why would the smallest companies, those in the 4th and 5th quintiles, fare so poorly in every index? In all
the US indices, 5th quintile returns were negative. In large, mid and small cap, and in growth and value, 5th
quintile returns were negative. You would think that on the back of positive passive flows that all index
components would uniformly rise with the tide. The answer likely must result from flows of capital away
from active managers, who don’t own cap weighted portfolios mimicking an index. The proportion of
each index in the lower quintiles are small, and overweight positions held by active managers being fired
would place downward pressure on those names.
The distribution of returns across all the indices was so dominated by the few, it’s like watching a
perfectly balanced playground see saw, with the chubby kid on one side and the rest of the class on the
other. If over the course of a year Lumpy is given all the food and grows even larger, what happens to the
balance? In the smallest quintiles of each index, the skinny kids are being starved and are losing precious
weight. Some are near death and are falling off the see saw, yet capital allocators keep feeding the fat kid.
Here are beginning and ending weights for our component groups at the outset of 2017 and at the end.
With the drastic outperformance of the largest components, index weights are now even more top heavy.
2017 Beginning and Ending Year Component Weights The Rich Get Richer (The Fat Get Fatter)
Index
Total
Weight
Largest
5
Largest
10
Largest
25
Largest
Quintile
2nd
Quintile
Middle
Quintile
4th
Quintile
Smallest
Quintile
MSCI Emerging
Market 100
12.5 /
15.9
18.9 /
22.0
28.5 /
31.7
58.0 /
61.3
17.5 /
17.3
11.0 /
9.9
7.6 /
7.2
5.8 /
4.2
Russell 1000
Growth 100
19.6 /
23.6
24.5 /
30.4
36.8 /
41.6
71.3 /
72.7
14.1 /
13.9
7.4 /
6.8
5.0 /
4.5
2.3 /
1.9
MSCI EAFE 100 6.8 /
6.5
11.7 /
10.6
21.0 /
19.5
58.7 /
60.4
17.4 /
17.4
9.7 /
10.0
6.7 /
7.0
4.8 /
4.1
MSCI ACWI 100 5.3 /
6.4
7.7 /
9.2
15.2 /
16.4
55.9 /
57.0
18.7 /
18.4
12.0 /
11.6
8.1 /
8.1
5.3 /
4.9
Russell 2000
Growth 100
1.6 /
2.2
2.6 /
4.6
6.7 /
9.0
46.0 /
50.8
25.9 /
25.2
16.0 /
13.4
8.2 /
6.2
3.7 /
2.7
S&P 500 100 11.0 /
13.3
18.9 /
21.0
32.5 /
34.6
62.7 /
64.6
16.8 /
16.5
9.5 /
9.0
5.9 /
5.8
4.0 /
3.6
Russell 1000 100 9.8 /
11.9
17.0 /
18.9
29.2 /
31.1
71.6 /
72.3
14.1 /
13.5
7.3 /
7.3
4.5 /
4.4
1.0 /
2.5
Russell Midcap 100 2.1 /
3.9
4.2 /
4.6
9.6 /
9.7
42.1 /
42.8
24.0 /
24.4
16.1 /
16.1
10.9 /
10.9
6.6 /
6.1
Russell 2000 100 1.1 /
0.9
1.7 /
2.0
4.0 /
5.0
47.4 /
50.1
25.5 /
24.4
15.0 /
13.6
8.1 /
6.9
4.0 /
3.3
Russell 1000 Value 100 10.6 /
13.7
19.6 /
22.3
35.8 /
36.0
70.7 /
70.0
14.5 /
14.4
7.7 /
7.8
4.5 /
4.7
2.6 /
3.1
Russell 2000 Value 100 1.1 /
1.8
2.1 /
2.9
6.9 /
6.9
48.7 /
50.1
24.1 /
23.4
14.4 /
13.7
8.0 /
7.1
4.7 /
3.6
Source: Bloomberg Raw Data; SAI Calculations; Index components derived from ETF Index Holdings; Component weights using year-end 2016
and year-end 2017 weights.
This gets to be a busy but powerful table. The numerator in each box represents the weight at the
beginning of 2017 and the denominator is the year-end weight. Because returns among the largest
components were highest, the weighting of the larger segments grew during the year. With the smallest

40
quintiles lagging and generally declining, their weights are now lower. Money is pushing the largest even
higher and it likely doesn’t correlate to underlying fundamentals. It’s flow, baby.
We have written in the past that passive indices are far from it. Turnover in the S&P 500 averages about
4% per year. Where weight adjustments don’t correlate to returns in the previous table, mergers,
bankruptcies, and index expulsions and additions will distort and adjust weights. Generally, however,
because inflows drove the large members disproportionately higher, the weights over the course of the
year are higher. Using the MSCI Emerging Market Index as an example, 15.9% of new contributions are
now directed to the five largest components versus 12.5% a year ago. If those five stocks grew faster than
the underlying value of the businesses, the riskiness of your contribution is higher today, period.
We don’t know when the situation will reverse itself. If you believed flows to passive funds and strategies
would continue to run, why not just own the five biggest components of each index? Had you done that in
2017, you would have looked like a genius.
When the flows finally reverse course, the money invested in passive portfolios is going to get hurt. The
magnitude of outperformance at the top is incredible. When this changes direction, there are going to be a
lot of people banking on the efficiencies and low-cost rationale of passive investing that wind up with far
less money than they expected to have. The tables above should be a major red flag. The disparity in
performance is likely presenting the same opportunity for value that existed in the late 1990’s.
Capitalizing on opportunity requires thought, which can’t be done with software allocating $3.80 of every
dollar invested to Apple because that happens to be its weight in an index.
Active Shouldn’t Mean Activity: Common Threads Among the New Superinvestors
Passive investing is done with computers allocating capital based on component size in an index.
Attention is not paid to business quality, and a rising price attracts more capital. It can be a self-fulfilling
phenomenon, until flows reverse. Investing as we know it requires thought, experience, patience and
reason. Too much active investing is done poorly. As we tried to show above, while passive investing has
merit for some, when taken to excess can also create risk and ultimately produce incredibly poor results.
Compounding capital at good rates over the long-haul, and preserving it, is not easy. Whether an investor
is good is measured over a lifetime. Over the years, we have had the privilege to know some individuals
that we think are likely to continue achieving long-run success. I can assure you that upon our demise, our
families’ capital will not be managed passively.
Invincibility is a trait shared by the young. You don’t think about the proverbial bus when you are young
because you are the bus. As we’ve grown older, and hopefully wiser, you think a lot about happiness,
health and success. Life happens and you deal with health, and when those you love face adversity, you
realize that good health is a key to happiness. You also think about your own inevitability. We have been
asked a million times what would happen if we as stewards of capital were hit by the proverbial bus. The
short answer was always that we own businesses that don’t require daily attention. We own them with an
expectation of ownership over many years. When the bus comes, sure we have a list of successors to me
and Chad – but the message has been that you have time to figure it out because you own high-quality
businesses. When the question is reversed, upon reflection, we needed a solution for our own families’
capital. It’s the same list, but we really hadn’t spent time thinking much about the why, other than those
on the list are exceptional investors.
To answer the question about who should manage our families’ capital if Chad and I had a mistimed
encounter with the bus, we are very close with several individuals who have similar processes and look at
capital in a similar vein. We have been blessed to get to know contemporaries across our small corner of
the value world. They each understand that active investing shouldn’t mean activity. They understand

41
what matters in investing, and they live their lives in the footnotes of financial statements. I think we
could blindly look at a track record and know who built it. But it’s not the nuts and bolts that go into a
track record that matter. It’s the people behind the record. The light finally went on once real thought
went into identifying the commonality between these investors and friends.
It’s not why they own a certain company or even how high is too high a price to pay for an outstanding
business. The single common thread shared by the very best investors in our circle is a love of and
passion for business analysis. Ours is not a business but a profession, and the best live, breathe and eat it.
Understanding a business is like a solving a puzzle. They are curious. They are also deeply devoted to
their families and live moral and ethical lives. Knowing them is a privilege. In thinking about them
collectively, those who would be perfectly suited at managing our families’ capital if we couldn’t do it,
what they earned over the last one, three or five years is irrelevant. Each should outperform markets over
the very long haul, but that’s not what’s relevant either. It’s the threads regarding character and
philosophy that count, with character being by far the most important.
On Character:
Every outstanding investor we know is humble. The investment business teaches it, as does life. At the
same time, each is happy and successful.
An ability to admit and know when they are wrong. Investing provides plenty of mistakes to be made and
to learn from. Mistakes learned from lead to confidence. Confidence can only be earned through failure.
The best freely discuss mistakes and use them as lessons.
All have an insatiable desire to learn, and a high work ethic. Intellectual curiosity is hard wired.
It’s never a job and there is no time clock. Some snuck in annual reports on honeymoons (not advice for
you young guys who haven’t yet been initiated to the bliss of marriage). Some friends would lay on the
floor reading company filings by the tub as their toddlers bathed.
Many had a chip on their shoulder. Each wanted a better life and independence from worries about
money.
Perhaps it’s the nature of our small corner of the value world but everyone is extremely collegial and nice.
Willingness to teach and give back for the gifts of wisdom learned from others is a common thread.
Contrarianism. When it matters, not for the sake of it.
Extreme patience.
Independence of thought. This goes hand in hand with contrarianism. None are hindered by large group
think or decision by committee. Even in larger groups, the individual is allowed autonomy of process and
thought. In fact, some of the very best investors work together in partnership with like-minded peers and
as a group are collectively outstanding.
On Philosophy:
All possess a core belief that a disparity can exist between price and value. It’s the key concept of value
investing. Price matters greatly. The best are disciplined on both business quality and price. Growth is a

42
part of the value equation and the price paid for it matters. The investment process to each is consistent,
repeatable, easily understood and explained, and is a competitive advantage.
Risk is a permanent loss of capital. It’s not the volatility of price. Price volatility simply creates
opportunity at times when price and value are disparate. The best I know spend far more time worrying
and thinking about what can go wrong than modeling what will go right. Without a deep understanding of
the downside, even of the unfathomable, conviction and concentration can be dangerous to disastrous.
Each own concentrated stock portfolios in deeply understood businesses, with high conviction about the
business and its value. Without the appreciation of risk, however, these unique aspects of great investing
can become the Achilles heel of value investing. We see too many young bucks wanting to build a track
record in three years, swinging for the fences in only a few extremely concentrated ideas. Stewardship
isn’t on the radar. When the unanticipated comes along, and we’ve seen it with the young and
inexperienced as well as with the seasoned, big bets that weren’t well thought out or that misunderstood
risk that was there all along, can produce disaster. The best investors understand diversification but know
when it’s too much, and when it’s not enough. None are index huggers, it would be anathema to their
belief system. None are concerned about having investments across multiple or all sectors. But they all
appreciate risk.
Unconstrained. You don’t know where the next opportunity will come from, you have the capability to
research and understand it, and you have the mandate to invest in it. Those that are boxed into certain
segments invariably must invest in those segments, even if the entire segment is uninvestable from a
business quality or price standpoint. We know very good industry analysts that wouldn’t make for good
investors.
Not managing too much money. Many have stopped taking new assets or clients on. An ability to buy
smaller cap and mid-sized businesses in meaningful enough size when value exists in smaller names is
important to the best we know. One of the silliest things seen is the investor who must sell an outstanding
business that has grown too large for his “mandate.” Size is an anchor, but so is too little time. Knowing if
you are being pulled in too many directions is a common issue and the best understand and deal
accordingly with it. Time for reading and thinking is a necessity and the best guard it well.
Every outstanding investor we know lives in the footnotes. Deep research on individual companies is in
their DNA, and it’s a never-ending process. Business changes, risks that didn’t exist appear, sometimes
slowly and sometimes suddenly. At the same time, however, living in the footnotes isn’t done so deeply
that you get so bogged down in an irrelevant data point that you miss the Mack truck barreling full speed
right at you.
Patient temperament that results in low portfolio turnover. Active management shouldn’t require activity.
Until you own businesses whose share prices grow to three, five, ten times your original investment, you
don’t really have an appreciation for compounding. Time is the arbiter of value, and when you have
businesses that grow, and those that don’t, only then, over the passage of time, can you truly understand
the drivers of compounding. It’s all right there in a discounted cash flow formula, but until you live and
breathe it, I don’t think you can understand or appreciate it. Investors that buy and sell all the time,
thinking high levels of activity add value, don’t allow themselves to learn the nature of compounding. All
great investors we know have companies in their portfolios that have compounded for years.
Expanding on the last point, by owning businesses that have compounded for years, an appreciation for
growth and what growth is worth is a common characteristic. Mr. Munger talks about Mr. Buffett’s
evolution as an investor. We see it in the businesses our contemporaries have owned for years and
decades.

43
Cash is another anchor, and held too long drags returns downward. Holding cash for long periods of time
doesn’t help. We’ve never seen it help others. It certainly hasn’t helped us. Allowing cash to accumulate
briefly as part of the investment process can be necessary to the process. When it happens, it should be
during the rare times of very high market overvaluation. The opportunity cost of waiting around for years
for prices to fall is an expensive one, particularly when cash yields are far below available earnings
yields.
Aware of one’s circle of competence. This comes with the humility listed first that we see every day in
the best investors, and it also comes with having made mistakes by treading too far outside the circle.
Universally, mistakes aren’t brushed under the rug but they are studied and used as teaching tools or
reminders. The passion for the business and the amount of ongoing learning that goes on works to expand
the circle over time.
Act like business owners. No one thinks about stocks without thinking about owning the business first.
Investing is a profession, not so much a business. They don’t invest using different “strategies”. Investing
is not a strategy but a philosophy. Some do have multiple “products” and make it work, but the core
research process is the same. The very best don’t have teams covering myriad sectors or caps or regions.
The best groups are made up of generalists, and the investment philosophy is universally shared. There is
a sacrifice involved in investing well, and it often results in fewer assets managed. You can’t be all things
to all people and you can’t serve multiple masters, and they don’t.
Expectation of underperformance, even for many years. Intelligent allocation of capital takes time to
work. Good investors understand this, and don’t think in the same time intervals as many who allocate
capital to them for management. It’s an enigma of the investment world. Too often, when periods of
underperformance create doubt, both from within and from the outside, the temptation exists to change
from what is seemingly not working, not producing relative results, for what apparently is. Those who
understand why what they do works over time don’t change philosophy and do develop the ability to deal
with and address the doubts. It often requires the ability to communicate well.
Whether working individually or as a group, a culture of excellence and stewardship exists.
Compensation and ownership is structured logically and avoids any motivation to behave badly.
Much more could be added to these common threads of character and philosophy, only because we are
blessed to know some outstanding human beings. Life is easy when the people around you are
extraordinary. Whether in the investing arena or at home with family, life is a joy thanks to people that
make it that way. The motivation for discussing the commonalities among the great investors and friends
we have the privilege of sharing the arena with wasn’t to let you know we have the succession planning
box checked. We do, but that’s not it. We wanted to highlight the characteristics of active investors that
do it right and who understand risk deeply. With the capital allocation world pouring money into passive
strategies, there is going to be a reminder that risk is a four-letter world. The logic behind indexing makes
perfect sense, but its overuse today is likely going to harm a lot of people.
Don’t take the message the wrong way. They will take us out of here in a pine box, ideally sometime in
the next century. You shouldn’t be allowed to have as much fun as we do. Professionally, happiness
comes from spending all your time on what would be your hobby if you couldn’t do it every day. Mr.
Buffett talks about tap dancing to work. It’s true. But if the bus does happen to come, I know our families
are in great hands.

44
We discussed ownership of businesses that compound over many years being a common thread among
good investors. Let’s move back now into what is turning out to be a multi-year running commentary on
our largest investment, one we have owned for many years. We bought Berkshire Hathaway extremely
well in early 2000 for the first time and have opportunistically added to the position at favorable prices
over the years with cash and cash flows. At times, when price and concentration warranted, in cases we
have trimmed the position when necessary. While it has been in the portfolio for nearly two decades and
is a testament to compounding, the position is far from passively held. The good news is that, thanks to
the tax bill just passed and signed, the value of the company just got that much more valuable. The shares
remain substantially undervalued.
********

45
BERKSHIRE HATHAWAY: CHARMED BY THE TAX DEED AND OTHER RUMINATIONS
Berkshire remains by far our largest holding, and we believe the company is the single largest
beneficiary of December’s tax reform. The shares advanced 21.9% last year, again outpacing
underlying growth in our appraisal of intrinsic value, but not by much thanks to the tax change! We
estimate Berkshire will see a sustained $3 billion increase in its earning power from tax reform, an
increase of about 10% in normalized earning power. Adjustments we make to GAAP earnings yield an
additional $9.9 billion in economic earning power that you don’t see by simply relying on reported
financials. The shares were up 23.4% in 2016, bringing the two-year gain to 50.4%. Recall a 12.5%
decline was the impetus for our overview of the company in our 2015 year-end letter, Party Like its 1999.
Two years on, the shares have moved from severely undervalued to less so, though a sizable discount
remains, both absolute and absolutely relative to the market.
Having just concluded a section on the dangers of passive investing, I’d like to make a point about price
as it relates to Berkshire. Some say owning Berkshire is akin to owning an index fund. My reply to that
notion is that our experience owning Berkshire has been far different than that for many shareholders.
General Re shareholders were paid $80,882 per Berkshire A share in 1998. Through year-end 2017, they
have earned 3.7 times their money, 6.9% per year compounded annually (if they didn’t sell their new
Berkshire shares to chase technology). Semper bought its first shares shortly thereafter, in February 2000
at $43,744 per share. We have earned 6.8 times our money, 11.4% per year. The point is that price
matters. With shares acquired in subsequent years, purchases have been made at wide discounts to our
ongoing appraisal of intrinsic value, as was the case in 2000. Price brackets the endpoints in a
compounding series. With any asset we would own, there is a price we would pay and a price at which we
would sell. Indexing lacks that discipline.
2017 was a sleepy year at Berkshire, highlighted by:
• No major acquisitions. The company did announce an agreement to incrementally purchase a
majority stake in Pilot Flying J over a period of years – but no elephants. • The largest retroactive insurance policy written in National Indemnity’s history, this one with
AIG. • A swelling of the cash balance – now exceeding $100 billion. • First in 15-year underwriting losses across the insurance businesses - from the hurricane trio of
Harvey, Irma and Maria and a severe earthquake in Mexico (offset by higher dividends and
interest on investments). • Modest strengthening in the wholly-owned railroad, BNSF, as well as in a handful of
underperforming industrial businesses. • A post-year appointment of Greg Abel and Ajit Jain to oversee the non-insurance and the
insurance operations, respectively, as well as to Board seats, signaling the unsurprising
management succession plan.
• A major change in the statutory US corporate tax rate from 35% to 21%, plus several other
meaningful business tax revisions, which combine to improve the moving parts within Berkshire
in several ways.
• A temporary removal of the dual yardsticks of intrinsic value from the Chairman’s letter in the
2016 annual report, perhaps a token nod to a persnickety analyst’s call for color enhancement.
46
The reception to our recent year-end letters has been great. Huge thanks to everyone who has reached out
with comments and questions. Thanks again to Joe Koster who convinced me to post the letters, and
others from years’ past, to our website. Joe has sent our letter for the last two years via his outstanding
Value Investing World daily blog. Writing-up Berkshire and how we look at it was always on the to-do
list. Having done so two years ago, and again with a more modest follow-up last year, presents a
quandary about whether to continue with follow-ups. While Berkshire remains our largest holding,
writing about the company every year is unlikely to add much insight. Thanks to its diversified assets and
streams of income, the company grows as smoothly, like an aircraft carrier turns, as any business we
know. The tax change for US centric, capital intensive corporations is a big deal, and for Berkshire
warrants enough change to include an update again in this year’s letter. We may skip discussing Berkshire
in future letters or may simply update some of the valuation tables in the appendix. This year compels a
few words.
Tax Code Mini-Primer
The Tax Bill Formerly Known as…
Congress passed a tax overhaul bill, signed into law on December 22, 2017. Passage confirms the latter
certainty in Benjamin Franklin’s famous observation, “In this world, nothing can be certain, except death
and taxes.” The bill was originally known as the Tax Cuts and Jobs Act, but in final form, the 503-page
(plus 600 of explanatory conference notes) legislation passed as, “An Act to Provide for Reconciliation
Pursuant to Titles II and V of the Concurrent Resolution on the Budget for Fiscal Year 2018.” We the
people are instructed its passage simplifies the tax code…
A mystery remains whether the tax cut lowered our personal taxes, raised our taxes, or was neutral.
Sometimes in Washington, a cut isn’t so much a decrease but less of an increase. Regardless, in the
business world of IRS Subchapter C corporations, the tax cut is indeed a cut. Though for some it will be
an increase! Simplification, right?
The heart of tax reform affecting Berkshire and other US businesses are:
• The maximum corporate rate falls from 35% to 21%, which is the lowest since 1939. The US
rate had been the highest in the developed world, and the change moves the rate more
competitively in line with our global trading partners. Many large US headquartered businesses
already pay below the headline rate. Berkshire is no exception, paying a far lower rate on pre-
tax income for many years.
• Interest expense deductibility is limited to 30% of EBITDA, which reverts to EBIT after four
years. This limitation will impact many firms. Berkshire’s interest burden is so low that the
limitation will have no effect, however. Regulated utilities, which employ large amounts of
leverage, are exempted from the limitation.
• Because interest is tax deductible for corporations, the tax rate reduction raises the after-tax cost
of debt, including at Berkshire.
• To stimulate the economy by encouraging investments in capital spending, depreciable assets
(excluding structures) can be expensed in one year instead of being amortized over many years.
This is accelerated depreciation on steroids. The equipment must have been purchased after
September 27, 2017 and by December 31, 2022 (with an additional year for longer production
property and certain aircraft). The immediate 100% expensing is reduced by 20% annually
beginning in 2023 and is phased out entirely after 2026. Regulated public utilities are largely
excluded from this benefit.
47
• Corporate Alternative Minimum Tax (AMT) is eliminated, which had been in force if a firm’s
rate were pushed below that threshold by tax credits. Under the AMT, firms couldn’t deduct
R&D or investments in low-income neighborhoods.
• Requires taxation on and encourages (deems) repatriation of more than $2.5 trillion in
undistributed, non-previously-taxed foreign earnings held by “US shareholders” of “specified
foreign corporations”. The tax is charged at a one-time rate of 15.5% on cash and 8% on
equipment. The tax payments can be spread over eight years, at 8% in the first five years, 15%
in year six, 20% in year 7 and 25% in the final installment.
• Retains tax credits for wind energy and electric vehicles. BH Energy utilizes large wind credits.
• Lesser known are tax cuts on beer, wine and liquor, which won’t affect the tee totaling
Chairman at Berkshire or similarly abstaining half of partners at Semper. The other more fun
half, however…
The questions to consider when analyzing any business or industry affected by tax changes:
▪ How permanent or likely to future revision, upward or downward, is the cut?
▪ If not permanent, when and by how much will it change?
▪ How much of the tax cut is sticky, to be retained on an ongoing basis?
▪ How much will get competed away over time? Will we see a rise in hand-shake agreements made
in smoke-filled back rooms?
▪ How much will get regulated away?
▪ How will new-found profit (read new-found capital) be “invested”?
▪ Will capital spending rise from low historical levels? There are incentives for capital spending
with the immediate 100% expensing treatment through 2022, phasing out through 2026.
▪ How much cash held overseas will come back and how will it be “invested”? There are incentives
to bring cash held overseas back to the US, particularly now that it will be taxed regardless of
whether it stays abroad.
▪ How will limitations on interest deductibility impact highly leveraged enterprises?
▪ How much will the increased after-tax cost of debt capital (coupled with interest rates rising for
now at least) impact the use of debt versus equity in the overleveraged capital structures of many
businesses?
It remains to be seen how much of the lower maximum tax rate will translate into increased profit and for
how long. Most large companies, particularly those doing business abroad and those receiving tax credits,
already pay at a lower effective rate. The question as to how long the lower rate will stay in place must be
considered. Will a change in the White House and Congress come with a higher rate in three, five, seven
or more years? Most importantly, too often overlooked is to what degree a lower tax burden gets
competed away.
Lowering the effective tax rate for business from 35% to 21% implies an immediate increase in after-tax
earnings of 21.5%. $100 in pre-tax earnings, taxed at 35% becomes $65 in profit. The same $100 taxed at
only 21% yields $79 in profit. The $14 in additional earnings are 21.5% greater than $65. When thinking
about which companies benefit, this would be the best-case increase in profit. Reality for most businesses
is lower, and in some cases far lower. The aggregate of the S&P 500 is taxed closer to an effective rate of
27%.
If the lowering of the rate to 21% stands to change soon, three years from now at the earliest, the
discounted savings on current tax loses its value from future years at an altered higher rate. The corporate
rate doesn’t change often, however. The 35% rate has been in effect since 1986, when it was lowered
from 50% during the second Reagan administration. Earlier cuts under Reagan in personal tax rates,

48
coupled with tax incentives for capital spending, were extremely accretive to the economy and to federal
tax receipts. If we have now entered an era of successive administrations quickly undoing what was done
in the previous, it’s hard to assign certainty to reform being long-lasting. However, that we are now more
on par with tax rates among our global trading partners, lends credence to the argument that we can
somewhat rely on the new rate having legs.
The most damning case against the new low rate not having as much impact as anticipated rests on the
laws of economics. Capitalism begins with capital, and capital invested is done so to provide a return, of
it and on it. We have long argued that corporate taxes are largely a pass-through to the end consumer.
New-found profit created with no new capital invested will find its way to your competitor as well. For
how long will the players in an industry reap the reward of lower taxes and who will be the first to blink
and lower prices. In some industries, a deflationary price adjustment will be nearly instantaneous. Some
are less “efficient”. We’ll soon find out. Perhaps this is instead a salve for all the businesses that don’t
earn their cost of capital. We have said for years that most don’t.
If the tax changes allow for a permanent or long-term increase in profitability and return on capital, the
question as to how well the new-found profits (capital) are invested is the same question asked of how
well retained earnings are invested and capital allocated.
Capital allocation is one of the most important tasks charged to CEO’s and CFO’s, and too many don’t do
it well. A handful of capital levers are at the disposal of managements. All require an understanding of the
intrinsic value of business, theirs and others. A firm grip on how to measure return on invested capital is
essential. Among the options at the disposal of management for capital allocation are:
• Capital spending in the business – Capex and R&D
• Pay / increase dividends or reduce / suspend dividends
• Pay down debt or take on new/additional debt, including shifting terms
• Make acquisitions using company stock, with cash, with debt, or with a combination
• Repurchase shares in the open market
• Issue shares / new capital
• Increase wages
• Increase executive compensation (favored by many – though they don’t highlight it)
Numerous businesses have indicated their intent to use the new profit to return capital to shareholders
through dividends and share repurchases. I’m going to stop myself from a diatribe on share repurchases at
high prices (Too Late!). At too high a price, they destroy capital. Others have indicated an intent to
increase capital spending, which now greatly tax advantaged makes sense if the economics of expected
return make sense. We’ll see on that. Even others have indicated a willingness to increase wages.
Typically, it’s the executives’ wages that are at the fore of executive thinking so we’ll see on that as well.
The entire outcome is hard to predict but we’ll see how much benefit is sustainably derived and to what
extent new capital is intelligently allocated. It will also be interesting to see how our long-held belief
holds up – that capitalism begins with capital and thus, to what degree corporate taxes are indeed a pass-
through.
49
The Impact of the Tax Bill at Berkshire
Berkshire Hathaway is the largest beneficiary of the December tax code change, but not for the reasons
presented in the financial press. The well-publicized impact is a reduction of deferred tax liabilities that
Berkshire carries to reflect future taxes due on unrealized capital gains in its investment portfolio. This
doesn’t matter. Book value will be revised upward indeed, but only partly by revising the tax rate applied
on unrealized gains in the portfolio. To the degree book value is revised upward, Berkshire will also
report a huge offsetting, one-time, non-cash addition to reported earnings for its fourth quarter and year-
end 2017. This doesn’t matter either. What really matters is that the earning power of the business
rises by more than $3 billion. Growth in new free cash profitability largely matches the upward
revision in book value. This is of great importance as the return on equity of the business, which we
normalize at a sustainable 10%, remains intact.
There are three summary aspects of the tax changes on Berkshire:
First, even before the tax change, Berkshire was already massively tax advantaged. The amount of taxes
the company pays, not as reported but as cash, has averaged 20.3% per year for the past 15 years, far
below the 35% corporate rate and even slightly below the new 21% maximum federal rate. Berkshire’s
cash tax rate was as low as 11.7% in 2014 and was 12.8% for the first nine months of 2017. In their
energy segment, for example, the company already pays no cash taxes, despite reporting a GAAP tax
expense. The segment is deferring more than it owes in tax. At the railroad, BNSF defers about half of its
reported taxes. With the tax change, across all of Berkshire, both the reported taxes and the cash taxes that
Berkshire pays will be driven lower.
Second, a large 11.4% upward revaluation of book value by $35 billion, which exceeds an amount
reported in the financial press by $8 billion, comes only in part from devaluation of deferred tax liability
for taxes on unrealized gains on investments. Much more of upward revision to book value is derived
from revising deferred tax liabilities on property, plant and equipment; deferred charges for reinsurance
assumed; goodwill and intangibles; and “other” tax liabilities. Deferred tax assets will simultaneously be
revalued downward as well, mostly for deferred taxes on various accrued liabilities and insurance unpaid
losses and unpaid premiums. The revision to deferred tax assets results in a decrease in book value and an
offsetting, one-time non-cash loss. Our calculation is on the net balance, which is a liability.
Combining the adjustment for the deferred tax liabilities and assets, a one-time, $35 billion increase in
book value and what will be announced as a huge equal and offsetting one-time $35 billion non-cash net
profit, are mostly immaterial to us. Our ongoing analysis always assumed that most of the deferred
liability would either never be paid or would be paid so far into future years that most of it could already
be considered equity. Only a portion of the revaluation comes from the unrealized gain portion of the
stock portfolio, which has received nearly all the media attention regarding Berkshire and the tax change.
More of the revaluation stems from a deferred tax liability created by Berkshire’s massive capital
spending on property, plant and equipment in its railroad and energy operations (see appendix C for a
capital spending and deferred tax liability progression from 2004 to September 30, 2017).
Third, and the most important aspect of the tax change, is an increase of more than $3 billion in the after-
tax earning power of Berkshire. Prior to the tax code changes, we had assumed Berkshire’s normalized
after-tax earning power at $30 billion. The addition of as much as an additional $3 billion in annual profit
adds more than $50 billion to our appraisal of the intrinsic value of the business. In other words, with one
stroke of a pen, Berkshire’s value on an earning power basis increased by upwards of 10%. The
associated cash tax rate may be driven down to the single digits in some years, far below the new headline
21% corporate rate. If the company can retain most of the benefit, then the immediate gain in intrinsic
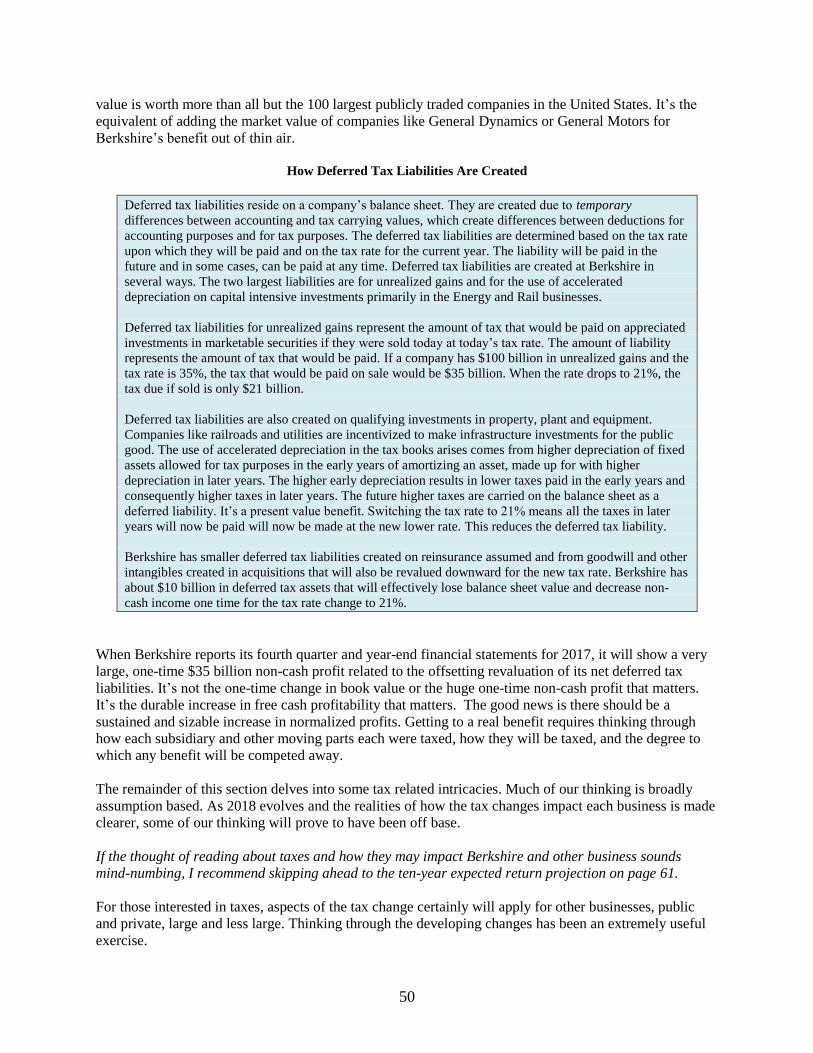
50
value is worth more than all but the 100 largest publicly traded companies in the United States. It’s the
equivalent of adding the market value of companies like General Dynamics or General Motors for
Berkshire’s benefit out of thin air.
How Deferred Tax Liabilities Are Created
Deferred tax liabilities reside on a company’s balance sheet. They are created due to temporary
differences between accounting and tax carrying values, which create differences between deductions for
accounting purposes and for tax purposes. The deferred tax liabilities are determined based on the tax rate
upon which they will be paid and on the tax rate for the current year. The liability will be paid in the
future and in some cases, can be paid at any time. Deferred tax liabilities are created at Berkshire in
several ways. The two largest liabilities are for unrealized gains and for the use of accelerated
depreciation on capital intensive investments primarily in the Energy and Rail businesses.
Deferred tax liabilities for unrealized gains represent the amount of tax that would be paid on appreciated
investments in marketable securities if they were sold today at today’s tax rate. The amount of liability
represents the amount of tax that would be paid. If a company has $100 billion in unrealized gains and the
tax rate is 35%, the tax that would be paid on sale would be $35 billion. When the rate drops to 21%, the
tax due if sold is only $21 billion.
Deferred tax liabilities are also created on qualifying investments in property, plant and equipment.
Companies like railroads and utilities are incentivized to make infrastructure investments for the public
good. The use of accelerated depreciation in the tax books arises comes from higher depreciation of fixed
assets allowed for tax purposes in the early years of amortizing an asset, made up for with higher
depreciation in later years. The higher early depreciation results in lower taxes paid in the early years and
consequently higher taxes in later years. The future higher taxes are carried on the balance sheet as a
deferred liability. It’s a present value benefit. Switching the tax rate to 21% means all the taxes in later
years will now be paid will now be made at the new lower rate. This reduces the deferred tax liability.
Berkshire has smaller deferred tax liabilities created on reinsurance assumed and from goodwill and other
intangibles created in acquisitions that will also be revalued downward for the new tax rate. Berkshire has
about $10 billion in deferred tax assets that will effectively lose balance sheet value and decrease non-
cash income one time for the tax rate change to 21%.
When Berkshire reports its fourth quarter and year-end financial statements for 2017, it will show a very
large, one-time $35 billion non-cash profit related to the offsetting revaluation of its net deferred tax
liabilities. It’s not the one-time change in book value or the huge one-time non-cash profit that matters.
It’s the durable increase in free cash profitability that matters. The good news is there should be a
sustained and sizable increase in normalized profits. Getting to a real benefit requires thinking through
how each subsidiary and other moving parts each were taxed, how they will be taxed, and the degree to
which any benefit will be competed away.
The remainder of this section delves into some tax related intricacies. Much of our thinking is broadly
assumption based. As 2018 evolves and the realities of how the tax changes impact each business is made
clearer, some of our thinking will prove to have been off base.
If the thought of reading about taxes and how they may impact Berkshire and other business sounds
mind-numbing, I recommend skipping ahead to the ten-year expected return projection on page 61.
For those interested in taxes, aspects of the tax change certainly will apply for other businesses, public
and private, large and less large. Thinking through the developing changes has been an extremely useful
exercise.

51
The change in the maximum federal rate to 21% caused a buzz in the financial media regarding Berkshire.
It was widely reported that deferred taxes created on unrealized appreciation in Berkshire’s holdings in
common stocks would now be lower. Most articles in the media attributed an expected $27 billion gain
(calculated by a sell-side insurance analyst), in Berkshire’s book value to its unrealized stock market
gains now being taxed on a deferred basis at a 14% lower rate. However, the immediate impact on book
value from simply the unrealized appreciation being deferred at a lower rate is only part of the picture.
The total increase in book value will be larger than $27 billion.
Berkshire’s stock portfolio gained about 7.4%, or $13.1 billion during the fourth quarter to $190.8 billion
(which includes the market value of its investment in Kraft Heinz that is being carried at cost on the
balance sheet using the equity method). The portfolio will likely have about $104 billion in unrealized
gains at year-end 2017. At the old 35% tax rate, the deferred tax liability is $36.4 billion. At the new 21%
rate, the deferred tax liability is $21.8 billion, a reduction of $14.6 billion.
The book value gain doesn’t end there, though. Berkshire’s deferred tax liability is only partially created
by taxes due on unrealized appreciation. More is on the books due to deferred tax liabilities being created
using accelerated depreciation for the tax books in the rail and energy businesses, as well as from deferred
charges for reinsurance assumed, created from goodwill and other intangibles in acquisitions, and
ascribed to every analyst’s favorite category, “other”. They also have deferred tax assets ($9.8 billion at
year-end 2016) that will effectively lose balance sheet value due to the tax change.
All in, the net deferred tax liability at September 30 on the balance sheet was $86.6 billion. It would likely
be over $91 billion at year-end 2017, using the old 35% tax rate. The liability from the stock portfolio
gains would only be $36.4 billion of that. Thus, an additional $54.6 billion (the balance of the deferred tax
net liabilities), would be offset by the lower rate. Assuming the entire net liability was created using a
35% tax and will now be calculated using a 21% tax rate, the entire net liability will be reduced by 40%.
The entire revaluation of the deferred tax liability serves decrease the deferred tax liability by $35 billion
and correspondingly increase book value by the same $35 billion. So that everything ties out, net income
in the fourth quarter will also include the same $35 billion in non-cash net income (from a decrease in
income tax expense), an amount equal to the revision to book value and the deferred tax liability. The
downward revision in the deferred tax liability is treated as profit, albeit one-time and not taxable. Thus,
book value up; deferred tax net liability down; profit up. All three revisions are non-cash.
Combining the $35 billion deferred tax revaluation with the gain in the stock portfolio and with
fourth quarter operating income, Berkshire’s book value stands to grow by perhaps $52 billion in
the fourth quarter. Book value was $308 billion at September 30, and we’re looking for a 16.9%
increase to $360 billion at year-end.

52
Cash Taxes
Berkshire’s reported tax rate steadily declined from between 32% and 33% in the mid-2000’s to about
27% recently, with its current (cash) tax rate well below that. Both are significantly below the 35%
maximum headline rate. As a conglomerate, taxes are generally calculated at the subsidiary level, but are
the responsibility of the parent. As an example, BNSF notes in its annual filings that their tax expense and
liabilities are computed on a stand-alone basis, with substantially all of its current (emphasis added)
federal income taxes payable remitted to Berkshire each quarter. We’ll look closer at the tax impact on
Berkshire’s groups shortly. Here is a reconciliation between Berkshire’s headline GAAP tax rate and how
much they actually paid on a current (cash) basis each year back to 2003, the year MidAmerican Energy
was acquired:
For 14 ¾ years, Berkshire’s cumulative GAAP taxes were at a headline tax rate of 30.1%. The GAAP tax
rate generally falls below the federal maximum rate for several reasons. Dividends received from its
ownership in common stocks are taxed between 10.5% (30% of the 35% rate) and 14% (40% of the 35%
rate): dividends from investees when using the equity method, like Kraft Heinz, are taxed at 7% (20% of
the 35% rate); wind production credits in the utility businesses (Berkshire is the largest producer of wind
energy in the US), and foreign income being taxed at lower rates abroad. But the amount of cash that
Berkshire pays falls even farther below the already lower GAAP rate.
You can see that of that amount in taxes due in the cumulative column, only 67.6% of the total due were
paid as cash, with the balance deferred. The company’s cash tax rate averaged only 20.3% over the
period, and has been much lower in recent years.
We discussed two years ago (in the 2015 year-end letter) how the use of accelerated depreciation in the
energy and rail businesses were pushing the cash tax rate downward and increasing the amount of
deferred tax liabilities. We won’t repeat that discussion, but the tax code change is going to affect some of
the moving parts.
Let’s roll through a brief overview of each main business segment and compare their current tax burden
with any prospective changes. We isolated tax treatment of the operating groups and investment
securities. If Berkshire’s operating companies retain all the benefit from lower tax rates, normalized
income looks like it could be more than $4 billion higher per year under the new code. We think the lower
53
tax rates will be stickier in some businesses but will be quickly competed or regulated away in others. We
estimate the company will see a more than $3 billion durable increase in annual earning power.
Capitalizing Berkshire’s normalized earning power at 18 times adds more than $54 billion immediately to
intrinsic value.
Operating Segments
Berkshire Hathaway Energy – No Break, But None Needed
BHE had a headline tax rate of 14.5% in 2016, having been as low as 9.4% in 2013 and as high as 22.7%
in 2014. For the first nine months of 2017 its tax rate was 22.3%. Though not highly publicized, we
presume BHE has not paid cash taxes in years because of the deferral of income taxes and the
amortization of tax credits. They also are taxed at a much lower UK tax rate on their operations there.
BHE has large investments in alternative energy, $19 billion in total through the end of 2016, with wind
being the preponderance. The business is awarded tax credits based on production amounts which drive
the aggregate tax rate of its utilities and energy assets well below 35%. The wind credits available were
retained in the tax bill, but may lose some value due to the lower tax rate. Berkshire’s cash tax rate is
already negative, however, far below the headline rates due to its use of accelerated depreciation on
qualifying investments.
To illustrate, let’s look at 2016. The combined businesses within BHE spent $5.1 billion in capital
spending during the year and had depreciation and amortization expense of $2.6 billion. Income tax
expense totaled $403 million but the net deferred tax liability on the balance sheet grew by $1.2 billion to
$13.9 billion. BHE had a federal tax benefit during the year of $743 million and deferred tax of $1.1
billion!
Tax reform will affect the reporting at BHE’s individual subsidiaries, but may not be much of a benefit
when compared to other Berkshire operating units. Lowering the tax rate to 21% will be accretive to
BHE’s book value as already discussed. The business will also likely report a one-time addition to income
to reflect the lower rate applied to the net deferred tax liability. The lowering of deferred tax liabilities,
now carried net of the new lower tax rate, will likely see the benefit of future tax reduction passed to
customers using a required “normalization” treatment that matches the remaining asset life with the newer
lower tax rate. In other words, the tax cut won’t likely involve an immediate rate cut for customers but
over time. Offsetting any tax benefit is an immediate higher after-tax cost of the debt used to financing
the business. Interest expense is deductible for corporations, and the lower tax rate raises the cost of debt.
BHE has about $38.5 billion in debt outstanding with coupons averaging 4.75%. The after-tax cost of
debt here rises from 3.09% to 3.75% assuming full deductibility as the tax rate falls from 35% to 21%.
Berkshire and BHE had benefitted from the use of accelerated depreciation on property, plant and
equipment for tax purposes in the early years of amortization by use of a higher expense offsetting current
taxes at the higher former 35% gross rate. As assets depreciate, future taxes in the out years would have
been more expensive, but are now only being taxed at the new lower tax rate. Passing this through to
customers with the normalization mechanism allows for some of the benefit of the cut to be retained, but
not entirely.
The tax bill provides for an allowance of capital spending on depreciable assets (excluding structures) to
be expensed in one year instead of amortized over many. This will apply on any of BHE’s capital
spending on independent (unregulated) investments between now and year-end 2022. Most capital
spending is within the regulated utilities, however, and won’t qualify. [That said, we suppose any new
non-qualifying capital expenditures (for immediate expensing), will continue to utilize accelerated

54
depreciation schedules, but now around the lower 21% rate.] The upfront benefit is less, but the tax rate
over the life of the asset is cumulatively lower. With Berkshire’s cash tax position already negative, we
should see a build in deferred tax assets from use of wind credits. Deferred tax liabilities will build more
slowly as a byproduct of accelerated depreciation on new qualifying investments using the lower current
tax rate over the life of an asset.
Capitalism being what it is, it is extremely likely that rate setting bodies in each state will be very quick to
compel any new after-tax source of profit, absent new investment, to be passed to the customers. We have
seen several “consumer advocates” already demanding that any tax benefit be passed to utility customers.
The result may be lower utility revenues and a lower price per kilowatt hour for household and business
customers. Alternatively, some negotiations with rate-setting bodies may result in an increased allowance
on capital spending, particularly in non-qualifying infrastructure projects that may fall under the 100%
expensing rule. There are a lot of moving parts within BHE, but at the end of the day we don’t think
profits and returns on invested capital will change much, at least without a commensurate change in
capital invested.
Burlington Northern Santa Fe – The Big Break
BNSF and its large railroad competitors will likely be major beneficiaries of the tax code changes. BNSF
had a GAAP tax rate of 37.3% for the last three years. The rate exceeds 35% because of state taxes.
However, the current (cash) tax rate is far lower (due to the use of accelerated depreciation on
investments in property, plant and equipment), ranging from only 53.1% in 2016 to 59.1% in 2014. On a
cash basis, the cash paid tax rate has ranged from 19.8% to 22.0%. BNSF may reap much of the benefit of
the tax changes. It is possible that they will not pay cash taxes for the next two or three years, with the
cash paid rate stair-stepping up after 2022.
The decline in the federal rate to 21% impacts BNSF in several ways. Like BHE, they will likely include
a fourth quarter 2017 non-cash reduction in income tax expense, a one-time non-cash bump in reported
earnings, resulting primarily from the reduction in its net deferred tax liability applying the decline in the
federal rate from 35% to 21%. On an ongoing basis, the GAAP statutory rate will probably be 23% or so,
higher than 21% to reflect state taxes. On a cash tax basis, the rate will be closer to 15% or 16% over
time, reflecting the lower rate and what is likely to be allowed immediate 100% expensing of qualifying
capital expenditures. In the first years of the 100% expensing tax policy, the tax savings may result in
zero cash taxes being paid. Ongoing immediate expensing for growth and maintenance capital
expenditures through year-end 2022 is a huge benefit. Beginning 2023 we presume accelerated
depreciation will again be incrementally utilized for tax purposes on qualifying capital expenditures at the
21% rate as the 100% expensing phases out (assuming no future legislative change to the rate…).
BNSF’s use of accelerated depreciation created a deferred tax liability using a 35% tax rate. The benefit
of accelerated depreciation comes from higher depreciation of fixed assets for tax purposes in the early
years of amortizing the asset, made up for with lower depreciation in later years for tax purposes. The
higher early depreciation results in less taxes paid early. The taxes will be caught up eventually, and the
future higher taxes are carried on the balance sheet as a deferred liability. It’s a present value benefit.
Switching the tax rate to 21% means all the future taxes to be paid will now be made at the new lower
rate. Unlike BHE, which doesn’t benefit because of the normalization recapture, BNSF really benefits
from future higher depreciation being taxed around the new 21% rate.
Offsetting the tax benefits, the railroad uses $22.5 billion in debt, with an average interest rate of 4.8%
and maturities ranging from 2018 to 2097 (yep, 80 years from now). The after-tax cost of debt rises from
roughly 3.12% to 3.79%.
55
All in, the free cash impact at the railroad will produce an additional $600 million in free cash annually,
an ongoing annual improvement of about 8% at today’s run rate in normalized profitability. It’s not the
full 21.5% bump that a business would reap seeing taxes fall from 35% to 21%, but it’s real money. If the
tax cut is permanent and remains in place for many years, and if the higher industry profitability isn’t
competed away, the additional free cash raises our intrinsic value estimate of BNSF by up to $11 billion.
The real question is how likely is the tax cut to be competed away by rail competitors or prices forced
down by customer pressure? Our impression is that the current climate is friendlier than in decades’ past.
We wouldn’t use the heavy term collusive, but oligopolistically cooperative may be fitting. Regulation
allows reasonable returns on capital and allows the marketplace to set pricing. Despite a weak, though
improving, climate for rails in the past couple years, returns on capital have been exceptional over the
past decade. Trucking generally has a difficult time competing for many load types. At present, the
trucking industry is dealing with a very tight supply of trucks, which is pushing rates upward
dramatically. The tightness should dissipate.
Our bet is that some of the tax benefit to BNSF and the rails will be competed away through customer
pressure. Many manufacturers and other shipping clients are likely to face their own customer (and
supplier) pressures. I don’t think a determination as to how much benefit the rail industry retains can be
clear. A reasonable guess would be most over the first couple years, followed by an erosion of half to
two-thirds of the total over the following five or so years. A recession may accelerate that timetable.
I’d like to make a sidebar comment on BNSF as a subsidiary of Berkshire. We had erroneously long-
assumed that the railroad had retained most or all profits since Berkshire closed the acquisition in early
2010. It turns out that the railroad has been paying substantial dividends upstream to its Berkshire parent
every year. Mentioned above is BNSF’s payment to Berkshire of all cash taxes due, which are offset my
modest tax refunds from Berkshire back down to BNSF. But net of these have been substantial dividends
paid to the parent totaling $25.2 billion out of $26.9 billion in reported cumulative net income from the
2010 acquisition through September 30, 2017. To put the dividends in perspective, Berkshire paid $33.1
billion for the railroad, $22.5 billion in cash and $10.6 billion in undervalued Berkshire shares. In
dividends paid upstream to the parent, Berkshire has already recouped 78% of its purchase price, and
owns 100% of the railroad with a book value that will rise from $36.4 billion to $44.6 billion at year-end.
Book value had been largely unchanged since the acquisition – it was $35.5 billion in 2010. The railroad
earns about 12% on equity. Our appraisal of BNSF ranges between $85 billion and $95 billion. At the low
end of the range, Berkshire has earned $78 billion on its $33 billion investment. To think we initially
thought Berkshire had overpaid…
Manufacturing, Service and Retail Businesses – Can’t We Just All Get Along
The immediate tax impact on Berkshire’s extremely diversified MSR businesses should be fairly
straightforward. The group’s average headline tax rate was about 34% for the last several years. The
consolidated rate would deviate from the 35% federal rate upward for state taxes and downward for the
15% of group revenues and greater than 15% of pre-tax profits generated outside the US in lower tax
countries. Within the segments, the manufacturing businesses do more business abroad and are taxed
between 31% and 32%. Service and retailing businesses are more US-centric and have paid in the 37%
range on average.
A reasonable guess would place the MSR consolidated group’s 2018 tax rate and beyond perhaps at 23%
to reflect the new 21% US rate close to international rates and adding a couple points for state taxes. The
group also had $12 billion in deferred tax liabilities on the books at year-end 2016. We should see a rough
$4.8 billion increase in the book value of the group and a one-time non-cash income included for the
fourth quarter 2017 as the liability is revalued for the new tax rate.
56
The MSR businesses should generate $126.3 billion in revenues and $8.9 billion in pre-tax income for the
2017 year just ended. Taxed at a consolidated 33.7% for the year, net income should come in at $5.9
billion. Had our assumed 23% consolidated group tax rate been in place for 2017, net income would be
close to $1 billion higher, nearly $6.9 billion, or 16% higher. The increase would improve the group profit
margin by the same 16% increase from 4.7% to 5.4%. Return on consolidated equity would also improve
by 16% to about 7.2%.
The math here, tedious to read I’m sure, hopefully illustrates that for any business being analyzed,
whatever is the percentage increase in profit margin will equal the increase in return on equity and return
on capital without any increase or decrease in capital invested.
Trying to figure out the long-run or even the intermediate impact of the tax change is only guesswork.
Berkshire’s many businesses in the MSR group are far more domestically oriented than the S&P 500’s
roughly 50%, for example. Thus, Berkshire’s businesses should reap a more immediate and larger benefit.
It will probably be the case that those businesses that are run among ruthless competition, and where the
competition measures profit as return on capital, see the most severe erosion of the tax benefit to
competition. Some businesses operate with very high returns on capital and have defensible positions and
pricing power. Luxury brands and well-established branded consumer staple and durable goods come to
mind.
A few examples may demonstrate the difficulty of estimating the tax impact on a portfolio of numerous
diversified businesses. If Boeing is pressured by its airline or military customers for concessions, those
concessions will work themselves in short order through the supply chain. A Precision Castparts would be
affected here. If Boeing, however, can convince those same airline and military customers that it is
investing in new capital spending and R&D that will benefit them, then the daisy chain effect may not
reverberate downward. Apparel and footwear businesses are likely to see their tax savings quickly
competed away given many competitors and thin returns. Duracell operates in an oligopoly. How rational
the oligopoly is in the US market will dictate the stickiness of the tax cut. Benjamin Moore distributes its
paints almost exclusively through a network of independent dealers. If Home Depot and the big boxes
choose to compete by driving their own tax savings through their cost of goods sold and push prices
drastically downward, must Benjamin Moore react? Most likely the answer is yes. Furniture retailers
operate in markets that are price sensitive. If manufacturers don’t demand concessions and competitors
maintain pricing, increased profitability can inure for the retailer’s benefit. We could continue working
through more of the businesses but you will soon see the answers are individually far from clear. The
state of competition and the focus on return on capital will dictate the pace at which tax cuts are passed
through.
We really have no concrete idea how much of the tax cut winds up being permanent. Unlike Berkshire’s
regulated utility businesses which will see little benefit, the MSR composite benefit is more dependent on
competition. If we assumed a 16% increase in immediate profitability, it’s probably reasonable to think
that a decade hence most of the cut will have been competed away by capitalism and return on capital
requirements. Perhaps five years out the MSR businesses are half, or 8% more profitable than they would
be without the December 2017 cut. For 2018, the benefit can yield close to an additional $1 billion in free
cash profits.
Finance and Financial Products – Rising Cap Ex, Bigly
Berkshire’s leasing, transportation equipment manufacturing, manufactured housing and finance
businesses were taxed between 32% and 34% collectively for the past few years. The businesses are
leveraged by about 2:1 excluding surplus capital. We anticipate the new consolidated tax rate will fall to

57
the new 21% rate, with additional state taxes offset by leases to foreign customers at roughly the same or
slightly lower rates now in effect in the US. The debt used in the capital structure, nearly all issued by
Berkshire Hathaway Finance Corporation (BHFC), bears interest at 2.8% and matures between 2018 and
2043. The after-tax interest cost becomes higher here, and will be offset by some dividends on equities
and interest earned on cash and fixed income taxed at lower rates. The businesses have about $4 billion in
common stock holdings, and are taxed on dividends at a rate that now declines from 10.5% to 6.3%.
The leasing businesses should benefit from an increase in demand for leased equipment in two ways.
First, the increase in bonus depreciation to what will now be 100% immediate expensing should increase
the demand for capital equipment. Second, because of interest deduction limitations to no more than 30%
of taxable income without regard to depreciation, lessees may claim a full deduction of rental payments.
This may be more advantageous than an outright leveraged purchase of the same equipment if the interest
pushes against the 30% limitation.
The change in tax rate alone, before considering any increase in demand that should transpire, adds about
$300 million to the group’s combined after-tax profits.
Insurance Underwriting – Regulation and Competition Benefit the Customer
Berkshire’s collection of insurance and reinsurance businesses are either tightly regulated on price or
operate in very competitive markets. Collectively the insurance group underwrites more than $52 billion
in premiums earned at today’s run rate, excluding premiums earned on long-tail retroactive policies. They
underwrote the largest retroactive policy in the industry’s history in 2017, an upfront premium of $10.2
billion from AIG. Our methodology for valuing Berkshire assumes a long-term, pre-tax underwriting
margin of 5%. Year-to-year results will fluctuate significantly from this level. The combined company
will suffer underwriting losses in 2017 due to the hurricanes, a Mexican earthquake and fires in
California. We had capitalized the underwriting segment of the insurance businesses at 10 times our
normalized pre-tax margin, which translated to a rough 15 times after-tax multiple assuming at a 35%
normal tax rate. The tax rate on underwriting gains for the past three years ranged from 35.7% to 36.7%.
The rate is higher for state taxes and offset for international business written, primarily in Berkshire’s
reinsurance businesses, Berkshire Hathaway Reinsurance Group and General Re. Underwriting should
initially benefit from the reduction in the maximum federal rate to 21%.
Over time, the admitted portion of business written, where rates charged for premiums are regulated and
set by insurance commissioners in each state (think GEICO), will likely be adjusted for the tax windfall.
Insurers are allowed reasonable profits on statutory equity. Like the utility businesses, much of the tax
benefit will be regulated away over time. This will be an interesting year. Given higher than normal loss
ratios, insurers would typically look to rate increases to replenish capital. With the tax cut, the response
by regulators may be to limit the amount of price increase or to hold premium rates flat for a time.
In non-admitted lines of business, where the marketplace sets rates, the dynamic of the tax cut may be
stickier. Reinsurance and Berkshire’s new primary business suffered relatively fewer losses from the
catastrophes in 2017 than the industry. They may pick up market share if prices firm, and the benefit of a
tax rate that should decline to the 22% to 23% range will boost underwriting profits.
If the entire cut in the tax rate were retained by the collective insurers, normalized underwriting profits
would be just over $300 million higher per year. The reality is that through regulation of admitted lines,
coupled with surplus capacity in the industry (which leads to ruthless and even excessive price
competition), it’s hard to believe that much of additional underwriting profits will be retained by the
industry in the absence of new capital. Berkshire’s insurers, on the other hand, who possess low-cost
positions in their respective segments of the industry and who underwrite with price discipline, will
58
continue to grow premiums and will benefit somewhat from the tax cut. We would thus capitalize pre-tax
underwriting profits at more than ten times, in concession to some tax benefit. An 11.9 multiple would
price in the full benefit. Settling on 11 times seems reasonable, implying a 10% sustainable increase in
normalized after-tax underwriting profits.
Realized Capital Gains – Objects in The Mirror Are Larger Than They Appear
Domestically, corporate capital gains are taxed at 35%. While Berkshire is generally averse to selling
investment positions and paying capital gains taxes, any future gains realized will now be taxed at 21%.
Often, realized gains are recognized but are non-cash. The company has proven adept at swapping
fundamentally challenged low-basis stock holdings for entire businesses and avoiding taxes in the
process. In recent years, Berkshire “sold” the following businesses with little cash tax impact:16.3% of
White Mountains Insurance in 2008 for two run-off insurance subsidiaries and $751 million in cash;
23.4% of Graham Holdings in 2014 (Washington Post with a 1973 cost basis) for a Miami ABC TV
affiliate plus $450 million in undervalued Berkshire shares and $328 million in cash; a $1.35 billion stake
in Phillips 66 in 2014 for a lubricants business; and most recently in 2016 a swap of a low-basis Proctor
& Gamble position (originally from Gillette) for Duracell and an injection of cash into Duracell pre-swap.
It’s a mouthful but demonstrated an aversion to paying capital gains taxes and an ability to part with
undesired positions with no tax consequences.
As mentioned earlier, the big boost in book value recognizing deferred taxes on unrealized gains doesn’t
matter. Our long-run assumption has been that the gains would rarely be recognized, and as such we
counted most of the deferred tax liability for unrealized gains as equity. Unless the company is more
likely to begin taking gains at the new 21%, the tax cut is somewhat moot here. The portion of increase in
book value was already effectively counted by us as adjusted equity. If Berkshire views the new tax rate
as low enough to sell overvalued or undesired holdings, then we may see taxable sales. Only one person
knows what will happen here.
Accumulated Undistributed Earnings on Foreign Subsidiaries – A Tax Cut?
Berkshire had a modest $12.4 billion accumulated undistributed earnings in foreign subsidiaries held
abroad at year-end 2016, and the company has stated its intent to leave it overseas for investment. The
balance likely grew by the amount of subsidiary profit earned in 2017. It looks like Berkshire will likely
owe tax at 15.5% on cash and 8% on equipment, whether they bring back the cash or not. Companies can
elect to pay the tax over an eight-year period. Presumably equipment will have been bought and the tax
will take place at the lower 8% rate. The total tax will be about $1 billion at the 8% rate (and as much as
$2 billion if cash), which will be charged at $125 million to $150 million per year initially.
Investment Income and Dividends – Big Savings That Won’t Be Competed Away
Most of Berkshire’s investments in stocks are held by their insurance companies, we estimate at $162
billion at year-end 2017. An additional $7 billion are held within the finance, rail and utilities, and at the
holding company level. Dividends of $3.6 billion of stocks at the insurers are taxed at 14% (40% of the
federal rate). We think the rate will drop to 8.4%, a tax savings of approximately $202 million.
Dividends on stocks held by the other subsidiaries and the holding company are taxed at 10.5% (30% of
the 35% federal rate). The tax rate there should drop to 6.3%.
Berkshire also owns 325.6 million shares of Kraft Heinz, a 26.7% ownership positon worth $25.3 billion
at year-end. The shares are held by the parent company, and because Berkshire owns more than 20% of
the company but less than 50% and is deemed to be in a position of control, accounts for its investment
59
using the “equity method” of accounting. From a tax standpoint, dividends are taxed by the holding
company at 7%, which is an 80% discount from the 35% corporate tax rate. The holding company’s tax
rate on dividends beginning in 2018 on its Kraft position should be taxed at 4.2%, which is the same 80%
discount from the new 21% rate. The current dividend paid by Kraft Heinz is $2.50 per share, $813
million pre-tax to Berkshire. Tax on the dividend will drop to $32 million from $57 million, a $25 million
benefit. Whether at Berkshire’s insistence or in concert with their 3G investment partner in Kraft Heinz,
the dividend represents nearly 70% of profits. Berkshire benefits greatly by earning profits as dividends as
opposed to through retained earnings and capital gain. If they are in a “position of control,” we’d expect
they are driving the payout ratio higher. We think the position will one day be sold. Perhaps they can take
a brand and some cash and avoid a realized taxable cash gain. It is a mediocre, domestic business with
little prospect for growth and unhealthy brands in decline.
Accounting for positions using the equity method requires that Berkshire’s pro-rata portion of Kraft
Heinz’s reported income to be included in Berkshire’s income and serves to increase Berkshire’s cost
basis by the amount of their pro-rata profit. Dividends received are an offset, effectively a return of
capital, and reduce Berkshire’s cost basis by the amount of the dividend. The combination increases the
cost basis by the amount of undistributed earnings. Cash taxes are paid by Berkshire only on the amount
received as dividends. The undistributed earnings (retained by Kraft Heinz) are included in a deferred tax
liability and are payable when Berkshire receives a cash distribution or they sell the position. The
deferred tax liability is created using Berkshire’s corporate tax rate (was 35%, now 21%). Berkshire
applies a Dividend Received Deduction “DRD” on the dividends it receives as it expects undistributed
earnings to ultimately be distributed. It’s this assumption by Berkshire that allows it to offset its 35% tax
rate (now 21%) with an 80% deduction. Thus a 7% tax rate on dividends from Kraft Heinz are now taxed
at 4.2% and the deferred tax liability building for retained earnings by Kraft Heinz is established using a
21% tax rate.
The use of equity method accounting is similar to the way we view undistributed earnings by Berkshire’s
common stock investees. We view the undistributed profits as ours and count them in normalized
earnings. GAAP accounting picks this up differently – though the creation of a deferred tax liability for
unrealized gains on the stock price. If stock prices grow in line with retained earnings, then our method
and GAAP will converge. GAAP is more volatile because it tracks stock prices quarterly and we track
retained earnings. My kids like to say, “TMI, Dad”. They are usually right. Let’s move on…
Berkshire owns about $21.4 billion in fixed income securities, almost all held by its insurance businesses.
Interest on US Treasury bonds and notes are taxed at Berkshire’s corporate rate. Investments in corporate
fixed income securities are also taxed at Berkshire’s corporate rate. Investments in municipal securities
generally aren’t taxed federally. Investments in foreign governments are taxed locally and we assume are
owned by Berkshire’s foreign insurance subsidiaries. Any federal taxes charged at 35% on interest will
now be taxed at 21%. Total interest income is about $1 billion pretax.
Cash held by Berkshire across its segments and at the holding company totaled $109.3 billion at
September 30. US T-bills were about 60% of the total. As recently as 18 months ago, cash yielded close
to nothing. Now, cash yields average about 1.5%, producing over $1.6 billion in interest. Now taxed at
21%, the differential saves $224 million in tax that would have been due at 35%. We assign an optionality
premium to most of the cash, which presumes balances north of one-year’s typical losses in the insurance
businesses will be invested at decent returns. But this is for a discussion on valuation.
Retained Earnings of Common Stock Investees – Big Source of “Hidden Value” Improving Modestly
Berkshire’s receives $3.6 billion in dividends on its investments in common stocks, mostly held by their
insurance companies. But those investees retain more of their net income, about $5.5 billion, that

60
compounds at whatever rate of return on capital the investees collectively earn. The $5.5 billion figure has
already been taxed by the publicly traded corporations that Berkshire owns shares in. Each business will
see its effective tax rate decline. The group of investees collectively were taxed at a mid-to-high 20%
effective rate, and will all benefit somewhat from the decline in the US rate to 21%. Some will benefit
more than others. Those doing substantial business overseas were already paying taxes at lower
international rates. As a group the impact is not huge. Banks are taxed at low rates already. Coca-Cola
does over half of its business abroad. Apple’s international revenues are approaching 70%. American
Express stands to be a large beneficiary of reform and retains almost 80% of its profit. As each pay lower
taxes and are benefitted from the different aspects of tax reform (immediate expensing on capital
spending), Berkshire’s retained earnings may improve by 5% to 6%, around $300 million on an
annualized basis.
Summarizing the Moving Tax Parts
A sustainable increase of more than $3 billion in the after-tax earning power of Berkshire adds at least
$50 billion to our appraisal of intrinsic value. Over time, an immediate benefit larger than $3 billion is
likely to shrink as the imperative of return on capital drives returns downward across industries. Even if
half of the maximum benefit disappears over the next decade, which we think is likely, the immediate tax
savings add as much as 10% to the present value of the company. If all the tax benefit as we measure it is
permanently retained, Berkshire’s value would be increased by far more than 10%. The cash tax rate may
be driven down to the single digits in some years, allowing a preponderance of pre-tax income to fall to
Berkshire’s bottom line. The immediate gain from tax reform alone adds the value of the 100th largest
publicly traded companies in the United States to Berkshire’s intrinsic value.
********

61
Berkshire Hathaway: Ten-Year Expected Return
Berkshire’s 21.9% stock market gain in 2017 was closely matched by its gain in intrinsic value thanks to
operating gains combined with new earning power created by tax reform. Therefore, despite the stock
gaining more than twice what we would expect in an average year, the 10-year expected return is barely
changed from a year ago.
Here is last year’s expected return projection. The projected year-end intrinsic value of $544.5 billion for
2017 assumed the stock trades at 18 times our then-expected 2017 normalized earnings of $30.25 billion.
The one-year projection in market cap isn’t a forecast but illustrates the gain to our appraisal of intrinsic
value. To the right were ten-year projections with Berkshire earning 8% annually on equity in the first
case and with an average 10% ROE in the second case. We showed the stock at a range of terminal
multiples to earnings, with our normalized case of 18 times shaded in light green. If Berkshire were to
average 10% in equity for ten years, an investor would have earned 12.4% per year with the stock trading
at 18 times earnings in 2026.
Now here is the updated table with final stock price gain, market cap and estimated income, plus P/E and
earnings yield, all in light green. The red column shows a projection for 2018 normalized net income, plus
market cap and P/E were the stock to trade at intrinsic value on the last day of 2018. This is not a forecast
but here to illustrate the accretion to intrinsic value plus 10% growth over the next year from today’s
stock price. To the right are tables with updated ten-year projections, illustrating Berkshire earning an
average of 8% on equity and our assumed 10% on equity.
Our normalized intrinsic value estimate falls at 18 times our calculation of normalized earnings. The 18
multiple approximates the combination of our intrinsic value estimates derived from our handful of
valuation methodologies.
13x 15x 18x 20x 13x 15x 18x 20x
$754b $870b $1044b $1160b $930b $1073b $1287b $1430b
$58b $58b $58b $58b $71.5b $71.5b $71.5b $71.5b
13x 15x 18x 20x 13x 15x 18x 20x
7.7% 6.7% 5.60% 5.0% 7.7% 6.7% 5.60% 5.0%
87% 117% 160% 189% 132% 167% 221% 256%
6.7% 8.1% 10.0% 11.2% 8.8% 10.3% 12.4% 13.6%
10-Year:20268%ROEandgrowth 10-Year:202610%ROEandgrowth

62
Berkshire’s 21.9% stock price gain in 2017 only slightly exceeded our estimate of the gain in intrinsic
value for the year. Hence, our ten-year projected returns are not much different today than they were a
year ago. In the 8% and 10% ROE tables on the right, we shade our intrinsic value figures with the stock
at 18 times earnings in green. The stock will return 10.2% per year if ROE averages 8%, and will return
12.2% if ROE averages 10%. With the stock today trading at 14.8 times our estimate of normalized
earnings, if the multiple remains unchanged a decade from now, you will earn the ROE. If ROE averages
8%, you will earn 8% absent any multiple expansion or contraction. If ROE averages 10%, you will earn
10%. You can see roughly this scenario under the 15x earnings columns in each table. An investor should
be thinking in these terms.
Using the inferior range of assumptions, with Berkshire earning only 8% on equity on average for the
next decade instead of our 10% projection, if the multiple to earnings contracts from 14.8x to 13x, you
will earn a respectable 6.6% per year.
Earlier in the letter we tried to show the degree of overvaluation in the S&P 500. We would wager annual
returns for the index over the next decade fall somewhere in the low single digit range. At some point,
they may well be negative. We think under most scenarios, Berkshire’s stock outperforms the S&P 500
by a wide margin for the next ten years. A 3% to 5% annual index return from today’s elevated level is a
realistic assumption for the market. Berkshire may double or triple that. A quad even lurks in the cards.
Double, double…
********

63
Berkshire Hathaway Intrinsic Value Update
We estimate that Berkshire’s 2017 increase in intrinsic value exceeded $100 billion, and the company is
now worth more than $600 billion. The nearly 20% gain in intrinsic value is double what we would
expect from a typical year.
Reported earnings are going to be a mess when Berkshire’s 2017 financial statements are released at the
end of the month. Tax reform creates several large, non-cash adjustments. Some have economic benefit
and some have cost. Lost in the shuffle is the degree to which reported GAAP earnings, even when
ignoring this year’s one time revaluations, materially understate Berkshire’s economic earning power.
We adjust ongoing GAAP figures upward by nearly $10 billion on an annualized basis. These
adjustments, some positive and some negative, lead to over $170 billion in intrinsic value that you
wouldn’t recognize when using reported results.
2017 will go down as a quiet but important year in the ongoing history of Berkshire Hathaway. When the
company releases its annual report at the end of February, book value is likely to have increased about
27% for the year, 16.9% in the fourth quarter alone. Drivers for the gain in book value are the retention of
the year’s operating profits, a sizable gain in the common stock portfolio, and a large revaluation of the
subsidiary’s deferred tax liability to reflect the change in Berkshire’s federal tax rate from 35% to 21%
(the deferred tax net liability revaluation takes place in 2017 because the taxes to be paid in the future,
called deferred, will be taxed later, at the new, lower rate – the liability changes today).
Much of 2017 profit and change in book value can be dismissed as one-time and non-cash. Missed by
many will be an increase in Berkshire’s core earning power that will also rise substantially thanks to tax
reform. Our estimate of increased earning power from changes in the tax code, over $3 billion per year,
matches the magnitude of the revision in book value when it comes to properly measuring profitability.
By our methods for measuring earning power and intrinsic value, we conclude that intrinsic value at
Berkshire grew by almost 20% for the year, approximating the 21.9% gain in the stock price. While the
gain in intrinsic value was below the likely increase in GAAP book value, it was more than double the
gain that we would expect in a typical year. The tax code revision can be thanked for much of that.
This section summarizes our methodologies for valuing Berkshire. Updated tables are again included in
the appendix. Data in the tables include our expectations for year-end 2017 financial information. Most of
the moving parts at the company are affected by the tax code reform, and some of our assumptions
regarding the change’s impact will prove to be high or low, and even in cases wrong. Some subsidiaries
will benefit more than others. Some perhaps not at all.
We use several approaches to valuing Berkshire, all of which are used to reconcile to each other. With
any investment, you are buying the discounted free cash that an asset produces from today throughout its
lifetime. Estimating future profits in the case of any business is difficult. With the diversity of businesses
owned under Berkshire’s umbrella, forecasting its future should be difficult. Rather, because of its myriad
earnings streams across a wide array of industries, the quality of its assets, its limited use of leverage, the
high quality of management, an ethical approach and an increasing investment in predictable, and in
many cases regulated industries, we assign a high degree of confidence in our estimate of Berkshire’s
earning power.
Our process at Semper focuses on two variables – the quality of the businesses we own and the quantity
of earnings they produce. The price we pay for those earnings impacts future investment returns. Earning
power is central to each of the methods we employ in valuing Berkshire. Our Sum of the Parts approach
and our GAAP Adjusted Financials approach are our preferred methodologies, both relying on measuring

64
earning power. We use a price-to-book value approach and a return on equity analysis as reconciliation
tools to complement the earning power estimates.
2017 Year-End Intrinsic Value by Methodology
Below is a summary of our current intrinsic value appraisal for Berkshire using our four primary
methodologies. We first show 2016 final figures (with year-earlier estimates in parenthesis) to illustrate
how dramatically intrinsic value grew in 2017. Supporting data and tables can be found in Appendix A
and Appendix B.
2016 Intrinsic Value by Market Cap and Per Share
Market Capitalization Price Per A Share Price Per B Share
Sum of the Parts Basis $532 billion (520) * $323,837 $216
GAAP Adjusted Financials 514 billion (514) 312,709 208
Simple Price to GAAP Book Value 495 billion (487) 301,189 201
Two-Pronged Approach (Ours) 517 billion (508) 314,555 210
Simple Average 515 billion (507) 313,071 209 * Numbers in parenthesis were estimates prior to release of year-end financial statements
2017 Intrinsic Value by Market Cap and Per Share
Market Capitalization Price Per A Share Price Per B Share
Sum of the Parts Basis $630 billion $383,049 $255
GAAP Adjusted Financials 595 billion 361,768 241
Simple Price to GAAP Book Value 630 billion 383,049 255
Two-Pronged Approach (Ours) 610 billion 370,895 247
Simple Average 616 billion 374,690 250
The average gain in 2017 intrinsic value across all four methodologies is a stunning $101 billion, or
19.7%. Approximately half of the increase comes from the ordinary progression of Berkshire earning a
normalized 10% return on equity and retaining all its profit. The balance of the gain comes from
capitalizing the $3 billion in new after-tax income created by tax reform.
Today’s intrinsic value, an average $616 billion using an average of methods, implies 25.9% upside to
value from year-end $489 billion market capitalization. The shares remain considerably undervalued at
79% of our appraisal of intrinsic value.

65
Sum of the Parts
Our sum of the parts methodology values Berkshire between $630 billion and $660 billion. We use the
low estimate in a range for valuation. Below are appraisals for each businesses unit:
Sum of the Parts Valuation (dollars in billions)
Operating Groups
Berkshire Hathaway Energy $47 - 52
BNSF 85 - 95
Manufacturing, Service and Retail 130 - 140
Finance and Financial Products 33 - 38
Operating Group Subtotal $295 - 325
Insurance Underwriting Norm Capitalized Value 30
Operating Group Plus Insurance Underwriting $325 - 355
Investments
Insurance Investments 288
Insurance Investments Valuation Premium/Discount (16)
Holding Company Investments (Net) 33
Investments (Insurance and HoldCo) Total * $305
TOTAL VALUATION $630 - 660 *Excludes Investments and Cash in Operating Groups
The valuation incorporates tools used in adjusting GAAP financials. We measure pre-tax income and
after-tax income and assess whether operating groups are under-earning or over-earning cyclically or
otherwise. BNSF is presently still somewhat depressed.
You can see in the table that we also assign a discount to the value of Berkshire’s insurance investments,
which are now overvalued in our opinion. We typically allow latitude to year-to-year investment price
changes, and only when a material disparity exists do we adjust upward or downward. The last time we
made a major downward adjustment to Berkshire’s stock portfolio was in the late 1990’s and in early
2000 (we first invested in Berkshire in February 2000, despite the discount on the stock portfolio, at an
average of $43,744 per A share). We marked up the portfolio in late 2008 and early 2009 as being
undervalued. Today, the insurance stock portfolios total an estimated $162 billion. Including stocks held
by other segments and Kraft Heinz, which is held by the holding company, the stock portfolio should total
$191 billion. Stocks constitute a smaller portion of the aggregate value of Berkshire than at any time since
the 1969-1970 bear market shortly after Berkshire acquired National Indemnity in 1967. Stocks total
about 31% of our estimate of the entire value of the business and 27% of total firm assets.
Here are profitability estimates for the operating groups, as well as our calculation for normalized
underwriting profit. We also include estimates for the earnings and income being produced by the
investment portfolios. More specific detail can be seen in the appendix. Note the two rightmost columns.
We are presenting after-tax income for GAAP adjusted financials both as they would appear in 2017
before the tax change and as though the tax change had been in effect for the year. We made the
calculation using line item tax assumptions for each group or investment asset to illustrate the normalized
increase in earning power on an apples-to-apples basis:

66
Net Income Basis – 2017 Year-End Estimated – Prior and Post Tax Code Revision (dollars in billions)
Pre-Tax
Income
Before Tax ∆
Net Income
After Tax ∆
Net Income
Operating Groups
Berkshire Hathaway Energy $3.1 $3.1 $3.1
BNSF 6.3 4.6 5.2
Manufacturing, Service and Retail 8.9 5.9 6.9
Finance and Financial Products 2.5 1.7 2.0
Operating Group Subtotal 20.8 15.3 17.2
Insurance Underwriting Normalized Gain 2.6 1.7 2.1
Operating Group Plus Insurance Underwriting 23.4 17.0 19.3
Investments
Investment Income (Insurance and HoldCo) 14.4 13.4 13.8
Totals $37.8 $30.4 $33.1
Cash Tax Rate 19.6% 12.4%
The number that should jump off the page is the increase in profitability to $33.1 billion from $30.4
billion. The cash tax rate is assumed to be driven down to 12.4% from 19.6%. Berkshire pays nowhere
near the federal tax rate in current (cash) taxes. The situation gets even better for the next few years, as
immediate expensing of capital spending will be allowed for tax purposes in all domestic investments,
except in Berkshire’s regulated utilities. The regulated utilities don’t need much of a tax push. Through
tax credits and the use of accelerated depreciation (which created deferred tax liabilities), we don’t think
they have paid cash taxes for years.
We noted elsewhere that Berkshire’s reported GAAP earnings for the fourth quarter and year 2017 will
be huge will be largely meaningless. Each operating group will report a downward revision to deferred
tax liabilities, increase in equity, and an offsetting one-time non-cash reduction in tax expense (increase in
profit). We exclude these one-off accounting adjustments, and properly make our assessment of ongoing
tax benefit or cost individually to each group. Realized gains on investments are also ignored.
Price to Book Methodology
Book value understates intrinsic value at Berkshire by a wide margin. Many assets are carried at historic
cost far below replacement or economic value. The stock portfolio is carried with an offsetting deferred
tax liability that may only be paid years from now, if ever. The insurance companies carry liabilities for
policy losses that on an economic basis are replaced with new premium dollars every year. In effect, the
deferred losses will be paid, but on a cash flow basis, the loss liabilities grow with new policies written.
Our 2015 year-end letter discussed more in depth the use of book value as a valuation proxy.
Given what will be a huge increase in fourth quarter book value, much from the revaluation of
Berkshire’s deferred tax liabilities, the question is whether the economic return on reported equity will be
diminished due to a now larger equity balance. The answer to this question, we think, is no. Berkshire’s
increasing profitability, helped prospectively via a lower tax burden, will be great enough to maintain
roughly the same 10% return on equity that we had assumed prior to tax reform. In fact, for a few years,
as capital spending is expensed immediately for taxes, the cash tax rate stands to be even lower. This
benefit is progressively reduced and the cash tax rate will move higher over time, closer to the new
federal 21% rate (which was about what the cash tax rate averaged for the past fifteen years). To the
extent more investment is made abroad, US rates are more now in line with an industrialized world

67
average. Core profitability remains intact at Berkshire, and a price to book measure retains its viability as
a reconciling tool to our more earnings driven methodologies.
A 75% premium to book value is used as a reconciling proxy for intrinsic value. At 1.75 times book
value, Berkshire’s value is $630 billion, $383,049 per A share and $255 per B. But the stock was
beginning to appear more fully valued. Using the September 30, 2017 book value of $308 billion, the
stock traded at 1.59 times book value. The upward revision coming for the fourth quarter changes that. On
the expected upward revision, which again includes not only upward adjustment for taxes but also
operating and stock market gains in the investment portfolio, book climbs to our estimate of $360 billion.
The stock at year-end winds up at only 1.36 to book value.
Book Value and Share Repurchases
Most know that Berkshire may repurchase shares at 1.2 times book value or below. Using the updated and
revised year-end book value, the 1.2 times threshold is only 11.7% below the year-end closing price.
Looked at another way, if return on equity continues at 10%, and if the stock is simply flat for the
foreseeable future, book value climbs enough by the first quarter of 2019 to reach the magic share
repurchase target.
The question is, does Berkshire modify its repurchase floor to book value for the upward revision due to
tax change? Probably not should be the answer. Regardless of what you think about the merits of limiting
purchases to no higher than 120% of GAAP book value, the increase in Berkshire’s current earning power
is enough to offset the higher reported book value. In other words, whatever the company was earning on
equity before, they should continue to do so, assuming they can sustain enough of the tax benefit. Our
analysis backs off what would be full tax benefit due to the likelihood of competition and regulation
muting the impact in areas. Our estimate of $3 billion in increased profitability is only about 60% of what
would be a full benefit at headline tax rates (full reduction from 35% to 21%). Berkshire is already greatly
tax benefitted relative to the old maximum federal rate and we do assume some of the benefit will
disappear. Some corporate taxes will prove to be a pass through, as we have long maintained.
As to the logic, merit, or lack thereof, of limiting repurchases to 120% of book value, we believe that
above that price Berkshire feels it has ample uses for cash to yield higher returns. If the company earns
10% on equity, then buying shares at a 20% premium to book becomes an 8.3% adjusted return. A
purchase above the threshold yields less than 8.3% and a purchase below yields more. It should be as
simple as that. Oh, were the rest of corporate titans able to think about buybacks in this simple way…
Two-Pronged Approach
See the upcoming section: “Berkshire’s Dual Yardsticks of Intrinsic Value: “Removing” the Goalposts”
GAAP Adjusted Financials Approach
Analyzing the earning power of any business only begins with GAAP financials. Many companies and
complicit analysts abuse this notion by adjusting metrics such as EBITDA upward by suggesting
exclusion from expense many items that we would never ignore. But GAAP (or IFRS for international
businesses) accounting regularly fails to reflect cash based reality. In some businesses, GAAP earnings do
reflect economic reality. In others, profits can be badly overstated. In a typical year, Berkshire is the
opposite. Its GAAP reported profits often severely understate economic earning power. We make a series
of normalizing adjustments each year to try to capture what we estimate as economic profit. The
adjustments are elaborated on in detail in our year-end 2015 letter. Listed here is a summary of the
adjustments (among the adjustments we look for with any business).
68
Our approach removes realized gains and losses, including from derivative liabilities, from the GAAP
reported earnings number. To this we add approximately $9.9 billion at today’s run rate for the
modifications made to reflect economic earning power. The adjustment last year was $7.5 billion. The
methods for adjustment are updated and refined. The approach will:
• Add a $5.3 billion estimate for the retained earnings of Berkshire’s investees in common stocks.
These have already been taxed. We assume a further tax to reflect eventual capital gains taxes
due. Our method hypothetically taxed retained earnings at the rate that Berkshire’s subsidiaries
owning the stocks pay income taxes on dividends earned. The insurance companies and the
holding company pay taxes on dividends at different rates. A true sale would take place at
Berkshire’s federal rate. We now lower the already assumed low tax rate to reflect the
unlikelihood that Berkshire realizes gains, and if they were to, would only likely do so in the
distant future. The retained earnings are already taxed at the investee’s tax rate. Recognizing a
full tax liability to reflect liquidation value does not reflect reality at Berkshire, given their proven
history of generally not realizing capital gains, and will instead adeptly swap entire positions for
pieces of an investment in part to avoid paying cash taxes. The lower 21% federal rate may prove
an incentive to sell less fundamentally sound positions, but we remain skeptical and comfortable
in discounting any tax liability as an expense. The present value of any distant capital gains taxes
to be paid is very low. We assume an arbitrary 5% tax for 2017 and 3% for 2018 and beyond, in
both cases as a present value of 1/7th of Berkshire’s federal rate.
• Include a $1.4 billion upward adjustment for the creation of deferred taxes though capital
spending and the tax use of accelerated depreciation in the rail and energy businesses. Capital
spending across Berkshire, excluding its regulated utility businesses, will benefit under the new
tax code with 100% expensing in year-one for taxes, the benefit phased out after 2022 over the
subsequent five years. We will adjust accordingly here. There continues to be a material benefit
for the use of accelerated, now in some cases hyper-accelerated, depreciation and its impact on
cash taxes spent versus the GAAP calculation of taxes.
• Increase economic earnings by $900 million to reflect the amortization of some intangibles
created in acquisitions which do not economically decay. Berkshire’s Chairman recognizes this
reality each year in a non-GAAP presentation of the Manufacturing, Service and Retail
businesses. Unlike many public companies, Berkshire does not present a pro-forma or
supplemental set of financials excluding various expenses. The goodwill and intangibles footnote
makes clear the types and amounts of intangibles being amortized. The balance of intangibles
being amortized with no economic decay is now much larger. We had been adding back 80% of
the amortization charge for intangibles, which resulted in economic earnings being roughly $600
million higher after-tax than GAAP profits for 2010 to 2015. Gross intangibles are $41.5 billion
at September 30, 2017. Accumulated amortization is only $7.9 billion. Assets such as trademarks,
trade names and customer relationships generally lose little, if any, economic value over time.
Some companies instruct analysts to add back all amortization, which is often aggressive. Patents
on software or in medicine absolutely have finite economic lives and lose value over time.
• Reduce income by $400 million to reflect a method we have used for the nearly 20-year history
of Semper when analyzing the health of pension and OPEB plans. We have long assumed an
investment return of 4% per year for most companies’ defined benefit plans, unless asset mix or
overall valuation warrant. Berkshire assumes a more conservative than most 6.1% expected long-
term rate of return on plan assets (lowered from 6.7% in 2015 and 6.5% in 2016 – they are going
the right way…), on what now is about $15.3 billion in plan assets, and assume underfunding to
the Pension Benefit Obligation will be funded over 10 years. The pension liability was $17.8
billion at year-end 2016, making the plan underfunded by $2.4 billion. Ours is far from a GAAP
or actuarial treatment, and is a more aggressive treatment than required, but is a decent economic

69
approximation of cash to be used in the future to fund pension obligations beyond actuarial
assumptions. This is pretty much a rounding error at Berkshire. At businesses with materially
large defined plans relative to business size, most assume much higher and unrealistic return
assumptions. Maybe next year we’ll dig back into the work we do on pension math. We calculate
that defined benefit plans economically cost the 346 businesses in the S&P 500 that have them
about $10 per share, or $90 billion in earnings per year that never flows though the operating
income statement. How many big plans make a “one-time” extraordinary contribution to their
plan, often funded with debt (may be funded this year with repatriated offshore cash, net of tax),
and tell the investment community to ignore the expense as non-recurring? Reality would have
the business make larger regular contributions to account for their unlikely ability to earn the
expected return.
• Include a large $2.7 billion net of tax optionality premium to reflect higher investment earnings
for near-term and intermediate-term investments expected to be made with cash balances. We
currently assume $30 billion in cash balances will be held permanently in cash and not invested in
anything beyond US T-bills. Berkshire says it will keep $20 billion on hand. We use $30 billion
to approximate one-year’s average losses paid in the insurance businesses. We also exclude from
the optionality premium cash held within the MSR, Rail, Energy and Finance units. Our
calculation presumes $61 billion invested at an earnings yield of 7% (lower than we had used in
the past), and nets out the current 90-day T-bill yield. Taxes are applied based on the federal
maximum rate. If Berkshire purchases stocks, taxes on dividends would be lower. We could use a
lower rate to reflect an expected blend of investments to be made in common stocks or in wholly-
owned subsidiaries. We don’t however, as an offset to time, not knowing how quickly cash will
be invested.
• The previous five adjustments can be considered generally recurring in nature and the dollar
amounts won’t change much year to year. A critical final (or initial) adjustment to GAAP
earnings is to strip out realized gains and losses per period, including gains and losses on
derivative liabilities. These are non-recurring in nature and in some cases, are only taxable under
GAAP and not on the tax/cash books.
• Make a further adjustment reflecting the degree to which any businesses within Berkshire are
under or over-earning relative to normalized potential, and mark up or down the stock portfolio
for any material deviation from reasonable fair value. We are discounting the stock portfolio this
year for the first time since the late 1990’s and early 2000. We had included a valuation premium
in late 2008 and early 2009 to reflect an undervalued stock portfolio. We also estimate BNSF is
earning below what would be normalized earnings on lower than normal revenues. We didn’t
raise our income estimate for BNSF, however.
Totaling the revisions, Berkshire has an additional approximate $9.9 billion in “hidden” after-tax annual
economic earning power on a sustainable basis that doesn’t appear in the reported financials, after
stripping our realized gains and losses. We could add a further $700 million to after-tax earnings today to
reflect our belief that BNSF is still under earning, though less so than a year ago. There has been
considerable improvement at the railroad.

70
Berkshire’s Dual Yardsticks of Intrinsic Value: “Removing” the Goalposts
The final method used for estimating intrinsic value at Berkshire uses a framework first presented by
Berkshire in 1995. We have employed the method as part of our ongoing analysis since 1996 with
adjustments we think relevant to the way the figures are presented by Berkshire. We took issue with what
appeared to be a revised methodology two years ago accompanied by little explanation.
Never one to let a sleeping dog lie…
Background
The Chairman’s letter in the Berkshire Hathaway annual report customarily includes a brief section which
helps investors understand how management thinks about the intrinsic value of the company. Provided
are two numbers, a figure for per share investments in marketable securities and a second figure for pre-
tax earnings per share excluding all income from investments. With a general understanding of the
business, the two numbers combined have proven useful to a shorthand estimate of Berkshire’s intrinsic
value. (In addition to the yardsticks, Berkshire presents summary information in the Chairman’s letter for
its main business groupings. Those interested in understanding Berkshire owe a huge thank you to
management for summarizing the key moving parts of an otherwise extremely complex enterprise in such
an intelligent and logical presentation. We have never seen another business so interested in helping
shareholders understand the business and what it deems critical information to analysis. Most are
concerned with muddying the water with pro-forma adjustments that only paint their business in the best
light, which are usually shadows in a house of mirrors.)
The two yardsticks of intrinsic value were first presented in the 1995 annual report and appeared for the
following four years. The insurance underwriting climate changed in 1998 and 1999, distorting the
earnings per share figure, which we believe caused the yardsticks to be left out of the annual report for the
next five years, 2000 to 2004. They reappeared in the 2005 annual report, with a change in how they were
derived (“solving” the underwriting distortion), and remained a fixture in the Chairman’s letter each year
through the 2015 annual report. A longer discussion of the dual yardsticks was also included in the 2010
Chairman’s letter and reproduced subsequently in the appendix for the next five years as well.
Last year, both the dual yardstick figures in the Chairman’s letter and the appendix reprint went missing,
removed from the annual report entirely.
We presume that we are at least partly to blame for the disappearance. I hope we can at least eventually
take some credit when, not if, the yardsticks presumably reappear, with new color. To see them back in
this year’s Chairman’s letter would be terrific.
What happened? Both yardstick figures provided in the 2015 Chairman’s letter apparently changed
methodologies as to how each were calculated in the past. The method used in changing the calculation of
earnings per share figure was discussed (underwriting again), but there was no mention of any change in
the marketable securities method. Both figures were stated to have grown at respective rates over the prior
year, but when reconciling the growth rates to 2014’s figures as then presented, didn’t compute.
An absence of not only an elaboration on how the calculation of marketable securities per share was
altered, but of any disclosure whatsoever, compelled us to determine what had changed and why. With
some effort, reasoning through what had likely been altered was possible. Believing that the changes

71
would be made clearer with some discussion by Berkshire, I sent a letter to the Chairman, wound up
discussing the issue at length in an interview with Kate Welling, and laying out what likely had taken
place in our year-end letter last year, Sympathy for the Dog. Given all of that, we expected to see some
clarity in the presentation of the yardsticks in the 2016 annual report. Instead, we saw the yardsticks
removed.
To rehash the entire last two years of this issue would be beating a long-dead horse. If you want to dig
into the detail, both the Sympathy letter (http://www.semperaugustus.com/clientletter) and the interview
with Kate, Berkshire Believer, (http://www.semperaugustus.com/media-and-interviews) are on our
website. The lengthy discussion can be found in the “Moving the Goalposts” section and in Appendix D
of last year’s letter. Appendix D is reprinted at the back of this year’s report as well.
Our Idea of How the Yardsticks Should be Presented
The boiling-down of all the disparate moving parts within Berkshire into two simple numbers, one
representing the earnings of the business, the other representing the market value of the investments, is
entirely logical and useful. If we were the Yardsticks Overlord, these would be the rules:
Earnings Per Share
This figure has always been presented as pre-tax and excludes all income from marketable securities.
Within this number, we would:
• Exclude underwriting gains and losses from the calculation. We have always done so in our
methodology. Year-to-year underwriting results can be volatile, and in years when they are
deviant from what we view as a normal long-term underwriting margin can skew the results of
the rest of the non-insurance operating businesses and their profits. Berkshire included
underwriting profit from 1995 through 1999. This fact was mistakenly misstated in the 2015
annual report. Underwriting was so negative in 1998 and 1999 to cause the entire earnings figure
for the operating businesses to be a loss (back then, insurance was the preponderance of
Berkshire). The yardsticks then spent the next five years in the penalty box, omitted from the
annual report, the hockey equivalent of a major penalty. When they reappeared in 2000,
underwriting results were excluded from the calculation and stayed that way for fifteen years.
Berkshire’s calculation then included underwriting gains in 2015, as had been done from 1995 to
1999, on the heels of thirteen consecutive years of underwriting profit. Then, of course, the
yardsticks themselves were benched in 2016, as they were from 2000 to 2004. It will be
interesting to see if they make their reappearance this year, because the insurers will post an
underwriting loss for the year. It’s less material now because underwriting profit or loss are only
a fraction of the enormous earnings produced by the rest of the non-insurance businesses.
• We assume a separate long-term underwriting margin of 5% and capitalize that to arrive at a
value for the underwriting piece of the insurance businesses. You can assume zero or whatever
margin you like, or keep a running total of underwriting gains or losses. Either way, by stripping
out underwriting from the yardstick figure for earnings per share isolates the non-insurance
businesses and the volatility of underwriting from the annual calculation.
• Include interest earned on cash equivalents and US T-bills held in non-insurance subsidiaries. In
2015, it appeared that all cash was pulled into the marketable securities calculation from groups
where it hadn’t been included before. If cash is part of a non-insurance subsidiary’s working
capital and is used in the operation of the business, then any interest earned should be included in
operating earnings (and that portion of cash assets not included in the marketable securities
calculation). If cash is included in summary balance sheet detail (or with interest presented as
72
net), then the cash effectively should remain in the operating business and not included in
marketable securities. Cash is included as an asset in the group presentation of summary
information for the MSR businesses, the railroad and the energy businesses.
• Exclude realized gains and losses from investments included in the marketable securities
yardstick. These gains are not recurring and are not predictive of earning power. Further exclude
earnings from investments carried using the equity method of accounting (Kraft Heinz). Although
investee earnings are added to the income of the investor, they serve to reduce the carrying value
of an investment and taxes due are deferred as a liability. Gain, loss and income are “property” of
the investment securities yardstick.
Marketable Securities
Historically, Berkshire’s investments in marketable securities were nearly all owned by the insurance
companies. We long associated the value of the investments with the value of the insurance operations,
plus a value for capitalized underwriting. Now, the insurance companies as a group are significantly
overcapitalized and more investments than ever are held at the holding company level. Tax treatment in
some cases make ownership by the holding company more advantageous than by the insurers.
Investments are also held among the non-insurance subsidiaries.
For the yardstick calculation of the marketable securities per share figure, we would:
• Include all investments in marketable securities and cash held by the insurance companies, as has
always been the case.
• Include investments held by any non-insurance subsidiary that is surplus capital. As of year-end
2017 we estimate there are more than $7 billion in stocks held by the holding company, railroad,
energy businesses and by the holding company. Kraft Heinz, a $25.3 billion position at market, is
held at the holding company level. All would be included.
• Include any cash equivalents and T-bills from all non-insurance operations that is not used as
working capital in the operations of the business. We would identify how much cash is included
in the marketable securities figure but also appears in the summary financials in the Chairman’s
letter in the segment presentation.
• Disclose how much cash and investments in marketable securities, if any, are held by the non-
insurance subsidiaries and are excluded from the per share figure. The footnotes to Berkshire’s
quarterly and annual SEC filings make identification of where assets are held possible.
Reconciling their location to the marketable securities per share yardstick, however, has been a
chore, especially with groups of assets having been excluded at times and included at times with
no or little disclosure (worse when stated that assets were specifically excluded and then included
in later years with no notice).
• State how much of the change in the per share figure from year-to-year was the result of gain/loss
and income and how much was from net purchases/sales. The statement of cash flows identifies
net purchases and sales but with assets moving into or out of the yardstick figure, or when net
additions of cash occur, ascribing investment returns is guesswork.
Summary on Berkshire and Intrinsic Value
Tax reform that makes Berkshire perhaps its greatest beneficiary and ongoing growth in operations
combined in 2017 to drive book value and intrinsic value higher than would be expected in a single year.
Berkshire will see an incredible increase in its book value when the company reports its quarterly and
annual earnings this month. It will also report an incredible, but meaningless, one-time increase in non-

73
cash net income. The estimated gain in intrinsic value is the product of our work and understanding of the
company. The stock price should reflect intrinsic value over time. Despite the shares gaining 50% in the
last two years alone, they remain undervalued. Much of our analysis is based on assumptions that others
may not agree with and are open to debate. We are trying to get it “roughly right”, to borrow an
expression.
Berkshire’s “hidden” earning power that our GAAP adjustments reveal, almost $10 billion more than
GAAP net income, amounts to more than $170 billion in intrinsic value that an investor relying on
reported GAAP profits at face value wouldn’t recognize. With an additional $3 billion (or more) in new
net profitability created by tax reform late last year, another $50 billion is added to Berkshire’s value.
Combined, the hidden and new sources of earnings power combine to provide well over $200 billion in
intrinsic value that most investors won’t see by using GAAP income and using the tax code in place prior
to December 2017.
It is the greatest of good fortune for passive investors in the S&P 500 get to own Berkshire’s undervalued
shares. The stock is underweighted in the index because insiders own a big chunk and the index is “float
adjusted”. But the stock was only included in the index in 2010, after its purchase of BNSF and
Berkshire’s 50-for-1 stock split of the B shares. Did last year’s gain of 21.9% in Berkshire’s shares mirror
a like gain in intrinsic value? Or was the gain in the shares the result of increasing flows of money
funneling into a narrowing tier of stocks at the top of the index? Sometimes the “dumb money” is the
smart money. Sometimes it’s the lucky money. When the tide next goes out, how will Berkshire fare, now
that it has a place in the upper echelon of index darlings? Passive investing stands to deliver
underwhelming returns going forward. Shares in Berkshire, despite their inclusion near the top of the
index, stand to “beat the market” for many years.
********
SUMMARY
If you made it to this point without skipping ahead, thank you for the commitment. Diving back into
Berkshire Hathaway as perhaps the largest beneficiary of tax reform made sense as an update. The intent
was to brevity, but we have a problem with verbosity. Few derive pleasure from reading about taxes.
Those that do are members of a club comprised of the oddly-wired, weird really (like the sisters around
the cauldron). I hope we add to the understanding of Berkshire. We learn new things about the business
every year. The degree to which Berkshire benefits from tax reform will be revealed over the coming
quarters and years. The adjustments we make to GAAP earnings continue to grow as well, and although
the shares are up over 50% in the last two years alone, a sizable margin of safety remains. Combining tax
reform with ongoing growth in operations and in the securities portfolio, the gain in intrinsic value during
2017 was larger in dollar terms than any year in Berkshire’s history. Berkshire has been our largest
holding for years, and we remain extremely comfortable with the quality of the business. The discount to
intrinsic value makes our investment in Berkshire an extremely low-risk, high returning investment.
Extreme market valuation and the overdone trend toward passive investing combine to make the present
investment climate dangerous. Many are taking risk with capital that isn’t clear. A day of reckoning is
approaching. Intelligent active investment, done correctly, provides huge relative and absolute advantages
at times. Today is likely to be one of those times.
74
Our portfolio provides meaningful fundamental and valuation advantages. Business quality is as great as
it has ever been. We survey the roster of management teams leading our portfolio businesses and they are
simply outstanding. Very good capital allocators man the helm. Many are founders or have purchased
large ownership positions. They think like owners because they are owners. With our stocks trading at
13.7 times normalized earnings, our earnings yield is a full 3% higher than the S&P 500’s. Price to book
value, price to sales, price to cash flow are all far lower. Our businesses are nearly unleveraged, with a
collective 11.7% return on equity translating to an 11.6% return on invested net capital. Retained earnings
are invested at acceptable to great returns. Elsewhere, index valuations are extended and retained earnings
spent repurchasing overpriced shares are destroying capital.
The portfolio should generate favorable returns for many years, and the risk assumed is very low.
We don’t know what the witches at the Federal Reserve will do when the risk so seemingly apparent in
the capital markets are manifested. The elixir brewed as the market touched 666 fostered a double and
another double. If the Bard were chronicling the scene today, the play would likely be a tragedy.
Thanks to all of you for making the investment journey so enjoyable. The personal relationships
developed over the years are gratifying. We remain humbled by your confidence and accept the
responsibility bestowed on us with all the energy we have. As always, we welcome your comments and
feedback.
Christopher P. Bloomstran, CFA
Semper Augustus Investments Group LLC
231 South Bemiston Avenue
Suite 925
St. Louis MO 63105
Office: 314-726-0430
Past performance is no guarantee of future outcome. Information presented
herein was obtained from sources believed to be reliable, but accuracy,
completeness and opinions based on this information are not guaranteed. Under
no circumstances is this an offer or a solicitation to buy securities suggested
herein. The reader may judge the possibility and existence of bias on our part.
The information we believe was accurate as of the date of the writing. As of the
date of the writing a position may have been held in stocks specifically identified
in either client portfolios or investment manager accounts or both. Rule 204-3
under the Investment Advisers Act of 1940, commonly referred to as the
“brochure rule”, requires every SEC-registered investment adviser to offer to
deliver a brochure to existing clients, on an annual basis, without charge. If you
would like to receive a brochure please contact us at (303) 893-1214 or send an
email to [email protected].
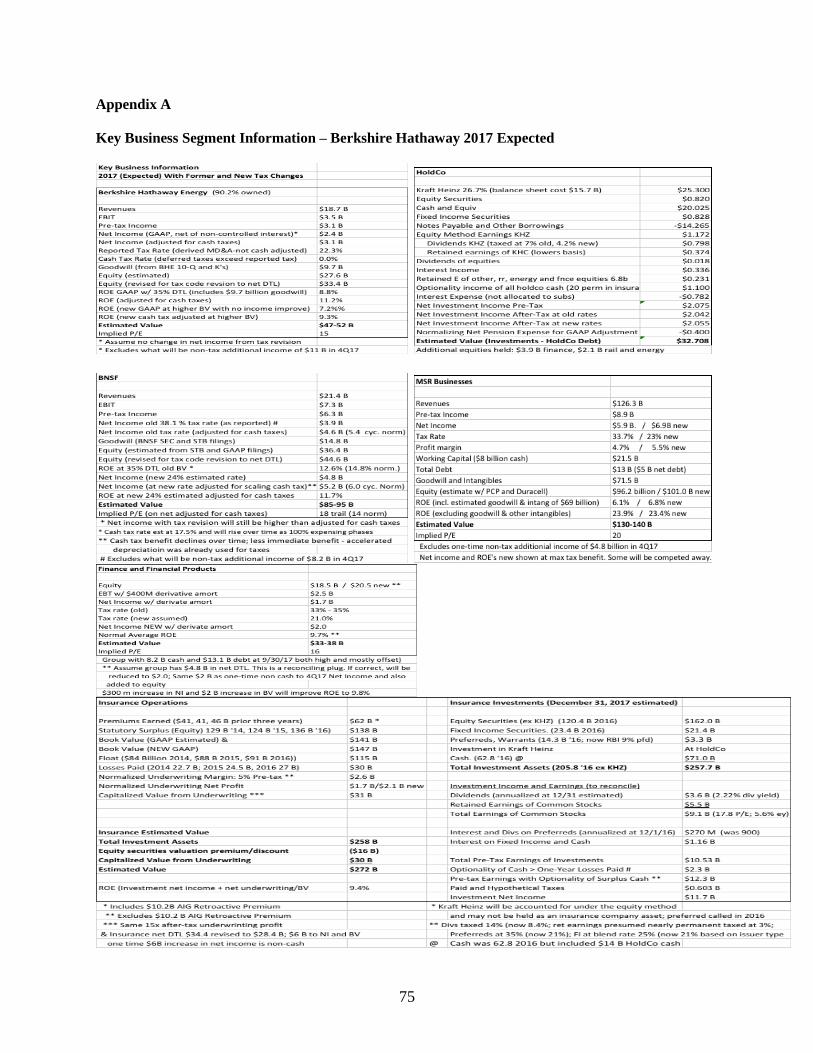
75
Appendix A
Key Business Segment Information – Berkshire Hathaway 2017 Expected
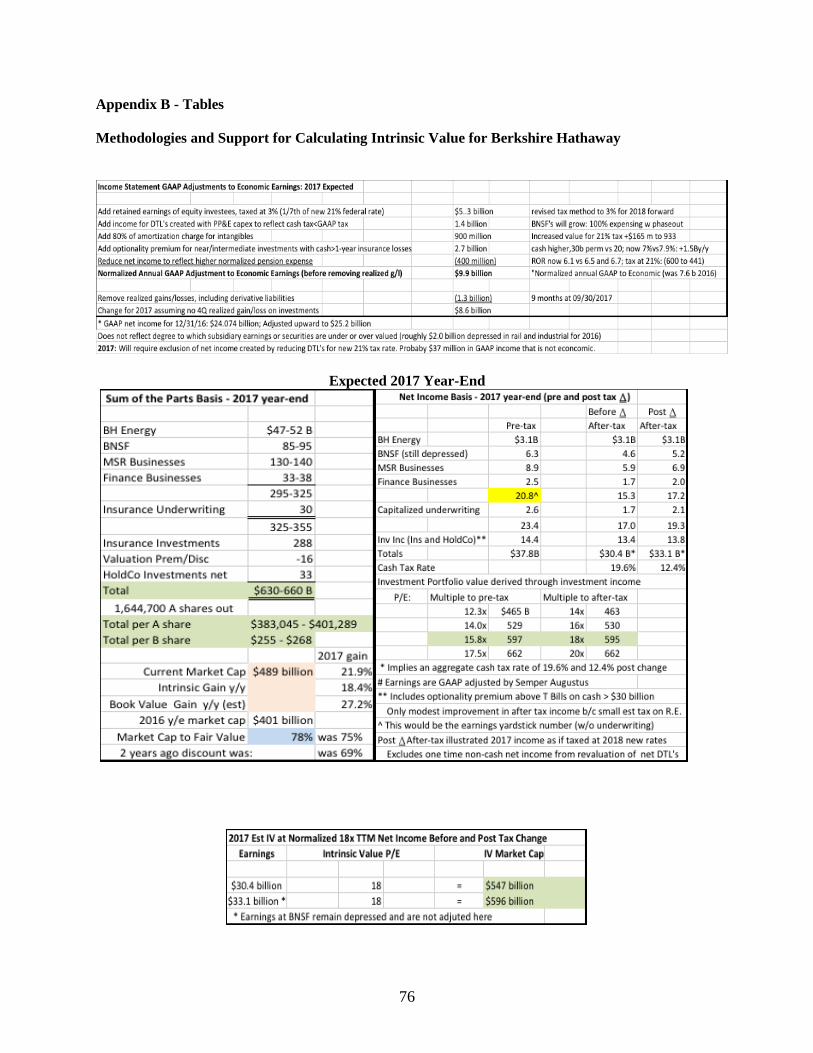
76
Appendix B - Tables
Methodologies and Support for Calculating Intrinsic Value for Berkshire Hathaway
Expected 2017 Year-End

77
Two-Pronged Basis - Expected 2017 Year-End
Price to Book Value - Expected 2017 Year-End

78
Appendix C – Capital Expenditures and Depreciation; Deferred Tax Liabilities

79
Appendix D – Down the Rabbit Hole We Go
Moving the Goalposts at Berkshire – What Changed and How it was Presented
(Reprinted From 2016 Year-End Letter)
Last year’s write-up of Berkshire covered in detail the different methodologies we employ in appraising
intrinsic value for the firm. The first method discussed, which comes with two data points provided
annually by Berkshire, is a Two-Pronged Approach. It so happens that we first began researching
Berkshire at the time the business created the “B” share class of stock via their 1996 public offering. Our
earliest analysis consisted of researching the annual reports from 1993-1995 as well as the offering
prospectus for the share offering. Berkshire included a table in the 1995 annual report with two columns.
The first showed marketable securities owned per-share at ten-year intervals. The second listed pre-tax
per-share operating earnings for all Berkshire subsidiaries excluding dividends, interest and realized
capital gains and losses from the marketable securities.
Pre-tax Earnings Per Share
Marketable Securities Excluding All Income from
Year Per Share Investments
---- --------------------- --------------------------
1965 .......................... $ 4 $ 4.08
1975 .......................... 159 (6.48)
1985 .......................... 2,443 18.86
1995 .......................... 22,088 258.20
Yearly Growth Rate: 1965-95.... 33.4% 14.7%
It was apparent that management was providing the two data points at ten-year intervals to help
shareholders objectively understand the economics of the business and how they viewed valuation. The
inclusion of these two columns of data, highlighting marketable securities per-share and pre-tax earnings
per-share, excluding all income from investments, provided a simple back of the envelope tool for valuing
Berkshire. It also highlighted the degree to which investments in marketable securities had contributed to
value creation over time. The two data points for investments and pre-tax earnings were subsequently
included in the four following years 1996-1999, were omitted in the following five from 2000-2004, and
found their way permanently back beginning with the 2005 annual. The depth of our understanding of Berkshire has evolved over the years. We bought shares for the first
time in February 2000. The position quickly became our largest through growth and subsequent well-
timed purchases. As our Berkshire acumen developed, our estimates of the two data points have become
very accurate each year in advance of their update in the annual Chairman’s letter. Last year, having taken
the time to write-up our analysis of Berkshire, we expected to be as precisely correct as possible. Imagine
the surprise then when the two yardsticks supplied for year-end 2015 wound up being far different than
we expected. Whoa! I mean, we had just told the world what those numbers would be. In both cases, each
yardstick was higher than we expected. Way higher. What had we missed? We’d done this every year
since first buying the stock, even in the five years when the two numbers weren’t supplied (more on this
shortly). We’d always been close to spot on. Here, we were wrong. So naturally we dug in. Other than
one mentioned change regarding underwriting results in the Chairman’s letter, the answers, particularly
for marketable securities per-share, weren’t immediately obvious. It became immediately clear that the
two data points that had been previously provided by Berkshire for 2014 had been changed, and were
changed with little to no explanation.

80
Before we expand on what changed, let’s review the two quantitative intrinsic value data points as they
appeared in Berkshire’s 2014 Chairman’s letter:
Here is an update of the two quantitative factors: In 2014 our per-share investments increased
8.4% to $140,123, and our earnings from businesses other than insurance and investments
increased 19% to $10,847 per share.
Besides occasionally updating the multi-year data points as they appeared in the 1995 annual, in most
years the two data points are generally presented along with their year-over-year growth rate. We never
presumed that Berkshire would ever restate the previous year’s numbers. Reconciling the two numbers
for 2014 with the 8.4% and 19% growth rates presented yields $129,253 for per-share investments and
$9,116 for per-share earnings, precisely the numbers that appeared in the 2013 annual. No issue there.
When we wrote our letter last year, we expected Berkshire to report something very close to $136,918 for
per-share investments and $11,562 for per-share earnings. Instead, the two yardstick values were
presented in the Chairman’s letter as:
Here is an update of the two quantitative factors: In 2015 our per-share cash and investments increased
8.3% to $159,794 (with our Kraft Heinz shares stated at market value), and earnings from our many
businesses – including insurance underwriting income – increased 2.1% to $12,304 per share. We exclude
in the second factor the dividends and interest from the investments we hold because including them would
produce a double-counting of value. In arriving at our earnings figure, we deduct all corporate overhead,
interest, depreciation, amortization and minority interests. Income taxes, though, are not deducted. That is,
the earnings are pre-tax.
I used the italics in the paragraph above because we are for the first time including insurance underwriting
income in business earnings. We did not do that when we initially introduced Berkshire’s two quantitative
pillars of valuation because our insurance results were then heavily influenced by catastrophe coverages. If
the wind didn’t blow and the earth didn’t shake, we made large profits. But a mega-catastrophe would
produce red ink. In order to be conservative then in stating our business earnings, we consistently assumed
that underwriting would break even over time and ignored any of its gains or losses in our annual
calculation of the second factor of value.
Today, our insurance results are likely to be more stable than was the case a decade or two ago because we
have deemphasized catastrophe coverages and greatly expanded our bread-and-butter lines of business.
Last year, our underwriting income contributed $1,118 per share to the $12,304 per share of earnings
referenced in the second paragraph of this section. Over the past decade, annual underwriting income has
averaged $1,434 per share, and we anticipate being profitable in most years. You should recognize,
however, that underwriting in any given year could well be unprofitable, perhaps substantially so.
Our estimate for marketable securities of $136,918 missed the reported amount of $159,794 per-share by
$22,876 per share. In dollar terms, we were low by more than $37 billion! For earnings per-share our miss
was more modest. We had estimated $11,562 for 2015 and were under the reported $12,304 by $742 per-
share, lower in dollars by $1.224 billion. The 2015 letter referenced that underwriting earnings were
included for the first time. While we knew that not to be the case (more on that in a bit), it reasoned that
their inclusion probably accounted for our “miss”. We further suspected that in readying for the
impending closure of the acquisition of Precision Castparts, cash balances must be now included in the
marketable securities tally that hadn’t been previously included. But the analyst in us needed to dig
deeper to reconcile what specifically had changed in the reporting of both numbers.
81
The first easy test was to reconcile the growth rates indicated for 2015 back to 2014’s reported numbers.
Remarkably, the growth rates for both data points don’t reconcile the reported numbers to each other. If
per-share investments had grown at the stated 8.3% rate, then 2014’s investments would have been
$147,548 per share. But in fact, from the 2014 annual report, the number was presented was the
previously mentioned $140,123. With that simple calculation and revelation, I just stared at the calculator.
Then I re-read the Chairman’s letter for each year. No explanation. How could the numbers presented for
2014 and 2015 not reconcile with the growth rate presented, and particularly with no disclosure that both
of 2014’s yardstick values had changed? It was a stunning finding.
The next step was to reconcile the earnings per-share figures between the years, which would now require
an adjustment for the inclusion of underwriting results in each year. 2015’s $12,304 per-share, grown by
2.1%, would make 2014’s earnings $12,050, as opposed to the $10,847 actually presented that year.
Because 2015’s figure now included the stated $1,118 in pre-tax underwriting profit, increasing 2014’s
$10,847 by $1,204 in underwriting earnings would make the numbers tie out. Except pre-tax underwriting
earnings in 2014 weren’t $1,204 per share. From the 2014 annual report, pre-tax underwriting earnings
that year were $2.668 billion, which on a per-share basis was $1,624 per-share, a $690 million dollar
difference than what had been reported. We suspected the difference could have been explained through
year-to-year insurance loss development, but in reviewing the 2015 10-K, that didn’t explain the
difference. Loss reserves developed favorably.
In both cases, trying to reconcile the reported yardstick figures for 2014 and 2015 couldn’t be done using
the growth rates supplied. Even when adjusting for the new inclusion of underwriting profit in the
earnings figures, the numbers simply didn’t make sense using the methods we had been using for years.
2014’s numbers were now different than those that had been reported. Coupled with a lack of disclosure
as to which, if any, marketable securities were now being included, we were thoroughly dismayed. Time
to keep digging.
Below is a spreadsheet which helps to clarify the moving parts across the two years. We include in the
first column the numbers as actually reported and show the underlying reconciliation. In the second
column, you will see where we believe methodologies changed, as suggested by the growth rates not
allowing the data to tie out. We’ll discuss those, and then elaborate on issues at large regarding when
various changes had taken place and what had been previously been said about the methods over time.
Continued on next page

82
Marketable Securities 2014 to 2015 - Presented in Dollars (millions)
2014
Reported 2014 Inferred Restated (8.3%
'14 to '15) 2015 Reported growth y/y
230,285 242,448 262,571 8.3%
Insurance and Other
Cash and cash equivalents 57,974 57,974 61,181
Fixed Maturity Securities 27,397 27,397 25,988
Equity Securities # 115,529 115,529 110,212 (4.6%) total return (2.7%)
Other (Warrants, Preferreds WWY,DOW,BAC,RBI) 16,346 16,346 15,998 Investments in Heinz/Kraft Heinz (Fair Mkt Value)* 11,660 11,660 32,042
Minus Cash From MSR * -5,765 -5,765 -6,807 Subtotal Insurance and Other (no MSR cash) 223,141 223,141 238,614
Finance and Financial Products Other (Warrants, Preferreds WWY,DOW,BAC,RBI) ** 5,978 5,978 5,719 Investments in equity and fixed income securities ** 1,299 1,299 411
7,277 7,277 6,130
ORIGINAL TOTAL 230,418 230,418 244,744 6.2%
Plus
Cash from MSR 5,765 6,807 Cash from Railroad, Utilities and Energy 3,001 3,437 Cash from Finance and Financial Products 2,294 7,112
11,060 17,356 Reconciled Total ^ 241,478 262,100 8.5% 2014 per-share investments: $140,123 equals $230.285 billion 2014 RESTATED/INFERRED investments: $147,548 per share equals $242.448 billion 2015 per-share investments: $159,794 per share equals $$262.571 billion
* Investments in Heinz and Kraft Heinz not at balance sheet value (cost) but fair value from fair value table; MSR cash from Chairman's Letter ** Assets from Finance and Financial Products stated as excluded in 1999 and 2005 Chairman's Letter # Growth y/y excludes dividends, net purchases and time weighting, Ballpark estimate of total return loss of $3.1 billion, 2.7% ^ Reconciled totals are off (low) by $970 million for 2014 and by $471 million for 2005. Number of shares in denominator or other assets?
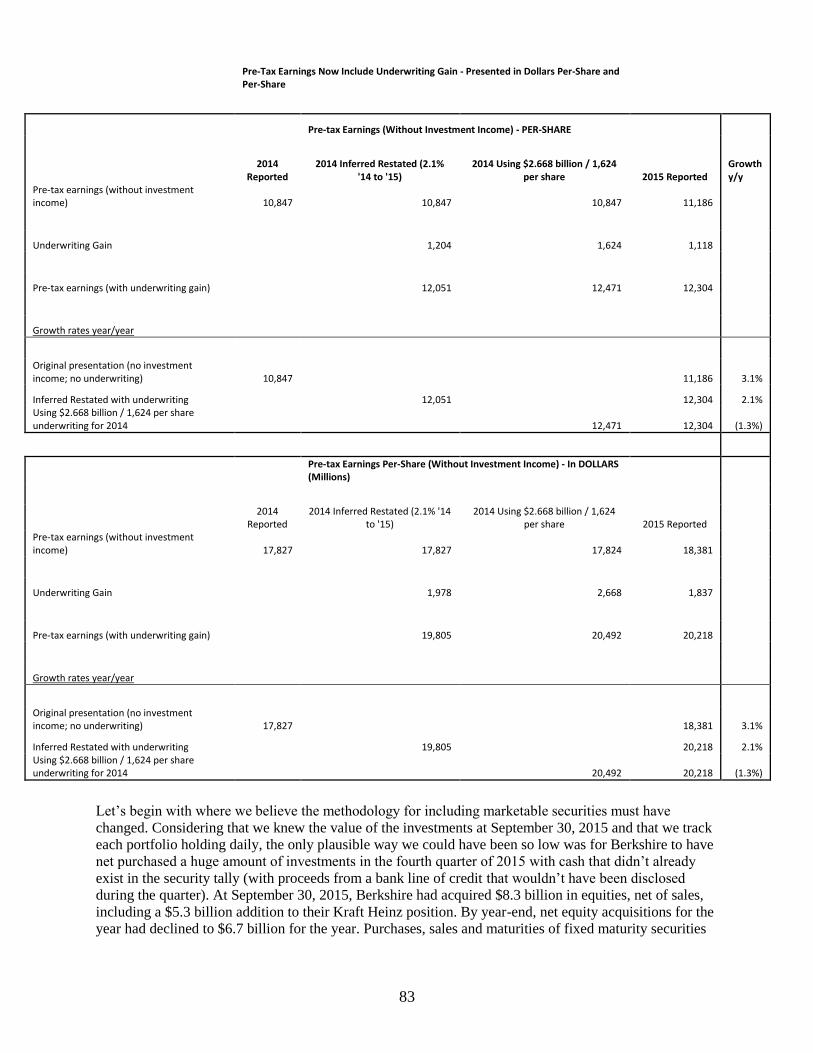
83
Let’s begin with where we believe the methodology for including marketable securities must have
changed. Considering that we knew the value of the investments at September 30, 2015 and that we track
each portfolio holding daily, the only plausible way we could have been so low was for Berkshire to have
net purchased a huge amount of investments in the fourth quarter of 2015 with cash that didn’t already
exist in the security tally (with proceeds from a bank line of credit that wouldn’t have been disclosed
during the quarter). At September 30, 2015, Berkshire had acquired $8.3 billion in equities, net of sales,
including a $5.3 billion addition to their Kraft Heinz position. By year-end, net equity acquisitions for the
year had declined to $6.7 billion for the year. Purchases, sales and maturities of fixed maturity securities
Pre-Tax Earnings Now Include Underwriting Gain - Presented in Dollars Per-Share and Per-Share
Pre-tax Earnings (Without Investment Income) - PER-SHARE
2014
Reported 2014 Inferred Restated (2.1%
'14 to '15) 2014 Using $2.668 billion / 1,624
per share 2015 Reported Growth y/y
Pre-tax earnings (without investment income) 10,847 10,847 10,847 11,186
Underwriting Gain 1,204 1,624 1,118
Pre-tax earnings (with underwriting gain) 12,051 12,471 12,304
Growth rates year/year
Original presentation (no investment income; no underwriting) 10,847 11,186 3.1%
Inferred Restated with underwriting 12,051 12,304 2.1% Using $2.668 billion / 1,624 per share underwriting for 2014 12,471 12,304 (1.3%)
Pre-tax Earnings Per-Share (Without Investment Income) - In DOLLARS (Millions)
2014
Reported 2014 Inferred Restated (2.1% '14
to '15) 2014 Using $2.668 billion / 1,624
per share 2015 Reported Pre-tax earnings (without investment income) 17,827 17,827 17,824 18,381
Underwriting Gain 1,978 2,668 1,837
Pre-tax earnings (with underwriting gain) 19,805 20,492 20,218
Growth rates year/year
Original presentation (no investment income; no underwriting) 17,827 18,381 3.1%
Inferred Restated with underwriting 19,805 20,218 2.1% Using $2.668 billion / 1,624 per share underwriting for 2014 20,492 20,218 (1.3%)
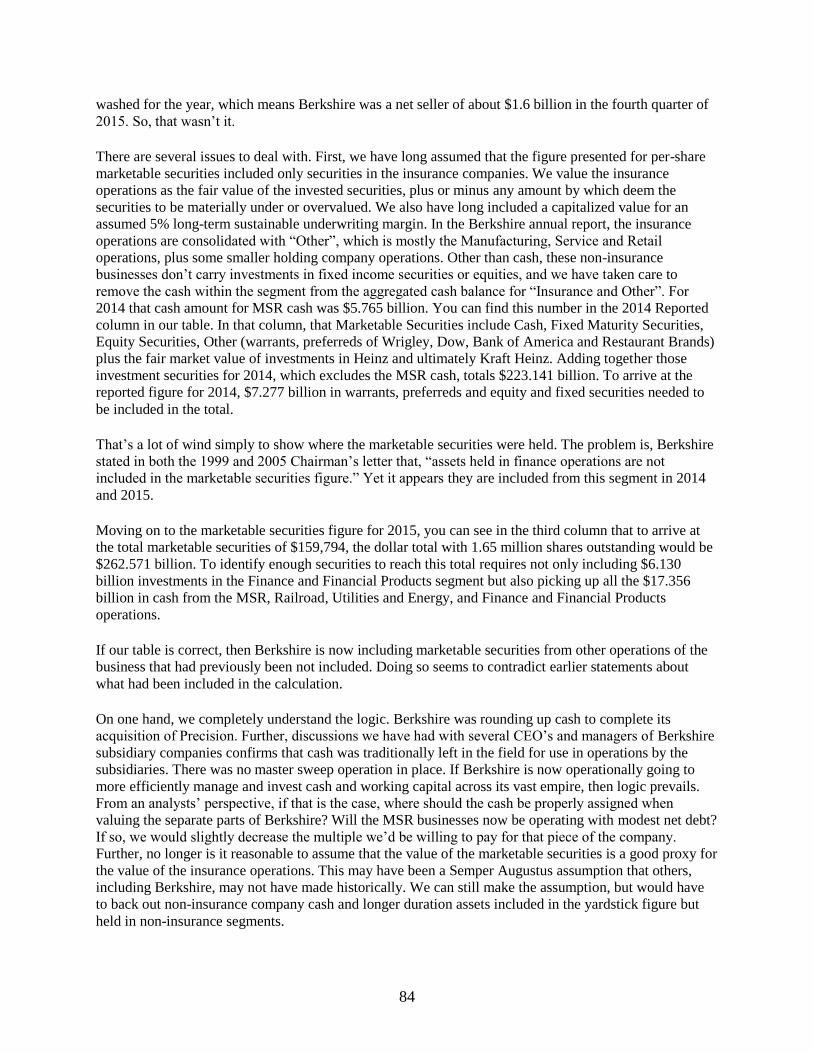
84
washed for the year, which means Berkshire was a net seller of about $1.6 billion in the fourth quarter of
2015. So, that wasn’t it.
There are several issues to deal with. First, we have long assumed that the figure presented for per-share
marketable securities included only securities in the insurance companies. We value the insurance
operations as the fair value of the invested securities, plus or minus any amount by which deem the
securities to be materially under or overvalued. We also have long included a capitalized value for an
assumed 5% long-term sustainable underwriting margin. In the Berkshire annual report, the insurance
operations are consolidated with “Other”, which is mostly the Manufacturing, Service and Retail
operations, plus some smaller holding company operations. Other than cash, these non-insurance
businesses don’t carry investments in fixed income securities or equities, and we have taken care to
remove the cash within the segment from the aggregated cash balance for “Insurance and Other”. For
2014 that cash amount for MSR cash was $5.765 billion. You can find this number in the 2014 Reported
column in our table. In that column, that Marketable Securities include Cash, Fixed Maturity Securities,
Equity Securities, Other (warrants, preferreds of Wrigley, Dow, Bank of America and Restaurant Brands)
plus the fair market value of investments in Heinz and ultimately Kraft Heinz. Adding together those
investment securities for 2014, which excludes the MSR cash, totals $223.141 billion. To arrive at the
reported figure for 2014, $7.277 billion in warrants, preferreds and equity and fixed securities needed to
be included in the total.
That’s a lot of wind simply to show where the marketable securities were held. The problem is, Berkshire
stated in both the 1999 and 2005 Chairman’s letter that, “assets held in finance operations are not
included in the marketable securities figure.” Yet it appears they are included from this segment in 2014
and 2015.
Moving on to the marketable securities figure for 2015, you can see in the third column that to arrive at
the total marketable securities of $159,794, the dollar total with 1.65 million shares outstanding would be
$262.571 billion. To identify enough securities to reach this total requires not only including $6.130
billion investments in the Finance and Financial Products segment but also picking up all the $17.356
billion in cash from the MSR, Railroad, Utilities and Energy, and Finance and Financial Products
operations.
If our table is correct, then Berkshire is now including marketable securities from other operations of the
business that had previously been not included. Doing so seems to contradict earlier statements about
what had been included in the calculation.
On one hand, we completely understand the logic. Berkshire was rounding up cash to complete its
acquisition of Precision. Further, discussions we have had with several CEO’s and managers of Berkshire
subsidiary companies confirms that cash was traditionally left in the field for use in operations by the
subsidiaries. There was no master sweep operation in place. If Berkshire is now operationally going to
more efficiently manage and invest cash and working capital across its vast empire, then logic prevails.
From an analysts’ perspective, if that is the case, where should the cash be properly assigned when
valuing the separate parts of Berkshire? Will the MSR businesses now be operating with modest net debt?
If so, we would slightly decrease the multiple we’d be willing to pay for that piece of the company.
Further, no longer is it reasonable to assume that the value of the marketable securities is a good proxy for
the value of the insurance operations. This may have been a Semper Augustus assumption that others,
including Berkshire, may not have made historically. We can still make the assumption, but would have
to back out non-insurance company cash and longer duration assets included in the yardstick figure but
held in non-insurance segments.

85
Let’s now address a few additional thoughts regarding the “new” presentation of operating earnings per-
share. We had estimated $11,562 for earnings per-share for 2015 and were low of the reported $12,304 by
$742 per-share, lower in dollars by about $1.224 billion. The answer to the difference here was mostly
evidenced by the inclusion of underwriting profits. We still can’t reconcile 2014’s inferred (by growth
rate) larger earning figure though. The number is too low by $420 per-share, and we’d like to understand
what had changed from 2014 to 2015 to modify the previously reported number for 2014. In fact, when
presenting year-over-year results both in the Chairman’s letter and in the footnotes to the annual report,
the 2014 pre-tax figure was unchanged. How then did the number change when presenting the intrinsic
value yardstick figure?
From a disclosure standpoint, the 2015 Chairman’s letter states:
I used the italics in the paragraph above because we are for the first time (emphasis added) including
insurance underwriting income in business earnings. We did not do that when we initially introduced
Berkshire’s two quantitative pillars of valuation (emphasis added) because our insurance results were then
heavily influenced by catastrophe coverages.
The fact is, Berkshire actually did just that. 2015 was not the first time they included insurance
underwriting income in business earnings. When the two-prong yardsticks first appeared in 1995, they
very much included underwriting earnings. They were included for all five years 1995-1999. We can only
speculate why the yardsticks were omitted from the 2000-2004 reports, but it’s interesting that
underwriting profitability turned seriously negative immediately at the time of the General Re acquisition
in 1998. In fact, the underwriting results were so bad that the overall pre-tax operating earnings yardstick
figures were reported as negative in 1998 and 1999. It’s hard to capitalize losses. When we first bought
our shares in 2000, the 1999 annual hadn’t yet been released, but we already had assumed that
Berkshire’s aggregate insurance operations would underwrite at 5% on a long-term sustained basis. When
the yardsticks failed to appear, we didn’t blanch at their omission, simply concluding that it never made
sense to include them together in the first place. Underwriting results are too volatile over time and over
cycles. Even with a lessened reliance on catastrophe coverage, we presume there will again come a year,
or years, when Berkshire suffers underwriting losses, and may regret the reintroduction of that portion of
earnings in the operating earnings yardstick. Of course, as insurance overall shrinks in relevance within
Berkshire, perhaps it won’t much affect the total number.