doing analytics right - designing and automating analytics
TRANSCRIPT
Doing Analytics RightPart 2 – Designing and Automating Analytics
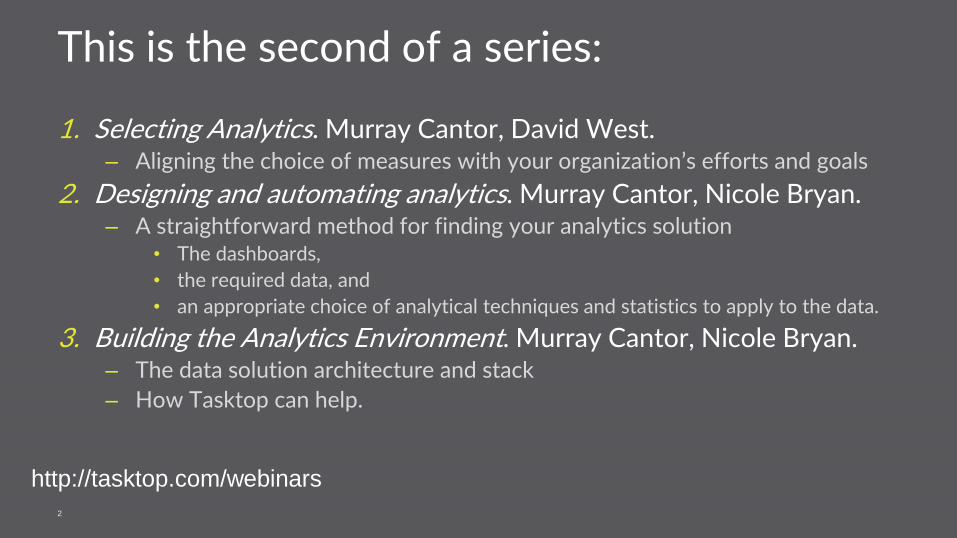
This is the second of a series:
1. Selecting Analytics. Murray Cantor, David West.– Aligning the choice of measures with your organization’s efforts and goals
2. Designing and automating analytics. Murray Cantor, Nicole Bryan.– A straightforward method for finding your analytics solution
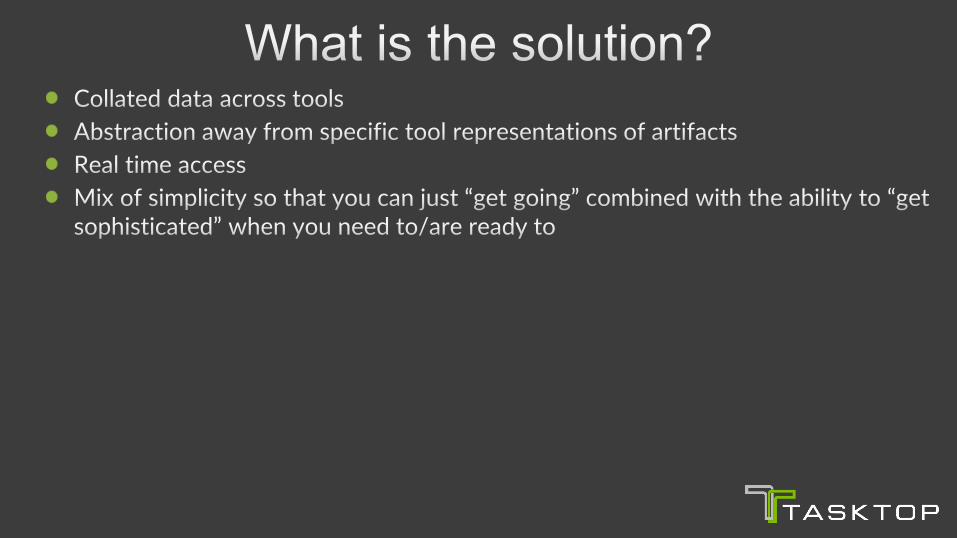
• The dashboards,
• the required data, and
• an appropriate choice of analytical techniques and statistics to apply to the data.
3. Building the Analytics Environment. Murray Cantor, Nicole Bryan.– The data solution architecture and stack
– How Tasktop can help.
2
http://tasktop.com/webinars
Look Whose Talking
@tasktop
• Nicole Bryan, VP of Product Management, Tasktop– Passionate about improving the
experience of how software is delivered– Former Director at Borland Software– [email protected] |
@nicolebryan
• Dr Murray Cantor – Senior Consultant, Cutter Consortium – Working to improve our industry with
metrics– Former IBM Distinguished Engineer– [email protected] | @murraycantor
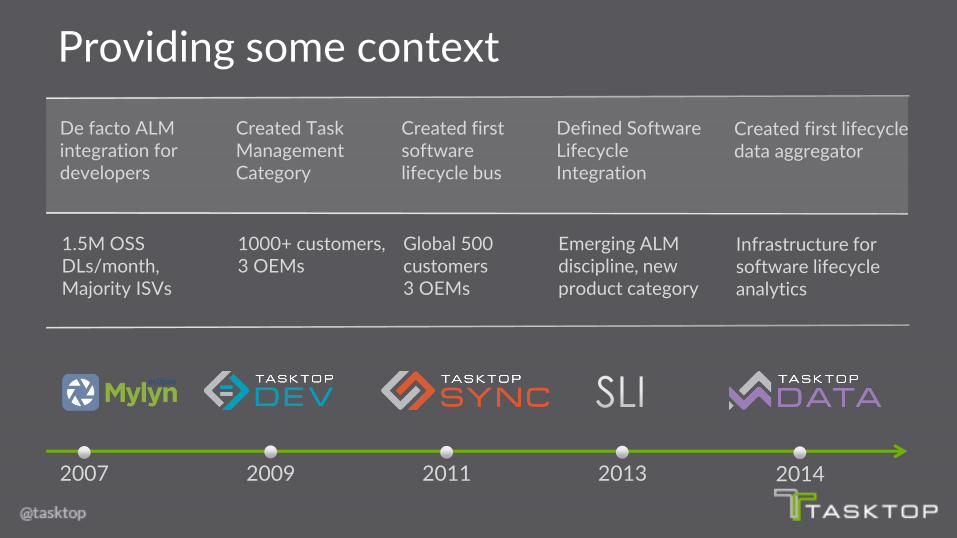
Providing some context
Created first software lifecycle bus
2011
Global 500 customers3 OEMs
Created Task Management Category
2009
1000+ customers,3 OEMs
De facto ALM integration for developers
2007
1.5M OSS DLs/month,Majority ISVs
Defined Software Lifecycle Integration
2013
Emerging ALM discipline, new product category
Created first lifecycle data aggregator
2014
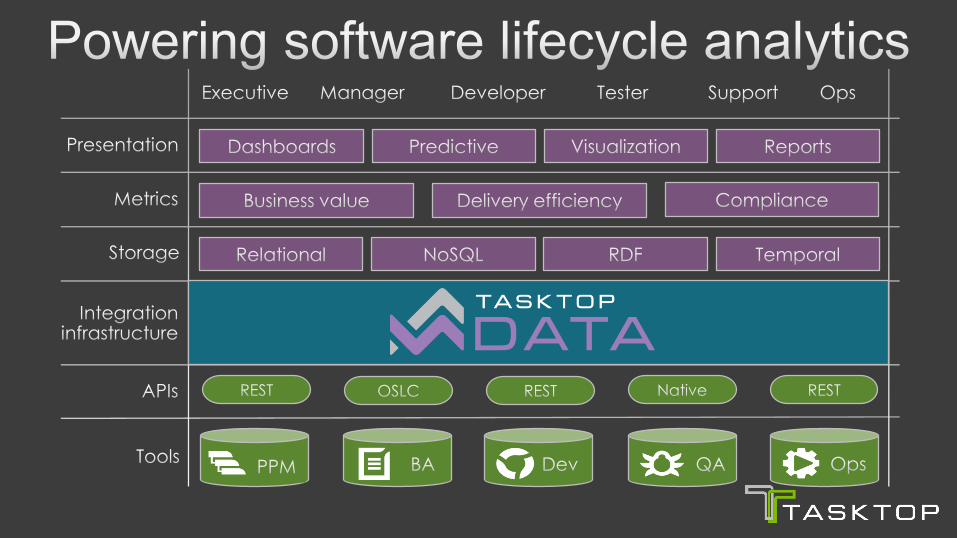
Infrastructure for software lifecycle analytics

So…. You have Data, then what…
©2015 Murray Cantor
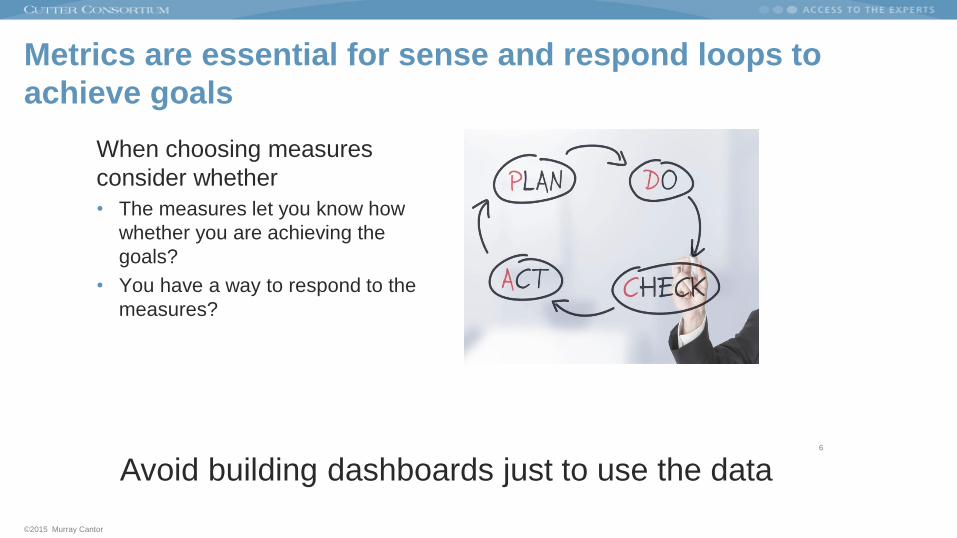
Metrics are essential for sense and respond loops to
achieve goals
When choosing measures
consider whether
• The measures let you know how
whether you are achieving the
goals?
• You have a way to respond to the
measures?
6
Avoid building dashboards just to use the data

©2015 Murray Cantor
Choosing metrics big picture
Agree on goals
- Depends on the levels and mixture of work
Agree on the how they fit into the loop
1. “How would we know we are achieving the goal”
2.” What response we take?”
Determine the measures needed to answer the questions
- Apply the Einstein test (as simple as possible, but no simpler)
Specify the data needed to answer the questions
Automate collection and staging of the data
7
Today
Later
©2015 Murray Cantor
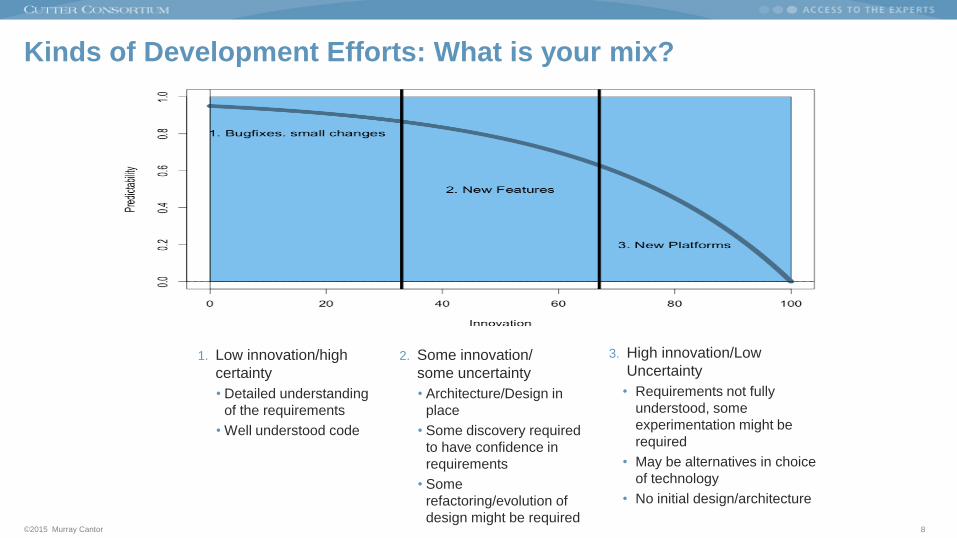
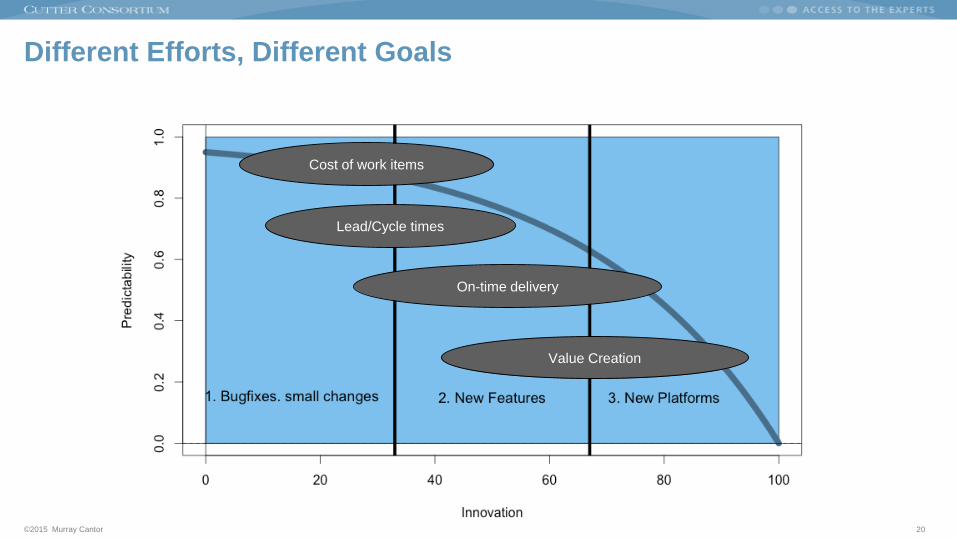
Kinds of Development Efforts: What is your mix?
8
1. Low innovation/high
certainty
• Detailed understanding
of the requirements
• Well understood code
2. Some innovation/
some uncertainty
• Architecture/Design in
place
• Some discovery required
to have confidence in
requirements
• Some
refactoring/evolution of
design might be required
3. High innovation/Low
Uncertainty
• Requirements not fully
understood, some
experimentation might be
required
• May be alternatives in choice
of technology
• No initial design/architecture

©2015 Murray Cantor
Different Efforts, Different Goals
9
Cost of work items
Lead/Cycle times
On-time delivery
Value Creation
©2015 Murray Cantor
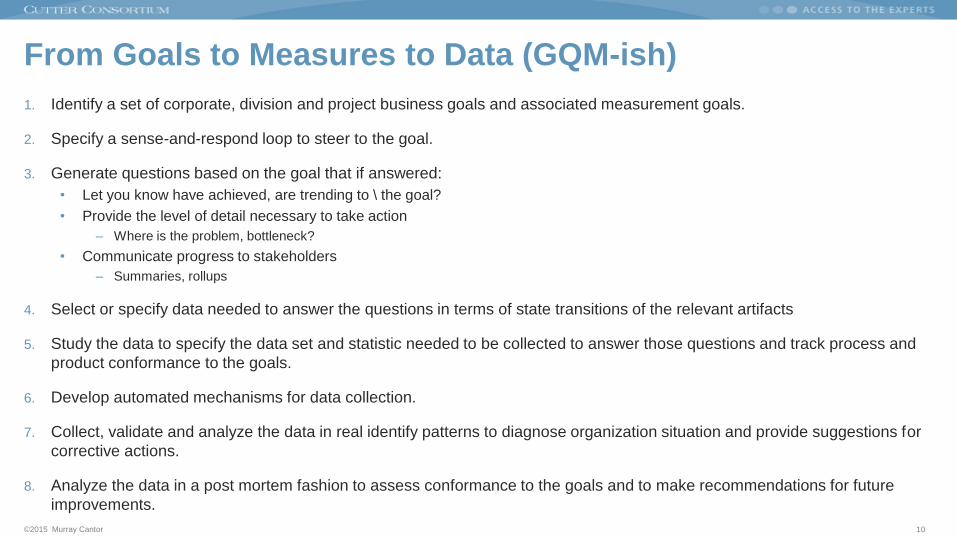
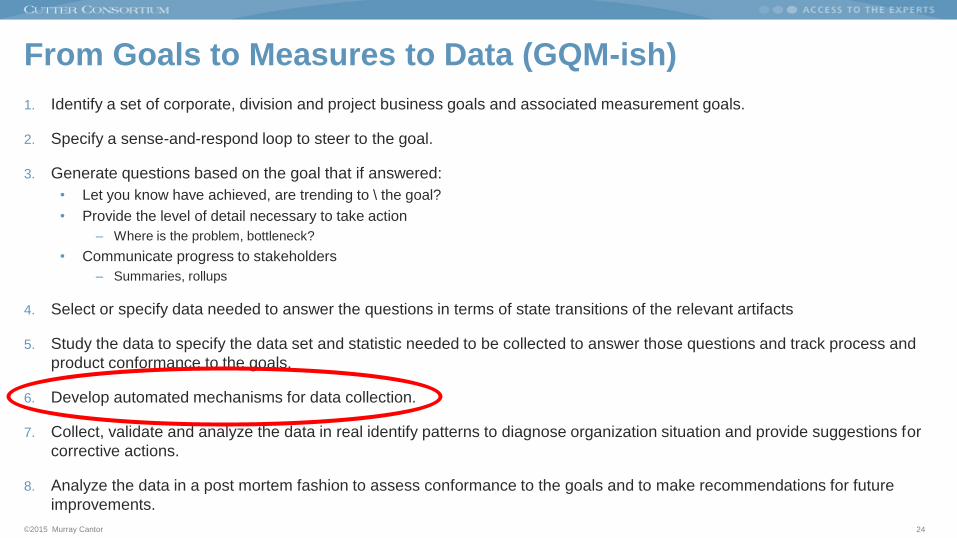
From Goals to Measures to Data (GQM-ish)
1. Identify a set of corporate, division and project business goals and associated measurement goals.
2. Specify a sense-and-respond loop to steer to the goal.
3. Generate questions based on the goal that if answered:
• Let you know have achieved, are trending to \ the goal?
• Provide the level of detail necessary to take action
– Where is the problem, bottleneck?
• Communicate progress to stakeholders
– Summaries, rollups
4. Select or specify data needed to answer the questions in terms of state transitions of the relevant artifacts
5. Study the data to specify the data set and statistic needed to be collected to answer those questions and track process and
product conformance to the goals.
6. Develop automated mechanisms for data collection.
7. Collect, validate and analyze the data in real identify patterns to diagnose organization situation and provide suggestions for
corrective actions.
8. Analyze the data in a post mortem fashion to assess conformance to the goals and to make recommendations for future
improvements.
10

©2015 Murray Cantor
Why GQM?
Operationalizes ‘business alignment’
• Shared ‘goals’ is the essence of business alignment:
It is the method for going from client needs to technical specification
• Like going from user stories to software specifications
Disciplined practice
• Avoid platitudes like ‘Operational excellence’
• Avoid Common anti pattern: Lots of metrics, ill focused
11
Doing analytics without GQM is like doing software without stories

©2015 Murray Cantor
Bucket One Example: Goal: Improve Cycle Time
The situation: An level 3 support organization
needs to meet stakeholder needs to improve its
responsiveness
Questions:
• How long does it take to complete?
• Where are the bottle necks?
– In the process
– Which team
The artifact is a defect with states “opened,
prioritized, tested, shipped”.
We need the durations of times between
“opened” and “shipped”states
12

©2015 Murray Cantor
To feed an analytics tool like Tableau we need this table:
13
We found the durations using the DATEDIFF() function.
©2015 Murray Cantor
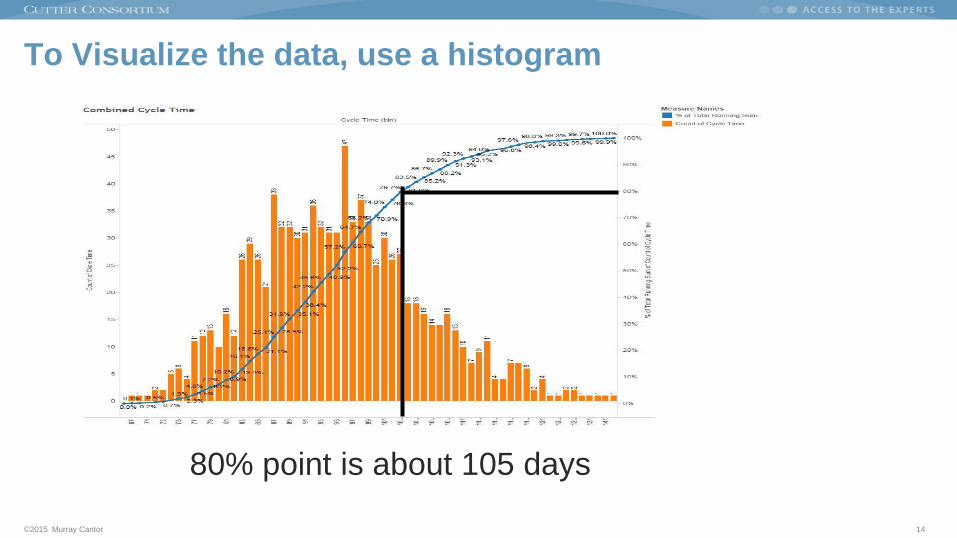
To Visualize the data, use a histogram
14
80% point is about 105 days
©2015 Murray Cantor
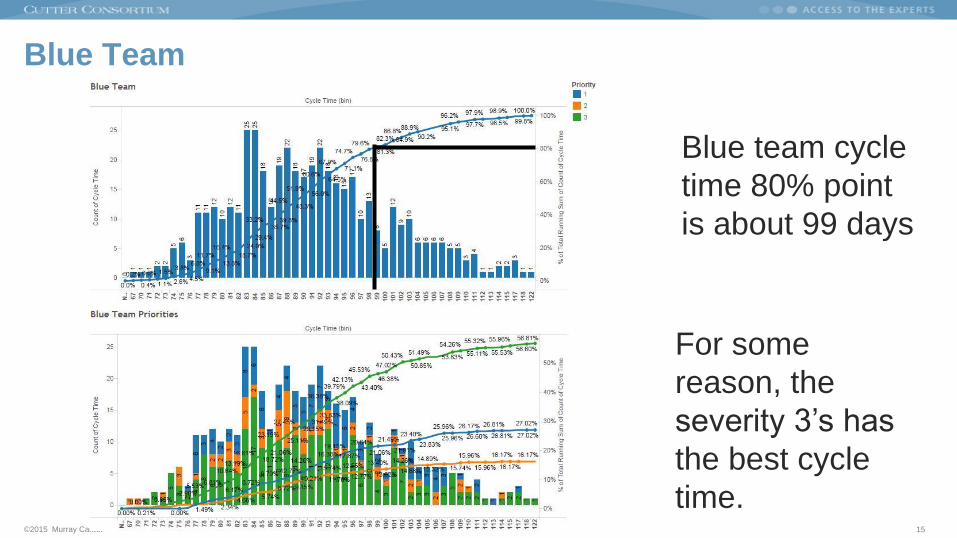
Blue Team
15
Blue team cycle
time 80% point
is about 99 days
For some
reason, the
severity 3’s has
the best cycle
time.
©2015 Murray Cantor
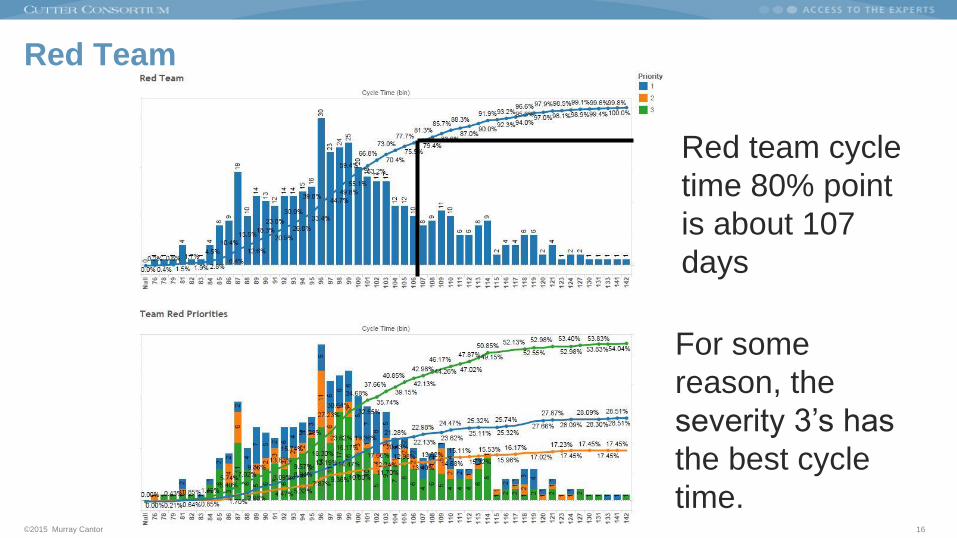
Red Team
16
Red team cycle
time 80% point
is about 107
days
For some
reason, the
severity 3’s has
the best cycle
time.
©2015 Murray Cantor
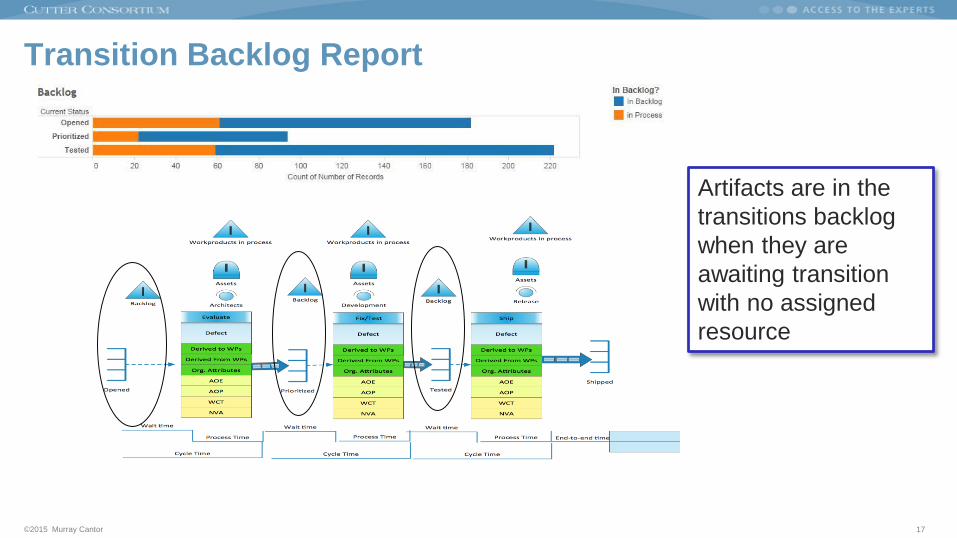
Artifacts are in the
transitions backlog
when they are
awaiting transition
with no assigned
resource
Transition Backlog Report
17
©2015 Murray Cantor
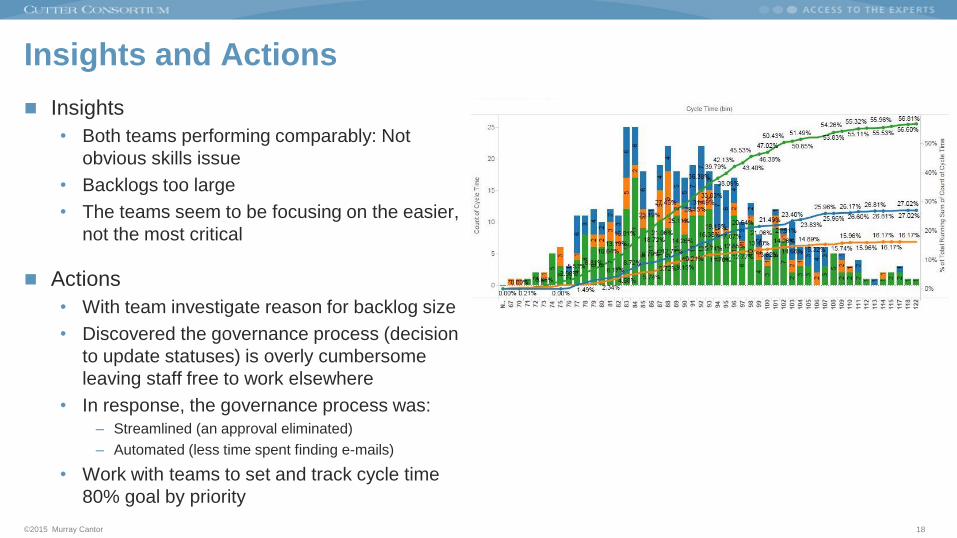
Insights and Actions
Insights
• Both teams performing comparably: Not
obvious skills issue
• Backlogs too large
• The teams seem to be focusing on the easier,
not the most critical
Actions
• With team investigate reason for backlog size
• Discovered the governance process (decision
to update statuses) is overly cumbersome
leaving staff free to work elsewhere
• In response, the governance process was:
– Streamlined (an approval eliminated)
– Automated (less time spent finding e-mails)
• Work with teams to set and track cycle time
80% goal by priority
18

©2015 Murray Cantor
This is what improvement looks like
19
©2015 Murray Cantor
Different Efforts, Different Goals
20
Cost of work items
Lead/Cycle times
On-time delivery
Value Creation

But wait … there’s more!
What we’ve learned so far….
• Webinar 1: There is no “one size fits all” metric nirvana
• Webinar 2: Use GQM to design the metrics that are right for your mix of development
And up next …
Webinar #3: It’s all about the execution! Let’s get practical!

©2015 Murray Cantor
Choosing metrics big picture
Agree on goals
- Depends on the levels and mixture of work
Agree on the how they fit into the loop
1. “How would we know we are achieving the goal”
2.” What response we should take?”
Determine the measures needed to answer the questions
- Apply the Einstein test (as simple as possible, but no simpler)
Specify the data needed to answer the questions
Automate collection and staging of the data
23
Today
Webinar 3
©2015 Murray Cantor
From Goals to Measures to Data (GQM-ish)
1. Identify a set of corporate, division and project business goals and associated measurement goals.
2. Specify a sense-and-respond loop to steer to the goal.
3. Generate questions based on the goal that if answered:
• Let you know have achieved, are trending to \ the goal?
• Provide the level of detail necessary to take action
– Where is the problem, bottleneck?
• Communicate progress to stakeholders
– Summaries, rollups
4. Select or specify data needed to answer the questions in terms of state transitions of the relevant artifacts
5. Study the data to specify the data set and statistic needed to be collected to answer those questions and track process and
product conformance to the goals.
6. Develop automated mechanisms for data collection.
7. Collect, validate and analyze the data in real identify patterns to diagnose organization situation and provide suggestions for
corrective actions.
8. Analyze the data in a post mortem fashion to assess conformance to the goals and to make recommendations for future
improvements.
24
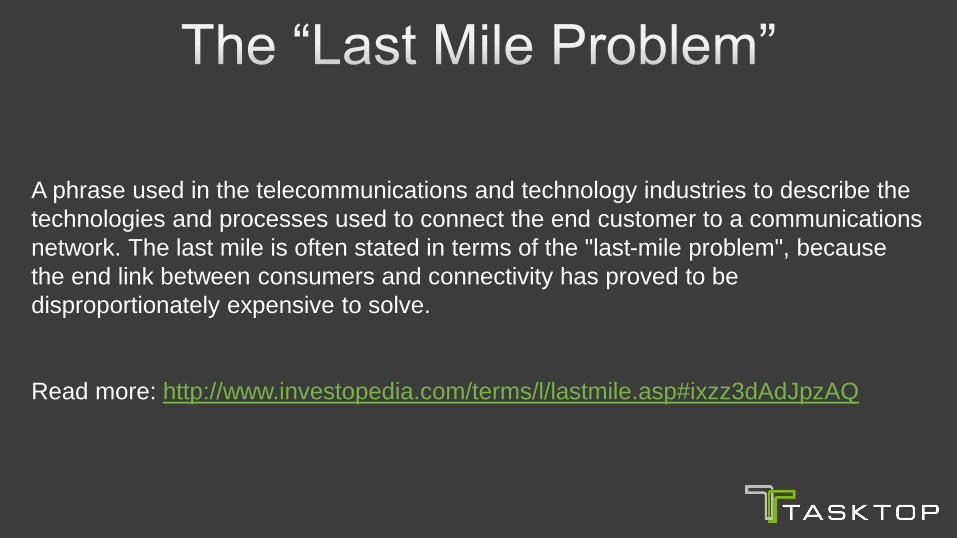
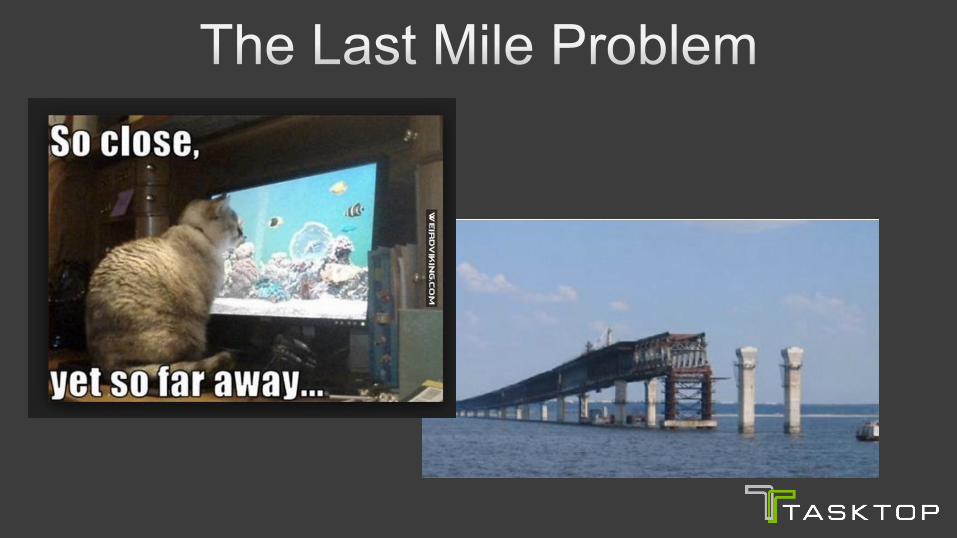
A phrase used in the telecommunications and technology industries to describe the
technologies and processes used to connect the end customer to a communications
network. The last mile is often stated in terms of the "last-mile problem", because
the end link between consumers and connectivity has proved to be
disproportionately expensive to solve.
Read more: http://www.investopedia.com/terms/l/lastmile.asp#ixzz3dAdJpzAQ
Aspiration without execution is useless!
No wait … It’s actually worse than useless…

Po
rtfo
lio M
gm
tAgile PM
Requirements
TestDev
Op
eratio
ns

Remember – you want your point tools to stay focused on their domain expertise
In the last webinar in this series, we will show you how, by using Tasktop Data, you can solve the last mile problem efficiently and painlessly
And, yes, there will be a demo


This is the second of a series:
1. Selecting Analytics. Murray Cantor, Dave West.– Aligning the choice of measures with your organization’s efforts and goals
2. Designing and automating analytics. Murray Cantor, Nicole Bryan.– A straightforward method for finding your analytics solution
• The dashboards,
• the required data, and
• an appropriate choice of analytical techniques and statistics to apply to the data.
3. Building the Analytics Environment. Murray Cantor, Nicole Bryan.– The data solution architecture and stack
– How Tasktop can help
36
http://tasktop.com/webinars
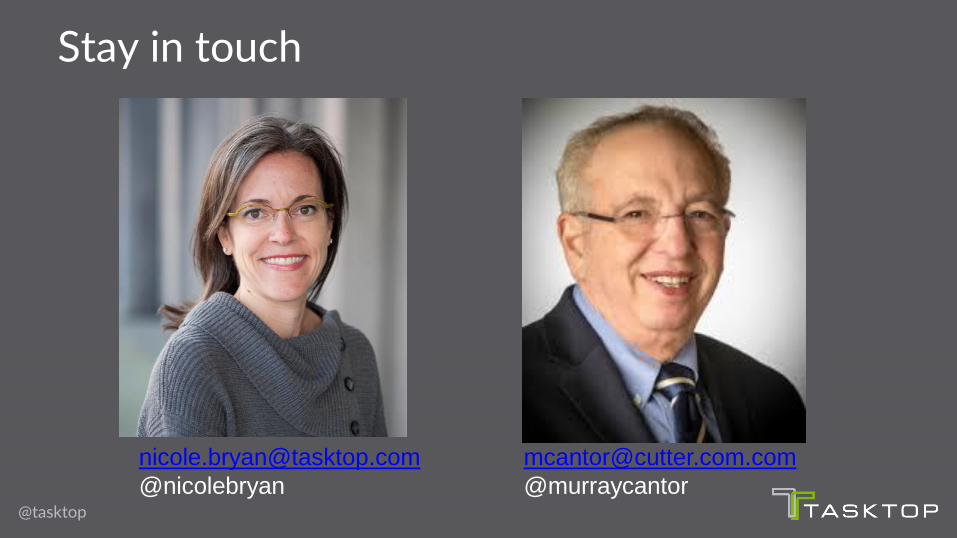
Stay in touch
@tasktop
@nicolebryan
@murraycantor
@tasktop@cuttertweets