does generosity beget generosity? alumni giving and ... · does generosity beget generosity? alumni...
TRANSCRIPT
NBER WORKING PAPER SERIES
DOES GENEROSITY BEGET GENEROSITY? ALUMNI GIVING AND UNDERGRADUATEFINANCIAL AID
Jonathan MeerHarvey S. Rosen
Working Paper 17861http://www.nber.org/papers/w17861
NATIONAL BUREAU OF ECONOMIC RESEARCH1050 Massachusetts Avenue
Cambridge, MA 02138February 2012
We are grateful to Princeton’s Center for Economic Policy Studies for support of this research. Wehave received useful suggestions from Ronald Ehrenberg, Mark Hoekstra, Robin Moscato and participantsin the Bush School Quantitative Workshop. The views expressed herein are those of the authors anddo not necessarily reflect the views of the National Bureau of Economic Research.
NBER working papers are circulated for discussion and comment purposes. They have not been peer-reviewed or been subject to the review by the NBER Board of Directors that accompanies officialNBER publications.
© 2012 by Jonathan Meer and Harvey S. Rosen. All rights reserved. Short sections of text, not to exceedtwo paragraphs, may be quoted without explicit permission provided that full credit, including © notice,is given to the source.
Does Generosity Beget Generosity? Alumni Giving and Undergraduate Financial AidJonathan Meer and Harvey S. RosenNBER Working Paper No. 17861February 2012JEL No. I22,I23
ABSTRACT
We investigate how undergraduates’ financial aid packages affect their subsequent donative behavioras alumni. The empirical work is based upon micro data on alumni giving at an anonymous researchuniversity. We focus on three types of financial aid, scholarships, loans, and campus jobs. A novelaspect of our modeling strategy is that, consistent with the view of some professional fundraisers, weallow the receipt of a given form of aid per se to affect alumni giving. At the same time, our modelallows the amount of the support to affect giving behavior nonlinearly.
Our main findings are: 1) Individuals who took out student loans are less likely to make a gift, otherthings being the same. We conjecture that this phenomenon is caused by an “annoyance effect” —alumni resent the fact that they are burdened with loans. 2) Scholarship aid reduces the size of a gift,but has little effect on the probability of donating. The negative effect of receiving a scholarship ondonations decreases in absolute value with the size of the scholarship. We do not find any evidencethat scholarship recipients give less because they have relatively low incomes post graduation. 3) Aidin the form of campus jobs does not have a strong effect on donative behavior.
Jonathan MeerDepartment of EconomicsTexas A&M UniversityCollege Station, TX [email protected]
Harvey S. RosenDepartment of EconomicsFisher HallPrinceton UniversityPrinceton, NJ 08544-1021and [email protected]
1. Introduction
Financial aid to undergraduates from their schools has been growing over time; according
to the College Board [2010, p.3], institutional grant dollars per full-time-equivalent undergradu-
ate increased at an average annual rate of about 2.8 percent over the 1999-2000 to 2009-10 dec-
ade. At the same time, institutions of higher education have become ever more reliant on support
from alumni contributions, which were $7.1 billion in 2010 (Council for Aid to Education
[2011]). This paper examines one potential linkage between these two trends, the possibility that
the financial packages students receive when they are undergraduates affect their subsequent
donative behavior as alumni. Indeed, “conventional wisdom among university fund-raisers holds
that former scholarship recipients… are among the most dependable donors because they are
grateful to the institution and want to lend a hand to the next generation” (Bombardieri [2007]).
This intuition is consistent with the literature on gift exchange in charitable giving. For instance,
Falk [2007] conducts a field experiment in which potential donors who receive a large gift with
their solicitation donate more than those who receive a small gift, who in turn donate more than
members of the control group, who receive no gift.1
The flip side of this argument is that students who leave college with large loans may feel
some resentment and therefore donate less money, other things being the same. As a recent grad-
uate from Boston University said, “I got a great deal with my financial aid, but I’m still paying
tens of thousands of dollars. And now they want more money? I think it’s just ludicrous” (quoted
in Bombardieri [2007]). Alternatively, loan recipients might donate less simply because repaying
the loans reduces their disposable income.
We investigate these and related hypotheses using a rich set of micro data on alumni giv-
ing at an anonymous private research university, which we call Anon U. We follow a group of 1 For related papers on gift exchange in charitable giving, see Alpizar et al. [2008] and Landry et al. [2011].
2
about 13,000 alumni who graduated between 1993 and 2005. The panel nature of the data allows
us to examine issues relating to the time pattern of giving, in particular, the frequency with which
individuals make gifts. Such questions cannot be addressed by previous studies, which have
tended to look at either a single year’s worth of data, or have examined average giving over a
number of years. In addition, our data provide a more detailed characterization of financial aid
packages than has been available to previous researchers. In particular, in addition to grants and
loan aid, we also have information on earnings from campus jobs.
Section 2 of the paper reviews the relevant literature. Section 3 discusses the data. We
present the econometric specification and results in Section 4. Our main findings are:
1) The mere fact of taking out a student loan decreases the probability that an individual
will contribute to the university as an alumnus. Further, individuals who take out large student
loans make smaller contributions as alumni, conditional on making a gift. Taking advantage of
correlates of income that are in our data set, we argue that this negative impact is unlikely to be
because alumni who took out loans have relatively low disposable incomes. We conjecture that,
rather, it is caused by an “annoyance effect” — alumni resent the fact that they have to repay
loans.
2) Financial aid received in the form of scholarships reduces the size of a gift, conditional
on making a gift, but has little effect on the probability of making a gift. Students who received
scholarships are also less likely to be in the top 10 percent of givers in their class in a given year.
Again, we find no evidence of income effects, i.e., that undergraduates who received scholar-
ships give less because they have relatively low incomes as adults One possible explanation is
that scholarship recipients prefer to give to charities other than their alma mater. Interestingly,
among the group of scholarship recipients, subsequent donations increase with the size of the
3
scholarship (although the amounts are still less than for non-grant recipients). This suggests that
at least some kind of gift exchange motive is present among scholarship awardees.
3) Aid in the form of campus jobs does not have a strong effect on donative behavior.
Section 5 discusses some alternative specifications of the model in order to assess the ro-
bustness of our results. In particular, we allow individuals’ responses to the composition of their
aid packages to depend on their demographic characteristics. We find some differences across
racial groups, but the responses of men and women are about the same. Additionally, and some-
what surprisingly, the effects of having received aid do not change greatly as alumni age. We
conclude in Section 6 with a summary and suggestions for future research.
2. Previous Literature
Several papers have used institutional level data to study the link between financial aid
packages and subsequent alumni giving.2 Ficano and Cunningham [2002] characterize financial
aid as the percentage of the cost of attending the institution full time that is rebated in the forms
of need based scholarships, non-need based scholarships, and student loans from college funds.
They find that more generous need-based scholarships are associated with higher subsequent
alumni donations. Baade and Sundberg [1996] include in their model the percentage of students
who receive financial aid, along with scholarship and fellowship amounts per student. They find
no effect of scholarship aid on alumni giving, and negative effects for the percentage receiving
financial aid only for liberal arts schools. While interesting, the results of studies using institu-
tional level data must be regarded with caution because the cultures and histories of different col-
2 While the literature on the effect of financial aid on behavior after college is rather sparse, there has been a good deal of literature on the effects of financial aid before college, i.e., on college attendance decisions. See, for example, Dynarski [2000].
4
leges are highly diverse. Hence, unobserved variables such as the style of university governance
could be driving both financial aid policy and alumni giving patterns.
An alternative strategy that avoids this problem is to use micro data from a single or sev-
eral institutions, a tack taken by Clotfelter [2001], Monks [2003] and Holmes [2009]. The impact
of financial aid is not the main focus of any of these studies, and the characterizations of individ-
uals’ undergraduate aid packages are consequently not very detailed. Clotfelter’s model of alum-
ni giving includes only a dichotomous variable indicating whether an individual received finan-
cial aid, Monks includes the size of any loans and an indicator for whether they were a “major”
or “minor” source of support, and Holmes includes dichotomous variables both for whether the
individual received loans or grants. Their substantive results differ across papers and sometimes
within the same paper. Clotfelter finds that for some cohorts of individuals, the receipt of need-
based financial aid depressed future giving, but for others, there was no statistically significant
effect. Monks’ results suggest that recipients of financial aid are more likely to make subsequent
donations but loans depress the likelihood of making gifts, while Holmes finds that neither the
receipt of grants nor loans affects donative behavior. This is similar to the result of McDearmon
and Shirley [2009], whose analysis of online survey data (as opposed to administrative data)
suggests that neither financial awards nor student loans affect alumni giving.
Marr et al. [2005] examine the amounts given by the individuals over the first eight years
after graduation. Their data allow them to include a quite detailed characterization of financial
aid packages. They consider amounts of need-based loans, need-based scholarships, merit-based
scholarships, and athletic scholarships. They find that loans decrease both the probability and
amount of giving, and need-based scholarships have the opposite effect. They enter their varia-
bles as step functions, and find some evidence that the effects of loans and scholarships are non-
5
linear. Their econometric model does not attempt to take advantage of the longitudinal nature of
their data set because so few individuals make contributions in any given year. Rather, they fo-
cus on the likelihood that an individual makes any gift during the eight-year period after gradua-
tion. Such averages can mask substantial heterogeneity; someone who gives once during an ex-
tended period of time is treated as being exactly the same as someone who donates every year.
Our data set, described below, includes a rich set of information relating to the structure
of financial aid packages, including income from on-campus jobs, which has not been studied
before. In addition, unlike previous studies, we track some individuals in our sample over a suf-
ficiently long period of time that we can examine whether the effects of financial aid packages
diminish with time. Our econometric procedure takes advantage of the longitudinal nature of the
data set, allowing us, for example, to compare patterns of giving rather than just a snapshot of a
single year’s donations.
3. Data
Our data are drawn from Anon U’s administrative archives. The data are proprietary and
sensitive, and individuals’ names were stripped from the records before being made available to
us. Our sample consists of all individuals who graduated between 1993 and 2005.3 We have each
individual’s giving history from the year after graduation until 2009. Our unit of observation is a
yearly giving opportunity. For example, if an individual has been an alumna for 5 years, she ac-
counts for 5 giving opportunities, starting in the first fiscal year after graduation. Multiple gifts in
the same year are summed together. We begin with 142,874 observations, representing 14,382
alumni. We delete 5,175 observations because of missing or unreliable data, leaving 137,699 ob-
3 The members of these relatively young classes donated about 2.5 percent of the total amount given to the universi-ty by alumni in 2009, and smaller amounts in each previous year. Younger and older classes tend to give at fairly similar rates.
6
servations on 13,831 alumni. Of these observations, 84,394 (or 61.3 percent) are associated with
a gift.
At Anon U, eligible students can receive aid in the form of scholarships, loans and cam-
pus jobs. About 49.6 percent of the individuals in our sample received any financial aid at all
during their time at Anon U. 44.7 percent received some scholarship aid; 40.4 percent received
aid in the form of a campus job, and 43.0 percent received loans; 34.8 percent received all three
types of aid.4 All scholarships are need based; the university gives no athletic or merit scholar-
ships. The student’s need is defined as the difference between the student budget and the univer-
sity’s estimate of what the student and his or her family can afford to pay toward these expenses.
The parents’ contribution, the student’s summer earnings, a portion of the student’s own savings,
and external grants are compared with the university’s costs to determine whether or not the ap-
plicant needs financial assistance. In our data, conditional on receiving any aid, the average total
amount of aid received during a student’s undergraduate career is $85,749 (s.d. = $51,627).
Among students who receive scholarships, the average grant is $71,471 (s.d. = $45,921).
In 2001, Anon U moved to a no-loan policy; the class of 2005 was the first to have all
four undergraduate years under this policy. Financial need was fully met by grants and campus
jobs and aid that previously would have come in the form of loans came as grants instead.
However, students were still able to take out loans to meet costs in excess of their calculated
financial need. Thus, a few students in these classes still received loans, though their prevalence
4 These figures include aid that came from sources external to the university. Our data do not allow us to distinguish between funds received from the university and external funds. However, over 93 percent of scholarship aid comes from university sources.
7
is much lower. Since the policy is relatively recent, it is difficult to estimate its effects on alumni
giving, particularly because they are not distinguishable from cohort effects.5
During our sample period, the average interest rate on student loans was about 7 percent,
and the repayment period was 10 years beginning at graduation. If a student went directly to
graduate school, repayment of the loans was deferred, and the 10 year clock started when gradu-
ate school was completed. Conditional on obtaining a loan, the average amount received over the
individual’s undergraduate career is $15,633 (s.d. = $8,308). The average loan repayment during
the 10-year period for a member of the class of 2001 is about $166 per month.
Campus jobs typically involve 9 or 10 hours of work per week for the 30 weeks of the
academic year; the average amount of money earned from campus jobs is $9,544 (s.d. =
$4,429).6 This figure includes remuneration from both positions arranged by the financial aid
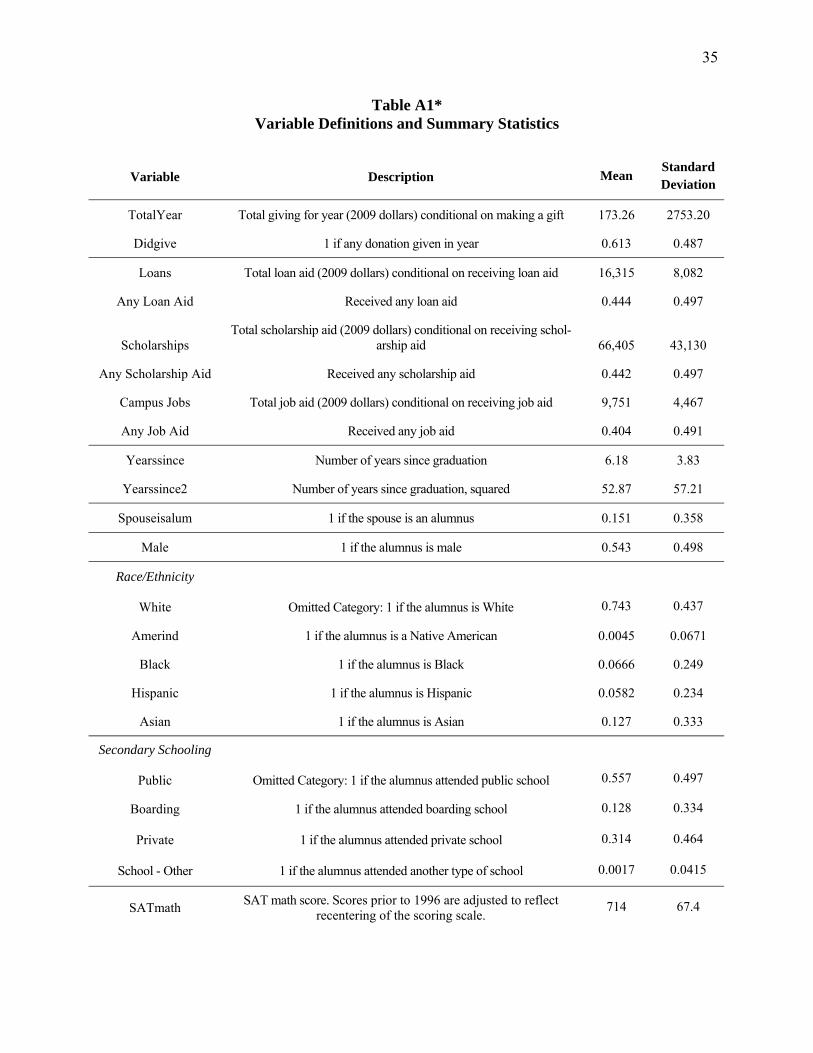
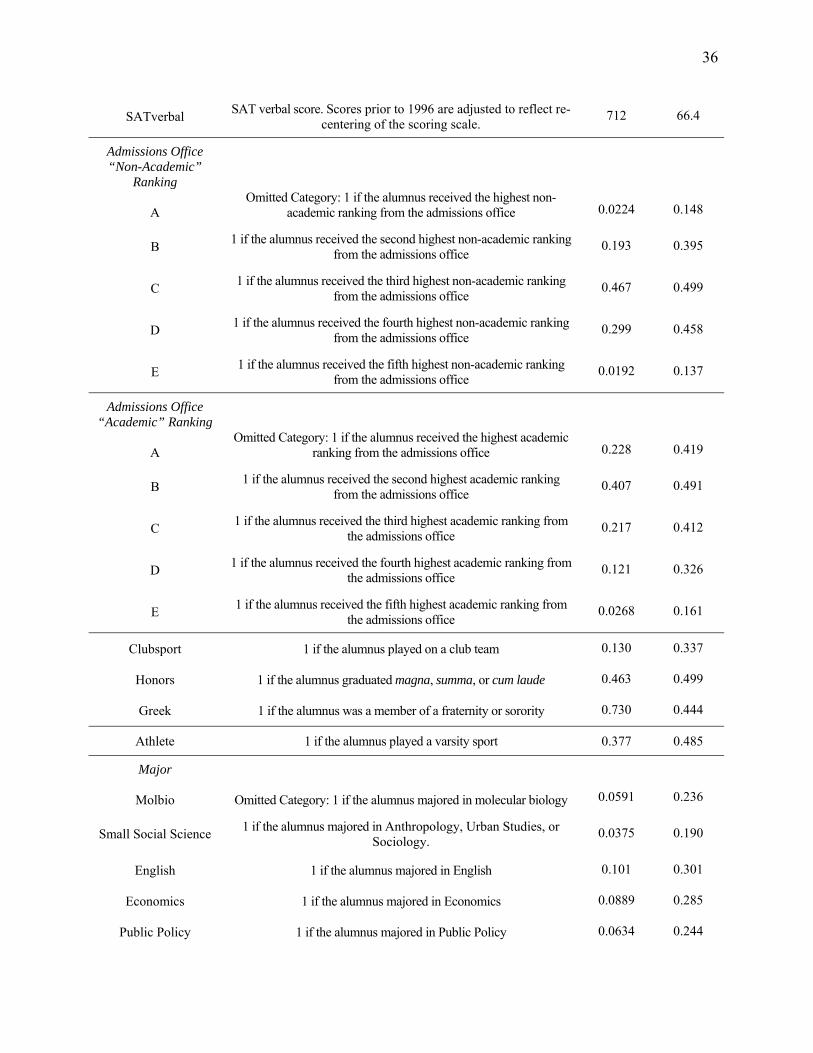
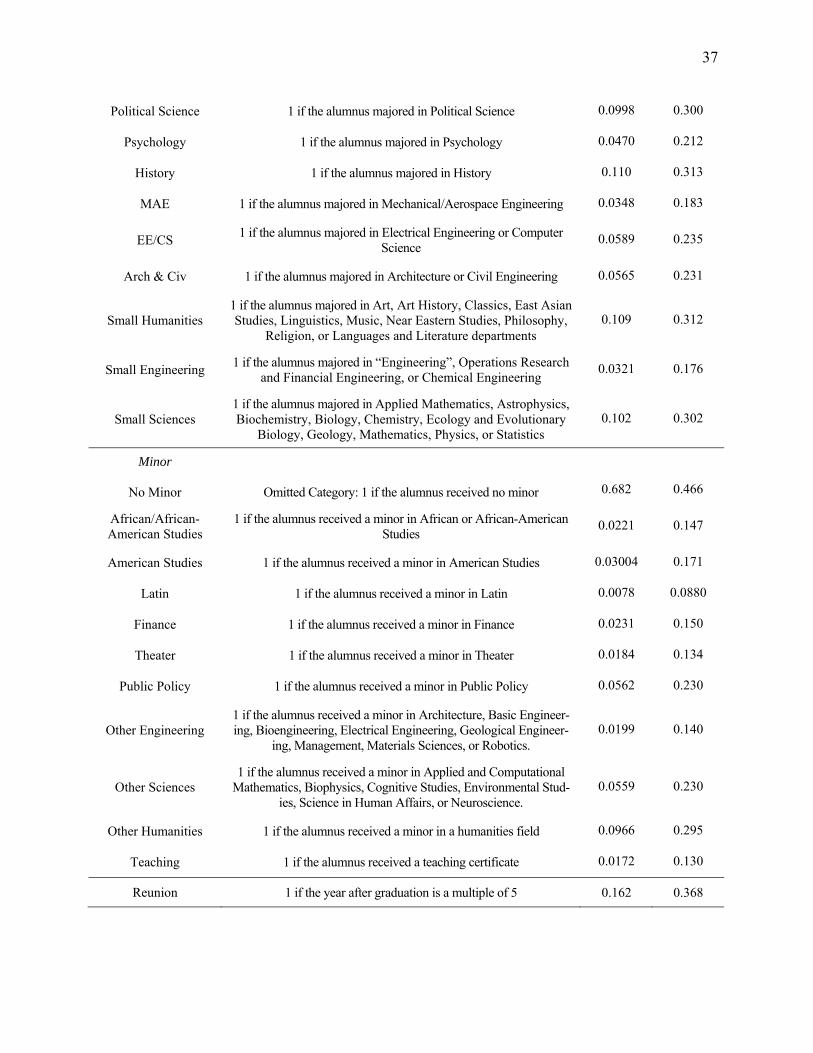
office as well as other jobs such as research assistants.7 Appendix Table A1 shows the average
amounts per alumnus of scholarship, job, and loan aid during students’ four years conditional on
each source of aid being positive. The unit of observation for this table is a yearly giving oppor-
tunity as defined above. These statistics differ somewhat from those discussed above, for which
the unit of observation is the individual student.
We also have information on the alumnus’s undergraduate extracurricular activities, post
graduate education, residence, whether he or she is married to another graduate of Anon U,8 SAT
scores, academic honors, ethnicity, type of high school, summary evaluations made by the Ad-
5 A comparison of giving behavior in the first 5 years after graduation before and after the policy shows very little effect. However, given the problems with identifying the impact and the small number of affected cohorts in our sample, one cannot make too much of this finding. 6 The median values for loan, scholarship, and job aid, respectively, are $15,961; 69,503; and $10,544. 7 Income from campus jobs not arranged by the financial aid office is recorded only for aid recipients; a student not on financial aid who worked as, say, a research assistant would not have his or her income reported here. Infor-mation on off-campus jobs is not available. 8 Except in unusual situations, half of each gift from married alumni couples is attributed to each spouse.
8
missions Office during the application process, major and minor course of study, and grade point
average. Summary statistics for these other variables are included in Table A1 as well.
4. Econometric Specification and Results
4.1 Econometric Specification
Previous empirical work on the determinants of giving suggests that variables can differ-
ently affect the decision whether or not to donate — the extensive margin — than on the decision
how much to donate, conditional on making a gift — the intensive margin.9 A statistical model
that allows for this possibility is therefore needed. We assume that each alumnus first chooses
whether or not to make a gift and then, conditional on making a gift, decides how much to do-
nate. Following Huck and Rasul [2007], a natural specification is a hurdle model. In our context,
the first step is to estimate a linear probability model for whether or not the individual makes a
gift.10 The second step is to use ordinary least squares on the positive observations to analyze the
decision about how much to give. In order to make causal inferences from the second-stage esti-
mates, one must assume that the second stage is conditionally independent of the first. We dis-
cuss this further below. We correct for correlation among the error terms for any given individual
with a clustering procedure.
An alternative two-step procedure, suggested by Heckman [1979], can also be used to es-
timate the amount of giving, conditional on it being positive. Heckman’s model augments the
OLS equation in the second stage with the inverse Mills ratio. There is some controversy with
respect to which estimator is superior (Leung and Yu [1996]); hence, a sensible approach is to
9 Thus, for example, it would not be appropriate to use a Tobit model, which constrains the marginal effect of a given variable on the probability of giving and the marginal effect on the amount given to be the same up to a constant of proportionality. 10 It is more common to use a probit model for this first stage. However, the interpretation of the marginal effects in the presence of quadratic terms and interactions is less intuitive in non-linear models than in the linear probability model, so we prefer the latter. This issue is described in more detail below.
9
estimate the model both ways. We show below that our substantive results are essentially un-
changed when we use Heckman’s method.
As is typical, a few relatively large gifts account for a disproportionate amount of Anon
U’s donations. For example, in our analysis sample, the top one percent of gifts in 2009 account-
ed for 50.8 percent of total giving. These large donations are critical to the university, so it is im-
portant to determine whether financial aid packages affect the likelihood that an individual
makes such gifts. We therefore also use a linear probability model to estimate the probability that
the alumnus is a “class leader” in a given year, where a class leader is defined as someone who
donated an amount greater than or equal to the 90th percentile of gifts in his or her class. Given
that, by construction, the mean of the left hand side variable in this model is about 0.10, the line-
ar probability model might not be appropriate. In Section 5 below we show that our substantive
results are very much the same when we estimate the class leader model using a probit.
Another issue relates to the fact that our data contain a few very large outliers. For exam-
ple, there are 11 gifts greater than $100,000 in our sample. We therefore use the logarithm of the
amount of giving on the left hand side of the equation for the intensive margin. As an additional
check to make sure that outliers are not driving our results, we estimate the OLS equation with
the top one percent of the observations eliminated. In Section 5 we show that the substantive re-
sults with respect to the impact of financial aid are unchanged.
A major concern is how to characterize the structure of undergraduates’ financial aid
packages. The conjectures about the effects of financial aid discussed above suggest that we need
a specification that allows us to address the following questions: does the receipt of a particular
form of aid per se have an effect on giving; what is the marginal effect of receiving additional
aid of a particular type; and what is the overall effect of a given aid package? With that in mind,
10
we adopt a somewhat novel modeling strategy, and include both a dichotomous variable that
takes a value of one if the individual received any aid of a given type, as well as a quadratic in
the amount of that kind of aid.
The dichotomous term allows the receipt of a particular form of aid per se to affect sub-
sequent giving. Fundraising professionals are keenly aware of this mechanism. The Vice-
President for Development at Boston University, discussing it in the context of the impact of col-
lege loans on giving behavior, expressed concern about a “psychological debt burden. Whether
your debt is $200 or $200,000, you don’t tend to write checks as long as you have it”
(Bombardieri [2007]). It is also possible that students who take out loans have lower family in-
comes than their peers, or perhaps develop less of an affinity for the university when they are
undergraduates. We discuss the interpretation of the coefficient on the indicator variable in more
detail below.
The quadratic terms permits nonlinearity in the impact of the amount of the form of aid.
We choose a quadratic over a logarithmic function because, for many individuals, the amount of
aid is zero. In order to assess the robustness of the quadratic specification, we experimented with
a cubic, and found that it did not significantly affect the explanatory power of the equation.11
In addition, we include on the right hand side a series of alumni characteristics that have
been shown in previous studies to influence giving.12 These include years since graduation, gen-
der, ethnicity, SAT scores, ranking of the candidate by the admissions office when they applied
to Anon U, course of study, and post-baccalaureate education. The literature also shows that
11 We also experimented with a step function. The relationship between the financial aid variables and giving behav-ior was qualitatively similar to those for the quadratic. However, there was some instability to the coefficients. If one uses a substantial number of categories, there are relatively few observations in any given category, but as one de-creases the number of categories, significant differences in effects within the categories are ignored. 12 See, for example, Cunningham and Cochi-Ficano [2002], Shulman and Bowen [2001], Lara and Johnson [2008], and Holmes [2009]).
11
alumni giving is heavily influenced by the affinity they develop for their schools as undergradu-
ates. Participation in varsity sports and membership in fraternities are two ways in which affini-
ties develop (Clotfelter [2003], Monks [2003], Meer and Rosen [2009]); we include variables
relating to these activities. Summary statistics for these variables are recorded in Table A1. The
model also includes year, class, , and location effects. The year effects reflect the impacts of the
business cycle, the stock market, and so on.13 The year effects also account for yearly differences
in the size of Anon U’s fundraising staff and its fundraising expenditures. The class effects con-
trol for common influences on alumni in the same class, such as the political milieu when they
were undergraduates, the presence of certain professors or administrators, and so on.
Unfortunately, our data include no direct information on income, an important determi-
nant of alumni giving (Shulman and Bowen [2001, p. 404]). To address this issue, we begin by
noting that a number of the variables in our basic specification are correlated with the individu-
al’s income, including gender, ethnicity, college major and grade point average, advanced de-
grees, years since graduation, and location. In addition, as noted below, we augment the basic
model with a number of variables that are closely related to permanent income, including the
sector in which the individual works, inter alia, and find that our substantive results are not sen-
sitive to their inclusion.
4.2 Results
4.2.1 Probability of Giving
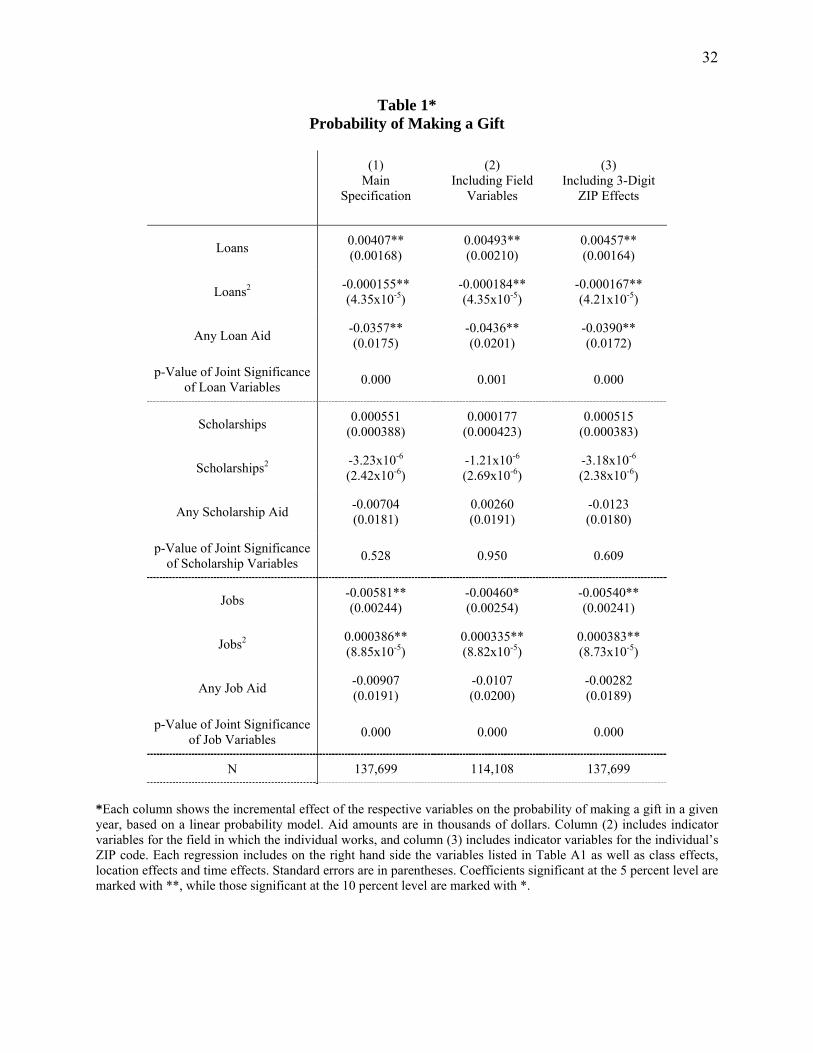
Table 1 shows the effects of the financial aid variables on the probability of making a
gift. For each type of aid, we exhibit the estimated coefficients and standard errors for both the
linear and quadratic terms, and for the dichotomous variable indicating whether the individual
13 Bristol [1991] emphasizes the role of the stock market and Ehrenberg and Smith [2001] document the importance of macroeconomic conditions.
12
received that form of aid at all. In addition to the financial aid variables in the table, the models
include the other right hand side variables mentioned in the previous section, which are
suppressed for brevity.
To begin, consider the results for loans in the first panel. The coefficient of -0.0357 on
the dichotomous variable Any Loan Aid in the first column means that receiving a loan in itself
lowers the probability that an alumnus makes a gift by about 3.6 percentage points. Given that
the mean rate of giving is about 62 percent, it seems fair to characterize this as a meaningful
although not huge effect.
The positive linear term and negative quadratic term imply that, in absolute value, the
negative effect on the probability of giving first decreases and then increases with the amount of
the loan. Indeed, when the function reaches its maximal value (when loans are around $13,000),
the overall effect is a much weaker, -0.88 percentage points (s.e. = 1.12 percentage points). The
negative quadratic term then begins to dominate and by the time the loan amount is about
$23,000, the effect is once more significantly different from zero at the 5 percent level.
Essentially, receiving small or large loans reduces the probability of giving, while moderate-
sized loans have little effect. While we cannot definitively say what is driving these results, a
possible explanation is that the annoyance effect of small loans is diminished by gratitude for
moderate amounts of aid, while large loans feel like a burden.
One potential reason that student loans reduce the likelihood of donating is that students
who take out loans subsequently have lower incomes than other alumni, perhaps because they
come from relatively low-income families, and have less wealth as well as fewer family connec-
tions to help them professionally. It follows that to the extent donations to Anon U are a normal
good, alumni who took out loans will be less likely to make donations. In other words, if loan aid
13
as an undergraduate is correlated with income as an alumnus, then the omission of income from
the right hand side might bias the coefficients on loan aid (and other kinds of aid as well).14
While we do not have income in our data, we do have several variables that are correlated with
income. Specifically, for a subset of our alumni (114,108 observations, representing 11,124
alumni), we have information that is closely related to permanent income, the fields in which
they work. The fields of education, finance, health care, and law are highly represented. The
complete distribution of fields across the sample is available upon request.15 If income effects are
behind the estimated effects of the financial aid variables, then including these correlates of in-
come in the model should change the coefficients on the financial aid variables.
The results when the model is estimated with the field variables are shown in the second
column of Table 1.16 The coefficients on the field variables, which are not reported in the table,
are jointly significant in all specifications17 and their signs and magnitudes are as expected if
they are correlates of income (although they could certainly be picking up other effects as well).
For example, the coefficient for working in finance on the conditional amount given is 0.407
(s.e. = 0.027), while the coefficient for working at a nongovernmental organization is -0.090 (s.e.
= 0.042). A comparison with the estimates for our basic model in the first column indicates that
they are essentially unchanged. This is consistent with the notion that income effects are not
driving our results on the impact of loan aid.
14 A related possibility is that repayment of loans diminishes disposable income, which also could reduce donations. We present evidence below that this phenomenon is unlikely to explain our findings. 15 Due to lack of reliable data regarding the start- and stop-dates of occupation and field, these variables indicate whether the alumnus ever worked in that field or occupation, rather than whether he or she worked in it during the particular year of observation. An alumnus can be listed as having worked in multiple fields, so these categories are not mutually exclusive. 16 In order to benchmark this exercise, we estimated the basic model (i.e., the model without the occupation and field variables) using the smaller sample comprised only of the observations with the occupation and field variables. These results, too, were substantively the same as those in Column (1). 17 In both the models for the probability of making a gift and for the conditional amount given, the null hypothesis that the coefficients on the field of work variables have no effect is rejected at p = 0.0000.
14
To investigate this issue further, we utilize information in the dataset on ZIP code, anoth-
er correlate of income. We re-estimate the basic model including a dichotomous variable for
each three-digit ZIP code.18 The zip code variables are jointly statistically significant in all speci-
fications.19 The results on the coefficients of interest, which are in the third column, are not sub-
stantively different from those in column (1) either. A related approach is to include ZIP-code-
level measures of income as regressors instead of three-digit ZIP code dichotomous variables. To
the extent that an alumnus’s income varies with the income in her zip code area, this provides a
way, albeit a rough one, to account for income effects. Implementing this strategy is difficult be-
cause income data are unavailable for some areas and we lack consistent income data on a yearly
basis. Nevertheless, we obtain median income data from the 2000 Census and the 2008 IRS Sta-
tistics of Income (SOI) and, separately, map them into each alumnus’s ZIP code in each year.
We then re-estimate our basic models, first augmented with a quadratic in the Census measure,
and then with the SOI measure. For both measures, the income variables are statistically signifi-
cant and imply that giving is a normal good, a result consistent with intuition as well as the em-
pirical literature on donative behavior (Andreoni [2006]). The implied income elasticity of giv-
ing (0.15) is lower than most previous estimates, but this is expected given that our ZIP-code
measure of individual income is clearly measured with error. In any case, neither variable’s in-
clusion has a substantial effect on the coefficients on the financial aid variables.
The starting point for our final check for the relevance of income effects is the well-
known observation that the incomes of children and their parents are positively correlated. (See,
for example, Behrman and Taubman [1990].) Presumably this correlation is stronger for relative-
ly young individuals, such as the members of our sample, the oldest of whom are about 38 years
18 For alumni living abroad, we include indicators for their country. 19 In both the models for the probability of making a gift and for the conditional amount given,, the null hypothesis that the three-digit ZIP code effects are jointly zero is rejected at p = 0.0000.
15
old at the end of the sample period. Because aid recipients must submit evidence of their finan-
cial need, we know parental income for alumni who received financial aid as undergraduates.
While this is clearly not a random subset of our analysis sample, it is of some interest to see
whether the inclusion of parental income for members of this group affects our conclusions with
respect to the impact of financial aid.20 To construct a benchmark for this analysis, we re-
estimate our basic model from column (1) for this sample, and then augment the model with par-
ents’ income. In results available upon request, we find that the coefficients on the financial aid
variables are not affected substantially. Given the particular nature of this sample, and that paren-
tal income is only a proxy for the alumnus’s income, we cannot argue too strongly that this exer-
cise rules out the presence of income effects. Nevertheless, the preponderance of the evidence
suggests that they are not driving our results.
We turn next to the results for scholarships in the second panel. The intercept, linear, and
quadratic terms in column (1) are all very small in magnitude and imprecisely estimated. One
cannot reject the hypothesis that scholarship aid has no effect on the likelihood of making a
donation. Looking across the columns, we see that including our additional correlates of income
does not change the substantive findings. As before, income effects do not appear to be behind
the results.
The last panel has the results for campus jobs. The intercept suggests that receiving this
form of aid per se has no discernible impact on the probability of making a gift. The amount of
aid has a small negative effect (roughly 0.58 percentage points per thousand dollars) on the
probability of giving until about $7,500, at which point the positive quadratic term dominates.
The effect on giving at this point is a statistically significant but relatively small -0.031 (s.e. =
20 For most of the analysis sample, we have the students’ ZIP codes at the time of application to Anon U, a variable that is correlated with family income. The inclusion of indicators for family three-digit ZIP code does not materially affect the estimates of the coefficients on the financial aid variables.
16
0.014). Aid through campus jobs does not appear to materially affect the likelihood of making a
contribution.
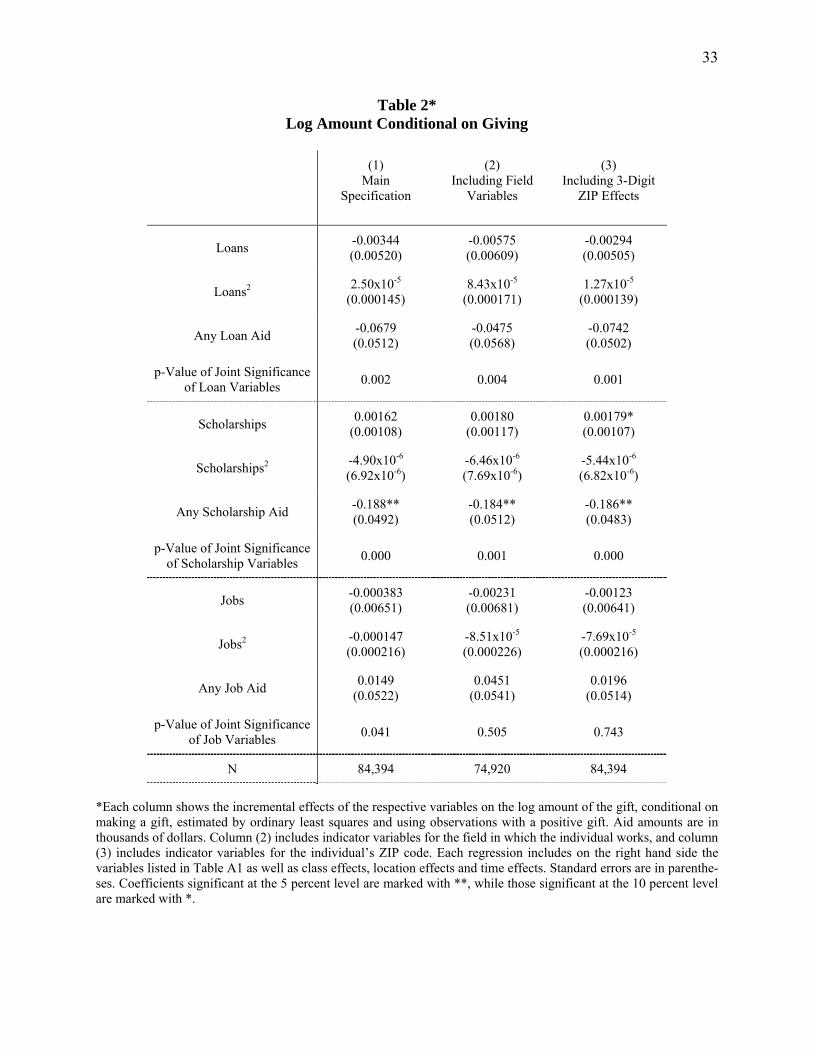
4.2.2 Amount of Giving
Table 2 shows the estimates for the log of the conditional amount of giving. In the first
panel, none of the individual coefficients on aid from loans is significant, but the set of loan
variables is jointly significant at p = 0.002. The point estimate of the intercept for loans, -0.0679,
implies that the receipt of loan aid reduces donations by about 6.6 percent, but it is not statistical-
ly significant. The negative linear term dominates over the entire range of loan values, and the
overall (negative) effect becomes statistically significant at around $3,000 of loans. As discussed
above, one possible explanation is that alumni who took out larger loans as undergraduates have
relatively low incomes. However, as was the case in Table 1, a look across the columns indicates
that augmenting the model with various correlates of income has little effect on the estimates, so
income effects are unlikely to be at work.
In the second panel of Table 2, the striking result is the coefficient on Any Scholarship
Aid, which indicates that the receipt of a scholarship in itself lowers giving by about 18 percent,
an effect that is precisely estimated. The negative effect of receiving a scholarship per se is
attenuated by the positive though imprecisely estimated linear term. Indeed, at the conditional
mean of $71,000, the estimated decrease is only half as large, -0.092 (s.e. = 0.043). It becomes
insignificantly different from zero (though still relatively large in magnitude) at around $90,000
of scholarship aid, and at the conditional 99th percentile of scholarship aid, $170,000, the effect is
-0.045 (s.e. = 0.071). Thus, the absolute value of the negative effect of scholarships on the condi-
tional amount of giving tends to fall with the size of the scholarship.
17
The third panel shows that aid from campus jobs does not have a statistically discernible
effect on the amount of giving.
Note that we can combine the results for the probability of giving in Table 1 with the re-
sults for conditional amounts of giving in Table 2 to estimate the effects of the various forms of
financial aid on the average amount of giving.21 These results are presented in Appendix Table
A2, which shows the marginal effect of additional aid of a given type, evaluated at the mean,
along with the effect of going from no aid of that type to a positive amount. For instance, Col-
umn (1) shows that an additional thousand dollars of loan aid, evaluated at the mean, has a statis-
tically insignificant effect of about half a percent on the average gift, while receiving any loan
aid reduces it by about seventeen percent, a statistically significant effect.
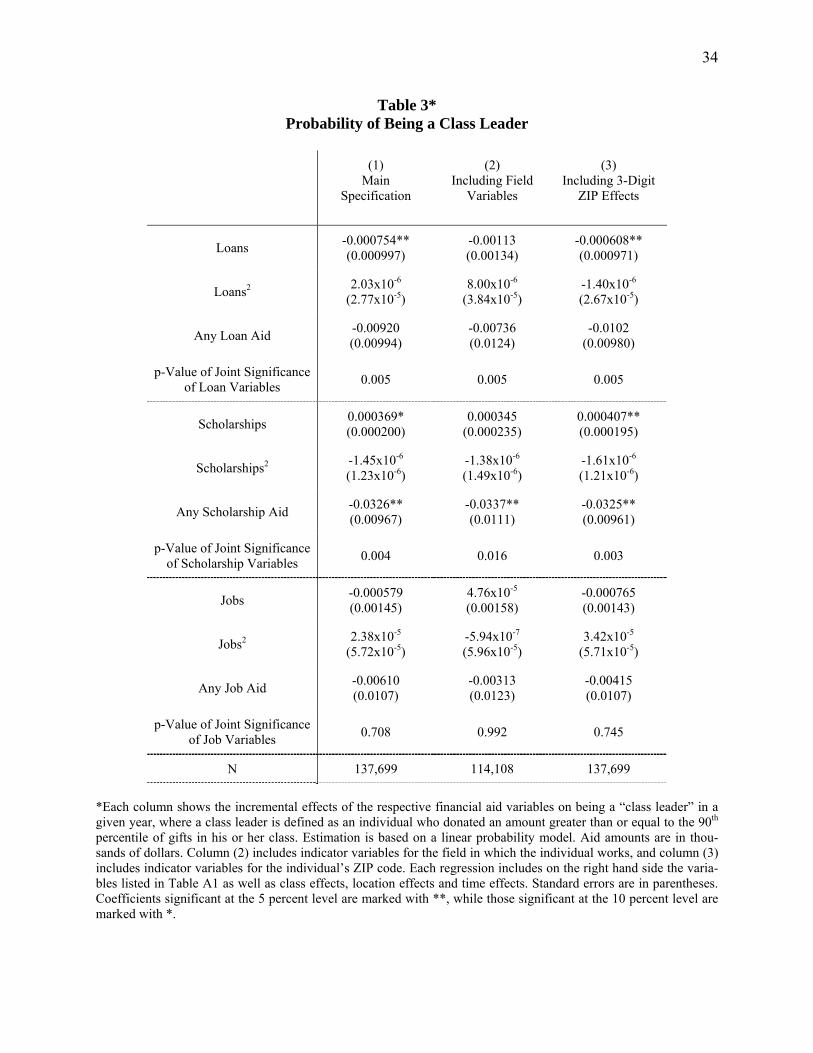
4.2.3. Class Leadership
Table 3 shows the estimates for class leadership. To put these figures in perspective,
recall that by construction, the mean value of the probability of being a class leader is about 0.10.
Hence, the point estimate of the loan intercept in column (1) of the first panel, 0.9 percentage
points, is substantial, although imprecisely estimated. The quadratic term is minuscule, and the
linear term suggests that each thousand dollar increase in loans reduces the probability of being a
class leader by about 0.07 percentage points. While this effect is small for a marginal thousand
dollar increase, the overall effect of loans taking into account all three coefficients becomes
statistically significantly different from zero at around $6,000 of loan aid.
The impacts of scholarship aid on the likelihood of being a class leader are in the second
panel. From Column (1), the effect of receiving a scholarship is large, about negative 3.3
21 Denote the amount of giving as Y, and the vector of right hand side variables as X. Then the first stage of the estimation gives results for Pr[Y>0|X] and the second stage gives E[Y|X,Y>0]. The unconditional value of giving, E[Y|X], is Pr[Y>0|X]*E[Y|X,Y>0]. The marginal effects, ∂E[Y|X]/∂X, are straightforward to compute, and standard errors are obtained using the delta method.
18
percentage points, and precisely estimated. But at the conditional mean of scholarship aid, one
cannot reject the hypothesis that the effect on being a class leader is zero; the overall effect is -
0.014 with a standard error of 0.009. In the third panel, we see that aid from campus jobs has no
discernible effect on the probability of being a class leader. As was the case in Tables 1 and 2, a
glance across columns indicates that the results are not sensitive to the addition of correlates of
income.
4.3 Interpreting the Results
We begin with the results for loans. Taking out a student loan per se reduces both the
probability an alumnus makes a gift and its size, conditional on making a gift. This finding is
consistent with the belief of development professionals, mentioned above, that taking on debt
creates a kind of psychological burden that is independent of the amount..
We have argued that this finding is probably not because undergraduates who take out
loans subsequently have lower incomes than their classmates. Another observation consistent
with this notion is that the intercept term in the model for the probability of making a gift is
negative, and dominates the positive linear term for relatively small loans. In short, smaller loans
have a more pronounced negative effect on giving than medium-sized loans, though large loans
depress giving on both the intensive and extensive margins. This nonlinear relationship is diffi-
cult to reconcile with a predominant role for income effects.
Another possible explanation for the negative effect of loan aid on the probability of do-
nating is that loan recipients felt excluded from the majority campus culture when they were
undergraduates, hence reducing their affinity for Anon U. Such unobserved heterogeneity might
bias our parameter estimates, and the standard method for dealing with it, including fixed effects,
is not open to us because alumni’s financial aid histories are time invariant. To explore this issue,
19
we begin by noting a robust finding in the literature, that individuals who participate in fraterni-
ties/sororities and varsity sports develop relatively strong affinities to their colleges, ceteris pari-
bus.(Clotfelter [2003] and Monks [2003]). If so, the negative effect of loans on giving should be
less in absolute value for individuals who were involved in these activities, other things being the
same. We augmented our basic models from the first columns of Tables 1, 2, and 3, respectively,
with interactions between the financial aid variables and both participation in fraterni-
ties/sororities and in varsity athletics. The interaction terms were neither individually nor jointly
significant. Hence, the negative effect of loans on the probability of making a gift does not ap-
pear to be due to alienation of loan recipients from the campus culture, at least to the extent the
majority culture can be characterized by these variables.
A final possibility is that, as suggested above, paying back loans creates an “annoyance
effect.” Given that the results do not seem to be driven by income or ties to the majority social
culture, it is difficult to put forward an explanation other than that loan recipients resent the fact
that their aid came in the form of loans rather than grants, and consequently, give less to Anon U.
Turning next to the scholarship results, we have already argued that the negative effects
in Tables 2 and 3 are probably not because scholarship recipients have lower incomes than their
classmates. Another problem with an income-effect interpretation is that the negative effect of
receiving a scholarship on the amount given falls (in absolute value) with the size of the
scholarship. Indeed, at approximately $85,000 in scholarships (about the 86th percentile of the
unconditional distribution in our data), the combined effect of the amount of scholarships and the
indicator for any grant aid is not even statistically different from zero at the 5 percent level.22
Given that scholarships at Anon U are entirely need-based, this means that scholarship students
22 At about $105,000 in scholarships (the 91st percentile of the unconditional distribution), it no longer significant at the 10 percent level.
20
from lower-income families give more than those from higher-income families, ceteris paribus.
To the extent that children’s incomes are related to their parents’ incomes, then if income effects
were driving the results, we would expect just the opposite.
Another conjecture is that scholarship recipients might feel alienated from the majority
culture at Anon U, and hence develop less of an affinity for the institution. However, just as was
the case for loan recipients, we find no evidence that alumni who likely developed relatively
strong affinities to the institution react differently to receiving scholarships than other scholar-
ship recipients. Moreover, one would expect lower affinity to be reflected in a lower probability
of giving, not just a smaller amount conditional on giving. Hence, we are inclined to discount
this explanation.
How, then, can we account for the negative effects of scholarships on subsequent giving?
Perhaps scholarship recipients target their donations to other institutions that extend grant aid to
students who want to attend college, such as Scholarship America or the United Negro College
Fund. However, given that we have no information on alumni’s other charitable donations, this
notion remains conjectural.
Does the observation that scholarship recipients give less than others mean that one
should reject the notion that they want to “give back?” Not necessarily. As noted above, the
negative impact on conditional giving to Anon U falls as the amount of the scholarship increases;
that is, those who receive more generous aid as undergraduates give more as alumni, conditional
on making a gift. In this limited sense, then, our data are consistent with the gift exchange hy-
pothesis.
21
5. Alternative Specifications
In this section we estimate several alternative specifications of the model in order to
assess the robustness of our results.
5.1 Outliers
As is the case at most universities, a few large gifts account for a disproportionate share
of total donations to Anon U. As noted earlier, the top one percent of positive gifts in our sample
accounted for about half of the total in 2009. This raises the possibility that our results for
amounts given in Table 2 are driven by just a few observations. Our use of the log rather than the
level of giving on the left hand side attenuates the impact of outliers, but as another check, we re-
estimate the models deleting the top one percent of donations in each column from the sample.
These results, available on request, have similar signs and magnitudes to their counterparts in
Table 2. Hence, outliers do not appear to be affecting our results for giving on the intensive
margin.
5.2 Demographic Differences Previous empirical research indicates that various aspects of altruistic behavior can differ
substantially by demographic group. (See, for example, Andreoni and Vesterlund [2001],
Andreoni [2006], and Meer [2011].) This raises the possibility that the impact of financial aid
might as well. We therefore investigated whether our parameter estimates vary by race, gender,
and age. To do so, we augmented our basic models from the first columns of Tables 1 through 3,
respectively, with a series of terms interacting the financial aid variables first with indicator
variables for race, then gender, and finally age.
The detailed results are presented in the Appendix. The main substantive findings can be
summarized as follows:
22
5.2.1 Race
One cannot reject the joint hypothesis that the interactions between the race and financial
aid variables are zero. However, some of the interaction terms are individually significant. For
instance, the effect of loans on the probability of giving is different for black alumni than other
ethnic groups; the linear term is negative while the intercept is positive (the latter is significant at
p = 0.08). Receiving a scholarship does not have any substantial effect on the size of a gift for
Asian alumni. With a few other exceptions, there is little difference across races in the effect of
financial aid on alumni giving.
5.2.2 Gender
The interaction terms between gender and the financial aid variables are jointly
significant for the case of scholarship aid in the model for giving on the extensive margin;
otherwise, they are not. The most striking difference is that the negative effect of receiving a
scholarship is especially pronounced for alumnae, particularly on the probability of being a class
leader. One possible interpretation is that relatively low-income women selectively mate with
relatively low-income men and are therefore less likely to donate for household income-related
reasons. To investigate this possibility, we augmented our basic specification with interactions
between the gender and financial aid variables with marital status. We found that these interac-
tion terms were not statistically significant.23 This finding is consistent with the notion that in-
come effects are not driving our results.
5.2.3 Age
For purposes of examining whether age affects the response to financial age packages, we
create a dichotomous variable that equals one if an alumnus graduated 10 or more years ago and
23 The interactions of marital status, gender and the loan variables are jointly significant only at p = 0.311, with scholarships at p = 0.978, and with campus jobs at p = 0.131. Note that in our data we know only if the individual was ever married, not the date on which he or she married. Hence, the marital status variable is measured with error.
23
zero otherwise, and interact it with the financial aid variables. Our sample for this specification
consists only of individuals who graduated in 1999 or earlier, whose giving behavior we observe
both before and after the 10-year mark. One cannot reject the joint hypothesis that the
interactions between the financial aid and age variables are zero. This result may be a bit
surprising. One can imagine, for example, that any gift exchange motive associated with being a
scholarship student either increases (because of nostalgia) or decreases (because of forgetfulness)
with age. Similarly, any negative feelings associated with loan obligations might be less after the
loans are paid off. However, the “annoyance effect” associated with receiving loans appears to
persist beyond the repayment period.
This finding also relates to our previous discussion of whether our results on the impact
of loans are due to income effects. We focused on the possibility that students who receive loan
aid have lower incomes as alumni. But note that making loan payments reduces an individual’s
disposable income, ceteris paribus. Hence, if income effects were dominant, we would expect
the negative effect of loans to disappear or at least be attenuated after they are paid off. However,
we find no statistically significant difference in the impact of loan aid on the donative behavior
of individuals who have been out of school for more than ten years (and have generally paid off
their loans) and those who are younger.
There is clearly some arbitrariness in our selection of 10 years as the cutoff between
“young” and “old” alumni. We therefore estimated a series of specifications varying the cutoff
for “young” from seven to twelve years.24 While of course the coefficients differ somewhat,
there are no dramatic differences. To explore this issue further, we interacted the aid variables
with years since graduation. None of the sets of interaction terms is jointly significant, except for
24 Thus, for example, for an eight-year cutoff, we estimate whether the impact of financial aid on giving by alumni who are out eight or more years in 2009 depends on whether, in a given year, they have been out at least eight or fewer than eight years.
24
the campus aid variable in the equation for the log of the amount of giving, but even here, the
interaction terms are extremely small relative to the main effects. Our finding with respect to the
impact of age on the financial aid effects appears to be fairly robust.
5.3 Alternative Econometric Specifications
We have used the convenient linear probability model to estimate the equations for the
dichotomous left hand side variables, DidGive and ClassLeader. As is well-known, a possible
problem with the linear probability model is that the predicted values may be outside the range
zero to one, which is especially likely to be an issue when the mean of the variable is close to
zero or one. For DidGive, whose mean is about 0.61, this is unlikely to be an issue.25 In fact,
when we estimated the basic model of column (1) in Table 1 using a probit model, we found es-
sentially identical average marginal effects.
Given that, by construction, the mean of ClassLeader is about 0.10, the problem is poten-
tially a greater concern for those estimates. When we estimated the ClassLeader model of Col-
umn (1) in Table 3 using a probit, we found the following average marginal effects: -0.00092
(s.e. = 0.00084) for loans, 0.00042 (s.e. = 0.00022) for scholarships, and -0.00115 (s.e. =
0.00151) for campus jobs. These are not dissimilar to the average marginal effects calculated
from the model in Column (1) of Table 3: -0.00072 (s.e. = 0.00064) for loans, 0.00028 (s.e. =
0.00013) for scholarships, and -0.00039 (s.e. = 0.00106) for campus jobs.
Another econometric issue relates to the use of the hurdle model. An alternative estimator
augments the OLS equation for the amount given with the inverse Mills ratio generated by the
first stage probit (Heckman [1979]). This model explicitly allows for correlation between the er-
rors in the first and second stage equations. The econometric literature indicates that the desira-
bility of this estimator relative to the hurdle model is unclear. In particular, Leung and Yu [1996] 25 Fewer than one percent of the predicted values are outside the range zero to one.
25
observe that even if the errors in the true model are correlated, the hurdle model may, under cer-
tain circumstances, yield better estimates. Also, in the absence of variables that can be excluded
from the second stage but still affect the probability of giving, which is our situation, identifica-
tion comes entirely off of functional form assumptions.
In any case, it seems sensible to re-estimate the model using Heckman’s approach to see
if the substantive results are affected. They are not. For instance, using the selection model, the
effect of receiving a loan on the likelihood of making a gift is -3.7 percentage points, and the ef-
fect on the conditional size of the gift is -6.58 percent. The comparable results from our basic
specification are -3.6 percentage points and -6.56 percent, respectively. The other variables are
similarly close in magnitude. Hence, our results are robust with respect to this change in econo-
metric specification.
6. Conclusion
College and university fundraisers are justifiably concerned about the impact of under-
graduate financial aid packages on future gift-giving by alumni. Do students who receive loans
or who need to take campus jobs give less in the future because they are resentful? Do scholar-
ship recipients donate more because they want to “give back?” We have analyzed micro data
from a selective research university to address these questions. We find that the mere act of tak-
ing out a student loan decreases the probability that an alumnus contributes to the university,,
and that large student loans reduce future donations, conditional on making a gift. Scholarship
aid reduces the amount of alumni giving, conditional on making a gift, but has little effect on the
probability of making a gift. Scholarship recipeints are also less likely to be in the top 10 percent
of donors in their class in a given year. We find no evidence that the negative effects of loans and
scholarships on subsequent giving arise because aid recipients have lower post-graduation in-
26
comes than their peers. Nor is there any evidence that scholarship recipients give less because
they felt alienated from the majority culture on campus when they were undergraduates. We con-
jecture that their charitable giving might be focused on organizations other than their relatively
wealthy alma mater.
Our results provide mixed evidence for the gift exchange model. As just noted, it does
not appear that gratitude induces alumni who received financial aid give back to the university
more generously than alumni who received no aid. Indeed, scholarship recipients give less than
their classmates, ceteris paribus. However, within the set of scholarship awardees, those who
received larger grants make larger donations as alumni, providing some evidence for a gift ex-
change motive. In any case, to the extent our findings generalize, universities should not expect
that generous financial aid will pay for itself through larger donations in the future. Of course,
there remain myriad reasons to maintain these policies apart from the financial status of the uni-
versity.
Another caveat is that our results are based on data from a single selective research
university. Consequently, one must be cautious about assuming that the results would apply to
other institutions as well. Still, it seems safe to say that university fundraisers’ belief that
financial aid packages affect future alumni giving is well founded.
27
References
Alpizar, Francisco, Fredrik Carlsson, and Olof Johansson-Stenman. “Anonymity, Reci-procity, and Conformity: Evidence from Voluntary Contributions to a National Park in Costa Ri-ca.” Journal of Public Economics 92, 2008, pp. 1047-1060.
Andreoni, James. “Philanthropy.” in Kolm, Serge-Christophe and Jean Mercier Ythier,
Handbook of the Economics of Giving, Altruism, and Reciprocity. Vol. 2, Elsevier, 2006, pp. 1202-1269.
Andreoni, James and Lisa Vesterlund. “Which is the Fairer Sex? Gender Differences in Altruism.” Quarterly Journal of Economics. Vol. 116, No. 1, p. 293. Feb 2001.
Baade, Robert A. and Jeffrey O. Sundberg, What Determines Alumni Generosity?” Eco-nomics of Education Review, volume 15, no. 1, 1996, pp. 75-81.
Behrman, Jehr R. and Paul Taubman, “The Intergenerational Correlation between Chil-
dren’s Adult Earnings and Their Parents’ Income: Results from the Michigan Panel Survey of Income Dynamics,” Review of Income and Wealth 36, No. 2, June 1990, pp. 115-127.
Bristol, Ralph, “How Much Will Alumni Give in the Future?” Planning for Higher Edu-
cation 20, Winter 1991-92, pp. 1-12. Bombardieri, Marcella. “Colleges Fear Debt Puts Damper on Donations.” The Boston Globe. July 9, 2007.
Clotfelter, Charles, “Who Are the Alumni Donors? Giving by Two Generations of Alum-ni from Selective Colleges,” Nonprofit Management and Leadership 12, Winter 2001, pp. 119-138. Clotfelter, Charles, “Alumni Giving to Elite Private Colleges and Universities,” Econom-ics of Education Review 22, 2003, pp. 109-120. College Board, Advocacy and Policy Center, Trends in Student Aid 2010, http://trends.collegeboard.org/downloads/Student_Aid_2010.pdf
Cochi-Ficano, Carlena and Brendan Cunningham, “The Determinants of Donative Reve-nue Flows from Alumni of Higher Education: An Empirical Inquiry," Journal of Human Re-sources 37, no. 3, Summer 2002, pp. 540-569.
Council for Aid to Education. “Colleges and Universities Raise $28 Billion in 2010.” February 2, 2011. http://www.cae.org/content/pdf/VSE_2010_Press_Release.pdf.
28
Dynarksi, Susan, “Hope for Whom? Financial Aid for the Middle Class and Its Impact on College Attendance,” National Bureau of Economic Research, Working Paper No. 7756, June 2000.
Ehrenberg, Ronald and Christopher L. Smith, “The Sources and Uses of Annual Giving
at Private Research Universities,” Economics of Education Review 22, June 2003, pp. 223-341. Falk, Armin, “Gift Exchange in the Field,” Econometrica 75, 2007, pp. 1501-1511.
Heckman, James J., “Sample Selection Bias as a Specification Error,” Econometrica 47, 1979, pp. 153-161.
Holmes, Jessica, “Prestige, Charitable Deductions and Other Determinants of Alumni Giving: Evidence from a Highly Selective Liberal Arts College,” Economics of Education Re-view 28, 2009, pp. 18-28.
Huck, Steffen and Imram Rasul. “Comparing Charitable Fundraising Schemes: Evidence from a Natural Field Experiment.” Manuscript, October 2007.
Landry, Craig, Andreas Lange, John List, Michael Price, and Nicholas Rupp. “The Hid-den Benefits of Control: Evidence From a Natural Field Experiment.” NBER Working Paper No. 17473. September 2011.
Lara, Christen and Daniel K.N. Johnson, “The Anatomy of a Likely Donor: Econometric
Evidence on Philanthropy to Higher Education,” Working Paper 2008-05, Colorado College, Ju-ly 2008.
Leung, Siu Fai and Shihti Yu, “On the Choice between Sample Selection and Two-Part
Models,” Journal of Econometrics 72, 1996, pp. 197-229.
Marr, Kelly A., Charles H. Mullin and John J. Siegfried, “Undergraduate Financial Aid and Subsequent Alumni Giving Behavior,” The Quarterly Review of Economics and Finance 45, 2005, pp. 123-143.
McDearmon, J. Travis and Kathryn Shirley, “Characteristics and Institutional Factors Re-
lated to Young Alumni Donors and Non-Donors,” International Journal of Educational Ad-vancement, volume 9, 2009, pp. 83-95.
Monks, James, “Patterns of Giving to One’s Alma Mater among Young Graduates from Selective Institutions,” Economics of Education Review 22, 2003, pp. 121-130.
Meer, Jonathan. “Brother, Can You Spare a Dime? Peer Pressure in Charitable Solicita-tion.” Journal of Public Economics 95, 2011, pp. 926-941.
29
Meer, Jonathan and Harvey S. Rosen, “The Impact of Athletic Performance on Alumni Giving: An Analysis of Micro Data,” Economics of Education Review, June 2009, pp. 287-294.
Shulman, James L. and William G. Bowen, The Game of Life, Princeton University
Press: Princeton, 2001.
30
Appendix Appendix Table A1 presents the summary statistics for the variables used in our econo-
metric model. Table A2 combines the results for the probability of giving in Table 1 with the
results for conditional amounts of giving in Table 2 in order to estimate the effects of the various
forms of financial aid on the average amount of giving.
The remaining tables show the results when we augment our basic models with interac-
tions of the financial aid variables with indicators for race, gender, and age, respectively. Table
A3 shows the outcomes when we interact the financial aid variables with the indicators for
race.26 Consider the first panel, which shows the results for loans. We do not report the regres-
sion coefficients themselves. Rather, for each racial category, we show the sum of the main ef-
fect of a given loan variable and the coefficient on the interaction between the loan variable and
the race dichotomous variable. In short, the figures show the total effects of each loan variable
for the respective ethnic categories. The coefficient for an ethnic group is italicized if it is statis-
tically different at the 5 percent level from the corresponding figure for whites. The bottom por-
tion of the first panel shows the p-value of a test of the hypothesis that the interaction terms are
jointly significant (for example, 0.110 for the probability of making a gift) and the p-value of a
test of the hypothesis that the average marginal effects for each ethnic group are equal ( 0.001).
The figures suggest, then, that these interactions do not jointly improve the explanatory power of
the equation, but one can reject the hypothesis that the average marginal effects of loans are the
same across ethnic groups. It is important to note that the figures in the table measure the total
impact of each financial aid variable on giving, including the estimate of the associated intercept.
However, the average marginal effects recorded toward the bottom of the panel do not include
the effect of the intercept, because they measure the impact of an incremental increase of a given 26 Because there are so few Native Americans in our sample, they are not included in this analysis.
31
type of aid rather than the leap from no aid to some aid. The next two panels report the same in-
formation for scholarships and campus jobs.
Table A4 reports the results for interactions by gender. Coefficients for men and older
alumni that are significantly different from the corresponding coefficients for women and young-
er alumni, respectively, are italicized. Table A5 has the interactions with age. The indicator for
age takes a value of one if, in a given year, the individual graduated 10 or more years ago, and
zero otherwise, and is estimated for the sample of those who were out of college for at least 10
years. As noted in the text, there are generally (but not always) no statistically discernible differ-
ences by demographic group.
32
Table 1* Probability of Making a Gift
(1) Main
Specification
(2) Including Field
Variables
(3) Including 3-Digit
ZIP Effects
Loans 0.00407** (0.00168)
0.00493** (0.00210)
0.00457** (0.00164)
Loans2 -0.000155** (4.35x10⁻⁵)
-0.000184** (4.35x10⁻⁵)
-0.000167** (4.21x10⁻⁵)
Any Loan Aid -0.0357** (0.0175)
-0.0436** (0.0201)
-0.0390** (0.0172)
p-Value of Joint Significance of Loan Variables
0.000 0.001 0.000
Scholarships 0.000551
(0.000388) 0.000177
(0.000423) 0.000515
(0.000383)
Scholarships2 -3.23x10⁻⁶ (2.42x10⁻⁶)
-1.21x10⁻⁶ (2.69x10⁻⁶)
-3.18x10⁻⁶ (2.38x10⁻⁶)
Any Scholarship Aid -0.00704 (0.0181)
0.00260 (0.0191)
-0.0123 (0.0180)
p-Value of Joint Significance of Scholarship Variables
0.528 0.950 0.609
Jobs -0.00581** (0.00244)
-0.00460* (0.00254)
-0.00540** (0.00241)
Jobs2 0.000386** (8.85x10⁻⁵)
0.000335** (8.82x10⁻⁵)
0.000383** (8.73x10⁻⁵)
Any Job Aid -0.00907 (0.0191)
-0.0107 (0.0200)
-0.00282 (0.0189)
p-Value of Joint Significance of Job Variables
0.000 0.000 0.000
N 137,699 114,108 137,699
*Each column shows the incremental effect of the respective variables on the probability of making a gift in a given year, based on a linear probability model. Aid amounts are in thousands of dollars. Column (2) includes indicator variables for the field in which the individual works, and column (3) includes indicator variables for the individual’s ZIP code. Each regression includes on the right hand side the variables listed in Table A1 as well as class effects, location effects and time effects. Standard errors are in parentheses. Coefficients significant at the 5 percent level are marked with **, while those significant at the 10 percent level are marked with *.
33
Table 2* Log Amount Conditional on Giving
(1) Main
Specification
(2) Including Field
Variables
(3) Including 3-Digit
ZIP Effects
Loans -0.00344 (0.00520)
-0.00575 (0.00609)
-0.00294 (0.00505)
Loans2 2.50x10⁻⁵
(0.000145) 8.43x10⁻⁵
(0.000171) 1.27x10⁻⁵
(0.000139)
Any Loan Aid -0.0679 (0.0512)
-0.0475 (0.0568)
-0.0742 (0.0502)
p-Value of Joint Significance of Loan Variables
0.002 0.004 0.001
Scholarships 0.00162
(0.00108) 0.00180
(0.00117) 0.00179* (0.00107)
Scholarships2 -4.90x10⁻⁶ (6.92x10⁻⁶)
-6.46x10⁻⁶ (7.69x10⁻⁶)
-5.44x10⁻⁶ (6.82x10⁻⁶)
Any Scholarship Aid -0.188** (0.0492)
-0.184** (0.0512)
-0.186** (0.0483)
p-Value of Joint Significance of Scholarship Variables
0.000 0.001 0.000
Jobs -0.000383 (0.00651)
-0.00231 (0.00681)
-0.00123 (0.00641)
Jobs2 -0.000147 (0.000216)
-8.51x10⁻⁵ (0.000226)
-7.69x10⁻⁵ (0.000216)
Any Job Aid 0.0149
(0.0522) 0.0451
(0.0541) 0.0196
(0.0514)
p-Value of Joint Significance of Job Variables
0.041 0.505 0.743
N 84,394 74,920 84,394
*Each column shows the incremental effects of the respective variables on the log amount of the gift, conditional on making a gift, estimated by ordinary least squares and using observations with a positive gift. Aid amounts are in thousands of dollars. Column (2) includes indicator variables for the field in which the individual works, and column (3) includes indicator variables for the individual’s ZIP code. Each regression includes on the right hand side the variables listed in Table A1 as well as class effects, location effects and time effects. Standard errors are in parenthe-ses. Coefficients significant at the 5 percent level are marked with **, while those significant at the 10 percent level are marked with *.
34
Table 3* Probability of Being a Class Leader
(1) Main
Specification
(2) Including Field
Variables
(3) Including 3-Digit
ZIP Effects
Loans -0.000754** (0.000997)
-0.00113 (0.00134)
-0.000608** (0.000971)
Loans2 2.03x10⁻⁶
(2.77x10⁻⁵) 8.00x10⁻⁶
(3.84x10⁻⁵) -1.40x10⁻⁶
(2.67x10⁻⁵)
Any Loan Aid -0.00920 (0.00994)
-0.00736 (0.0124)
-0.0102 (0.00980)
p-Value of Joint Significance of Loan Variables
0.005 0.005 0.005
Scholarships 0.000369* (0.000200)
0.000345 (0.000235)
0.000407** (0.000195)
Scholarships2 -1.45x10⁻⁶ (1.23x10⁻⁶)
-1.38x10⁻⁶ (1.49x10⁻⁶)
-1.61x10⁻⁶ (1.21x10⁻⁶)
Any Scholarship Aid -0.0326** (0.00967)
-0.0337** (0.0111)
-0.0325** (0.00961)
p-Value of Joint Significance of Scholarship Variables
0.004 0.016 0.003
Jobs -0.000579 (0.00145)
4.76x10⁻⁵ (0.00158)
-0.000765 (0.00143)
Jobs2 2.38x10⁻⁵
(5.72x10⁻⁵) -5.94x10⁻⁷ (5.96x10⁻⁵)
3.42x10⁻⁵ (5.71x10⁻⁵)
Any Job Aid -0.00610 (0.0107)
-0.00313 (0.0123)
-0.00415 (0.0107)
p-Value of Joint Significance of Job Variables
0.708 0.992 0.745
N 137,699 114,108 137,699
*Each column shows the incremental effects of the respective financial aid variables on being a “class leader” in a given year, where a class leader is defined as an individual who donated an amount greater than or equal to the 90th percentile of gifts in his or her class. Estimation is based on a linear probability model. Aid amounts are in thou-sands of dollars. Column (2) includes indicator variables for the field in which the individual works, and column (3) includes indicator variables for the individual’s ZIP code. Each regression includes on the right hand side the varia-bles listed in Table A1 as well as class effects, location effects and time effects. Standard errors are in parentheses. Coefficients significant at the 5 percent level are marked with **, while those significant at the 10 percent level are marked with *.
35
Table A1* Variable Definitions and Summary Statistics
Variable Description Mean Standard Deviation
TotalYear Total giving for year (2009 dollars) conditional on making a gift 173.26 2753.20
Didgive 1 if any donation given in year 0.613 0.487
Loans Total loan aid (2009 dollars) conditional on receiving loan aid 16,315 8,082
Any Loan Aid Received any loan aid 0.444 0.497
Scholarships Total scholarship aid (2009 dollars) conditional on receiving schol-
arship aid 66,405 43,130
Any Scholarship Aid Received any scholarship aid 0.442 0.497
Campus Jobs Total job aid (2009 dollars) conditional on receiving job aid 9,751 4,467
Any Job Aid Received any job aid 0.404 0.491
Yearssince Number of years since graduation 6.18 3.83
Yearssince2 Number of years since graduation, squared 52.87 57.21
Spouseisalum 1 if the spouse is an alumnus 0.151 0.358
Male 1 if the alumnus is male 0.543 0.498
Race/Ethnicity
White Omitted Category: 1 if the alumnus is White 0.743 0.437
Amerind 1 if the alumnus is a Native American 0.0045 0.0671
Black 1 if the alumnus is Black 0.0666 0.249
Hispanic 1 if the alumnus is Hispanic 0.0582 0.234
Asian 1 if the alumnus is Asian 0.127 0.333
Secondary Schooling
Public
Omitted Category: 1 if the alumnus attended public school 0.557 0.497
Boarding 1 if the alumnus attended boarding school 0.128 0.334
Private 1 if the alumnus attended private school 0.314 0.464
School - Other 1 if the alumnus attended another type of school 0.0017 0.0415
SATmath SAT math score. Scores prior to 1996 are adjusted to reflect
recentering of the scoring scale. 714 67.4
36
SATverbal SAT verbal score. Scores prior to 1996 are adjusted to reflect re-
centering of the scoring scale. 712 66.4
Admissions Office “Non-Academic”
Ranking
A Omitted Category: 1 if the alumnus received the highest non-
academic ranking from the admissions office 0.0224 0.148
B 1 if the alumnus received the second highest non-academic ranking
from the admissions office 0.193 0.395
C 1 if the alumnus received the third highest non-academic ranking
from the admissions office 0.467 0.499
D 1 if the alumnus received the fourth highest non-academic ranking
from the admissions office 0.299 0.458
E 1 if the alumnus received the fifth highest non-academic ranking
from the admissions office 0.0192 0.137
Admissions Office “Academic” Ranking
A
Omitted Category: 1 if the alumnus received the highest academic ranking from the admissions office 0.228 0.419
B 1 if the alumnus received the second highest academic ranking
from the admissions office 0.407 0.491
C 1 if the alumnus received the third highest academic ranking from
the admissions office 0.217 0.412
D 1 if the alumnus received the fourth highest academic ranking from
the admissions office 0.121 0.326
E 1 if the alumnus received the fifth highest academic ranking from
the admissions office 0.0268 0.161
Clubsport 1 if the alumnus played on a club team 0.130 0.337
Honors 1 if the alumnus graduated magna, summa, or cum laude 0.463 0.499
Greek 1 if the alumnus was a member of a fraternity or sorority 0.730 0.444
Athlete 1 if the alumnus played a varsity sport 0.377 0.485
Major
Molbio Omitted Category: 1 if the alumnus majored in molecular biology 0.0591 0.236
Small Social Science 1 if the alumnus majored in Anthropology, Urban Studies, or
Sociology. 0.0375 0.190
English 1 if the alumnus majored in English 0.101 0.301
Economics 1 if the alumnus majored in Economics 0.0889 0.285
Public Policy 1 if the alumnus majored in Public Policy 0.0634 0.244
37
Political Science 1 if the alumnus majored in Political Science 0.0998 0.300
Psychology 1 if the alumnus majored in Psychology 0.0470 0.212
History 1 if the alumnus majored in History 0.110 0.313
MAE 1 if the alumnus majored in Mechanical/Aerospace Engineering 0.0348 0.183
EE/CS 1 if the alumnus majored in Electrical Engineering or Computer
Science 0.0589 0.235
Arch & Civ 1 if the alumnus majored in Architecture or Civil Engineering 0.0565 0.231
Small Humanities 1 if the alumnus majored in Art, Art History, Classics, East Asian Studies, Linguistics, Music, Near Eastern Studies, Philosophy,
Religion, or Languages and Literature departments 0.109 0.312
Small Engineering 1 if the alumnus majored in “Engineering”, Operations Research
and Financial Engineering, or Chemical Engineering 0.0321 0.176
Small Sciences 1 if the alumnus majored in Applied Mathematics, Astrophysics, Biochemistry, Biology, Chemistry, Ecology and Evolutionary
Biology, Geology, Mathematics, Physics, or Statistics 0.102 0.302
Minor
No Minor Omitted Category: 1 if the alumnus received no minor 0.682 0.466
African/African-American Studies
1 if the alumnus received a minor in African or African-American Studies
0.0221 0.147
American Studies 1 if the alumnus received a minor in American Studies 0.03004 0.171
Latin 1 if the alumnus received a minor in Latin 0.0078 0.0880
Finance 1 if the alumnus received a minor in Finance 0.0231 0.150
Theater 1 if the alumnus received a minor in Theater 0.0184 0.134
Public Policy 1 if the alumnus received a minor in Public Policy 0.0562 0.230
Other Engineering 1 if the alumnus received a minor in Architecture, Basic Engineer-ing, Bioengineering, Electrical Engineering, Geological Engineer-
ing, Management, Materials Sciences, or Robotics. 0.0199 0.140
Other Sciences 1 if the alumnus received a minor in Applied and Computational
Mathematics, Biophysics, Cognitive Studies, Environmental Stud-ies, Science in Human Affairs, or Neuroscience.
0.0559 0.230
Other Humanities 1 if the alumnus received a minor in a humanities field 0.0966 0.295
Teaching 1 if the alumnus received a teaching certificate 0.0172 0.130
Reunion 1 if the year after graduation is a multiple of 5 0.162 0.368
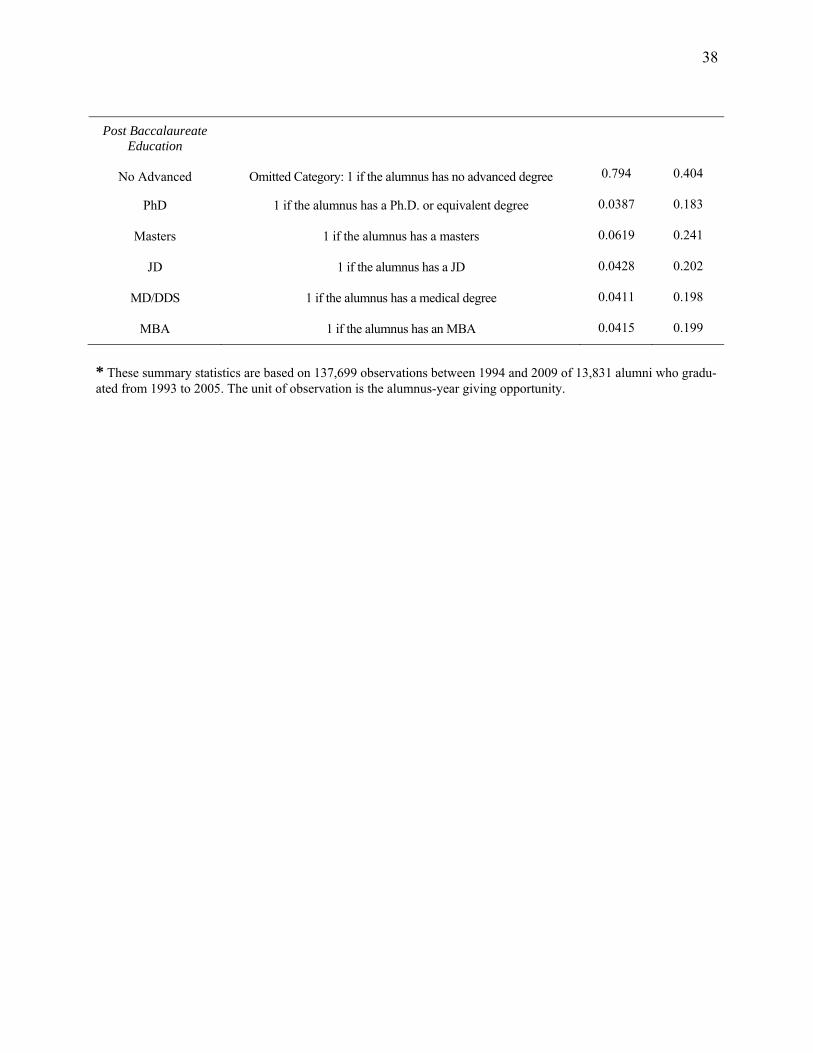
38
Post Baccalaureate Education
No Advanced Omitted Category: 1 if the alumnus has no advanced degree 0.794 0.404
PhD 1 if the alumnus has a Ph.D. or equivalent degree 0.0387 0.183
Masters 1 if the alumnus has a masters 0.0619 0.241
JD 1 if the alumnus has a JD 0.0428 0.202
MD/DDS 1 if the alumnus has a medical degree 0.0411 0.198
MBA 1 if the alumnus has an MBA 0.0415 0.199
* These summary statistics are based on 137,699 observations between 1994 and 2009 of 13,831 alumni who gradu-ated from 1993 to 2005. The unit of observation is the alumnus-year giving opportunity.
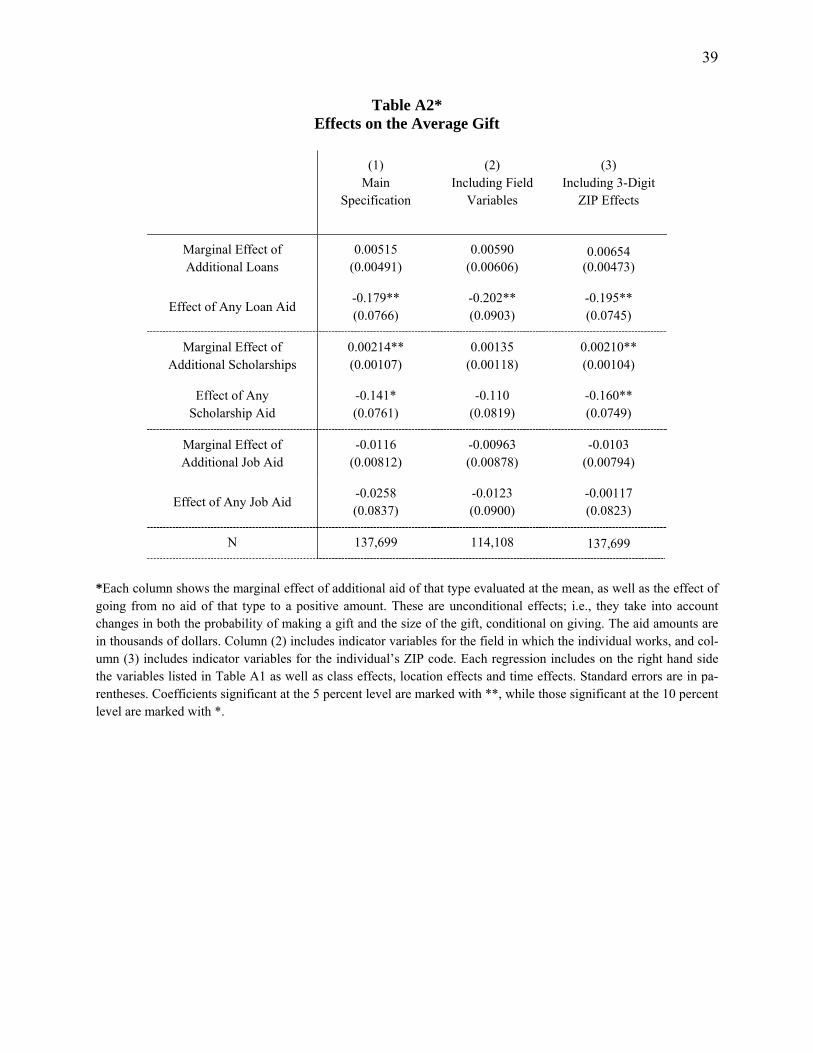
39
Table A2* Effects on the Average Gift
(1) Main
Specification
(2) Including Field
Variables
(3) Including 3-Digit
ZIP Effects
Marginal Effect of Additional Loans
0.00515 (0.00491)
0.00590 (0.00606)
0.00654 (0.00473)
Effect of Any Loan Aid -0.179** (0.0766)
-0.202** (0.0903)
-0.195** (0.0745)
Marginal Effect of Additional Scholarships
0.00214** (0.00107)
0.00135 (0.00118)
0.00210** (0.00104)
Effect of Any Scholarship Aid
-0.141* (0.0761)
-0.110 (0.0819)
-0.160** (0.0749)
Marginal Effect of Additional Job Aid
-0.0116 (0.00812)
-0.00963 (0.00878)
-0.0103 (0.00794)
Effect of Any Job Aid -0.0258 (0.0837)
-0.0123 (0.0900)
-0.00117 (0.0823)
N 137,699 114,108 137,699
*Each column shows the marginal effect of additional aid of that type evaluated at the mean, as well as the effect of going from no aid of that type to a positive amount. These are unconditional effects; i.e., they take into account changes in both the probability of making a gift and the size of the gift, conditional on giving. The aid amounts are in thousands of dollars. Column (2) includes indicator variables for the field in which the individual works, and col-umn (3) includes indicator variables for the individual’s ZIP code. Each regression includes on the right hand side the variables listed in Table A1 as well as class effects, location effects and time effects. Standard errors are in pa-rentheses. Coefficients significant at the 5 percent level are marked with **, while those significant at the 10 percent level are marked with *.
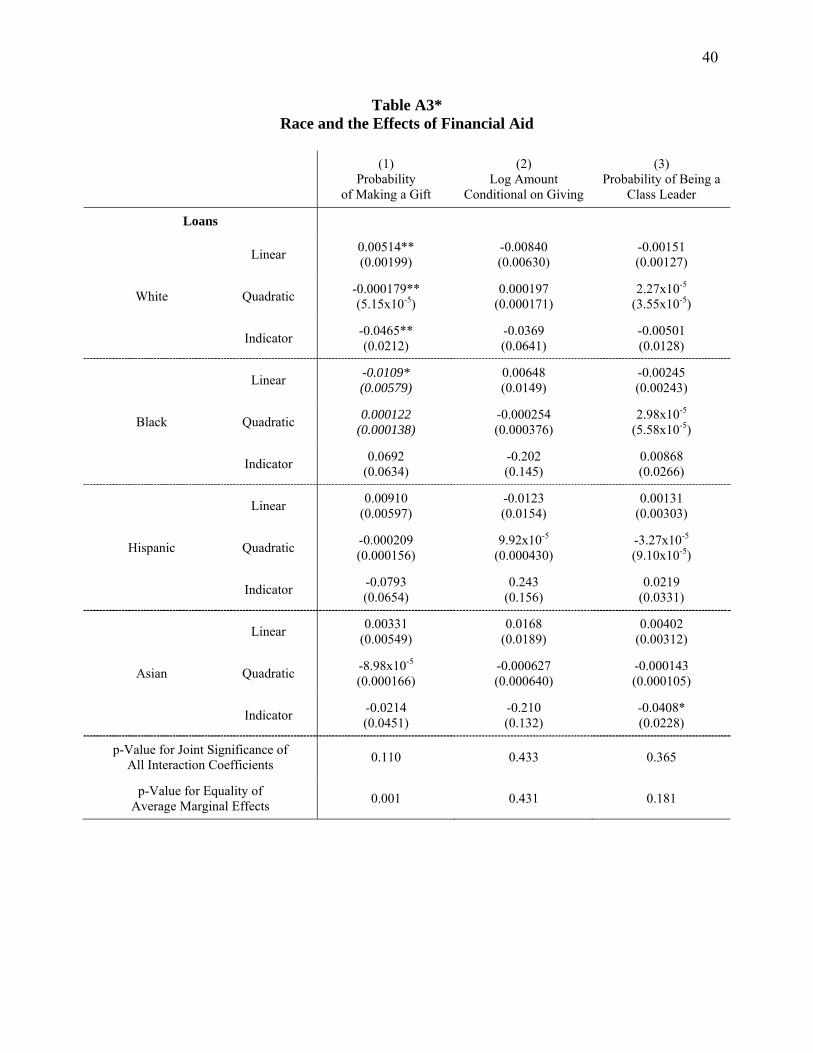
40
Table A3* Race and the Effects of Financial Aid
(1)
Probability of Making a Gift
(2) Log Amount
Conditional on Giving
(3) Probability of Being a
Class Leader
Loans
White
Linear 0.00514** (0.00199)
-0.00840 (0.00630)
-0.00151 (0.00127)
Quadratic -0.000179** (5.15x10⁻⁵)
0.000197 (0.000171)
2.27x10⁻⁵ (3.55x10⁻⁵)
Indicator -0.0465** (0.0212)
-0.0369 (0.0641)
-0.00501 (0.0128)
Black
Linear -0.0109* (0.00579)
0.00648 (0.0149)
-0.00245 (0.00243)
Quadratic 0.000122
(0.000138) -0.000254 (0.000376)
2.98x10⁻⁵ (5.58x10⁻⁵)
Indicator 0.0692
(0.0634) -0.202 (0.145)
0.00868 (0.0266)
Hispanic
Linear 0.00910
(0.00597) -0.0123 (0.0154)
0.00131 (0.00303)
Quadratic -0.000209 (0.000156)
9.92x10⁻⁵ (0.000430)
-3.27x10⁻⁵ (9.10x10⁻⁵)
Indicator -0.0793 (0.0654)
0.243 (0.156)
0.0219 (0.0331)
Asian
Linear 0.00331
(0.00549) 0.0168
(0.0189) 0.00402
(0.00312)
Quadratic -8.98x10⁻⁵ (0.000166)
-0.000627 (0.000640)
-0.000143 (0.000105)
Indicator -0.0214 (0.0451)
-0.210 (0.132)
-0.0408* (0.0228)
p-Value for Joint Significance of All Interaction Coefficients
0.110 0.433 0.365
p-Value for Equality of Average Marginal Effects
0.001 0.431 0.181
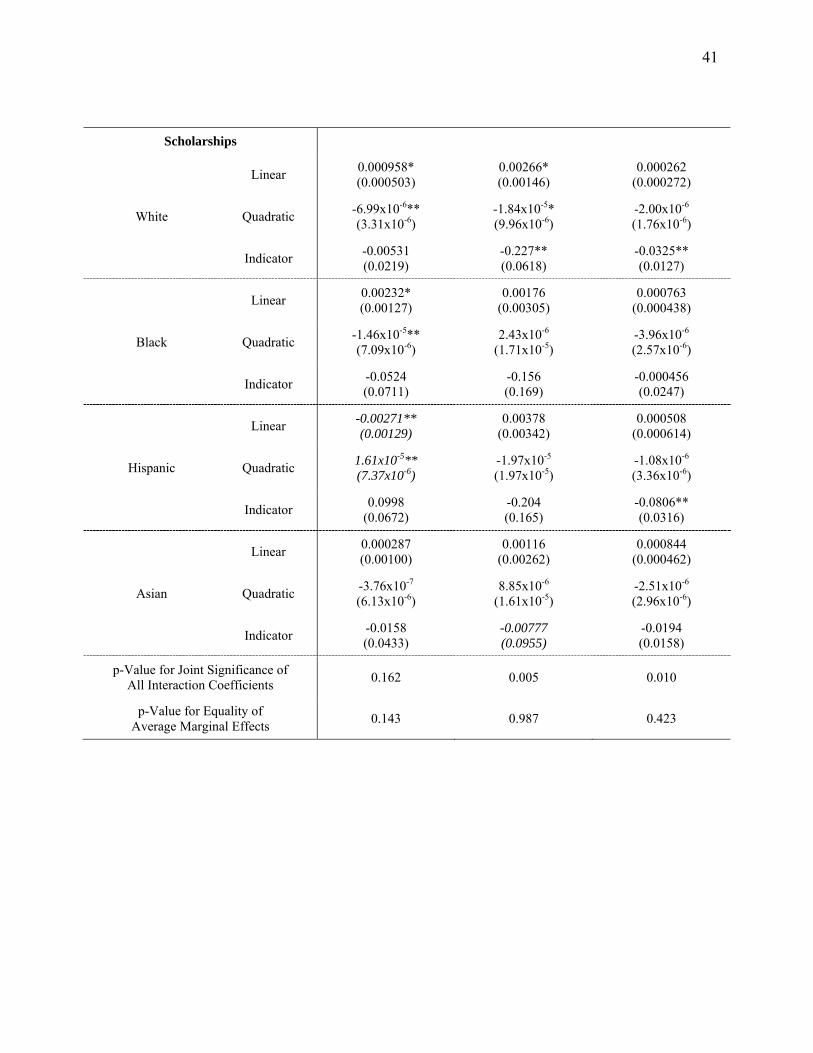
41
Scholarships
White
Linear 0.000958* (0.000503)
0.00266* (0.00146)
0.000262 (0.000272)
Quadratic -6.99x10⁻⁶** (3.31x10⁻⁶)
-1.84x10-5* (9.96x10-6)
-2.00x10⁻⁶ (1.76x10⁻⁶)
Indicator -0.00531 (0.0219)
-0.227** (0.0618)
-0.0325** (0.0127)
Black
Linear 0.00232* (0.00127)
0.00176 (0.00305)
0.000763 (0.000438)
Quadratic -1.46x10⁻⁵** (7.09x10⁻⁶)
2.43x10⁻⁶ (1.71x10⁻⁵)
-3.96x10⁻⁶ (2.57x10⁻⁶)
Indicator -0.0524 (0.0711)
-0.156 (0.169)
-0.000456 (0.0247)
Hispanic
Linear -0.00271** (0.00129)
0.00378 (0.00342)
0.000508 (0.000614)
Quadratic 1.61x10⁻⁵** (7.37x10⁻⁶)
-1.97x10⁻⁵ (1.97x10⁻⁵)
-1.08x10⁻⁶ (3.36x10⁻⁶)
Indicator 0.0998
(0.0672) -0.204 (0.165)
-0.0806** (0.0316)
Asian
Linear 0.000287 (0.00100)
0.00116 (0.00262)
0.000844 (0.000462)
Quadratic -3.76x10⁻⁷ (6.13x10⁻⁶)
8.85x10⁻⁶ (1.61x10⁻⁵)
-2.51x10⁻⁶ (2.96x10⁻⁶)
Indicator -0.0158 (0.0433)
-0.00777 (0.0955)
-0.0194 (0.0158)
p-Value for Joint Significance of All Interaction Coefficients
0.162 0.005 0.010
p-Value for Equality of Average Marginal Effects
0.143 0.987 0.423
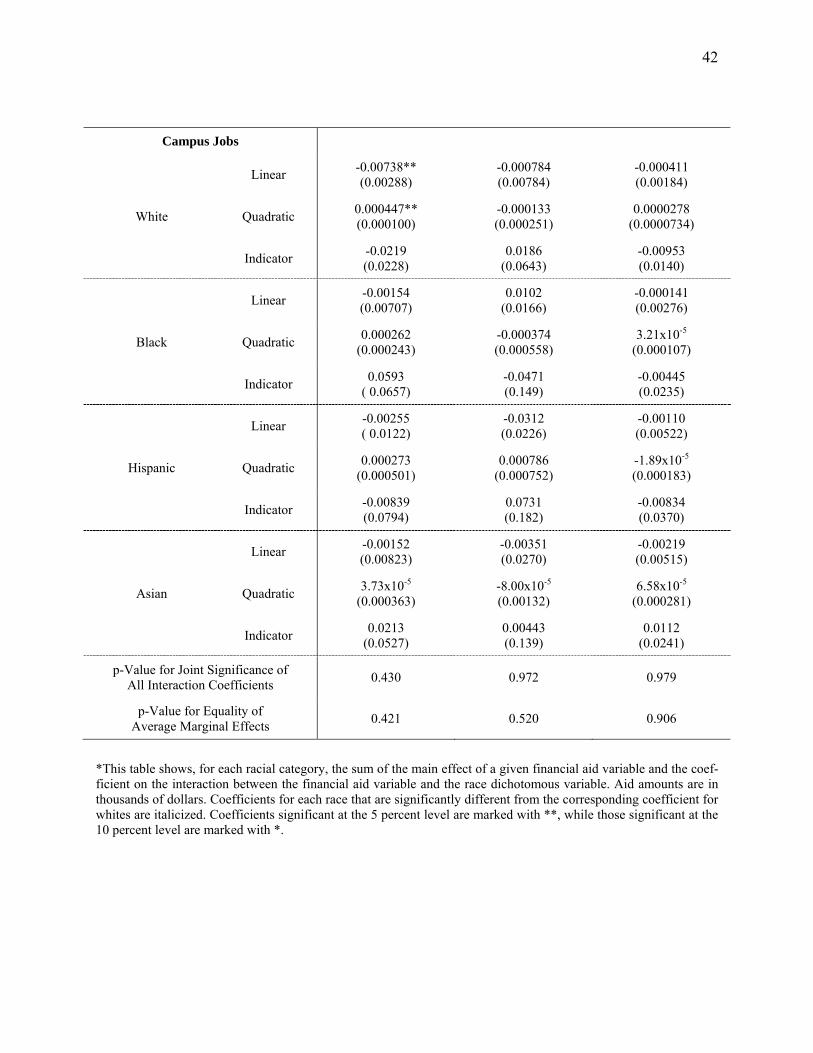
42
Campus Jobs
White
Linear -0.00738** (0.00288)
-0.000784 (0.00784)
-0.000411 (0.00184)
Quadratic 0.000447** (0.000100)
-0.000133 (0.000251)
0.0000278 (0.0000734)
Indicator -0.0219 (0.0228)
0.0186 (0.0643)
-0.00953 (0.0140)
Black
Linear -0.00154 (0.00707)
0.0102 (0.0166)
-0.000141 (0.00276)
Quadratic 0.000262
(0.000243) -0.000374 (0.000558)
3.21x10⁻⁵ (0.000107)
Indicator 0.0593
( 0.0657) -0.0471 (0.149)
-0.00445 (0.0235)
Hispanic
Linear -0.00255 ( 0.0122)
-0.0312 (0.0226)
-0.00110 (0.00522)
Quadratic 0.000273
(0.000501) 0.000786
(0.000752) -1.89x10⁻⁵ (0.000183)
Indicator -0.00839 (0.0794)
0.0731 (0.182)
-0.00834 (0.0370)
Asian
Linear -0.00152 (0.00823)
-0.00351 (0.0270)
-0.00219 (0.00515)
Quadratic 3.73x10⁻⁵
(0.000363) -8.00x10⁻⁵ (0.00132)
6.58x10⁻⁵ (0.000281)
Indicator 0.0213
(0.0527) 0.00443 (0.139)
0.0112 (0.0241)
p-Value for Joint Significance of All Interaction Coefficients
0.430 0.972 0.979
p-Value for Equality of Average Marginal Effects
0.421 0.520 0.906
*This table shows, for each racial category, the sum of the main effect of a given financial aid variable and the coef-ficient on the interaction between the financial aid variable and the race dichotomous variable. Aid amounts are in thousands of dollars. Coefficients for each race that are significantly different from the corresponding coefficient for whites are italicized. Coefficients significant at the 5 percent level are marked with **, while those significant at the 10 percent level are marked with *.
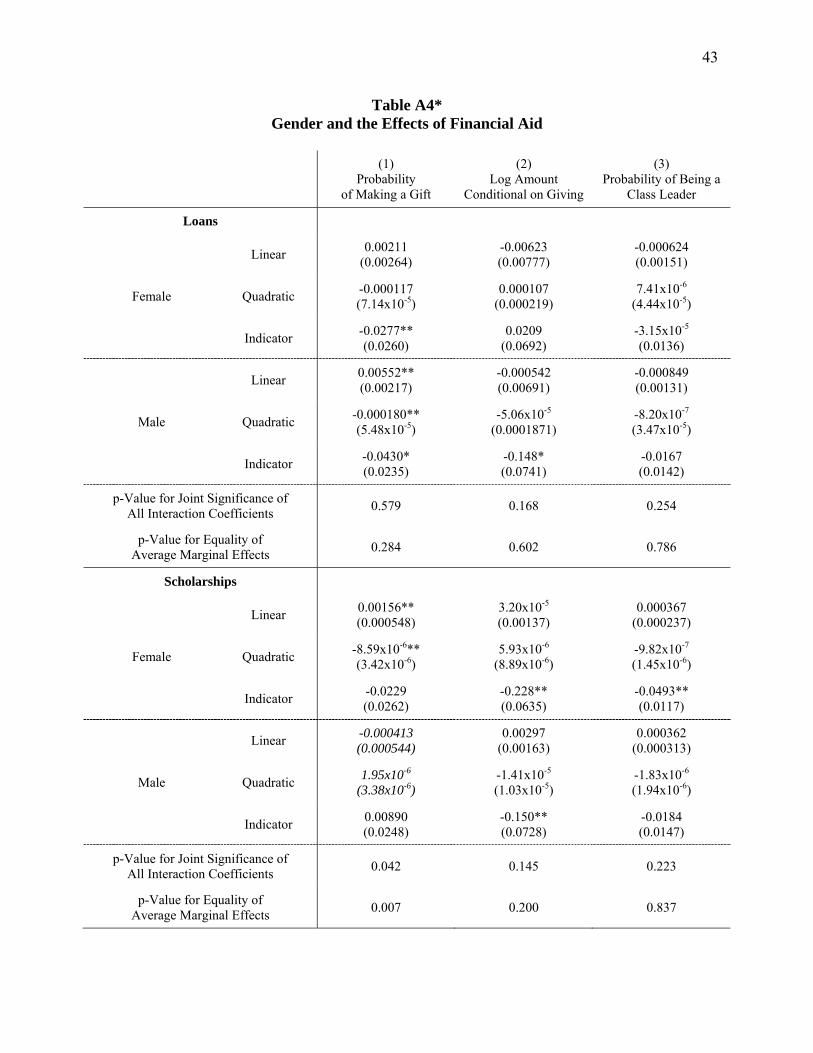
43
Table A4* Gender and the Effects of Financial Aid
(1)
Probability of Making a Gift
(2) Log Amount
Conditional on Giving
(3) Probability of Being a
Class Leader
Loans
Female
Linear 0.00211
(0.00264) -0.00623 (0.00777)
-0.000624 (0.00151)
Quadratic -0.000117 (7.14x10⁻⁵)
0.000107 (0.000219)
7.41x10⁻⁶ (4.44x10⁻⁵)
Indicator -0.0277** (0.0260)
0.0209 (0.0692)
-3.15x10⁻⁵ (0.0136)
Male
Linear 0.00552** (0.00217)
-0.000542 (0.00691)
-0.000849 (0.00131)
Quadratic -0.000180** (5.48x10⁻⁵)
-5.06x10⁻⁵ (0.0001871)
-8.20x10⁻⁷ (3.47x10⁻⁵)
Indicator -0.0430* (0.0235)
-0.148* (0.0741)
-0.0167 (0.0142)
p-Value for Joint Significance of All Interaction Coefficients
0.579 0.168 0.254
p-Value for Equality of Average Marginal Effects
0.284 0.602 0.786
Scholarships
Female
Linear 0.00156** (0.000548)
3.20x10⁻⁵ (0.00137)
0.000367 (0.000237)
Quadratic -8.59x10⁻⁶** (3.42x10⁻⁶)
5.93x10⁻⁶ (8.89x10⁻⁶)
-9.82x10⁻⁷ (1.45x10⁻⁶)
Indicator -0.0229 (0.0262)
-0.228** (0.0635)
-0.0493** (0.0117)
Male
Linear -0.000413 (0.000544)
0.00297 (0.00163)
0.000362 (0.000313)
Quadratic 1.95x10⁻⁶
(3.38x10⁻⁶) -1.41x10⁻⁵ (1.03x10⁻⁵)
-1.83x10⁻⁶ (1.94x10⁻⁶)
Indicator 0.00890 (0.0248)
-0.150** (0.0728)
-0.0184 (0.0147)
p-Value for Joint Significance of All Interaction Coefficients
0.042 0.145 0.223
p-Value for Equality of Average Marginal Effects
0.007 0.200 0.837
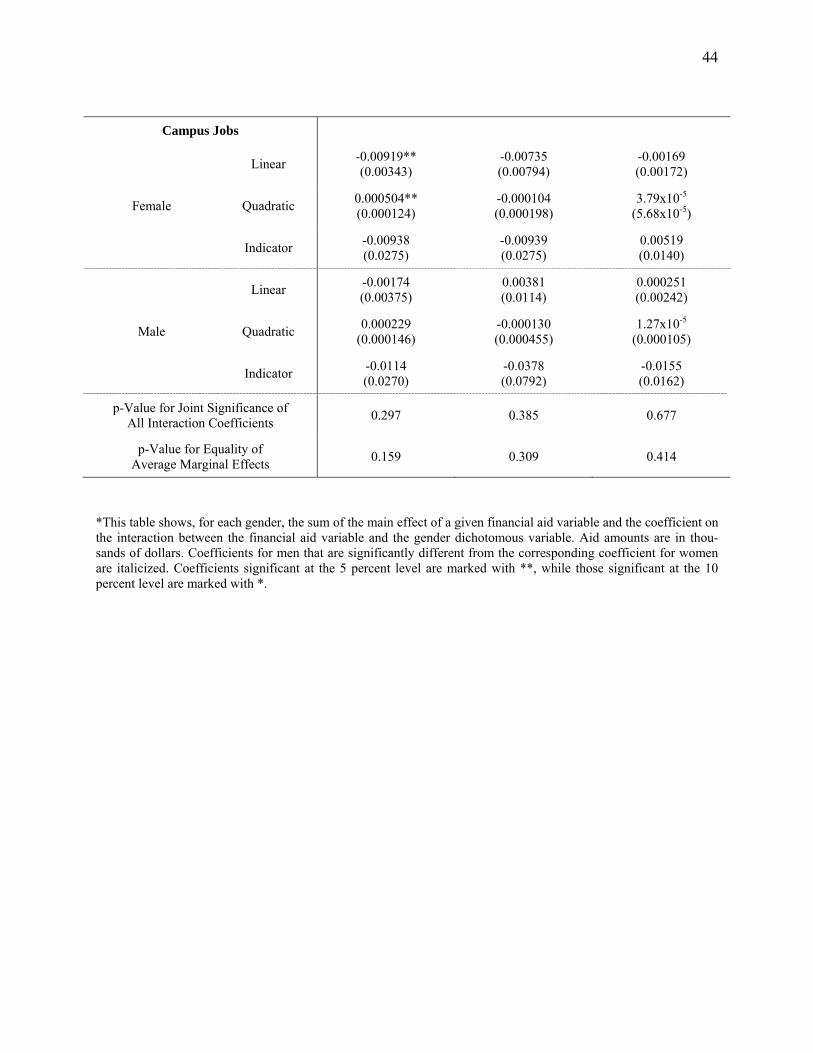
44
Campus Jobs
Female
Linear -0.00919** (0.00343)
-0.00735 (0.00794)
-0.00169 (0.00172)
Quadratic 0.000504** (0.000124)
-0.000104 (0.000198)
3.79x10⁻⁵ (5.68x10⁻⁵)
Indicator -0.00938 (0.0275)
-0.00939 (0.0275)
0.00519 (0.0140)
Male
Linear -0.00174 (0.00375)
0.00381 (0.0114)
0.000251 (0.00242)
Quadratic 0.000229
(0.000146) -0.000130 (0.000455)
1.27x10⁻⁵ (0.000105)
Indicator -0.0114 (0.0270)
-0.0378 (0.0792)
-0.0155 (0.0162)
p-Value for Joint Significance of All Interaction Coefficients
0.297 0.385 0.677
p-Value for Equality of Average Marginal Effects
0.159 0.309 0.414
*This table shows, for each gender, the sum of the main effect of a given financial aid variable and the coefficient on the interaction between the financial aid variable and the gender dichotomous variable. Aid amounts are in thou-sands of dollars. Coefficients for men that are significantly different from the corresponding coefficient for women are italicized. Coefficients significant at the 5 percent level are marked with **, while those significant at the 10 percent level are marked with *.

45
Table A5* Age and the Effects of Financial Aid
(1)
Probability of Making a Gift
(2) Log Amount
Conditional on Giving
(3) Probability of Being a
Class Leader
Loans
Younger
Linear 0.00456* (0.00234)
-0.00545 (0.00694)
-0.00205 (0.00150)
Quadratic -0.000155** (5.58x10⁻⁵)
2.69x10⁻⁵ (0.000178)
2.23x10⁻⁵ (4.03x10⁻⁵)
Indicator -0.0495* (0.0256)
-0.0675 (0.0737)
-0.00218 (0.0149)
Older
Linear 0.00303
(0.00308) -0.00457 (0.0120)
-0.000394 (0.00163)
Quadratic -0.000135* (7.52x10-5)
0.000136 (0.000314)
1.28x10⁻⁶ (4.03x10⁻⁵)
Indicator -0.0137 (0.0336)
-0.0318 (0.125)
-0.00865 (0.0196)
p-Value for Joint Significance of Interaction Coefficients
0.505 0.341 0.270
p-Value for Equality of Average Marginal Effects
0.537 0.730 0.203
Scholarships
Younger
Linear 0.000562
(0.000584) 0.00117
(0.00155) 0.000458
(0.000296)
Quadratic -4.15x10⁻⁶ (4.08x10⁻⁶)
-3.21x10⁻⁶ (1.14x10⁻⁵)
-2.38x10⁻⁶ (2.08x10⁻⁶)
Indicator -0.00577 (0.0237)
-0.108* (0.0595)
-0.0296** (0.0125)
Older
Linear 0.000535
(0.000761) 0.00130
(0.00285) 0.000319
(0.000426)
Quadratic -6.42x10⁻⁶ (5.34x10⁻⁶)
2.13x10⁻⁶ (2.10x10⁻⁵)
-1.08x10⁻⁶ (3.00x10⁻⁶)
Indicator 0.0147
(0.0312) -0.248** (0.105)
-0.0278 (0.0179)
p-Value for Joint Significance of Interaction Coefficients
0.210 0.254 0.947
p-Value for Equality of Average Marginal Effects
0.770 0.820 0.802
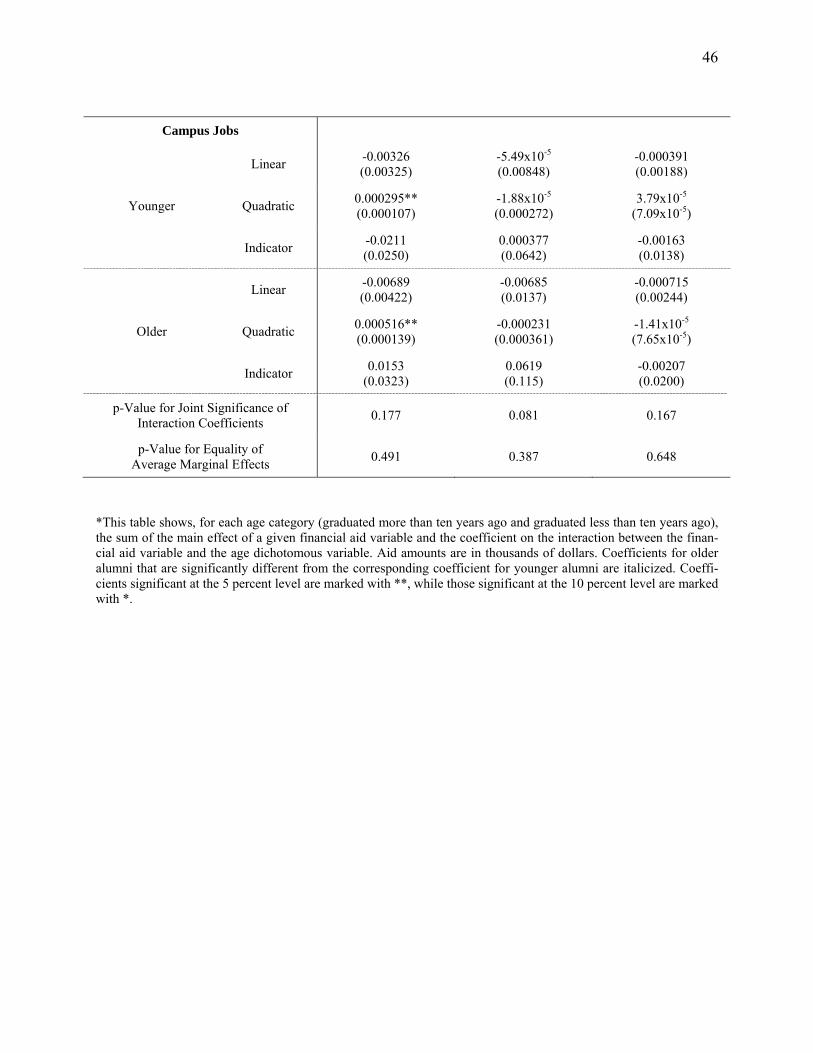
46
Campus Jobs
Younger
Linear -0.00326 (0.00325)
-5.49x10⁻⁵ (0.00848)
-0.000391 (0.00188)
Quadratic 0.000295** (0.000107)
-1.88x10⁻⁵ (0.000272)
3.79x10⁻⁵ (7.09x10⁻⁵)
Indicator -0.0211 (0.0250)
0.000377 (0.0642)
-0.00163 (0.0138)
Older
Linear -0.00689 (0.00422)
-0.00685 (0.0137)
-0.000715 (0.00244)
Quadratic 0.000516** (0.000139)
-0.000231 (0.000361)
-1.41x10⁻⁵ (7.65x10⁻⁵)
Indicator 0.0153
(0.0323) 0.0619 (0.115)
-0.00207 (0.0200)
p-Value for Joint Significance of Interaction Coefficients
0.177 0.081 0.167
p-Value for Equality of Average Marginal Effects
0.491 0.387 0.648
*This table shows, for each age category (graduated more than ten years ago and graduated less than ten years ago), the sum of the main effect of a given financial aid variable and the coefficient on the interaction between the finan-cial aid variable and the age dichotomous variable. Aid amounts are in thousands of dollars. Coefficients for older alumni that are significantly different from the corresponding coefficient for younger alumni are italicized. Coeffi-cients significant at the 5 percent level are marked with **, while those significant at the 10 percent level are marked with *.