does fuel hedging make economic sense? the case … does fuel hedging make economic sense? the case...
TRANSCRIPT
Does Fuel Hedging Make Economic Sense? The Case of the US Airline Industry
David A. Carter a, Daniel A. Rogers b, and Betty J. Simkins a
a 301Business Building, Oklahoma State University, Stillwater, OK 74078-4011, USA b School of Business Administration, Portland State University, Portland, OR 97207-0751, USA
December 11, 2003
Abstract
Does hedging add value to the firm, and if so, is the source of the added value consistent with hedging theory? We investigate jet fuel hedging behavior of firms in the US airline industry during 1994-2000 to examine whether such hedging is a source of value for these companies. We illustrate that the investment climate in the airline industry conforms well to the theoretic framework of Froot, Scharfstein, and Stein (1993). In general, airline industry investment opportunities correlate positively with jet fuel costs, while higher fuel costs are consistent with lower cash flow. Given that jet fuel costs are hedgeable, airlines with a desire for expansion may find value in hedging future purchases of jet fuel. Our results show that jet fuel hedging is positively related to airline firm value. The coefficients on the hedging indicator variables in our regression analysis suggest that the �hedging premium� constitutes approximately a 12-16 percent increase in firm value. We find that the positive relation between hedging and value increases in capital investment. This result is consistent with the assertion that the principal benefit of jet fuel hedging by airlines comes from reduction of underinvestment costs. JEL Classification: G30, G31, G32, L93 Keywords: Hedging; Risk Management; Airline industry We thank John Doukouris in the Office of Economics at the Air Transport Association and Pete Reig at Williams, Inc. for providing airline fuel cost data. We also thank Chiddi Chidambaran, Georges Dionne, Chitru Fernando, Tomas Jandik, Wayne Mikkelson, Thouraya Triki, Larry Wall, participants at the 2001 Eastern Finance Association meeting, 2001 FMA meetings, and 2003 FMA European meetings, and seminar participants at HEC Montréal, Kent State University, the 2003 Southwest Finance Symposium at the University of Tulsa, and University of Oregon for useful comments. Janybek Abakirov, Brad Beall, Freddie Leonardi, and Brent Asavamonchai provided excellent research assistance. * Please direct all correspondence to: Betty J. Simkins, Department of Finance, College of Business Administration, Oklahoma State University, Stillwater, OK 74078-4011, (405) 744-8625 (office), (405) 744-5180 (fax), email: [email protected].
1
Does Fuel Hedging Make Economic Sense? The Case of the US Airline Industry
Abstract
Does hedging add value to the firm, and if so, is the source of the added value consistent with hedging theory? We investigate jet fuel hedging behavior of firms in the US airline industry during 1994-2000 to examine whether such hedging is a source of value for these companies. We illustrate that the investment climate in the airline industry conforms well to the theoretic framework of Froot, Scharfstein, and Stein (1993). In general, airline industry investment opportunities correlate positively with jet fuel costs, while higher fuel costs are consistent with lower cash flow. Given that jet fuel costs are hedgeable, airlines with a desire for expansion may find value in hedging future purchases of jet fuel. Our results show that jet fuel hedging is positively related to airline firm value. The coefficients on the hedging indicator variables in our regression analysis suggest that the �hedging premium� constitutes approximately a 12-16 percent increase in firm value. We find that the positive relation between hedging and value increases in capital investment. This result is consistent with the assertion that the principal benefit of jet fuel hedging by airlines comes from reduction of underinvestment costs. JEL Classification: G30, G31, G32, L93 Keywords: Hedging; Risk Management; Airline industry
I. Introduction
Recent literature in corporate finance has fostered an improved understanding of why
nonfinancial firms may hedge.1 However, very little research has focused on whether hedging
achieves reasonable economic objectives. In particular, many researchers are interested in
whether hedging increases firm value. Allayannis and Weston (2001) examine the relation
between foreign currency hedging and Tobin�s Q. They conclude that hedging is associated with
higher firm value.
1 Allayannis and Ofek (2001), Berkman and Bradbury (1996), Dolde (1995), Gay and Nam (1998), Géczy, Minton, and Schrand (1997), Graham and Rogers (2002), Haushalter (2000), Mian (1996), Nance, Smith, and Smithson (1993), Rogers (2002), Schrand and Unal (1998), and Tufano (1996) are many of the published studies examining the determinants of corporate hedging behavior.
2
One obvious question resulting from the results of Allayannis and Weston (2001) pertains
to the source of value from hedging. They speculate that the source of added value from hedging
is likely attributable to its ability to reduce underinvestment as theorized by Bessembinder
(1991) and Froot, Scharfstein, and Stein (1993). Unfortunately, their study is unable to draw this
specific conclusion.
In this paper, we study the dual questions of �does hedging add value?� and �if so, what
is the source of added value?� To do so, we identify a more targeted sample than used by
Allayannis and Weston (2001). We analyze hedging of jet fuel price risk exposure by US
airlines. Because average jet fuel costs constitute approximately 13 percent, on average, of
airlines� operating costs, jet fuel price risk is economically meaningful to airlines.
In addressing the value question, we adopt a similar framework to Allayannis and Weston
(2001). The results show that airlines increase value by hedging their jet fuel price exposures.
Additionally, changes in hedging are positively associated with changes in firm value. As in
Allayannis and Weston, we interpret certain results from our regressions as the �hedging
premium� (i.e., the added firm value attributable to hedging). Our results suggest that the average
hedging premium for airlines is in the range of 12-16 percent.
The airline sample allows us to also address the source of value question. We find that
the airline industry exhibits two characteristics consistent with the general assumptions and
framework developed in Froot et al. (1993). First, the airline industry�s history of investment
spending is not negatively correlated with jet fuel costs, as one might expect. In fact, the relation
between these two variables is largely positive. Second, airlines face significant distress costs, as
shown by Pulvino (1998, 1999), because distressed airlines are forced to sell aircraft at below-
market prices. Froot et al. (1993) suggest that firms facing significant expected distress costs will
choose to underinvest. In essence, the underinvestment cost is an indirect cost of financial
3
distress (e.g., Stulz (1996)). They show that hedging is a mechanism to alleviate this
underinvestment incentive. In their model, hedging is more valuable when investment
opportunities display lower correlations with cash flows from hedgeable risks. Thus, rather than
assuming that underinvestment reduction is the reason that hedging adds value (as is done by
Allayannis and Weston), our sample industry is chosen because it �fits� the theory. Given this,
an additional contribution of our study is to illustrate the source of economic benefits of hedging
in an industry environment where investment opportunities may be positively correlated with a
hedgeable risk.
Given investment patterns in the airline industry, the value premium suggests that
hedging allows airlines more ability to fund investment during periods of high jet fuel prices.
The positive relation between hedging and value suggests that investors view such investment as
positive net present value projects. We find that the interaction of hedging and capital
expenditures captures at least 72 percent of the hedging premium. We also examine a two-stage
system in which hedging impacts value through its effect on capital expenditures. While the
system shows no statistically significant effect of hedging on capital expenditures, the economic
impact of hedging on value suggests that, if a hedging premium exists, it results largely from the
effect of hedging on capital investment.
An additional rationale for our choice of studying hedging in the airline industry is that
the firms face substantial price risk associated with jet fuel price volatility. Guay and Kothari
(2003) suggest that most sample firms used in many prior studies defining hedging using interest
rate and/or currency derivatives may be unable to gain significant benefits from their derivative
holdings. We note that jet fuel prices are more volatile than prices of other underlying assets
typically studied, particularly currencies. Annualized jet fuel price volatility measured from
monthly averages over 1994-2000 is approximately 26 percent. As a point of comparison, Guay
4
and Kothari (2003) find that the annualized volatility of major currencies is only 11 percent
(measured over 1988-1997). Additionally, using the median percentage of fuel consumption
hedged, we show that the cash flow sensitivity to extreme jet fuel price changes (defined
similarly to the measure calculated by Guay and Kothari) of the median firm in our sample is
21.6 percent of capital expenditures. Overall, airline exposure to jet fuel price risk is
economically significant, and considerable cash would be realized by hedging airlines in the
event of an extreme price increase.
The paper proceeds as follows. Section II provides a brief review of relevant hedging
literature. Section III investigates investment and financing patterns in the US airline industry.
Section IV presents data on the magnitude of jet fuel costs and jet fuel hedging by the sample of
airlines. Economic exposure to fuel price risk for US airline firms is also examined in Section
IV. The value of hedging is analyzed in Section V, and we investigate whether the hedging
premium is associated with the investment opportunities framework. Section VI concludes the
paper.
II. Literature Review
A. General Overview
Much of the theoretical research in corporate risk management identifies value-
maximizing rationales for hedging.2 Empirical research in this area primarily focuses on
identifying the rationales that are associated with corporate hedging behavior. For example,
many published articles conclude that firms hedge to reduce expected costs of distress.3 Other
2 These articles include Bessembinder (1991), Froot et al. (1993), Mello and Parsons (2000), and Smith and Stulz (1985). 3 Berkman and Bradbury (1996), Dolde (1995), Gay and Nam (1998), Graham and Rogers (2002), Haushalter (2000), and Howton and Perfect (1998) are examples of papers reaching this conclusion.
5
papers deduce that firms hedge because of high investment opportunities.4
While empirical research in hedging has identified rationales that drive corporate
derivatives usage, there is little evidence to date that these financial policies assist in value
creation. Two recent studies make attempts to address this shortcoming. Allayannis and Weston
(2001) examine the effect of currency derivatives usage on relative market value (as defined by
Tobin�s Q). They find a positive relation between currency hedging and Tobin�s Q, and interpret
this as evidence that hedging improves firm value. Graham and Rogers (2002) test the effect of
derivatives hedging on debt in a capital structure model. They find that hedging has a positive
effect on debt ratios. They measure the incremental tax benefits of the additional debt due to
derivatives hedging, and show that the average hedging firm achieves gross tax benefits of
approximately $30 million.
This paper seeks to provide additional evidence on the market value impact of hedging
policy. Our aim is to identify the value effect of a single hedging policy in an investment and
financing environment where hedging should be valued as in the theoretic framework discussed
by Froot et al. (1993). We discuss their setting in more detail next.
B. Investment, Financing, Cash Flow, and Hedging
Froot et al. (1993) illustrate the value of hedging for firms facing financial constraints.
Their basic framework shows that, when the costs of external capital include deadweight costs,
firms requiring outside financing will underinvest when internal cash flow is sufficiently low.
4 Allayannis and Ofek (2001), Dolde (1995), Gay and Nam (1998), Géczy et al. (1997), and Nance et al. (1993) find that hedging increases with the level of R&D expenditures.
6
Hedging generates additional cash in these states, thus circumventing the underinvestment
problem.5
An important feature of the Froot et al. (1993) model is that it allows for the firm�s
investment opportunity set to be correlated with cash flows from the hedgeable risk. If a positive
correlation exists, less hedging is necessary because the firm enjoys a natural hedge (i.e., when
cash flows are low, so are investment opportunities). Thus, hedging is more valuable to firms
with investment opportunities that are uncorrelated or negatively correlated with the risk factor�s
cash flows. Additionally, the Froot et al. model shows that if outside financing costs increase as
hedgeable cash flows decrease, then hedging becomes more valuable. In essence, hedging allows
a firm to minimize its need to access outside capital when it is most expensive.
Tufano (1998) illustrates that, by adding manager-shareholder agency costs to the Froot
et al. (1993) model, hedging may allow managers to destroy value. Tufano�s framework assumes
that managers are able to appropriate an amount in excess of the value created from an
investment project. External capital providers know this agency problem exists, and therefore,
refuse to provide capital for this project. Managers may hedge to avoid the inability to invest in
the �pet� project after low cash flow realizations.
One of the testable implications of the Froot et al. model is that investment-cash flow
sensitivity should be declining with hedging. Allayannis and Mozumdar (2000) show that
investment-cash flow sensitivity is lower for firms that hedge with foreign currency derivatives.
This result is consistent with Froot et al. (1993), suggesting that firms hedge to ensure sufficient
amounts of cash to take advantage of valuable investment opportunities during periods of
unfavorable cash flow shocks. Alternatively, their results may be consistent with Tufano (1998).
5 Bessembinder (1991) and Mello and Parsons (2000) make a similar argument as to the benefit of hedging.
7
Hedgers may be insulating investment from the scrutiny of outside investors so managers can
obtain private benefits from �pet� projects.
Adam (2002) studies the implications of Froot et al. (1993) in a sample of North
American gold mining firms. He provides evidence suggesting that firms with higher expected
investment hedge a greater degree of expected investment. Furthermore, he documents that the
positive relation between investment and external financing is smaller for hedging firms. He
interprets the combination of results as indirect evidence consistent with Froot et al. (1993).
Nevertheless, Adam does not examine the value implications of hedging, so his results may also
be consistent with Tufano (1998).
We show in the next section that the US airline industry provides a natural industrial
setting to examine hedging in the context of the Froot et al. (1993) framework. Ultimately, our
goal is to address whether hedging allows airlines to increase value. We test this hypothesis in
Section V.
C. What About Other Hedging Rationales?
We motivate this study by illustrating the applicability of the airline industry environment
to the underinvestment rationale for hedging. However, several rationales exist for increased
value from hedging beyond the Froot et al. (1993) study. We discuss the potential applicability
of these rationales below, and argue that other value-increasing reasons for hedging do not fit the
airline data particularly well.6
First, Smith and Stulz (1985) argue that reducing the volatility of taxable income
generates greater firm value if the firm faces a convex tax function. Graham and Smith (1999)
6 Because we are interested in value effects, we do not consider managerial motives as a hedging motive (e.g., Tufano (1996)) because there is not a clear link that hedging for such reasons has a positive value effect.
8
illustrate the economic magnitude of the tax savings available from hedging as a result of
estimated tax function convexity. However, Graham and Rogers (2002) find that such tax
savings have no power to explain hedging behavior by a large cross-section of firms. We
examine whether tax function convexity may explain hedging in the airline industry by
constructing Graham and Smith�s (1999, p. 2256) predicted convexity variable for each sample
airline exhibiting a non-trivial jet fuel hedging policy. Of these 13 active jet fuel hedgers, the
Graham and Smith regression predicts tax savings (as a percentage of taxable income) in excess
of 2.5 percent for five firms (Airtran, America West, Amtran, Hawaiian, and Northwest) as of
year-end 2000. However, the two largest hedgers in the sample (Delta and Southwest) display
the lowest predicted convexities. In fact, Southwest is predicted to have an effectively concave
tax function. We also multiply the predicted convexity values by taxable income to find the
implied dollar amount of tax savings from reducing volatility. As a percentage of equity market
value, the median firm�s tax benefit as a percentage of equity market value is only 0.08 percent,
and the maximum tax benefit is only 0.47 percent. Overall, the economic benefit of hedging to
take advantage of tax function convexity appears limited.
Stulz (1996) provides discussion highlighting the fact that the underinvestment costs
outlined in Froot et al. (1993) is an important indirect cost of financial distress. Alternatively,
direct costs of financial distress may be an important element in the hedging decision. As an
example of bankruptcy costs in the airline industry, Weiss and Wruck (1998) report that Eastern
Airlines incurred $114 million in direct costs associated with its bankruptcy case. In Weiss and
Wruck (1998), estimates of Eastern�s value at the date of Chapter 11 filing ranged from $3.51
billion to $4.929 billion. Thus, even if hedging completely eliminates the possibility of
bankruptcy (which is improbable), the increase in Eastern�s value from reduced expected
9
bankruptcy costs is 2.3 � 3.2 percent. However, this estimate is only an upper bound because of
declining equity values prior to the bankruptcy filing.
Another source of value from hedging is related to reduction of distress probability.
Leland (1998) argues that firms capable of significantly reducing distress probability by hedging
would increase financial leverage upon hedging to achieve additional tax benefits. Graham and
Rogers (2002) find that this strategy yields significant economic benefits for a number of
hedging firms. If airlines follow such a strategy, we should observe increases in leverage by
hedging firms in recent years as jet fuel hedging has become more pervasive. However, hedging
airlines have typically decreased debt levels during the study�s time frame.
The discussion above suggests that the benefits of hedging from tax convexity, expected
direct bankruptcy costs, and increases in debt tax shields would be small for airlines over the
time frame studied. Given that we find a hedging premium of 12-16 percent in our analysis, it
seems the hedging rationales discussed above are relatively unimportant for airlines. Thus, we
focus our attention on explaining why the airline industry fits the framework of the
underinvestment rationale for hedging as presented by Froot et al. (1993).
III. Investment, Jet Fuel Costs, Cash Flow and Financing in the Airline Industry
A. Relation of Investment, Jet Fuel Costs and Cash Flow
There are two major ways in which hedging can assist in an airline�s ability to invest.
First, new aircraft purchases must be planned years in advance, and purchase orders submitted to
the aircraft manufacturer. Purchase orders are disclosed as firm commitments in the financial
statement footnotes; however, the orders appear to include deferral/cancellation options as most
carriers recently exercised such options following the World Trade Center attacks. Hedging
preserves internal cash flow to meet future commitments to purchase aircraft.
10
Second, periods of economic downturn often result in failure and/or asset sales by
financially weak airlines. Financially stronger airlines may be in a position to buy these assets at
prices below fair value (e.g., Pulvino, 1998, 1999). Investment may also take the form of
acquisition of a financially weak carrier. Kim and Singal (1993) show that such acquisitions
typically yield higher fare environments upon completion of the acquisition. If hedging improves
its cash position during economic downturns, the hedged airline may rely less (or not at all) on
external sources of funds to make such capital expenditures (e.g., Froot et al., 1993). For
example, AMR discloses that its purchase of TWA during 2001 was funded with existing cash
and assumption of TWA debt.
Froot et al. (1993) show that firms find hedging more valuable the lower the correlation
between investment opportunities and cash flows resulting from hedgeable risks. For airlines,
this framework implies that hedging makes sense if airlines possess valuable investment
opportunities when jet fuel prices are high (and internal cash flow is low as a result).
To analyze whether the airline industry is characterized by the investment and financing
environment discussed in Froot et al. (1993), we examine aggregate airline industry data on jet
fuel costs, investment expenditures, and cash flow from 1979-2000. All airlines with at least
$100 million in assets in the Compustat active and research databases are included in the
aggregate statistics for investment expenditures and cash flows. The Froot et al. (1993)
framework implies the higher the correlation between jet fuel costs and investment, combined
with a negative relation between jet fuel costs and cash flow, the greater the benefit to hedging.
Table 1 illustrates the annual patterns of jet fuel costs, cash flow, and investment
spending for US airlines during 1979-2000.7 The first column shows the level of industry jet fuel
7 Per gallon jet fuel costs are not adjusted for inflation in the analysis presented in this section. As a robustness check, the analysis is repeated with inflation-adjusted jet fuel costs, but not reported in the text. Adjusting jet fuel costs for inflation does not affect the general conclusions reached in this section. As a side note, inflation in per
11
costs per gallon, as reported by the Air Transport Association. The cost of jet fuel has varied
significantly over time. The average cost of jet fuel during 1979-2000 is about 69 cents per
gallon. However, jet fuel prices were at their highest levels during the early 1980�s, so the
average over this time frame likely does not reflect current expectations.
Figure 1 illustrates the airlines� more recent jet fuel costs. Panel A of Figure 2 shows the
monthly industry jet fuel costs from January 1988 through November 2001, as reported by the
Air Transport Association. Domestic jet fuel costs principally range between 50 and 70 cents per
gallon. The chart shows the spike occurring before and during the Persian Gulf War, and the
more recent increases occurring during 2000.
Panel B of Figure 1 shows spot jet fuel prices at various locations around the US, as
reported daily by the Oil Price Information Service (OPIS), beginning in January 1994 through
June 2001. These prices more accurately reflect the base purchase price of jet fuel (depending on
the region). Jet fuel supply contracts are typically based on reported regional jet fuel prices (plus
or minus a differential for different airports). During 1994-2000, average daily jet fuel prices fall
in the range of 55.8 cents per gallon (on the Gulf Coast) to approximately 62.5 cents per gallon
(in Los Angeles and San Francisco). The volatility of jet fuel price ranges from about 15.2 cents
per gallon (Gulf Coast) to almost 17 cents per gallon (San Francisco). The standard deviations
are virtually identical if computed using monthly average jet fuel prices, as opposed to daily
prices.
The second column of Table 1 shows net income plus depreciation (scaled by book value
of assets). Industry cash flow was relatively low during the first half of the 1990�s, and has since
recovered to above average levels. The third column shows industry capital expenditures as a
gallon jet fuel costs may be offset by fuel-saving measures used by airlines, such as using more fuel-efficient
12
percentage of book value of assets. Capital expenditures range from 6.6 percent in 1995 to 18.4
percent in 1979. The final set of columns in Table 1 presents summary statistics of investment
percentages computed across firms for each year. These data suggest that there is significant
variation in the investment spending of airlines during any given year. The average data exhibit
similar patterns as observed in the aggregate industry investment data. Specifically, investment
spending was relatively high during the 1980�s, followed by a decline through 1996. The most
recent years have been characterized by investment spending percentages last observed in the
late 1980�s.
Figure 2, Panel A shows annual jet fuel costs for the period 1979-2000 on the x-axis and
industry capital expenditures (scaled by the end-of-year book value of industry assets) on the y-
axis.8 The figure presents the regression line estimated by OLS, and suggests that aggregate
airline investment is high during periods of high fuel prices. While statistical significance is only
marginal in this regression, the important point is that, in aggregate, airlines do not offset higher
fuel costs by lowering capital expenditures. This is one of the key aspects of the Froot et al.
(1993) framework. Nevertheless, this presents only one necessary condition for hedging to be
useful. Jet fuel costs must be negatively associated with cash flow.
Figure 2, Panel B, shows the regression line through the historical data on airline cash
flow and jet fuel costs. Higher jet fuel costs are typically associated with lower industry cash
flow (as defined by net income plus depreciation scaled by total assets).9 Although statistical
airplanes, etc. 8 All results discussed are similar if flow variables (such as capital expenditures) are scaled by assets as of the prior year-end. 9 Given that airlines must commit to aircraft orders in advance, we examine the relation between investment and cash flow lagged two years. We find that the relation between investment and cash flow lagged two years is positively related (with weak statistical significance over 1979-2000). So, high levels of investment may be indicative of high cash flows at the time when the investment decision is binding. However, this finding does not eliminate the positive relation between investment and jet fuel costs. The level of jet fuel costs remains positively related to investment even when controlling for lagged cash flow (although statistical significance declines slightly).
13
significance is not strong, the overall basic pattern that emerges is one that is consistent with the
Froot et al. (1993) theoretical framework.
The relations above incorporate data from the early 1980�s (i.e., as the industry was being
deregulated). To address concerns that the results discussed above may be driven by conditions
more reminiscent of the early 1980�s, we examine the data using only observations from 1987 �
2000. The implications of the results using more recent data remain: airline capital expenditures
are high during periods of higher fuel costs, even while cash flow is typically lower.
One additional concern is that the relation between jet fuel costs and cash flow may drive
the relation between jet fuel costs and investment. To examine this, we perform multivariate
regressions of the investment measures on both jet fuel costs and cash flow measures. The
positive relation between jet fuel costs and investment, while statistically weakened by the
inclusion of cash flow measures in some cases, remains similar to the relations reported earlier.
In fact, the positive coefficient on jet fuel costs is of considerably greater significance than the
negative coefficient on cash flow.
B. Costs of Financial Distress and the Airline Financing Environment
An additional extension of the Froot et al. (1993) argument is that external finance is
increasingly expensive when the hedgeable risk factor negatively affects cash flows (i.e., when
jet fuel costs are high). The source of the additional deadweight cost may be the result of distress
costs, information asymmetry, as well as other possible sources. Pulvino (1998) presents
evidence that airlines face significant distress costs. He shows that aircraft are often sold in �fire
sales� by financially troubled airlines. In this context, Froot et al. (1993) implies that airlines
would want to hedge against rising fuel prices if this strategy makes it possible to invest in
aircraft (and other assets) of financially distressed airlines at discount prices. Alternatively,
14
airlines may wish to hedge to avoid the possibility of selling assets at below-market values, thus
reducing expected financial distress costs (e.g., Smith and Stulz, 1985). However, as will be seen
in the next section, smaller airlines (which face higher proportional costs of distress) hedge much
less than the largest firms in the industry. Thus, the Froot et al. (1993) arguments seem more
compelling in explaining airline hedging behavior.
To examine the relative cost of airline debt financing, we gather the S&P ratings for
senior debt of the 15 sample airlines with ratings reported in the Compustat database. Table 2
shows the level of credit ratings as of January 1988 (or date of first rating thereafter), the median
rating during 1/1988 � 12/2000, the highest and lowest ratings experienced and the rating as of
the end of 2000. As of the end of 2000, only 3 airlines (AMR, Delta, and Southwest) have
investment grade credit ratings. At the beginning of 1988, six airlines possessed investment
grade ratings. Over the time frame examined, six airlines experience a decline in credit rating,
one filed bankruptcy, and one was purchased after filing bankruptcy. Four airlines had no net
change in credit rating over the period studied, and three airlines experienced increases in their
credit ratings. The lower portion of the table shows the years of rating changes. The 1990-1994
period was characterized by relatively high jet fuel prices, recession, and subsequently low cash
flows. During this time frame, credit ratings typically declined. Twenty-two credit downgrades
occurred for seven airlines (versus only one upgrade). Continental, Trans World Airlines, and
America West all filed Chapter 11 bankruptcy during this period as well (as well as other notable
cases, such as Pan Am).
While jet fuel prices are not the sole source of the cash flow declines mentioned above, it
is worth noting that they were relatively high during 1990 as the industry slump began.
Alternatively, as jet fuel prices fell significantly during 1997-1999, airline debt was often
upgraded. Eight credit upgrades (over seven airlines) occurred during 1997 and 1998. However,
15
this upgrade activity did not offset much of the downgrades occurring in the early 1990�s. These
observations imply that airlines face lackluster credit markets. As we have recently seen in the
wake of the World Trade Center attacks, external shocks can have devastating impact on the
industry�s cash flows. Interestingly, the last major cash flow shock of the 1990�s occurred during
a period when major airlines had better credit ratings. In the current environment, hedging may
be much more important to airlines wishing to take advantage of future periods of industry
consolidation.
The data presented thus far suggests that firms in the airline industry may have significant
investment opportunities when cash flows are low. Furthermore, industry investment has been
positively related to the level of jet fuel costs, suggesting that airlines could hedge to preserve
cash flow to use for such investment. Hedging may be important in this respect because airlines
face significant distress costs, and typically face low credit ratings. In the next section, we
present summary data regarding airline cost structures and jet fuel hedging practices over 1994-
2000.
IV. Airline Fuel Cost Structures, Hedging, and Exposure to Volatile Fuel Prices
A. Airline Fuel Costs and Hedging
Table 3 lists the 27 US airlines (defined as firms with SIC codes 4512 or 4513) with
available data on the Compustat database as of 2000. Our analysis includes only airline
companies.10
10 We do not include other types of transportation firms (such as railroads and trucking companies) because they typically face very different fuel price risk exposures. For example, Banham (2000) notes that railroads are less affected by fuel price increases because diesel cost increases are partially offset by increased revenues from delivering coal (i.e., an alternative fuel source). Airlines typically lack these types of natural hedges.
16
Table 3, Panel A, shows average revenues, available seat mile (ASM) and market share
data for each airline. Airlines are classified as major carrier (10 airlines), national carrier (15
airlines), or regional/commuter carrier (2 airlines) using the following Air Transport Association
of America classifications: major carriers have annual revenue of more than $1 billion, national
carriers have annual revenues between $100 million and $1 billion, and regional carriers have
annual revenues of less than $100 million and their services are limited to a particular geographic
region. Average revenues for each firm are calculated as the average over 1994-2000. ASM
represents one seat flown one mile.11 Market share is calculated as the percentage of total ASM
for the period 1994-2000 that the airline flew. The top seven airlines, ranked by ASM, account
for 86.4 percent of seat-miles flown by the sample firms.
Table 3, Panel B summarizes fuel usage and costs, jet fuel hedging policy and other
institutional arrangements affecting fuel costs. For the full sample of airlines, fuel costs average
just over 13 percent of operating costs during the 7-year period. The percentages ranged from 7.9
percent (World Airways) to 18.8 percent (Amtran). Jet fuel expenses are slightly lower, on
average, for the major airlines. Their costs range from about 10 � 15 percent. Average fuel cost
per available seat mile during the period was $0.0153 with a range of over 2 cents between the
high of $0.03 (Great Lakes Aviation) and low of $0.0098 (Southwest Airlines). The average
amount of jet fuel consumed annually during 1994-2000 is 662 million gallons per airline.
The next set of three columns in Table 3, Panel B, reports information (from 10-K
filings) on jet fuel hedging by the sample airlines. We show the calendar years in which fuel
11 For example, an airline with 100 passenger seats, flown a distance of 100 miles, represents 10,000 available seat miles (ASM).
17
hedges are in place as of fiscal year-end, maximum maturity of the hedge in years, and
percentage of next year�s fuel requirements hedged, respectively.12
Major airlines are more commonly hedgers of jet fuel purchases than are smaller firms.
Appendix A, Panels A and B, illustrates sample disclosures of jet fuel hedging. While all major
airlines hedged during part of the period 1994-2000, only AMR and Southwest Airlines hedged
over the entire period. Sixteen of the 27 firms reported hedging jet fuel in at least one year during
1994-2000. Of hedging firms, the average hedged percentage of next year�s fuel consumption is
approximately 19 percent. We observe wide variation in the amount of fuel hedged, even among
hedgers. Delta Air Lines hedged an average of 68 percent of next year�s fuel consumption, while
US Airways hedged only about 6 percent. Recently, Southwest Airlines had 80 percent of its
2001 fuel consumption hedged as of the end of 2000. Most hedging airlines also report the
maximum maturity of jet fuel hedges. Southwest, AMR, and Delta recently increased their
maximum hedge maturities to 3 years. All other airlines limit their derivative maturities to 1 year
or less.
Within the industry, some airlines use additional avenues to protect cash flows from
rising fuel prices. For example, some smaller carriers contract with major airlines to provide
service to smaller communities near the major airline�s hub. These carriers may have a fuel pass-
through agreement where the major carrier absorbs the risk of fluctuating fuel prices. Panel B of
Table 3 indicates if carriers disclose such fuel pass-through agreements. Similar to fuel pass-
through agreements, charter airlines typically do not bear the risk of fluctuating fuel prices. The
charter�s customer reimburses fuel costs. The final column of Table 3, Panel B indicates airlines
12 Disclosure of commodity derivatives is not required under SFAS 119 (the FASB standard for derivative disclosure starting in 1995). However, we are able to generally ascertain firm-years in which airlines use derivatives to hedge fuel purchases. Beginning in 1997, disclosures regarding significant market risks became required under SEC guidelines. Airlines often discuss their market risks with respect to jet fuel under this requirement.
18
classified as having charter operations.13 Appendix A, Panel C, shows samples of disclosures
regarding fuel pass-through agreements and fuel arrangements associated with charter
operations.
B. Exposure to Fuel Price Volatility
An obvious issue regarding fuel price risk that we have not addressed thus far is �how
much economic exposure to volatile fuel prices do airlines face?� We address this issue briefly
by illustrating that, on average, airlines face negative cash flow and stock price consequences
from increases in the price of jet fuel.
Guay and Kothari (2003) suggest a measure of cash flow sensitivity to price risk in which
a three standard deviation price change is used to illustrate the effects of an extreme move in
underlying asset prices. In the case of jet fuel, a 45-cent (per gallon) change represents
approximately three standard deviations (as discussed in Section III.A.). Thus, for each firm-year
observation, we multiply gallons consumed by 45 cents to estimate the cash flow impact of an
extreme jet fuel price change. Scaling this amount by firm-year capital expenditures provides an
estimate of the decline in investment possible if jet fuel prices increase dramatically from one
year to the next. Across 144 firm-years, the median of this value is 94 percent. Alternatively,
this measure may be interpreted as the relative cash flow resulting if the firm has hedged 100
percent of its fuel consumption. The median percentage of next year�s fuel consumption hedged
is 23 percent (for firms that hedge). Multiplying the prior amounts by 23 percent suggests that
�normal� amounts of hedging would generate cash flow equal to 21.62 percent of capital
expenditures in the event of an extreme price move. By contrast, Guay and Kothari (2003) find
13 Charter carriers are defined as airlines that disclose that a significant part of their business is due to charter operations.
19
that the median firm in its sample would generate cash flow amounting to only 9 percent of
investing cash flow (capital expenditures are greater than or equal to investing net cash flow for
over half of our sample). Clearly, jet fuel hedging by airlines is economically meaningful in
terms of Guay and Kothari�s measure.
An alternative approach to measuring exposure is to estimate the effect of actual changes
in jet fuel prices on operating cash flow. To examine this effect for each firm in our sample, we
regress the year-over-year changes in quarterly operating income before depreciation (as a
percentage of sales) on the changes in quarterly average jet fuel price (in cents per gallon).14,15
In untabulated results, we find that the median coefficient from the regression above is
-0.0013, suggesting that airlines face significant cash flow risk from rising jet fuel prices. A 15-
cent increase in jet fuel price (recall the standard deviation of Gulf Coast jet fuel prices was just
over 15 cents) implies a decrease of 1.95 percent in cash flow as a percentage of sales. To put
this in context, the median airline quarterly cash flow as a percentage of sales is 10.4 percent.
Thus, a roughly one standard deviation increase in jet fuel price corresponds to approximately a
18.75 percent decrease in cash flow margin, on average (i.e., 1.95 ÷ 10.4).
As a final measure of exposure, we estimate a market model that includes a weekly jet
fuel return factor. This type of methodology is standard in other research examining risk
exposures.16 For each firm-year in our sample, we conduct the following weekly time-series
regression:
14 Year-over-year changes in quarterly data are used because of seasonality in airline operating income. The jet fuel prices used are simple averages of the five regional prices presented earlier averaged over the 3 months in each quarter. The data observations are from first quarter of calendar 1995 through the fourth quarter of calendar 2000. 15 Common practice in exposure research (such as measuring currency exposure) is to use percentage change in the independent variable. This approach is appropriate when measuring stock return exposure. However, in this regression, we measure cash flow exposures to jet fuel price changes. A 15-cent price change should have similar cash flow effects on airlines whether jet fuel price is at 40 cents per gallon or 80 cents per gallon.
20
Rit = αi + βiRmt + γiRJt + εit, (1)
where Rit is the rate of return on the ith company�s common stock in week t (as gathered from
CRSP), Rmt is the return on the CRSP value-weighted market portfolio, RJt is the percentage
change in OPIS jet fuel prices, and εit is the idiosyncratic error term.17 For each firm, the
estimated coefficient, γi, is a measure of the sensitivity of a firm�s stock price to changes in jet
fuel prices. We expect airlines to be negatively exposed to the price of jet fuel.
In untabulated results, we find that, on average, airlines� stock prices are negatively
related to jet fuel prices, but the effect of short-term fluctuations in fuel prices is economically
small (and coefficients are rarely statistically significant). The average jet fuel exposures range
from �0.061 using the Gulf Coast jet fuel prices to �0.079 using New York prices.
V. Do Investors Value Jet Fuel Hedging?
A. Measurement of Firm Value
Thus far, we have shown that airlines have incentives to hedge jet fuel exposures to
protect internal cash flow, and that jet fuel cost levels tend to be negatively correlated with
industry investment. These conditions suggest that, if the market expects airlines to invest
marginal cash flow in positive net present value projects, then investors should place positive
value on jet fuel hedging. On the other hand, if investors view such investment unfavorably,
hedging would have negative value consequences. The purpose of this section is to examine the
relation between airline firm value and jet fuel hedging practices.
16 Currency exposures are studied by Bartov and Bodnar (1994), Bodnar and Wong (2000), Jorion (1990), and Pantzalis, Simkins, and Laux (2001). Petersen and Thiagarajan (2000) estimate gold price exposures for gold mining firms. 17 When examining currency exposures, Bodnar and Wong (2000) point out that using the value-weighted index can distort the sign and size of the resulting exposures because of an inherent relation between market capitalization and exposure. They recommend using the equal-weighted index to prevent this distribution shift. We derive similar results if we use the equal-weighted market index.
21
We investigate whether airlines� jet fuel hedging activities positively affect value by
estimating the empirical relationships between Tobin�s Q (our proxy for firm value) and jet fuel
hedging. Our approach is similar to the procedure used by Allayannis and Weston (2001) to
investigate the relation between firm value and the use of foreign currency derivatives.
We measure firm value using the simple approximation of Tobin�s Q, developed by
Chung and Pruitt (1994).18 This method offers several advantages: first, the computational cost is
low relative to other more complex methods of calculating Tobin�s Q. Second, the data are
readily available using COMPUSTAT for small, as well as large, firms. Finally, Chung and
Pruitt (1994) and Perfect and Wiles (1994) find a high degree of correlation between the simple
approximation and more rigorous constructions of Q.19 DaDalt, Donaldson, and Garner (2003)
note these three advantages of utilizing a simple construction of Q, and conclude that the simple
Q calculation is preferable in most empirical applications. Given the proportion of smaller firms
in our sample, the availability of data is an especially important issue.
Because our purpose is to investigate the link between jet fuel hedging and value, we
require variables to measure such hedging by airlines. In Section 4, we discuss ways by which
airlines manage fuel price risk: hedging with derivatives, entering into fuel pass-through
agreements, and passing fuel cost changes along to charter customers. We form dummy variables
indicating each type of fuel price risk management and a dummy indicating usage of any of the
18 The Q ratio is calculated as the following sum divided by book value of total assets: (market value of equity + liquidation value of preferred stock + the book values of long-term debt and current liabilities � current assets + book value of inventory). We use Compustat to obtain the accounting data for our control variables, as well as to calculate Tobin�s Q. We use Moody�s Industrial Manual to obtain the yields on preferred stock for medium-grade industrials. 19 Perfect and Wiles (1994) find that regression results using the simple approximation may differ from more complex estimations of Tobin�s Q. However, when estimating relationships using changes in values, the simple approximation produces similar results to the other calculations of Q. We conduct tests using both value levels and changes.
22
three types. However, in subsequent regression analysis, only hedging with derivatives shows
any explanatory power, so we limit our analysis to this type of variable.
We measure jet fuel hedging with derivatives in three ways. First, we define a hedging
dummy if the airline discloses any use of derivatives to hedge jet fuel exposure, even if no other
information is given. Second, for most of our data, firms disclose the percentage of its coming
year�s jet fuel requirements that it has hedged as of year-end. Finally, we define a dummy
variable that is equal to one if the percentage hedged is greater than zero.
Our sample consists of 26 airlines over a maximum period of 1994 � 2000 with a total of
164 firm-year observations of Tobin�s Q. Table 4 shows summary values of Q for each firm in
the sample. The data are separated into major versus smaller carriers. The first two columns
show Q-ratios calculated using the Chung and Pruitt (1994) approach. The second set of Q-ratios
is adjusted to reflect the amount of obligations existing under operating leases. Because airlines
often lease a significant portion of their aircraft, reported assets may be well below assets
actually controlled by the airlines. The adjustment process used is explained in Damodaran
(2002), and is used to find the present value of future operating lease obligations. This present
value is then added to assets and debt, thus adjusting the value of Q.
Table 4, Panel A, shows that most airline Q-ratios are well below 1.0. This is true for
both major airlines, as well as other carriers. However, Q does display significant variation
across airlines and time. Eleven of the 26 airlines have average Q-ratios greater than 1.0 over
1994-2000. However, only two of these observations are from major airlines.
Panel B of Table 4 shows that average Q-ratios vary considerably over the sample period,
especially for non-major airlines. In general, the data show no clear time trend, however, the Q-
ratios of major airlines are more skewed in the last three years of the sample. The adjusted Q-
ratios exhibit less skewness because the adjustment process tends to push the values toward one.
23
B. Control Variables
Other factors, in addition to hedging, affect firm value. To control for these other effects,
we include proxy variables to account for the following factors. In general, we structure the
control variables to be consistent with those in the regression analysis of Allayannis and Weston
(2001).
Size: Several prior studies find that large firms are more likely to use derivatives due to
the high start-up costs necessary to develop a hedging program (see Nance et al., 1993; Mian,
1996; and Géczy et al., 1997). This effect is apparent in our sample as well (see Table 3). Thus,
a positive effect between hedging and value may be due to a positive relation between size and
value. For this reason, we include the natural logarithm of total assets to control for the effect of
size. Allayannis and Weston (2001) find a negative relation between size and value in their
sample.
Dividends: Following Allayannis and Weston (2001), we include a dummy variable if the
firm paid a common dividend during the current year. Firms paying dividends are less likely to
be capital constrained (e.g., see Fazzari, Hubbard, and Petersen, 1988) and thus may overinvest
by accepting negative net present value projects. On the other hand, dividends may be seen as a
positive signal from management (especially in an industry that has experienced a significant
number of bankruptcy filings). Additionally, the initiation or increase (elimination/reduction) of
a dividend is likely to be seen as positive (negative) by the market. Allayannis and Weston
(2001) show contrasting evidence on the relation between dividend payment and firm value.
Leverage: Capital structure may affect firm value as well as the firm�s decision to hedge
if a higher level of debt, and hence, a higher probability of financial distress, induces the firm to
hedge (e.g., Haushalter, 2000; and Graham and Rogers, 2002). We use the ratio of long-term
24
debt to total assets as a control for leverage. Leverage has an ambiguous effect on firm value in
Allayannis and Weston (2001).
Profitability: Because the marketplace is likely to reward more profitable firms, highly
profitable firms are expected to have higher values of Tobin�s Q. We include return on assets
(ROA) to control for profitability. Allayannis and Weston (2001) find a positive relation between
ROA and firm value.
Investment opportunities: Firms with greater investment opportunities are likely to be
valued higher by the market. Froot et al. (1993) and Géczy et al. (1997) argue that firms that
hedge are more likely to have greater investment opportunities. We use the ratio of capital
expenditures to sales as a proxy for investment opportunities. Allayannis and Weston (2001) find
weak evidence of a positive relation between this variable and firm value.
Time effects: To control for the possibility of systematic time effects on airline firm
value, we include dummy variables to indicate each year from 1996 through 2000 in all
regressions on the levels of Q and indicator variables for 1997 through 2000 in the regressions on
changes in Q. We do not report the results for these dummy variables in the tables presented.
C. Results � Firm Value and Hedging
Table 5 presents the results for the estimation of the effect of jet fuel hedging on airline
firm value. As in Allayannis and Weston (2001), the natural logarithm of Q is the dependent
variable. By using the natural logarithm of Q, we can interpret coefficients on hedging dummy
variables as the hedging premium. Models 1 through 3 are estimated using pooled OLS with
robust standard errors, while Models 4 through 6 are estimated using a time-series cross-
sectional GLS procedure with a heteroskedastically consistent covariance matrix.
25
The results for the regressions yield several interesting results. First, the estimates for
size are always negative and highly significant, indicating that larger size in the airline industry
does not convey an advantage, with respect to firm value. This result is consistent with those in
Allayannis and Weston (2001). Second, the parameter estimates for the dividend dummy
variable are positive and significant in all models. In contrast, Allayannis and Weston (2001)
find that firms with foreign sales show a negative relation between the dividend dummy and firm
value, while firms with zero foreign sales show a positive relation between the two. Our results
suggest that airlines use dividends to signal their financial success.
We find relatively strong support for the role of hedging as a factor in firm value.
Hedging jet fuel exposure with derivatives shows positive and statistically significant relations
with airline firm value using all three measures of jet fuel hedging. The results are similar if we
use the adjusted Q-ratios discussed earlier, but we do not report these for the sake of brevity.20
While statistical significance provides confidence that a value premium exists, we are
equally (if not more) interested in the economic significance of the relation between hedging and
value. Allayannis and Weston (2001) suggest that firms with positive foreign sales command
close to a 5 percent premium for hedging currency risk. Our parameter estimates on the hedging
dummy variables suggest that airlines hedging jet fuel demand a value premium in the range of
14.94 - 16.08 percent. When using the percentage hedged, the coefficient represents the average
premium implied if an airline were to hedge 100 percent of its following year fuel requirements.
Given an average hedging percentage of 19 percent, the corresponding premium is
approximately 9 percent (0.4745 x 0.19). The magnitude of the jet fuel hedging premium relative
20 The regressions shown in Tables 5 and 6 are also conducted using fixed effects. The Table 5 (level of Q) models show evidence that the firm-specific effects are significant. However, firm-specific effects are not found in the change in Q (Table 6) models. Performing fixed effects detracts considerably from the statistical significance of all variables except ROA and percent hedged. Specifically, the percent hedged variable shows significance at the 10% level in the fixed effects models.
26
to the 5 percent currency hedging premium found by Allayannis and Weston may be due to their
inclusion of many firms with relatively small foreign exchange exposures. Our study focuses
solely on companies that spend a significant amount of money on jet fuel, thus are more likely to
face larger value consequences when choosing whether or not to manage this risk.
An alternative means to measure the value consequences of hedging is to measure the
change in value when firms change hedging policy. In fact, this type of regression is less likely
to suffer from endogeneity that may call the Table 5 results into question. Table 6 shows the
results of regressions examining the changes in firm value (i.e., changes in the natural logarithm
of Q) versus the changes in the independent variables.
The addition of a hedging program using derivatives is positively related to firm value.
Specifically, the dummy variable indicating a change from no hedging to a material amount of
hedging shows a positively and statistically significant association with change in firm value.
The coefficient on this variable may also be viewed as a hedging premium and the size of these
coefficients, while slightly smaller than those shown in Table 5, are of similar magnitude. The
evidence here suggests hedgers are 12.33 - 13.68 percent more valuable as a result of initiation of
measurable jet fuel hedging. On the other hand, the market appears to place less value on
changes in the extent of hedging. The coefficients on the changes in percentage hedged are
positive but not statistically significant.
D. Is the Hedging Premium Related to Investment Opportunities?
Earlier in the paper, we postulate that the benefit from jet fuel hedging is primarily
related to the reduction of underinvestment as theorized by Froot et al. (1993). The analysis
presented in the prior section establishes a positive relation between hedging and firm value.
However, the prior analyses do not show a link between fuel hedging by airlines and their
27
investment opportunities. In this section, we discuss results of analyses designed to ascertain
whether such a rationale explains the hedging premium.
As an initial test, Table 7 shows the results of two regression models that are comparable
to Models 3 and 6 from Table 5. The only difference is the inclusion of an additional
independent variable measuring the interaction of hedging with capital expenditures. The
variable is computed as the product of the hedging indicator and the capital expenditures-to-sales
ratio. In these specifications, the hedging dummy variable shows no significant relation with firm
value, while a positive relation is evident on the interaction of capital expenditures and hedging.
Given the binary specification of hedging, the positive relation may be interpreted as follows: for
hedgers, an increase in capital spending creates more value, all else equal. Using the coefficients
from Model 1 of Table 7, at the average level of capital expenditures-to-sales of 11 percent, a
hedging firm is expected to be valued 12.8 percent higher than a non-hedging firm ((1.33 x 0.11)
+ -0.018). In fact, over 100 percent of the hedging premium is attributable to the interaction of
capital expenditures and hedging in Model 1. The analysis presented in Model 2 using GLS
implies that the hedging premium is approximately 15 percent ((0.98 x 0.11) + 0.042), while the
interaction of investment and hedging constitutes approximately 72 percent of this premium
((0.98 x 0.11) ÷ 0.15).
While the analysis above is not a direct test that jet fuel hedging reduces the
underinvestment problem for airlines, it does establish that capital spending is more valued for
hedgers than for non-hedgers. Why might this be? A reasonable argument would be that jet fuel
hedging makes future capital spending less susceptible to future increases in jet fuel prices. Thus,
current capital expenditures may be more reflective of future capital expenditures. As a result,
investors may place additional value on capital expenditures made today by hedgers because of
greater confidence that these are a better proxy for future investment opportunities.
28
Thus far, we have limited the analysis to one-stage regression specifications. Much prior
research in hedging has noted that a firm�s hedging decision may be part of a simultaneous
system.21 The theoretic framework for our empirical study suggests the following link (e.g.,
Bessembinder (1991) and Froot et al. (1993)): 1) the hedging decision is made at time 0, 2) the
outcome of investment decisions (i.e., capital expenditures) are observed between time 0 and
time 1, and 3) firm value and the firm�s next hedging decision are observed at time 1. This
sequence of events implies the following two-stage empirical framework:
Capital expenditurest = f(hedgingt-1, other controls)
Firm valuet = f(capital expenditurest, hedgingt, other controls)
To model this framework, we estimate capital expenditures as an instrumental variable from the
other independent variables shown in the analysis presented in Table 5. We also add cash flow-
to-sales, lagged Q, and lagged hedging variables to the capital expenditures specification.22 The
fitted values from the first-stage capital expenditures estimation are then utilized in the second-
stage estimation of Q.
Table 8 presents results of the first-stage estimation of capital expenditures-to-sales, and
the second-stage estimation of Q. To obtain the estimated hedging premium from this system, we
first add the two hedging coefficients in the first-stage estimation then multiply this sum by the
coefficient on the capital expenditures variable in the second-stage estimation. This portion
represents the hedging premium associated with its effect on the firm�s capital spending. To
21 Géczy et al. (1997) and Graham and Rogers (2002) model hedging and leverage as simultaneous decisions. Tufano (1996) notes that executive compensation and hedging decisions are made simultaneously. Rogers (2002) models the simultaneity of executive portfolio structure and hedging. Conducting tests for endogeneity (e.g., Kennedy (1992)) of hedging in the value regression (and vice versa), we find no support for a simultaneous system of equations involving value and hedging. 22 Fazzari et al. (1988) model investment as a function of cash flow and Q to estimate investment-cash flow sensitivity.
29
obtain the total hedging premium, we then add the coefficient on the hedging variable in the
second-stage Q estimation.
As may be seen in Models 1 through 3, the effect of hedging on value through both its
direct effect and its effect on capital expenditures is ambiguous. One point worth noting is that
statistical significance of the coefficients on the hedging variables is non-existent. We do not
debate this point; rather we focus on the economic significance of the coefficients in comparing
those to results from the one-stage estimations discussed earlier. On one hand, the total hedging
premiums estimated by Models 1 and 2 are similar to those shown in Table 5. In fact, the
economic magnitude of the premium appears larger in the two-stage systems relative to the one-
stage systems modeled in Table 5 (18 vs. 16 percent in Model 1 and 55 vs. 47 percent in Model
2). Meanwhile, Model 3 uses a dummy variable indicating that the percentage hedged is
specifically stated as greater than zero, and this variable shows a small negative effect on value
in the two-stage system.
Assuming the hedging premiums illustrated in Models 1 and 2 of Table 8 are valid, the
portion of the hedging premium attributable to the effect of hedging on capital investment is
debatable. Results of Model 1 suggest that approximately 52 percent of the hedging premium
comes from the effect of hedging on capital expenditures. On the other hand, Model 2 results
imply that more than 100 percent of the hedging premium comes from its effect on capital
expenditures.
VI. Conclusion
The US airline industry offers a unique sample allowing for a more direct test of the
value implications of hedging predicted by Froot et al. (1993). High jet fuel prices coincide with
low industry cash flows, and industry investment is positively related to the level of jet fuel
30
costs. Because jet fuel constitutes a large percentage of airline operating costs and jet fuel prices
are highly volatile, airlines face an incentive to hedge fuel price risk. Such hedging provides
firms with the opportunity to buy underpriced assets from distressed airlines during periods of
high jet fuel prices and/or protects the ability to meet previously contracted purchase
commitments.
We find that airlines employing jet fuel hedging trade at a premium, after controlling for
other factors impacting value. This result provides evidence in support of Allayannis and
Weston�s (2001) findings that hedging adds value. While Guay and Kothari (2003) question the
validity of the Allayannis and Weston results, we argue that our results offer clearer evidence
that hedging adds value because reduction of jet fuel price risk exposure is clearly economically
significant.
Furthermore, our sample choice allows us to form a more educated opinion as to the
source of value gain from hedging. Large airlines are typically in the best position to buy
distressed airlines or desired assets. Hedging future jet fuel purchases allows these firms a means
to manage a significant source of variation in cash flows. Given that jet fuel price increases often
coincide with distress in the airline industry, hedging provides an additional source of cash for
making acquisitions during these periods. Our results show that the value increase from hedging
increases with capital investment, and that this interaction provides the vast majority of the
hedging premium. This result implies that investors value hedging more in airlines where they
expect hedging to protect the ability to invest in bad times. The results of two-stage regressions,
while ambiguous regarding the existence of a hedging premium, suggest that the effect of
hedging on investment opportunities provides at least half of the hedging value premium.
One caveat of our results is necessary. If jet fuel hedging is a valuable activity, then why
don�t all airlines engage in this practice? In other words, do non-hedgers act suboptimally? The
31
answer is probably not. The hedging premiums discussed reflect the average net benefit of fuel
hedging. In the framework developed in this paper, many smaller airlines may find that
additional cash flows provided by hedging are too small to allow for acquisitions or asset
purchases at discount prices. Additionally, issues of financial strength and creditworthiness may
be a factor in some non-hedging decisions. The costs of hedging may be prohibitive for firms
with poor credit quality (i.e., such firms may not be able to find a willing counterparty). Firms
lacking adequate liquidity may also be unable to afford option premiums or cash margin on
futures contracts.
32
Appendix A Example Disclosures Illustrating Fuel Price Risk for Airlines
This appendix provides examples of fuel price risk disclosures for airlines that do not hedge (see Panel A), use fuel derivatives (see Panel B) and use fuel pass-through agreements (see Panel C). The information is collected from the 10-K reports of airlines and illustrates how exposure to jet fuel prices varies by firm based on the firm�s hedging mechanisms. Panel A: Example Disclosures From Airlines that Does Not Hedge using Fuel Derivatives From Vanguard Airlines� 1999 10K Report Jet fuel costs are subject to wide fluctuations as a result of disruptions in supply or other international events. The Company cannot predict the effect on the future availability and cost of jet fuel. The Boeing 737-200 jet aircraft is relatively fuel inefficient compared to newer aircraft. Accordingly, a significant increase in the price of jet fuel results in a disproportionately higher increase in the Company's fuel expenses as compared with many of its competitors who have, on average, newer and thus more fuel-efficient aircraft. The Company has not entered into any agreements that fix the price of jet fuel over any period of time. Therefore, an increase in the cost of jet fuel will be immediately passed through to the Company by suppliers. The Company has experienced reduced margins when the Company has been unable to increase fares to compensate for such higher fuel costs. Even at times when the Company is able to raise selected fares, the Company has experienced reduced margins on sales prior to such fare increases. From Airtran/ValueJet�s 1999 10K Report The cost of jet fuel is an important expense for The Company. The Company estimates that a one-cent increase in fuel cost would increase the Company's fuel expenses by approximately $57,000 per month, based on the Company's current fuel consumption rate. Jet fuel costs are subject to wide fluctuations as a result of sudden disruptions in supply, such as the effect of the invasion of Kuwait by Iraq in August 1990. Due to the effect of world and economic events on the price and availability of oil, the future availability and cost of jet fuel cannot be predicted with any degree of certainty. Increases in fuel prices or a shortage of supply could have a material adverse effect on the Company's operations and operating results. The Company has not entered into any agreement which fixes the price or guarantees delivery of fuel over any period of time. A significant increase in the price of jet fuel would result in a disproportionately higher increase in the Company's average total costs than its competitors using more fuel efficient aircraft and whose fuel costs represent a smaller portion of total costs. Panel B: Example Disclosures From Airlines that Use Fuel Derivatives From American Airlines 1999 10K Report The impact of fuel price changes on the Company and its competitors is dependent upon various factors, including hedging strategies. Although American's average cost per gallon of fuel in 1999 was flat in comparison to 1998, actual fuel prices began to increase in April 1999 and continued significantly throughout 1999 and into 2000. However, American has a fuel hedging program in which it enters into fuel swap and option contracts to protect against increases in jet fuel prices, which has had the effect of dampening American's average cost per gallon. To reduce the impact of potential continuing fuel price increases in 2000, American had hedged approximately 48 percent of its 2000 fuel requirements as of December 31, 1999. From United Airlines 1999 10K Report Changes in fuel prices are industry-wide occurrences that benefit or harm United's competitors as well as United, although fuel-hedging activities may affect the degree to which fuel-price changes affect individual companies�. The impact of rising fuel costs is somewhat tempered by United's fuel hedging program. United pursues an options based strategy in which the upside is retained while
33
the downside is eliminated. At the end of 1999, 75% of United's fuel exposure was hedged, but the goal is for fuel exposure in 2000 to be 100% hedged by the end of the first quarter. Panel C: Example Disclosures From Airlines using Fuel Pass-Through Agreements From Mesa Air Group�s 1999 10K Report The Company has exposure to certain market risks associated with its aircraft fuel. Aviation fuel expense is a significant expense for any air carrier and even marginal changes greatly impact a carriers profitability. Standard industry contracts do not generally provide protection against fuel price increases, nor do they insure availability of supply. However, both the USAirways and America West fee for departure contracts allow fuel costs to be passed directly back to the codeshare partner, thereby reducing the overall exposure of Mesa to fuel price fluctuations. In the fourth quarter of fiscal 1999, 62.2% of Mesa fuel requirements were associated with these contracts. A substantial increase in the price of jet fuel or the lack of adequate fuel supplies in the future would have a material adverse effect on Mesa's business, financial condition, and the results of operations and liquidity. From Skywest, Inc.�s 1999 10K Report The Company is exposed to fluctuations in the price and availability of aircraft fuel that affect the Company's earnings. Currently, the Company has limited its exposure to fuel price increases with respect to approximately 65 percent of available seat miles produced, due to contractual arrangements with Delta and United. These major airlines reimburse the Company for the actual cost of fuel on contracted flights. From World Airways 1995 10K Report Fluctuations in the price of fuel has not had a significant impact on the Company's operations in recent years. The Company's exposure to fuel risk is limited because (i) under the terms of the Company's basic contracts, the customer is responsible for providing fuel, (ii) under the terms of its full service contracts with the U.S. Government, the Company is reimbursed for the cost of fuel it provides, and (iii) under the Company's charter contracts, the Company is reimbursed for fuel price increases in excess of 5% of the price agreed upon in the contract, subject to a 10% cap.
34
References Adam, T.R. 2002. Do firms use derivatives to reduce their dependence on external capital
markets? European Finance Review 6:163-187. Allayannis, G., and Mozumdar, A. 2000. Cash flow, investment, and hedging. Unpublished
working paper, Darden School of Business, University of Virginia. Allayannis, G., and Ofek, E. 2001. Exchange rate exposure, hedging, and the use of foreign
currency derivatives. Journal of International Money and Finance 20:273-296. Allayannis, G., and Weston, J.P. 2001. The use of foreign currency derivatives and firm market
value. Review of Financial Studies 14:243-276. Banham, R. 2000. Top cops of risk. CFO. September: 91-98. Bartov, E., and Bodnar, G.M. 1994. Firm valuation, earnings expectations, and the exchange rate
exposure effect. Journal of Finance 49:1755-1785. Berkman, H., and Bradbury, M.E. 1996. Empirical evidence on the corporate use of derivatives.
Financial Management 25 (2):5-13. Bessembinder, H. 1991. Forward contracts and firm value: Investment incentive and contracting
effects. Journal of Financial and Quantitative Analysis 26:519-532. Bodnar, G.M., and Wong, M.H.F. 2000. Estimating exchange rate exposures: Some �weighty�
issues. Unpublished working paper W7497, NBER. Chung, K.H., and Pruitt, S.W. 1994. A simple approximation of Tobin�s q. Financial
Management 23 (3):70-74. DaDalt, P.J., Donaldson, J.R., and Garner, J.L. 2003. Will any q do? Firm characteristics and
divergences in estimates of Tobin�s q. Journal of Financial Research 26:535-551. Damodaran, A. 2002. Investment valuation: Tools and techniques for determining the value of
any asset (2nd ed.). John Wiley & Sons, New York. Dolde, W. 1995. Hedging, leverage, and primitive risk. Journal of Financial Engineering 4:187-
216. Fazzari, S.R., Hubbard, G., and Petersen, B. 1988. Financing constraints and corporate
investment. Brookings Papers on Economic Activity 1:141-195. Froot, K., Scharfstein, D., and Stein, J. 1993. Risk management: Coordinating investment and
financing policies. Journal of Finance 48:1629-1658.
35
Gay, G.D., and Nam, J. 1998. The underinvestment problem and corporate derivatives use. Financial Management 27 (4):53-69.
Géczy, C., Minton, B.A., and Schrand, C. 1997. Why firms use currency derivatives. Journal of
Finance 52:1323-1354. Graham, J.R., and Rogers, D.A. 2002. Do firms hedge in response to tax incentives? Journal of
Finance 57:815-839. Graham, J.R., and Smith, C.W., Jr. 1999. Tax incentives to hedge. Journal of Finance 54:2241-
2262. Guay, W., and Kothari, S.P. 2003. How much do firms hedge with derivatives? Journal of
Financial Economics 70:423-461. Haushalter, G.D. 2000. Financing policy, basis risk, and corporate hedging: Evidence from oil
and gas producers. Journal of Finance 55:107-152. Howton, S.D., and Perfect, S.B. 1998. Currency and interest-rate derivatives use in US firms.
Financial Management 27 (4):111-121. Jorion, P. 1990. The exchange-rate exposure of US multinationals. Journal of Business 63:331-
346. Kennedy, P. 1992. A guide to econometrics, 3rd edition. MIT Press, Cambridge, MA. Kim, E.H., and Singal, V. 1993. Mergers and market power: Evidence from the airline industry.
American Economic Review 83:549-569. Leland, H.E. 1998. Agency costs, risk management, and capital structure. Journal of Finance
53:1213-1243. Mello, A.S., and Parsons, J.E. 2000. Hedging and liquidity. Review of Financial Studies 13:127-
153. Mian, S.L. 1996. Evidence on corporate hedging policy. Journal of Financial and Quantitative
Analysis 31:419-439. Nance, D.R., Smith, C.W., Jr., and Smithson, C.W. 1993. On the determinants of corporate
hedging. Journal of Finance 48:267-284. Pantzalis, C., Simkins, B.J., and Laux, P. 2001. Operational hedges and the foreign exchange
exposure of US multinational corporations. Journal of International Business Studies 32:793-812.
Perfect, S.B., and Wiles, K.W. 1994. Alternative constructions of Tobin�s q: An empirical
comparison. Journal of Empirical Finance 1:313-341.
36
Petersen, M.A., and Thiagarajan, S.R. 2000. Risk measurement and hedging: With and without
derivatives. Financial Management 29 (4):5-30. Pulvino, T.C. 1998. Do asset fire sales exist? An empirical investigation of commercial aircraft
transactions. Journal of Finance 53:939-978. Pulvino, T.C. 1999. Effects of bankruptcy court protection on asset sales. Journal of Financial
Economics 52:151-186. Rogers, D.A. 2002. Does executive portfolio structure affect risk management? CEO risk-taking
incentives and corporate derivatives usage. Journal of Banking and Finance 26:271-295. Schrand, C., and Unal, H. 1998. Hedging and coordinated risk management: Evidence from thrift
conversions. Journal of Finance 53:979-1013. Smith, C.W., Jr., and Stulz, R.M. 1985. The determinants of firms� hedging policies. Journal of
Financial and Quantitative Analysis 20:391-405. Stulz, R.M. 1996. Rethinking risk management. Journal of Applied Corporate Finance 9 (3):8-
24. Tufano, P. 1996. Who manages risk? An empirical examination of risk management practices in
the gold mining industry. Journal of Finance 51:1097-1137. Tufano, P. 1998. Agency costs of corporate risk management. Financial Management 27 (1):67-
77. Weiss, L.A., and Wruck, K.H. 1998. Information problems, conflicts of interest, and asset
stripping: Chapter 11�s failure in the case of Eastern Airlines. Journal of Financial Economics 48:55-97.
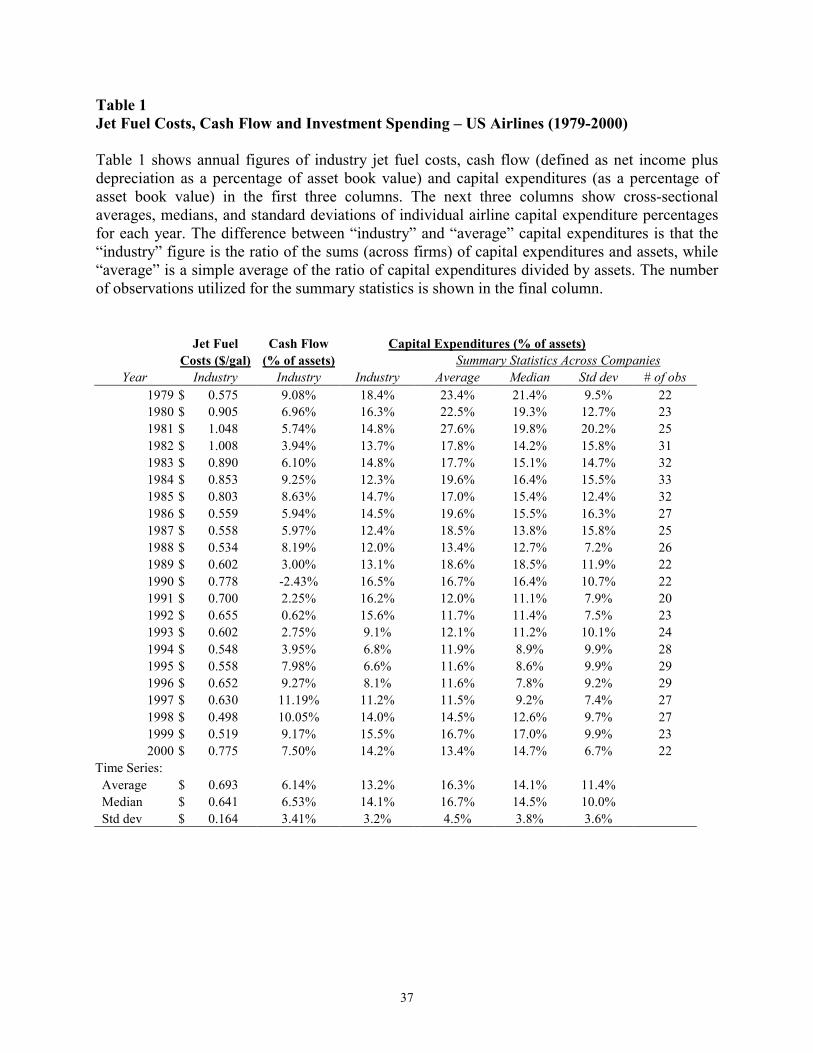
37
Table 1 Jet Fuel Costs, Cash Flow and Investment Spending � US Airlines (1979-2000) Table 1 shows annual figures of industry jet fuel costs, cash flow (defined as net income plus depreciation as a percentage of asset book value) and capital expenditures (as a percentage of asset book value) in the first three columns. The next three columns show cross-sectional averages, medians, and standard deviations of individual airline capital expenditure percentages for each year. The difference between �industry� and �average� capital expenditures is that the �industry� figure is the ratio of the sums (across firms) of capital expenditures and assets, while �average� is a simple average of the ratio of capital expenditures divided by assets. The number of observations utilized for the summary statistics is shown in the final column. Jet Fuel Cash Flow Capital Expenditures (% of assets) Costs ($/gal) (% of assets) Summary Statistics Across Companies
Year Industry Industry Industry Average Median Std dev # of obs 1979 $ 0.575 9.08% 18.4% 23.4% 21.4% 9.5% 22 1980 $ 0.905 6.96% 16.3% 22.5% 19.3% 12.7% 23 1981 $ 1.048 5.74% 14.8% 27.6% 19.8% 20.2% 25 1982 $ 1.008 3.94% 13.7% 17.8% 14.2% 15.8% 31 1983 $ 0.890 6.10% 14.8% 17.7% 15.1% 14.7% 32 1984 $ 0.853 9.25% 12.3% 19.6% 16.4% 15.5% 33 1985 $ 0.803 8.63% 14.7% 17.0% 15.4% 12.4% 32 1986 $ 0.559 5.94% 14.5% 19.6% 15.5% 16.3% 27 1987 $ 0.558 5.97% 12.4% 18.5% 13.8% 15.8% 25 1988 $ 0.534 8.19% 12.0% 13.4% 12.7% 7.2% 26 1989 $ 0.602 3.00% 13.1% 18.6% 18.5% 11.9% 22 1990 $ 0.778 -2.43% 16.5% 16.7% 16.4% 10.7% 22 1991 $ 0.700 2.25% 16.2% 12.0% 11.1% 7.9% 20 1992 $ 0.655 0.62% 15.6% 11.7% 11.4% 7.5% 23 1993 $ 0.602 2.75% 9.1% 12.1% 11.2% 10.1% 24 1994 $ 0.548 3.95% 6.8% 11.9% 8.9% 9.9% 28 1995 $ 0.558 7.98% 6.6% 11.6% 8.6% 9.9% 29 1996 $ 0.652 9.27% 8.1% 11.6% 7.8% 9.2% 29 1997 $ 0.630 11.19% 11.2% 11.5% 9.2% 7.4% 27 1998 $ 0.498 10.05% 14.0% 14.5% 12.6% 9.7% 27 1999 $ 0.519 9.17% 15.5% 16.7% 17.0% 9.9% 23 2000 $ 0.775 7.50% 14.2% 13.4% 14.7% 6.7% 22
Time Series: Average $ 0.693 6.14% 13.2% 16.3% 14.1% 11.4% Median $ 0.641 6.53% 14.1% 16.7% 14.5% 10.0% Std dev $ 0.164 3.41% 3.2% 4.5% 3.8% 3.6%
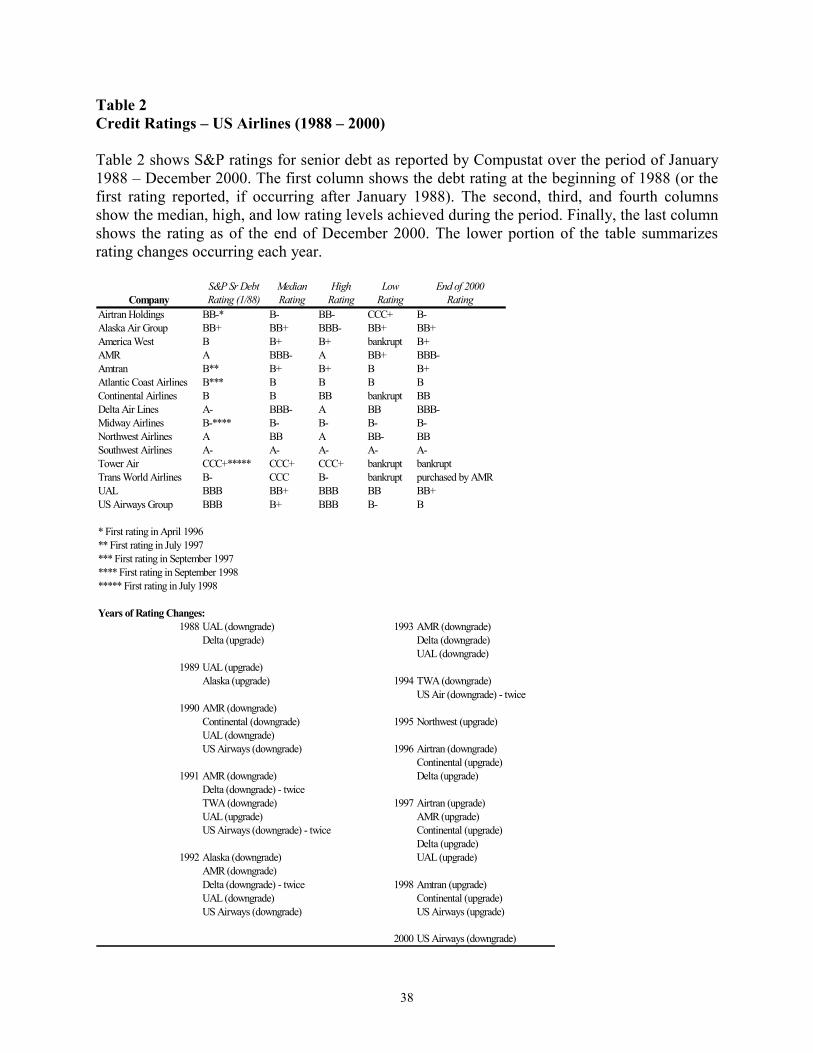
38
Table 2 Credit Ratings � US Airlines (1988 � 2000) Table 2 shows S&P ratings for senior debt as reported by Compustat over the period of January 1988 � December 2000. The first column shows the debt rating at the beginning of 1988 (or the first rating reported, if occurring after January 1988). The second, third, and fourth columns show the median, high, and low rating levels achieved during the period. Finally, the last column shows the rating as of the end of December 2000. The lower portion of the table summarizes rating changes occurring each year.
S&P Sr Debt Median High Low End of 2000Company Rating (1/88) Rating Rating Rating Rating
Airtran Holdings BB-* B- BB- CCC+ B-Alaska Air Group BB+ BB+ BBB- BB+ BB+America West B B+ B+ bankrupt B+AMR A BBB- A BB+ BBB-Amtran B** B+ B+ B B+Atlantic Coast Airlines B*** B B B BContinental Airlines B B BB bankrupt BBDelta Air Lines A- BBB- A BB BBB-Midway Airlines B-**** B- B- B- B-Northwest Airlines A BB A BB- BBSouthwest Airlines A- A- A- A- A-Tower Air CCC+***** CCC+ CCC+ bankrupt bankruptTrans World Airlines B- CCC B- bankrupt purchased by AMRUAL BBB BB+ BBB BB BB+US Airways Group BBB B+ BBB B- B
* First rating in April 1996** First rating in July 1997*** First rating in September 1997**** First rating in September 1998***** First rating in July 1998
Years of Rating Changes:1988 UAL (downgrade) 1993 AMR (downgrade)
Delta (upgrade) Delta (downgrade)UAL (downgrade)
1989 UAL (upgrade)Alaska (upgrade) 1994 TWA (downgrade)
US Air (downgrade) - twice1990 AMR (downgrade)
Continental (downgrade) 1995 Northwest (upgrade)UAL (downgrade)US Airways (downgrade) 1996 Airtran (downgrade)
Continental (upgrade)1991 AMR (downgrade) Delta (upgrade)
Delta (downgrade) - twiceTWA (downgrade) 1997 Airtran (upgrade)UAL (upgrade) AMR (upgrade)US Airways (downgrade) - twice Continental (upgrade)
Delta (upgrade)1992 Alaska (downgrade) UAL (upgrade)
AMR (downgrade)Delta (downgrade) - twice 1998 Amtran (upgrade)UAL (downgrade) Continental (upgrade)US Airways (downgrade) US Airways (upgrade)
2000 US Airways (downgrade)
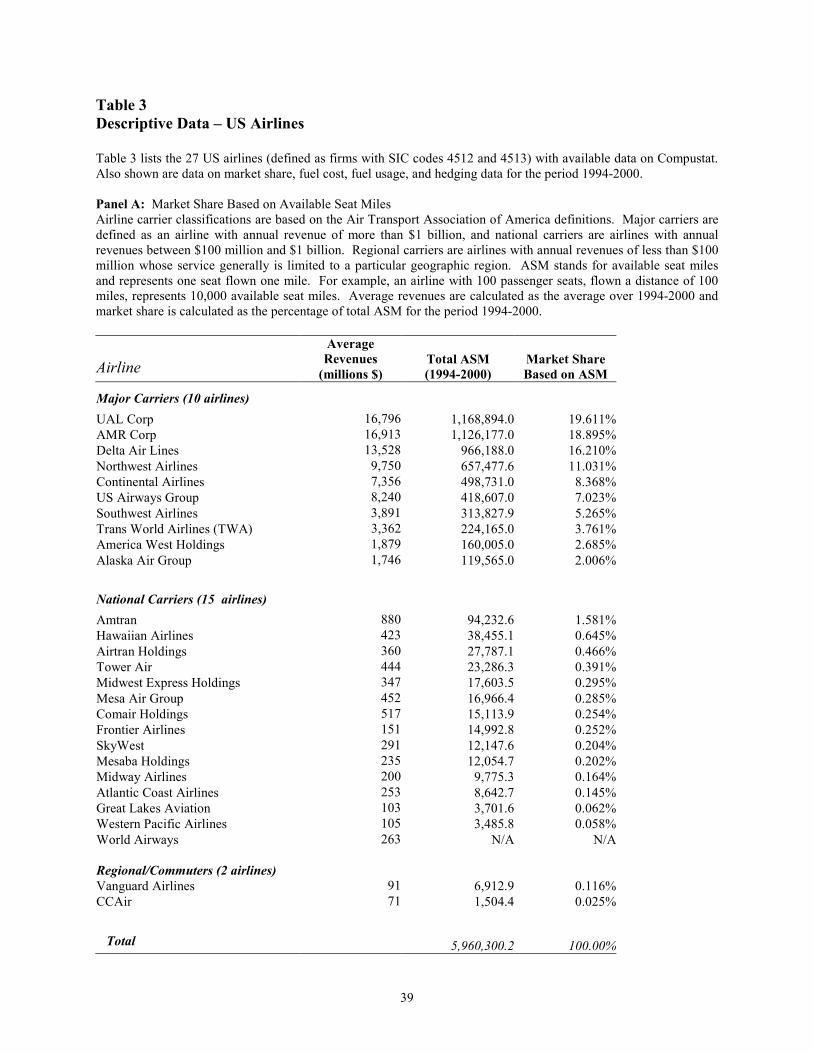
39
Table 3 Descriptive Data � US Airlines Table 3 lists the 27 US airlines (defined as firms with SIC codes 4512 and 4513) with available data on Compustat. Also shown are data on market share, fuel cost, fuel usage, and hedging data for the period 1994-2000. Panel A: Market Share Based on Available Seat Miles Airline carrier classifications are based on the Air Transport Association of America definitions. Major carriers are defined as an airline with annual revenue of more than $1 billion, and national carriers are airlines with annual revenues between $100 million and $1 billion. Regional carriers are airlines with annual revenues of less than $100 million whose service generally is limited to a particular geographic region. ASM stands for available seat miles and represents one seat flown one mile. For example, an airline with 100 passenger seats, flown a distance of 100 miles, represents 10,000 available seat miles. Average revenues are calculated as the average over 1994-2000 and market share is calculated as the percentage of total ASM for the period 1994-2000.
Airline Average Revenues
(millions $) Total ASM (1994-2000)
Market Share Based on ASM
Major Carriers (10 airlines) UAL Corp 16,796 1,168,894.0 19.611% AMR Corp 16,913 1,126,177.0 18.895% Delta Air Lines 13,528 966,188.0 16.210% Northwest Airlines 9,750 657,477.6 11.031% Continental Airlines 7,356 498,731.0 8.368% US Airways Group 8,240 418,607.0 7.023% Southwest Airlines 3,891 313,827.9 5.265% Trans World Airlines (TWA) 3,362 224,165.0 3.761% America West Holdings 1,879 160,005.0 2.685% Alaska Air Group 1,746 119,565.0 2.006%
National Carriers (15 airlines) Amtran 880 94,232.6 1.581% Hawaiian Airlines 423 38,455.1 0.645% Airtran Holdings 360 27,787.1 0.466% Tower Air 444 23,286.3 0.391% Midwest Express Holdings 347 17,603.5 0.295% Mesa Air Group 452 16,966.4 0.285% Comair Holdings 517 15,113.9 0.254% Frontier Airlines 151 14,992.8 0.252% SkyWest 291 12,147.6 0.204% Mesaba Holdings 235 12,054.7 0.202% Midway Airlines 200 9,775.3 0.164% Atlantic Coast Airlines 253 8,642.7 0.145% Great Lakes Aviation 103 3,701.6 0.062% Western Pacific Airlines 105 3,485.8 0.058% World Airways 263 N/A N/A Regional/Commuters (2 airlines) Vanguard Airlines 91 6,912.9 0.116% CCAir 71 1,504.4 0.025%
Total 5,960,300.2 100.00%
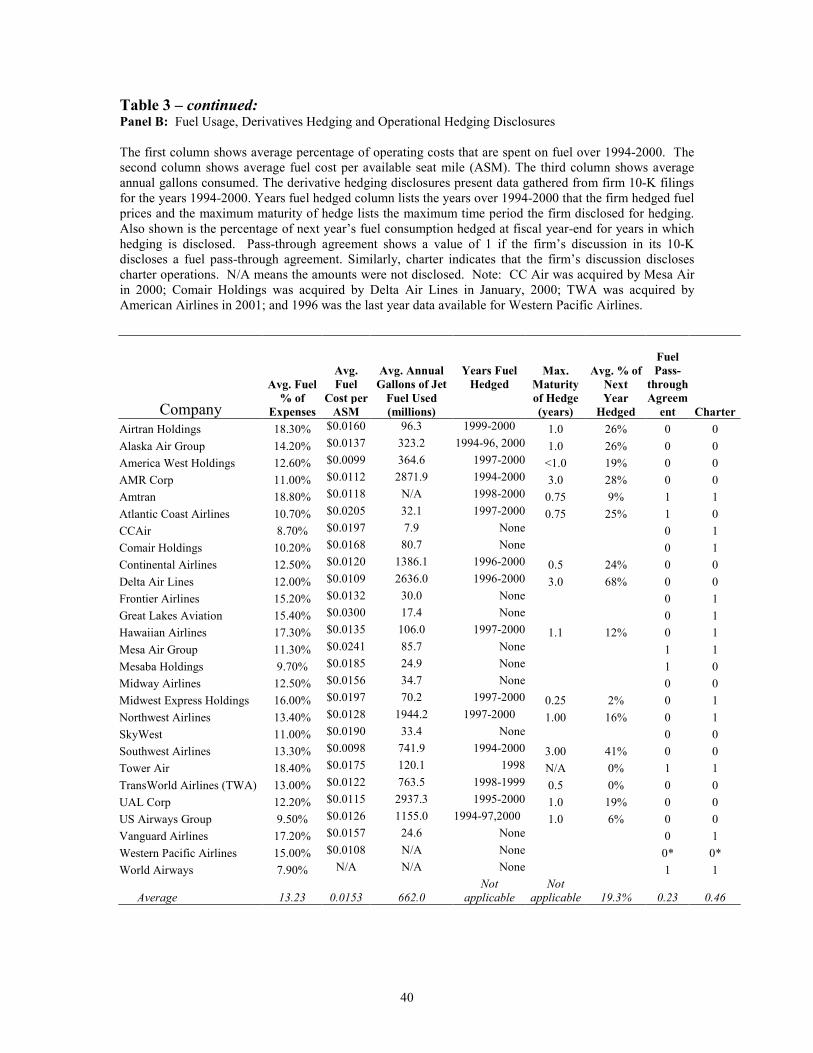
40
Table 3 � continued: Panel B: Fuel Usage, Derivatives Hedging and Operational Hedging Disclosures
The first column shows average percentage of operating costs that are spent on fuel over 1994-2000. The second column shows average fuel cost per available seat mile (ASM). The third column shows average annual gallons consumed. The derivative hedging disclosures present data gathered from firm 10-K filings for the years 1994-2000. Years fuel hedged column lists the years over 1994-2000 that the firm hedged fuel prices and the maximum maturity of hedge lists the maximum time period the firm disclosed for hedging. Also shown is the percentage of next year�s fuel consumption hedged at fiscal year-end for years in which hedging is disclosed. Pass-through agreement shows a value of 1 if the firm�s discussion in its 10-K discloses a fuel pass-through agreement. Similarly, charter indicates that the firm�s discussion discloses charter operations. N/A means the amounts were not disclosed. Note: CC Air was acquired by Mesa Air in 2000; Comair Holdings was acquired by Delta Air Lines in January, 2000; TWA was acquired by American Airlines in 2001; and 1996 was the last year data available for Western Pacific Airlines.
Company Avg. Fuel
% of Expenses
Avg. Fuel
Cost per ASM
Avg. Annual Gallons of Jet
Fuel Used (millions)
Years Fuel Hedged
Max. Maturity of Hedge (years)
Avg. % of Next Year
Hedged
Fuel Pass-
through Agreem
ent CharterAirtran Holdings 18.30% $0.0160 96.3 1999-2000 1.0 26% 0 0 Alaska Air Group 14.20% $0.0137 323.2 1994-96, 2000 1.0 26% 0 0 America West Holdings 12.60% $0.0099 364.6 1997-2000 <1.0 19% 0 0 AMR Corp 11.00% $0.0112 2871.9 1994-2000 3.0 28% 0 0 Amtran 18.80% $0.0118 N/A 1998-2000 0.75 9% 1 1 Atlantic Coast Airlines 10.70% $0.0205 32.1 1997-2000 0.75 25% 1 0 CCAir 8.70% $0.0197 7.9 None 0 1 Comair Holdings 10.20% $0.0168 80.7 None 0 1 Continental Airlines 12.50% $0.0120 1386.1 1996-2000 0.5 24% 0 0 Delta Air Lines 12.00% $0.0109 2636.0 1996-2000 3.0 68% 0 0 Frontier Airlines 15.20% $0.0132 30.0 None 0 1 Great Lakes Aviation 15.40% $0.0300 17.4 None 0 1 Hawaiian Airlines 17.30% $0.0135 106.0 1997-2000 1.1 12% 0 1 Mesa Air Group 11.30% $0.0241 85.7 None 1 1 Mesaba Holdings 9.70% $0.0185 24.9 None 1 0 Midway Airlines 12.50% $0.0156 34.7 None 0 0 Midwest Express Holdings 16.00% $0.0197 70.2 1997-2000 0.25 2% 0 1 Northwest Airlines 13.40% $0.0128 1944.2 1997-2000 1.00 16% 0 1 SkyWest 11.00% $0.0190 33.4 None 0 0 Southwest Airlines 13.30% $0.0098 741.9 1994-2000 3.00 41% 0 0 Tower Air 18.40% $0.0175 120.1 1998 N/A 0% 1 1 TransWorld Airlines (TWA) 13.00% $0.0122 763.5 1998-1999 0.5 0% 0 0 UAL Corp 12.20% $0.0115 2937.3 1995-2000 1.0 19% 0 0 US Airways Group 9.50% $0.0126 1155.0 1994-97,2000 1.0 6% 0 0 Vanguard Airlines 17.20% $0.0157 24.6 None 0 1 Western Pacific Airlines 15.00% $0.0108 N/A None 0* 0* World Airways 7.90% N/A N/A None 1 1
Average 13.23
0.0153
662.0 Not
applicable Not
applicable 19.3% 0.23 0.46
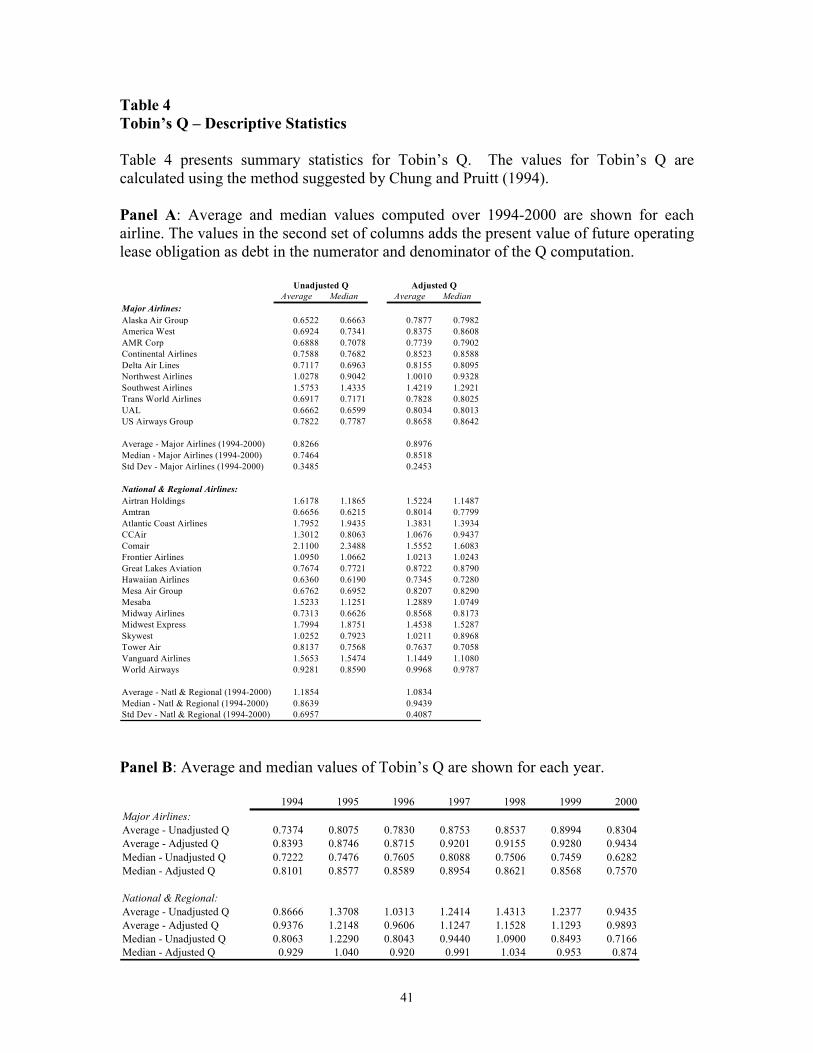
41
Table 4 Tobin�s Q � Descriptive Statistics Table 4 presents summary statistics for Tobin�s Q. The values for Tobin�s Q are calculated using the method suggested by Chung and Pruitt (1994). Panel A: Average and median values computed over 1994-2000 are shown for each airline. The values in the second set of columns adds the present value of future operating lease obligation as debt in the numerator and denominator of the Q computation.
Panel B: Average and median values of Tobin�s Q are shown for each year.
Average Median Average MedianMajor Airlines:Alaska Air Group 0.6522 0.6663 0.7877 0.7982America West 0.6924 0.7341 0.8375 0.8608AMR Corp 0.6888 0.7078 0.7739 0.7902Continental Airlines 0.7588 0.7682 0.8523 0.8588Delta Air Lines 0.7117 0.6963 0.8155 0.8095Northwest Airlines 1.0278 0.9042 1.0010 0.9328Southwest Airlines 1.5753 1.4335 1.4219 1.2921Trans World Airlines 0.6917 0.7171 0.7828 0.8025UAL 0.6662 0.6599 0.8034 0.8013US Airways Group 0.7822 0.7787 0.8658 0.8642
Average - Major Airlines (1994-2000) 0.8266 0.8976Median - Major Airlines (1994-2000) 0.7464 0.8518Std Dev - Major Airlines (1994-2000) 0.3485 0.2453
National & Regional Airlines:Airtran Holdings 1.6178 1.1865 1.5224 1.1487Amtran 0.6656 0.6215 0.8014 0.7799Atlantic Coast Airlines 1.7952 1.9435 1.3831 1.3934CCAir 1.3012 0.8063 1.0676 0.9437Comair 2.1100 2.3488 1.5552 1.6083Frontier Airlines 1.0950 1.0662 1.0213 1.0243Great Lakes Aviation 0.7674 0.7721 0.8722 0.8790Hawaiian Airlines 0.6360 0.6190 0.7345 0.7280Mesa Air Group 0.6762 0.6952 0.8207 0.8290Mesaba 1.5233 1.1251 1.2889 1.0749Midway Airlines 0.7313 0.6626 0.8568 0.8173Midwest Express 1.7994 1.8751 1.4538 1.5287Skywest 1.0252 0.7923 1.0211 0.8968Tower Air 0.8137 0.7568 0.7637 0.7058Vanguard Airlines 1.5653 1.5474 1.1449 1.1080World Airways 0.9281 0.8590 0.9968 0.9787
Average - Natl & Regional (1994-2000) 1.1854 1.0834Median - Natl & Regional (1994-2000) 0.8639 0.9439Std Dev - Natl & Regional (1994-2000) 0.6957 0.4087
Unadjusted Q Adjusted Q
1994 1995 1996 1997 1998 1999 2000Major Airlines:Average - Unadjusted Q 0.7374 0.8075 0.7830 0.8753 0.8537 0.8994 0.8304Average - Adjusted Q 0.8393 0.8746 0.8715 0.9201 0.9155 0.9280 0.9434Median - Unadjusted Q 0.7222 0.7476 0.7605 0.8088 0.7506 0.7459 0.6282Median - Adjusted Q 0.8101 0.8577 0.8589 0.8954 0.8621 0.8568 0.7570
National & Regional:Average - Unadjusted Q 0.8666 1.3708 1.0313 1.2414 1.4313 1.2377 0.9435Average - Adjusted Q 0.9376 1.2148 0.9606 1.1247 1.1528 1.1293 0.9893Median - Unadjusted Q 0.8063 1.2290 0.8043 0.9440 1.0900 0.8493 0.7166Median - Adjusted Q 0.929 1.040 0.920 0.991 1.034 0.953 0.874
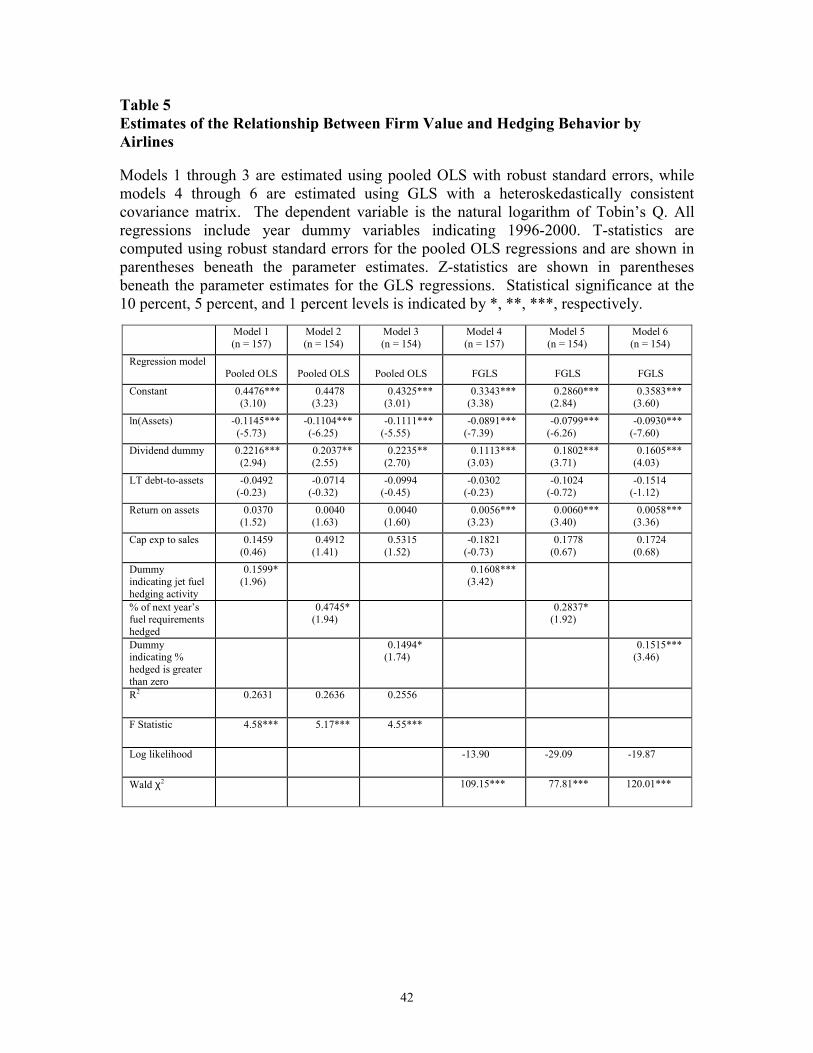
42
Table 5 Estimates of the Relationship Between Firm Value and Hedging Behavior by Airlines Models 1 through 3 are estimated using pooled OLS with robust standard errors, while models 4 through 6 are estimated using GLS with a heteroskedastically consistent covariance matrix. The dependent variable is the natural logarithm of Tobin�s Q. All regressions include year dummy variables indicating 1996-2000. T-statistics are computed using robust standard errors for the pooled OLS regressions and are shown in parentheses beneath the parameter estimates. Z-statistics are shown in parentheses beneath the parameter estimates for the GLS regressions. Statistical significance at the 10 percent, 5 percent, and 1 percent levels is indicated by *, **, ***, respectively.
Model 1 (n = 157)
Model 2 (n = 154)
Model 3 (n = 154)
Model 4 (n = 157)
Model 5 (n = 154)
Model 6 (n = 154)
Regression model Pooled OLS
Pooled OLS
Pooled OLS
FGLS
FGLS
FGLS
Constant 0.4476*** (3.10)
0.4478 (3.23)
0.4325*** (3.01)
0.3343*** (3.38)
0.2860*** (2.84)
0.3583*** (3.60)
ln(Assets) -0.1145*** (-5.73)
-0.1104*** (-6.25)
-0.1111*** (-5.55)
-0.0891*** (-7.39)
-0.0799*** (-6.26)
-0.0930*** (-7.60)
Dividend dummy 0.2216*** (2.94)
0.2037** (2.55)
0.2235** (2.70)
0.1113*** (3.03)
0.1802*** (3.71)
0.1605*** (4.03)
LT debt-to-assets -0.0492 (-0.23)
-0.0714 (-0.32)
-0.0994 (-0.45)
-0.0302 (-0.23)
-0.1024 (-0.72)
-0.1514 (-1.12)
Return on assets 0.0370 (1.52)
0.0040 (1.63)
0.0040 (1.60)
0.0056*** (3.23)
0.0060*** (3.40)
0.0058*** (3.36)
Cap exp to sales 0.1459 (0.46)
0.4912 (1.41)
0.5315 (1.52)
-0.1821 (-0.73)
0.1778 (0.67)
0.1724 (0.68)
Dummy indicating jet fuel hedging activity
0.1599* (1.96)
0.1608*** (3.42)
% of next year�s fuel requirements hedged
0.4745* (1.94)
0.2837* (1.92)
Dummy indicating % hedged is greater than zero
0.1494* (1.74)
0.1515*** (3.46)
R2 0.2631 0.2636 0.2556
F Statistic 4.58*** 5.17*** 4.55***
Log likelihood -13.90 -29.09 -19.87
Wald χ2 109.15*** 77.81*** 120.01***
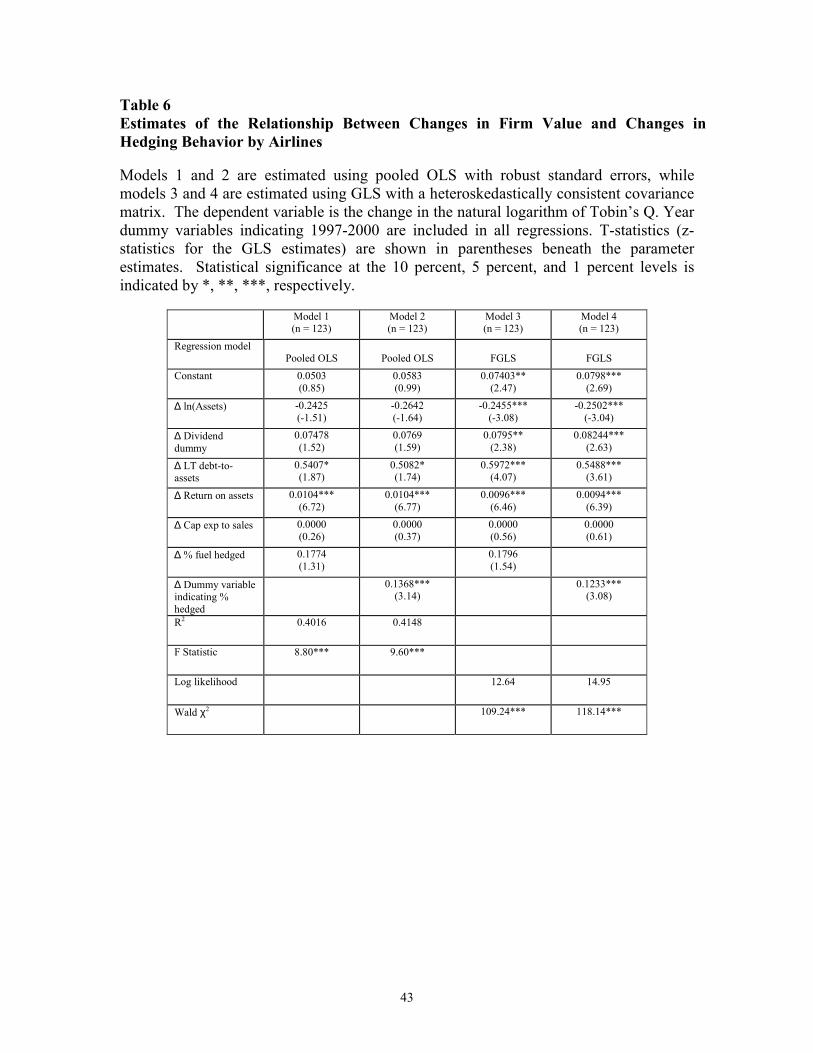
43
Table 6 Estimates of the Relationship Between Changes in Firm Value and Changes in Hedging Behavior by Airlines
Models 1 and 2 are estimated using pooled OLS with robust standard errors, while models 3 and 4 are estimated using GLS with a heteroskedastically consistent covariance matrix. The dependent variable is the change in the natural logarithm of Tobin�s Q. Year dummy variables indicating 1997-2000 are included in all regressions. T-statistics (z-statistics for the GLS estimates) are shown in parentheses beneath the parameter estimates. Statistical significance at the 10 percent, 5 percent, and 1 percent levels is indicated by *, **, ***, respectively.
Model 1
(n = 123) Model 2 (n = 123)
Model 3 (n = 123)
Model 4 (n = 123)
Regression model Pooled OLS
Pooled OLS
FGLS
FGLS
Constant 0.0503 (0.85)
0.0583 (0.99)
0.07403** (2.47)
0.0798*** (2.69)
∆ ln(Assets) -0.2425 (-1.51)
-0.2642 (-1.64)
-0.2455*** (-3.08)
-0.2502*** (-3.04)
∆ Dividend dummy
0.07478 (1.52)
0.0769 (1.59)
0.0795** (2.38)
0.08244*** (2.63)
∆ LT debt-to-assets
0.5407* (1.87)
0.5082* (1.74)
0.5972*** (4.07)
0.5488*** (3.61)
∆ Return on assets 0.0104*** (6.72)
0.0104*** (6.77)
0.0096*** (6.46)
0.0094*** (6.39)
∆ Cap exp to sales 0.0000 (0.26)
0.0000 (0.37)
0.0000 (0.56)
0.0000 (0.61)
∆ % fuel hedged 0.1774 (1.31)
0.1796 (1.54)
∆ Dummy variable indicating % hedged
0.1368*** (3.14)
0.1233*** (3.08)
R2 0.4016 0.4148
F Statistic 8.80*** 9.60***
Log likelihood 12.64 14.95
Wald χ2 109.24*** 118.14***
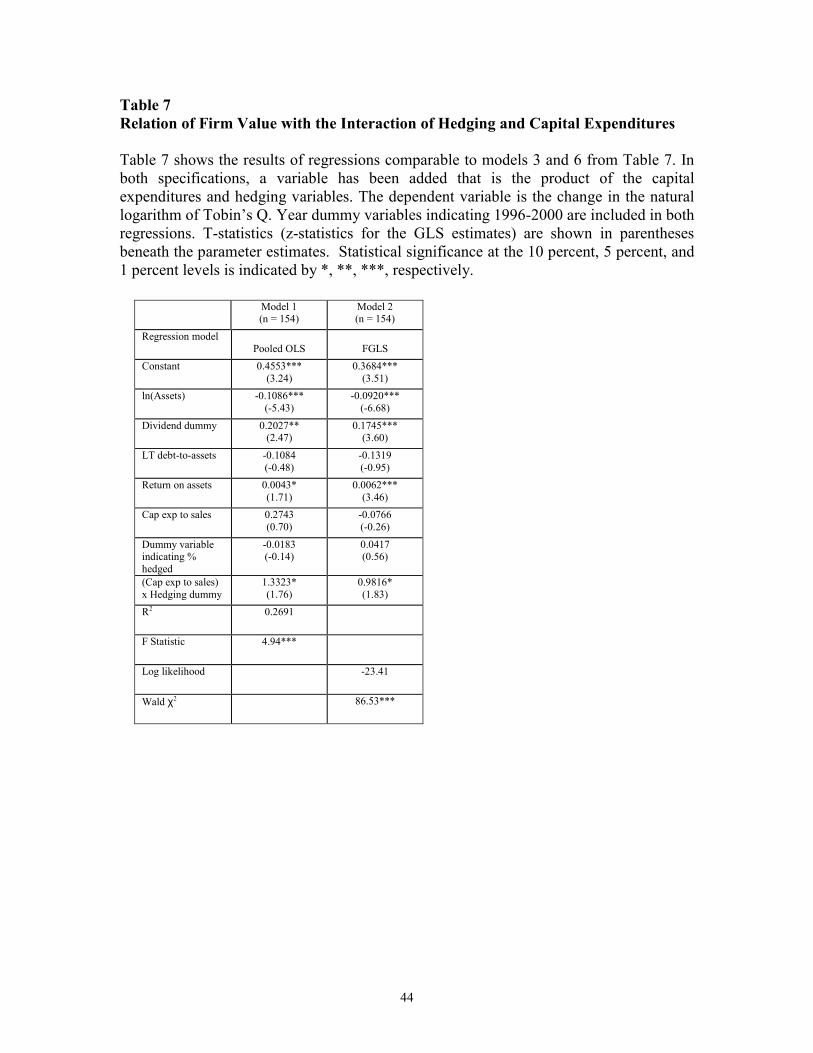
44
Table 7 Relation of Firm Value with the Interaction of Hedging and Capital Expenditures Table 7 shows the results of regressions comparable to models 3 and 6 from Table 7. In both specifications, a variable has been added that is the product of the capital expenditures and hedging variables. The dependent variable is the change in the natural logarithm of Tobin�s Q. Year dummy variables indicating 1996-2000 are included in both regressions. T-statistics (z-statistics for the GLS estimates) are shown in parentheses beneath the parameter estimates. Statistical significance at the 10 percent, 5 percent, and 1 percent levels is indicated by *, **, ***, respectively.
Model 1 (n = 154)
Model 2 (n = 154)
Regression model Pooled OLS
FGLS
Constant 0.4553*** (3.24)
0.3684*** (3.51)
ln(Assets) -0.1086*** (-5.43)
-0.0920*** (-6.68)
Dividend dummy 0.2027** (2.47)
0.1745*** (3.60)
LT debt-to-assets -0.1084 (-0.48)
-0.1319 (-0.95)
Return on assets 0.0043* (1.71)
0.0062*** (3.46)
Cap exp to sales 0.2743 (0.70)
-0.0766 (-0.26)
Dummy variable indicating % hedged
-0.0183 (-0.14)
0.0417 (0.56)
(Cap exp to sales) x Hedging dummy
1.3323* (1.76)
0.9816* (1.83)
R2 0.2691
F Statistic 4.94***
Log likelihood -23.41
Wald χ2 86.53***
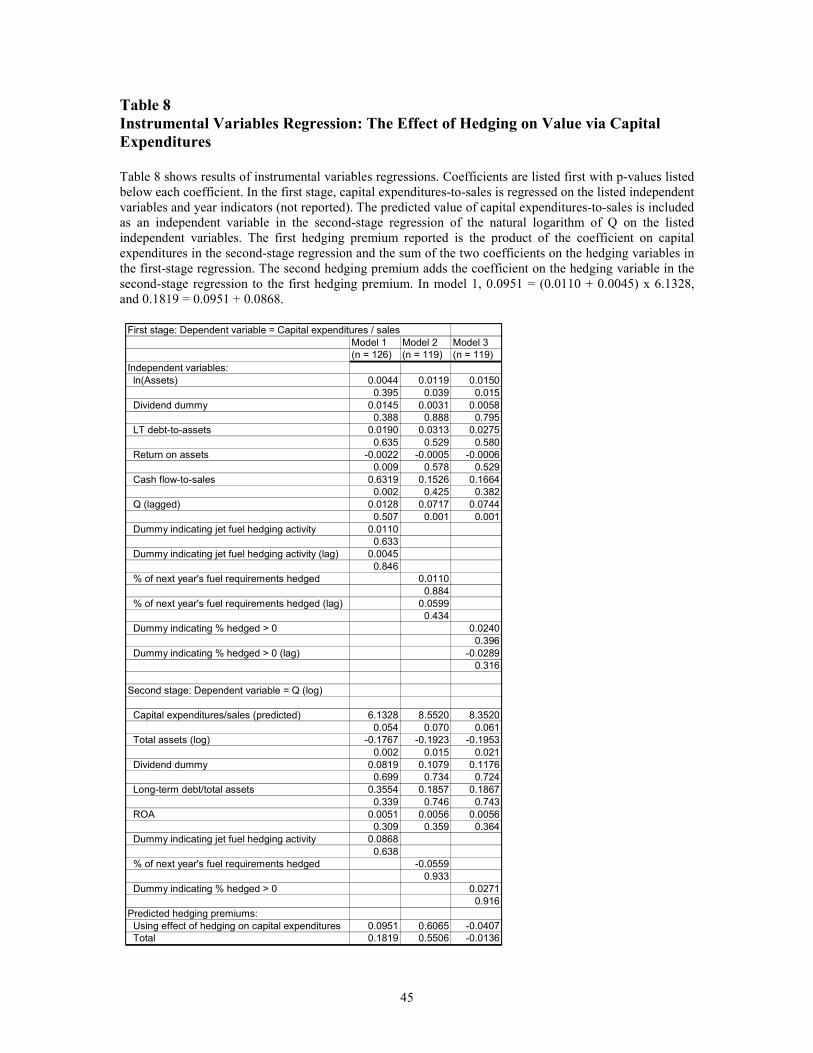
45
Table 8 Instrumental Variables Regression: The Effect of Hedging on Value via Capital Expenditures Table 8 shows results of instrumental variables regressions. Coefficients are listed first with p-values listed below each coefficient. In the first stage, capital expenditures-to-sales is regressed on the listed independent variables and year indicators (not reported). The predicted value of capital expenditures-to-sales is included as an independent variable in the second-stage regression of the natural logarithm of Q on the listed independent variables. The first hedging premium reported is the product of the coefficient on capital expenditures in the second-stage regression and the sum of the two coefficients on the hedging variables in the first-stage regression. The second hedging premium adds the coefficient on the hedging variable in the second-stage regression to the first hedging premium. In model 1, 0.0951 = (0.0110 + 0.0045) x 6.1328, and 0.1819 = 0.0951 + 0.0868.
First stage: Dependent variable = Capital expenditures / salesModel 1 Model 2 Model 3(n = 126) (n = 119) (n = 119)
Independent variables: ln(Assets) 0.0044 0.0119 0.0150
0.395 0.039 0.015 Dividend dummy 0.0145 0.0031 0.0058
0.388 0.888 0.795 LT debt-to-assets 0.0190 0.0313 0.0275
0.635 0.529 0.580 Return on assets -0.0022 -0.0005 -0.0006
0.009 0.578 0.529 Cash flow-to-sales 0.6319 0.1526 0.1664
0.002 0.425 0.382 Q (lagged) 0.0128 0.0717 0.0744
0.507 0.001 0.001 Dummy indicating jet fuel hedging activity 0.0110
0.633 Dummy indicating jet fuel hedging activity (lag) 0.0045
0.846 % of next year's fuel requirements hedged 0.0110
0.884 % of next year's fuel requirements hedged (lag) 0.0599
0.434 Dummy indicating % hedged > 0 0.0240
0.396 Dummy indicating % hedged > 0 (lag) -0.0289
0.316
Second stage: Dependent variable = Q (log)
Capital expenditures/sales (predicted) 6.1328 8.5520 8.35200.054 0.070 0.061
Total assets (log) -0.1767 -0.1923 -0.1953 0.002 0.015 0.021 Dividend dummy 0.0819 0.1079 0.1176 0.699 0.734 0.724 Long-term debt/total assets 0.3554 0.1857 0.1867 0.339 0.746 0.743 ROA 0.0051 0.0056 0.0056
0.309 0.359 0.364 Dummy indicating jet fuel hedging activity 0.0868
0.638 % of next year's fuel requirements hedged -0.0559
0.933 Dummy indicating % hedged > 0 0.0271
0.916Predicted hedging premiums: Using effect of hedging on capital expenditures 0.0951 0.6065 -0.0407 Total 0.1819 0.5506 -0.0136
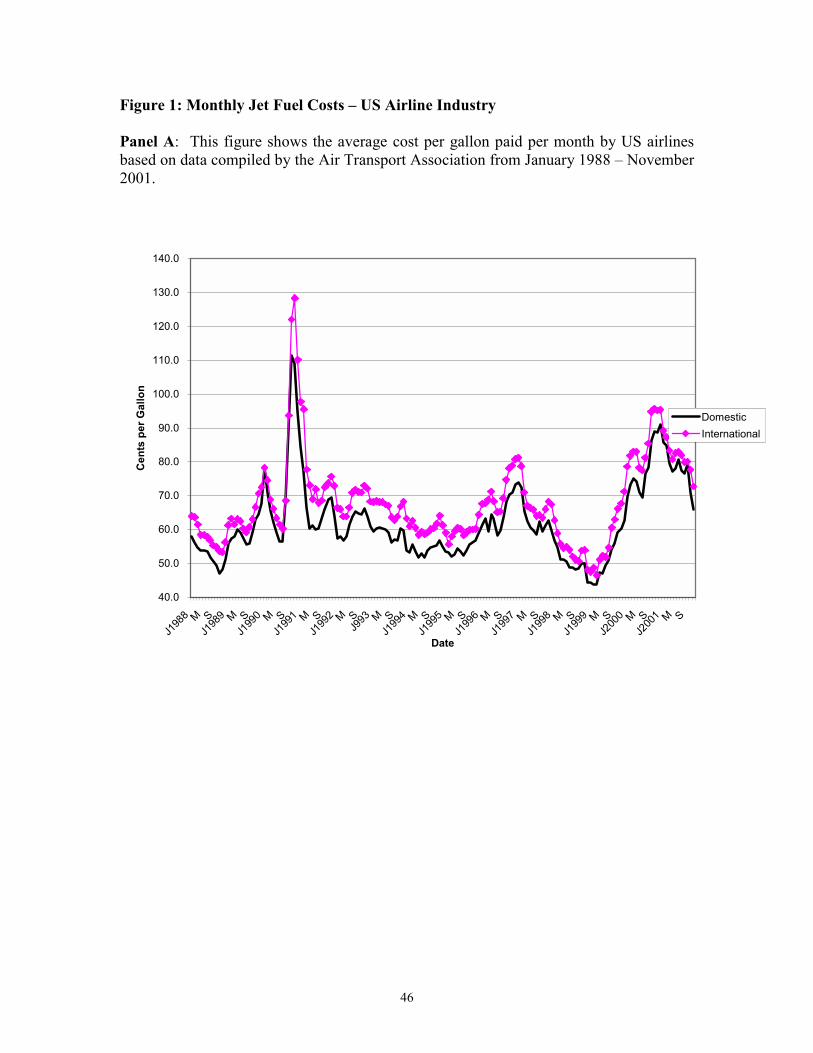
46
Figure 1: Monthly Jet Fuel Costs � US Airline Industry Panel A: This figure shows the average cost per gallon paid per month by US airlines based on data compiled by the Air Transport Association from January 1988 � November 2001.
40.0
50.0
60.0
70.0
80.0
90.0
100.0
110.0
120.0
130.0
140.0
J198
8 M S
J198
9 M S
J199
0 M S
J199
1 M S
J199
2 M S J9
93 M S
J199
4 M S
J199
5 M S
J199
6 M S
J199
7 M S
J199
8 M S
J199
9 M S
J200
0 M S
J200
1 M S
Date
Cen
ts p
er G
allo
n
DomesticInternational
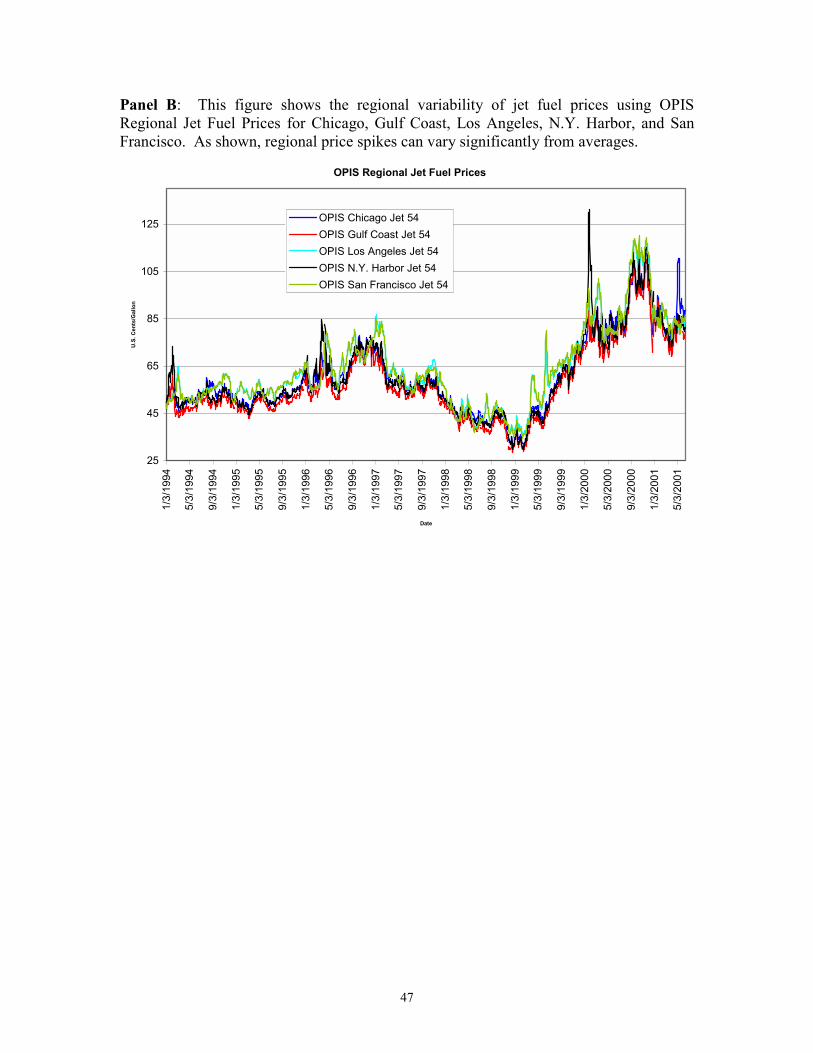
47
Panel B: This figure shows the regional variability of jet fuel prices using OPIS Regional Jet Fuel Prices for Chicago, Gulf Coast, Los Angeles, N.Y. Harbor, and San Francisco. As shown, regional price spikes can vary significantly from averages.
OPIS Regional Jet Fuel Prices
25
45
65
85
105
125
1/3/
1994
5/3/
1994
9/3/
1994
1/3/
1995
5/3/
1995
9/3/
1995
1/3/
1996
5/3/
1996
9/3/
1996
1/3/
1997
5/3/
1997
9/3/
1997
1/3/
1998
5/3/
1998
9/3/
1998
1/3/
1999
5/3/
1999
9/3/
1999
1/3/
2000
5/3/
2000
9/3/
2000
1/3/
2001
5/3/
2001
Date
U.S
. Cen
ts/G
allo
n
OPIS Chicago Jet 54OPIS Gulf Coast Jet 54OPIS Los Angeles Jet 54OPIS N.Y. Harbor Jet 54OPIS San Francisco Jet 54
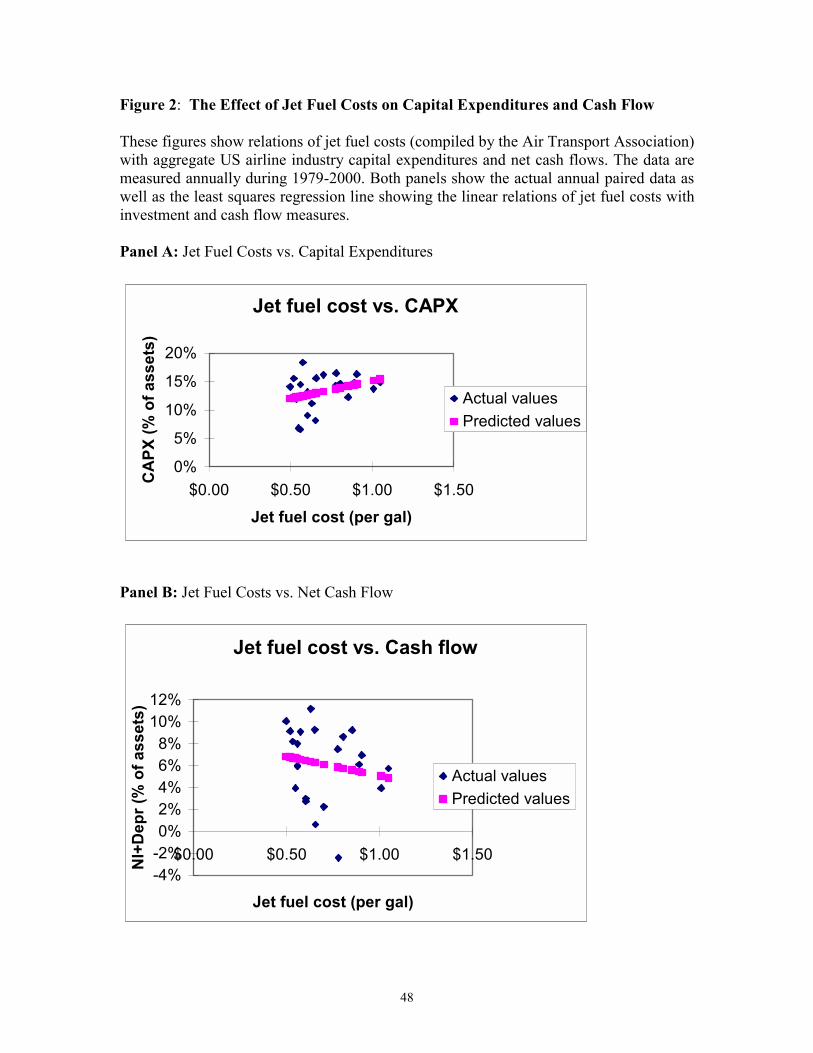
48
Figure 2: The Effect of Jet Fuel Costs on Capital Expenditures and Cash Flow
These figures show relations of jet fuel costs (compiled by the Air Transport Association) with aggregate US airline industry capital expenditures and net cash flows. The data are measured annually during 1979-2000. Both panels show the actual annual paired data as well as the least squares regression line showing the linear relations of jet fuel costs with investment and cash flow measures. Panel A: Jet Fuel Costs vs. Capital Expenditures
Jet fuel cost vs. CAPX
0%
5%
10%
15%
20%
$0.00 $0.50 $1.00 $1.50Jet fuel cost (per gal)
CA
PX (%
of a
sset
s)
Actual valuesPredicted values
Panel B: Jet Fuel Costs vs. Net Cash Flow
Jet fuel cost vs. Cash flow
-4%-2%0%2%4%6%8%
10%12%
$0.00 $0.50 $1.00 $1.50
Jet fuel cost (per gal)
NI+
Dep
r (%
of a
sset
s)
Actual valuesPredicted values