does deposit insurance increase banking system … deposit insurance increase banking system...
TRANSCRIPT
Does Deposit Insurance Increase Banking System Stability?
An Empirical Investigation
by Asli Demirgüç-Kunt and Enrica Detragiache*
JEL Classification: G28, G21, E44
Keywords: Deposit insurance, banking crises
* World Bank, Development Research Group, and International Monetary Fund, ResearchDepartment. The findings, interpretations, and conclusions expressed in this paper are entirelythose of the authors. They do not necessarily represent the views of the World Bank, IMF, theirExecutive Directors, or the countries they represent. We wish to thank George Clark, RobertaGatti, Francesca Recanatini, Marco Sorge, and Colin Xu for very helpful comments. We aregreatly indebted to Anqing Shi and Tolga Sobac2 for excellent research assistance.
- 2 -
I. Introduction
The first formal system of national bank deposit insurance was established in the U.S. in
1934 with the purpose of preventing the extensive bank runs that contributed to the Great
Depression. Other countries, even those where bank distress had accompanied the depression,
did not follow this lead, and it was not until the Post-War period that deposit insurance began to
spread outside of the U.S. (Table I). The 1980’s saw an acceleration in the diffusion of deposit
insurance, with most OECD countries and an increasing number of developing countries
adopting some form of explicit depositor protection. In 1994, deposit insurance became the
standard for the newly created single banking market of the European Union. 1 More recently,
the IMF has endorsed a limited form of deposit insurance in its code of best practices (Folkerts-
Landau and Lindgren, 1997).
Despite its increased favor among policy-makers, the desirability of deposit insurance
remains a matter of some controversy among economists. In the classic work of Diamond and
Dybvig (1983), deposit insurance (financed through money creation) is an optimal policy in a
model where bank stability is threatened by self-fulfilling depositor runs. If runs result from
imperfect information on the part of some depositors, suspensions can prevent runs, but at the
cost of leaving some depositors in need of liquidity in some states of the world (Chari and
Jagannathan, 1988). As pointed out by Bhattacharya et al. (1998), in this class of models deposit
insurance (financed through taxation) is better than suspensions provided the distortionary
effects of taxation are small. In Allen and Gale (1998) runs result from a deterioration in bank
asset quality, and the optimal policy is for the Central Bank to extend liquidity support to the
1 For an overview of deposit insurance around the world, see Kyei (1995) and Garcia (1999).
- 3 -
banking sector through a loan. 2 Whether or not deposit insurance is the best policy to prevent
depositor runs, all authors acknowledge that it is a source of moral hazard: as their ability to
attract deposits no longer reflects the risk of their asset portfolio, banks are encouraged to finance
high-risk, high-return projects. As a result, deposit insurance may lead to more bank failures
and, if banks take on risks that are correlated, systemic banking crises may become more
frequent.3 The U.S. Savings & Loan crisis of the 1980s has been widely attributed to the moral
hazard created by a combination of generous deposit insurance, financial liberalization, and
regulatory failure (see, for instance, Kane, 1989). Thus, according to economic theory, while
deposit insurance may increase bank stability by reducing self-fulfilling or information-driven
depositor runs, it may decrease bank stability by encouraging risk-taking on the part of banks.
When the theory has ambiguous implications it is particularly interesting to look at the
empirical evidence, yet no comprehensive empirical study to date has investigated the effects of
deposit insurance on bank stability. 4 This paper is an attempt to fill this gap. To this end, we rely
on a newly-constructed data base assembled at the World Bank which records the characteristics
of deposit insurance systems around the world. A quick look at the data reveals that there is
considerable cross-country variation in the presence and design features of depositor protection
schemes (Table 1): some countries have no explicit deposit insurance at all (although depositors
2 Matutes and Vives (1996) find deposit insurance to have ambiguous welfare effects in a framework where themarket structure of the banking industry is endogenous.
3 Even in the absence of deposit insurance, banks are prone to excessive risk-taking due to limited liability for theirequityholders and to their high leverage (Stiglitz, 1972).
4 In a previous study of the determinants of banking crises (DemirgηΗ-Kunt and Detragiache, 1998), we foundexplicit deposit insurance to be positively correlated with the probability of a banking crisis. In that study, however,the sample including the deposit insurance variable contained only 24 crisis episodes. Also, we did not distinguishamong deposit insurance systems with different characteristics.
- 4 -
may be rescued on an ad hoc basis after a crisis occurs, of course), while others have generous
systems with extensive coverage and no coinsurance. Other countries yet have schemes that
place strict limits on the size and nature of covered deposits, and require co-payments by the
banks. The deposit insurance funds may be managed by the government or the private sector,
and different financing arrangements are also observed. Since a number of countries have
adopted deposit insurance in the last two decades, the data exhibit some time-series variation as
well. Finally, the 61 countries in the sample experienced 40 systemic banking crises over the
period 1980-97.
Given the considerable variation in deposit insurance arrangements and the relatively
large number of banking crises, it is possible to use this panel to test whether the nature of the
deposit insurance system has a significant impact on the probability of a banking crisis once
other factors are controlled for. We carry out these tests using the multivariate logit econometric
model developed in our previous work on the determinants of banking crises (DemirgηΗ-Kunt
and Detragiache, 1998). The first test that we perform is whether a zero-one dummy variable for
the presence of explicit deposit insurance has a significant coefficient. This approach, however,
constrains all types of deposit insurance schemes to have the same impact on the banking crisis
probability. In practice, such impact may well be different depending on the specific design
features of the system: for instance, more limited coverage should give rise to less moral hazard,
although it may not be as effective at preventing runs. Similarly, in a system that is funded the
guarantee may be more credible than in an unfunded system; thus, moral hazard may be stronger
and the risk of runs smaller when the system is funded. To take these differences into account,
we construct alternative deposit insurance variables using the design feature data. We then
- 5 -
estimate a number of alternative banking crisis regressions in which the simple zero-one deposit
insurance dummy is replaced by each of the more refined variables.
A second aspect addressed by our study is whether the impact of deposit insurance on
bank stability depends on the quality of the regulatory environment. This is a natural question to
ask, since one of tasks of bank regulation is to curb the adverse incentives created by deposit
insurance. Lacking direct measures of the quality of regulation, we rely on a series of indexes
that measure different aspects of the institutional environment which may be positively
correlated with the quality of regulation. Using these indexes, we test whether in countries with
better institutions deposit insurance has a smaller adverse impact on bank stability.5
Finally, in the third part of the paper we address some robustness issues, including the
concern that our results may be affected by simultaneity bias if the decision to adopt deposit
insurance system is affected by the fragility of the banking system. To assess the extent of this
problem, a two-stage estimation exercise is carried out, in which the first stage estimation is a
logit model of the adoption of explicit deposit insurance, while the banking crisis probability
regression is estimated in the second stage.
The paper is organized as follows: Section II contains an overview of the data and of the
methodology. The main results are in Section III. Section IV addresses the role of institutions.
Section V contains the sensitivity analysis, and Section VI concludes.
II. The Data Set
5 Using a similar approach, in a previous paper we found that good institutions tend to moderate the impact offinancial liberalization on the probability of systemic banking crises (DemirgηΗ-Kunt and Detragiache, 1999).
- 6 -
A. An Overview of Deposit Insurance Protection in the Sample Countries
Information about depositor protection arrangements in the countries included in our
study comes from a new data set assembled at the World Bank. This data set, which expands an
earlier study conducted at the IMF (Kyei, 1995), contains cross-country information about the
date in which a formal deposit insurance system was established and about a number of
characteristics of the system, including the extent of coverage (the presence of a ceiling and/or of
coinsurance, whether or not foreign exchange deposit or interbank deposits are covered), how the
system is funded and managed, and others. Table I reports the design features of deposit
insurance for the 61 countries in our sample.
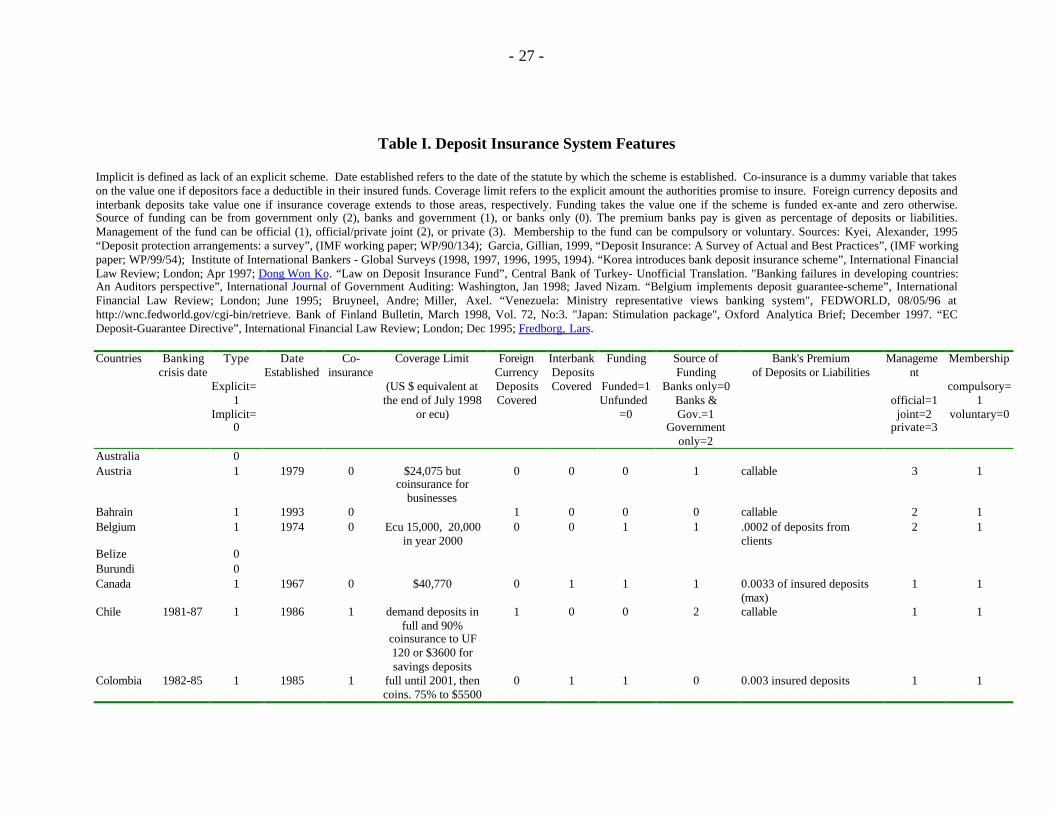
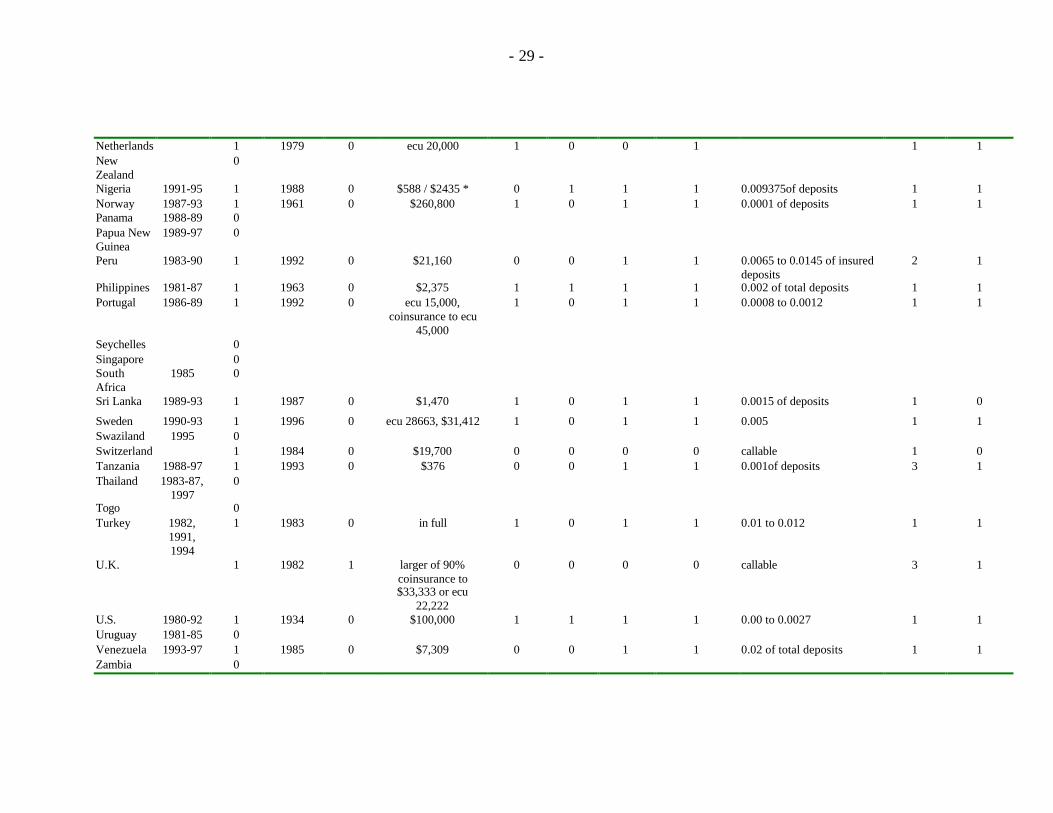
The first noticeable feature of the data is that explicit deposit insurance was not common
at the beginning of the sample period, as less than 20 percent of the sample countries had a
depositor protection scheme in place. Deposit insurance became much more popular after 1980,
however, and the fraction of sample countries with an explicit scheme reached 40 percent in
1990, and stood slightly above 50 percent in 1997. In total, 33 countries had deposit insurance in
1997, compared to only 12 in 1980.6
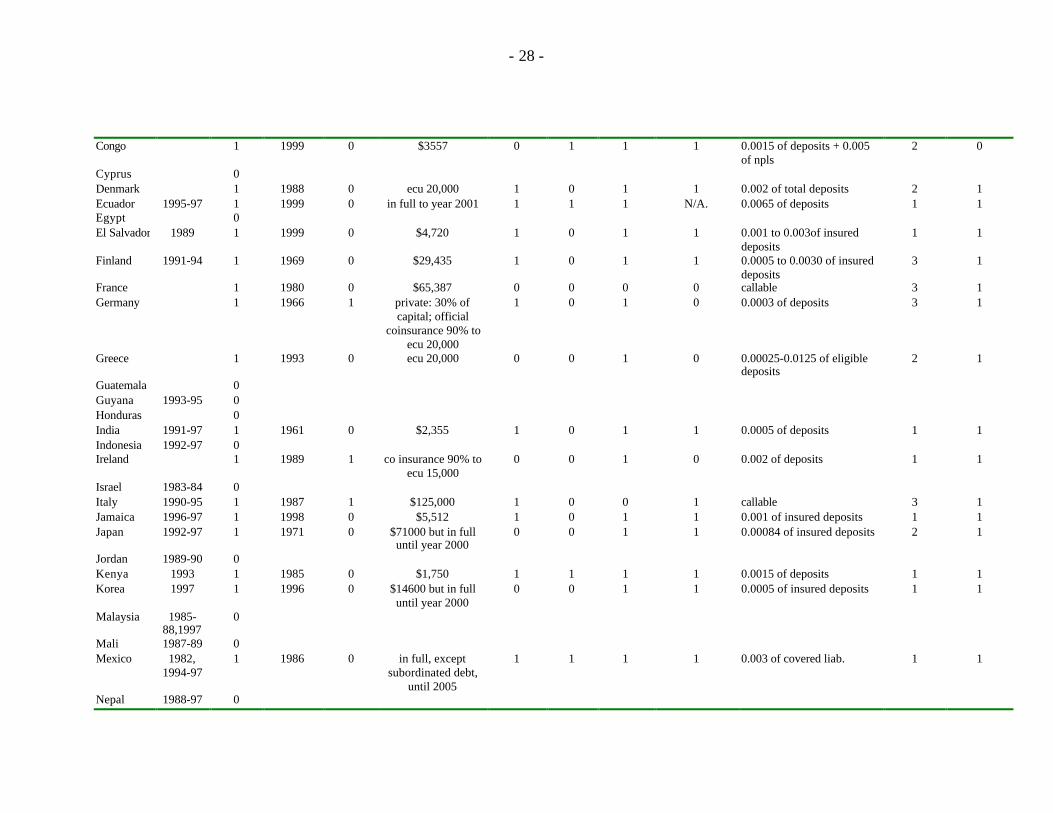
Turning now to the design features of the schemes, it is apparent from Table I that there
is substantial heterogeneity across countries, and no worldwide accepted blueprint exists for
deposit insurance. As far as the extent of coverage, coinsurance seems to be relatively rare (only
6 out of 33 countries have it). Coverage limits are common, but their extent varies considerably:
for instance, Norway covers deposits as large as $260,800, while in Switzerland deposits are
6 The diffusion of deposit insurance would look much more pervasive if countries were weighted by GDP per capitaor by population; although there are exceptions, it is mostly the richer and larger countries that have adoptedexplicit depositor protection.
- 7 -
protected only up to $19,700. In a majority of countries coverage includes foreign currency
deposits, while interbank deposits are insured in only 9 countries. Most deposit insurance
schemes are funded, and the most common source of funds is a combination of government and
bank resources. In 22 countries the system is managed by the government, in 6 it is run
privately, while in the remaining 7 countries some form of joint public and private management
exists. Finally, in almost all countries membership in the insurance scheme is compulsory.
B. Sample Selection, the Banking Crisis Variable, and the Control Variables
To test the effect of explicit deposit insurance on bank stability, we estimate the
probability of a systemic banking crisis using a multivariate logit model in which alternative
variables capturing the nature of the deposit protection arrangement enter as explanatory
variables along with a set of other control variables. The model is estimated using a panel of 61
countries over the period 1980-97. Details about the construction of the panel, the definition of
the banking crisis dummy variable, and the choice, definition, and interpretation of the control
variables can be found in our previous work (DemirgηΗ-Kunt and Detragiache, 1998). To
summarize briefly, to choose the countries we started with all the countries covered in the
International Financial Statistics, and then excluded economies in transition, non-market
economies, countries for which one or more data series were missing, and a few countries with
chronic banking sector problems. Years in which banking crises were under way were excluded
from the panel because during a crisis the behavior of some of the explanatory variables
(including deposit insurance) is likely to be affected by the crisis itself. The benchmark sample
includes 61 countries and 898 observations; for about half of the observations a deposit
insurance system is present, so the panel is balanced with respect to this variable.
- 8 -
To build the banking crisis dummy variable, we identified and dated episodes of banking
sector distress during the sample period using various sources, and classified as systemic crises
episodes in which non-performing assets reached at least 10 percent of total assets; or the cost of
the rescue operation was at least 2 percent of GDP; or banking sector problems resulted in a
large scale nationalization of banks, extensive bank runs, or emergency measures such as deposit
freezes, prolonged bank holidays, or generalized deposit guarantees. This criteria identify 40
systemic banking crises in our panel. The crisis periods are also reported in Table I. Banking
crises make up 4.4 percent of the observations in the baseline sample.
Turning now to the control variables, the rate of growth of real GDP, the change in the
external terms of trade, and the rate of inflation capture macroeconomic developments that are
likely to affect the quality of bank assets. The short-term real interest rate affects the banks’ cost
of funds, while bank vulnerability to sudden capital outflows is measured by the ratio of M2 to
foreign exchange reserves. Since high rates of credit expansion may finance an asset price
bubble that, when it bursts, causes a banking crisis, lagged credit growth is used as an additional
control. Finally, GDP per-capita is used to control for the level of development of the country.
Detailed variable definitions and sources are given in the Appendix.
III. The Results
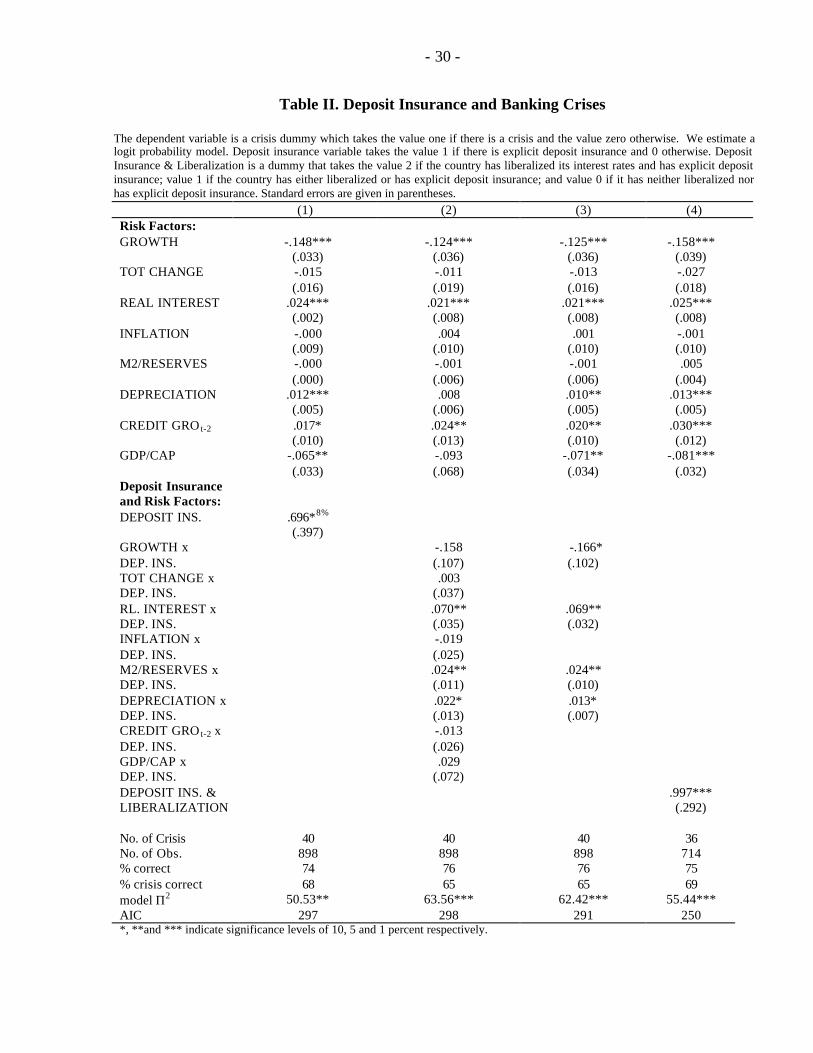
Table II reports estimation results for the first model specification, which uses the simple
explicit/implicit dummy as the deposit insurance variable. When the dummy is entered directly
in the regression, it has a positive coefficient significant at the 8 percent confidence level,
suggesting that explicit deposit insurance increases banking system vulnerability. This confirms
the finding of our previous study. Among the control variables, GDP growth and per-capita
- 9 -
GDP enter negatively, while the real interest rate and depreciation enter positively, as suggested
by economic theory. Inflation and the change in the terms of trade have insignificant
coefficients.7 In the second and third regression of Table II, the binary deposit insurance dummy
is interacted with the control variables to test whether the presence of explicit deposit insurance
tends to make countries more sensitive to systemic risk factors. This hypothesis finds some
support, as economies with deposit insurance seem to be more vulnerable to increases in real
interest rates, exchange rate depreciation, and to runs triggered by currency crises.8
In these regressions we ignore elements of the banking system safety net other than
deposit insurance, and such elements could be as important as deposit insurance in determining
bank fragility. However, this omission is unlikely to drive the positive correlation between the
deposit insurance variable and the banking crisis probability: for that to be the case, countries
without deposit insurance would need to have alternative safety net institutions that are even
more effective at preventing depositor runs than deposit insurance itself. This seems to us rather
unlikely. 9 10
7 In our previous work, inflation had a significant impact on crisis probability while depreciation did not. These twovariables are quite strongly positively correlated, and it is difficult to precisely disentangle the role of each.
8 Note that deposit insurance guarantees the domestic currency value of deposit, not their foreign currency value.Thus, the expectation of a devaluation would trigger withdrawals of domestic currency deposits to purchase foreignassets even in the presence of deposit insurance.
9 One possibility is that countries without deposit insurance are countries where the banking sector is mostly public,and is therefore covered by a very strong implicit guarantee. Using the somewhat sparse data available, we havecomputed the correlation between the size of the public banking sector and the presence of deposit insurance. Thecorrelation is positive, suggesting that this concern may not be particularly serious.
10 In a recent study, Rossi (1999) examines the impact on banking crisis probabilities of a “bank safety net” index ina sample of 15 countries for 1990-97. The index captures the presence of deposit insurance, of lender of last resortfacilities, and whether or not there is a history of bank bailouts. The extent of the safety net appears to increase bankfragility. These results, however, need to be taken with caution given the small number of banking crises in thesample.
- 10 -
In the last regression presented in Table II, the binary deposit insurance dummy is
replaced by a dummy variable taking the value of zero for observations with no deposit
insurance, the value of one for observations with deposit insurance but interest rate controls, and
the value of two for observations with deposit insurance and liberalized interest rates.11 This
modified dummy variable, therefore, allows for a different impact of deposit insurance on bank
fragility in systems in which interest rates are deregulated relative to systems in which controls
remain. The conjecture is that controls on bank interest rates limit the ability of banks to benefit
from investment in high-risk, high-return projects, thereby curbing the moral hazard created by
deposit insurance. The new dummy variable has a positive coefficient that is significant at the
one percent confidence level. Thus, this dummy fits the data better than the simple zero-one
dummy, suggesting that the moral hazard due to deposit insurance may be more severe in
liberalized banking systems.12
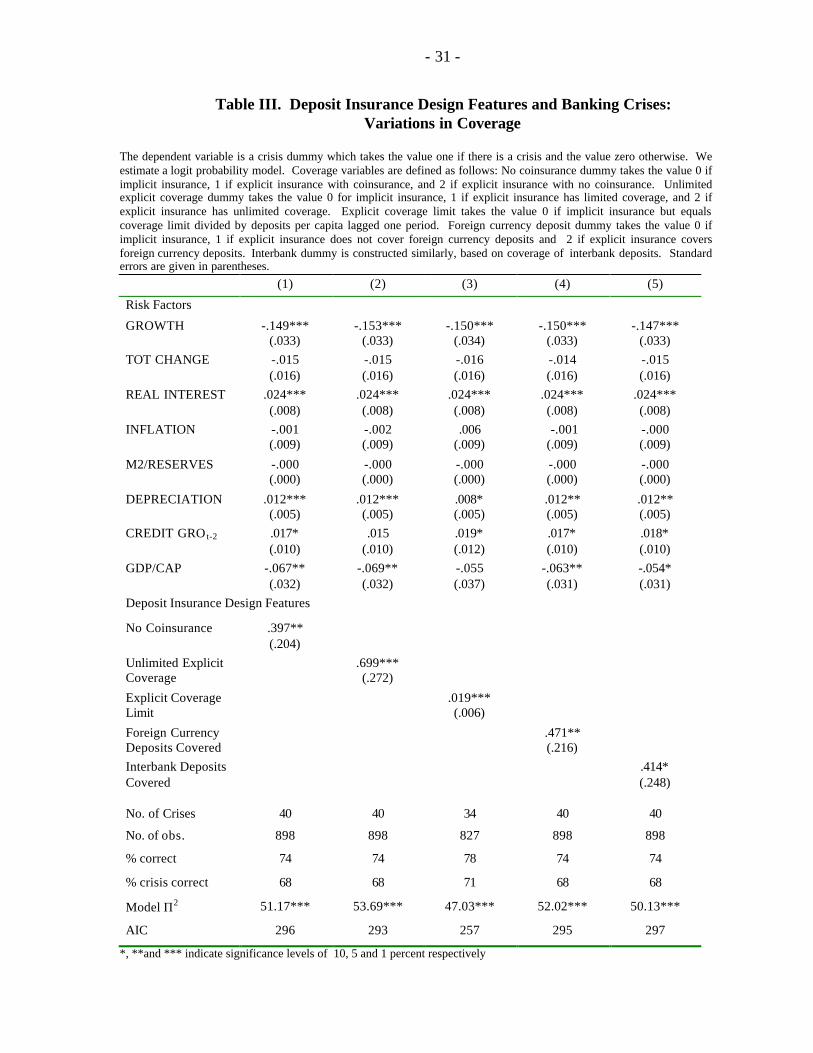
Table III presents the results of estimating banking crisis probabilities using variations in
the deposit insurance dummy that allow us to distinguish among systems with different degrees
of coverage. According to the theory, more comprehensive coverage should be a better
guarantee against depositor runs, but it would also create more incentives for excessive risk
taking. All coverage-related variables assign the value of zero to observations with no explicit
deposit insurance and assign larger values to deposit insurance systems with broader coverage.
11 The data on interest rate liberalization are from DemirgηΗ-Kunt and Detragiache (1999). This dummy variabletakes the value of zero in economies where bank interest rates are regulated and the value of one in economieswhere the process on interest rate liberalization has begun. The correlation between this dummy and the depositinsurance dummy is about 32 percent; thus, although there is a tendency for deposit insurance to be introducedalong with financial liberalization, the tendency is far from being universal.
12 This result is not due to the different sample size: when the baseline model is estimated using the same sampleused in the regression with interest rate liberalization, the deposit insurance dummy remains significant only at the10 percent confidence level.
- 11 -
The “no coinsurance” dummy assigns the value of one to observations without coinsurance and
the value of two if there is no coinsurance. The second coverage-related variable is also a three-
way dummy variable, but in this case all systems with a coverage limit are treated as ones, and
systems in which coverage is unlimited are treated as twos. A third variable is constructed
assigning to observations with a deposit insurance scheme the actual share of deposits covered,
computed as the individual coverage limit divided by bank deposit per capita.13 This variable, of
course, is not a dummy variable. Countries/periods with unlimited coverage are excluded from
this regression. Finally, systems that extend coverage to foreign currency deposits or to
interbank loans should be more vulnerable than systems with more narrow coverage. To test this
hypothesis, we introduce two more three-way dummy variables, assuming the value of zero
where there is no deposit insurance, of one if there is deposit insurance but foreign currency
(interbank) deposits are not covered, and the value of two otherwise.
As evident from Table III, estimation results uniformly suggest that explicit deposit
insurance tends to increase bank fragility, and the more so the more extensive is coverage. All
five coverage-related variables have positive signs and are strongly significant (except for the
interbank deposit variable, which is significant only at the 10 percent confidence level). It is
noteworthy that the coefficient of the deposit insurance variable is estimated more precisely
when differences in coverage are taken into account. This is consistent with an interpretation of
the baseline results in terms of moral hazard. Also, these findings lend support to the view that
the pitfalls of deposit insurance can be reduced by limiting the extend of coverage (Garcia,
13 If a banking crisis is accompanied by a decline in deposits, this ratio may increase in banking crisis years eventhough the deposit insurance system has not become more generous. To avoid this problem, we have used depositslagged by one year to compute the coverage ratio.
- 12 -
1999).14 To get a sense for the magnitude of the effect, we have computed estimated banking
crisis probabilities for four episodes under the hypothesis that the coverage of the deposit
insurance system in the four countries is reduced to the level of Switzerland, where coverage is
limited to 45 percent of deposit per capita (about 50 percent of per-capita GDP). For the 1993
crisis in Kenya, the estimated crisis probability would decline from 26.8 percent to 16.6 percent;
for the 1981 crisis in the Philippines it would go from 21.0 percent to 3.8 percent; for the 1980
crisis in the U.S. it would become 2.5 percent from 4.3 percent. Finally, the estimated crisis
probability in Venezuela in 1993 would have fallen from 17.0 percent to 12.5 percent. So the
estimated effect of a change in coverage on fragility is not trivial.
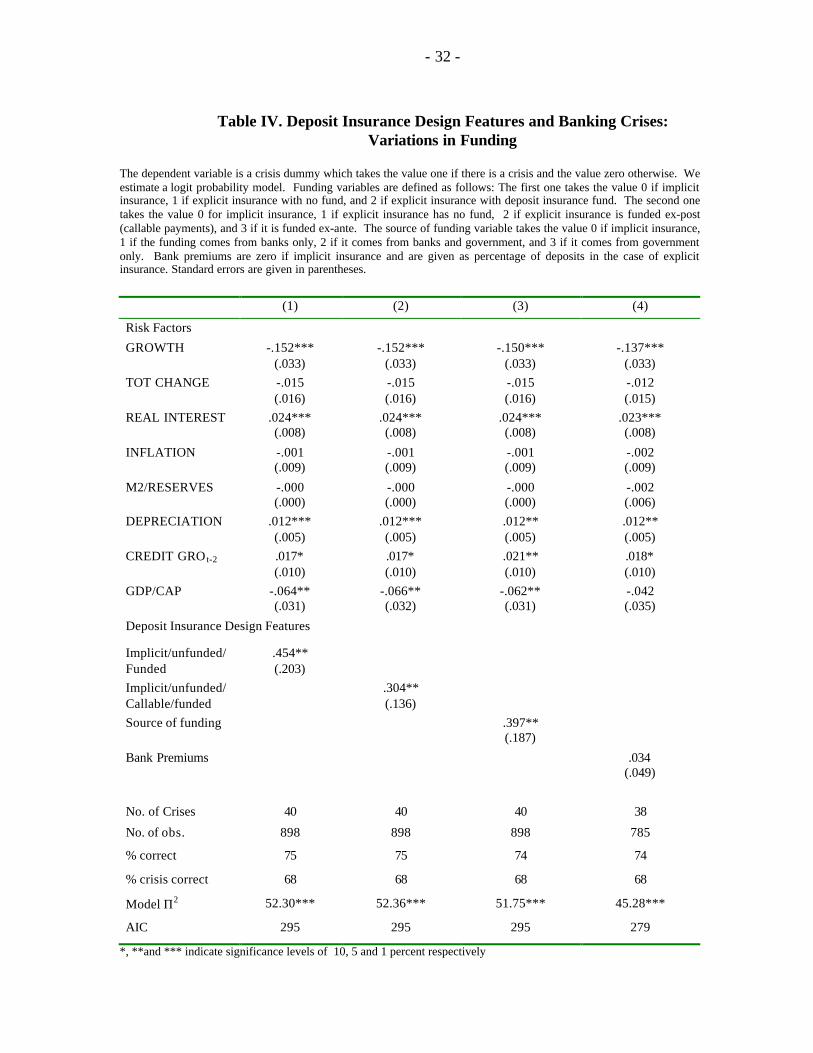
A second element that differentiates deposit insurance schemes is the type of funding.
Here we experiment with three different dummy variables. The first is a zero-one-two variable
based on whether there is no scheme, an unfunded scheme, or a funded scheme. The second
dummy variable further distinguishes between schemes that are funded with callable funds and
schemes that are funded with paid-up resources (the latter providing a more credible guarantee).
The conjecture is, of course, that unfunded schemes are more similar to implicit schemes than
funded schemes. Another aspect of funding is whether the resources are provided by the banks
themselves, by the government, or by both. In this case, we hypothesize that moral hazard is
stronger if the scheme is funded by the government, and it is milder if the scheme if completely
privately funded, so we set the dummy variable at zero for implicit schemes, at one for privately
funded programs, at two for programs that are funded by both the public and the private sector,
14 We have also tested for “threshold” effects concerning coverage, namely whether deposit insurance tends toincrease fragility only if coverage extends beyond a certain threshold, but we have not been able to identify any sucheffects.
- 13 -
and at three for government-financed schemes. As in the case of coverage, also in the case of
funding estimation results shows that differentiating among systems based on the type of funding
yields better coefficient estimates for the deposit insurance variable relative to the baseline
(Table IV). Also, the hypothesis that funded systems give rise to more moral hazard finds
empirical support, suggesting that the credibility of the safety net plays a significant role. Thus,
ensuring that the deposit insurance system is well-funded, as recommended for instance by
Garcia (1999), while it may have other advantages, appears to have costs in terms of bank
fragility. In the last regression reported in Table IV we have tested whether distinguishing among
systems with different insurance premiums allows to improve the estimation results. This does
not appear to be the case, perhaps because what matters is whether premiums are adjusted to
reflect the risk of bank portfolios.15
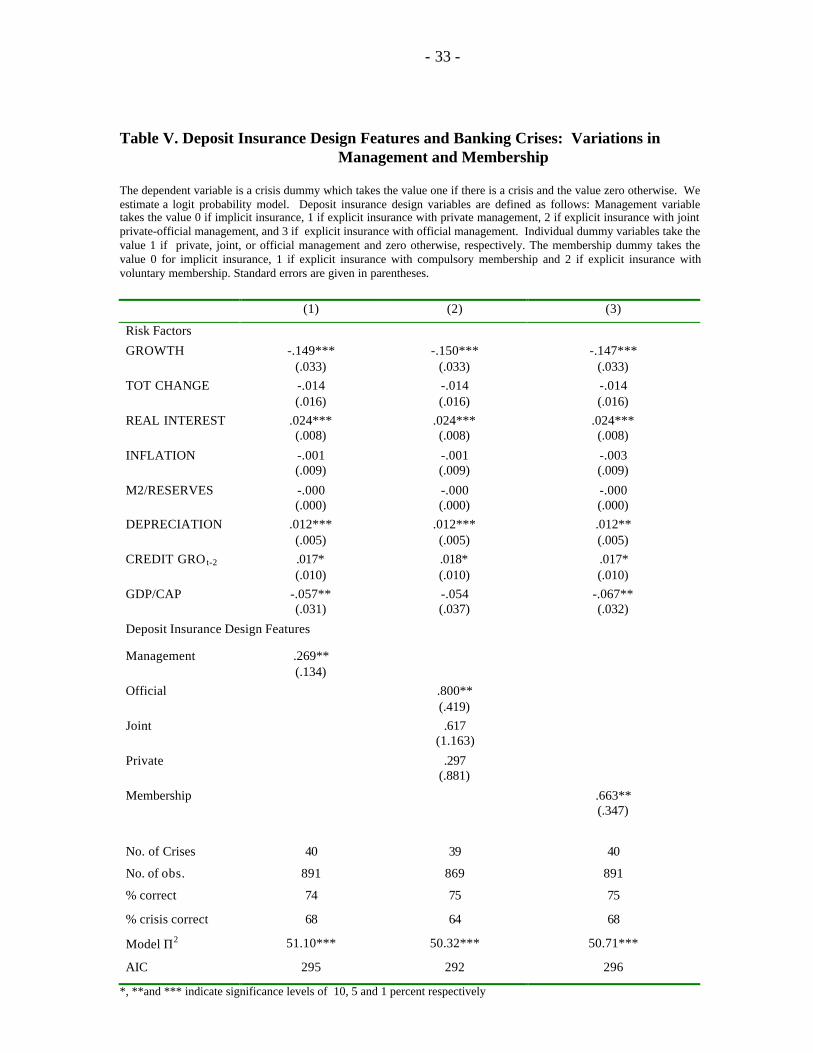
Differences in management and membership rules may also be relevant in shaping the
impact of deposit insurance and bank stability. In a system managed by the banks themselves
there may be less room for abuse than in a system managed by the government if banks have
better information to monitor one another. This hypothesis finds support in the estimation results
reported in Table V, where as the deposit insurance variable we introduce a dummy variable that
takes the value of zero for implicit systems, of one for explicit systems that are privately
managed, two for explicit systems that are managed jointly by the private sector and the
government, and three for systems managed by the government alone. As a further test, we also
15 Six countries in the sample reported that their insurance premiums were risk-adjusted, Assuming that premiumswere risk-adjusted from the inception of the deposit insurance scheme, we constructed a dummy that takes the valueof zero when there is no deposit insurance, a value of one if there is deposit insurance and premiums are risk-adjusted, and a value of two otherwise. This variable has positive and significant (at the 5 percent level) coefficientin the banking crisis regression suggesting that risk-adjusted premiums are better at mitigating excessive risk taking.
- 14 -
introduce three dummies for each of the three alternative forms of management. The four-way
dummy has a coefficient that is positive and significant (at the 5 percent confidence level).
When separate dummies are introduced, the dummy for government management is the only one
significant. Thus, it appears that the relevant distinction is between systems that are entirely run
by the government and systems in which the banking sector plays at least some role. Finally, in
the last banking crisis regression we introduce a membership dummy that is zero for implicit
schemes, one for schemes with compulsory membership, and two for schemes with voluntary
membership. Here the conjecture is that compulsory membership, by reducing adverse selection
among banks, should make the banking systems less unstable than deposit insurance with
voluntary membership. This hypothesis is supported by the data.
At this point the reader may wonder whether the alternative deposit insurance dummies
constructed using different design features really convey additional information: if all the
dummies are strongly positively correlated because countries with high coverage are also
countries in which deposit insurance is funded and the government manages the system, for
instance, then it would be difficult to claim that we can disentangle the effect of each design
feature on bank stability. As it turns out, however, the dummies are highly positively correlated
only because they all have zeroes for countries with no deposit insurance. If we compute
correlations among the dummies only for countries with deposit insurance, then such correlations
are only around 30 percent, suggesting that there is considerable variation in design features in
the sample. A perusal of the information in Table 1 suggests as much.
- 15 -
IV. Deposit Insurance, Bank Fragility, and the Institutional Environment
To investigate further the relationship between bank stability and deposit insurance, in
this section we examine to what extent the institutional environment affects this relationship.
More specifically, advocates of deposit insurance often claim that the risk of moral hazard can be
contained through effective prudential regulation and supervision of the banking system. If this
is true, then we should find the impact of deposit insurance on banking crisis probabilities to be
small or even negligible in economies where bank regulation is strong, and vice versa.
Unfortunately, no comprehensive measure of the quality of bank regulation exists to date, so to
test this hypothesis we rely on proxies consisting of indexes capturing different aspects of the
institutional environment: the degree to which the rule of law prevails (“law and order”), the
quality of contract enforcement, the quality of the bureaucracy, the extent of bureaucratic delay,
and, finally, the degree of corruption. All indexes are increasing in the quality of the institutions,
and range from zero to six (except for the indexes of contract enforcement and of bureaucratic
delay, which range from zero to four). We hypothesize that where institutions are of high quality
so is bank prudential regulation and supervision. Accordingly, if the institutional index is
interacted with the deposit insurance variable and entered in the banking crisis probability
regression, we expect this interaction term to have a negative coefficient.
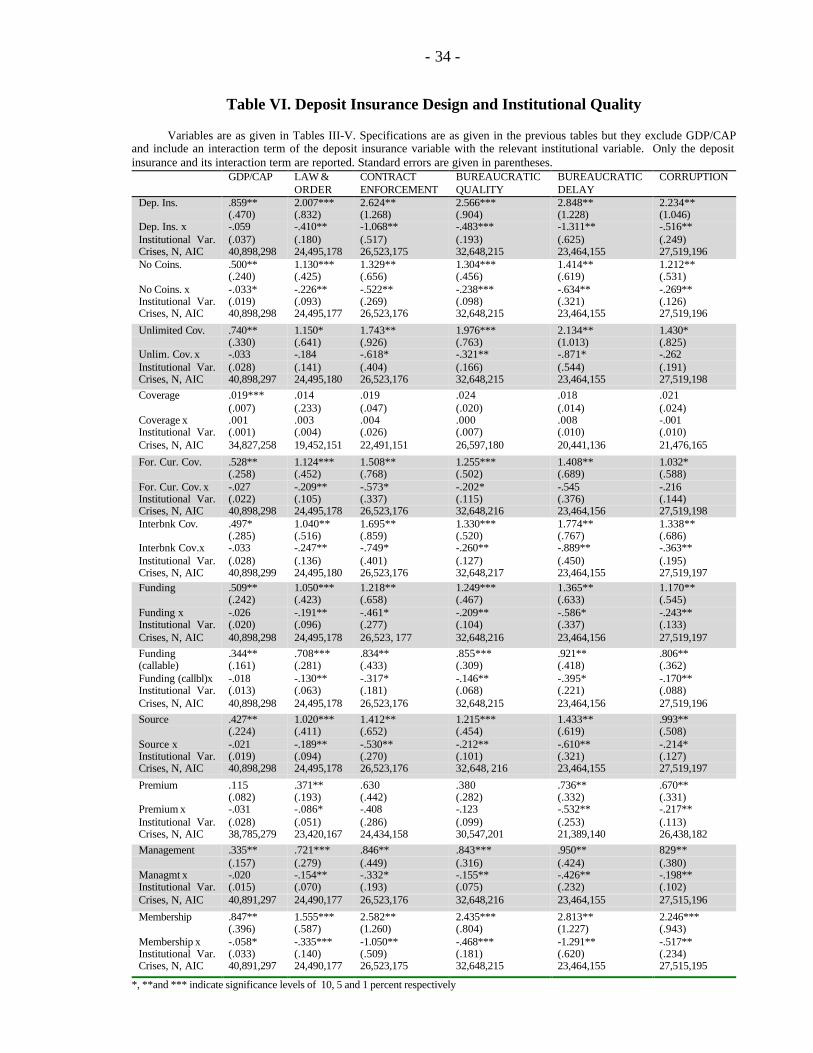
Table VI summarizes the results. Each regression includes the control variables used in
the baseline regression (except for GDP per-capita, which is itself a proxy for institutional
quality), one of the deposit insurance variables used in Section III above, and an interaction term
between the variable and an index of institutional quality. In the first column, the exercise is
conducted using GDP per capita as the institutional variable. For brevity, the table only reports
the coefficient and standard errors of the deposit insurance variables and of the interaction terms,
- 16 -
as well as the number of crises, the number of observations, and the value of the AIC for each
regression. 16
The first observation about the results in Table VI is that the coefficients of all the
interaction terms have the expected negative sign, with the exception of those using the extent of
coverage as the deposit insurance variable. The latter are positive but not significant.
Furthermore, the great majority of the interaction variables is significant. We interpret this as
evidence that indeed good institutions (and, therefore, presumably better bank regulation and
supervision) perform an important role in curbing the negative effect of deposit insurance on
bank stability. In fact, in a number of cases the point estimate of the coefficient of the interaction
variable is large enough that for the higher values of the institutional indexes the impact of
deposit insurance on banking system fragility is no longer significant.
Interestingly, if GDP per-capita is used as the institutional variable, the interaction terms
are mostly insignificant. This is not due to the different sample size, as running the regression
including GDP for the samples used for the other institutional variables yields equally
insignificant results. Therefore, it appears that the institutional indexes capture aspects of the
environment that are relevant to bank stability over and beyond the general level of development
of the country. Finally, among the different indexes, “law and order” and the index of the quality
of the bureaucracy seem to yield marginally better results.
To summarize, in this section we have found the negative impact of deposit insurance on
bank stability to be greater in economies with institutions of poor quality. This suggests that
such countries should be especially wary of introducing an explicit deposit insurance system.
16 Due to the limited availability of the institutional indexes, the size of the panel is considerably smaller than thebaseline.
- 17 -
V. Robustness
A. Testing for Simultaneity Bias
A potential criticism to the regression results derived in the previous sections is that the
decision to adopt deposit insurance may be influenced by the fragility of the banking sector, so
that the two variables are really jointly determined. If this is the case, then treating deposit
insurance as exogenous would lead to simultaneity bias in the estimates.17 To assess whether
such bias is what drives the results, in this section we perform a two-stage estimation procedure:
in the first stage, a logit model of the determinants of the deposit insurance regime is estimated.
In the second stage, we estimate the benchmark specification of Section III using the probability
of adopting deposit insurance estimated in the first stage as the deposit insurance variable.
Essentially, this is an instrumental variable estimation, where we try to purge the endogenous
component of the deposit insurance variable in the first stage. For the two-stage logit model to
be properly identified, there has to be at least one variable that is correlated with the probability
of adopting an explicit deposit insurance scheme but is uncorrelated with the country’s
probability of experiencing a crisis. We use the proportion of countries in the sample that has
already adopted explicit deposit insurance as the instrument, a variable that we call contagion for
lack of a better term. The conjecture here is that, when deciding whether to implement deposit
insurance, policy-makers are influenced by the choices of policy-makers in other countries. As
explicit depositor protection becomes more widespread, it becomes enshrined as a sort of
“universal best practice”, and policy-makers become more prone to adopt it. Also, policy-makers
17 In our sample the raw correlation between the crisis dummy and the deposit insurance dummy is .002 andinsignificant which makes this unlikely.
- 18 -
may learn from neighboring countries about the workings of deposit insurance. Of course, once
we control for other important factors, the popularity of explicit deposit insurance schemes
around the world should not be an important determinant of a country’s crisis probability.
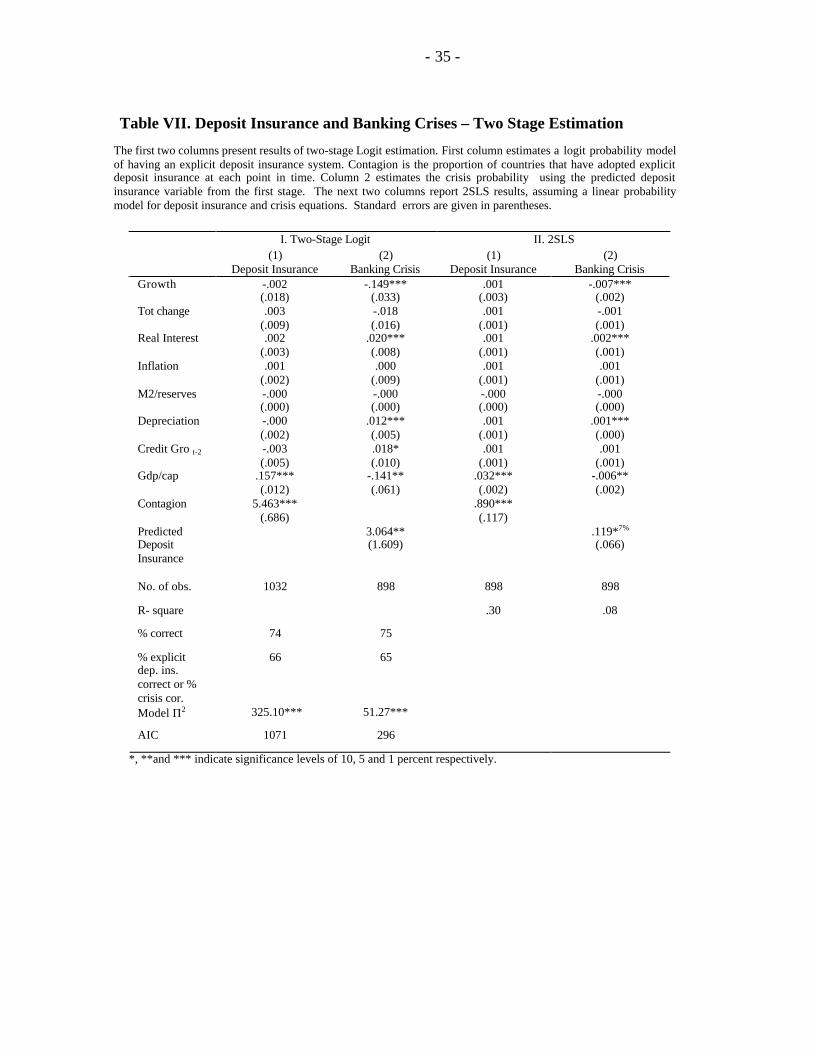
The results of the two-stage logit are presented in Table VII. The first column estimates a
logit model of adopting explicit deposit insurance. Notice that out of all the control variables in
the crisis probability regression, only per-capita GDP is significant in the deposit insurance
regression. This is an encouraging result, suggesting that the decision to adopt deposit insurance
and banking crises are driven by different factors. The sign of GDP per capita is positive,
indicating that richer economies are more likely to adopt an explicit insurance scheme. As better
institutions are correlated with higher GDP per capita and better institutions may be associated
with better prudential regulation and supervision of banks, this finding may suggest that
countries are more likely to adopt deposit insurance if they can reduce its costs. We also find that
the contagion variable has a positive and significant effect, suggesting some sort of “fad” among
policy-makers concerning the adoption of deposit insurance.
The results of the second-stage crisis regression are presented in the second column of
Table VII. The deposit insurance variable is now slightly more significant, at five percent. As
for the control variables, the sign of the coefficients and their significance levels remain virtually
unchanged relative to the baseline. While the second stage estimation results are consistent, the
use of standard errors from the second stage to judge whether or not the coefficients are
significant is incorrect since this procedure ignores the fact that deposit insurance variable is now
an estimated variable. The computation of the correct covariance matrix for double limited
dependent variable models can be quite cumbersome (Maddala 1983, Chapter 8). However,
Angrist (1991) has shown through Monte Carlo techniques that standard instrumental variable
- 19 -
estimation is a viable alternative to the double logit model. In other words, if we ignore that
deposit insurance and banking crisis are binary variables and estimate the system with a standard
two-stage least squares (2SLS) the estimates would have all the desirable properties. This is
equivalent to assuming that the crisis and deposit insurance models can be estimated using a
linear probability model. The last two columns in Table VII report the results of the 2SLS.
These results are very similar to the ones obtained using the two-stage logit.18 Indeed, correcting
for the endogeneity of the deposit insurance variable does not lead to significant differences
compared to the baseline. Thus, also the results of the two-stage estimation exercise suggest that
deposit insurance tends to increase bank fragility, as in the one-equation models of Section III.
B. Further Sensitivity Tests
In Section III, we examined the impact of the design features of deposit insurance on
banking crisis probabilities by looking at each feature in isolation. In practice, of course, each
deposit insurance system is a combination of different design features and, if our interpretation
of the evidence is correct, systems incorporating more of the features associated with moral
hazard should be more vulnerable to banking crises. To test this hypothesis, we construct an
aggregate index of the moral hazard associated with each deposit insurance scheme in the
sample, and then use this index as the deposit insurance variable in the banking crisis regression.
18 Note that while significance levels will be similar, the coefficients from logistic and linear probability models arenot directly comparable. Amemiya (1981) shows that coefficients of the logistic model are larger than those of thelinear probability model. While it is possible to multiply the coefficients of the linear probability model by a certainfactor to obtain the coefficients of the logistic model, these are rough approximations and the factors change fordifferent probability ranges. So, Amemiya suggests that it is better to compare probabilities directly rather thancomparing the estimates of the coefficients even after an appropriate conversion.
- 20 -
To build an aggregate index of moral hazard we use principal components analysis.19 The
principal components are linear combinations of the original design features, computed using
weights that minimize the loss of information due to replacing the matrix of design features by a
single vector. Using as design features the dummies for no coinsurance, foreign currency
deposits covered, interbank deposits covered, type of funding, source of funding, management,
membership and the level of explicit coverage, we find that the first principal component
explains over 83 percent of the total variation in these variables. The next principal component
explains less than 10 percent variation, which each additional component explaining about one
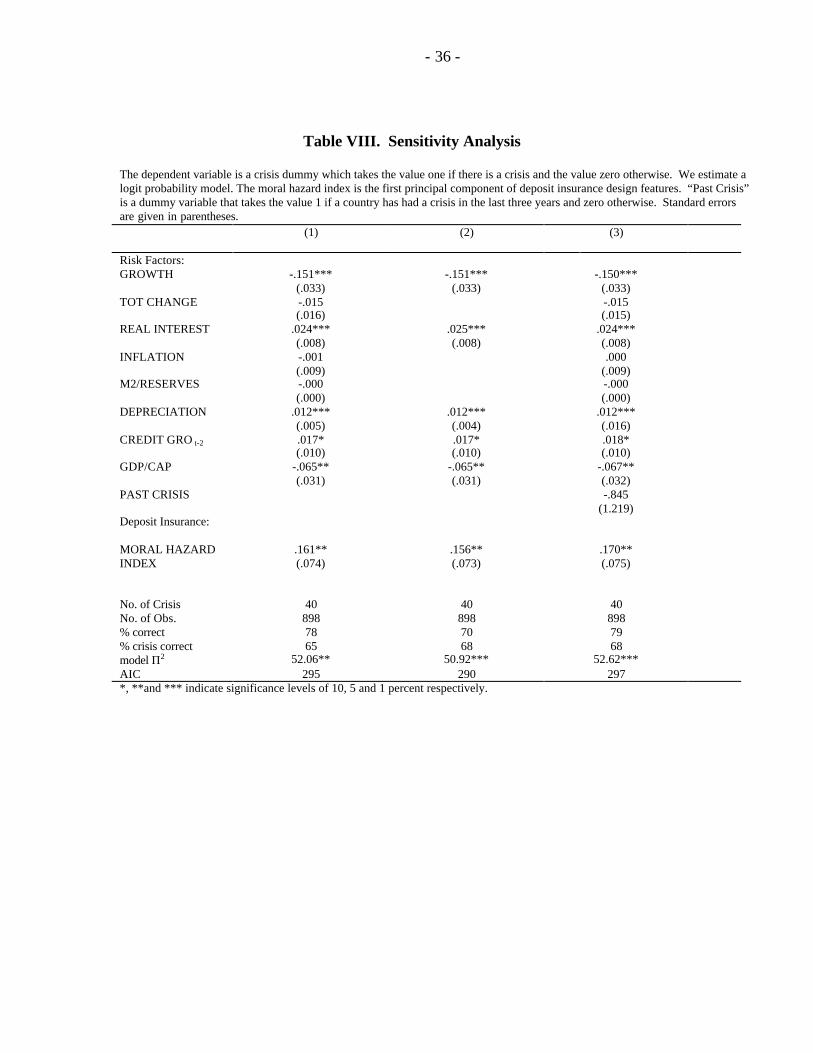
percent. When we use the first principal component as an aggregate index of moral hazard in the
benchmark banking crisis regression, we find that the index has a positive coefficient that is
significant at the 5 percent confidence level (Table VIII). This confirms the results obtained with
the individual dummy variables.
Using the aggregate index of moral hazard as the deposit insurance variable, we have also
performed other sensitivity tests. First, we have tested for the presence of fixed effects
introducing country dummies and (separately) year dummies. None of the dummies was
significant, suggesting that fixed effects models are not appropriate.20 A second test involves
dropping from the regression control variables that have insignificant coefficients; when this is
done, the index of moral hazard remains significant at 5 percent confidence level and the
coefficient does not change much. Finally, it could be argued that banking crises are not
independent events, namely that the probability of a crisis differs for countries that experienced
19 See Greene (1997) pp. 424-427 for a detailed discussion of principal component analysis.
20 These results are not reported. It should also be noted that in the fixed effects model, countries (years) with nobanking crises drop out of the sample, thus resulting in a substantial loss of information (Greene, 1997, p. 899).
- 21 -
crises in the past. To allow for this type of dependence in the crisis probabilities, in the last
regression of Table VIII we introduce a dummy variable that takes the value of 1 if the country
was experiencing a crisis in the three years before the observation and the value of zero
otherwise.21 This dummy has a negative but insignificant coefficient, and the rest of the
regression shows little change.
21 For some countries in the sample we lacked information about the occurrence of a banking crisis in the threeyears before the beginning of the sample period. We assumed that such countries had not experienced a crisis inthose years.
- 22 -
VI. Conclusions
Explicit deposit insurance has become increasingly popular, and a growing number of
depositors around the world are now sheltered from the risk of bank failure. However, the
question of the effects of such schemes on banking sector stability remains an open one both
from a theoretical and from an empirical perspective. Having analyzed empirical evidence for a
large panel of countries for 1980-97, this study finds that explicit deposit insurance tends to be
detrimental to bank stability, the more so where bank interest rates have been deregulated and
where the institutional environment is weak. We interpret the latter result to mean that, where
institutions are good it is more likely that an effective system of prudential regulation and
supervision is in place to offset the lack of market discipline created by deposit insurance. Also,
the adverse impact of deposit insurance on bank stability tends to be stronger the more extensive
is the coverage offered to depositors, where the scheme is funded, and where the scheme is run
by the government rather than by the private sector. Controlling for the possible endogeneity of
deposit insurance does not change our results significantly.
These findings raise a number of interesting questions: first, what is the channel that
leads from explicit deposit insurance to increased bank fragility, given that depositors tend to be
bailed out anyway when systemic problems arise? Here we offer two possible interpretations.
The first is that without an explicit legal commitment by the government there remains a degree
of uncertainty on the part of depositors as to what extent and how quickly their losses will be
covered in case of a crisis.22 This margin of uncertainty, then, is sufficient to restore significant
incentives for depositors to monitor bank behavior. A possible objection to this interpretation
22 If the banking crisis leads to a bout of inflation, then small delays in compensating depositors would result insubstantial real losses since deposits are not usually indexed to the price level.
- 23 -
(and, more generally, to the view that deposit insurance is an important source of moral hazard)
is that it is very costly (and perhaps impossible) for depositors, especially small ones, to be
effective monitors of banks. Acquiring and evaluating information about the quality of bank
assets is a complex and costly activity which is likely to be subject to a substantial collective
action problem, as each individual depositor can free-ride on the monitoring activities of the
others (Stiglitz, 1992).23
There is, however, an alternative explanation of why deposit insurance may increase bank
fragility, that does not rely on the ability of depositors to monitor banks: with deposits already
covered by the funds set aside through the insurance fund, in the event of a crisis other bank
creditors and perhaps even bank shareholders may be in a better position to pressure policy-
makers to extend protection to their own claims. Conversely, if it must scramble to find the
budgetary resources to pay off depositors, then the government may find it easier to say no to the
other claimants. If this is true, then ex ante deposit insurance would lead to weaker incentives to
monitor bank management not only for depositors, but also for other bank creditors and bank
shareholders.24 Interestingly. DemirgηΗ-Kunt and Huizinga (1999) find banks’ cost of fund to
be lower and less sensitive to bank-specific risk factors in countries with explicit deposit
insurance. This supports the view that deposit insurance weakens market discipline, be it
discipline exercised by depositors, by other bank creditors, or by bank shareholders.
23 In a system where deposits are not insured, banks could hire credit rating agencies to monitor them, and couldmake the rating available to depositors a little or no cost.
24 Our finding that the adverse impact of deposit insurance on fragility is larger for funded schemes supports thisinterpretation. Whether bailouts tend to be more generous in countries with deposit insurance is an interestingquestion for future empirical research.
- 24 -
A second interesting issue is whether there are reasons to adopt explicit deposit insurance
despite its negative impact on systemic stability. It is sometimes argued that the main purpose of
deposit insurance is to provide a risk-free asset to small savers (Folkerts-Landau and Lindgren,
1998). Critics of this view, however, point out that this function can be performed at a lower
cost to the economy by assets other than insured bank deposits, such as postal savings or money
market funds backed by government debt (Calomiris, 1996, Stiglitz, 1992). Another, related
argument to introduce deposit insurance is that it may create the basis for a more developed
banking system that performs more financial intermediation. This is a conjecture that awaits
thorough empirical examination, although preliminary results are not encouraging (Cull, 1998).
A third question, of obvious importance for policy advise, is whether deposit insurance
may be beneficial to stability in some types of countries even though, on average, it has an
adverse effect. Our empirical results suggest that in countries with a very good institutional
environment deposit insurance may not lead to additional instability, perhaps because in those
countries regulators can more effectively offset moral hazard.
- 25 -
References
Allen, Franklin, and Douglas Gale, 1998, “Optimal Banking Crises”, Journal of Finance, 53 (4),pp. 1245-1284.
Amemiya, Takeshi, 1981, “Qualitative Response Models: A Survey,” Journal of EconomicLiterature, 19 (4), pp. 483-536.
Angrist, Joshua D., 1991, “Instrumental Variables Estimation of Average Treatment Effects inEconometrics and Epidemiology,” National Bureau of Economic Research, TechnicalWorking Paper No. 115.
Bhattacharya, Sudipto, Arnoud W. A. Boot, Anjan V. Thakor, 1998, “The Economics of BankRegulation”, Journal of Money, Credit, and Banking, 30 (4), pp. 745-770.
Calomiris, Charles, W., 1996, “Building an Incentive-Compatible Safety Net: Special Problemsfor Developing Countries”, mimeo, Columbia University.
Cull, Robert (1998), “How Deposit Insurance Affects Financial Depth: A Cross-CountryAnalysis”, Policy Research Paper No. 1875, World Bank.
Demirgüç-Kunt, Asl2, and Detragiache, Enrica, 1998, “The Determinants of Banking Crises in Developing and Developed Countries”, IMF Staff Papers, 45 (1), pp. 81-109.
__________, 1999, “Financial Liberalization and Financial Fragility”, in B. Pleskovic and J.E.Stiglitz (Eds.) Proceedings of the 1998 World Bank Conference on DevelopmentEconomics, Washington, DC, The World Bank.
Demirgüç-Kunt, Asl2, and Harry Huizinga, 1999, “Market Discipline and Financial Safety NetDesign,” Policy Research Working Paper No. 2183, World Bank.
Diamond, Douglas, and Philip Dybvig, 1983, “Bank Runs, Deposit Insurance, andLiquidity,”Journal of Political Economy, 91 (3), pp. 401-19.
Folkerts-Landau, David, and Carl-Johan Lindgren, 1998, Toward a Framework for FinancialStability, (Washington, International Monetary Fund).
Garcia, Gillian, 1996, “Deposit Insurance: Obtaining the Benefits and Avoiding the Pitfalls”,IMF Working Paper No. 96/83.
Garcia, Gillian, 1999, “Deposit Insurance: A Survey of Actual and Best Practices”, IMFWorking Paper No. 99/54.
Greene, William, H., 1997, Econometric Analysis, Third Edition, (Saddle River, NJ: PrenticeHall).
- 26 -
Kane, Edward J., 1989, The S&L Insurance Mess: How Did it Happen?, (Washington: UrbanInstitute Press).
Kyei, Alexander, “Deposit Protection Arrangements: A Survey”, IMF Working Paper No.95/134.
Maddala, G. S.,1983, Limited-Dependent and Qualitative Variables in Econometrics, (NewYork: Cambrige University Press)
Matutes, Carmen, and Xavier Vives, 1996, “Competition for Deposit, Fragility, and Insurance”,Journal of Financial Intermediation, 5 (2), pp. 184-216.
Rossi, Marco, 1999, “Financial Fragility and Economic Performance in Developing Countries:Do Capital Controls, Prudential Regulation and Supervision Matter?”, IMF WorkingPaper No. 99/66.
Stiglitz, Joseph E., 1972, “Some Aspects of the Pure Theory of Corporate Finance: Bankruptciesand Takeovers,” Bell Journal of Economics, 3 (3), pp. 458-82.
Stiglitz, Joseph E., 1992, “S&L Bailout”, in James R. Barth and R. Dan Brunbaugh Jr. (Eds.),TheReform of Federal Deposit Insurance, (New York, HarperBusiness).
Talley, Samuel H., and Igracio Mas, 1990, “Deposit Insurance in Developing Countries,” Policy,Research, and External Affairs Working Paper No. 548, (Washington: World Bank,November).
- 27 -
Table I. Deposit Insurance System Features
Implicit is defined as lack of an explicit scheme. Date established refers to the date of the statute by which the scheme is established. Co-insurance is a dummy variable that takeson the value one if depositors face a deductible in their insured funds. Coverage limit refers to the explicit amount the authorities promise to insure. Foreign currency deposits andinterbank deposits take value one if insurance coverage extends to those areas, respectively. Funding takes the value one if the scheme is funded ex-ante and zero otherwise.Source of funding can be from government only (2), banks and government (1), or banks only (0). The premium banks pay is given as percentage of deposits or liabilities.Management of the fund can be official (1), official/private joint (2), or private (3). Membership to the fund can be compulsory or voluntary. Sources: Kyei, Alexander, 1995“Deposit protection arrangements: a survey”, (IMF working paper; WP/90/134); Garcia, Gillian, 1999, “Deposit Insurance: A Survey of Actual and Best Practices”, (IMF workingpaper; WP/99/54); Institute of International Bankers - Global Surveys (1998, 1997, 1996, 1995, 1994). “Korea introduces bank deposit insurance scheme”, International FinancialLaw Review; London; Apr 1997; Dong Won Ko. “Law on Deposit Insurance Fund”, Central Bank of Turkey- Unofficial Translation. "Banking failures in developing countries:An Auditors perspective”, International Journal of Government Auditing: Washington, Jan 1998; Javed Nizam. “Belgium implements deposit guarantee-scheme”, InternationalFinancial Law Review; London; June 1995; Bruyneel, Andre; Miller, Axel. “Venezuela: Ministry representative views banking system", FEDWORLD, 08/05/96 athttp://wnc.fedworld.gov/cgi-bin/retrieve. Bank of Finland Bulletin, March 1998, Vol. 72, No:3. "Japan: Stimulation package", Oxford Analytica Brief; December 1997. “ECDeposit-Guarantee Directive”, International Financial Law Review; London; Dec 1995; Fredborg, Lars.
Countries Bankingcrisis date
Type
Explicit=1
Implicit=0
DateEstablished
Co-insurance
Coverage Limit
(US $ equivalent atthe end of July 1998
or ecu)
ForeignCurrencyDepositsCovered
Interbank DepositsCovered
Funding
Funded=1Unfunded
=0
Source ofFunding
Banks only=0Banks &Gov.=1
Governmentonly=2
Bank's Premiumof Deposits or Liabilities
Management
official=1joint=2
private=3
Membership
compulsory=1
voluntary=0
Australia 0Austria 1 1979 0 $24,075 but
coinsurance forbusinesses
0 0 0 1 callable 3 1
Bahrain 1 1993 0 1 0 0 0 callable 2 1Belgium 1 1974 0 Ecu 15,000, 20,000
in year 20000 0 1 1 .0002 of deposits from
clients2 1
Belize 0Burundi 0Canada 1 1967 0 $40,770 0 1 1 1 0.0033 of insured deposits
(max)1 1
Chile 1981-87 1 1986 1 demand deposits infull and 90%
coinsurance to UF120 or $3600 forsavings deposits
1 0 0 2 callable 1 1
Colombia 1982-85 1 1985 1 full until 2001, thencoins. 75% to $5500
0 1 1 0 0.003 insured deposits 1 1
- 28 -
Congo 1 1999 0 $3557 0 1 1 1 0.0015 of deposits + 0.005of npls
2 0
Cyprus 0Denmark 1 1988 0 ecu 20,000 1 0 1 1 0.002 of total deposits 2 1Ecuador 1995-97 1 1999 0 in full to year 2001 1 1 1 N/A. 0.0065 of deposits 1 1Egypt 0El Salvador 1989 1 1999 0 $4,720 1 0 1 1 0.001 to 0.003of insured
deposits1 1
Finland 1991-94 1 1969 0 $29,435 1 0 1 1 0.0005 to 0.0030 of insureddeposits
3 1
France 1 1980 0 $65,387 0 0 0 0 callable 3 1Germany 1 1966 1 private: 30% of
capital; officialcoinsurance 90% to
ecu 20,000
1 0 1 0 0.0003 of deposits 3 1
Greece 1 1993 0 ecu 20,000 0 0 1 0 0.00025-0.0125 of eligibledeposits
2 1
Guatemala 0Guyana 1993-95 0Honduras 0India 1991-97 1 1961 0 $2,355 1 0 1 1 0.0005 of deposits 1 1Indonesia 1992-97 0Ireland 1 1989 1 co insurance 90% to
ecu 15,0000 0 1 0 0.002 of deposits 1 1
Israel 1983-84 0Italy 1990-95 1 1987 1 $125,000 1 0 0 1 callable 3 1Jamaica 1996-97 1 1998 0 $5,512 1 0 1 1 0.001 of insured deposits 1 1Japan 1992-97 1 1971 0 $71000 but in full
until year 20000 0 1 1 0.00084 of insured deposits 2 1
Jordan 1989-90 0Kenya 1993 1 1985 0 $1,750 1 1 1 1 0.0015 of deposits 1 1Korea 1997 1 1996 0 $14600 but in full
until year 20000 0 1 1 0.0005 of insured deposits 1 1
Malaysia 1985-88,1997
0
Mali 1987-89 0Mexico 1982,
1994-971 1986 0 in full, except
subordinated debt,until 2005
1 1 1 1 0.003 of covered liab. 1 1
Nepal 1988-97 0
- 29 -
Netherlands 1 1979 0 ecu 20,000 1 0 0 1 1 1NewZealand
0
Nigeria 1991-95 1 1988 0 $588 / $2435 * 0 1 1 1 0.009375of deposits 1 1Norway 1987-93 1 1961 0 $260,800 1 0 1 1 0.0001 of deposits 1 1Panama 1988-89 0Papua NewGuinea
1989-97 0
Peru 1983-90 1 1992 0 $21,160 0 0 1 1 0.0065 to 0.0145 of insureddeposits
2 1
Philippines 1981-87 1 1963 0 $2,375 1 1 1 1 0.002 of total deposits 1 1Portugal 1986-89 1 1992 0 ecu 15,000,
coinsurance to ecu45,000
1 0 1 1 0.0008 to 0.0012 1 1
Seychelles 0Singapore 0SouthAfrica
1985 0
Sri Lanka 1989-93 1 1987 0 $1,470 1 0 1 1 0.0015 of deposits 1 0
Sweden 1990-93 1 1996 0 ecu 28663, $31,412 1 0 1 1 0.005 1 1Swaziland 1995 0Switzerland 1 1984 0 $19,700 0 0 0 0 callable 1 0Tanzania 1988-97 1 1993 0 $376 0 0 1 1 0.001of deposits 3 1Thailand 1983-87,
19970
Togo 0Turkey 1982,
1991,1994
1 1983 0 in full 1 0 1 1 0.01 to 0.012 1 1
U.K. 1 1982 1 larger of 90%coinsurance to$33,333 or ecu
22,222
0 0 0 0 callable 3 1
U.S. 1980-92 1 1934 0 $100,000 1 1 1 1 0.00 to 0.0027 1 1Uruguay 1981-85 0Venezuela 1993-97 1 1985 0 $7,309 0 0 1 1 0.02 of total deposits 1 1Zambia 0
- 30 -
Table II. Deposit Insurance and Banking Crises
The dependent variable is a crisis dummy which takes the value one if there is a crisis and the value zero otherwise. We estimate alogit probability model. Deposit insurance variable takes the value 1 if there is explicit deposit insurance and 0 otherwise. DepositInsurance & Liberalization is a dummy that takes the value 2 if the country has liberalized its interest rates and has explicit depositinsurance; value 1 if the country has either liberalized or has explicit deposit insurance; and value 0 if it has neither liberalized norhas explicit deposit insurance. Standard errors are given in parentheses.
(1) (2) (3) (4)Risk Factors:GROWTH -.148***
(.033)-.124***
(.036)-.125***
(.036)-.158***
(.039)TOT CHANGE -.015
(.016)-.011(.019)
-.013(.016)
-.027(.018)
REAL INTEREST .024***(.002)
.021***(.008)
.021***(.008)
.025***(.008)
INFLATION -.000(.009)
.004(.010)
.001(.010)
-.001(.010)
M2/RESERVES -.000(.000)
-.001(.006)
-.001(.006)
.005(.004)
DEPRECIATION .012***(.005)
.008(.006)
.010**(.005)
.013***(.005)
CREDIT GRO t-2 .017*(.010)
.024**(.013)
.020**(.010)
.030***(.012)
GDP/CAP -.065**(.033)
-.093(.068)
-.071**(.034)
-.081***(.032)
Deposit Insuranceand Risk Factors:DEPOSIT INS. .696*8%
(.397)GROWTH xDEP. INS.
-.158(.107)
-.166*(.102)
TOT CHANGE xDEP. INS.
.003(.037)
RL. INTEREST xDEP. INS.
.070**(.035)
.069**(.032)
INFLATION xDEP. INS.
-.019(.025)
M2/RESERVES xDEP. INS.
.024**(.011)
.024**(.010)
DEPRECIATION xDEP. INS.
.022*(.013)
.013*(.007)
CREDIT GRO t-2 xDEP. INS.
-.013(.026)
GDP/CAP xDEP. INS.
.029(.072)
DEPOSIT INS. &LIBERALIZATION
.997***(.292)
No. of Crisis 40 40 40 36No. of Obs. 898 898 898 714% correct 74 76 76 75% crisis correct 68 65 65 69model Π2 50.53** 63.56*** 62.42*** 55.44***AIC 297 298 291 250*, **and *** indicate significance levels of 10, 5 and 1 percent respectively.
- 31 -
Table III. Deposit Insurance Design Features and Banking Crises:Variations in Coverage
The dependent variable is a crisis dummy which takes the value one if there is a crisis and the value zero otherwise. Weestimate a logit probability model. Coverage variables are defined as follows: No coinsurance dummy takes the value 0 ifimplicit insurance, 1 if explicit insurance with coinsurance, and 2 if explicit insurance with no coinsurance. Unlimitedexplicit coverage dummy takes the value 0 for implicit insurance, 1 if explicit insurance has limited coverage, and 2 ifexplicit insurance has unlimited coverage. Explicit coverage limit takes the value 0 if implicit insurance but equalscoverage limit divided by deposits per capita lagged one period. Foreign currency deposit dummy takes the value 0 ifimplicit insurance, 1 if explicit insurance does not cover foreign currency deposits and 2 if explicit insurance coversforeign currency deposits. Interbank dummy is constructed similarly, based on coverage of interbank deposits. Standarderrors are given in parentheses.
(1) (2) (3) (4) (5)
Risk Factors
GROWTH -.149***(.033)
-.153***(.033)
-.150***(.034)
-.150***(.033)
-.147***(.033)
TOT CHANGE -.015(.016)
-.015(.016)
-.016(.016)
-.014(.016)
-.015(.016)
REAL INTEREST .024***(.008)
.024***(.008)
.024***(.008)
.024***(.008)
.024***(.008)
INFLATION -.001(.009)
-.002(.009)
.006(.009)
-.001(.009)
-.000(.009)
M2/RESERVES -.000(.000)
-.000(.000)
-.000(.000)
-.000(.000)
-.000(.000)
DEPRECIATION .012***(.005)
.012***(.005)
.008*(.005)
.012**(.005)
.012**(.005)
CREDIT GRO t-2 .017*(.010)
.015(.010)
.019*(.012)
.017*(.010)
.018*(.010)
GDP/CAP -.067**(.032)
-.069**(.032)
-.055(.037)
-.063**(.031)
-.054*(.031)
Deposit Insurance Design Features
No Coinsurance .397**(.204)
Unlimited ExplicitCoverage
.699***(.272)
Explicit CoverageLimit
.019***(.006)
Foreign CurrencyDeposits Covered
.471**(.216)
Interbank DepositsCovered
.414*(.248)
No. of Crises 40 40 34 40 40
No. of obs. 898 898 827 898 898
% correct 74 74 78 74 74
% crisis correct 68 68 71 68 68
Model Π2 51.17*** 53.69*** 47.03*** 52.02*** 50.13***
AIC 296 293 257 295 297
*, **and *** indicate significance levels of 10, 5 and 1 percent respectively
- 32 -
Table IV. Deposit Insurance Design Features and Banking Crises:Variations in Funding
The dependent variable is a crisis dummy which takes the value one if there is a crisis and the value zero otherwise. Weestimate a logit probability model. Funding variables are defined as follows: The first one takes the value 0 if implicitinsurance, 1 if explicit insurance with no fund, and 2 if explicit insurance with deposit insurance fund. The second onetakes the value 0 for implicit insurance, 1 if explicit insurance has no fund, 2 if explicit insurance is funded ex-post(callable payments), and 3 if it is funded ex-ante. The source of funding variable takes the value 0 if implicit insurance,1 if the funding comes from banks only, 2 if it comes from banks and government, and 3 if it comes from governmentonly. Bank premiums are zero if implicit insurance and are given as percentage of deposits in the case of explicitinsurance. Standard errors are given in parentheses.
(1) (2) (3) (4)
Risk Factors
GROWTH -.152***(.033)
-.152***(.033)
-.150***(.033)
-.137***(.033)
TOT CHANGE -.015(.016)
-.015(.016)
-.015(.016)
-.012(.015)
REAL INTEREST .024***(.008)
.024***(.008)
.024***(.008)
.023***(.008)
INFLATION -.001(.009)
-.001(.009)
-.001(.009)
-.002(.009)
M2/RESERVES -.000(.000)
-.000(.000)
-.000(.000)
-.002(.006)
DEPRECIATION .012***(.005)
.012***(.005)
.012**(.005)
.012**(.005)
CREDIT GRO t-2 .017*(.010)
.017*(.010)
.021**(.010)
.018*(.010)
GDP/CAP -.064**(.031)
-.066**(.032)
-.062**(.031)
-.042(.035)
Deposit Insurance Design Features
Implicit/unfunded/Funded
.454**(.203)
Implicit/unfunded/Callable/funded
.304**(.136)
Source of funding .397**(.187)
Bank Premiums .034(.049)
No. of Crises 40 40 40 38
No. of obs. 898 898 898 785
% correct 75 75 74 74
% crisis correct 68 68 68 68
Model Π2 52.30*** 52.36*** 51.75*** 45.28***
AIC 295 295 295 279
*, **and *** indicate significance levels of 10, 5 and 1 percent respectively
- 33 -
Table V. Deposit Insurance Design Features and Banking Crises: Variations inManagement and Membership
The dependent variable is a crisis dummy which takes the value one if there is a crisis and the value zero otherwise. Weestimate a logit probability model. Deposit insurance design variables are defined as follows: Management variabletakes the value 0 if implicit insurance, 1 if explicit insurance with private management, 2 if explicit insurance with jointprivate-official management, and 3 if explicit insurance with official management. Individual dummy variables take thevalue 1 if private, joint, or official management and zero otherwise, respectively. The membership dummy takes thevalue 0 for implicit insurance, 1 if explicit insurance with compulsory membership and 2 if explicit insurance withvoluntary membership. Standard errors are given in parentheses.
(1) (2) (3)
Risk Factors
GROWTH -.149***(.033)
-.150***(.033)
-.147***(.033)
TOT CHANGE -.014(.016)
-.014(.016)
-.014(.016)
REAL INTEREST .024***(.008)
.024***(.008)
.024***(.008)
INFLATION -.001(.009)
-.001(.009)
-.003(.009)
M2/RESERVES -.000(.000)
-.000(.000)
-.000(.000)
DEPRECIATION .012***(.005)
.012***(.005)
.012**(.005)
CREDIT GRO t-2 .017*(.010)
.018*(.010)
.017*(.010)
GDP/CAP -.057**(.031)
-.054(.037)
-.067**(.032)
Deposit Insurance Design Features
Management .269**(.134)
Official .800**(.419)
Joint .617(1.163)
Private .297(.881)
Membership .663**(.347)
No. of Crises 40 39 40
No. of obs. 891 869 891
% correct 74 75 75
% crisis correct 68 64 68
Model Π2 51.10*** 50.32*** 50.71***
AIC 295 292 296
*, **and *** indicate significance levels of 10, 5 and 1 percent respectively
- 34 -
Table VI. Deposit Insurance Design and Institutional Quality
Variables are as given in Tables III-V. Specifications are as given in the previous tables but they exclude GDP/CAPand include an interaction term of the deposit insurance variable with the relevant institutional variable. Only the depositinsurance and its interaction term are reported. Standard errors are given in parentheses.
GDP/CAP LAW &ORDER
CONTRACTENFORCEMENT
BUREAUCRATICQUALITY
BUREAUCRATICDELAY
CORRUPTION
Dep. Ins. .859**(.470)
2.007***(.832)
2.624**(1.268)
2.566***(.904)
2.848**(1.228)
2.234**(1.046)
Dep. Ins. xInstitutional Var.
-.059(.037)
-.410**(.180)
-1.068**(.517)
-.483***(.193)
-1.311**(.625)
-.516**(.249)
Crises, N, AIC 40,898,298 24,495,178 26,523,175 32,648,215 23,464,155 27,519,196No Coins. .500**
(.240)1.130***(.425)
1.329**(.656)
1.304***(.456)
1.414**(.619)
1.212**(.531)
No Coins. xInstitutional Var.
-.033*(.019)
-.226**(.093)
-.522**(.269)
-.238***(.098)
-.634**(.321)
-.269**(.126)
Crises, N, AIC 40,898,298 24,495,177 26,523,176 32,648,215 23,464,155 27,519,196
Unlimited Cov. .740**(.330)
1.150*(.641)
1.743**(.926)
1.976***(.763)
2.134**(1.013)
1.430*(.825)
Unlim. Cov. xInstitutional Var.
-.033(.028)
-.184(.141)
-.618*(.404)
-.321**(.166)
-.871*(.544)
-.262(.191)
Crises, N, AIC 40,898,297 24,495,180 26,523,176 32,648,215 23,464,155 27,519,198Coverage .019***
(.007).014(.233)
.019(.047)
.024(.020)
.018(.014)
.021(.024)
Coverage xInstitutional Var.
.001(.001)
.003(.004)
.004(.026)
.000(.007)
.008(.010)
-.001(.010)
Crises, N, AIC 34,827,258 19,452,151 22,491,151 26,597,180 20,441,136 21,476,165
For. Cur. Cov. .528**(.258)
1.124***(.452)
1.508**(.768)
1.255***(.502)
1.408**(.689)
1.032*(.588)
For. Cur. Cov. xInstitutional Var.
-.027(.022)
-.209**(.105)
-.573*(.337)
-.202*(.115)
-.545(.376)
-.216(.144)
Crises, N, AIC 40,898,298 24,495,178 26,523,176 32,648,216 23,464,156 27,519,198Interbnk Cov. .497*
(.285)1.040**(.516)
1.695**(.859)
1.330***(.520)
1.774**(.767)
1.338**(.686)
Interbnk Cov.xInstitutional Var.
-.033(.028)
-.247**(.136)
-.749*(.401)
-.260**(.127)
-.889**(.450)
-.363**(.195)
Crises, N, AIC 40,898,299 24,495,180 26,523,176 32,648,217 23,464,155 27,519,197Funding .509**
(.242)1.050***(.423)
1.218**(.658)
1.249***(.467)
1.365**(.633)
1.170**(.545)
Funding xInstitutional Var.
-.026(.020)
-.191**(.096)
-.461*(.277)
-.209**(.104)
-.586*(.337)
-.243**(.133)
Crises, N, AIC 40,898,298 24,495,178 26,523, 177 32,648,216 23,464,156 27,519,197Funding(callable)
.344**(.161)
.708***(.281)
.834**(.433)
.855***(.309)
.921**(.418)
.806**(.362)
Funding (callbl)xInstitutional Var.
-.018(.013)
-.130**(.063)
-.317*(.181)
-.146**(.068)
-.395*(.221)
-.170**(.088)
Crises, N, AIC 40,898,298 24,495,178 26,523,176 32,648,215 23,464,156 27,519,196Source .427**
(.224)1.020***(.411)
1.412**(.652)
1.215***(.454)
1.433**(.619)
.993**(.508)
Source xInstitutional Var.
-.021(.019)
-.189**(.094)
-.530**(.270)
-.212**(.101)
-.610**(.321)
-.214*(.127)
Crises, N, AIC 40,898,298 24,495,178 26,523,176 32,648, 216 23,464,155 27,519,197
Premium .115(.082)
.371**(.193)
.630(.442)
.380(.282)
.736**(.332)
.670**(.331)
Premium xInstitutional Var.
-.031(.028)
-.086*(.051)
-.408(.286)
-.123(.099)
-.532**(.253)
-.217**(.113)
Crises, N, AIC 38,785,279 23,420,167 24,434,158 30,547,201 21,389,140 26,438,182Management .335**
(.157).721***(.279)
.846**(.449)
.843***(.316)
.950**(.424)
829**(.380)
Managmt xInstitutional Var.
-.020(.015)
-.154**(.070)
-.332*(.193)
-.155**(.075)
-.426**(.232)
-.198**(.102)
Crises, N, AIC 40,891,297 24,490,177 26,523,176 32,648,216 23,464,155 27,515,196
Membership .847**(.396)
1.555***(.587)
2.582**(1.260)
2.435***(.804)
2.813**(1.227)
2.246***(.943)
Membership xInstitutional Var.
-.058*(.033)
-.335***(.140)
-1.050**(.509)
-.468***(.181)
-1.291**(.620)
-.517**(.234)
Crises, N, AIC 40,891,297 24,490,177 26,523,175 32,648,215 23,464,155 27,515,195
*, **and *** indicate significance levels of 10, 5 and 1 percent respectively
- 35 -
Table VII. Deposit Insurance and Banking Crises – Two Stage Estimation
The first two columns present results of two-stage Logit estimation. First column estimates a logit probability modelof having an explicit deposit insurance system. Contagion is the proportion of countries that have adopted explicitdeposit insurance at each point in time. Column 2 estimates the crisis probability using the predicted depositinsurance variable from the first stage. The next two columns report 2SLS results, assuming a linear probabilitymodel for deposit insurance and crisis equations. Standard errors are given in parentheses.
I. Two-Stage Logit II. 2SLS(1)
Deposit Insurance(2)
Banking Crisis(1)
Deposit Insurance(2)
Banking CrisisGrowth -.002
(.018)-.149***
(.033).001
(.003)-.007***
(.002)Tot change .003
(.009)-.018(.016)
.001(.001)
-.001(.001)
Real Interest .002(.003)
.020***(.008)
.001(.001)
.002***(.001)
Inflation .001(.002)
.000(.009)
.001(.001)
.001(.001)
M2/reserves -.000(.000)
-.000(.000)
-.000(.000)
-.000(.000)
Depreciation -.000(.002)
.012***(.005)
.001(.001)
.001***(.000)
Credit Gro t-2 -.003(.005)
.018*(.010)
.001(.001)
.001(.001)
Gdp/cap .157***(.012)
-.141**(.061)
.032***(.002)
-.006**(.002)
Contagion 5.463***(.686)
.890***(.117)
PredictedDepositInsurance
3.064**(1.609)
.119*7%
(.066)
No. of obs. 1032 898 898 898
R- square .30 .08
% correct 74 75
% explicitdep. ins.correct or %crisis cor.
66 65
Model Π2 325.10*** 51.27***
AIC 1071 296
*, **and *** indicate significance levels of 10, 5 and 1 percent respectively.
- 36 -
Table VIII. Sensitivity Analysis
The dependent variable is a crisis dummy which takes the value one if there is a crisis and the value zero otherwise. We estimate alogit probability model. The moral hazard index is the first principal component of deposit insurance design features. “Past Crisis”is a dummy variable that takes the value 1 if a country has had a crisis in the last three years and zero otherwise. Standard errorsare given in parentheses.
(1) (2) (3)
Risk Factors:GROWTH -.151***
(.033)-.151***
(.033)-.150***
(.033)TOT CHANGE -.015
(.016)-.015(.015)
REAL INTEREST .024***(.008)
.025***(.008)
.024***(.008)
INFLATION -.001(.009)
.000(.009)
M2/RESERVES -.000(.000)
-.000(.000)
DEPRECIATION .012***(.005)
.012***(.004)
.012***(.016)
CREDIT GRO t-2 .017*(.010)
.017*(.010)
.018*(.010)
GDP/CAP -.065**(.031)
-.065**(.031)
-.067**(.032)
PAST CRISIS -.845(1.219)
Deposit Insurance:
MORAL HAZARDINDEX
.161**(.074)
.156**(.073)
.170**(.075)
No. of Crisis 40 40 40No. of Obs. 898 898 898% correct 78 70 79% crisis correct 65 68 68model Π2 52.06** 50.92*** 52.62***AIC 295 290 297*, **and *** indicate significance levels of 10, 5 and 1 percent respectively.
- 37 -
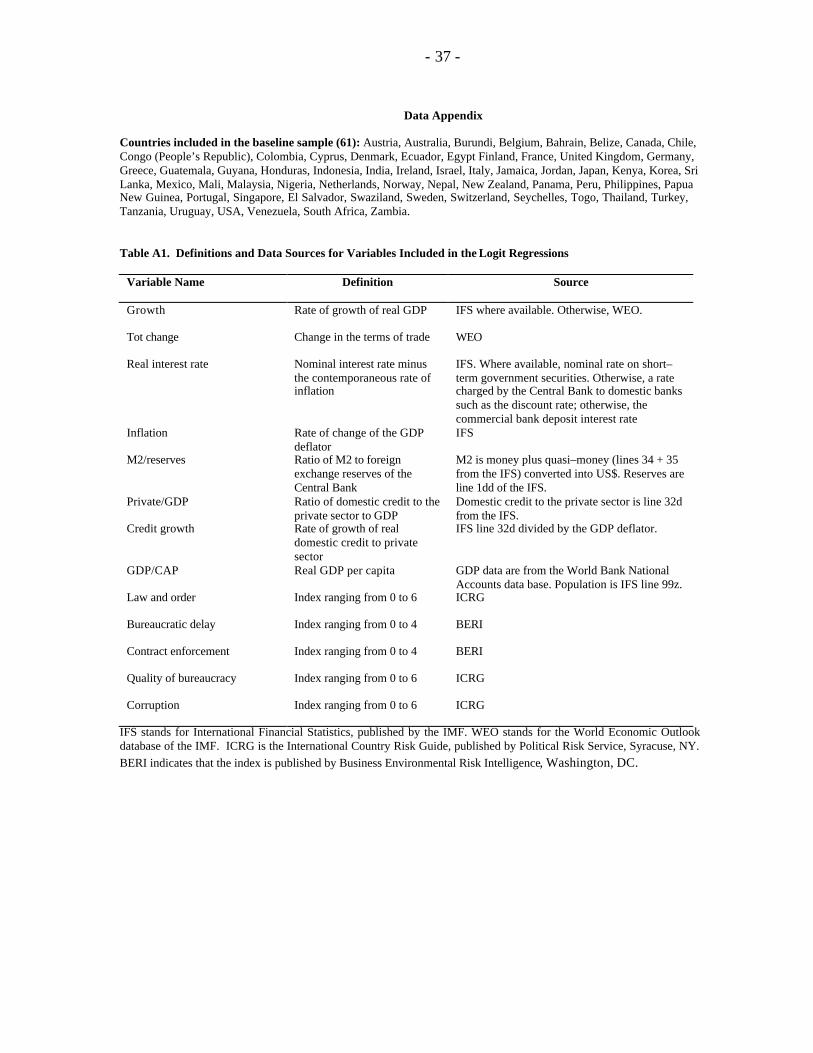
Data Appendix
Countries included in the baseline sample (61): Austria, Australia, Burundi, Belgium, Bahrain, Belize, Canada, Chile,Congo (People’s Republic), Colombia, Cyprus, Denmark, Ecuador, Egypt Finland, France, United Kingdom, Germany,Greece, Guatemala, Guyana, Honduras, Indonesia, India, Ireland, Israel, Italy, Jamaica, Jordan, Japan, Kenya, Korea, SriLanka, Mexico, Mali, Malaysia, Nigeria, Netherlands, Norway, Nepal, New Zealand, Panama, Peru, Philippines, PapuaNew Guinea, Portugal, Singapore, El Salvador, Swaziland, Sweden, Switzerland, Seychelles, Togo, Thailand, Turkey,Tanzania, Uruguay, USA, Venezuela, South Africa, Zambia.
Table A1. Definitions and Data Sources for Variables Included in the Logit Regressions
Variable Name Definition Source
Growth Rate of growth of real GDP IFS where available. Otherwise, WEO.
Tot change Change in the terms of trade WEO
Real interest rate Nominal interest rate minusthe contemporaneous rate ofinflation
IFS. Where available, nominal rate on short–term government securities. Otherwise, a ratecharged by the Central Bank to domestic bankssuch as the discount rate; otherwise, thecommercial bank deposit interest rate
Inflation Rate of change of the GDPdeflator
IFS
M2/reserves Ratio of M2 to foreignexchange reserves of theCentral Bank
M2 is money plus quasi–money (lines 34 + 35from the IFS) converted into US$. Reserves areline 1dd of the IFS.
Private/GDP Ratio of domestic credit to theprivate sector to GDP
Domestic credit to the private sector is line 32dfrom the IFS.
Credit growth Rate of growth of realdomestic credit to privatesector
IFS line 32d divided by the GDP deflator.
GDP/CAP Real GDP per capita GDP data are from the World Bank NationalAccounts data base. Population is IFS line 99z.
Law and order Index ranging from 0 to 6 ICRG
Bureaucratic delay Index ranging from 0 to 4 BERI
Contract enforcement Index ranging from 0 to 4 BERI
Quality of bureaucracy Index ranging from 0 to 6 ICRG
Corruption Index ranging from 0 to 6 ICRG
IFS stands for International Financial Statistics, published by the IMF. WEO stands for the World Economic Outlookdatabase of the IMF. ICRG is the International Country Risk Guide, published by Political Risk Service, Syracuse, NY.BERI indicates that the index is published by Business Environmental Risk Intelligence, Washington, DC.