does decentralization hurt childhood immunization? decentralization hurt childhood immunization?...
TRANSCRIPT

Does Decentralization Hurt Childhood Immunization?
Joanne Yoong∗
Department of Economics,Stanford University
October 20, 2007
Abstract
How does decentralization in developing countries affect the provision of public services,particularly in healthcare? We study the impact of decentralizing reforms in the district-healthsystem on a critical public health intervention, routine childhood immunization, in MadhyaPradesh, one of the largest and poorest states in India. Time-varying statewide implementationof the reform between 1996 and 1998 led to differences in exposure for children within the samebirth cohorts and districts. The results suggest that immunization, particularly in rural areas,suffered a severe fall due to the reform. Children aged 0-3 received an average of 0.5 less vaccinesper year of exposure, equivalent to a gap of 12-14% of the state-level average.
Keywords: Public Health; Development; Decentralization
JEL Classification Numbers:∗Address: 579 Serra Mall, Stanford, California USA, e-mail: [email protected] author acknowledges with
heartfelt appreciation the contribution of Nirmala and Mahesh Buch in Bhopal, Madhya Pradesh and the kind
cooperation of Health Commissioner Dr Rajesh Rajora and RKS Officer Dr Abha Sahu in the design and dissemination
of facility surveys. The author also thanks Edward Miguel, Nancy Qian, Seema Jayachandran, Prakash Kannan, Katja
Kaufmann, Soohyung Lee, Maya Meidan, Sri Nagavarapu and participants of the Development Reading Groups at
Stanford and Berkeley for helpful comments, and especially Aprajit Mahajan, Ulrike Malmendier and Alessandro
Tarozzi for advice and support.
1

1 Introduction
Does decentralization help or hurt public health services? Over the last 25 years, more than75 countries have adopted some form of decentralization reform (Ahmad, Devarajan, Khemani,and Shah, 2005), often prompted in fact by the evident failure of centralized states to provideadequate levels of public services (Bardhan, 2002). This type of failure is particularly evident inIndia’s overburdened public health sector, where the provision of preventive care for children hasbeen a long-time priority but has achieved limited success. Against a backdrop of phenomenaleconomic growth, under-five mortality in India for 2000 has remained high at 105 per 100,000births - more than ten times the developed-country average. Multilateral development agenciesand other advocates of reform in developing countries often suggest decentralization reforms as theremedy for the types of quality and coverage issues that confront child health in India, in manycases explicitly prioritizing lending and technical assistance for programs that involve local-levelparticipation (Bossert, 1998; Lipscomb and Mobarak, 2007; Ahmad, Devarajan, Khemani, andShah, 2005)1
While some practitioners may have come to see change in the direction of local participation asan ”unqualified good” occasionally subject to faulty implementation (Khwaja, 2004), the theoreticaleconomics literature points to fundamental tradeoffs inherent to decentralization itself. Althoughefficiency may be gained from better information and increased accountability, externalities maynot be accounted for and local capacity for both technical production and governance is ofteninadequate. In spite of this, a growing number of empirical studies have begun to evaluate theimpact of various forms of decentralization on a range of public services in developing countriesand remarkably few find negative effects. Fewer still specifically address the actual impact ofhealth-sector decentralization on service outcomes.
The WHO (2004) has identified the direct impact of decentralization on the public sector re-sponse to immunization specifically as a key information gap in in public health. We focus attentionon immunization for five reasons. Firstly, immunization is a key intervention not just for publichealth but development in general, cost-effectively reducing childhood morbidity and mortality,especially in developing countries (Aaby, Samb, Simondon, Seck, Knudsen, and Whittle, 1995;Koenig, Bishar, and Khan, 2001; Breiman, Streatfield, Phelan, Shifa, Rashid, and Yunus, 2004).Most countries in theory subscribe to universal coverage against at least six major infectious child-hood diseases - polio, diphtheria, pertussis, tetanus, tuberculosis and measles. Secondly, this is asuitable case study for supply-side organizational change as immunization is a mostly supply-driventechnical intervention (?). Demand for vaccination is limited but significantly less controversialamong the receiving public than other services, such as family planning (Nichter, 1995). Thirdly,immunization carries significant positive externalities as vaccination reduces the risk of disease notonly for the immunized community but those around it. Finally, as a preventive against infectiousdiseases, even if overall efficiency gain involves reducing immunization, the welfare cost of such an
1Lending from the World Bank alone to enable community-based development projects has more than doubled
since 1996, accounting for over $7 billion in 2003 (Mansuri and Rao, 2004).
2

action may disproportionately on vulnerable groups.In India, universal immunization is mandated under the Government of India’s Reproductive
and Child Health program but the actual state of childhood immunization leaves much to be desired.In 1998/1999, virtually all immunization occurred in government health facilities. However, lessthan half of all children aged 12 to 23 months had received their eight scheduled vaccinations,and 14% had received none at all. Funding constraints account for only part of this failure: InMadhya Pradesh, the region of study, the proportion of fully-immunized children saw an absolutedecline over the 1990s although funding for regular routine immunization remained stable andtotal immunization-related funding actually increased under the specialized nationwide Pulse Polioprogram.
I analyze a natural experiment with decentralization in the district health system of one of thelargest and poorest states of India. In Madhya Pradesh, district hospitals provide curative servicesto hospital patients and preventive care to urban areas, wile overseeing public health services for thedistrict as a whole. Over the 1990s, Madhya Pradesh created district hospital committees jointlyrun by hospital authorities and district-level local governments. The reform had two importantcomponents: firstly ,the committees were allowed to manage the hospital’s staff and physical assetsand secondly, to raise and spend their own supplementary funds via user fees, donations, loans andleases. These reforms were subject to two constraints: central control over service-specific grantsand the doctors’ employment was maintained, and the poor were exempted from the payment offees.
Time-varying statewide implementation of reforms between 1996 and 1998 led to differences inexposure for children across birth cohorts and districts. By matching district-level administrativedata to child-level vaccination records from the Indian National Family Health Surveys before andafter the reform, I measure child-level program exposure and infer causality between organizationalchange and indidivual immunization status. I supplement the household survey data with district-level socioeconomic indicators as well as a survey of facilities and hospital administrators collectedin the field.
Routine immunization suffered a significant fall due to the decentralization reforms. The analy-sis suggests that children aged 0-3 years received an average of 12-14% fewer vaccinations per yearof exposure to the reforms, controlling for age and other demographic factors. Further analysisexplores four common observations about decentralization that apply to this setting that could po-tentially drive these results: the demand impact of user fees, the neglect of immunization in favorof for-profit services, externalities and, to a very limited extent,the identity of local politicians.
This paper provides an alternative explanation for the drop in overall vaccination observedby health officials in Madhya Pradesh. More generally, the findings support existing case-studyliterature on immunization and present a clear counter-example to recent impact evaluations ofdecentralization and public services that have been largely positive or neutral. Thirdly, the paperadds to the literature on health-sector decentralization by examining a hybrid form of decentral-ization that combines autonomy with central grants that is widely-practiced but rarely evaluated
3

outside the case-study method.The rest of the paper continues as follows. First, I briefly review the relevant literature related
to decentralization and public services, with a focus on health-related services and immunization.I then describe the institutional case study of the Rogi Kalyan Samiti. The empirical analysisproceeds by reviewing the data before presenting the results of both a simple, intuitive difference-in-difference analysis as well as a more precise analysis based on individual-level exposure measures.Finally, we discuss the results, present robustness checks and conclude with suggestions for furtherwork.
2 Background
2.1 Related Literature
The main argument made in support of decentralization is that local managers are likely to bebetter informed about and more responsive to local costs and needs, as they are more accountableto their communities for the level and quality of services. Decentralization in theory promotes thisaccountability by increasing the probability that welfare of a given locality can determine the re-election of government (?). Better information and accountability can enhance efficiency (Faguet,2004), which may also benefit from the reduction of bottlenecks and delays from bureaucraticprocedures (Bossert, Bowser, and Amenyah, 2007).
However, local authorities may not be willing or able to provide improved public services.Services with positive inter-jurisdictional externalities are likely to be underprovided by local man-agers who free-ride on their neighbors (Besley and Coate, 2003), while services that create negativeexternalities may be overprovided or underregulated (List and Gerking, 2000; Sigman, 2007). Bard-han (2002) also suggests that received wisdom about decentralization leans heavily on the fiscalfederalism literature on industrialized nations, while particular attention needs to be paid to thedeveloping-country context2. In developing countries, accountability to the local community maybe subverted by small groups (Bardhan and Mookherjee, 2006), resulting simply in the transfer ofpower from rent-seeking bureaucrats to self-serving local political elites. Certain aspects of technicalefficiency may be compromised due to additional complexity, duplication and the loss of economiesof scale (see Liu, Martineau, Chen, Zhan, and Tang (2006) on human resources management inChina’s health sector and Bossert, Bowser, and Amenyah (2007) on logistics management in Ghanaand Guatemala). Finally, fiscal reforms associated with decentralization may alter the overall bud-gets for local governments (Lipscomb and Mobarak, 2007) and hence increase or decrease the levelof resources available for local spending.
Empirical studies of decentralization and public services in many different sectors have providedsignificant evidence that various forms of decentralization can in fact improve service outcomes.Galiani, Gertler, and Schargrodsky (2005) find that privatization improves water quality in Ar-
2Barankay and Lockwood (2007), for example, find a powerful relationship between fiscal decentralization and the
productive efficiency of public good provision in the case of Swiss cantons)
4

gentina, while King and Ozler (2001) find that school autonomy improved educational outcomes inNicaragua . Indeed, various decentralization reforms outside the health sector have been shown toproduce better health-related outcomes. One body of work (such as Robalino, Picazo, and Voet-berg (2001)) uses data aggregated at the country-level aggregate to show that measures of politicaldecentralization are related to increases in child mortality. However, measurement error and selec-tion bias from poor comparability of health and political variables across countries is still likely tobe a major concern. More fundamentally, a broad international comparison of outcomes may becompromised by the material discrepancies in the forms and objectives of decentralization. Anotherrapidly growing literature shows that improvements in water and sanitation infrastructure deliv-ery through privatization, administrative decentralization and community management positivelyaffect health, particularly for children. Galiani, Gertler, and Schargrodsky (2005) find that waterprivatization reduced child mortality through improvements in access that reduced water-bornedisease.
However, there exists an overall dearth of impact evaluation of decentralization within thehealth sector itself, in part because experience with decentralization in healthcare itself tends to bemore recent relative to other sectors (Bossert, 1998; WHO, 2004). Much discussion has taken placewithin the health sector about decentralization for public services for the reasons above, albeit inthe form of case-studies and qualitative analyses. (Khaleghian (2004) and Wagstaff and Yu (2005)summarize the related policy and public-health literature, providing a further overview and critiqueof health sector reform evaluation) The evidence that is starting to accumulate, however suggeststhat the typically multitask mission of the government health-sector decentralization has led tomixed success on a range of health outcomes. Kremer, Bloom, King, Bhushan, Clingingsmith,Loevinsohn, Hong, and Schwartz (2006), for example, find in Cambodia that contracting-out issuccessful in that it improves explicitly targeted service indicators; non-contract outcomes howeverwere unaffected.
Present work on decentralization and immunization specifically suggests that the overall effectsmay be negative. Using a panel of cross-country data, Khaleghian (2004) finds that political de-centralization is related to lower levels of childhood immunization. Akin, Hutchinson, and Strumpf(2005) collect fiscal data from a sample of decentralized districts in Uganda and find a decliningshare of government health budgets to public goods activities (including vaccination-related activi-ties) relative to private goods under decentralization. Bossert, Chitah, and Bowser (2003) find thatutilization of curative health services and family planning in Zambia did not change with decen-tralization between 1995 and 1998, while national average immunization coverage (as measured bythe third doses of DPT and polio) fell from 82% in 1995 to 63% in 1998. They also find that thisdecline was more pronounced in smaller, poorer and more rural districts. Finally, Wagstaff and Yu(2005) examine a World-Bank funded reform in one province of China aimed at improving urbanhealth infrastructure, and find a fall of 4% in average village-level immunization rates, even when noexplicit immunization-related reform took place. The authors surmise that immunization suffereddue to the lack of incentives for doctors on fixed-salaries to increase outreach, as improvement at
5

township hospitals led to the closure of village clinics.While the direction of the results is relatively clear, each individual study has its limitations.
It is difficult to draw inferences about specific channels of causality in the cross-country setting of(Khaleghian, 2004), particularly when the explanatory variable, overall political decentralization,is so broadly defined. On the other hand, data and sample size often limit the validity of individualcase studies: in Bossert (1998), the available district-level data sources are partial, inconsistent andbegin only after decentralization was well under way. On the other hand Akin, Hutchinson, andStrumpf (2005) consider only districts with sufficient resources to have available workplans in 1995,leaving only 13 observations. In addition, case studies that rely on pre- and post-comparisons suchBossert, Chitah, and Bowser (2003) are likely to confound decentralization with contemporaneousevents. In the case of Zambia above, for example, economic disruptions and changes in donorfunding may have affected the supply chain for vaccines at the same time. Controlling for economy-wide time trends is a general problem for most studies as decentralization often occurs against abackdrop of economic change. The Argentine crisis led to increases in poverty, a falloff in healthinsurance and the disruption of medical supplies throughout the public hospital network duringthe major period of decentralization Ahmad, Devarajan, Khemani, and Shah (2005). In Georgia,extensive decentralization in the health system was accompanied by a resource shortage for vaccinesurveillance, which contributed to the deterioriation of vaccination Djibuti, Rukhadze, Hotchkiss,Eisele, and Silvestre (2007). Finally, none of the studies in this literature use a representativesample of household-level outcome data on vaccination outcomes, but rely on data aggregated atthe level of adminstrative units, a critique that ? observes applies to the decentralization literatureas whole. Firstly, this limits inference both about the actual impact of organizational changeand the underlying mechanisms by which it occurs. Secondly, when targeting and elite captureare concerns, household-level data is critical as differential access to public services between eliteand non-elite groups are fundamental to the analysis. Lastly, aggregate immunization rates areparticularly unreliable and difficult to compare not just between between countries but across time.When comparing administrative data to a well-validated set of household surveys in 45 countries,Murray, Shengelia, Gupta, Moussavi, Tandon, and Theiren (2003) find that changes in reportedcoverage are not correlated with changes reported from household surveys and conclude that theuse of any aggregated administrative data should be interpreted with caution. In India, our regionof study, Balraj, Mukundan, Samuel, and John (1993) found gross mismatches between householdcoverage surveys and administrative documents even at the village-level.
2.2 Institutional Setting
2.2.1 Public Health Facilities in India
Public health in India is the responsibility of individual states, which follow a hub-and-spokedistrict-based system, with a large district hospital and smaller, less-equipped facilities below. Thedistrict hospital delivers both curative(secondary) and specialist (tertiary) medical services usually
6

on a 24-hour basis, as well as preventive (primary) health services to the urban areas. Particulartertiary services may also be provided by specialty hospitals such as TB or eye hospitals. Rural areasare covered by three successively lower tiers of facilities - community health centers (CHCs), primaryhealth centers (PHCs) and sub-health centers (SHCs) . - for which the district hospital serves as thefinal referral3 As the apex institution, district hospitals play a role in the management of district-wide public health by supporting health education, implementing primary health policies such asthe Universal Immunization Program, and coordinating the lower-level health facilities as needed.This organizational structure is fairly typical of most developing country health systems (English,Lanata, Ngugi, and Smith, 2006; WHO, 1992). Private-sector healthcare is largely unregulated, andprovided by allopathic(Western) doctors as well as a significant minority of traditional practitioners.In urban areas, there is a proliferation of private nursing homes and hospitals (including those forprofit and nonprofit) and private tertiary health care establishments. Medical services and drugscan also be procured at small-scale clinics and pathology laboratories.
The district hospital in practice shoulders a significant amount of the burden of all care, asresources for lower-level facilities are often missing or inadequate. In a survey of facilities in ruralRajasthan, Banerjee, Deaton, and Duflo (2004) found that more than half were shut during regularposted hours. In the region of study, Madhya Pradesh, only half the number of mandated ruralfacilities have actually been built, with a deficit of approximately 10,000 sub health centers, 1000primary health centers and 200 community health centers (Bajpai, Dholakia, and Sachs, 2005;of Public Health & Family Welfare, 2006).
This system is doubly burdened by a lack of incentives . Total public health expenditure in Indiawas 0.9% of GDP in 2005 (lower than in Sub-Saharan Africa, at 1.7% of GDP) (Schweitzer, 2007).Doctors are state employees with fixed salaries who face little monitoring and often maintain aprivate practice or laboratory to provide supplementary income 4 Bardhan (2002) notes that evenwhen villagers in India are aware of problems in health facilities, they have no way to changethe behavior of doctors who answer only to the state authority. This system is buttressed bypolitical economy considerations both in terms of training and posting opportunities : elite grouppressures keep medical education highly-subsidized (Das Gupta (2005)) while Ahmad, Devarajan,Khemani, and Shah (2005) notes that the same groups then receive government postings. As
3The official guidelines for rural health facilities are as follows: the lowest tier or Sub Health Centre (SHC) supplies
limited primary care. One Primary Health Centre (PHC), acts as a referral unit for 6 SHCs and provides one qualified
medical officer per population of 30,000 (20,000 in hilly areas) as well as at least 6 beds for in patient services and
referrals for 6 SHCs. For every 4 PHCs, there should be one community Health Centre (CHC) equipped with 4
medical specialists (including surgeon, physician, gynecologist, pediatrician), 30 beds, an operating theatre and a
laboratory.4From informal interviews, it seems that status and hierarchy are extremely important among doctors at the
hospital. In addition, one source suggested that junior doctors who are serving residencies spend all their time
performing most hospital duties at the behest of their supervisors, while the older doctors hold private clinic hours.
Junior doctors are not able to provide quality service due to time constraints, while senior doctors choose not to
provide quality service due to better outside options. This is not an objectively verified observation. The source was
also using political connections to obtain a more favorable posting.
7

a result, performance is poor: Chaudhury, Hammer, Kremer, Muralidharan, and Rogers (2006)estimates that on any given day, an average of 40% of medical workers in government health clinicsin the 19 largest states of India are absent , consistent with Banerjee, Deaton, and Duflo (2004),who found that on average, 35-50% of medical personnel were absent. Providers may not even bemotivated when they do choose to work: Das and Hammer (2007) find that in Delhi, public-sectordoctors exert much less effort both relative to private providers and, more importantly, to theirown assessment of ”correct” treatment.
2.2.2 The Universal Immunization Programme
In line with the WHO policy of ”Health for All by 2000” announced at 1978 in Alma-Ata, Indiaintroduced the first six childhood vaccines (Bacillus Calmette-Guerin, TT, DPT, DT, polio, andtyphoid) with the aim of controlling six target diseases (diphtheria, pertussis, tetanus, poliomyeli-tis, typhoid and childhood tuberculosis) under its Expanded Programme of Immunization (EPI).Measles replaced typhoid in 1985, when the Indian government renamed the EPI the UniversalImmunization Programme (UIP). The UIP’s (unmet) goals were to achieve 85% for these six dis-ease for all children and tetanus toxoid vaccination for all pregnant women by 1990. In 1983, theNational Health Policy revised this target to universal immunization by 2000. In 1992, the UIP wasintegrated into the Child Survival and Safe Motherhood Programme (CSSM), and subsequentlyin 1997 into the RCH. Each child is ultimately entitled to free immunization against diphtheria,pertussis and tetanus (DPT), poliomyelitis, measles and childhood tuberculosis for a total of eightvaccinations (Polio 1-3, DPT 1-3, BCG and measles). According to the schedule, each child shouldbe fully-immunized i.e. received all eight vaccinations by the age of 12 months.
As typical of many developing countries, public facilities receive a fixed subsidy for routineimmunization activities and doctors themselves are required to perform immunizations and organizemass vaccination camps, but they receive no additional pay for performance. In Madhya Pradesh,the chief paedatrician at the local district hospital also takes on the role of the chief immunizationofficer for the district. In 1994, the nationwide Pulse Polio Immunization (PPI) campaign institutedtwo additional annual polio-only National Immunization Days, although polio vaccination alsocontinued under the regular UIP.
Overall, immunization coverage is largely driven by the availability of public-sector facilitiesDatar, Mukherji, and Sood (2005) and their outreach activities. Oster (2006) provides compellingevidence on the importance of on-site village camps for immunization in rural India and the potentialconsequences for gender inequality. Such outreach has to be sustained in order to remain effective:Nichter (1995) cites evidence that the withdrawal of intensive communication and camps causedtakeup to drop below 10% within one year, even in an area of rural India previously considered tobe ”highly successful”.
8

Figure 1: Map of Madhya Pradesh
2.2.3 The Rogi Kalyan Samiti in Madhya Pradesh
Madhya Pradesh is one of the largest, albeit poorest, states of India, with a population of60 million5 across 48 districts . 75% of the population is rural and 35% belong to a minority orscheduled caste/tribe6.
In 1992/3, Madhya Pradesh had infant mortality and under-five mortality rates of 85 and 130in 10,000, above the all-India averages of 79 and 109 (?) Immunization coverage was similarlybelow average: only 29.2% of children under 48 months reported being fully vaccinated and 34.4%reported receiving no vaccination at all, compared to the nationwide average of 35.4% and 30%respectively.
Prior to the institution of the RKS, district hospitals received fixed budgetary allocations from5Note that by population, Madhya Pradesh ranks among the 25 largest countries in the world6A Scheduled Caste or Scheduled Tribe is one officially identified in a table or ”schedule” of ethnic minorities
initially attached to the Indian Constitution, which awards specific rights and privileges to members of such tribes.The
identification is often abbreviated to SC/ST
9

the state designated for specific purposes (known as line-item grants). The civil surgeon or hospitaladministrator had to refer all decisions regarding capital purchases and hospital maintenance tothe state government, while approximately 90% of total hospital budgets was dedicated simply todoctors’ salaries7
In 1994, following an outbreak of the plague in the neighboring city of Surat in Gujarat, thevermin-infested hospital in the district of Indore was shut down under pressure by the local media.An obscure official directive was invoked to allow a committee of medical officers, citizens andlocal elected officials to take emergency control over government assets and privately raise revenueon behalf of the hospital in order to fund a large-scale extermination operation. Following thesuccessful refurbishment and continued maintenance of the hospital using private donations andfee revenue, in 1995, the government formalized a set of administrative guidelines for similar RogiKalyan Samiti (RKS) or Patient Welfare Committees, and directed all district-level hospitals toimplement them.
A RKS at each hospital is formally constituted as a ”registered society” or NGO. The societieshave a large number of stated ”official” objectives that fall into two broad categories: maintainingthe hospital and overseeing the National Health Programmes, including the UIP. A full listing ofthe objectives is in the appendix.
Each hospital continues to receive the same line-item grants from the state government toensure pre-reform levels of funding. The RKS however is allowed to raise its own money via user-fees (subject to exemptions for BPL households), leasing of hospital property, loans or donations.It has full autonomy over the use of hospital assets to generate revenue and can spend its ownincome freely on capital or service staff. It has no authority, however, over government-appointeddoctors, who remain employees of the state at fixed wages.
Decisions are taken by a committee that includes the civil surgeon, an elected community leaderor Sarpanch 8 and the chief district bureaucrat or Collector. 9
7Kumar (2004) relates an interview in which the hospital administrator expressed a common frustration ”I would
not be able to sort out even sundry grievances that would cost not even 20 rupees. It is not a big amount. But can
a CMO go on spending, howsoever little amount it is, practically every day from his own pocket? It was a helpless
situation. For everything you had to report to the directorate of health services and wait endlessly for their response.
Meanwhile not only would the patient suffer but the staff would also be sitting idle. For he would not have the
wherewithal to attend to his/her work”8Panchayats are locally-elected councils formed at each level of intra-state administration - villages, block and
district - that have the authority to allocate certain public goods(see Chattopadhyay and Duflo (2004) for a description
and history of the Panchayat system. Every five to fifteen villages are organized into a Gram Panchayat (GP) with
an elected council subject to the approval of an annual general assembly, the Gram Sabha. GP members form a
Panchayat Samiti (PS) at the next administrative level (the block), and elect a council. Finally, the PS elect a
district-level Zilla Panchayat (ZP). The president of the Panchayat is called the Sarpanch9The society in fact consists of twin committees: an executive committee that makes decisions regarding the
day-to-day affairs of the hospital on a bimonthly basis, and a large management committee that meets annually with
official responsibility for the overall budget and strategy of the hospital. The civil surgeon, the Sarpanch and the
Collector sit on both committees, and the civil surgeon as secretary, has the authoritative say over the management
committee’s agenda. A host of other stakeholders also have input via the management committee, but do not
10

Under the RKS, each hospital continues to receive the same line-itemized allocation from thestate government, over which the committee has no jurisdiction. In particular, the salary andemployment of doctors remains under the control of the state government; The realized autonomyof each society thus depends considerably on their ability to mobilize resources at the local level.The society may use all hospital assets for its own fund-raising purposes, whether by setting andcharging user fees for all services rendered (medical or supporting), leasing them out (in the caseof land or other assets), and collecting donations.
In practice, the fee structure amounts to a flat fee for all inpatient visits, usually between 2-5 rupees, and additional fees for services and drugs. The typical fee for a major surgery is 150rupees. Any patient with BPL status is exempt from paying the fees. The revenue of an RKS ata typical hospital amounts to about 10% of the government budget ((Kumar, 2004), also author’scalculations). An average of 60% of this revenue comes from fees, with about 15% coming fromcommercial rents and the remainder from profits from donations, sales of drugs and loans. However,as virtually the entire government allocation is dedicated to staff compensation, the RKS incomeamounts to a large portion of the actual capital budget.
In 1999, after the state had deemed the reform successful, this directive was extended to allpublic health facilities i.e. the remaining civil hospitals, community health centers and primaryhealth centers; the reform has also been propagated in other states. Enthusiastic reviews frominternational observers such as UNDP UND (2002) and Transparency International India (2005)largely support of the principles if not the actual practice of the RKS.
The only available detailed critical review to date, a case study of 9 hospitals by Kumar (2004),finds that the main benefit of the RKS has been the improvement in hospital environments fordoctors and users, but there is little mention of improvement in public health services10 The actualimpact of the RKS on service outcomes is undocumented. Furthermore, given the indicative studiesof similar hospital-level reforms by Bossert (1998) and Wagstaff and Yu (2005) it is unclear that weshould expect salutary effects on public health measures such as immunization even if the reformmanages to improve in-hospital service provision.
Kumar (2004) argues that evaluation of this reform is impossible given the paucity of datacollection in Madhya Pradesh. In the next section of the paper, I depart from the case-studyapproach and perform an impact evaluation by matching data from a national household healthsurvey to administrative data gathered at the facility-level in Madhya Pradesh. I use differences inthe timing of the reform to identify the impact of the RKS on immunization status. The resultssuggest that despite (or perhaps because of) improvements at the hospital level, immunizationsuffered significantly.
participate in the executive committee. Discussions with hospital staff suggest that in practice, it is generally the
executive committee that ultimately makes decisions, with the management committee granting approval. Details of
the membership roster are in the appendix10Furthermore, the case study suffers from sample selection as the author himself notes that effects were not seen
in many hospitals and, on the urging of ”the concerned officials”, the decision was made to ”select any 10 from a
dozen or so hospitals identified as those where visible changes had occurred”.
11

3 Data
3.1 Description
Records for RKS at various district hospitals were compiled by the author in January 2008from various administrative sources located at the Department of Health and Family Welfare, inBhopal, Madhya Pradesh as well as retrospective surveys conducted at te individual facility levelbetween January 2008-June 2008. Data was available for 39 of all 42 districts 11. The district-leveldata is merged with district-level characteristics in 1993 such as poverty, population density anddemographic composition collected in the United Nations Human Development Report for MadhyaPradesh, 1998 (UND, 1998).
Data on child health and family demographics including vaccination status is obtained fromthe first two waves of the National Family Health Survey (NFHS), a widely-used nationally-representative survey. The first wave of the NFHS was carried out before the reform in 1992(NFHS-1) and repeated, with some modification in late 1998 and early 1999 (NFHS-2). The surveycovers women of reproductive age (18-49), including a complete birth history and retrospectivehealth histories for recent births. Information on current health and socioeconomic status (includ-ing district of residence) for women available in 1992 and 1998/9, while information on incidenceof immunization status as well as mortality and current morbidity is available for their childrenborn between 1988-1993 and 1996-1999 (the 4 years preceding NFHS-1 and the 3 years precedingNFHS-2).
The final data consists of the 2 pooled cross-sections from the Madhya Pradesh samples ofNFHS1 and NFHS-2, matched by district of current residence with the district-level informationgathered above. For purposes of our analysis we restrict our analysis to living children aged 3 andunder in both waves of the survey. We drop 2 districts from the analysis where NFHS data iscollected in only one wave of the survey, and we also drop 37 observations for which state sampleweights for Madhya Pradesh are not available. The full matched sample contains 4519 child-levelobservations, 2514 in NFHS-1 and 2452 in NFHS-2, across 37 districts.
Table 3.1 shows descriptive statistics. The districts in the same are relatively populous and poor,with approximately 32% living below the poverty line in 1993. The distribution of population issparse and rural, with approximately 12 towns in districts of 1.5 million on average.
The individual sample reflects the overall district characteristics consisting of children fromlarge, mostly rural households with young mothers who have an average of 1 year of education.The average child in each wave is comparable on most dimensions, except minority status, whichis puzzlingly high in the second wave12
11It should be noted that the small neighbouring state of Chattisgarh at the time of our reform was part of Madhya
Pradesh itself. As we have not been able to collect data on the reform in Chattisgarh from current officials, the 42
districts reflect those districts that remained in Madhya Pradesh from before the split12As the NFHS does not include a measure of income but includes an asset roster, I compute a proxy for BPL
status by constructing an asset index using principal components analysis. I use the observation that the average
HCR is approximately 30% in 1993, around the time of NFHS-1. I then calibrate a proxy povery threshold for the
12

District
N 37Population (Census 1991) 1,466,035Population density per square km, (Census 1991) 179.6Towns (Census 1991) 12.5Percent SC, (Census 1991) 15.6Percent ST, (Census 1991) 19.6Male literacy rate 1991 58.8NSS 93/94 Poverty head count 31.9Percent urban (Census 1991) 24.4
Population per sub health center, 1996 4756Infant Mortality 1991 106.7Life Expectancy (yrs) 1991 56.6
Source: Madhya Pradesh Human Development Report, UNDP 1998
Individual 1992 Survey 1998/1999 Survey
N 2287 2232Age of child (years) 1.90 1.92Maternal education (years) 0.89 1.28Maternal age(years) 25.34 25.04Total household size 8.28 8.05Total sibling size 2.73 2.82Rural 0.78 0.77BPL proxy 0.29 0.37Scheduled Caste/Tribe (SC/ST) 0.34 0.40Total Vaccinations 3.65 3.99Any Vaccinations 0.61 0.80All Vaccinations 0.22 0.15Total Polio 1.46 1.91Total NonPolio 2.19 2.08
Source: NFHS-1 and NFHS-2. State sample weights applied
Table 1: Summary Statistics
13

Children aged 0-3 have received an average of 3-4 vaccines, as opposed to the mandated total of8. The data illustrate that a large increase in polio vaccination, consistent with the introduction ofPulse-Polio between these waves, which is also reflected in an increase in the proportion of childrenreporting having received any vaccination. However, the statistics also show a fall of approximately10% in the average number of non-polio vaccinations, i.e. vaccinations conducted primarily thoughthe district-health system, and a concurrent fall in the number of fully-immunized children from20% to 14% .
4 Empirical Analysis
The objective of this analysis is to identify the average treatment effect of the Rogi KalyanSamiti reform on vaccination coverage. As there is no randomized control group to proxy forthe counterfactual conditions that would have prevailed without the program, instead, I rely onvariation in individual exposure to the reforms at the time of the survey due to district-levelimplementation, which is jointly determined by the timing and district of birth, as well as thesurvey date.
4.1 Measuring Immunization Status
The Government of India’s Universal Immunization Program (UIP) schedule is depicted inFigure 4.1, which illlustrates the age-dependency of vaccination under perfect compliance:
Figure 2: Government of India Vaccination Schedule
Government of India’s Universal Immunization Program (UIP), depicted in Figure 4.1
index such that 30% of the observations in NFHS-1 lie below the cutoff point.
14

The first outcome variable is straightforward: the total number of vaccinations reported receivedreported at the time of survey (which in the analysis is then conditioned on age). Information onvaccination coverage for BCG, DPT, OPV and measles is collected for each child. Vaccinationincidence and dates are collected from vaccination record cards if available13.
Following Datar, Mukherji, and Sood (2005) and Barham, Brenzel, and Maluccio (2007), I alsodefine an alternative measure of immunization status based age-appropriate vaccination. For eachchild of age m months, I count the number of scheduled vaccinations that are actually received. Asage is reported in months in the NFHS, we convert this to month-equivalents using the rule of 4weeks to 1 month and rounding upwards.
Age (month-equivalent) Vaccine
0 BCG2 Polio 1, DPT 13 Polio 2, DPT 24 Polio 3, DPT 312 Measles
The second outcome measure is the percentage of age-appropriate vaccinations reported. Itshould be noted that this measure is not simply equal to the reported number of vaccines receiveddivided by the total number of vaccines required at that age. Individuals are penalized for notreceiving the correct type of vaccines on time and moreover receive no credit for receiving vacci-nations before the scheduled time. For example, a child of 3 months who receives no BCG butthree Polio and 3 DPT has received 6 vaccines . However, he is scheduled to have received BCG, 2Polio and 2 DPT, which amounts to 5 vaccines in total. He has received only 80% of his scheduledvaccines. This measure more accurately captures compliance with the Goverment of India schedule.
4.1.1 Measuring Program Exposure
Since the outcomes for immunization represent a process that is cumulative over time, therelevant program measure has to capture the duration of program exposure. The data allows twopotential ways to determine exposure at the district-level. Due to the status of the RKS as aregistered society with an individual bank account, data on account registration is available formost of the hospital committees , some at the day/month/year level14. This date may be regardedas the start of de-jure autonomy. Secondly, actual operating revenue data for the RKS is available,although aggregated more coarsely by year. The period in which actual revenue is collected maybe regarded as the start of de-facto autonomy. The relevant dates are presented in the appendixin Table 12.
13This data is available for only 887 children (less than 18.8% of the sample who provided such cards), and
possession of cards is likely to be correlated with household-level unobservables relevant to the child’s welfare and
overall health status, including vaccine compliance. and if not the survey records the mothers report of whether or
not the vaccination was received14For the four districts where month of registration is missing, I assume it to be June of the relevant year
15

Figure 3: Histogram: Date of registration of RKS in century-month code format
I generate two separate measures of exposure based on this data. First, considering de-jureexposure, Figure 4.1.1 plots the histogram of registration dates by month in century-month codeformat i.e. the number of months elapsed between the date and January of 1900. The first high-exposure dummy HJ
d equals one if the month of registration is after the median registration datein months observed in the sample, April 1996.
Second, for 45.2% of the sample, the year of first reported actual revenue is 1996, for 49.8%it is 1997 and for the remaining 5.0% it is 1998. I then generate a second high-exposure dummyreflecting the median value of de-facto exposure, HF
d , such that HFd equals one if the year of first
revenue generation is 1996.
4.2 Differences in Differences with District Exposure
I first present a simple differences-in-differences analysis using the pooled cross sections toillustrate the main result. As a first step, I therefore compare the vaccination status of 0-3 yearolds in districts with high-exposure to the same age-group in districts with low-exposure, across thetwo survey waves that take place before and after the program is implemented. (For this analysis,I further restrict the sample to only children who are living at the time of the survey.)
We then estimate the following equation
Yidw = βHdDw + γwDw + γdDd + γxXi + εisw (1)
where Yidt is dependent variable of interest, for each child i living in district d during survey wave w ,Dw is a dummy variable for NFHS-2, the post-program survey wave, Dd is a district fixed-effect andHd is a dummy variable that takes the value 1 if the district is a high-exposure district. Xi includescontrols for maternal demographics as well as child-level characteristics such as gender, birth orderand dummies for age in months15 The coefficient β then has the straightforward interpretation as
15In alternative specifications, we control for age in months up to a fourth-order polynomial. The results are almost
identical
16

the average effect of living in a high-exposure district on total vaccinations for children in the 0-3year age group.
Table 2 shows the results from estimating Equation 1 with total vaccines as the dependentvariable. As Yidt is bounded above and below at 8 and 0 respectively, I estimate Equation 1 firstby OLS and then using a Tobit specification to account for the effects of censoring. In theseand all subsequent regressions, observations are weighted using NFHS state sample weights forMadhya Pradesh. Standard errors are clustered at the level of the primary sampling unit. Thefollowing table, Table 4 shows the results from estimating Equation 1 using the percentage of age-appropriate vaccines as the dependent variable. As Yidt is now bounded above and below at 100and 0 respectively, I also estimate Equation 1 first by OLS and then by Tobit.
The results suggest that program exposure has a negative effect on immunization status. Notethat the estimated average treatment effects are strongly economically and statistically significantonly for de-facto exposure, both under OLS and Tobit and for both outcome measures. The de-jureexposure variable however has the same sign, although the effects are weaker. As the actual impactof the RKS derives from its ability to raise and spend its own income, arguably, de-facto than de-jureautonomy is a-priori more relevant. The naure of the estimates computed with de-jure autonomyare, indeed, consistent with the fact that de-jure autonomy consistently begins prior to de-factoautonomy as table 12 shows that in multiple cases, there are significant temporal lags betweenregistration and actual revenue collection. If program exposure reduces vaccination and de-jureautonomy measures consistently overstate exposure, we would expect the resulting estimates to besmaller and less significant.
When taking censoring into account, the results suggest that, relative to their peers in de-factolow-exposure districts, children aged 0-3 years in the de-facto high-exposure districts receive anaverage of 1.2 fewer vaccinations after the reform (Column 2, Table 2) . Given an average of3-4 vaccinations prior to the reform, this is a gap on the order of 30 % in the absolute numberof vaccinations received. When we examine age-appropriate vaccination, we find that the gap isreduced but still significant and on the order of 18%. (Column 2, Table 4)
17

(1) (2) (3) (4)Total vaccines Total vaccines Total vaccines Total vaccines
OLS Tobit OLS Tobit
High de-facto exposure*Post-program -0.616** -1.221**(0.247) (0.509)
High de-jure exposure*Post-program -0.212 -0.429(0.254) (0.519)
Post-program Cohort 0.710*** 1.709*** 0.584*** 1.464***(0.167) (0.344) (0.168) (0.342)
Birth Order -0.185*** -0.357*** -0.186*** -0.358***(0.032) (0.065) (0.032) (0.065)
Child is female -0.303*** -0.617*** -0.303*** -0.617***(0.086) (0.173) (0.086) (0.173)
Mother’s age(years) 0.066*** 0.128*** 0.065*** 0.128***(0.013) (0.024) (0.013) (0.024)
Mother’s education(years) 0.282*** 0.522*** 0.283*** 0.523***(0.027) (0.054) (0.027) (0.054)
Household is poor -0.576*** -1.057*** -0.570*** -1.045***(0.105) (0.207) (0.105) (0.207)
Household is urban 0.703*** 1.396*** 0.725*** 1.442***(0.151) (0.307) (0.149) (0.303)
Household is minority SC/ST -0.733*** -1.504*** -0.737*** -1.513***(0.124) (0.255) (0.124) (0.256)
R-squared 0.293 0.291N 4966 4966 4966 4966District dummies Yes Yes Yes YesAge in month dummies Yes Yes Yes Yes
NFHS state sample weights applied, robust s.e. clustered by PSU* p<0.10 ** p<0.05 *** p<0.0
Table 2: Difference in Differences: Total Vaccinations
18

(1) (2) (3) (4)% scheduled % scheduled % scheduled % scheduled
OLS Tobit OLS Tobit
High de-facto exposure*Post-program -8.046** -19.033**(3.337) (8.009)
High de-jure exposure*Post-program -3.150 -7.704(3.416) (8.194)
Post-program Cohort 9.814*** 25.492*** 8.329*** 22.135***(2.241) (5.457) (2.266) (5.464)
Birth Order -2.450*** -5.717*** -2.456*** -5.727***(0.421) (1.042) (0.421) (1.043)
Child is female -4.063*** -10.719*** -4.061*** -10.709***(1.152) (2.779) (1.152) (2.778)
Mother’s age(years) 0.860*** 2.012*** 0.857*** 2.008***(0.164) (0.390) (0.164) (0.389)
Mother’s education(years) 3.781*** 8.361*** 3.790*** 8.377***(0.362) (0.885) (0.363) (0.889)
Household is poor -7.339*** -15.691*** -7.258*** -15.493***(1.397) (3.227) (1.398) (3.230)
Household is urban 9.140*** 22.074*** 9.441*** 22.845***(1.967) (4.762) (1.954) (4.731)
Household is minority SC/ST -9.919*** -23.560*** -9.972*** -23.736***(1.611) (3.931) (1.613) (3.942)
R-squared 0.247 0.246N 4966 4966 4966 4966District dummies Yes Yes Yes YesAge in month dummies Yes Yes Yes Yes
NFHS state sample weights applied, robust s.e. clustered by PSU* p<0.10 ** p<0.05 *** p<0.0
Table 3: Difference in Differences: % Age-Appropriate Vaccinations
19

(1) (2)Total polio Total ex-polio
Tobit Tobit
High de-facto exposure*Post-program -0.910** -0.969**(0.438) (0.404)
Post-program Cohort 2.209*** 0.508*(0.305) (0.272)
Birth Order -0.246*** -0.330***(0.061) (0.054)
Child is female -0.395** -0.541***(0.155) (0.137)
Mother’s age(years) 0.098*** 0.108***(0.023) (0.020)
Mother’s education(years) 0.432*** 0.411***(0.055) (0.042)
Household is poor -0.828*** -0.967***(0.181) (0.170)
Household is urban 0.816*** 1.183***(0.266) (0.236)
Household is minority SC/ST -1.051*** -1.214***(0.229) (0.204)
R-squaredN 4966 4966District dummies Yes YesAge in month dummies Yes Yes
NFHS state sample weights applied, robust s.e. clustered by PSU* p<0.10 ** p<0.05 *** p<0.0
Table 4: Difference in Differences: % Age-Appropriate Vaccinations
20

4.3 Fixed-Effects Regression with Individual Exposure
The preceding section outlines the basic intuition behind the identification strategy and theissues with the use of alternative exposure variables. I now proceed to the main analysis based onmeasurement of program exposure at the more detailed individual-level. I estimate the followingequation using a Tobit specification
Yidyt = βTidt + γyDy + γdDd + γxXi + εidyt (2)
Here, Yidt is the dependent variable of interest, for each child i born in year y living in districtd at survey year t . Tidt measures exposure to the program in years. I include Dd, a district fixed-effect, Dy a birth-year cohort fixed effect and Xi again includes controls for maternal demographicsas well as child-level characteristics including dummies for age in months. (Note that we controlfor age and cohort effects but cannot separately identify cohort and time effects. ) The coefficientβ measures the average effect of a year of exposure on the dependent variable.
4.3.1 Individual measures of program exposure
First, we are able to compute exposure de jure autonomy at the level of months using the officialregistration date data. Because data collection was conducted over a period of several months, itis important to use the survey date, the date of birth and the date of program start, as childrenmeasured later in the survey are exposed to the program for a longer period of time (Tarozzi, 2005).I measure de jure exposure as follows. If the child is surveyed prior to the start date, exposure iszero. This includes all children surveyed in the pre-program survey wave. If the child is surveyedafter the start date, then exposure is equal to the number of months between the survey date andeither the start date or the child’s birth date, whichever of the latter is first. I divide the numberof months by 12 to yield years lived under the program. Secondly,we are able to compute de factoexposure at the level of years, in an analogous way If the child is surveyed after the start date, thenyearly exposure is equal to the number of years between the survey year and the start year if thechild is born prior the program start year. If the child is born in or after said year, yearly exposureis the age of the child in years.
4.3.2 Potential sources of bias
One concern here is survivorship bias. Total vaccination is computed by summing up thenumber of reported vaccinations over each childs lifetime history as reported by the mother at thetime of the survey. When vaccination histories are truncated by early mortality, in this analysis,the observation is dropped (447 observations). Since immunization reduces all-cause mortality, thisinduces selection bias. However, because we would expect survivors to be positively selected byimmunization status, this bias works against the finding that reform reduces immunizations.
Secondly, the data provides district of residence not over the entire life of the child, but only atthe time of survey.Munshi and Rosenzweig (2006) document that overall migration in India during
21

this period is extremely low and generally confined to withins districts, indeed it is fairly commonto find that empirical researchers treat migration as generally nonexistent (such as Chattopadhyayand Duflo (2004)) It is very common for women to travel back and forth from their home villagesto visit their parental homes after marriage, and stay for extended periods, and we find a numberof such observations in the data. While we believe that such migration remains intra-district, thiscannot be verified. Women who are not permanent household members to exclude such temporarymigration account for 471 observations.
We also find a small number of permanent migrants, or women who report being permanenthousehold members but who have lived in the residence for less than the lifetime of the child. Suchmigration is potentially correlated with immunization outcomes (as it would be if households movedin response to the reform), however, this also induces bias. In this case, it is not clear that the biascan be a priori signed. Such permanent migration is limited to only 92 cases, or 2.4% of our finalsample.
4.3.3 Main Results
In Table 7, the results suggest that a year of de-facto exposure results in half a vaccine lessin total (Column 1), or approximately a 6% drop in age-appropriate vaccines (Column 3). As wemight expect given the previous analysis, the estimate for de-jure exposure has the same sign but isless economically and statistically significant (Column 2) . This comparison is qualitatively similaracross all specifications tried, so for the remaining analysis, I focus on de-facto exposure.
In Column 3 , I remove all children whose mothers who are temporary visitors, which doesnot alter the coefficient much, consistent with our beliefs about temporary migration. Droppingthe small number of permanent migrants, in Column 4m however, increases the estimated negativeimpact slightly, which again, we might expect if migration occurs in response to reform (althoughit is difficult to say how plausible that might be). Going forward, I use the smaller sample withoutvisitors and recent migrants.
Some public health authorities in India have blamed the overemphasis on polio as a result ofthe national Pulse Polio campaign is the main driver of the fall in routine immunization.16 Theresults of this analysis suggest that other institutional factors may also be at fault.
In Columns 5 and 6, I present separate regression results for the three polio and four nonpoliovaccinations. Table 3.1 demonstrates that the level of polio vaccination increased significantly.However, the results show the estimates of the marginal effects from the program are significant,negative and not very different from one another. This suggests that, while the number of poliovaccinations increased overall, decentralization reforms affected both polio and non-polio vaccina-tion equally. These two facts are consistent with the actual institutional setting: polio vaccination
16For example:”For seven years women and children of the rural districts of Uttar Pradesh and Bihar have been
deprived of essential health services so that the polio eradication campaign could go on...Many lives have been lost
and many more have suffered because the health-workers were busy with the polio drive” (India Together, 7 April
2005)
22

remained part of routine immunization but in addition, children were exposed to two supplementalnationally-mandated annual Pulse-Polio campaign drives.
Finally, while I cannot rule out the possibility that Pulse-Polio campaign diverted some resourcesaway from routine immunzation, it is unlikely that the effect of Pulse-Polio is conflated with theseparticular results. All districts were exposed to the national Pulse-Polio drives equally, while theestimate effect of the program relies on a particular identifying pattern of time and spatial variation.
4.4 Heterogeneous Policy Effects
While I will not be able to directly test for the mechanisms that may be causing these effects,in the next section, I examine potential explanations for the fall in immunization by estimatingheterogeneous policy effects at the district and household level. At the district-level, I interactmeasure m with the individual treatment measure and interpret βm as the incremental policyeffect for the group of districts with higher values of m.
Yidyt = βTidt + βmTidt ∗ Zmd + γyDy + γdDd + γxXi + εidyt (3)
For individuals, I analogously interact exposure with individual-level characteristics and interpretβm as the incremental policy effect for the individuals with higher values of m.
Yidyt = βTidt + βmTidt ∗ Ii + γyDy + γdDd + γxXi + εidyt (4)
4.5 Rural vs Urban Households
Firstly, I examine indirect evidence that the fall in immunization occurs primarily throughdistrict hospitals. Table 4.5 illustrates the location of vaccination sources for women in NFHS-2.The majority of urban vaccination takes place at the district hospital, while rural vaccination takesplace fairly evenly across various government sources such as the hospital, local camps and othersources that include the smaller facilities and the government health workers.
Urban Rural
Government hospital 45.03% 28.57%Camp 18.71% 32.49%
Other govt 7.60% 23.53%Private sector 26.90% 15.41%
Table 5: Source of immunization in last 2 weeks, by sector (Madhya Pradesh NFHS-2)
The district hospital accounts for a disproportionate amount of urban immunization but notrural immunization, which is consistent with the role of the hospital as the primary provider ofpreventive care in urban areas. I therefore expect the effects of the program to be larger for urbanhouseholds. Column 1 of Table 9 shows that the coefficient on the interaction term for urbanhouseholds is imprecisely estimated, but negative.
23

4.5.1 User Fees and Autonomy
On the demand side, a very large literature in developing country health has examined theimpact of user fees and cost-sharing in government facilities. The majority of authors find that feesreduce the demand for health services in a variety of international settings for both curative andpreventive health services. (see Gertler, Locay, and Sanderson (1987); Osuga and Nordberg (1993);Collins, Quick, Musau, Kraushaar, and Hussein (1996); Gilson (1997); Akashi, Yamada, Huot,Kanal, and Sugimoto (2004); Jacobs and Price (2004); Mubyazi, Massaga, Kamugisha, Mubyazi,Magogo, Mdira, Gesase, and Sukwa (2006) among many others).
On the supply side, Eggleston and Yip (2004),Eggleston (2005) and Wagstaff and Yu (2005)suggest that, based on the multi-task nature of the district hospital,profit-maximizing hospitals mayfocus on the generation of revenue from high-margin services, rather than routine immunizationwhich is provided free of charge. While this is an intuitive argument, it is not clear, however,whether this argument applies in this context, given that doctor and administrator salaries arefixed and do not depend on profits. On the one hand, user fees from improved in-hospital servicesand other revenue directly contributes to the improvement of the doctors work environments, evenif doctors do not directly receive bonus payments17. However, in the absence of wage incentives andto give doctors their due, it is not clear that public-sector doctors are purely profit-maximizing:Dasand Hammer (2007) note that in their study of a variety of public providers, doctors at elite publichospitals demonstrated significantly more conformity to standards of ethical practice.
On the whole, the results suggest that the demand-side effects of user fees are important indepressing takeup, while there is little evidence of supply-side incentive effects. I first estimateEquation with an interaction term for the poverty-line proxy, as poor clients are automaticallyexempted from the inpatient fees. I interpret the poor as a control and the nonpoor as being”treated” in the sense of having to pay fees. Given that both groups are exposed to the sameorganizational changes within a district, the results suggest that the demand side effects of theuser fees play a large role in the observed decrease. Column 2 of Table 9 shows the magnitude andsignificance of the interaction term, which implies that there are effectively no negative effects atall for the poor. In Column 3, I include the interaction for urban residence and a triple interactionterm for the urban poor. The results show again that there is virtually no net effect for the poor,regardless of their residence. The coefficients on the interaction term for both urban residence andurban poor are imprecisely estimated as before, but the magnitudes suggest that in fact, the urbanpoor are slightly better off.
Next, I look at the supply side. If hospitals are indeed responding to profit incentives, I expectto see that the fall in immunization is larger in districts with more potential or actual revenuecollection. I focus attention of the following four measures: the percentage of population living inan urban area (based on the Census 1991), poverty head count ratio (based on the National SampleSurvey 1993/1994), 1999 RKS total revenue per 1991 population and log 1999 RKS revenue. The
17At the same time, the response of rent-seeking physicians is not clear, since bribe income and informal payments
from hearsay are not affected by these reforms
24

first two measures proxy for the extent of revenue collection potential while the last two actuallymeasure the amount of fees collected both on a per head and actual basis. Table 10 shows theresults. The coefficient on per capita revenue is negative and slightly larger, consistent with profit-maximizing behavior, but on all four measures, there is no significant relationship, and the estimatedcoefficients on the interaction terms are generally small.
4.5.2 Externalities
I next explore the explanation, based on the theory of public goods, that goods with positiveexternalities such as immunization are likely to be underprovided. If most children in neighboringdistricts are immunized and thus highly unlikely to develop and transmit infectious disease, theprobability of disease in a given district is also effectively reduced. A large and active literature hasanalyzed the the failure of decentralized regimes to internalize externalitie in the area of pollutioncontrol and its effect on the environment in industrial economies (see ?List and Gerking (2000)and Lipscomb and Mobarak (2007)) A common empirical approach is to examine variation in pol-lution levels by location around international borders and type of pollution. We adopt a similarapproach here by exploiting the centrality of Madhya Pradeshs location, and heterogeneity amongits neighbours. The levels of immunization among neighboring states may be taken as exogenouslydetermined over this period. Under the free-riding hypothesis, when decentralization occurs, bor-der districts located next to states with higher levels of immunization will reduce their levels ofimmunization more than border districts located next to states where immunization is low.
Madhya Pradesh borders five other states: the state of Gujarat on the West, Maharashtraon the South, Rajasthan and Uttar Pradesh on the South as well Chattisgarh on the East. AsChattisgarh is a newly created state, we restrict attention for now to the first four. As the tablebelow illustrates, disparities in child mortality as well as immunization are striking even in thislimited group. When ranked by either one of two indicators of immunization coverage status (allvaccines or no vaccines) Maharashtra and Gujarat as a group are significantly better in terms ofvaccination coverage than Madhya Pradesh, while Rajasthan and Uttar Pradesh are worse.
All None Has Card Infant Mortality Under- 5 Mortality
India 35.4 30 30.6 78.5 109.3Rajasthan 21.1 48.5 16.3 72.6 102.6Uttar Pradesh 19.8 43.3 23 99.9 141.3Madhya Pradesh 29.2 34.4 21.8 85.2 130.3Gujarat 49.8 18.9 32 68.7 104Maharashtra 64.1 7.5 39.2 50.5 70.3
Table 6: Vaccination and Mortality Rates, NFHS-1 (ranked by state vaccine coverage)
We then test the hypothesis that the Southern districts bordering Gujarat and Maharashtra
25

(where positive spillovers are likely to be largest) see a larger negative effect on immunization thanthose bordering Uttar Pradesh and Rajasthan . We group districts into subsamples, dependingon whether each district has a border with either Gujarat/Maharashtra, Uttar Pradesh or Ra-jasthan18.I estimate the effects for each group of districts using OLS as the small sample sizes leadto a lack of convergence in the Tobit model.
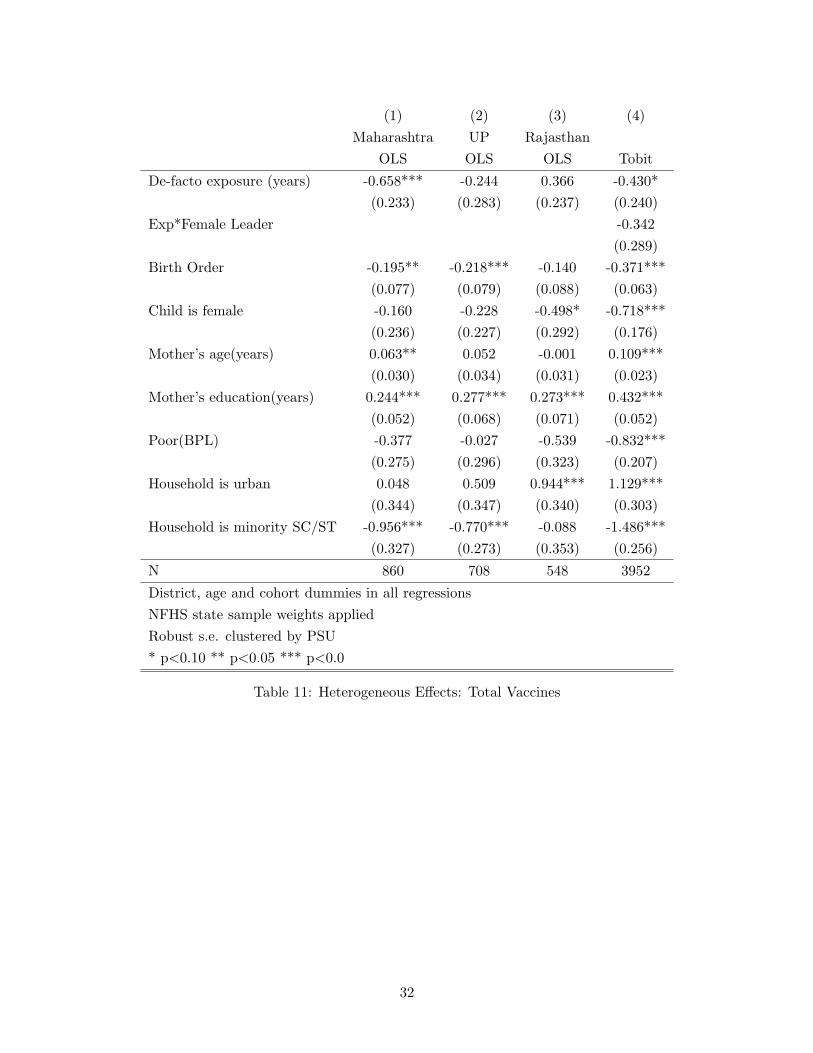
Columns 1 to 3 in Table 11 shows that the negative effects are largest in the districts borderingMaharashtra, smaller in the districts bordering Uttar Pradesh and positive in the districts thatborder Rajasthan. The pattern is directly inverse to the level of potential externalities. While thisis far from a conclusive test by any means and the mechanism is not explicitly clear., it is certainlyconsistent with the possibility that externalities also may play a role.
4.5.3 Local Representation
Finally, I use the dataset to briefly explore the role of local representation for women andits impact on immunization. The 73rd constitutional amendment mandated the reservation ofleadership in panchayats for women and minorities. Chattopadhyay and Duflo (2004) find thatthe reservation of seats for women by a system of alphabetized rotation significantly altered theallocations of local public goods to reflect women’s concerns. However, in an earlier study relatedspecifically to child mortality, Gleason (2001) investigates the relationship between female politicalparticipation in India on health outcomes and finds no effect. As the Sarpanch panchayat leaderssit directly on the hospital committees, I adopt the same strategy as Chattopadhyay and Duflo(2004), using the plausibly exogenous variation in local leadership induced by these reservations toexamine the effect of female leadership on immunization. (Although similar reservations are putinto place for minority representation, I was not able to collect this data)
I generate an indicator for whether the Sarpanch was a woman and include it in the standardspecification in order to test the hypothesis that districts with female Sarpanches show differenteffects. In Column 4 of Table 11 I show that the estimated coefficient is large and negative, butconsistent with Gleason (2001), it is not statistically significant. This is very likely due to the smallnumber of reserved seats in the sample (12).
5 Conclusions and Further Work
To reiterate, this paper provides new evidence that decentralization reforms int the health caresector can negatively impact routine immunization. In this particular case, children aged 0-3 yearsreceived an average of 12-14% fewer vaccinations per year of exposure to hospital decentralization,controlling for age and other demographic factors.
The analysis suggests that effects were manifested only under de-facto autonomy for localcommittees, rather than de-jure autonomy. Consistent with this, a study of the policy effectsacross households and districts suggests that the ability to charge user fees under the aegis of
18As there is only one district (Jhabua) bordering Gujarat, we treat Gujarat and Maharashtra as one
26

reform caused a large part of this falloff, while other incentive effects from charging fees (whichin this instance provide the wherewithal for autonomous decisionmaking) did not have much ofan impact. The evidence is also consistent with local committees responding to externalities fromneighbouring states. One conclusion that may tentatively be drawn is that the empirical analysisof such reforms should explicitly account for the method of financing. The results suggest thatreforms financed by other means may not have led to similar decreases in immunization.
This reform is a very specific case of decentralization, that may not shed light on the myriadother forms of decentralization that are of critical interest. It should be noted that these reformstypify the partial approach adopted in many actual cases of health sector decentralization, andthus the policy value of such an analysis still exists. In China, for example, delivery of medicalservices also relies heavily on government-owned hospitals, which in recent years have begun tosupplement government budgets with user charges and profits from sales of pharmaceuticals tocover operating expenses but largely left physician incentive structures unchanged In other sectors,such as education, it is also common to find that teachers remain on a fixed salary structure,answerable to the state, while local schools are allowed to charge fees and determine their ownspending. The lessons from this study may not apply to the broadest definition of decentralizationbut have relevance to more typical experiences found in the field.
It is also clear that the evidence on the underlying mechanisms is suggestive but by no meansconclusive. Data from facility surveys conducted in the field is currently being compiled by theauthor, and should enable more precise study of the mechanisms at work by giving detailed break-downs of expenditure patterns. In addition, since the Rogi Kalyan Samiti reform has recently beenextended to other neighbouring, gathering more implementation data over a larger sample is afeasible and potentially important next step. A larger dataset with inter-state variation would beparticularly useful with respect to the study of heterogeneous policy effects such as the impact ofpolitical reservations for women and minorities.
27

(1) (2) (3) (4) (5)Total vaccines Total vaccines % scheduled % scheduled % scheduled
De-facto exposure (years) -0.486** -6.240** -6.184** -6.903**(0.203) (2.881) (2.971) (2.941)
De-jure exposure (years) -0.363(0.427)
Birth Order -0.377*** -0.381*** -5.803*** -5.935*** -5.589***(0.060) (0.060) (0.894) (0.931) (0.932)
Child is female -0.649*** -0.651*** -10.160*** -11.026*** -11.295***(0.161) (0.161) (2.374) (2.636) (2.651)
Mother’s age(years) 0.113*** 0.114*** 1.669*** 1.673*** 1.607***(0.022) (0.022) (0.331) (0.347) (0.341)
Mother’s education(years) 0.434*** 0.433*** 6.762*** 6.573*** 6.625***(0.048) (0.048) (0.741) (0.809) (0.822)
Poor(BPL) -0.947*** -0.947*** -12.624*** -10.926*** -10.881***(0.197) (0.197) (2.888) (2.917) (2.969)
Household is urban 1.141*** 1.134*** 17.274*** 18.414*** 17.769***(0.297) (0.297) (4.361) (4.527) (4.445)
Household is minority SC/ST -1.486*** -1.467*** -22.118*** -21.802*** -21.869***(0.243) (0.243) (3.587) (3.702) (3.741)
N 4519 4519 4519 4048 3952
District, age and cohort dummies in all regressionsNFHS state sample weights applied. Robust s.e. clustered by PSU* p<0.10 ** p<0.05 *** p<0.0
Table 7: Main Findings
28

(1) (2)Total polio Total ex-polio
De-facto exposure (years) -0.419** -0.314*(0.194) (0.187)
Birth Order -0.241*** -0.332***(0.059) (0.053)
Child is female -0.445*** -0.624***(0.153) (0.146)
Mother’s age(years) 0.080*** 0.092***(0.021) (0.020)
Mother’s education(years) 0.353*** 0.346***(0.053) (0.042)
Poor(BPL) -0.590*** -0.813***(0.173) (0.174)
Household is urban 0.541** 1.011***(0.266) (0.238)
Household is minority SC/ST -0.971*** -1.206***(0.226) (0.204)
N 3952 3952
District, age and cohort dummies in all regressionsNFHS state sample weights applied. Robust s.e. clustered by PSU* p<0.10 ** p<0.05 *** p<0.0
Table 8: Polio vs Nonpolio
29

(1) (2) (3)
De-facto exposure (years) -0.453** -0.858*** -0.783***(0.222) (0.226) (0.243)
Exposure*Urban Hhd. -0.398 -0.284(0.298) (0.335)
Exposure*BPL 0.865*** 0.782***(0.233) (0.245)
Exposure*Urban*BPL 0.346(0.519)
Birth Order -0.373*** -0.379*** -0.380***(0.063) (0.063) (0.063)
Child is female -0.716*** -0.731*** -0.731***(0.177) (0.177) (0.177)
Mother’s age(years) 0.110*** 0.112*** 0.113***(0.023) (0.023) (0.023)
Mother’s education(years) 0.432*** 0.434*** 0.436***(0.052) (0.052) (0.052)
Poor(BPL) -0.832*** -1.127*** -1.111***(0.207) (0.238) (0.239)
Household is urban 1.254*** 1.102*** 1.168***(0.343) (0.302) (0.343)
Household is minority SC/ST -1.486*** -1.481*** -1.480***(0.256) (0.256) (0.257)
N 3952 3952 3952
District, age and cohort dummies in all regressionsNFHS state sample weights appliedRobust s.e. clustered by PSU* p<0.10 ** p<0.05 *** p<0.0
Table 9: Heterogeneous Effects: Total Vaccines
30

(1) (2) (3) (4)
De-facto exposure (years) -0.150 -0.570** -0.431* -1.907(0.350) (0.287) (0.229) (1.720)
Exp*Poverty Head Count -0.011(0.007)
Exp*% Urban 0.002(0.009)
Exp*RKS’99 Revenue percapita -0.185(0.115)
Exp*Log RKS’99 Revenue 0.099(0.127)
Birth Order -0.366*** -0.369*** -0.376*** -0.375***(0.063) (0.063) (0.064) (0.063)
Child is female -0.713*** -0.714*** -0.721*** -0.723***(0.177) (0.177) (0.186) (0.186)
Mother’s age(years) 0.108*** 0.108*** 0.107*** 0.107***(0.023) (0.023) (0.023) (0.023)
Mother’s education(years) 0.430*** 0.431*** 0.458*** 0.456***(0.052) (0.052) (0.053) (0.053)
Poor(BPL) -0.836*** -0.839*** -0.888*** -0.885***(0.206) (0.206) (0.220) (0.219)
Household is urban 1.129*** 1.124*** 1.109*** 1.087***(0.303) (0.305) (0.304) (0.305)
Household is minority SC/ST -1.479*** -1.481*** -1.497*** -1.504***(0.256) (0.256) (0.260) (0.260)
N 3952 3952 3872 3872
District, age and cohort dummies in all regressionsNFHS state sample weights appliedRobust s.e. clustered by PSU* p<0.10 ** p<0.05 *** p<0.0
Table 10: Heterogeneous Effects: Total Vaccines
31
(1) (2) (3) (4)Maharashtra UP Rajasthan
OLS OLS OLS Tobit
De-facto exposure (years) -0.658*** -0.244 0.366 -0.430*(0.233) (0.283) (0.237) (0.240)
Exp*Female Leader -0.342(0.289)
Birth Order -0.195** -0.218*** -0.140 -0.371***(0.077) (0.079) (0.088) (0.063)
Child is female -0.160 -0.228 -0.498* -0.718***(0.236) (0.227) (0.292) (0.176)
Mother’s age(years) 0.063** 0.052 -0.001 0.109***(0.030) (0.034) (0.031) (0.023)
Mother’s education(years) 0.244*** 0.277*** 0.273*** 0.432***(0.052) (0.068) (0.071) (0.052)
Poor(BPL) -0.377 -0.027 -0.539 -0.832***(0.275) (0.296) (0.323) (0.207)
Household is urban 0.048 0.509 0.944*** 1.129***(0.344) (0.347) (0.340) (0.303)
Household is minority SC/ST -0.956*** -0.770*** -0.088 -1.486***(0.327) (0.273) (0.353) (0.256)
N 860 708 548 3952
District, age and cohort dummies in all regressionsNFHS state sample weights appliedRobust s.e. clustered by PSU* p<0.10 ** p<0.05 *** p<0.0
Table 11: Heterogeneous Effects: Total Vaccines
32

References
(1992): The hospital in rural and urban districts.
(1998): Madhya Pradesh Human Development Report.
(2002): Madhya Pradesh Human Development Report.
(2004): Economics of Immunization: a guide to the literature and other resourcesWorld HealthOrganization.
Aaby, P., B. Samb, F. Simondon, A. Seck, K. Knudsen, and H. Whittle (1995): “Non-specific beneficial impact of measles immunization: analysis of mortality studies from developingcountries,” British Medical Journal.
Ahmad, J., S. Devarajan, S. Khemani, and S. Shah (2005): “Decentralization and ser-vice delivery,” Policy Research Working Paper Series 3603, The World Bank, available athttp://ideas.repec.org/p/wbk/wbrwps/3603.html.
Akashi, H., T. Yamada, E. Huot, K. Kanal, and T. Sugimoto (2004): “User fees at a publichospital in Cambodia: effects on hospital performance and provider attitudes.,” Soc Sci Med,58(0277-9536 (Print)), 553–64.
Akin, J., P. Hutchinson, and K. Strumpf (2005): “Decentralization and the provision of publicgoods : the public health sector in Uganda,” Journal of Development Studies, 41(8), 1417:1443.
Bajpai, N., R. Dholakia, and J. Sachs (2005): “Scaling Up Rural Health Services in India,”CGSD Working Paper 29, Center on Globalization and Sustainable Development.
Balraj, V., S. Mukundan, R. Samuel, and T. J. John (1993): “Factors Affecting Immuniza-tion Coverage Levels in a District of India,” International Journal of Epidemiology, 22(6).
Banerjee, A., A. Deaton, and E. Duflo (2004): “Wealth, Health, and Health Services inRural Rajasthan,” American Economic Review, 94(2), 326–330.
Barankay, I., and B. Lockwood (2007): “Decentralization and the productive efficiency ofgovernment: Evidence from Swiss Cantons,” Journal of Public Economics, 91, 1197–1218.
Bardhan, P. (2002): “Decentralization of Governance and Development,” Journal of EconomicPerspectives, 16(4).
Bardhan, P., and D. Mookherjee (2006): “Decentralization and Accountability in Infrastruc-ture Delivery in Developing Countries,” The Economic Journal, (116), 101–127.
Barham, T., L. Brenzel, and J. Maluccio (2007): “Beyond 80%: Are there New Ways ofIncreasing Vaccination Coverage?: Evaluation of CCT Programs in Mexico and Nicaragua,”Health nutritition and population (hnp) discussion paper, World Bank.
33

Besley, T., and S. Coate (2003): “Centralized versus decentralized provision of local publicgoods: a political economy approach,” Journal of Public Economics, 87(12), 2611–2637.
Bossert, T. (1998): “Analyzing the decentralization of health systems in developing countries:decision space, innovation and performance,” Social Science and Medicine, 47(10), 1513–1527.
Bossert, T., D. Bowser, and J. Amenyah (2007): “Is decentralization good for logistics sys-tems? Evidence on essential medicine logistics in Ghana and Guatemala,” Health Policy andPlanning, 22(2), 73–82.
Bossert, T., M. B. Chitah, and D. Bowser (2003): “Decentralization in Zambia: resourceallocation and district performance,” Health policy and planning, 18(4), 357–69.
Breiman, R., P. Streatfield, M. Phelan, N. Shifa, M. Rashid, and M. Yunus (2004):“Effect of infant immunization on childhood mortality in rural Bangladesh: analysis of healthand demographic surveillance data,” The Lancet, 364(9452), 2204–11.
Chattopadhyay, R., and E. Duflo (2004): “Women as Policy Makers: Evidence from a Ran-domized Policy Experiment in India,” Econometrica, 72(5), 1409–1443.
Chaudhury, N., J. Hammer, M. Kremer, K. Muralidharan, and F. H.
Rogers (2006): “Missing in Action: Teacher and Health Worker Absence in De-veloping Countries,” Journal of Economic Perspectives, 20(1), 91–116, available athttp://ideas.repec.org/a/aea/jecper/v20y2006i1p91-116.html.
Collins, D., J. D. Quick, S. N. Musau, K. Kraushaar, and I. M. Hussein (1996): “The falland rise of cost sharing in Kenya: the impact of phased implementation.,” Health Policy Plan,11(0268-1080 (Print)), 52–63.
Das, J., and J. Hammer (2007): “Money For Nothing: The Dire Straits of Medical Practice inNew Delhi, India,” Journal of Development Economics, 83(1), 1–36.
Das Gupta, M. (2005): “Public health in India : an overview,” Policy Research Working PaperSeries 3787, The World Bank.
Datar, A., A. Mukherji, and N. Sood (2005): “Health Infrastructure and Immunization Cov-erage in Rural India,” Working Paper 294, RAND.
Djibuti, M., N. Rukhadze, D. R. Hotchkiss, T. P. Eisele, and E. A. Silvestre (2007):“Health Systems Barries to Effective Use of Infections Disease Surveillance Data in the Contextof Decentralization in Georgia: A qualitative study,” Health Policy, In Press.
Eggleston, K. (2005): “Multitasking and mixed systems for provider payment,” Journal ofHealth Economics, 24(1), 211–223.
34

Eggleston, K., and W. Yip (2004): “Hospital Competition under Regulated Prices: Applica-tion to Urban Health Sector Reforms in China,” International Journal of Health Care Financeand Economics, 4(4), 343–368, available at http://ideas.repec.org/a/kap/ijhcfe/v4y2004i4p343-368.html.
English, M., C. F. Lanata, I. Ngugi, and P. C. Smith (2006): Disease Control Priorities inDeveloping Countrieschap. The District Hospital, pp. 1,211–1,228. Oxford University Press.
Faguet, J. P. (2004): “Does Decentralization Increase Government Responsiveness to LocalNeeds? Evidence from Bolivia,” Journal of Public Economics.
Galiani, S., P. Gertler, and E. Schargrodsky (2005): “Water for Life: The Impact ofthe Privatization of Water Services on Child Mortality,” Journal of Political Economy, 113(1),83–120.
Gertler, P., L. Locay, and W. Sanderson (1987): “Are User Fees Regressive? The WelfareImplications of Health Care Financing Proposals in Peru,” Journal of Econometrics, 36, 67–88.
Gilson, L. (1997): “The lessons of user fee experience in Africa.,” .
Gleason, S. (2001): “Female Political Participation and Health in India,” The Annals of theAmerican Academy of Political and Social Science, 573(1), 105–126.
India, T. I. (2005): “India Corruption Study 2005,” Discussion paper, Transparency International.
Jacobs, B., and N. Price (2004): “The impact of the introduction of user fees at a districthospital in Cambodia.,” Health Policy Plan, 19(0268-1080 (Print)), 310–21.
Khaleghian, P. (2004): “Decentralization and public services: the case of immunization,” SocialScience & Medicine, 59(1), 163–183.
Khwaja, A. I. (2004): “Is Increasing Community Participation Always a Good Thing?,” Journalof the European Economic Association, 2(2-3), 427–436.
King, E. M., and B. Ozler (2001): “What’s Decentralization Got To Do With Learning? TheCase of Nicaragua’s School Autonomy Reform,” Working Paper Series ”Impact Evaluation ofEducation Reforms” 9, Development Research Group, World Bank.
Koenig, M., D. Bishar, and M. A. Khan (2001): “Health Interventions and Health Equity:The Example of Measles Vaccination in Bangladesh,” Population and Development Review, 27(2),283–202.
Kremer, M., E. Bloom, E. King, I. Bhushan, D. Clingingsmith, B. Loevinsohn,
R. Hong, and J. B. Schwartz (2006): “Contracting for Health:Evidence from Cambodia,”Working paper, Harvard University.
35

Kumar, G. (2004): “Public Hospital Reforms in Madhya Pradesh (India): Perceptions andTrends,” Discussion paper, Centre de Sciences Humaines.
Lipscomb, M., and A. M. Mobarak (2007): “Decentralization and Water Quality:Evidencefrom the Re-drawing of County Boundaries in Brazil,” Working paper, University of Coloradoat Boulder and Yale University School of Management.
List, J., and S. Gerking (2000): “Regulatory Federalism and Environmental Protection in theUnited States,” Journal of Regional Science, 40(3), 453–471.
Liu, X., T. Martineau, L. Chen, S. Zhan, and S. Tang (2006): “Does decentralisationimprove human resource management in the health sector? A case study from China,” SocialScience & Medicine, 69(7), 1836–1845.
Mansuri, G., and V. Rao (2004): “Community-based (and driven) development : A crit-ical review,” Policy Research Working Paper Series 3209, The World Bank, available athttp://ideas.repec.org/p/wbk/wbrwps/3209.html.
Mubyazi, G., J. Massaga, M. Kamugisha, J.-N. Mubyazi, G. C. Magogo, K.-Y. Mdira,
S. Gesase, and T. Sukwa (2006): “User charges in public health facilities in Tanzania: effecton revenues, quality of services and people’s health-seeking behaviour for malaria illnesses inKorogwe district.,” Health Serv Manage Res, 19(0951-4848 (Print)), 23–35.
Munshi, K., and M. Rosenzweig (2006): “Why is Mobility in India so Low? Social Insurance,Inequality, and Growth,” .
Murray, C., B. Shengelia, N. Gupta, S. Moussavi, A. Tandon, and M. Theiren (2003):“Validity of reported vaccination coverage in 45 countries,” The Lancet, 362(9389), 1022–1027.
Nichter, M. (1995): “Vaccinations in the Third World: A consideration of Community Demand,”Social Science & Medicine, 41(5), 617–632.
of Public Health & Family Welfare, T. M. P. D. (2006): Medium Term Health SectorStrategy.
Oster, E. (2006): “Does Increased Access Increase Equality? Gender and Child Health Invest-ments in India,” NBER Working Papers 12743, National Bureau of Economic Research, Inc.
Osuga, B., and E. Nordberg (1993): “Effects of new service charges on attendance at ruralhealth facilities in Kenya.,” East Afr Med J, 70(0012-835X (Print)), 627–31.
Robalino, D. A., O. F. Picazo, and A. Voetberg (2001): “Does fiscal decentralization im-prove health outcomes? Evidence from a cross-country analysis,” Policy Research Working Paper2565, World Bank, Washington, DC.
36

Schweitzer, J. (2007): “Promoting Pro-Poor Human Development in South Asia,” mimeo, WorldBank.
Sigman, H. (2007): “Decentralization and Environmental Quality: An International Analysis ofWater Pollution,” Working Paper 13098, NBER.
Tarozzi, A. (2005): “The Indian Public Distribution System as provider of food security: Evidencefrom child nutrition in Andhra Pradesh,” European Economic Review, 49(5), 1305–1330.
Wagstaff, A., and S. Yu (2005): “Do Health Sector Reforms Have Their Intended Impacts?The World Bank’s Health VIII Project in Gansu Province, China,” World Bank Policy ResearchWorking Paper 3743, World Bank.
37

A Organization of the Rogi Kalyan Samiti
Objectives
• Improve the hospital, upgrade and modernize the health services• Ensure discipline in the institution and supervise the staff• Establish affiliations with private institutions to upgrade services• Undertake construction and expansion in the hospital building• Ensure optimal use of hospital land as per government guidelines• Improve participation of the committee in the running of the hospital• Ensure scientific disposal of hospital waste• Ensure proper training for doctors and staff• Ensure subsidized food, medicines and drinking water to patients/attendants• Ensure proper implementation of National Health Programmes• Ensure proper use, timely maintenance and repair of hospital equipment and machinery
Composition
• Management Committee:
• Health Minister (President)• Civil Surgeon and Hospital President (Member Secretary)• Members of Legislative Assembly (MLA)• District Panchayat President• Related member of Lok/Rajya Sabha• Mayor• Collector• Police Commissioner• Chief Medical Officer• NGO representatives• Press representatives,• Secretary, Red Cross Society
• Executive Committee:
• Collector(President)• Civil Surgeon and Hospital President (Member Secretary)• One MLA of the District• District Panchayat President• Chief Executive Officer, Panchayat• Mayor• Chief Medical Officer• Senior Doctor
(Source: Ministry of Health and Family Welfare, Madhya Pradesh)
38

District Registration Month & Year 1st Year of Revenue
Balaghat 10/1997 1997Betul 4 / 1996 1997Bhind 4 / 1996 1997Bhopal 10 / 1996 1996Chhatarpur 6 /1996 1998Chhindwara 11 / 1995 1998Damoh 6 /1996 1996Datia 5/1996 1997Dewas 3/1996 1996Dhar 7 /1996 1996Guna 12 / 1995 1996Gwalior 1997 1997Hoshangabad 5/1996 1996Indore 6/1996 1997Jabalpur 1/1996 1997Jhabua 6/1996 1996Khandwa 1 /1996 1996Khargone 2 /1996 1996Mandla 8 /1996 1996Mandsaur 3/1996 1997Morena 5 /1996 1997Raigarh . 1997 1997Raisen 2 / 1996 1997Rajgarh 5 /1996 1997Ratlam 6 /1996 1997Rewa 1996 1996Sagar . 1997 1997Satna 1/ 1996 1996Sehore 1995 1996Seoni 1/1996 1997Shahdol 6 /1996 1997Shajapur 7 /1996 1997Shivpuri 10 /1996 1996Sidhi 1/1996 1997Tikamgarh 5 /1997 1997Ujjain 6/1996 1997Vidisha 11/1995 1997
Table 12: Program implementation of Rogi Kalyan Samiti
39