world health statistics
TRANSCRIPT
World HealtH StatiSticS 2009
2
WHO Library Cataloguing-in-Publication Data
World health statistics 2009.
1.Health status indicators. 2.World health. 3.Health services – statistics. 4.Mortality. 5.Morbidity. 6.Life expectancy. 7.Demography. 8.Statistics. I.World Health Organization.
ISBN 97892 4 156381 9 (NLM classification: WA 900.1)
© World Health Organization 2009
All rights reserved. Publications of the World Health Organization can be obtained from WHO Press, World Health Organization, 20 Avenue Appia, 1211 Geneva 27, Switzerland (tel.: +41 22 791 3264; fax: +41 22 791 4857; e-mail: [email protected]). Requests for permission to reproduce or translate WHO publications – whether for sale or for noncommercial distribution – should be addressed to WHO Press, at the above address (fax: +41 22 791 4806; e-mail: [email protected]).
The designations employed and the presentation of the material in this publication do not imply the expression of any opinion whatsoever on the part of the World Health Organization concerning the legal status of any country, territory, city or area or of its authorities, or concerning the delimitation of its frontiers or boundaries. Dotted lines on maps represent approximate border lines for which there may not yet be full agreement.
The mention of specific companies or of certain manufacturers’ products does not imply that they are endorsed or recommended by the World Health Organization in preference to others of a similar nature that are not mentioned. Errors and omissions excepted, the names of proprietary products are distinguished by initial capital letters.
All reasonable precautions have been taken by the World Health Organization to verify the information contained in this publication. However, the published material is being distributed without warranty of any kind, either expressed or implied. The responsibility for the interpretation and use of the material lies with the reader. In no event shall the World Health Organization be liable for damages arising from its use.
Acknowledgements
This publication was produced by the Department of Health Statistics and Informatics of the Information, Evidence and Research Cluster, under the direction of Ties Boerma and Carla AbouZahr, assisted by Jessica Ho, and in collaboration with WHO technical programmes and regional offices and with other agencies in the United Nations system.
The following WHO staff contributed to the content of this publication: Mohammed Ali, Michel Beusenberg, Monika Bloessner, Cynthia Boschi Pinto, Sylvie Briand, Anthony Burton, Alexandra Cameron, Claudia Cappa, Martin Catterall, Claire Chauvin, Mercedes de Onis, Chris Dye, Daniel Ferrante, Christopher Fitzpatrick, Alexandra Fleischmann, Marta Gacic Dobo, Jun Gao, Sandra Garnier, Neeru Gupta, Regina Guthold, Rifat Hossain, Mehran Hosseini, Ahmadreza Hosseinpoor, Chandika Indikadahena, Mie Inoue, Derege Kebede, Gauri Khanna, Teena Kunjumen, Richard Laing, Enrique Loyola, Doris Ma Fat, Fatima Marinho, Ramon Martinez, Liz Mason, Colin Mathers, Chizuru Nishida, Vladimir Pozniak, Dag Rekve, Leanne Riley, Randa Saadeh, Lale Say, Sunil Senanayake, Jonathan Siekmann, Jacqueline Sims, William Soumbey-Alley, Yves Souteyrand, Tessa Tan-Torres, Khin Win Thin, Catherine Watt, Lara Wolfson, Nevio Zagaria and Jelka Zupan. WHO is grateful to UNICEF (Edilberto Loaiza, Tessa Wardlaw), the Department of Economic and Social Affairs Population Division (Gerhard K. Heilig, François Pelletier) and to the Centers for Disease Control and Prevention (Ann Goding, Brandon O’Hara, Wick Warren) for their valuable contributions. Alison Commar, Veronique Joseph and Wahyu Retno Mahanani have kindly assisted in checking tables for accuracy.
The publication was edited by Laragh Gollogly. Support for the online database was provided by Katherine O’Neill, Steve Moore, Florence Rusciano and John Rawlinson. Production support was provided by the Department of Knowledge Management and Sharing, including Caroline Allsopp, Ian Coltart and Maryvonne Grisetti. Graphic design and layout was by Sophie Guetaneh Aguettant. We thank Petra Schuster for her administrative support.
Cover design: Michel Beusenberg, Denis Meissner and Sophie Guetaneh Aguettant.
Printed in France.
3
Table of Contents
Introduction 7
Part I. Health-related Millennium Development Goals 9Summary of status and trends 10
Regional and country charts 1. Children aged <5 years underweight for age (%) 13 2. Under-5 mortality rate (probability of dying by age 5 per 1000 live births) 14 3. Measles immunization coverage among 1-year-olds (%) 15 4. Maternal mortality ratio (per 100 000 live births) 16 5. Births attended by skilled health personnel (%) 17 6. Contraceptive prevalence (%) 18 7. Adolescent fertility rate (per 1000 girls aged 15–19 years) 19 8. Antenatal care coverage (%): at least 1 visit 20 9. Unmet need for family planning (%) 2110. Prevalence of HIV among adults aged ≥15 years per 100 000 population 2211. Proportion of males aged 15–24 years with comprehensive correct knowledge of HIV/AIDS (%) 2312. Proportion of females aged 15–24 years with comprehensive correct knowledge of HIV/AIDS (%) 2413. Antiretroviral therapy coverage among people with advanced HIV infection (%) 2514. Malaria mortality rate per 100 000 population 2615. Children aged <5 years sleeping under insecticide-treated bednets (%) 2716. Children aged <5 years who received any antimalarial treatment for fever (%) 2817. Tuberculosis treatment success under DOTS (%) 2918. Access to improved drinking-water sources (%) 3019. Access to improved sanitation (%) 31
Part II. Global Health Indicators 33Table 1 Mortality and burden of disease 35
Life expectancy at birth (years) Healthy life expectancy (HALE) at birth (years) Neonatal mortality rate per 1000 live births Infant mortality rate (probability of dying between birth and age 1 per 1000 live births) Under-5 mortality rate (probability of dying by age 5 per 1000 live births) Adult mortality rate (probability of dying between 15 and 60 years per 1000 population)
4
Table 2 Cause-specific mortality and morbidity 47MortalityMaternal mortality ratio per 100 000 live births Cause-specific mortality rate per 100 000 population Age-standardized mortality rate by cause per 100 000 population Distribution of years of life lost by broader causes (%) Distribution of causes of death among children aged <5 years (%) MorbidityPrevalence of tuberculosis per 100 000 population Incidence of tuberculosis per 100 000 population per year Prevalence of HIV among adults aged ≥15 years per 100 000 population
Table 3 Selected infectious diseases : number of reported cases 59Cholera Diphtheria H5N1 influenza Japanese encephalitis Leprosy Malaria Measles Meningitis Mumps Pertussis Plague Poliomyelitis Congenital rubella syndrome Rubella Neonatal tetanus Total tetanus Tuberculosis Yellow fever
Table 4 Health service coverage 71Antenatal care coverage (%) Births attended by skilled health personnel (%) Births by caesarean section (%) Neonates protected at birth against neonatal tetanus (PAB) (%) Immunization coverage among 1-year-olds (%) Children aged 6–59 months who received vitamin A supplementation (%) Children aged <5 years sleeping under insecticide-treated bednets (%)
5
Children aged <5 years with fever who received treatment with any antimalarial (%) Children aged <5 years with ARI symptoms taken to facility (%) Children aged <5 years with diarrhoea receiving ORT (%) Unmet need for family planning (%) Contraceptive prevalence (%) Antiretroviral therapy coverage among HIV-infected pregnant women for PMTCT (%) Antiretroviral therapy coverage among people with advanced HIV infection (%) Tuberculosis detection rate under DOTS (%) Tuberculosis treatment success under DOTS (%)
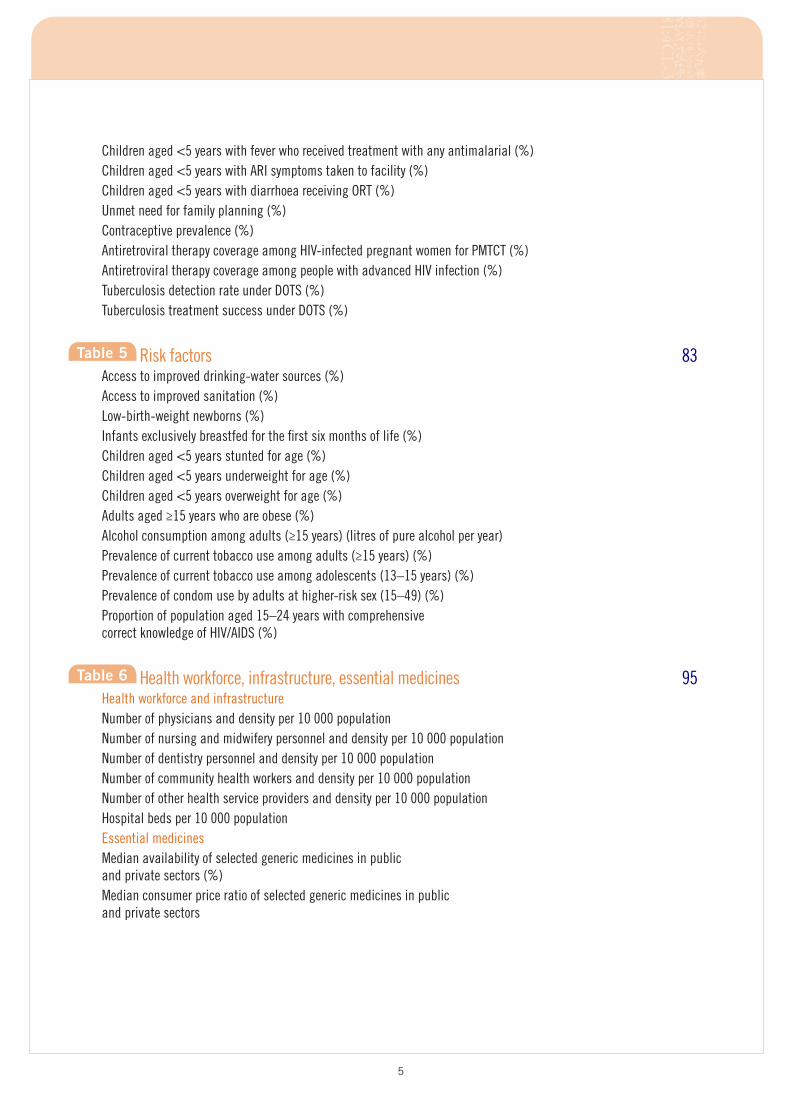
Table 5 Risk factors 83Access to improved drinking-water sources (%) Access to improved sanitation (%) Low-birth-weight newborns (%) Infants exclusively breastfed for the first six months of life (%) Children aged <5 years stunted for age (%) Children aged <5 years underweight for age (%) Children aged <5 years overweight for age (%) Adults aged ≥15 years who are obese (%) Alcohol consumption among adults (≥15 years) (litres of pure alcohol per year) Prevalence of current tobacco use among adults (≥15 years) (%) Prevalence of current tobacco use among adolescents (13–15 years) (%) Prevalence of condom use by adults at higher-risk sex (15–49) (%) Proportion of population aged 15–24 years with comprehensive correct knowledge of HIV/AIDS (%)
Table 6 Health workforce, infrastructure, essential medicines 95Health workforce and infrastructureNumber of physicians and density per 10 000 population Number of nursing and midwifery personnel and density per 10 000 population Number of dentistry personnel and density per 10 000 population Number of community health workers and density per 10 000 population Number of other health service providers and density per 10 000 population Hospital beds per 10 000 population Essential medicinesMedian availability of selected generic medicines in public and private sectors (%) Median consumer price ratio of selected generic medicines in public and private sectors
6
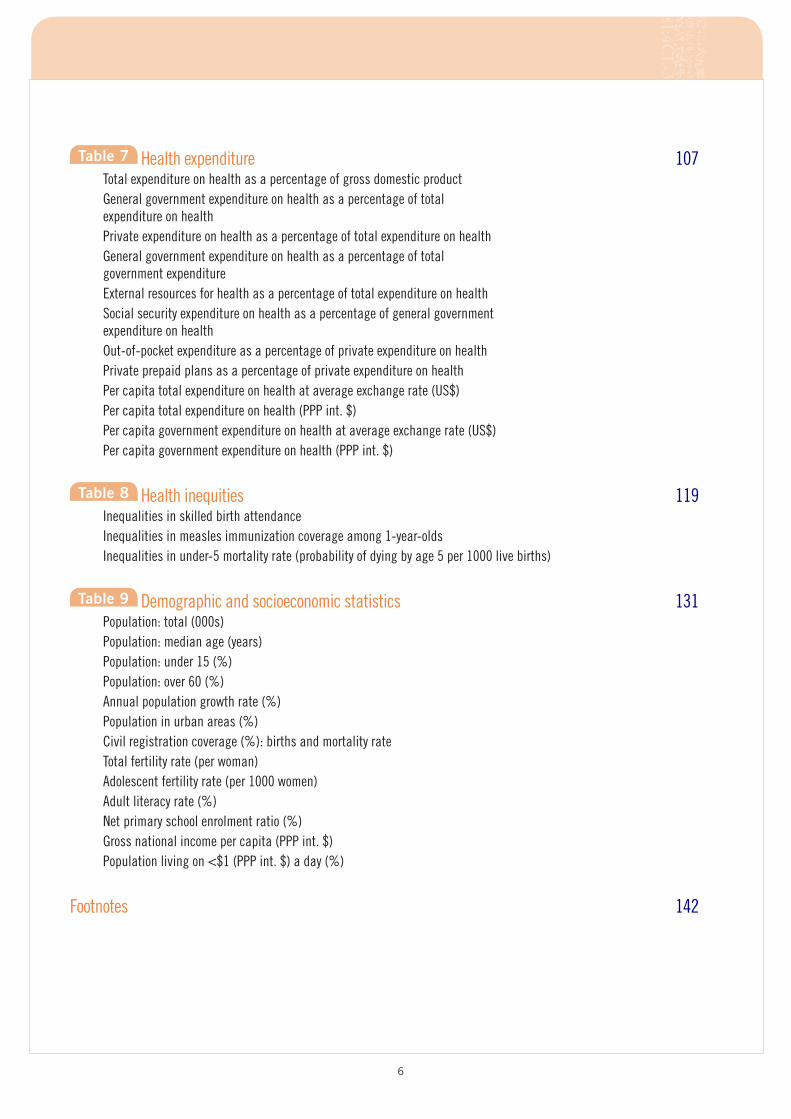
Table 7 Health expenditure 107Total expenditure on health as a percentage of gross domestic product General government expenditure on health as a percentage of total expenditure on health Private expenditure on health as a percentage of total expenditure on health General government expenditure on health as a percentage of total government expenditure External resources for health as a percentage of total expenditure on health Social security expenditure on health as a percentage of general government expenditure on health Out-of-pocket expenditure as a percentage of private expenditure on health Private prepaid plans as a percentage of private expenditure on health Per capita total expenditure on health at average exchange rate (US$) Per capita total expenditure on health (PPP int. $) Per capita government expenditure on health at average exchange rate (US$) Per capita government expenditure on health (PPP int. $)
Table 8 Health inequities 119Inequalities in skilled birth attendance Inequalities in measles immunization coverage among 1-year-olds Inequalities in under-5 mortality rate (probability of dying by age 5 per 1000 live births)
Table 9 Demographic and socioeconomic statistics 131Population: total (000s) Population: median age (years) Population: under 15 (%) Population: over 60 (%) Annual population growth rate (%) Population in urban areas (%) Civil registration coverage (%): births and mortality rate Total fertility rate (per woman) Adolescent fertility rate (per 1000 women) Adult literacy rate (%) Net primary school enrolment ratio (%) Gross national income per capita (PPP int. $) Population living on <$1 (PPP int. $) a day (%)
Footnotes 142
7
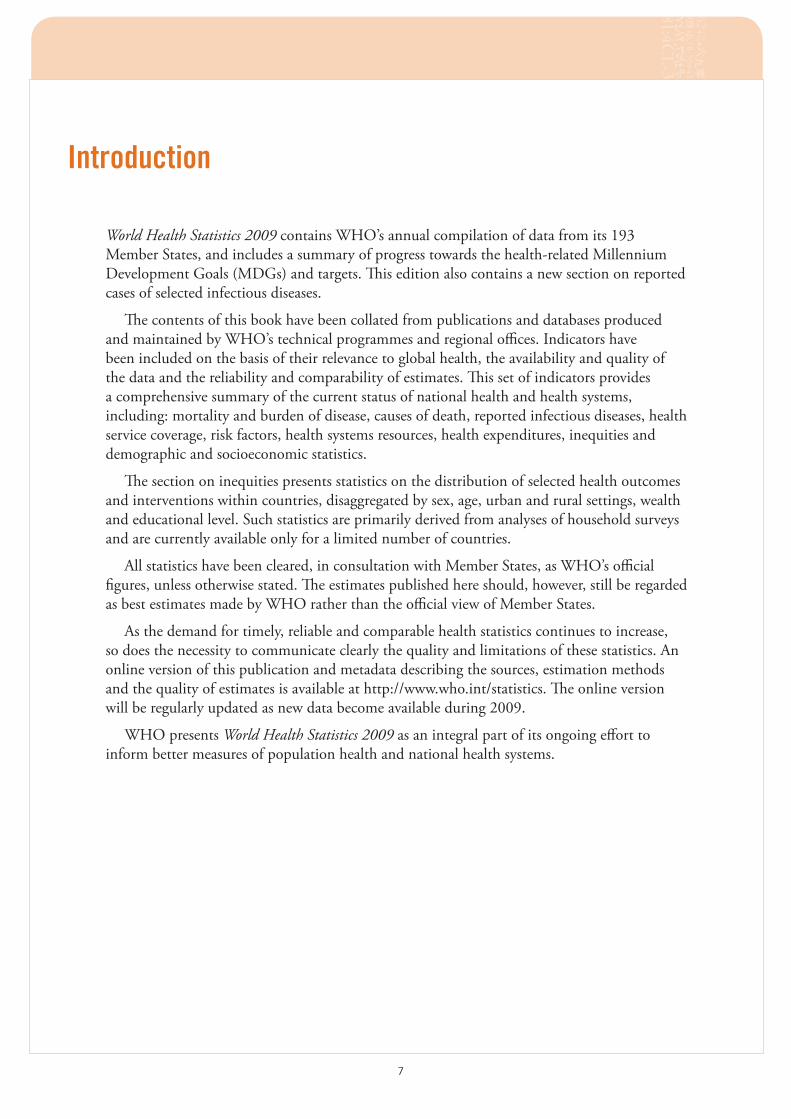
Introduction
World Health Statistics 2009 contains WHO’s annual compilation of data from its 193 Member States, and includes a summary of progress towards the health-related Millennium Development Goals (MDGs) and targets. This edition also contains a new section on reported cases of selected infectious diseases.
The contents of this book have been collated from publications and databases produced and maintained by WHO’s technical programmes and regional offices. Indicators have been included on the basis of their relevance to global health, the availability and quality of the data and the reliability and comparability of estimates. This set of indicators provides a comprehensive summary of the current status of national health and health systems, including: mortality and burden of disease, causes of death, reported infectious diseases, health service coverage, risk factors, health systems resources, health expenditures, inequities and demographic and socioeconomic statistics.
The section on inequities presents statistics on the distribution of selected health outcomes and interventions within countries, disaggregated by sex, age, urban and rural settings, wealth and educational level. Such statistics are primarily derived from analyses of household surveys and are currently available only for a limited number of countries.
All statistics have been cleared, in consultation with Member States, as WHO’s official figures, unless otherwise stated. The estimates published here should, however, still be regarded as best estimates made by WHO rather than the official view of Member States.
As the demand for timely, reliable and comparable health statistics continues to increase, so does the necessity to communicate clearly the quality and limitations of these statistics. An online version of this publication and metadata describing the sources, estimation methods and the quality of estimates is available at http://www.who.int/statistics. The online version will be regularly updated as new data become available during 2009.
WHO presents World Health Statistics 2009 as an integral part of its ongoing effort to inform better measures of population health and national health systems.

Part IHealth-related
Millennium Development Goals
10
Summary of status and trends
Health is at the heart of the Millennium Development Goals (MDGs). Goals 4, 5 and 6 specifically focus on health, but all the MDGs have health-related aspects; achieving them will not be possible without progress on food security, gender equality, the empowerment of women, wider access to education and better stewardship of the environment.
At the midpoint between 2000 and 2015, the analysis shows encouraging signs of progress, particularly in child health; it points to areas where current gains need to be sustained, particularly in relation to AIDS, tuberculosis and malaria; and areas where there has been little or no movement, notably maternal and newborn health. More detailed and updated data for 2008, reported in World Health Statistics 2009, show major differences in progress between and within countries and regions. Looking forward to 2015 and beyond, the challenges presented by weak health systems, the health transition and emerging health threats will become increasingly prominent.
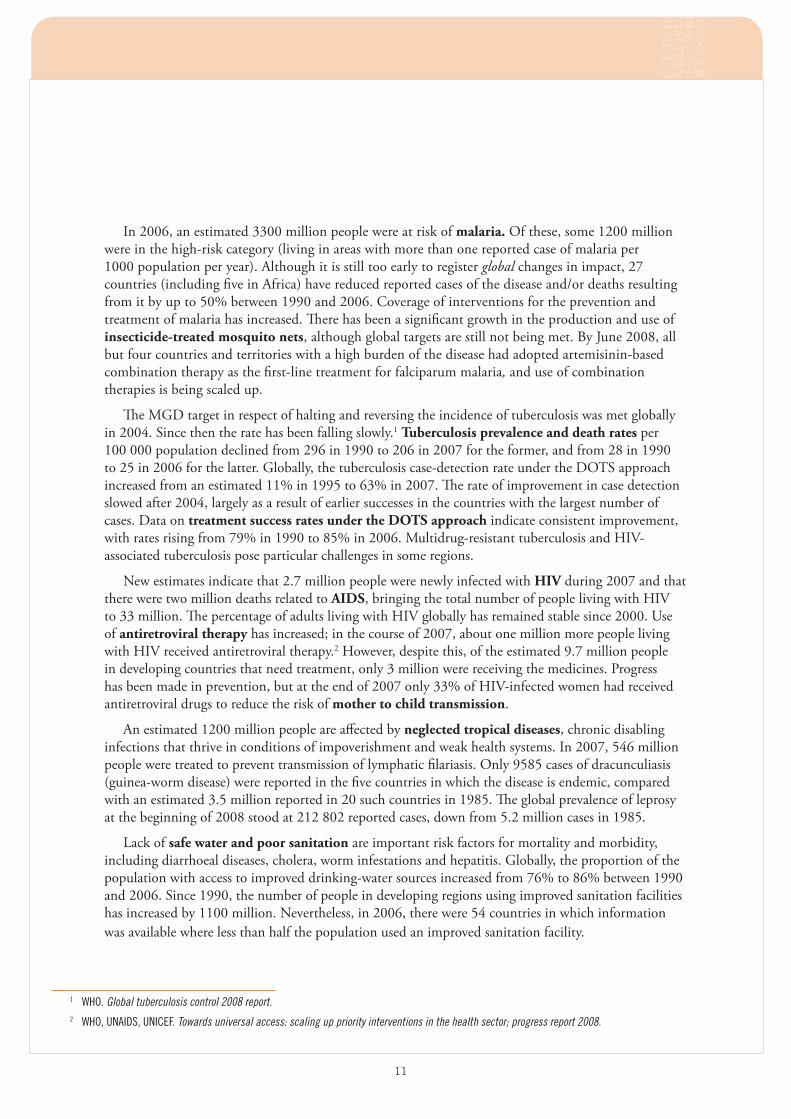
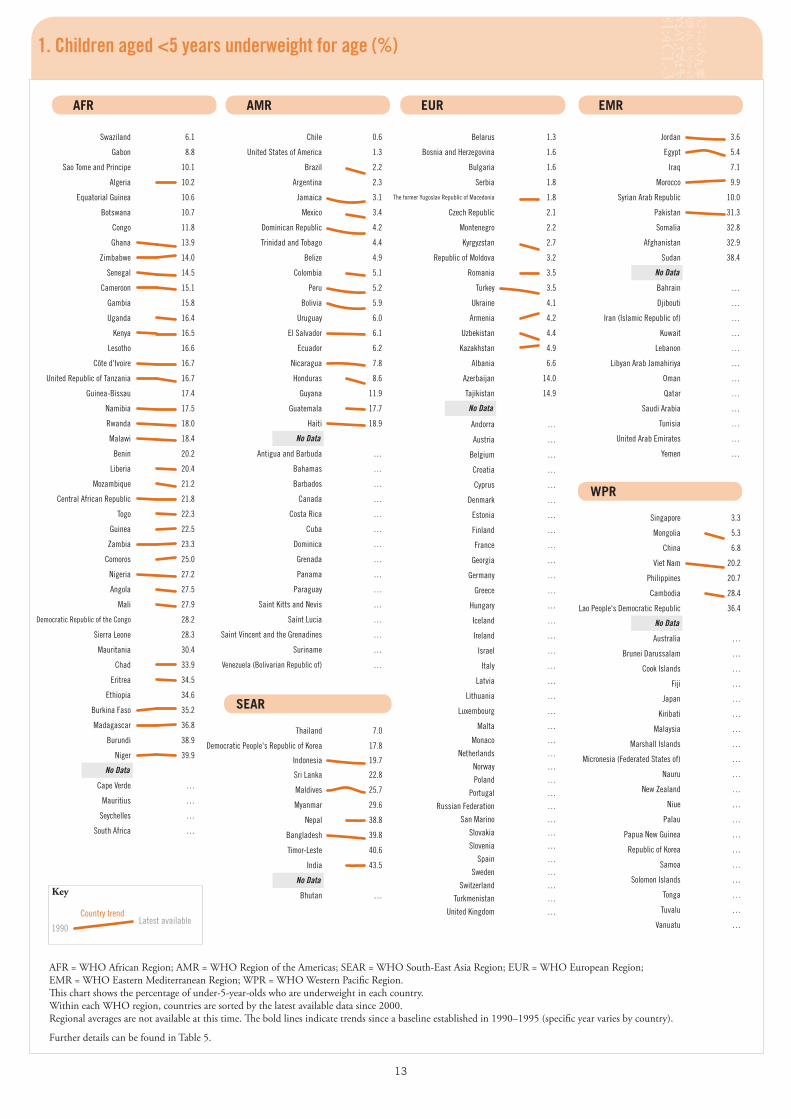
Overall, the proportion of children under five years of age suffering from under-nutrition (according to the WHO Child Growth Standards) declined from 27% in 1990 to 20% in 2005. However, progress has been uneven and an estimated 112 million children are underweight. Under-nutrition is an underlying cause in more than one third of child deaths.
In 2007, there were an estimated 9 million child deaths, significantly fewer than the 12.5 million estimated in 1990, with a 27% decline in the under-5 mortality rate over that period to 67 per 1000 live births in 2007. Reducing child mortality increasingly depends on tackling neonatal mortality; globally, an estimated 37% of deaths among children under five occurs in the first month of life, most in the first week. Countries making the least progress are generally those affected by high levels of HIV/AIDS, economic hardship or conflict.
Much of the progress in reducing child mortality can be attributed to increased immunization coverage, use of oral rehydration therapies during episodes of diarrhoea, use of insecticide-treated mosquito nets, access to artemisinin-based combination therapies, efforts to eliminate disease due to Haemophilus influenzae type b infection and reduced disease incidence due to improved water and sanitation. However, because the availability and use of proven interventions at community level remain low, pneumonia and diarrhoea still kill 3.8 million children under five each year.
Every year some 536 000 women die of complications during pregnancy or childbirth, 99% of them in developing countries. The global maternal mortality ratio of 400 maternal deaths per 100 000 live births in 2005 has barely changed since 1990. Most maternal deaths occur in the African Region, where the maternal mortality ratio is 900 per 100 000 live births, with no measureable improvement between 1990 and 2005.
Progress in reducing maternal mortality and morbidity depends on better access to, and use of, good maternal and reproductive health services. The proportion of pregnant women in the developing world who had at least one antenatal care visit increased from slightly more than half at the beginning of the 1990s to almost three quarters a decade later. Over the period 2000–2008, 65% of births globally were attended by skilled health personnel, 4% more than in 1990–1999.
Globally, the contraceptive prevalence rate increased from 59% in 1990–1995 to 63% in 2000–2006. Nonetheless, in some regions it remains very difficult to reduce the considerable unmet need for family planning and the high rates of adolescent fertility. Globally, there were 48 births for every 1000 women aged 15–19 years in 2006, only a small decline from 51 per 1000 in 2000.
11
In 2006, an estimated 3300 million people were at risk of malaria. Of these, some 1200 million were in the high-risk category (living in areas with more than one reported case of malaria per 1000 population per year). Although it is still too early to register global changes in impact, 27 countries (including five in Africa) have reduced reported cases of the disease and/or deaths resulting from it by up to 50% between 1990 and 2006. Coverage of interventions for the prevention and treatment of malaria has increased. There has been a significant growth in the production and use of insecticide-treated mosquito nets, although global targets are still not being met. By June 2008, all but four countries and territories with a high burden of the disease had adopted artemisinin-based combination therapy as the first-line treatment for falciparum malaria, and use of combination therapies is being scaled up.
The MGD target in respect of halting and reversing the incidence of tuberculosis was met globally in 2004. Since then the rate has been falling slowly.1 Tuberculosis prevalence and death rates per 100 000 population declined from 296 in 1990 to 206 in 2007 for the former, and from 28 in 1990 to 25 in 2006 for the latter. Globally, the tuberculosis case-detection rate under the DOTS approach increased from an estimated 11% in 1995 to 63% in 2007. The rate of improvement in case detection slowed after 2004, largely as a result of earlier successes in the countries with the largest number of cases. Data on treatment success rates under the DOTS approach indicate consistent improvement, with rates rising from 79% in 1990 to 85% in 2006. Multidrug-resistant tuberculosis and HIV-associated tuberculosis pose particular challenges in some regions.
New estimates indicate that 2.7 million people were newly infected with HIV during 2007 and that there were two million deaths related to AIDS, bringing the total number of people living with HIV to 33 million. The percentage of adults living with HIV globally has remained stable since 2000. Use of antiretroviral therapy has increased; in the course of 2007, about one million more people living with HIV received antiretroviral therapy.2 However, despite this, of the estimated 9.7 million people in developing countries that need treatment, only 3 million were receiving the medicines. Progress has been made in prevention, but at the end of 2007 only 33% of HIV-infected women had received antiretroviral drugs to reduce the risk of mother to child transmission.
An estimated 1200 million people are affected by neglected tropical diseases, chronic disabling infections that thrive in conditions of impoverishment and weak health systems. In 2007, 546 million people were treated to prevent transmission of lymphatic filariasis. Only 9585 cases of dracunculiasis (guinea-worm disease) were reported in the five countries in which the disease is endemic, compared with an estimated 3.5 million reported in 20 such countries in 1985. The global prevalence of leprosy at the beginning of 2008 stood at 212 802 reported cases, down from 5.2 million cases in 1985.
Lack of safe water and poor sanitation are important risk factors for mortality and morbidity, including diarrhoeal diseases, cholera, worm infestations and hepatitis. Globally, the proportion of the population with access to improved drinking-water sources increased from 76% to 86% between 1990 and 2006. Since 1990, the number of people in developing regions using improved sanitation facilities has increased by 1100 million. Nevertheless, in 2006, there were 54 countries in which information was available where less than half the population used an improved sanitation facility.
1 WHO. Global tuberculosis control 2008 report.2 WHO, UNAIDS, UNICEF. Towards universal access: scaling up priority interventions in the health sector; progress report 2008.
12
Although nearly all developing countries publish an essential medicines list, the availability of medicines at public health facilities is often poor. Surveys in about 30 developing countries indicate that availability of selected medicines at health facilities was only 35% in the public sector and 63% in the private sector. Lack of medicines in the public sector forces patients to purchase medicines privately. In the private sector, however, generic medicines are often sold at several times their international reference price, while originator brands are generally even more expensive.
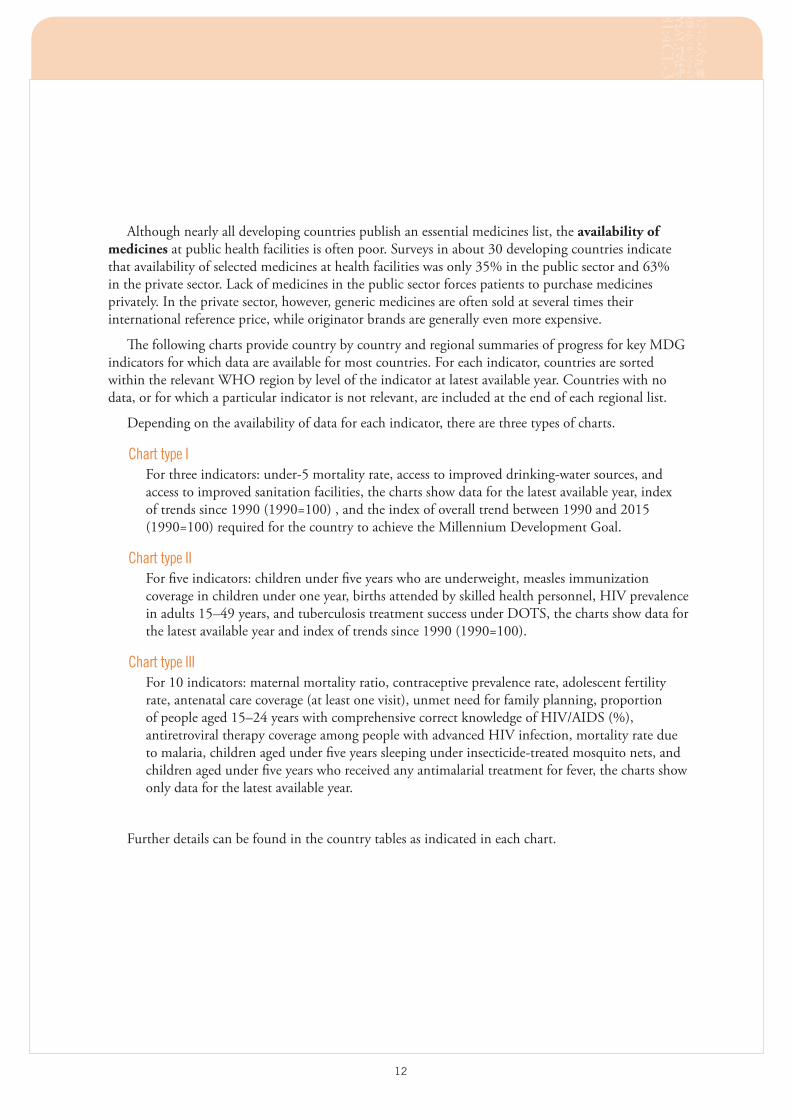
The following charts provide country by country and regional summaries of progress for key MDG indicators for which data are available for most countries. For each indicator, countries are sorted within the relevant WHO region by level of the indicator at latest available year. Countries with no data, or for which a particular indicator is not relevant, are included at the end of each regional list.
Depending on the availability of data for each indicator, there are three types of charts.
Chart type IFor three indicators: under-5 mortality rate, access to improved drinking-water sources, and access to improved sanitation facilities, the charts show data for the latest available year, index of trends since 1990 (1990=100) , and the index of overall trend between 1990 and 2015 (1990=100) required for the country to achieve the Millennium Development Goal.
Chart type IIFor five indicators: children under five years who are underweight, measles immunization coverage in children under one year, births attended by skilled health personnel, HIV prevalence in adults 15–49 years, and tuberculosis treatment success under DOTS, the charts show data for the latest available year and index of trends since 1990 (1990=100).
Chart type IIIFor 10 indicators: maternal mortality ratio, contraceptive prevalence rate, adolescent fertility rate, antenatal care coverage (at least one visit), unmet need for family planning, proportion of people aged 15–24 years with comprehensive correct knowledge of HIV/AIDS (%), antiretroviral therapy coverage among people with advanced HIV infection, mortality rate due to malaria, children aged under five years sleeping under insecticide-treated mosquito nets, and children aged under five years who received any antimalarial treatment for fever, the charts show only data for the latest available year.
Further details can be found in the country tables as indicated in each chart.
13
Thailand 7.0
Democratic People's Republic of Korea 17.8
Indonesia 19.7
Sri Lanka 22.8
Maldives 25.7
Myanmar 29.6
Nepal 38.8
Bangladesh 39.8
Timor-Leste 40.6
India 43.5
Bhutan …
No Data
Swaziland 6.1
Gabon 8.8
Sao Tome and Principe 10.1
Algeria 10.2
Equatorial Guinea 10.6
Botswana 10.7
Congo 11.8
Ghana 13.9
Zimbabwe 14.0
Senegal 14.5
Cameroon 15.1
Gambia 15.8
Uganda 16.4
Kenya 16.5
Lesotho 16.6
Côte d'Ivoire 16.7
United Republic of Tanzania 16.7
Guinea-Bissau 17.4
Namibia 17.5
Rwanda 18.0
Malawi 18.4
Benin 20.2
Liberia 20.4
Mozambique 21.2
Central African Republic 21.8
Togo 22.3
Guinea 22.5
Zambia 23.3
Comoros 25.0
Nigeria 27.2
Angola 27.5
Mali 27.9
Democratic Republic of the Congo 28.2
Sierra Leone 28.3
Mauritania 30.4
Chad 33.9
Eritrea 34.5
Ethiopia 34.6
Burkina Faso 35.2
Madagascar 36.8
Burundi 38.9
Niger 39.9
Cape Verde …
Mauritius …
Seychelles …
South Africa …
No Data
Chile 0.6
United States of America 1.3
Brazil 2.2
Argentina 2.3
Jamaica 3.1
Mexico 3.4
Dominican Republic 4.2
Trinidad and Tobago 4.4
Belize 4.9
Colombia 5.1
Peru 5.2
Bolivia 5.9
Uruguay 6.0
El Salvador 6.1
Ecuador 6.2
Nicaragua 7.8
Honduras 8.6
Guyana 11.9
Guatemala 17.7
Haiti 18.9
Antigua and Barbuda …
Bahamas …
Barbados …
Canada …
Costa Rica …
Cuba …
Dominica …
Grenada …
Panama …
Paraguay …
Saint Kitts and Nevis …
Saint Lucia …
Saint Vincent and the Grenadines …
Suriname …
Venezuela (Bolivarian Republic of) …
No Data
Singapore 3.3
Mongolia 5.3
China 6.8
Viet Nam 20.2
Philippines 20.7
Cambodia 28.4
Lao People's Democratic Republic 36.4
Australia …
Brunei Darussalam …
Cook Islands …
Fiji …
Japan …
Kiribati …
Malaysia …
Marshall Islands …
Micronesia (Federated States of) …
Nauru …
New Zealand …
Niue …
Palau …
Papua New Guinea …
Republic of Korea …
Samoa …
Solomon Islands …
Tonga …
Tuvalu …
Vanuatu …
No Data
Jordan 3.6
Egypt 5.4
Iraq 7.1
Morocco 9.9
Syrian Arab Republic 10.0
Pakistan 31.3
Somalia 32.8
Afghanistan 32.9
Sudan 38.4
Bahrain …
Djibouti …
Iran (Islamic Republic of) …
Kuwait …
Lebanon …
Libyan Arab Jamahiriya …
Oman …
Qatar …
Saudi Arabia …
Tunisia …
United Arab Emirates …
Yemen …
No Data
Belarus 1.3
Bosnia and Herzegovina 1.6
Bulgaria 1.6
Serbia 1.8
The former Yugoslav Republic of Macedonia 1.8
Czech Republic 2.1
Montenegro 2.2
Kyrgyzstan 2.7
Republic of Moldova 3.2
Romania 3.5
Turkey 3.5
Ukraine 4.1
Armenia 4.2
Uzbekistan 4.4
Kazakhstan 4.9
Albania 6.6
Azerbaijan 14.0
Tajikistan 14.9
Andorra …
Austria …
Belgium …
Croatia …
Cyprus …
Denmark …
Estonia …
Finland …
France …
Georgia …
Germany …
Greece …
Hungary …
Iceland …
Ireland …
Israel …
Italy …
Latvia …
Lithuania …
Luxembourg …
Malta …
Monaco …
Netherlands …
Norway …
Poland …
Portugal …
Russian Federation …
San Marino …
Slovakia …
Slovenia …
Spain …
Sweden …
Switzerland …
Turkmenistan …
United Kingdom …
1. Children aged <5 years underweight for age (%)
AFR = WHO African Region; AMR = WHO Region of the Americas; SEAR = WHO South-East Asia Region; EUR = WHO European Region; EMR = WHO Eastern Mediterranean Region; WPR = WHO Western Pacific Region. This chart shows the percentage of under-5-year-olds who are underweight in each country. Within each WHO region, countries are sorted by the latest available data since 2000. Regional averages are not available at this time. The bold lines indicate trends since a baseline established in 1990–1995 (specific year varies by country).
Further details can be found in Table 5.
Key
Latest available1990
Country trend
No Data
14
Singapore 3
Japan 4
Republic of Korea 5
Australia 6
New Zealand 6
Brunei Darussalam 9
Palau 10
Malaysia 11
Viet Nam 15
Fiji 18
Cook Islands 18
China 22
Tonga 23
Samoa 27
Philippines 28
Nauru 30
Vanuatu 34
Tuvalu 37
Micronesia (Federated States of) 40
Mongolia 43
Niue 46
Marshall Islands 54
Kiribati 63
Papua New Guinea 65
Lao People's Democratic Republic 70
Solomon Islands 70
Cambodia 91
San Marino 2
Iceland 3
Sweden 3
Finland 3
Luxembourg 4
Norway 4
Andorra 4
Portugal 4
Italy 4
Slovenia 4
Czech Republic 4
France 4
Greece 4
Spain 4
Austria 4
Germany 4
Ireland 4
Cyprus 4
Belgium 4
Monaco 5
Denmark 5
Netherlands 5
Switzerland 5
Israel 5
Malta 6
United Kingdom 6
Croatia 6
Estonia 6
Hungary 7
Belarus 7
Poland 7
Lithuania 7
Slovakia 8
Serbia 8
Montenegro 10
Latvia 10
Bulgaria 12
Russian Federation 12
Romania 14
Bosnia and Herzegovina 14
Albania 15
Ukraine 16
The former Yugoslav Republic of Macedonia 17
Republic of Moldova 18
Turkey 23
Armenia 24
Georgia 30
Kazakhstan 32
Kyrgyzstan 38
Azerbaijan 39
Uzbekistan 41
Turkmenistan 50
Tajikistan 67
Canada 6
Cuba 6
United States of America 8
Chile 9
Antigua and Barbuda 11
Costa Rica 11
Barbados 12
Saint Lucia 13
Bahamas 13
Dominica 14
Uruguay 14
Argentina 16
Saint Vincent and the Grenadines 17
Saint Kitts and Nevis 18
Grenada 19
Venezuela (Bolivarian Republic of) 19
Peru 20
Colombia 20
Mexico 21
Brazil 22
Ecuador 22
Panama 23
El Salvador 24
Honduras 24
Belize 25
Suriname 28
Paraguay 29
Jamaica 31
Nicaragua 35
Trinidad and Tobago 35
Dominican Republic 38
Guatemala 39
Bolivia 57
Guyana 60
Haiti 76
Seychelles 16
Mauritius 17
Cape Verde 32
Algeria 37
Botswana 40
South Africa 59
Comoros 66
Namibia 68
Eritrea 70
Lesotho 84
Zimbabwe 90
Swaziland 91
Gabon 91
Sao Tome and Principe 99
Togo 100
Gambia 109
Malawi 110
Madagascar 112
Senegal 114
Ghana 115
United Republic of Tanzania 116
Mauritania 118
Ethiopia 119
Kenya 121
Benin 123
Congo 125
Côte d'Ivoire 127
Uganda 131
Liberia 133
Cameroon 148
Equatorial Guinea 150
Guinea 150
Angola 158
Democratic Republic of the Congo 161
Mozambique 168
Zambia 170
Central African Republic 172
Niger 176
Burundi 180
Rwanda 181
Nigeria 189
Burkina Faso 191
Mali 196
Guinea-Bissau 198
Chad 209
Sierra Leone 262
Thailand 7
Sri Lanka 21
Maldives 30
Indonesia 31
Democratic People's Republic of Korea 55
Nepal 55
Bangladesh 61
India 72
Bhutan 84
Timor-Leste 97
Myanmar 113
United Arab Emirates 8
Qatar 10
Bahrain 10
Kuwait 11
Oman 12
Syrian Arab Republic 17
Libyan Arab Jamahiriya 18
Jordan 20
Tunisia 21
Saudi Arabia 25
Lebanon 29
Iran (Islamic Republic of) 33
Morocco 34
Egypt 36
Iraq 45
Yemen 73
Pakistan 90
Sudan 109
Djibouti 127
Somalia 142
Afghanistan 257
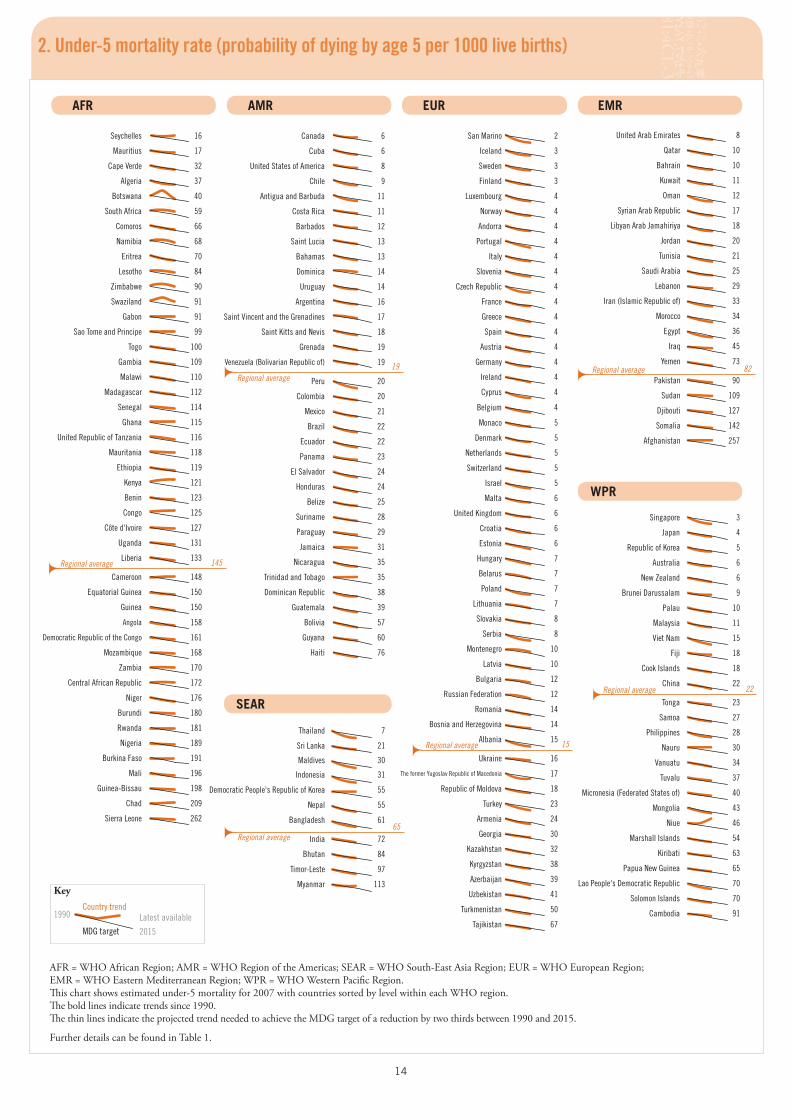
2. Under-5 mortality rate (probability of dying by age 5 per 1000 live births)
Regional average 145
Regional average19 Regional average 82
Regional average 22
Regional average 15
AFR = WHO African Region; AMR = WHO Region of the Americas; SEAR = WHO South-East Asia Region; EUR = WHO European Region; EMR = WHO Eastern Mediterranean Region; WPR = WHO Western Pacific Region. This chart shows estimated under-5 mortality for 2007 with countries sorted by level within each WHO region. The bold lines indicate trends since 1990. The thin lines indicate the projected trend needed to achieve the MDG target of a reduction by two thirds between 1990 and 2015.
Further details can be found in Table 1.
Key
2015
Latest available1990Country trend
MDG target
Regional average65
15
Rwanda 99
Seychelles 99
Mauritius 98
Eritrea 95
Ghana 95
Liberia 95
Burkina Faso 94
Algeria 92
Swaziland 91
Botswana 90
United Republic of Tanzania 90
Angola 88
Sao Tome and Principe 86
Gambia 85
Lesotho 85
Zambia 85
Senegal 84
Malawi 83
South Africa 83
Madagascar 81
Kenya 80
Togo 80
Democratic Republic of the Congo 79
Mozambique 77
Guinea-Bissau 76
Burundi 75
Cameroon 74
Cape Verde 74
Guinea 71
Namibia 69
Mali 68
Uganda 68
Congo 67
Côte d'Ivoire 67
Mauritania 67
Sierra Leone 67
Zimbabwe 66
Comoros 65
Ethiopia 65
Central African Republic 62
Nigeria 62
Benin 61
Gabon 55
Equatorial Guinea 51
Niger 47
Chad 23
Antigua and Barbuda 99
Argentina 99
Brazil 99
Cuba 99
Ecuador 99
Nicaragua 99
Peru 99
Saint Kitts and Nevis 99
Saint Vincent and the Grenadines 99
El Salvador 98
Grenada 98
Bahamas 96
Belize 96
Dominica 96
Dominican Republic 96
Guyana 96
Mexico 96
Uruguay 96
Colombia 95
Canada 94
Saint Lucia 94
Guatemala 93
United States of America 93
Chile 91
Trinidad and Tobago 91
Costa Rica 90
Honduras 89
Panama 89
Suriname 85
Bolivia 81
Paraguay 80
Jamaica 76
Barbados 75
Haiti 58
Venezuela (Bolivarian Republic of) 55
Bahrain 99
Kuwait 99
Libyan Arab Jamahiriya 98
Syrian Arab Republic 98
Tunisia 98
Egypt 97
Iran (Islamic Republic of) 97
Oman 97
Saudi Arabia 96
Jordan 95
Morocco 95
Qatar 92
United Arab Emirates 92
Pakistan 80
Sudan 79
Djibouti 74
Yemen 74
Afghanistan 70
Iraq 69
Lebanon 53
Somalia 34
Belarus 99
Hungary 99
Kazakhstan 99
Kyrgyzstan 99
Monaco 99
Russian Federation 99
Slovakia 99
Turkmenistan 99
Uzbekistan 99
Finland 98
Poland 98
Ukraine 98
Albania 97
Azerbaijan 97
Czech Republic 97
Georgia 97
Israel 97
Latvia 97
Lithuania 97
Romania 97
Spain 97
Bosnia and Herzegovina 96
Bulgaria 96
Croatia 96
Estonia 96
Luxembourg 96
Netherlands 96
Republic of Moldova 96
Slovenia 96
Sweden 96
The former Yugoslav Republic of Macedonia 96
Turkey 96
Iceland 95
Portugal 95
Serbia 95
Andorra 94
Germany 94
Armenia 92
Belgium 92
Norway 92
San Marino 92
Montenegro 90
Denmark 89
Greece 88
Cyprus 87
France 87
Ireland 87
Italy 87
Switzerland 86
United Kingdom 86
Tajikistan 85
Austria 79
Malta 79
Nauru 99
Niue 99
Tonga 99
Cook Islands 98
Japan 98
Mongolia 98
Brunei Darussalam 97
Singapore 95
Tuvalu 95
Australia 94
China 94
Marshall Islands 94
Kiribati 93
Micronesia (Federated States of) 92
Philippines 92
Republic of Korea 92
Palau 91
Malaysia 90
Viet Nam 83
Fiji 81
Cambodia 79
New Zealand 79
Solomon Islands 78
Vanuatu 65
Samoa 63
Papua New Guinea 58
Lao People's Democratic Republic 40
Democratic People's Republic of Korea 99
Sri Lanka 98
Maldives 97
Thailand 96
Bhutan 95
Bangladesh 88
Myanmar 81
Nepal 81
Indonesia 80
India 67
Timor-Leste 63
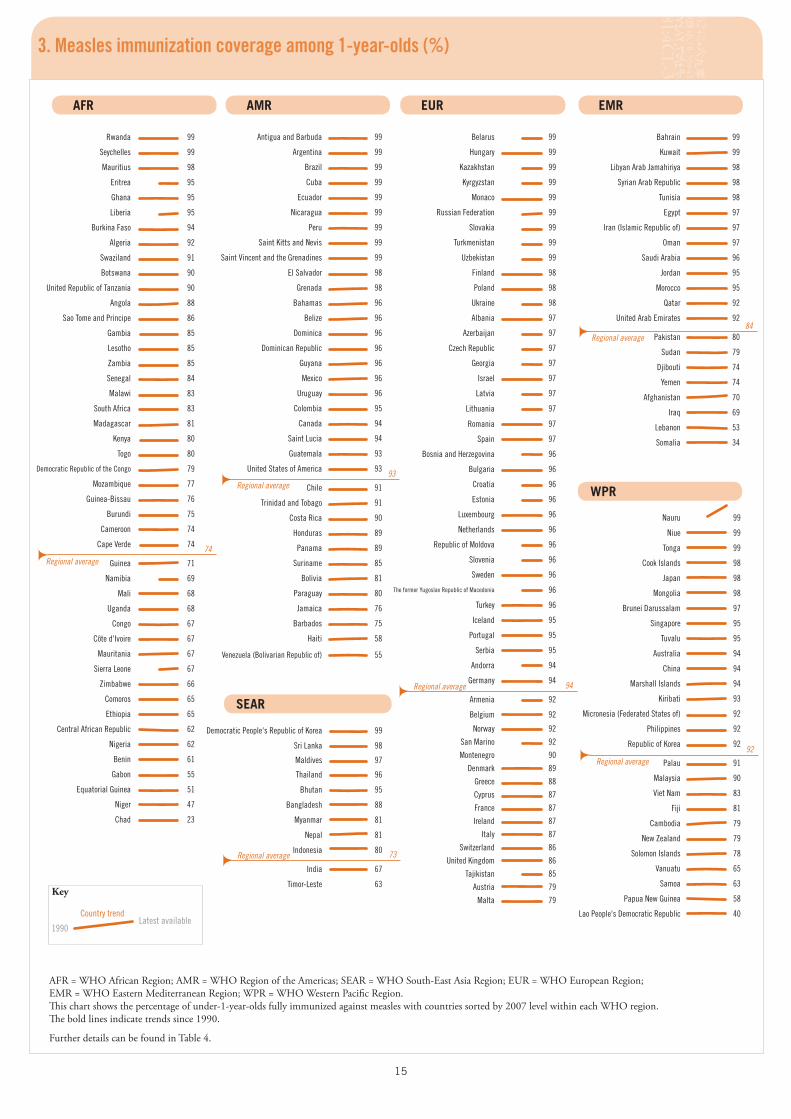
3. Measles immunization coverage among 1-year-olds (%)
AFR = WHO African Region; AMR = WHO Region of the Americas; SEAR = WHO South-East Asia Region; EUR = WHO European Region; EMR = WHO Eastern Mediterranean Region; WPR = WHO Western Pacific Region. This chart shows the percentage of under-1-year-olds fully immunized against measles with countries sorted by 2007 level within each WHO region. The bold lines indicate trends since 1990.
Further details can be found in Table 4.
Key
Latest available1990
Country trend
Regional average74
Regional average93
Regional average 73
Regional average 94
Regional average84
Regional average92
16
Mauritius 15
Algeria 180
Cape Verde 210
Namibia 210
Botswana 380
Swaziland 390
Comoros 400
South Africa 400
Eritrea 450
Madagascar 510
Togo 510
Gabon 520
Mozambique 520
Uganda 550
Ghana 560
Kenya 560
Equatorial Guinea 680
Gambia 690
Burkina Faso 700
Ethiopia 720
Congo 740
Côte d'Ivoire 810
Mauritania 820
Zambia 830
Benin 840
Zimbabwe 880
Guinea 910
United Republic of Tanzania 950
Lesotho 960
Mali 970
Central African Republic 980
Senegal 980
Cameroon 1 000
Burundi 1 100
Democratic Republic of the Congo 1 100
Guinea-Bissau 1 100
Malawi 1 100
Nigeria 1 100
Liberia 1 200
Rwanda 1 300
Angola 1 400
Chad 1 500
Niger 1 800
Sierra Leone 2 100
No Data
Sao Tome and Principe …
Seychelles …
Canada 7
United States of America 11
Bahamas 16
Barbados 16
Chile 16
Uruguay 20
Costa Rica 30
Cuba 45
Trinidad and Tobago 45
Belize 52
Venezuela (Bolivarian Republic of) 57
Mexico 60
Suriname 72
Argentina 77
Brazil 110
Colombia 130
Panama 130
Dominican Republic 150
Paraguay 150
El Salvador 170
Jamaica 170
Nicaragua 170
Ecuador 210
Peru 240
Honduras 280
Bolivia 290
Guatemala 290
Guyana 470
Haiti 670
No Data
Antigua and Barbuda …
Dominica …
Grenada …
Saint Kitts and Nevis …
Saint Lucia …
Saint Vincent and the Grenadines …
Kuwait 4
Qatar 12
Saudi Arabia 18
Bahrain 32
United Arab Emirates 37
Jordan 62
Oman 64
Libyan Arab Jamahiriya 97
Tunisia 100
Egypt 130
Syrian Arab Republic 130
Iran (Islamic Republic of) 140
Lebanon 150
Morocco 240
Iraq 300
Pakistan 320
Yemen 430
Sudan 450
Djibouti 650
Somalia 1 400
Afghanistan 1 800
Ireland 1
Bosnia and Herzegovina 3
Denmark 3
Greece 3
Italy 3
Sweden 3
Austria 4
Czech Republic 4
Germany 4
Iceland 4
Israel 4
Spain 4
Switzerland 5
Hungary 6
Netherlands 6
Slovakia 6
Slovenia 6
Croatia 7
Finland 7
Norway 7
Belgium 8
France 8
Malta 8
Poland 8
United Kingdom 8
Cyprus 10
Latvia 10
The former Yugoslav Republic of Macedonia 10
Bulgaria 11
Lithuania 11
Portugal 11
Luxembourg 12
Belarus 18
Ukraine 18
Republic of Moldova 22
Romania 24
Uzbekistan 24
Estonia 25
Russian Federation 28
Turkey 44
Georgia 66
Armenia 76
Azerbaijan 82
Albania 92
Turkmenistan 130
Kazakhstan 140
Kyrgyzstan 150
Tajikistan 170
No Data
Andorra …
Monaco …
Montenegro …
San Marino …
Serbia …
Australia 4
Japan 6
New Zealand 9
Brunei Darussalam 13
Republic of Korea 14
Singapore 14
China 45
Mongolia 46
Malaysia 62
Viet Nam 150
Fiji 210
Solomon Islands 220
Philippines 230
Papua New Guinea 470
Cambodia 540
Lao People's Democratic Republic 660
No Data
Cook Islands …
Kiribati …
Marshall Islands …
Micronesia (Federated States of) …
Nauru …
Niue …
Palau …
Samoa …
Tonga …
Tuvalu …
Vanuatu …
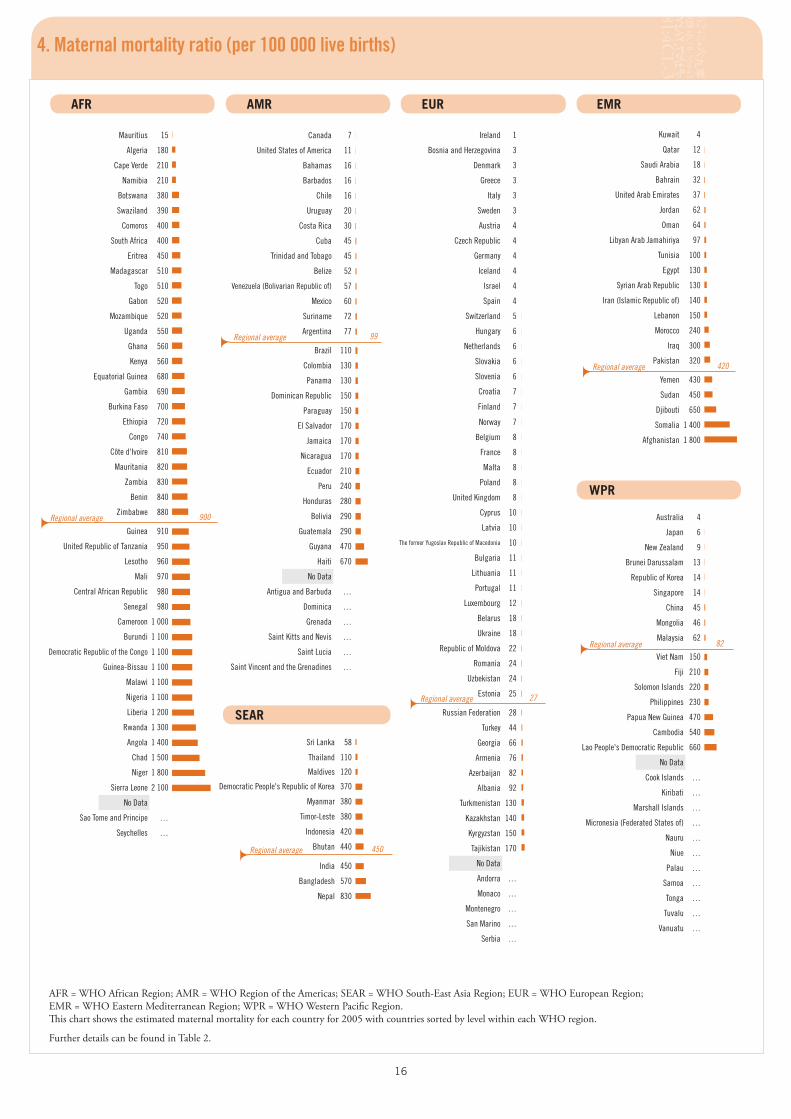
4. Maternal mortality ratio (per 100 000 live births)
Sri Lanka 58
Thailand 110
Maldives 120
Democratic People's Republic of Korea 370
Myanmar 380
Timor-Leste 380
Indonesia 420
Bhutan 440
India 450
Bangladesh 570
Nepal 830
Regional average 900
Regional average 99
Regional average 27
Regional average 82
Regional average 420
Regional average 450
AFR = WHO African Region; AMR = WHO Region of the Americas; SEAR = WHO South-East Asia Region; EUR = WHO European Region; EMR = WHO Eastern Mediterranean Region; WPR = WHO Western Pacific Region. This chart shows the estimated maternal mortality for each country for 2005 with countries sorted by level within each WHO region.
Further details can be found in Table 2.
17
Mauritius 99
Botswana 94
Algeria 95
South Africa 91
Congo 86
Gabon 86
Namibia 81
Sao Tome and Principe 81
Cape Verde 78
Benin 78
Swaziland 74
Democratic Republic of the Congo 74
Zimbabwe 69
Equatorial Guinea 63
Cameroon 63
Togo 62
Comoros 62
Mauritania 61
Côte d'Ivoire 57
Gambia 57
Lesotho 55
Burkina Faso 54
Malawi 54
Central African Republic 54
Rwanda 52
Senegal 52
Madagascar 51
Ghana 50
Mali 49
Mozambique 48
Angola 47
Zambia 47
Liberia 46
United Republic of Tanzania 46
Sierra Leone 42
Uganda 42
Kenya 42
Guinea-Bissau 39
Guinea 38
Nigeria 35
Burundi 34
Eritrea 28
Niger 18
Chad 14
Ethiopia 6
No data
Seychelles …
Antigua and Barbuda 100
Barbados 100
Canada 100
Saint Kitts and Nevis 100
Saint Vincent and the Grenadines 100
Cuba 100
Chile 100
Argentina 99
United States of America 99
Bahamas 99
Grenada 99
Uruguay 99
Ecuador 99
Trinidad and Tobago 98
Saint Lucia 98
Dominican Republic 98
Brazil 97
Jamaica 97
Colombia 96
Belize 96
Venezuela (Bolivarian Republic of) 95
Costa Rica 94
Dominica 94
Mexico 94
Panama 91
Suriname 90
El Salvador 84
Guyana 83
Paraguay 77
Nicaragua 74
Peru 73
Honduras 67
Bolivia 66
Guatemala 41
Haiti 26
Kuwait 100
Libyan Arab Jamahiriya 100
Qatar 100
United Arab Emirates 100
Jordan 99
Bahrain 99
Lebanon 98
Oman 98
Iran (Islamic Republic of) 97
Saudi Arabia 96
Syrian Arab Republic 93
Djibouti 93
Tunisia 90
Iraq 89
Egypt 79
Morocco 63
Sudan 49
Pakistan 39
Yemen 36
Somalia 33
Afghanistan 14
Albania 100
Belarus 100
Cyprus 100
Germany 100
Ireland 100
Latvia 100
Lithuania 100
Luxembourg 100
Malta 100
Netherlands 100
Switzerland 100
Turkmenistan 100
Croatia 100
Czech Republic 100
Finland 100
Kazakhstan 100
Poland 100
Portugal 100
Slovenia 100
Uzbekistan 100
Estonia 100
Hungary 100
Bosnia and Herzegovina 100
Republic of Moldova 100
Russian Federation 100
Slovakia 100
Bulgaria 99
Italy 99
Serbia 99
Romania 99
Montenegro 99
Ukraine 99
The former Yugoslav Republic of Macedonia 98
Armenia 98
Kyrgyzstan 98
Georgia 98
Azerbaijan 89
Tajikistan 83
Turkey 83
No data
Andorra …
Austria …
Belgium …
Denmark …
France …
Greece …
Iceland …
Israel …
Monaco …
Norway …
San Marino …
Spain …
Sweden …
United Kingdom …
Cook Islands 100
Malaysia 100
Niue 100
Palau 100
Republic of Korea 100
Samoa 100
Tuvalu 100
Japan 100
Brunei Darussalam 100
Singapore 100
Australia 99
Mongolia 99
Tonga 99
Fiji 99
China 98
Nauru 97
Marshall Islands 95
New Zealand 94
Vanuatu 93
Kiribati 90
Micronesia (Federated States of) 88
Viet Nam 88
Philippines 60
Cambodia 44
Solomon Islands 43
Papua New Guinea 39
Lao People's Democratic Republic 20
Sri Lanka 99
Thailand 97
Democratic People's Republic of Korea 97
Maldives 84
Indonesia 73
Myanmar 57
Bhutan 51
India 47
Timor-Leste 19
Nepal 19
Bangladesh 18
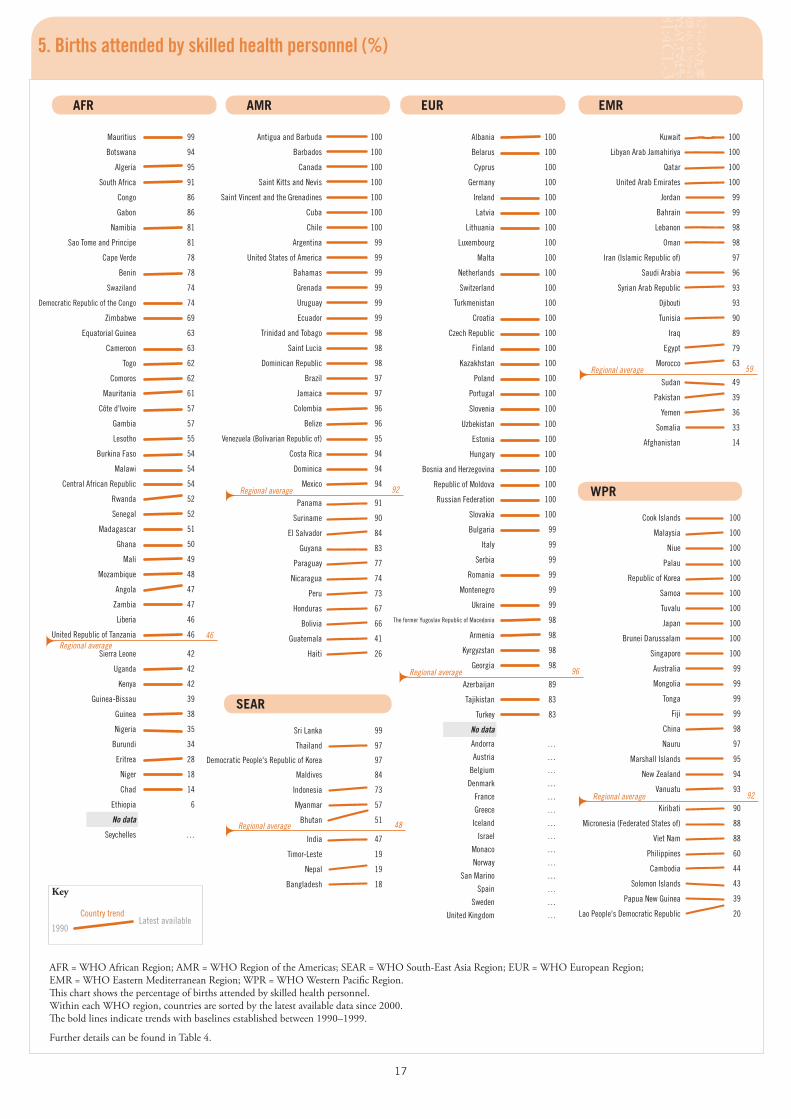
5. Births attended by skilled health personnel (%)
Regional average 59
Regional average 96
Regional average 92
Regional average 92
Regional average 48
Regional average46
AFR = WHO African Region; AMR = WHO Region of the Americas; SEAR = WHO South-East Asia Region; EUR = WHO European Region; EMR = WHO Eastern Mediterranean Region; WPR = WHO Western Pacific Region. This chart shows the percentage of births attended by skilled health personnel. Within each WHO region, countries are sorted by the latest available data since 2000. The bold lines indicate trends with baselines established between 1990–1999.
Further details can be found in Table 4.
Key
Latest available1990
Country trend
18
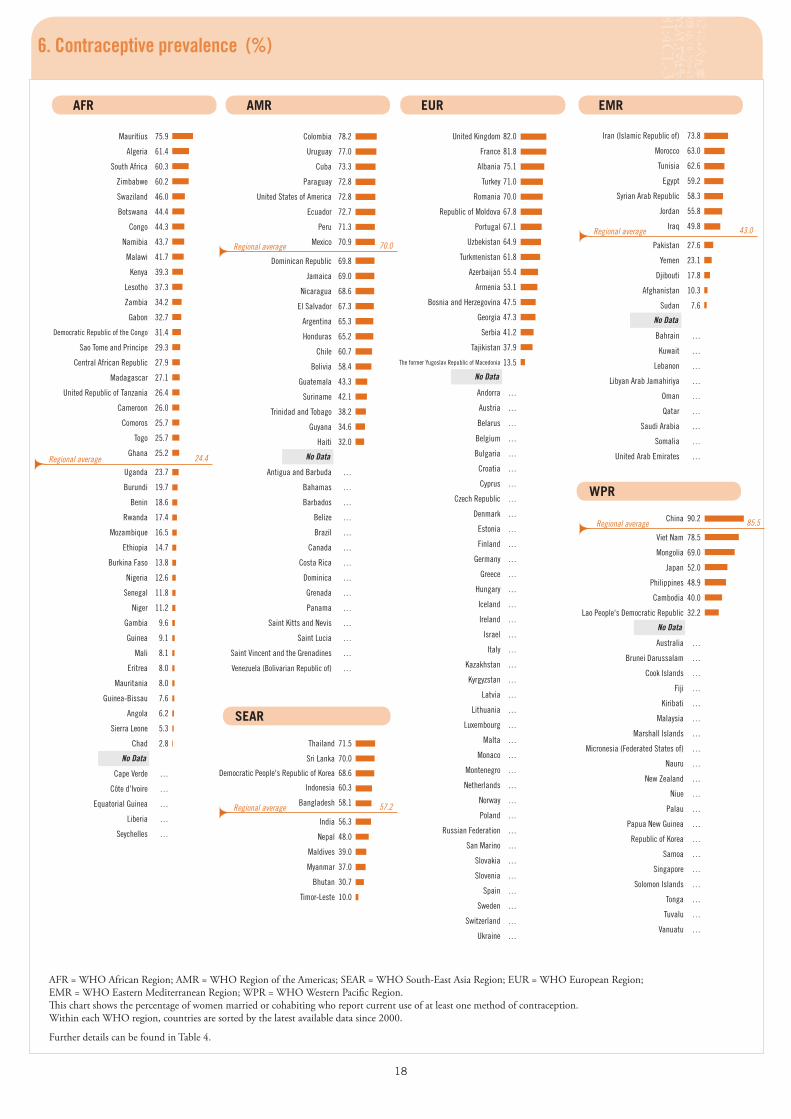
Colombia 78.2
Uruguay 77.0
Cuba 73.3
Paraguay 72.8
United States of America 72.8
Ecuador 72.7
Peru 71.3
Mexico 70.9
Dominican Republic 69.8
Jamaica 69.0
Nicaragua 68.6
El Salvador 67.3
Argentina 65.3
Honduras 65.2
Chile 60.7
Bolivia 58.4
Guatemala 43.3
Suriname 42.1
Trinidad and Tobago 38.2
Guyana 34.6
Haiti 32.0
Antigua and Barbuda …
Bahamas …
Barbados …
Belize …
Brazil …
Canada …
Costa Rica …
Dominica …
Grenada …
Panama …
Saint Kitts and Nevis …
Saint Lucia …
Saint Vincent and the Grenadines …
Venezuela (Bolivarian Republic of) …
No Data
6. Contraceptive prevalence (%)
AFR = WHO African Region; AMR = WHO Region of the Americas; SEAR = WHO South-East Asia Region; EUR = WHO European Region; EMR = WHO Eastern Mediterranean Region; WPR = WHO Western Pacific Region. This chart shows the percentage of women married or cohabiting who report current use of at least one method of contraception. Within each WHO region, countries are sorted by the latest available data since 2000.
Further details can be found in Table 4.
Thailand 71.5
Sri Lanka 70.0
Democratic People's Republic of Korea 68.6
Indonesia 60.3
Bangladesh 58.1
India 56.3
Nepal 48.0
Maldives 39.0
Myanmar 37.0
Bhutan 30.7
Timor-Leste 10.0
Regional average 24.4
Regional average 70.0
Regional average 57.2
Regional average 43.0
Regional average 85.5
Mauritius 75.9
Algeria 61.4
South Africa 60.3
Zimbabwe 60.2
Swaziland 46.0
Botswana 44.4
Congo 44.3
Namibia 43.7
Malawi 41.7
Kenya 39.3
Lesotho 37.3
Zambia 34.2
Gabon 32.7
Democratic Republic of the Congo 31.4
Sao Tome and Principe 29.3
Central African Republic 27.9
Madagascar 27.1
United Republic of Tanzania 26.4
Cameroon 26.0
Comoros 25.7
Togo 25.7
Ghana 25.2
Uganda 23.7
Burundi 19.7
Benin 18.6
Rwanda 17.4
Mozambique 16.5
Ethiopia 14.7
Burkina Faso 13.8
Nigeria 12.6
Senegal 11.8
Niger 11.2
Gambia 9.6
Guinea 9.1
Mali 8.1
Eritrea 8.0
Mauritania 8.0
Guinea-Bissau 7.6
Angola 6.2
Sierra Leone 5.3
Chad 2.8
Cape Verde …
Côte d'Ivoire …
Equatorial Guinea …
Liberia …
Seychelles …
No Data
China 90.2
Viet Nam 78.5
Mongolia 69.0
Japan 52.0
Philippines 48.9
Cambodia 40.0
Lao People's Democratic Republic 32.2
Australia …
Brunei Darussalam …
Cook Islands …
Fiji …
Kiribati …
Malaysia …
Marshall Islands …
Micronesia (Federated States of) …
Nauru …
New Zealand …
Niue …
Palau …
Papua New Guinea …
Republic of Korea …
Samoa …
Singapore …
Solomon Islands …
Tonga …
Tuvalu …
Vanuatu …
No Data
United Kingdom 82.0
France 81.8
Albania 75.1
Turkey 71.0
Romania 70.0
Republic of Moldova 67.8
Portugal 67.1
Uzbekistan 64.9
Turkmenistan 61.8
Azerbaijan 55.4
Armenia 53.1
Bosnia and Herzegovina 47.5
Georgia 47.3
Serbia 41.2
Tajikistan 37.9
The former Yugoslav Republic of Macedonia 13.5
Andorra …
Austria …
Belarus …
Belgium …
Bulgaria …
Croatia …
Cyprus …
Czech Republic …
Denmark …
Estonia …
Finland …
Germany …
Greece …
Hungary …
Iceland …
Ireland …
Israel …
Italy …
Kazakhstan …
Kyrgyzstan …
Latvia …
Lithuania …
Luxembourg …
Malta …
Monaco …
Montenegro …
Netherlands …
Norway …
Poland …
Russian Federation …
San Marino …
Slovakia …
Slovenia …
Spain …
Sweden …
Switzerland …
Ukraine …
No Data
Iran (Islamic Republic of) 73.8
Morocco 63.0
Tunisia 62.6
Egypt 59.2
Syrian Arab Republic 58.3
Jordan 55.8
Iraq 49.8
Pakistan 27.6
Yemen 23.1
Djibouti 17.8
Afghanistan 10.3
Sudan 7.6
Bahrain …
Kuwait …
Lebanon …
Libyan Arab Jamahiriya …
Oman …
Qatar …
Saudi Arabia …
Somalia …
United Arab Emirates …
No Data
19
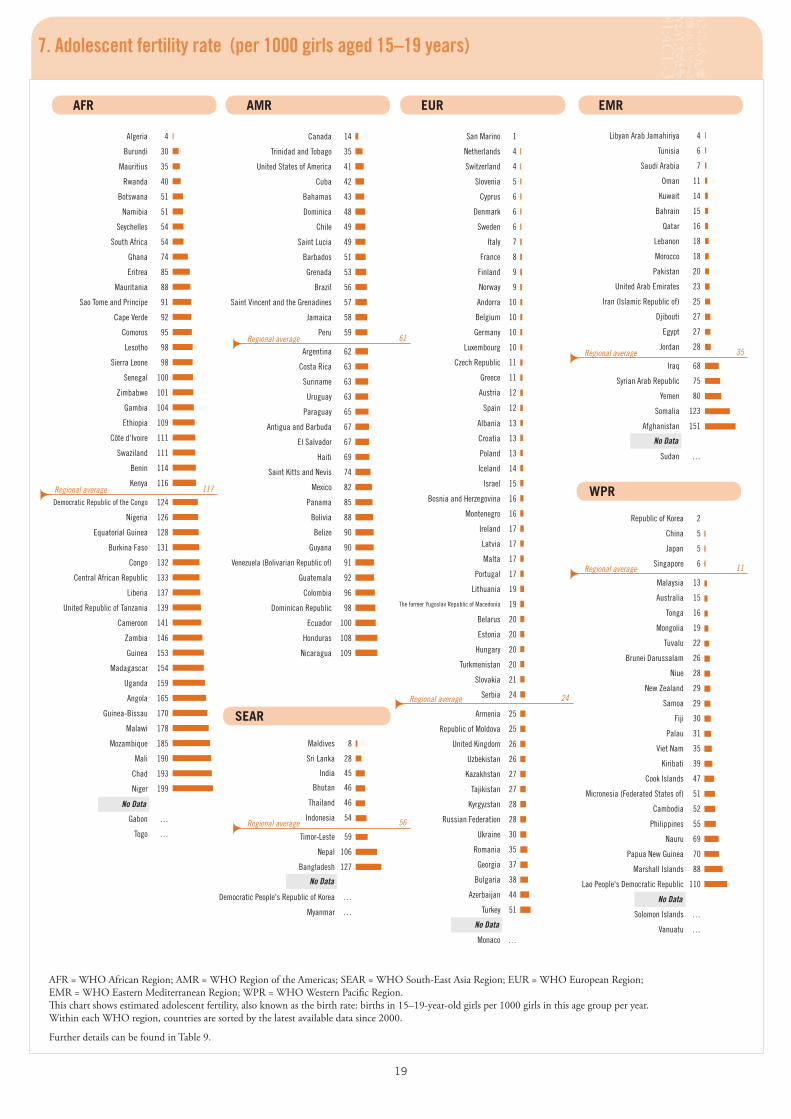
7. Adolescent fertility rate (per 1000 girls aged 15–19 years)
AFR = WHO African Region; AMR = WHO Region of the Americas; SEAR = WHO South-East Asia Region; EUR = WHO European Region; EMR = WHO Eastern Mediterranean Region; WPR = WHO Western Pacific Region. This chart shows estimated adolescent fertility, also known as the birth rate: births in 15–19-year-old girls per 1000 girls in this age group per year. Within each WHO region, countries are sorted by the latest available data since 2000.
Further details can be found in Table 9.
Canada 14
Trinidad and Tobago 35
United States of America 41
Cuba 42
Bahamas 43
Dominica 48
Chile 49
Saint Lucia 49
Barbados 51
Grenada 53
Brazil 56
Saint Vincent and the Grenadines 57
Jamaica 58
Peru 59
Argentina 62
Costa Rica 63
Suriname 63
Uruguay 63
Paraguay 65
Antigua and Barbuda 67
El Salvador 67
Haiti 69
Saint Kitts and Nevis 74
Mexico 82
Panama 85
Bolivia 88
Belize 90
Guyana 90
Venezuela (Bolivarian Republic of) 91
Guatemala 92
Colombia 96
Dominican Republic 98
Ecuador 100
Honduras 108
Nicaragua 109
Regional average 117
Regional average 56
Regional average 61
Regional average 24
Regional average 11
Regional average 35
Maldives 8
Sri Lanka 28
India 45
Bhutan 46
Thailand 46
Indonesia 54
Timor-Leste 59
Nepal 106
Bangladesh 127
Democratic People's Republic of Korea …
Myanmar …
No Data
Algeria 4
Burundi 30
Mauritius 35
Rwanda 40
Botswana 51
Namibia 51
Seychelles 54
South Africa 54
Ghana 74
Eritrea 85
Mauritania 88
Sao Tome and Principe 91
Cape Verde 92
Comoros 95
Lesotho 98
Sierra Leone 98
Senegal 100
Zimbabwe 101
Gambia 104
Ethiopia 109
Côte d'Ivoire 111
Swaziland 111
Benin 114
Kenya 116
Democratic Republic of the Congo 124
Nigeria 126
Equatorial Guinea 128
Burkina Faso 131
Congo 132
Central African Republic 133
Liberia 137
United Republic of Tanzania 139
Cameroon 141
Zambia 146
Guinea 153
Madagascar 154
Uganda 159
Angola 165
Guinea-Bissau 170
Malawi 178
Mozambique 185
Mali 190
Chad 193
Niger 199
Gabon …
Togo …
No Data
San Marino 1
Netherlands 4
Switzerland 4
Slovenia 5
Cyprus 6
Denmark 6
Sweden 6
Italy 7
France 8
Finland 9
Norway 9
Andorra 10
Belgium 10
Germany 10
Luxembourg 10
Czech Republic 11
Greece 11
Austria 12
Spain 12
Albania 13
Croatia 13
Poland 13
Iceland 14
Israel 15
Bosnia and Herzegovina 16
Montenegro 16
Ireland 17
Latvia 17
Malta 17
Portugal 17
Lithuania 19
The former Yugoslav Republic of Macedonia 19
Belarus 20
Estonia 20
Hungary 20
Turkmenistan 20
Slovakia 21
Serbia 24
Armenia 25
Republic of Moldova 25
United Kingdom 26
Uzbekistan 26
Kazakhstan 27
Tajikistan 27
Kyrgyzstan 28
Russian Federation 28
Ukraine 30
Romania 35
Georgia 37
Bulgaria 38
Azerbaijan 44
Turkey 51
Monaco …
No Data
Republic of Korea 2
China 5
Japan 5
Singapore 6
Malaysia 13
Australia 15
Tonga 16
Mongolia 19
Tuvalu 22
Brunei Darussalam 26
Niue 28
New Zealand 29
Samoa 29
Fiji 30
Palau 31
Viet Nam 35
Kiribati 39
Cook Islands 47
Micronesia (Federated States of) 51
Cambodia 52
Philippines 55
Nauru 69
Papua New Guinea 70
Marshall Islands 88
Lao People's Democratic Republic 110
Solomon Islands …
Vanuatu …
No Data
Libyan Arab Jamahiriya 4
Tunisia 6
Saudi Arabia 7
Oman 11
Kuwait 14
Bahrain 15
Qatar 16
Lebanon 18
Morocco 18
Pakistan 20
United Arab Emirates 23
Iran (Islamic Republic of) 25
Djibouti 27
Egypt 27
Jordan 28
Iraq 68
Syrian Arab Republic 75
Yemen 80
Somalia 123
Afghanistan 151
Sudan …
No Data
20
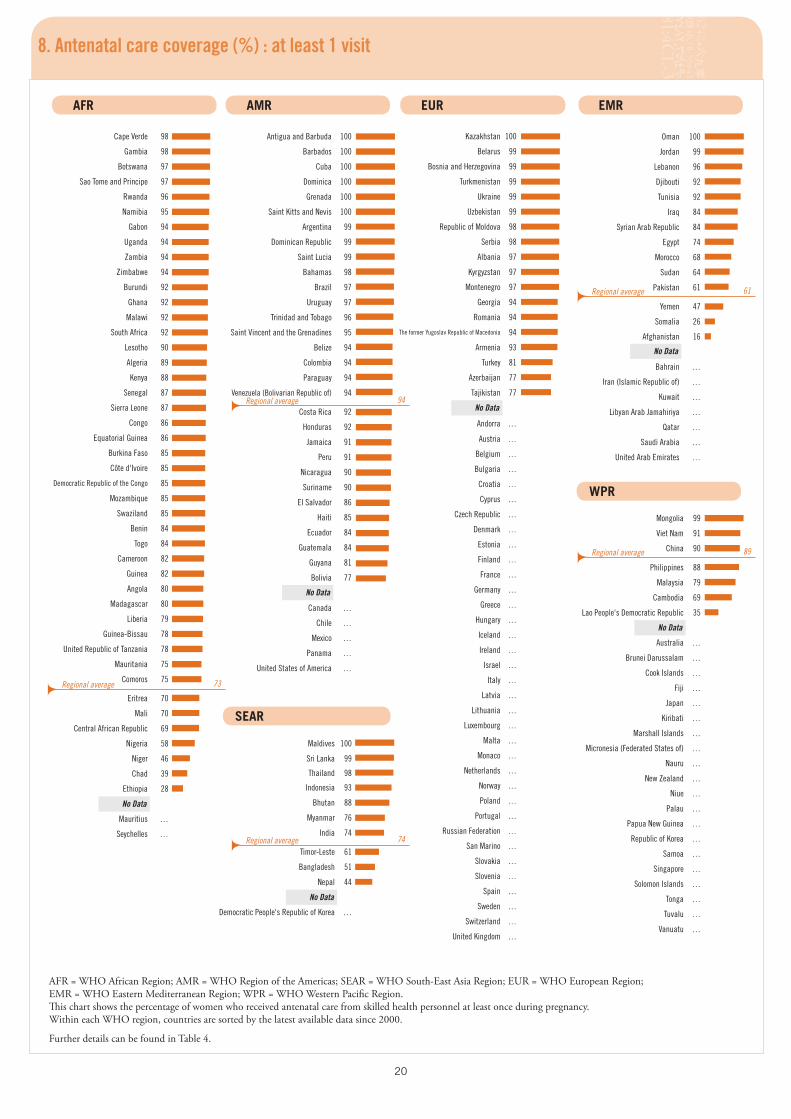
Maldives 100
Sri Lanka 99
Thailand 98
Indonesia 93
Bhutan 88
Myanmar 76
India 74
Timor-Leste 61
Bangladesh 51
Nepal 44
Democratic People's Republic of Korea …
No Data
Cape Verde 98
Gambia 98
Botswana 97
Sao Tome and Principe 97
Rwanda 96
Namibia 95
Gabon 94
Uganda 94
Zambia 94
Zimbabwe 94
Burundi 92
Ghana 92
Malawi 92
South Africa 92
Lesotho 90
Algeria 89
Kenya 88
Senegal 87
Sierra Leone 87
Congo 86
Equatorial Guinea 86
Burkina Faso 85
Côte d'Ivoire 85
Democratic Republic of the Congo 85
Mozambique 85
Swaziland 85
Benin 84
Togo 84
Cameroon 82
Guinea 82
Angola 80
Madagascar 80
Liberia 79
Guinea-Bissau 78
United Republic of Tanzania 78
Mauritania 75
Comoros 75
Eritrea 70
Mali 70
Central African Republic 69
Nigeria 58
Niger 46
Chad 39
Ethiopia 28
Mauritius …
Seychelles …
No Data
8. Antenatal care coverage (%) : at least 1 visit
AFR = WHO African Region; AMR = WHO Region of the Americas; SEAR = WHO South-East Asia Region; EUR = WHO European Region; EMR = WHO Eastern Mediterranean Region; WPR = WHO Western Pacific Region. This chart shows the percentage of women who received antenatal care from skilled health personnel at least once during pregnancy. Within each WHO region, countries are sorted by the latest available data since 2000.
Further details can be found in Table 4.
Regional average 73
Regional average 61
Regional average 89
Antigua and Barbuda 100
Barbados 100
Cuba 100
Dominica 100
Grenada 100
Saint Kitts and Nevis 100
Argentina 99
Dominican Republic 99
Saint Lucia 99
Bahamas 98
Brazil 97
Uruguay 97
Trinidad and Tobago 96
Saint Vincent and the Grenadines 95
Belize 94
Colombia 94
Paraguay 94
Venezuela (Bolivarian Republic of) 94
Costa Rica 92
Honduras 92
Jamaica 91
Peru 91
Nicaragua 90
Suriname 90
El Salvador 86
Haiti 85
Ecuador 84
Guatemala 84
Guyana 81
Bolivia 77
Canada …
Chile …
Mexico …
Panama …
United States of America …
No Data
Kazakhstan 100
Belarus 99
Bosnia and Herzegovina 99
Turkmenistan 99
Ukraine 99
Uzbekistan 99
Republic of Moldova 98
Serbia 98
Albania 97
Kyrgyzstan 97
Montenegro 97
Georgia 94
Romania 94
The former Yugoslav Republic of Macedonia 94
Armenia 93
Turkey 81
Azerbaijan 77
Tajikistan 77
Andorra …
Austria …
Belgium …
Bulgaria …
Croatia …
Cyprus …
Czech Republic …
Denmark …
Estonia …
Finland …
France …
Germany …
Greece …
Hungary …
Iceland …
Ireland …
Israel …
Italy …
Latvia …
Lithuania …
Luxembourg …
Malta …
Monaco …
Netherlands …
Norway …
Poland …
Portugal …
Russian Federation …
San Marino …
Slovakia …
Slovenia …
Spain …
Sweden …
Switzerland …
United Kingdom …
No Data
Oman 100
Jordan 99
Lebanon 96
Djibouti 92
Tunisia 92
Iraq 84
Syrian Arab Republic 84
Egypt 74
Morocco 68
Sudan 64
Pakistan 61
Yemen 47
Somalia 26
Afghanistan 16
Bahrain …
Iran (Islamic Republic of) …
Kuwait …
Libyan Arab Jamahiriya …
Qatar …
Saudi Arabia …
United Arab Emirates …
No Data
Mongolia 99
Viet Nam 91
China 90
Philippines 88
Malaysia 79
Cambodia 69
Lao People's Democratic Republic 35
Australia …
Brunei Darussalam …
Cook Islands …
Fiji …
Japan …
Kiribati …
Marshall Islands …
Micronesia (Federated States of) …
Nauru …
New Zealand …
Niue …
Palau …
Papua New Guinea …
Republic of Korea …
Samoa …
Singapore …
Solomon Islands …
Tonga …
Tuvalu …
Vanuatu …
No Data
Regional average 74
Regional average 94
21
Maldives 37.0
Nepal 24.6
Myanmar 19.1
India 12.8
Bangladesh 11.3
Indonesia 8.6
Sri Lanka 8.0
Timor-Leste 3.8
Bhutan …
Democratic People's Republic of Korea …
Thailand …
No Data
9. Unmet need for family planning (%)
AFR = WHO African Region; AMR = WHO Region of the Americas; SEAR = WHO South-East Asia Region; EUR = WHO European Region; EMR = WHO Eastern Mediterranean Region; WPR = WHO Western Pacific Region. This chart shows the percentage of women who are fertile and sexually active but report that they are not using any method of contraception. Within each WHO region, countries are sorted by the latest available data since 2000 .
Further details can be found in Table 4.
Regional average 24.4
Regional average 12.4
Lao People's Democratic Republic 39.5
Cambodia 25.1
Philippines 17.3
Viet Nam 4.8
Mongolia 4.6
Australia …
Brunei Darussalam …
China …
Cook Islands …
Fiji …
Japan …
Kiribati …
Malaysia …
Marshall Islands …
Micronesia (Federated States of) …
Nauru …
New Zealand …
Niue …
Palau …
Papua New Guinea …
Republic of Korea …
Samoa …
Singapore …
Solomon Islands …
Tonga …
Tuvalu …
Vanuatu …
No Data
Yemen 50.9
Syrian Arab Republic 30.6
Djibouti 26.3
Tunisia 12.1
Jordan 11.0
Egypt 10.3
Morocco 10.0
Afghanistan …
Bahrain …
Iran (Islamic Republic of) …
Iraq …
Kuwait …
Lebanon …
Libyan Arab Jamahiriya …
Oman …
Pakistan …
Qatar …
Saudi Arabia …
Somalia …
Sudan …
United Arab Emirates …
No Data
Georgia 16.4
Armenia 13.3
Romania 11.9
Azerbaijan 11.5
Turkmenistan 10.1
Republic of Moldova 6.7
Turkey 6.0
France 3.2
Albania 1.2
Andorra …
Austria …
Belarus …
Belgium …
Bosnia and Herzegovina …
Bulgaria …
Croatia …
Cyprus …
Czech Republic …
Denmark …
Estonia …
Finland …
Germany …
Greece …
Hungary …
Iceland …
Ireland …
Israel …
Italy …
Kazakhstan …
Kyrgyzstan …
Latvia …
Lithuania …
Luxembourg …
Malta …
Monaco …
Montenegro …
Netherlands …
Norway …
Poland …
Portugal …
Russian Federation …
San Marino …
Serbia …
Slovakia …
Slovenia …
Spain …
Sweden …
Switzerland …
Tajikistan …
The former Yugoslav Republic of Macedonia …
Ukraine …
United Kingdom …
Uzbekistan …
No Data
Haiti 37.5
Bolivia 22.7
Honduras 16.9
Nicaragua 14.6
Dominican Republic 10.9
El Salvador 8.9
Peru 8.1
Paraguay 6.6
Colombia 5.8
Ecuador 5.0
Antigua and Barbuda …
Argentina …
Bahamas …
Barbados …
Belize …
Brazil …
Canada …
Chile …
Costa Rica …
Cuba …
Dominica …
Grenada …
Guatemala …
Guyana …
Jamaica …
Mexico …
Panama …
Saint Kitts and Nevis …
Saint Lucia …
Saint Vincent and the Grenadines …
Suriname …
Trinidad and Tobago …
United States of America …
Uruguay …
Venezuela (Bolivarian Republic of) …
No Data
Uganda 40.6
Rwanda 37.9
Ghana 34.0
Ethiopia 33.8
Mauritania 31.6
Senegal 31.6
Lesotho 30.9
Burundi 29.4
Burkina Faso 28.8
Mali 28.5
Gabon 28.0
Malawi 27.6
Zambia 27.4
Benin 27.2
Eritrea 27.0
Namibia 25.1
Algeria 24.6
Kenya 24.5
Madagascar 23.6
Chad 23.3
United Republic of Tanzania 21.8
Guinea 21.2
Cameroon 20.2
Mozambique 18.4
Nigeria 16.9
Congo 16.2
Niger 15.8
Zimbabwe 12.8
Mauritius 3.3
Angola …
Botswana …
Cape Verde …
Central African Republic …
Comoros …
Côte d'Ivoire …
Democratic Republic of the Congo …
Equatorial Guinea …
Gambia …
Guinea-Bissau …
Liberia …
Sao Tome and Principe …
Seychelles …
Sierra Leone …
South Africa …
Swaziland …
Togo …
No Data
22
Japan 9
Philippines 14
Republic of Korea 33
New Zealand 42
Mongolia <52
China 65
Australia 107
Singapore 113
Lao People's Democratic Republic 149
Malaysia 428
Viet Nam 446
Cambodia 755
Papua New Guinea 1 395
Brunei Darussalam …
Cook Islands …
Fiji …
Kiribati …
Marshall Islands …
Micronesia (Federated States of) …
Nauru …
Niue …
Palau …
Samoa …
Solomon Islands …
Tonga …
Tuvalu …
Vanuatu …
Egypt 18
Tunisia 46
Pakistan 89
Morocco 95
Lebanon 101
Iran (Islamic Republic of) 163
Somalia 495
Sudan 1 253
Djibouti 2 870
Afghanistan …
Bahrain …
Iraq …
Jordan …
Kuwait …
Libyan Arab Jamahiriya …
Oman …
Qatar …
Saudi Arabia …
Syrian Arab Republic …
United Arab Emirates …
Yemen …
No Data
Slovakia <11
Turkmenistan <14
Czech Republic 17
Slovenia <29
The former Yugoslav Republic of Macedonia <30
Hungary 39
Finland 55
Malta 59
Poland 59
Germany 73
Georgia 75
Lithuania 77
Romania 77
Norway 79
Serbia 79
Sweden 82
Uzbekistan 85
Israel 98
Armenia 99
Kazakhstan 102
Denmark 108
Kyrgyzstan 113
Greece 115
Azerbaijan 120
Netherlands 134
Austria 138
United Kingdom 154
Belarus 158
Ireland 161
Belgium 172
Iceland <212
Tajikistan 239
France 278
Republic of Moldova 286
Italy 296
Spain 370
Portugal 379
Switzerland 398
Latvia 509
Russian Federation 774
Estonia 871
Ukraine 1 082
Albania …
Andorra …
Bosnia and Herzegovina …
Bulgaria …
Croatia …
Cyprus …
Luxembourg …
Monaco …
Montenegro …
San Marino …
Turkey …
No Data
Bangladesh 11
Sri Lanka 25
Bhutan <109
Indonesia 161
India 290
Nepal 389
Myanmar 667
Thailand 1 191
Democratic People's Republic of Korea …
Maldives …
Timor-Leste …
No Data
Cuba 67
Bolivia 132
Nicaragua 211
Chile 244
Mexico 267
Canada 268
Ecuador 275
Costa Rica 295
Peru 382
Uruguay 391
Argentina 409
United States of America 452
Colombia 490
Paraguay 501
Brazil 510
Honduras 598
Guatemala 691
El Salvador 743
Panama 810
Dominican Republic 902
Barbados 914
Trinidad and Tobago 1 240
Jamaica 1 386
Haiti 1 823
Belize 1 863
Suriname 2 066
Guyana 2 360
Bahamas 2 508
Antigua and Barbuda …
Dominica …
Grenada …
Saint Kitts and Nevis …
Saint Lucia …
Saint Vincent and the Grenadines …
Venezuela (Bolivarian Republic of) …
No Data
Comoros <41
Algeria 87
Madagascar 116
Gambia 741
Mauritania 744
Niger 757
Senegal 886
Benin 1 161
Eritrea 1 264
Mauritius 1 348
Mali 1 437
Burkina Faso 1 498
Guinea 1 520
Sierra Leone 1 523
Liberia 1 615
Guinea-Bissau 1 692
Ghana 1 722
Burundi 1 903
Ethiopia 1 907
Angola 1 962
Rwanda 2 342
Nigeria 2 886
Chad 3 102
Togo 3 184
Congo 3 330
Equatorial Guinea 3 343
Côte d'Ivoire 3 697
Cameroon 4 580
Uganda 5 155
Gabon 5 308
Central African Republic 5 582
United Republic of Tanzania 5 771
Malawi 11 367
Mozambique 11 761
Namibia 13 885
Zimbabwe 14 609
Zambia 15 087
South Africa 16 293
Lesotho 21 548
Botswana 22 757
Swaziland 24 301
Cape Verde …
Democratic Republic of the Congo …
Kenya …
Sao Tome and Principe …
Seychelles …
No Data
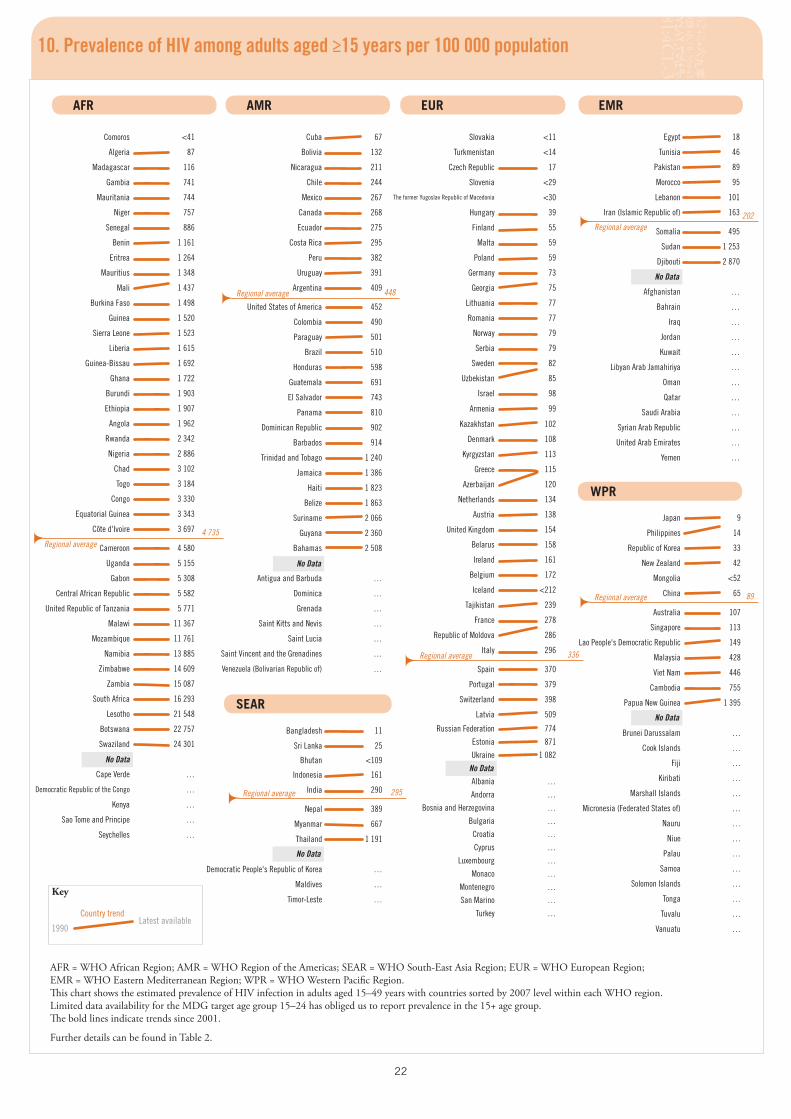
10. Prevalence of HIV among adults aged ≥15 years per 100 000 population
AFR = WHO African Region; AMR = WHO Region of the Americas; SEAR = WHO South-East Asia Region; EUR = WHO European Region; EMR = WHO Eastern Mediterranean Region; WPR = WHO Western Pacific Region. This chart shows the estimated prevalence of HIV infection in adults aged 15–49 years with countries sorted by 2007 level within each WHO region. Limited data availability for the MDG target age group 15–24 has obliged us to report prevalence in the 15+ age group. The bold lines indicate trends since 2001.
Further details can be found in Table 2.
Key
Latest available1990
Country trend
Regional average4 735
Regional average 448
Regional average 295
Regional average 336
Regional average202
Regional average 89
No Data
23
Namibia 62
Rwanda 54
Swaziland 52
Kenya 47
Zimbabwe 46
United Republic of Tanzania 40
Uganda 38
Zambia 37
Cape Verde 36
Malawi 36
Benin 35
Congo 35
Cameroon 34
Ethiopia 33
Ghana 33
Mozambique 33
Côte d'Ivoire 28
Central African Republic 27
Senegal 26
Burkina Faso 23
Guinea 23
Mali 22
Democratic Republic of the Congo 21
Nigeria 21
Chad 19
Lesotho 19
Madagascar 16
Niger 16
Algeria …
Angola …
Botswana …
Burundi …
Comoros …
Equatorial Guinea …
Eritrea …
Gabon …
Gambia …
Guinea-Bissau …
Liberia …
Mauritania …
Mauritius …
Sao Tome and Principe …
Seychelles …
Sierra Leone …
South Africa …
Togo …
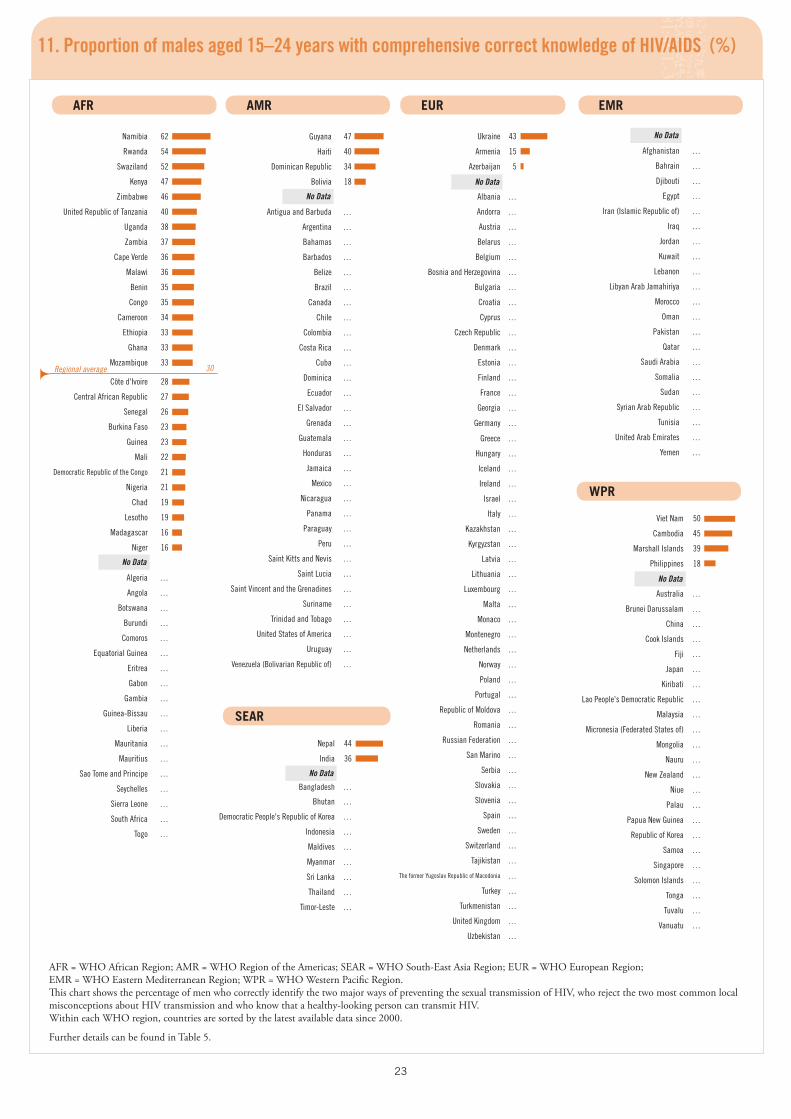
11. Proportion of males aged 15–24 years with comprehensive correct knowledge of HIV/AIDS (%)
AFR = WHO African Region; AMR = WHO Region of the Americas; SEAR = WHO South-East Asia Region; EUR = WHO European Region; EMR = WHO Eastern Mediterranean Region; WPR = WHO Western Pacific Region. This chart shows the percentage of men who correctly identify the two major ways of preventing the sexual transmission of HIV, who reject the two most common local misconceptions about HIV transmission and who know that a healthy-looking person can transmit HIV. Within each WHO region, countries are sorted by the latest available data since 2000.
Further details can be found in Table 5.
Regional average 30
No Data
Guyana 47
Haiti 40
Dominican Republic 34
Bolivia 18
Antigua and Barbuda …
Argentina …
Bahamas …
Barbados …
Belize …
Brazil …
Canada …
Chile …
Colombia …
Costa Rica …
Cuba …
Dominica …
Ecuador …
El Salvador …
Grenada …
Guatemala …
Honduras …
Jamaica …
Mexico …
Nicaragua …
Panama …
Paraguay …
Peru …
Saint Kitts and Nevis …
Saint Lucia …
Saint Vincent and the Grenadines …
Suriname …
Trinidad and Tobago …
United States of America …
Uruguay …
Venezuela (Bolivarian Republic of) …
No Data
Ukraine 43
Armenia 15
Azerbaijan 5
Albania …
Andorra …
Austria …
Belarus …
Belgium …
Bosnia and Herzegovina …
Bulgaria …
Croatia …
Cyprus …
Czech Republic …
Denmark …
Estonia …
Finland …
France …
Georgia …
Germany …
Greece …
Hungary …
Iceland …
Ireland …
Israel …
Italy …
Kazakhstan …
Kyrgyzstan …
Latvia …
Lithuania …
Luxembourg …
Malta …
Monaco …
Montenegro …
Netherlands …
Norway …
Poland …
Portugal …
Republic of Moldova …
Romania …
Russian Federation …
San Marino …
Serbia …
Slovakia …
Slovenia …
Spain …
Sweden …
Switzerland …
Tajikistan …
The former Yugoslav Republic of Macedonia …
Turkey …
Turkmenistan …
United Kingdom …
Uzbekistan …
No Data
Nepal 44
India 36
Bangladesh …
Bhutan …
Democratic People's Republic of Korea …
Indonesia …
Maldives …
Myanmar …
Sri Lanka …
Thailand …
Timor-Leste …
No Data
Viet Nam 50
Cambodia 45
Marshall Islands 39
Philippines 18
Australia …
Brunei Darussalam …
China …
Cook Islands …
Fiji …
Japan …
Kiribati …
Lao People's Democratic Republic …
Malaysia …
Micronesia (Federated States of) …
Mongolia …
Nauru …
New Zealand …
Niue …
Palau …
Papua New Guinea …
Republic of Korea …
Samoa …
Singapore …
Solomon Islands …
Tonga …
Tuvalu …
Vanuatu …
No Data
Afghanistan …
Bahrain …
Djibouti …
Egypt …
Iran (Islamic Republic of) …
Iraq …
Jordan …
Kuwait …
Lebanon …
Libyan Arab Jamahiriya …
Morocco …
Oman …
Pakistan …
Qatar …
Saudi Arabia …
Somalia …
Sudan …
Syrian Arab Republic …
Tunisia …
United Arab Emirates …
Yemen …
No Data
24
Thailand 46
Nepal 28
India 20
Bangladesh 16
Bhutan …
Democratic People's Republic of Korea …
Indonesia …
Maldives …
Myanmar …
Sri Lanka …
Timor-Leste …
No Data
Namibia 65
Swaziland 52
Rwanda 51
United Republic of Tanzania 45
Sao Tome and Principe 44
Zimbabwe 44
Gambia 39
Eritrea 37
Cape Verde 36
Kenya 34
Zambia 34
Uganda 32
Burundi 30
Togo 28
Cameroon 27
Lesotho 27
Congo 26
Ghana 25
Malawi 24
Senegal 21
Ethiopia 20
Mozambique 20
Madagascar 19
Comoros 18
Côte d'Ivoire 18
Guinea-Bissau 18
Mali 18
Nigeria 18
Central African Republic 17
Guinea 17
Sierra Leone 17
Benin 16
Burkina Faso 15
Democratic Republic of the Congo 15
Algeria 13
Niger 13
Chad 7
Equatorial Guinea 4
Angola …
Botswana …
Gabon …
Liberia …
Mauritania …
Mauritius …
Seychelles …
South Africa …
No Data
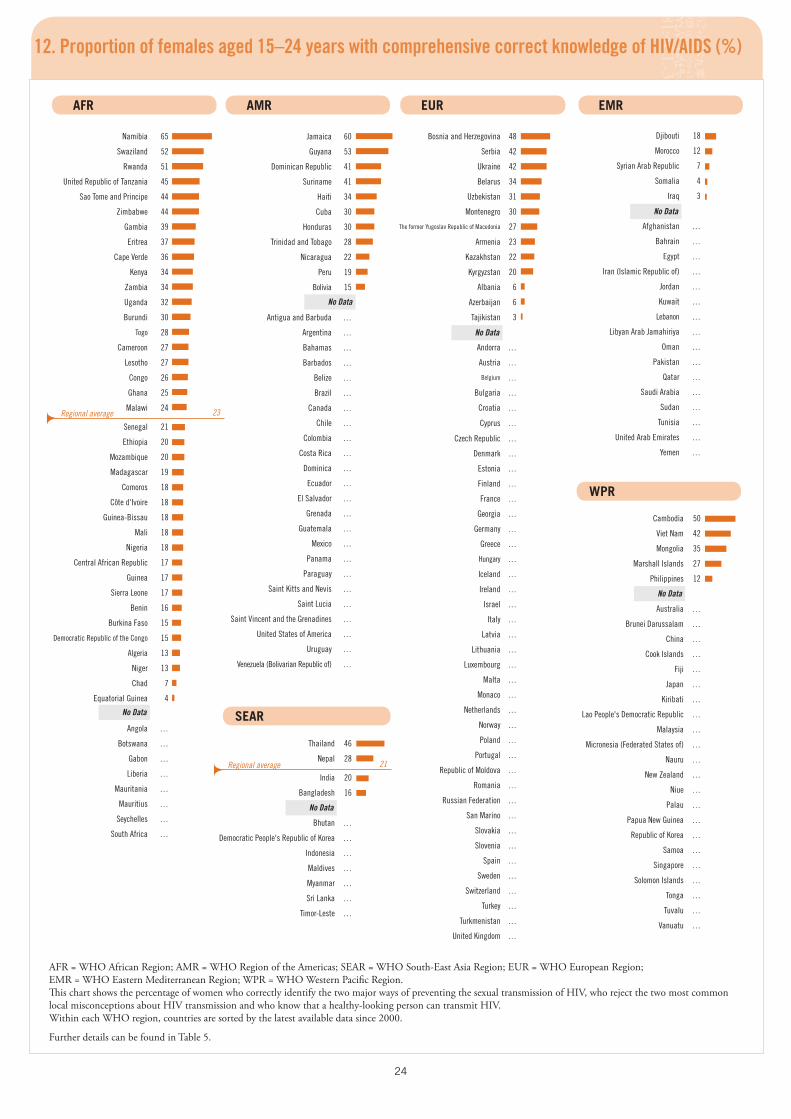
12. Proportion of females aged 15–24 years with comprehensive correct knowledge of HIV/AIDS (%)
AFR = WHO African Region; AMR = WHO Region of the Americas; SEAR = WHO South-East Asia Region; EUR = WHO European Region; EMR = WHO Eastern Mediterranean Region; WPR = WHO Western Pacific Region. This chart shows the percentage of women who correctly identify the two major ways of preventing the sexual transmission of HIV, who reject the two most common local misconceptions about HIV transmission and who know that a healthy-looking person can transmit HIV. Within each WHO region, countries are sorted by the latest available data since 2000.
Further details can be found in Table 5.
Cambodia 50
Viet Nam 42
Mongolia 35
Marshall Islands 27
Philippines 12
Australia …
Brunei Darussalam …
China …
Cook Islands …
Fiji …
Japan …
Kiribati …
Lao People's Democratic Republic …
Malaysia …
Micronesia (Federated States of) …
Nauru …
New Zealand …
Niue …
Palau …
Papua New Guinea …
Republic of Korea …
Samoa …
Singapore …
Solomon Islands …
Tonga …
Tuvalu …
Vanuatu …
Regional average 23
Regional average 21
Jamaica 60
Guyana 53
Dominican Republic 41
Suriname 41
Haiti 34
Cuba 30
Honduras 30
Trinidad and Tobago 28
Nicaragua 22
Peru 19
Bolivia 15
Antigua and Barbuda …
Argentina …
Bahamas …
Barbados …
Belize …
Brazil …
Canada …
Chile …
Colombia …
Costa Rica …
Dominica …
Ecuador …
El Salvador …
Grenada …
Guatemala …
Mexico …
Panama …
Paraguay …
Saint Kitts and Nevis …
Saint Lucia …
Saint Vincent and the Grenadines …
United States of America …
Uruguay …
Venezuela (Bolivarian Republic of) …
No Data
Bosnia and Herzegovina 48
Serbia 42
Ukraine 42
Belarus 34
Uzbekistan 31
Montenegro 30
The former Yugoslav Republic of Macedonia 27
Armenia 23
Kazakhstan 22
Kyrgyzstan 20
Albania 6
Azerbaijan 6
Tajikistan 3
Andorra …
Austria …
Belgium …
Bulgaria …
Croatia …
Cyprus …
Czech Republic …
Denmark …
Estonia …
Finland …
France …
Georgia …
Germany …
Greece …
Hungary …
Iceland …
Ireland …
Israel …
Italy …
Latvia …
Lithuania …
Luxembourg …
Malta …
Monaco …
Netherlands …
Norway …
Poland …
Portugal …
Republic of Moldova …
Romania …
Russian Federation …
San Marino …
Slovakia …
Slovenia …
Spain …
Sweden …
Switzerland …
Turkey …
Turkmenistan …
United Kingdom …
No Data
Djibouti 18
Morocco 12
Syrian Arab Republic 7
Somalia 4
Iraq 3
Afghanistan …
Bahrain …
Egypt …
Iran (Islamic Republic of) …
Jordan …
Kuwait …
Lebanon …
Libyan Arab Jamahiriya …
Oman …
Pakistan …
Qatar …
Saudi Arabia …
Sudan …
Tunisia …
United Arab Emirates …
Yemen …
No Data
No Data
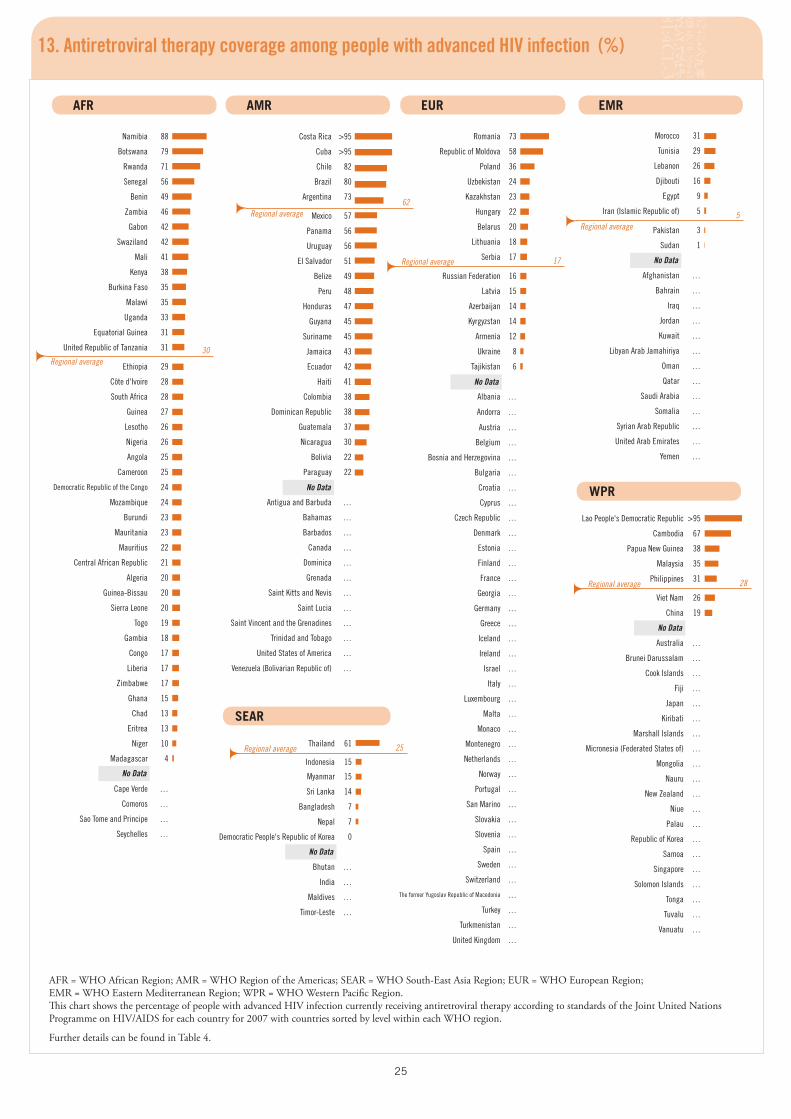
25
Costa Rica >95
Cuba >95
Chile 82
Brazil 80
Argentina 73
Mexico 57
Panama 56
Uruguay 56
El Salvador 51
Belize 49
Peru 48
Honduras 47
Guyana 45
Suriname 45
Jamaica 43
Ecuador 42
Haiti 41
Colombia 38
Dominican Republic 38
Guatemala 37
Nicaragua 30
Bolivia 22
Paraguay 22
Antigua and Barbuda …
Bahamas …
Barbados …
Canada …
Dominica …
Grenada …
Saint Kitts and Nevis …
Saint Lucia …
Saint Vincent and the Grenadines …
Trinidad and Tobago …
United States of America …
Venezuela (Bolivarian Republic of) …
No Data
Namibia 88
Botswana 79
Rwanda 71
Senegal 56
Benin 49
Zambia 46
Gabon 42
Swaziland 42
Mali 41
Kenya 38
Burkina Faso 35
Malawi 35
Uganda 33
Equatorial Guinea 31
United Republic of Tanzania 31
Ethiopia 29
Côte d'Ivoire 28
South Africa 28
Guinea 27
Lesotho 26
Nigeria 26
Angola 25
Cameroon 25
Democratic Republic of the Congo 24
Mozambique 24
Burundi 23
Mauritania 23
Mauritius 22
Central African Republic 21
Algeria 20
Guinea-Bissau 20
Sierra Leone 20
Togo 19
Gambia 18
Congo 17
Liberia 17
Zimbabwe 17
Ghana 15
Chad 13
Eritrea 13
Niger 10
Madagascar 4
Cape Verde …
Comoros …
Sao Tome and Principe …
Seychelles …
No Data
Morocco 31
Tunisia 29
Lebanon 26
Djibouti 16
Egypt 9
Iran (Islamic Republic of) 5
Pakistan 3
Sudan 1
Afghanistan …
Bahrain …
Iraq …
Jordan …
Kuwait …
Libyan Arab Jamahiriya …
Oman …
Qatar …
Saudi Arabia …
Somalia …
Syrian Arab Republic …
United Arab Emirates …
Yemen …
No Data
Romania 73
Republic of Moldova 58
Poland 36
Uzbekistan 24
Kazakhstan 23
Hungary 22
Belarus 20
Lithuania 18
Serbia 17
Russian Federation 16
Latvia 15
Azerbaijan 14
Kyrgyzstan 14
Armenia 12
Ukraine 8
Tajikistan 6
Albania …
Andorra …
Austria …
Belgium …
Bosnia and Herzegovina …
Bulgaria …
Croatia …
Cyprus …
Czech Republic …
Denmark …
Estonia …
Finland …
France …
Georgia …
Germany …
Greece …
Iceland …
Ireland …
Israel …
Italy …
Luxembourg …
Malta …
Monaco …
Montenegro …
Netherlands …
Norway …
Portugal …
San Marino …
Slovakia …
Slovenia …
Spain …
Sweden …
Switzerland …
The former Yugoslav Republic of Macedonia …
Turkey …
Turkmenistan …
United Kingdom …
No Data
Lao People's Democratic Republic >95
Cambodia 67
Papua New Guinea 38
Malaysia 35
Philippines 31
Viet Nam 26
China 19
Australia …
Brunei Darussalam …
Cook Islands …
Fiji …
Japan …
Kiribati …
Marshall Islands …
Micronesia (Federated States of) …
Mongolia …
Nauru …
New Zealand …
Niue …
Palau …
Republic of Korea …
Samoa …
Singapore …
Solomon Islands …
Tonga …
Tuvalu …
Vanuatu …
No Data
13. Antiretroviral therapy coverage among people with advanced HIV infection (%)
AFR = WHO African Region; AMR = WHO Region of the Americas; SEAR = WHO South-East Asia Region; EUR = WHO European Region; EMR = WHO Eastern Mediterranean Region; WPR = WHO Western Pacific Region. This chart shows the percentage of people with advanced HIV infection currently receiving antiretroviral therapy according to standards of the Joint United Nations Programme on HIV/AIDS for each country for 2007 with countries sorted by level within each WHO region.
Further details can be found in Table 4.
Regional average30
Regional average62
Regional average 17
Regional average5
Regional average 28
Thailand 61
Indonesia 15
Myanmar 15
Sri Lanka 14
Bangladesh 7
Nepal 7
Democratic People's Republic of Korea 0
Bhutan …
India …
Maldives …
Timor-Leste …
No Data
Regional average 25
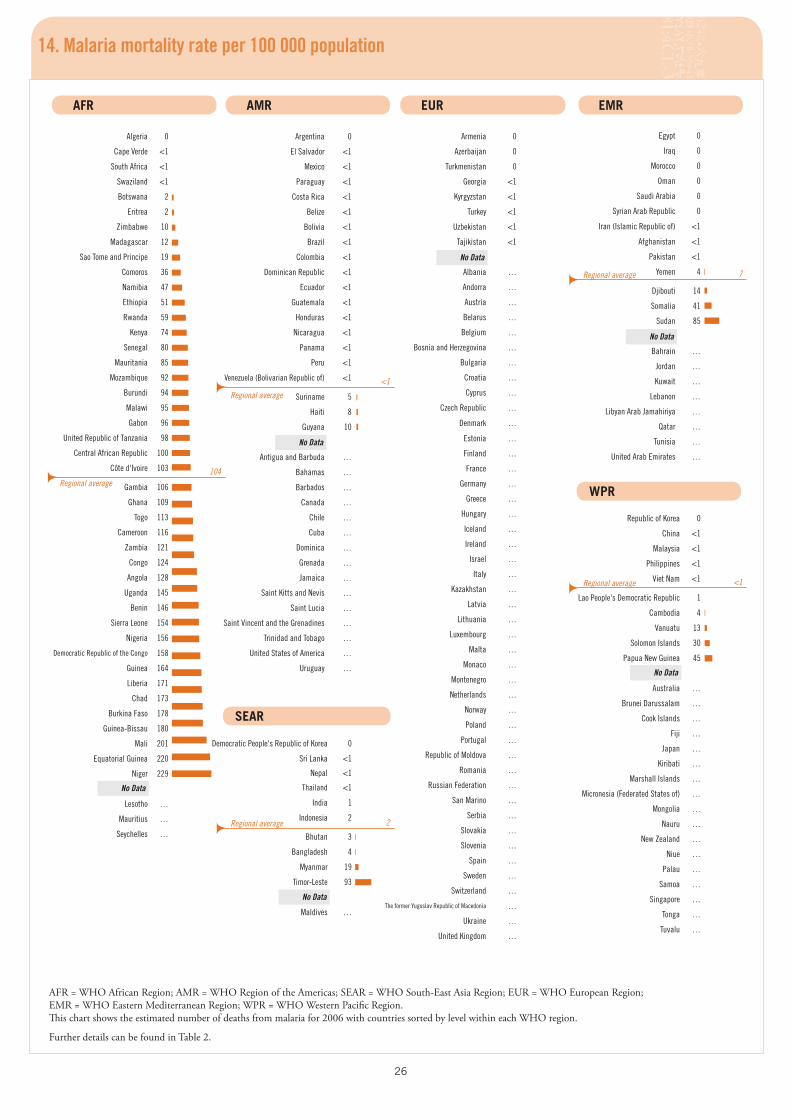
26
14. Malaria mortality rate per 100 000 population
AFR = WHO African Region; AMR = WHO Region of the Americas; SEAR = WHO South-East Asia Region; EUR = WHO European Region; EMR = WHO Eastern Mediterranean Region; WPR = WHO Western Pacific Region. This chart shows the estimated number of deaths from malaria for 2006 with countries sorted by level within each WHO region.
Further details can be found in Table 2.
Regional average104
Regional average 2
Regional average 7
Regional average <1
Regional average
<1
Algeria 0
Cape Verde <1
South Africa <1
Swaziland <1
Botswana 2
Eritrea 2
Zimbabwe 10
Madagascar 12
Sao Tome and Principe 19
Comoros 36
Namibia 47
Ethiopia 51
Rwanda 59
Kenya 74
Senegal 80
Mauritania 85
Mozambique 92
Burundi 94
Malawi 95
Gabon 96
United Republic of Tanzania 98
Central African Republic 100
Côte d'Ivoire 103
Gambia 106
Ghana 109
Togo 113
Cameroon 116
Zambia 121
Congo 124
Angola 128
Uganda 145
Benin 146
Sierra Leone 154
Nigeria 156
Democratic Republic of the Congo 158
Guinea 164
Liberia 171
Chad 173
Burkina Faso 178
Guinea-Bissau 180
Mali 201
Equatorial Guinea 220
Niger 229
Lesotho …
Mauritius …
Seychelles …
No Data
Argentina 0
El Salvador <1
Mexico <1
Paraguay <1
Costa Rica <1
Belize <1
Bolivia <1
Brazil <1
Colombia <1
Dominican Republic <1
Ecuador <1
Guatemala <1
Honduras <1
Nicaragua <1
Panama <1
Peru <1
Venezuela (Bolivarian Republic of) <1
Suriname 5
Haiti 8
Guyana 10
Antigua and Barbuda …
Bahamas …
Barbados …
Canada …
Chile …
Cuba …
Dominica …
Grenada …
Jamaica …
Saint Kitts and Nevis …
Saint Lucia …
Saint Vincent and the Grenadines …
Trinidad and Tobago …
United States of America …
Uruguay …
No Data
Armenia 0
Azerbaijan 0
Turkmenistan 0
Georgia <1
Kyrgyzstan <1
Turkey <1
Uzbekistan <1
Tajikistan <1
Albania …
Andorra …
Austria …
Belarus …
Belgium …
Bosnia and Herzegovina …
Bulgaria …
Croatia …
Cyprus …
Czech Republic …
Denmark …
Estonia …
Finland …
France …
Germany …
Greece …
Hungary …
Iceland …
Ireland …
Israel …
Italy …
Kazakhstan …
Latvia …
Lithuania …
Luxembourg …
Malta …
Monaco …
Montenegro …
Netherlands …
Norway …
Poland …
Portugal …
Republic of Moldova …
Romania …
Russian Federation …
San Marino …
Serbia …
Slovakia …
Slovenia …
Spain …
Sweden …
Switzerland …
The former Yugoslav Republic of Macedonia …
Ukraine …
United Kingdom …
No Data
Democratic People's Republic of Korea 0
Sri Lanka <1
Nepal <1
Thailand <1
India 1
Indonesia 2
Bhutan 3
Bangladesh 4
Myanmar 19
Timor-Leste 93
Maldives …
No Data
Egypt 0
Iraq 0
Morocco 0
Oman 0
Saudi Arabia 0
Syrian Arab Republic 0
Iran (Islamic Republic of) <1
Afghanistan <1
Pakistan <1
Yemen 4
Djibouti 14
Somalia 41
Sudan 85
Bahrain …
Jordan …
Kuwait …
Lebanon …
Libyan Arab Jamahiriya …
Qatar …
Tunisia …
United Arab Emirates …
No Data
Republic of Korea 0
China <1
Malaysia <1
Philippines <1
Viet Nam <1
Lao People's Democratic Republic 1
Cambodia 4
Vanuatu 13
Solomon Islands 30
Papua New Guinea 45
Australia …
Brunei Darussalam …
Cook Islands …
Fiji …
Japan …
Kiribati …
Marshall Islands …
Micronesia (Federated States of) …
Mongolia …
Nauru …
New Zealand …
Niue …
Palau …
Samoa …
Singapore …
Tonga …
Tuvalu …
No Data
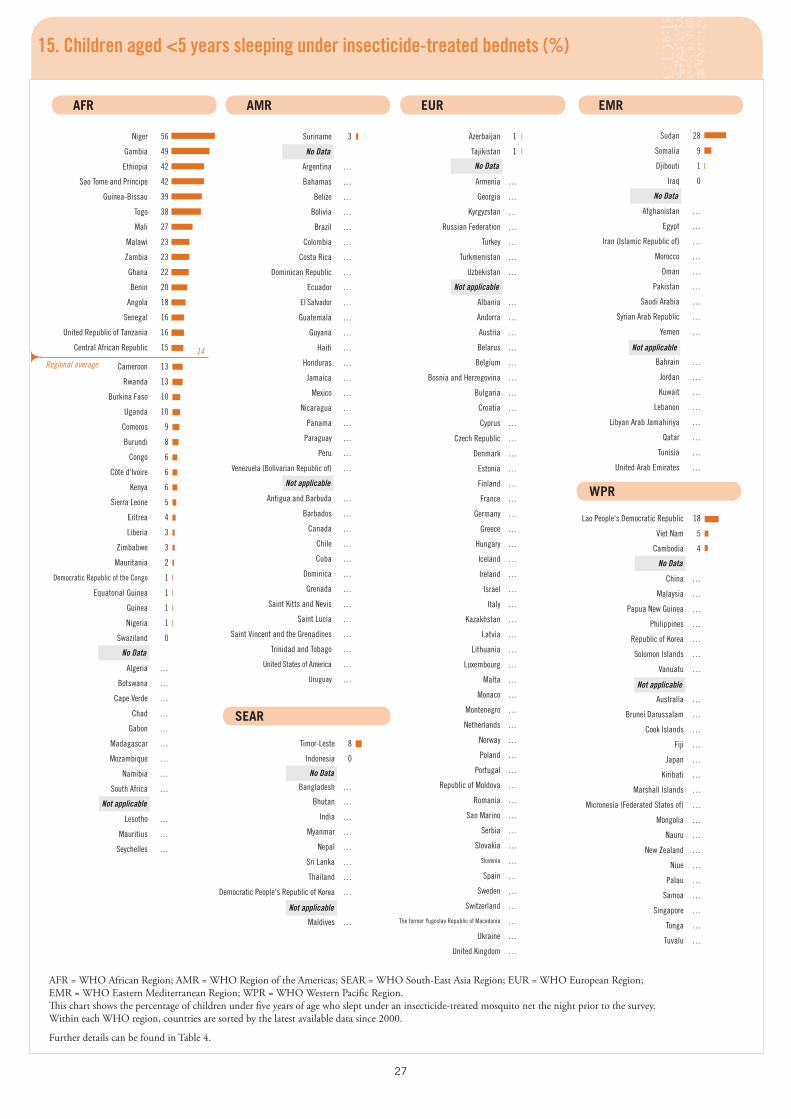
27
15. Children aged <5 years sleeping under insecticide-treated bednets (%)
AFR = WHO African Region; AMR = WHO Region of the Americas; SEAR = WHO South-East Asia Region; EUR = WHO European Region; EMR = WHO Eastern Mediterranean Region; WPR = WHO Western Pacific Region.This chart shows the percentage of children under five years of age who slept under an insecticide-treated mosquito net the night prior to the survey. Within each WHO region, countries are sorted by the latest available data since 2000.
Further details can be found in Table 4.
Regional average14
14. Malaria mortality rate per 100 000 population
Suriname 3
Argentina …
Bahamas …
Belize …
Bolivia …
Brazil …
Colombia …
Costa Rica …
Dominican Republic …
Ecuador …
El Salvador …
Guatemala …
Guyana …
Haiti …
Honduras …
Jamaica …
Mexico …
Nicaragua …
Panama …
Paraguay …
Peru …
Venezuela (Bolivarian Republic of) …
Antigua and Barbuda …
Barbados …
Canada …
Chile …
Cuba …
Dominica …
Grenada …
Saint Kitts and Nevis …
Saint Lucia …
Saint Vincent and the Grenadines …
Trinidad and Tobago …
United States of America …
Uruguay …
No Data
Not applicable
Timor-Leste 8
Indonesia 0
Bangladesh …
Bhutan …
India …
Myanmar …
Nepal …
Sri Lanka …
Thailand …
Democratic People's Republic of Korea …
Maldives …
No Data
Not applicable
Not applicable
Azerbaijan 1
Tajikistan 1
Armenia …
Georgia …
Kyrgyzstan …
Russian Federation …
Turkey …
Turkmenistan …
Uzbekistan …
Albania …
Andorra …
Austria …
Belarus …
Belgium …
Bosnia and Herzegovina …
Bulgaria …
Croatia …
Cyprus …
Czech Republic …
Denmark …
Estonia …
Finland …
France …
Germany …
Greece …
Hungary …
Iceland …
Ireland …
Israel …
Italy …
Kazakhstan …
Latvia …
Lithuania …
Luxembourg …
Malta …
Monaco …
Montenegro …
Netherlands …
Norway …
Poland …
Portugal …
Republic of Moldova …
Romania …
San Marino …
Serbia …
Slovakia …
Slovenia …
Spain …
Sweden …
Switzerland …
The former Yugoslav Republic of Macedonia …
Ukraine …
United Kingdom …
No Data
Not applicable
Sudan 28
Somalia 9
Djibouti 1
Iraq 0
Afghanistan …
Egypt …
Iran (Islamic Republic of) …
Morocco …
Oman …
Pakistan …
Saudi Arabia …
Syrian Arab Republic …
Yemen …
Bahrain …
Jordan …
Kuwait …
Lebanon …
Libyan Arab Jamahiriya …
Qatar …
Tunisia …
United Arab Emirates …
No Data
Not applicable
Lao People's Democratic Republic 18
Viet Nam 5
Cambodia 4
China …
Malaysia …
Papua New Guinea …
Philippines …
Republic of Korea …
Solomon Islands …
Vanuatu …
Australia …
Brunei Darussalam …
Cook Islands …
Fiji …
Japan …
Kiribati …
Marshall Islands …
Micronesia (Federated States of) …
Mongolia …
Nauru …
New Zealand …
Niue …
Palau …
Samoa …
Singapore …
Tonga …
Tuvalu …
No Data
Niger 56
Gambia 49
Ethiopia 42
Sao Tome and Principe 42
Guinea-Bissau 39
Togo 38
Mali 27
Malawi 23
Zambia 23
Ghana 22
Benin 20
Angola 18
Senegal 16
United Republic of Tanzania 16
Central African Republic 15
Cameroon 13
Rwanda 13
Burkina Faso 10
Uganda 10
Comoros 9
Burundi 8
Congo 6
Côte d'Ivoire 6
Kenya 6
Sierra Leone 5
Eritrea 4
Liberia 3
Zimbabwe 3
Mauritania 2
Democratic Republic of the Congo 1
Equatorial Guinea 1
Guinea 1
Nigeria 1
Swaziland 0
Algeria …
Botswana …
Cape Verde …
Chad …
Gabon …
Madagascar …
Mozambique …
Namibia …
South Africa …
Lesotho …
Mauritius …
Seychelles …
No Data
Not applicable
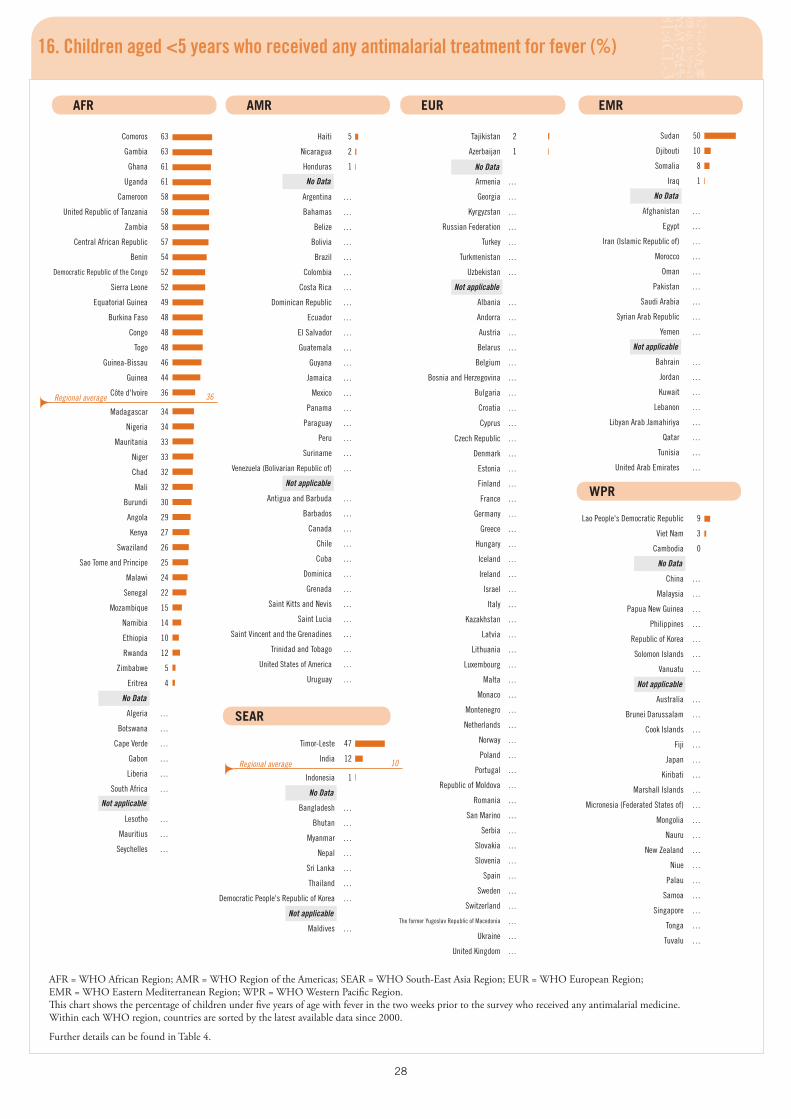
28
16. Children aged <5 years who received any antimalarial treatment for fever (%)
AFR = WHO African Region; AMR = WHO Region of the Americas; SEAR = WHO South-East Asia Region; EUR = WHO European Region; EMR = WHO Eastern Mediterranean Region; WPR = WHO Western Pacific Region. This chart shows the percentage of children under five years of age with fever in the two weeks prior to the survey who received any antimalarial medicine. Within each WHO region, countries are sorted by the latest available data since 2000.
Further details can be found in Table 4.
Regional average 36
Regional average 10
Comoros 63
Gambia 63
Ghana 61
Uganda 61
Cameroon 58
United Republic of Tanzania 58
Zambia 58
Central African Republic 57
Benin 54
Democratic Republic of the Congo 52
Sierra Leone 52
Equatorial Guinea 49
Burkina Faso 48
Congo 48
Togo 48
Guinea-Bissau 46
Guinea 44
Côte d'Ivoire 36
Madagascar 34
Nigeria 34
Mauritania 33
Niger 33
Chad 32
Mali 32
Burundi 30
Angola 29
Kenya 27
Swaziland 26
Sao Tome and Principe 25
Malawi 24
Senegal 22
Mozambique 15
Namibia 14
Ethiopia 10
Rwanda 12
Zimbabwe 5
Eritrea 4
Algeria …
Botswana …
Cape Verde …
Gabon …
Liberia …
South Africa …
Lesotho …
Mauritius …
Seychelles …
No Data
Not applicable
Haiti 5
Nicaragua 2
Honduras 1
Argentina …
Bahamas …
Belize …
Bolivia …
Brazil …
Colombia …
Costa Rica …
Dominican Republic …
Ecuador …
El Salvador …
Guatemala …
Guyana …
Jamaica …
Mexico …
Panama …
Paraguay …
Peru …
Suriname …
Venezuela (Bolivarian Republic of) …
Antigua and Barbuda …
Barbados …
Canada …
Chile …
Cuba …
Dominica …
Grenada …
Saint Kitts and Nevis …
Saint Lucia …
Saint Vincent and the Grenadines …
Trinidad and Tobago …
United States of America …
Uruguay …
No Data
Not applicable
Tajikistan 2
Azerbaijan 1
Armenia …
Georgia …
Kyrgyzstan …
Russian Federation …
Turkey …
Turkmenistan …
Uzbekistan …
Albania …
Andorra …
Austria …
Belarus …
Belgium …
Bosnia and Herzegovina …
Bulgaria …
Croatia …
Cyprus …
Czech Republic …
Denmark …
Estonia …
Finland …
France …
Germany …
Greece …
Hungary …
Iceland …
Ireland …
Israel …
Italy …
Kazakhstan …
Latvia …
Lithuania …
Luxembourg …
Malta …
Monaco …
Montenegro …
Netherlands …
Norway …
Poland …
Portugal …
Republic of Moldova …
Romania …
San Marino …
Serbia …
Slovakia …
Slovenia …
Spain …
Sweden …
Switzerland …
The former Yugoslav Republic of Macedonia …
Ukraine …
United Kingdom …
No Data
Not applicable
Sudan 50
Djibouti 10
Somalia 8
Iraq 1
Afghanistan …
Egypt …
Iran (Islamic Republic of) …
Morocco …
Oman …
Pakistan …
Saudi Arabia …
Syrian Arab Republic …
Yemen …
Bahrain …
Jordan …
Kuwait …
Lebanon …
Libyan Arab Jamahiriya …
Qatar …
Tunisia …
United Arab Emirates …
No Data
Not applicable
Lao People's Democratic Republic 9
Viet Nam 3
Cambodia 0
China …
Malaysia …
Papua New Guinea …
Philippines …
Republic of Korea …
Solomon Islands …
Vanuatu …
Australia …
Brunei Darussalam …
Cook Islands …
Fiji …
Japan …
Kiribati …
Marshall Islands …
Micronesia (Federated States of) …
Mongolia …
Nauru …
New Zealand …
Niue …
Palau …
Samoa …
Singapore …
Tonga …
Tuvalu …
No Data
Not applicable
Timor-Leste 47
India 12
Indonesia 1
Bangladesh …
Bhutan …
Myanmar …
Nepal …
Sri Lanka …
Thailand …
Democratic People's Republic of Korea …
Maldives …
No Data
Not applicable
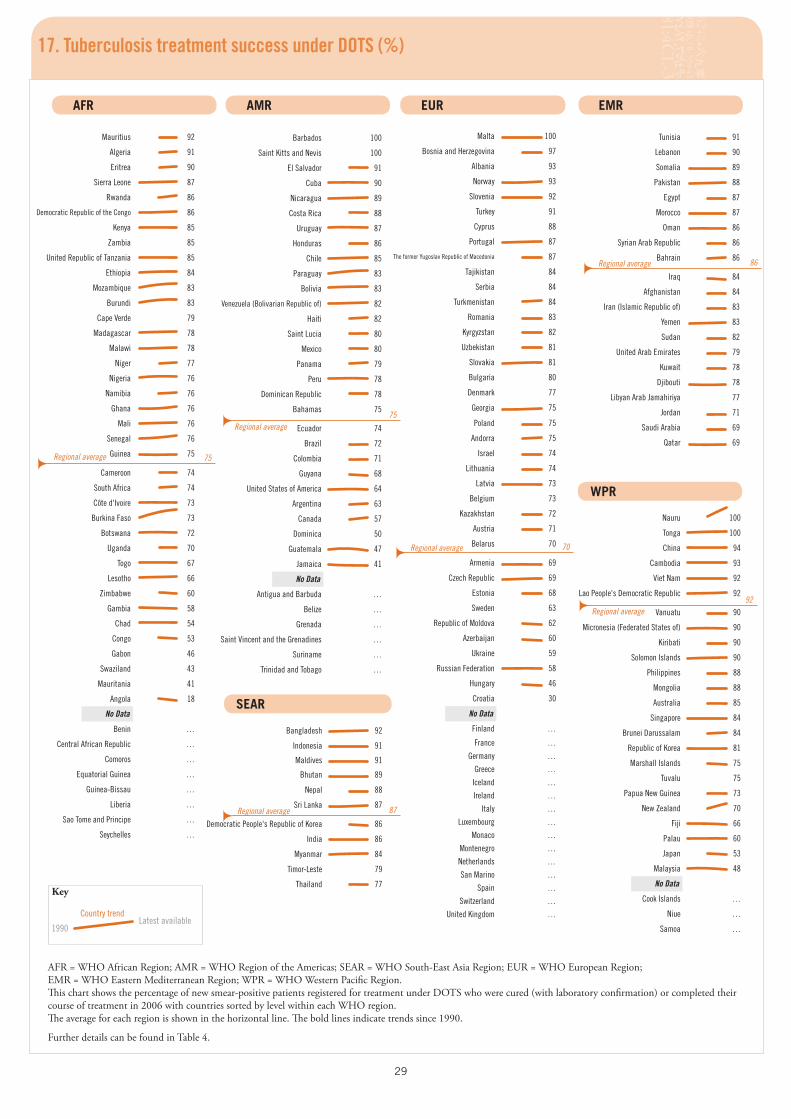
29
Nauru 100
Tonga 100
China 94
Cambodia 93
Viet Nam 92
Lao People's Democratic Republic 92
Vanuatu 90
Micronesia (Federated States of) 90
Kiribati 90
Solomon Islands 90
Philippines 88
Mongolia 88
Australia 85
Singapore 84
Brunei Darussalam 84
Republic of Korea 81
Marshall Islands 75
Tuvalu 75
Papua New Guinea 73
New Zealand 70
Fiji 66
Palau 60
Japan 53
Malaysia 48
Cook Islands …
Niue …
Samoa …
No Data
Malta 100
Bosnia and Herzegovina 97
Albania 93
Norway 93
Slovenia 92
Turkey 91
Cyprus 88
Portugal 87
The former Yugoslav Republic of Macedonia 87
Tajikistan 84
Serbia 84
Turkmenistan 84
Romania 83
Kyrgyzstan 82
Uzbekistan 81
Slovakia 81
Bulgaria 80
Denmark 77
Georgia 75
Poland 75
Andorra 75
Israel 74
Lithuania 74
Latvia 73
Belgium 73
Kazakhstan 72
Austria 71
Belarus 70
Armenia 69
Czech Republic 69
Estonia 68
Sweden 63
Republic of Moldova 62
Azerbaijan 60
Ukraine 59
Russian Federation 58
Hungary 46
Croatia 30
Finland …
France …
Germany …
Greece …
Iceland …
Ireland …
Italy …
Luxembourg …
Monaco …
Montenegro …
Netherlands …
San Marino …
Spain …
Switzerland …
United Kingdom …
No Data
Barbados 100
Saint Kitts and Nevis 100
El Salvador 91
Cuba 90
Nicaragua 89
Costa Rica 88
Uruguay 87
Honduras 86
Chile 85
Paraguay 83
Bolivia 83
Venezuela (Bolivarian Republic of) 82
Haiti 82
Saint Lucia 80
Mexico 80
Panama 79
Peru 78
Dominican Republic 78
Bahamas 75
Ecuador 74
Brazil 72
Colombia 71
Guyana 68
United States of America 64
Argentina 63
Canada 57
Dominica 50
Guatemala 47
Jamaica 41
Antigua and Barbuda …
Belize …
Grenada …
Saint Vincent and the Grenadines …
Suriname …
Trinidad and Tobago …
No Data
Mauritius 92
Algeria 91
Eritrea 90
Sierra Leone 87
Rwanda 86
Democratic Republic of the Congo 86
Kenya 85
Zambia 85
United Republic of Tanzania 85
Ethiopia 84
Mozambique 83
Burundi 83
Cape Verde 79
Madagascar 78
Malawi 78
Niger 77
Nigeria 76
Namibia 76
Ghana 76
Mali 76
Senegal 76
Guinea 75
Cameroon 74
South Africa 74
Côte d'Ivoire 73
Burkina Faso 73
Botswana 72
Uganda 70
Togo 67
Lesotho 66
Zimbabwe 60
Gambia 58
Chad 54
Congo 53
Gabon 46
Swaziland 43
Mauritania 41
Angola 18
Benin …
Central African Republic …
Comoros …
Equatorial Guinea …
Guinea-Bissau …
Liberia …
Sao Tome and Principe …
Seychelles …
No Data
Tunisia 91
Lebanon 90
Somalia 89
Pakistan 88
Egypt 87
Morocco 87
Oman 86
Syrian Arab Republic 86
Bahrain 86
Iraq 84
Afghanistan 84
Iran (Islamic Republic of) 83
Yemen 83
Sudan 82
United Arab Emirates 79
Kuwait 78
Djibouti 78
Libyan Arab Jamahiriya 77
Jordan 71
Saudi Arabia 69
Qatar 69
Bangladesh 92
Indonesia 91
Maldives 91
Bhutan 89
Nepal 88
Sri Lanka 87
Democratic People's Republic of Korea 86
India 86
Myanmar 84
Timor-Leste 79
Thailand 77
17. Tuberculosis treatment success under DOTS (%)
AFR = WHO African Region; AMR = WHO Region of the Americas; SEAR = WHO South-East Asia Region; EUR = WHO European Region; EMR = WHO Eastern Mediterranean Region; WPR = WHO Western Pacific Region. This chart shows the percentage of new smear-positive patients registered for treatment under DOTS who were cured (with laboratory confirmation) or completed their course of treatment in 2006 with countries sorted by level within each WHO region. The average for each region is shown in the horizontal line. The bold lines indicate trends since 1990.
Further details can be found in Table 4.
Key
Latest available1990
Country trend
Regional average 86
Regional average 75
Regional average75
Regional average 70
Regional average92
Regional average 87
16. Children aged <5 years who received any antimalarial treatment for fever (%)
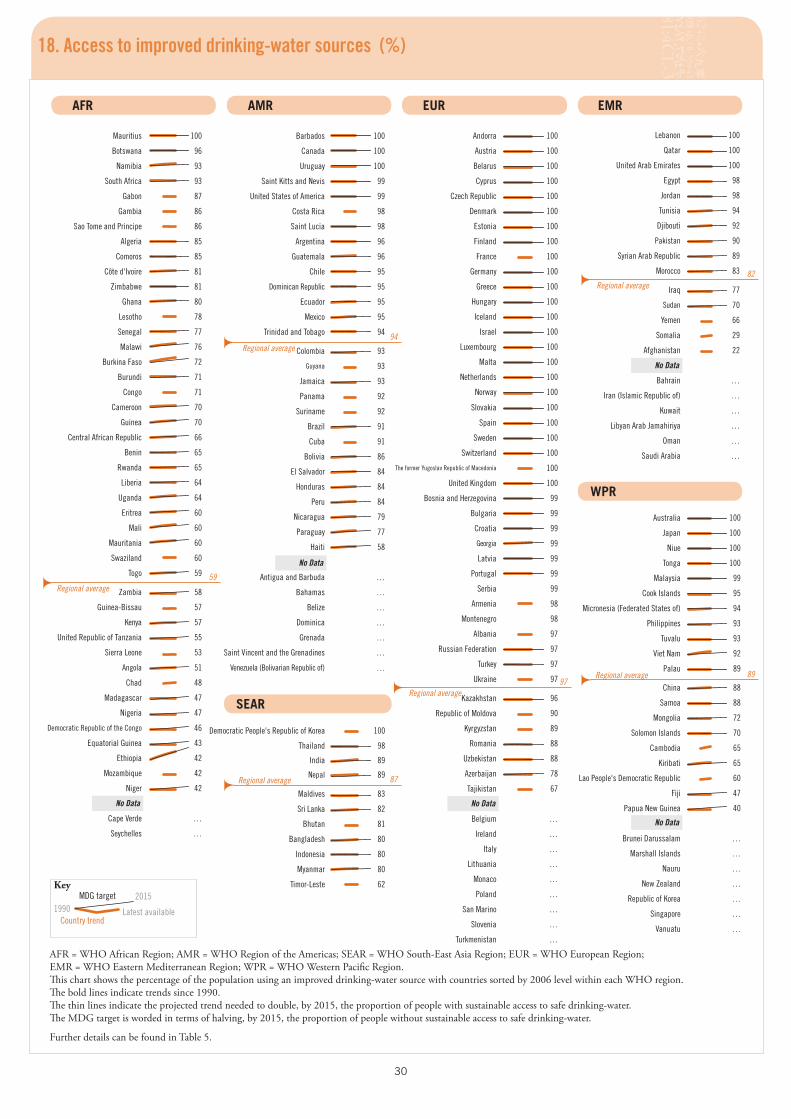
30
Andorra 100
Austria 100
Belarus 100
Cyprus 100
Czech Republic 100
Denmark 100
Estonia 100
Finland 100
France 100
Germany 100
Greece 100
Hungary 100
Iceland 100
Israel 100
Luxembourg 100
Malta 100
Netherlands 100
Norway 100
Slovakia 100
Spain 100
Sweden 100
Switzerland 100
The former Yugoslav Republic of Macedonia 100
United Kingdom 100
Bosnia and Herzegovina 99
Bulgaria 99
Croatia 99
Georgia 99
Latvia 99
Portugal 99
Serbia 99
Armenia 98
Montenegro 98
Albania 97
Russian Federation 97
Turkey 97
Ukraine 97
Kazakhstan 96
Republic of Moldova 90
Kyrgyzstan 89
Romania 88
Uzbekistan 88
Azerbaijan 78
Tajikistan 67
Belgium …
Ireland …
Italy …
Lithuania …
Monaco …
Poland …
San Marino …
Slovenia …
Turkmenistan …
No Data
Barbados 100
Canada 100
Uruguay 100
Saint Kitts and Nevis 99
United States of America 99
Costa Rica 98
Saint Lucia 98
Argentina 96
Guatemala 96
Chile 95
Dominican Republic 95
Ecuador 95
Mexico 95
Trinidad and Tobago 94
Colombia 93
Guyana 93
Jamaica 93
Panama 92
Suriname 92
Brazil 91
Cuba 91
Bolivia 86
El Salvador 84
Honduras 84
Peru 84
Nicaragua 79
Paraguay 77
Haiti 58
Antigua and Barbuda …
Bahamas …
Belize …
Dominica …
Grenada …
Saint Vincent and the Grenadines …
Venezuela (Bolivarian Republic of) …
No Data
Mauritius 100
Botswana 96
Namibia 93
South Africa 93
Gabon 87
Gambia 86
Sao Tome and Principe 86
Algeria 85
Comoros 85
Côte d'Ivoire 81
Zimbabwe 81
Ghana 80
Lesotho 78
Senegal 77
Malawi 76
Burkina Faso 72
Burundi 71
Congo 71
Cameroon 70
Guinea 70
Central African Republic 66
Benin 65
Rwanda 65
Liberia 64
Uganda 64
Eritrea 60
Mali 60
Mauritania 60
Swaziland 60
Togo 59
Zambia 58
Guinea-Bissau 57
Kenya 57
United Republic of Tanzania 55
Sierra Leone 53
Angola 51
Chad 48
Madagascar 47
Nigeria 47
Democratic Republic of the Congo 46
Equatorial Guinea 43
Ethiopia 42
Mozambique 42
Niger 42
Cape Verde …
Seychelles …
18. Access to improved drinking-water sources (%)
Democratic People's Republic of Korea 100
Thailand 98
India 89
Nepal 89
Maldives 83
Sri Lanka 82
Bhutan 81
Bangladesh 80
Indonesia 80
Myanmar 80
Timor-Leste 62
AFR = WHO African Region; AMR = WHO Region of the Americas; SEAR = WHO South-East Asia Region; EUR = WHO European Region; EMR = WHO Eastern Mediterranean Region; WPR = WHO Western Pacific Region. This chart shows the percentage of the population using an improved drinking-water source with countries sorted by 2006 level within each WHO region. The bold lines indicate trends since 1990. The thin lines indicate the projected trend needed to double, by 2015, the proportion of people with sustainable access to safe drinking-water. The MDG target is worded in terms of halving, by 2015, the proportion of people without sustainable access to safe drinking-water.
Further details can be found in Table 5.
Key2015
Latest available1990Country trend
MDG target
Regional average59
Regional average94
Regional average 87
Regional average97
Regional average82
Regional average 89
No Data
Australia 100
Japan 100
Niue 100
Tonga 100
Malaysia 99
Cook Islands 95
Micronesia (Federated States of) 94
Philippines 93
Tuvalu 93
Viet Nam 92
Palau 89
China 88
Samoa 88
Mongolia 72
Solomon Islands 70
Cambodia 65
Kiribati 65
Lao People's Democratic Republic 60
Fiji 47
Papua New Guinea 40
Brunei Darussalam …
Marshall Islands …
Nauru …
New Zealand …
Republic of Korea …
Singapore …
Vanuatu …
No Data
Lebanon 100
Qatar 100
United Arab Emirates 100
Egypt 98
Jordan 98
Tunisia 94
Djibouti 92
Pakistan 90
Syrian Arab Republic 89
Morocco 83
Iraq 77
Sudan 70
Yemen 66
Somalia 29
Afghanistan 22
Bahrain …
Iran (Islamic Republic of) …
Kuwait …
Libyan Arab Jamahiriya …
Oman …
Saudi Arabia …
No Data
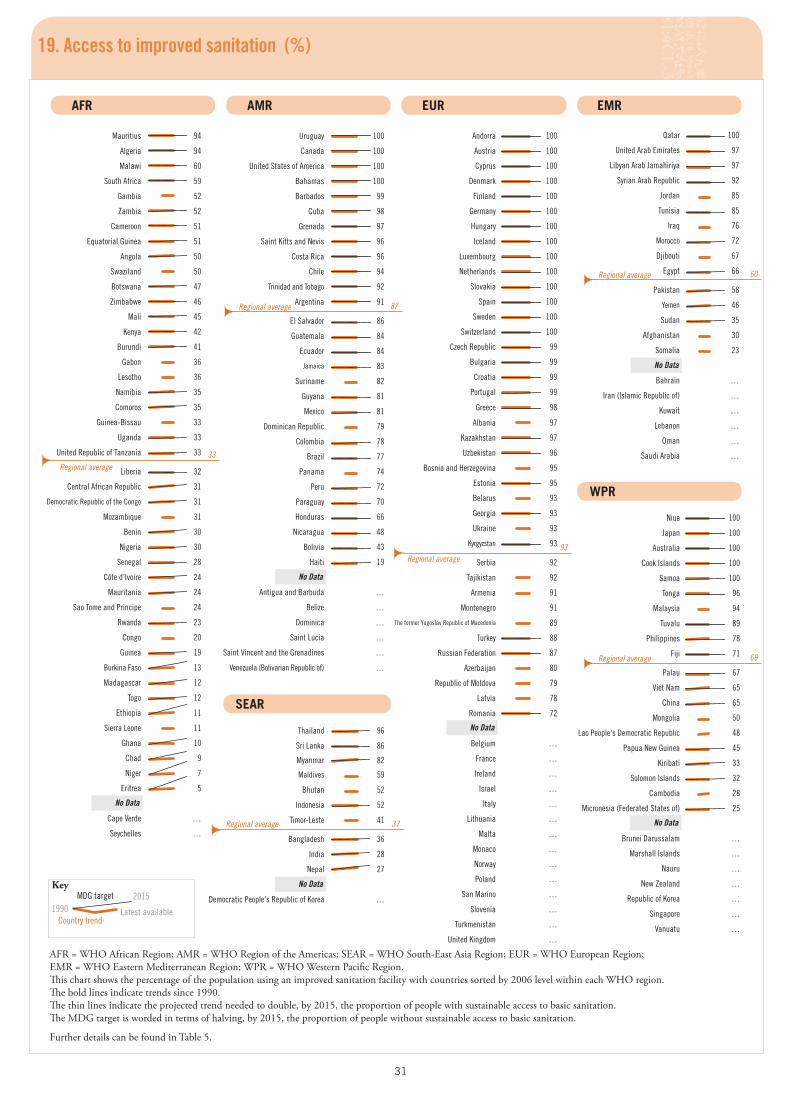
31
Thailand 96
Sri Lanka 86
Myanmar 82
Maldives 59
Bhutan 52
Indonesia 52
Timor-Leste 41
Bangladesh 36
India 28
Nepal 27
Democratic People's Republic of Korea …
No Data
Niue 100
Japan 100
Australia 100
Cook Islands 100
Samoa 100
Tonga 96
Malaysia 94
Tuvalu 89
Philippines 78
Fiji 71
Palau 67
Viet Nam 65
China 65
Mongolia 50
Lao People's Democratic Republic 48
Papua New Guinea 45
Kiribati 33
Solomon Islands 32
Cambodia 28
Micronesia (Federated States of) 25
Brunei Darussalam …
Marshall Islands …
Nauru …
New Zealand …
Republic of Korea …
Singapore …
Vanuatu …
No Data
Andorra 100
Austria 100
Cyprus 100
Denmark 100
Finland 100
Germany 100
Hungary 100
Iceland 100
Luxembourg 100
Netherlands 100
Slovakia 100
Spain 100
Sweden 100
Switzerland 100
Czech Republic 99
Bulgaria 99
Croatia 99
Portugal 99
Greece 98
Albania 97
Kazakhstan 97
Uzbekistan 96
Bosnia and Herzegovina 95
Estonia 95
Belarus 93
Georgia 93
Ukraine 93
Kyrgyzstan 93
Serbia 92
Tajikistan 92
Armenia 91
Montenegro 91
The former Yugoslav Republic of Macedonia 89
Turkey 88
Russian Federation 87
Azerbaijan 80
Republic of Moldova 79
Latvia 78
Romania 72
Belgium …
France …
Ireland …
Israel …
Italy …
Lithuania …
Malta …
Monaco …
Norway …
Poland …
San Marino …
Slovenia …
Turkmenistan …
United Kingdom …
No Data
Qatar 100
United Arab Emirates 97
Libyan Arab Jamahiriya 97
Syrian Arab Republic 92
Jordan 85
Tunisia 85
Iraq 76
Morocco 72
Djibouti 67
Egypt 66
Pakistan 58
Yemen 46
Sudan 35
Afghanistan 30
Somalia 23
Bahrain …
Iran (Islamic Republic of) …
Kuwait …
Lebanon …
Oman …
Saudi Arabia …
No Data
Uruguay 100
Canada 100
United States of America 100
Bahamas 100
Barbados 99
Cuba 98
Grenada 97
Saint Kitts and Nevis 96
Costa Rica 96
Chile 94
Trinidad and Tobago 92
Argentina 91
El Salvador 86
Guatemala 84
Ecuador 84
Jamaica 83
Suriname 82
Guyana 81
Mexico 81
Dominican Republic 79
Colombia 78
Brazil 77
Panama 74
Peru 72
Paraguay 70
Honduras 66
Nicaragua 48
Bolivia 43
Haiti 19
Antigua and Barbuda …
Belize …
Dominica …
Saint Lucia …
Saint Vincent and the Grenadines …
Venezuela (Bolivarian Republic of) …
No Data
Mauritius 94
Algeria 94
Malawi 60
South Africa 59
Gambia 52
Zambia 52
Cameroon 51
Equatorial Guinea 51
Angola 50
Swaziland 50
Botswana 47
Zimbabwe 46
Mali 45
Kenya 42
Burundi 41
Gabon 36
Lesotho 36
Namibia 35
Comoros 35
Guinea-Bissau 33
Uganda 33
United Republic of Tanzania 33
Liberia 32
Central African Republic 31
Democratic Republic of the Congo 31
Mozambique 31
Benin 30
Nigeria 30
Senegal 28
Côte d’Ivoire 24
Mauritania 24
Sao Tome and Principe 24
Rwanda 23
Congo 20
Guinea 19
Burkina Faso 13
Madagascar 12
Togo 12
Ethiopia 11
Sierra Leone 11
Ghana 10
Chad 9
Niger 7
Eritrea 5
Cape Verde …
Seychelles …
No Data
19. Access to improved sanitation (%)
AFR = WHO African Region; AMR = WHO Region of the Americas; SEAR = WHO South-East Asia Region; EUR = WHO European Region; EMR = WHO Eastern Mediterranean Region; WPR = WHO Western Pacific Region.This chart shows the percentage of the population using an improved sanitation facility with countries sorted by 2006 level within each WHO region. The bold lines indicate trends since 1990. The thin lines indicate the projected trend needed to double, by 2015, the proportion of people with sustainable access to basic sanitation. The MDG target is worded in terms of halving, by 2015, the proportion of people without sustainable access to basic sanitation.
Further details can be found in Table 5.
Regional average33
Regional average 87
Regional average 37
Regional average 60
Regional average 69
Regional average93
Key2015
Latest available1990Country trend
MDG target

Part IIGlobal Health Indicators

World HealtH StatiSticS
2009
35
Mortality and burden of diseaseIndicators derived from mortality rates provide a good picture of overall population health. These indicators include infant and child mortality (the probability of dying between birth and 1 and 5 years of age, respectively), adult mortality (the probability of dying between 15 and 60 years of age) and overall life expectancy at birth.
Almost 20% of all deaths are of children less than five years old. Neonatal mortality (deaths during the first 28 days of life per 1000 live births) accounts for a large proportion of child deaths in many countries. Neonatal mortality rates are considered a useful indicator of overall maternal and newborn health and the care that mothers and babies receive.
Estimates of mortality are derived from death registration data reported annually to WHO. For countries where such data are not available or are of poor quality, survey and census sources are analysed and used to create life tables for each country.
Countries with low life expectancy invariably have high levels of child mortality. For example, life expectancy at birth in the WHO African Region was estimated at only 52 years in 2007, compared with 76 years in the WHO Region of the Americas. Child mortality in the two regions was 145 per 1000 live births and 19 per 1000, respectively. In several African countries, recent improvements in child survival have not been reflected in higher life expectancy because they have been offset by higher levels of adult mortality due to HIV/AIDS and, in some countries, conflict.
However, mortality statistics alone are not sufficient to fully describe, measure and compare the health states of populations. This is because death rates underestimate the burden of ill-health caused by noncommunicable adult disease by not providing any information on non-fatal health outcomes. Hearing loss, visual impairment and mental disorders are the most common causes of disability worldwide. A summary measure of population health therefore needs to capture both fatal and non-fatal health outcomes. Life expectancy estimates reflect how many years a person might be expected to live. Healthy life expectancy is an estimate of how many years they might live in “good” health. These estimates are based on country life tables, analyses of 135 causes of disability for 17 regions of the world and 69 health surveys in 60 countries. The estimates of healthy life expectancy are more uncertain than those for life expectancy, because it is difficult to ensure comparable measurements of disability across countries and account for limitations in the data.
Tabl
e 1
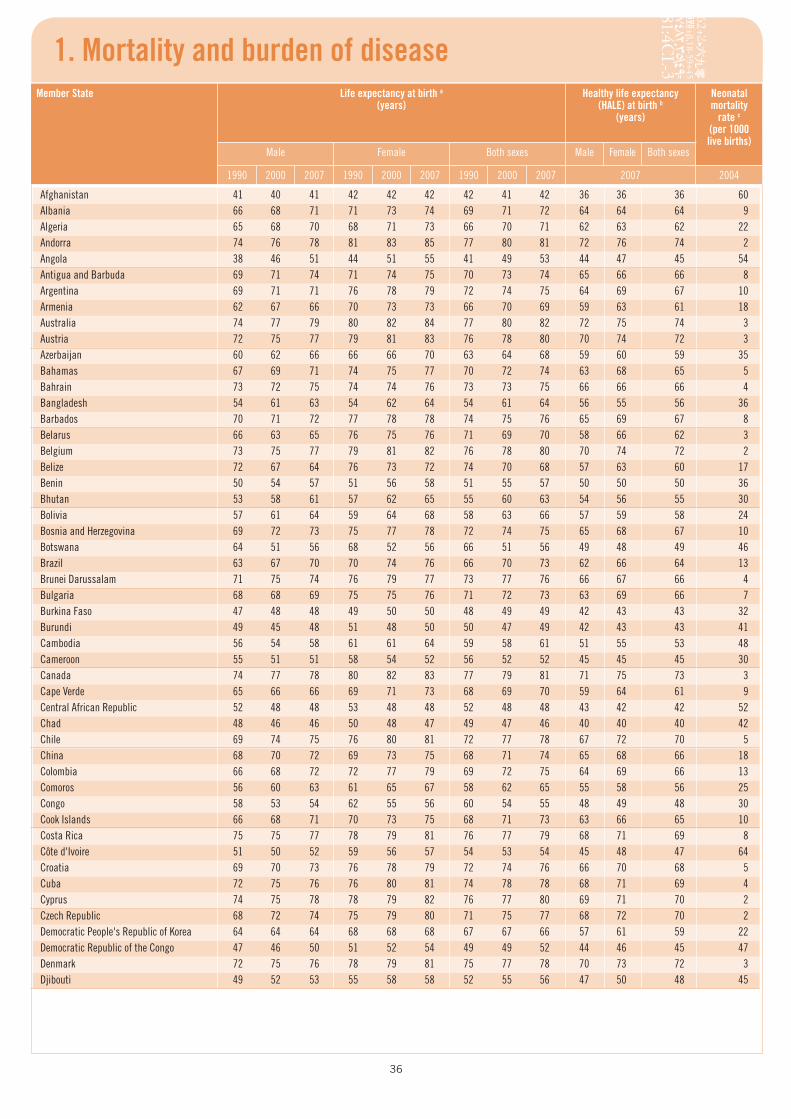
36
1. Mortality and burden of diseaseMember State Life expectancy at birth a
(years)Healthy life expectancy
(HALE) at birth b (years)
Neonatal mortality
rate c (per 1000 live births)
Male Female Both sexes Male Female Both sexes
1990 2000 2007 1990 2000 2007 1990 2000 2007 2007 2004
Afghanistan 41 40 41 42 42 42 42 41 42 36 36 36 60Albania 66 68 71 71 73 74 69 71 72 64 64 64 9Algeria 65 68 70 68 71 73 66 70 71 62 63 62 22Andorra 74 76 78 81 83 85 77 80 81 72 76 74 2Angola 38 46 51 44 51 55 41 49 53 44 47 45 54Antigua and Barbuda 69 71 74 71 74 75 70 73 74 65 66 66 8Argentina 69 71 71 76 78 79 72 74 75 64 69 67 10Armenia 62 67 66 70 73 73 66 70 69 59 63 61 18Australia 74 77 79 80 82 84 77 80 82 72 75 74 3Austria 72 75 77 79 81 83 76 78 80 70 74 72 3Azerbaijan 60 62 66 66 66 70 63 64 68 59 60 59 35Bahamas 67 69 71 74 75 77 70 72 74 63 68 65 5Bahrain 73 72 75 74 74 76 73 73 75 66 66 66 4Bangladesh 54 61 63 54 62 64 54 61 64 56 55 56 36Barbados 70 71 72 77 78 78 74 75 76 65 69 67 8Belarus 66 63 65 76 75 76 71 69 70 58 66 62 3Belgium 73 75 77 79 81 82 76 78 80 70 74 72 2Belize 72 67 64 76 73 72 74 70 68 57 63 60 17Benin 50 54 57 51 56 58 51 55 57 50 50 50 36Bhutan 53 58 61 57 62 65 55 60 63 54 56 55 30Bolivia 57 61 64 59 64 68 58 63 66 57 59 58 24Bosnia and Herzegovina 69 72 73 75 77 78 72 74 75 65 68 67 10Botswana 64 51 56 68 52 56 66 51 56 49 48 49 46Brazil 63 67 70 70 74 76 66 70 73 62 66 64 13Brunei Darussalam 71 75 74 76 79 77 73 77 76 66 67 66 4Bulgaria 68 68 69 75 75 76 71 72 73 63 69 66 7Burkina Faso 47 48 48 49 50 50 48 49 49 42 43 43 32Burundi 49 45 48 51 48 50 50 47 49 42 43 43 41Cambodia 56 54 58 61 61 64 59 58 61 51 55 53 48Cameroon 55 51 51 58 54 52 56 52 52 45 45 45 30Canada 74 77 78 80 82 83 77 79 81 71 75 73 3Cape Verde 65 66 66 69 71 73 68 69 70 59 64 61 9Central African Republic 52 48 48 53 48 48 52 48 48 43 42 42 52Chad 48 46 46 50 48 47 49 47 46 40 40 40 42Chile 69 74 75 76 80 81 72 77 78 67 72 70 5China 68 70 72 69 73 75 68 71 74 65 68 66 18Colombia 66 68 72 72 77 79 69 72 75 64 69 66 13Comoros 56 60 63 61 65 67 58 62 65 55 58 56 25Congo 58 53 54 62 55 56 60 54 55 48 49 48 30Cook Islands 66 68 71 70 73 75 68 71 73 63 66 65 10Costa Rica 75 75 77 78 79 81 76 77 79 68 71 69 8Côte d'Ivoire 51 50 52 59 56 57 54 53 54 45 48 47 64Croatia 69 70 73 76 78 79 72 74 76 66 70 68 5Cuba 72 75 76 76 80 81 74 78 78 68 71 69 4Cyprus 74 75 78 78 79 82 76 77 80 69 71 70 2Czech Republic 68 72 74 75 79 80 71 75 77 68 72 70 2Democratic People's Republic of Korea 64 64 64 68 68 68 67 67 66 57 61 59 22Democratic Republic of the Congo 47 46 50 51 52 54 49 49 52 44 46 45 47Denmark 72 75 76 78 79 81 75 77 78 70 73 72 3Djibouti 49 52 53 55 58 58 52 55 56 47 50 48 45
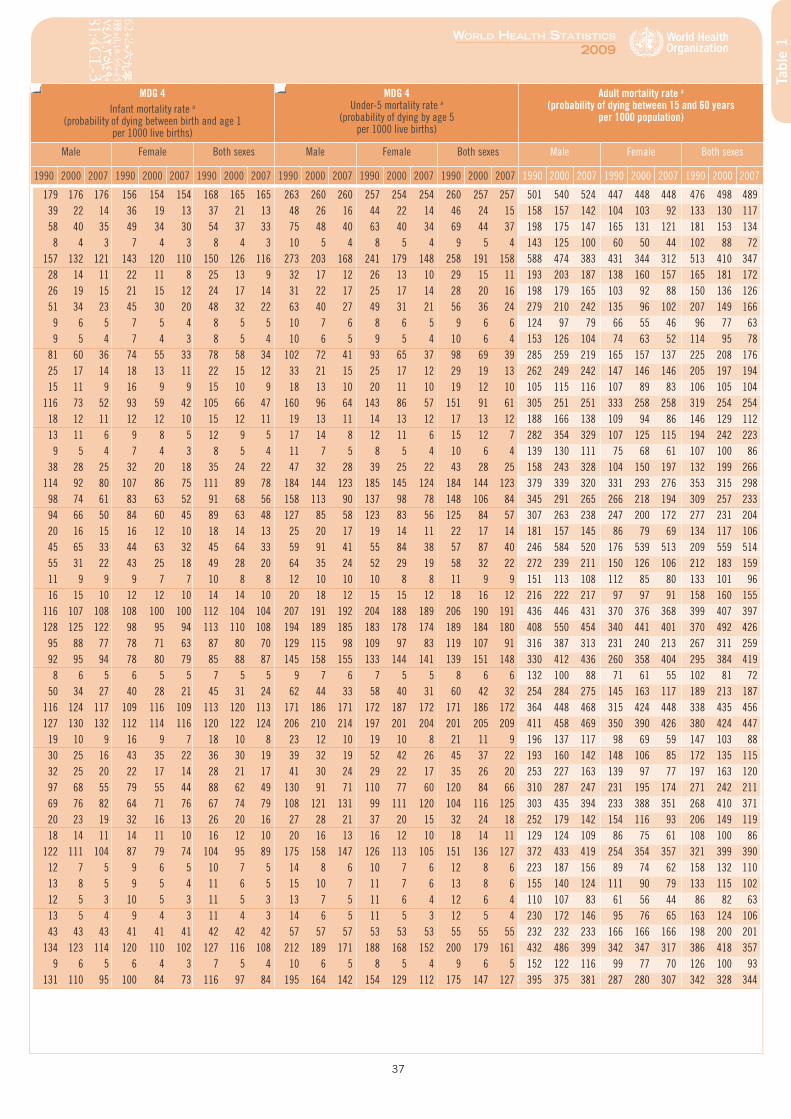
37
World HealtH StatiSticS
2009
Tabl
e 1
MDG 4Infant mortality rate a
(probability of dying between birth and age 1per 1000 live births)
MDG 4 Under-5 mortality rate a
(probability of dying by age 5 per 1000 live births)
Adult mortality rate a (probability of dying between 15 and 60 years
per 1000 population)
Male Female Both sexes Male Female Both sexes Male Female Both sexes
1990 2000 2007 1990 2000 2007 1990 2000 2007 1990 2000 2007 1990 2000 2007 1990 2000 2007 1990 2000 2007 1990 2000 2007 1990 2000 2007
179 176 176 156 154 154 168 165 165 263 260 260 257 254 254 260 257 257 501 540 524 447 448 448 476 498 48939 22 14 36 19 13 37 21 13 48 26 16 44 22 14 46 24 15 158 157 142 104 103 92 133 130 11758 40 35 49 34 30 54 37 33 75 48 40 63 40 34 69 44 37 198 175 147 165 131 121 181 153 1348 4 3 7 4 3 8 4 3 10 5 4 8 5 4 9 5 4 143 125 100 60 50 44 102 88 72
157 132 121 143 120 110 150 126 116 273 203 168 241 179 148 258 191 158 588 474 383 431 344 312 513 410 34728 14 11 22 11 8 25 13 9 32 17 12 26 13 10 29 15 11 193 203 187 138 160 157 165 181 17226 19 15 21 15 12 24 17 14 31 22 17 25 17 14 28 20 16 198 179 165 103 92 88 150 136 12651 34 23 45 30 20 48 32 22 63 40 27 49 31 21 56 36 24 279 210 242 135 96 102 207 149 1669 6 5 7 5 4 8 5 5 10 7 6 8 6 5 9 6 6 124 97 79 66 55 46 96 77 639 5 4 7 4 3 8 5 4 10 6 5 9 5 4 10 6 4 153 126 104 74 63 52 114 95 78
81 60 36 74 55 33 78 58 34 102 72 41 93 65 37 98 69 39 285 259 219 165 157 137 225 208 17625 17 14 18 13 11 22 15 12 33 21 15 25 17 12 29 19 13 262 249 242 147 146 146 205 197 19415 11 9 16 9 9 15 10 9 18 13 10 20 11 10 19 12 10 105 115 116 107 89 83 106 105 104
116 73 52 93 59 42 105 66 47 160 96 64 143 86 57 151 91 61 305 251 251 333 258 258 319 254 25418 12 11 12 12 10 15 12 11 19 13 11 14 13 12 17 13 12 188 166 138 109 94 86 146 129 11213 11 6 9 8 5 12 9 5 17 14 8 12 11 6 15 12 7 282 354 329 107 125 115 194 242 2239 5 4 7 4 3 8 5 4 11 7 5 8 5 4 10 6 4 139 130 111 75 68 61 107 100 86
38 28 25 32 20 18 35 24 22 47 32 28 39 25 22 43 28 25 158 243 328 104 150 197 132 199 266114 92 80 107 86 75 111 89 78 184 144 123 185 145 124 184 144 123 379 339 320 331 293 276 353 315 29898 74 61 83 63 52 91 68 56 158 113 90 137 98 78 148 106 84 345 291 265 266 218 194 309 257 23394 66 50 84 60 45 89 63 48 127 85 58 123 83 56 125 84 57 307 263 238 247 200 172 277 231 20420 16 15 16 12 10 18 14 13 25 20 17 19 14 11 22 17 14 181 157 145 86 79 69 134 117 10645 65 33 44 63 32 45 64 33 59 91 41 55 84 38 57 87 40 246 584 520 176 539 513 209 559 51455 31 22 43 25 18 49 28 20 64 35 24 52 29 19 58 32 22 272 239 211 150 126 106 212 183 15911 9 9 9 7 7 10 8 8 12 10 10 10 8 8 11 9 9 151 113 108 112 85 80 133 101 9616 15 10 12 12 10 14 14 10 20 18 12 15 15 12 18 16 12 216 222 217 97 97 91 158 160 155
116 107 108 108 100 100 112 104 104 207 191 192 204 188 189 206 190 191 436 446 431 370 376 368 399 407 397128 125 122 98 95 94 113 110 108 194 189 185 183 178 174 189 184 180 408 550 454 340 441 401 370 492 42695 88 77 78 71 63 87 80 70 129 115 98 109 97 83 119 107 91 316 387 313 231 240 213 267 311 25992 95 94 78 80 79 85 88 87 145 158 155 133 144 141 139 151 148 330 412 436 260 358 404 295 384 419
8 6 5 6 5 5 7 5 5 9 7 6 7 5 5 8 6 6 132 100 88 71 61 55 102 81 7250 34 27 40 28 21 45 31 24 62 44 33 58 40 31 60 42 32 254 284 275 145 163 117 189 213 187
116 124 117 109 116 109 113 120 113 171 186 171 172 187 172 171 186 172 364 448 468 315 424 448 338 435 456127 130 132 112 114 116 120 122 124 206 210 214 197 201 204 201 205 209 411 458 469 350 390 426 380 424 44719 10 9 16 9 7 18 10 8 23 12 10 19 10 8 21 11 9 196 137 117 98 69 59 147 103 8830 25 16 43 35 22 36 30 19 39 32 19 52 42 26 45 37 22 193 160 142 148 106 85 172 135 11532 25 20 22 17 14 28 21 17 41 30 24 29 22 17 35 26 20 253 227 163 139 97 77 197 163 12097 68 55 79 55 44 88 62 49 130 91 71 110 77 60 120 84 66 310 287 247 231 195 174 271 242 21169 76 82 64 71 76 67 74 79 108 121 131 99 111 120 104 116 125 303 435 394 233 388 351 268 410 37120 23 19 32 16 13 26 20 16 27 28 21 37 20 15 32 24 18 252 179 142 154 116 93 206 149 11918 14 11 14 11 10 16 12 10 20 16 13 16 12 10 18 14 11 129 124 109 86 75 61 108 100 86
122 111 104 87 79 74 104 95 89 175 158 147 126 113 105 151 136 127 372 433 419 254 354 357 321 399 39012 7 5 9 6 5 10 7 5 14 8 6 10 7 6 12 8 6 223 187 156 89 74 62 158 132 11013 8 5 9 5 4 11 6 5 15 10 7 11 7 6 13 8 6 155 140 124 111 90 79 133 115 10212 5 3 10 5 3 11 5 3 13 7 5 11 6 4 12 6 4 110 107 83 61 56 44 86 82 6313 5 4 9 4 3 11 4 3 14 6 5 11 5 3 12 5 4 230 172 146 95 76 65 163 124 10643 43 43 41 41 41 42 42 42 57 57 57 53 53 53 55 55 55 232 232 233 166 166 166 198 200 201
134 123 114 120 110 102 127 116 108 212 189 171 188 168 152 200 179 161 432 486 399 342 347 317 386 418 3579 6 5 6 4 3 7 5 4 10 6 5 8 5 4 9 6 5 152 122 116 99 77 70 126 100 93
131 110 95 100 84 73 116 97 84 195 164 142 154 129 112 175 147 127 395 375 381 287 280 307 342 328 344
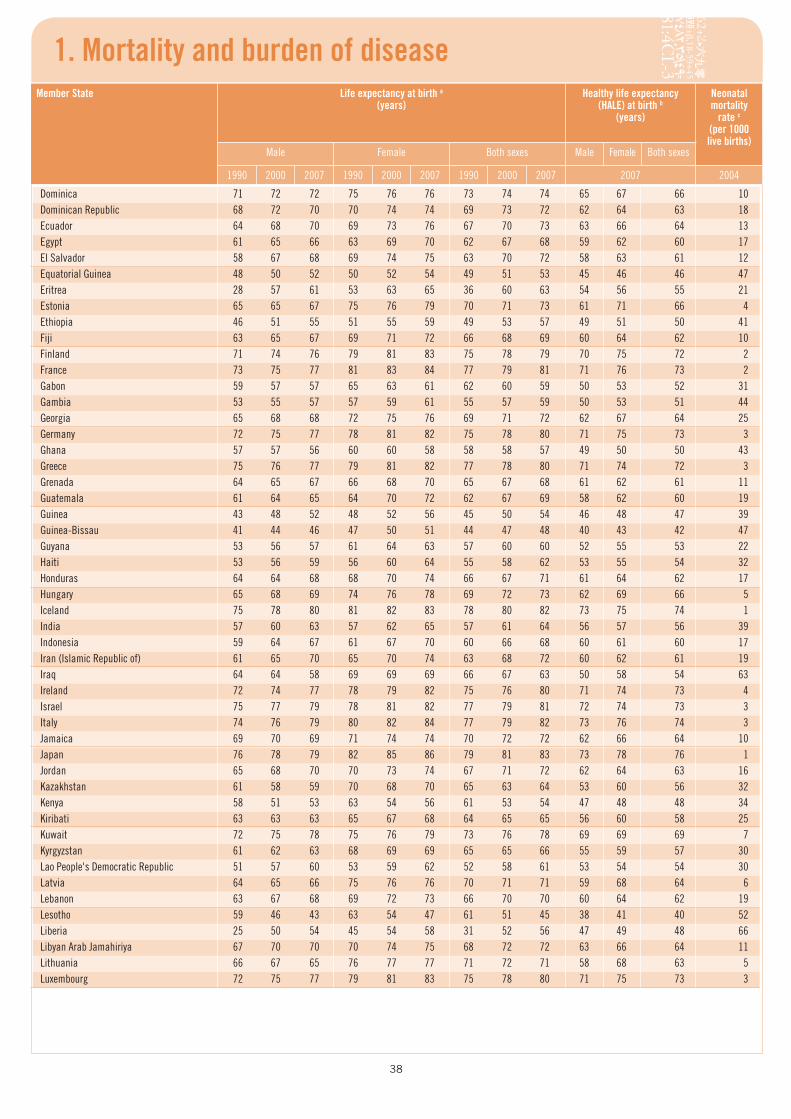
38
1. Mortality and burden of diseaseMember State Life expectancy at birth a
(years)Healthy life expectancy
(HALE) at birth b (years)
Neonatal mortality
rate c (per 1000 live births)
Male Female Both sexes Male Female Both sexes
1990 2000 2007 1990 2000 2007 1990 2000 2007 2007 2004
Dominica 71 72 72 75 76 76 73 74 74 65 67 66 10Dominican Republic 68 72 70 70 74 74 69 73 72 62 64 63 18Ecuador 64 68 70 69 73 76 67 70 73 63 66 64 13Egypt 61 65 66 63 69 70 62 67 68 59 62 60 17El Salvador 58 67 68 69 74 75 63 70 72 58 63 61 12Equatorial Guinea 48 50 52 50 52 54 49 51 53 45 46 46 47Eritrea 28 57 61 53 63 65 36 60 63 54 56 55 21Estonia 65 65 67 75 76 79 70 71 73 61 71 66 4Ethiopia 46 51 55 51 55 59 49 53 57 49 51 50 41Fiji 63 65 67 69 71 72 66 68 69 60 64 62 10Finland 71 74 76 79 81 83 75 78 79 70 75 72 2France 73 75 77 81 83 84 77 79 81 71 76 73 2Gabon 59 57 57 65 63 61 62 60 59 50 53 52 31Gambia 53 55 57 57 59 61 55 57 59 50 53 51 44Georgia 65 68 68 72 75 76 69 71 72 62 67 64 25Germany 72 75 77 78 81 82 75 78 80 71 75 73 3Ghana 57 57 56 60 60 58 58 58 57 49 50 50 43Greece 75 76 77 79 81 82 77 78 80 71 74 72 3Grenada 64 65 67 66 68 70 65 67 68 61 62 61 11Guatemala 61 64 65 64 70 72 62 67 69 58 62 60 19Guinea 43 48 52 48 52 56 45 50 54 46 48 47 39Guinea-Bissau 41 44 46 47 50 51 44 47 48 40 43 42 47Guyana 53 56 57 61 64 63 57 60 60 52 55 53 22Haiti 53 56 59 56 60 64 55 58 62 53 55 54 32Honduras 64 64 68 68 70 74 66 67 71 61 64 62 17Hungary 65 68 69 74 76 78 69 72 73 62 69 66 5Iceland 75 78 80 81 82 83 78 80 82 73 75 74 1India 57 60 63 57 62 65 57 61 64 56 57 56 39Indonesia 59 64 67 61 67 70 60 66 68 60 61 60 17Iran (Islamic Republic of) 61 65 70 65 70 74 63 68 72 60 62 61 19Iraq 64 64 58 69 69 69 66 67 63 50 58 54 63Ireland 72 74 77 78 79 82 75 76 80 71 74 73 4Israel 75 77 79 78 81 82 77 79 81 72 74 73 3Italy 74 76 79 80 82 84 77 79 82 73 76 74 3Jamaica 69 70 69 71 74 74 70 72 72 62 66 64 10Japan 76 78 79 82 85 86 79 81 83 73 78 76 1Jordan 65 68 70 70 73 74 67 71 72 62 64 63 16Kazakhstan 61 58 59 70 68 70 65 63 64 53 60 56 32Kenya 58 51 53 63 54 56 61 53 54 47 48 48 34Kiribati 63 63 63 65 67 68 64 65 65 56 60 58 25Kuwait 72 75 78 75 76 79 73 76 78 69 69 69 7Kyrgyzstan 61 62 63 68 69 69 65 65 66 55 59 57 30Lao People's Democratic Republic 51 57 60 53 59 62 52 58 61 53 54 54 30Latvia 64 65 66 75 76 76 70 71 71 59 68 64 6Lebanon 63 67 68 69 72 73 66 70 70 60 64 62 19Lesotho 59 46 43 63 54 47 61 51 45 38 41 40 52Liberia 25 50 54 45 54 58 31 52 56 47 49 48 66Libyan Arab Jamahiriya 67 70 70 70 74 75 68 72 72 63 66 64 11Lithuania 66 67 65 76 77 77 71 72 71 58 68 63 5Luxembourg 72 75 77 79 81 83 75 78 80 71 75 73 3
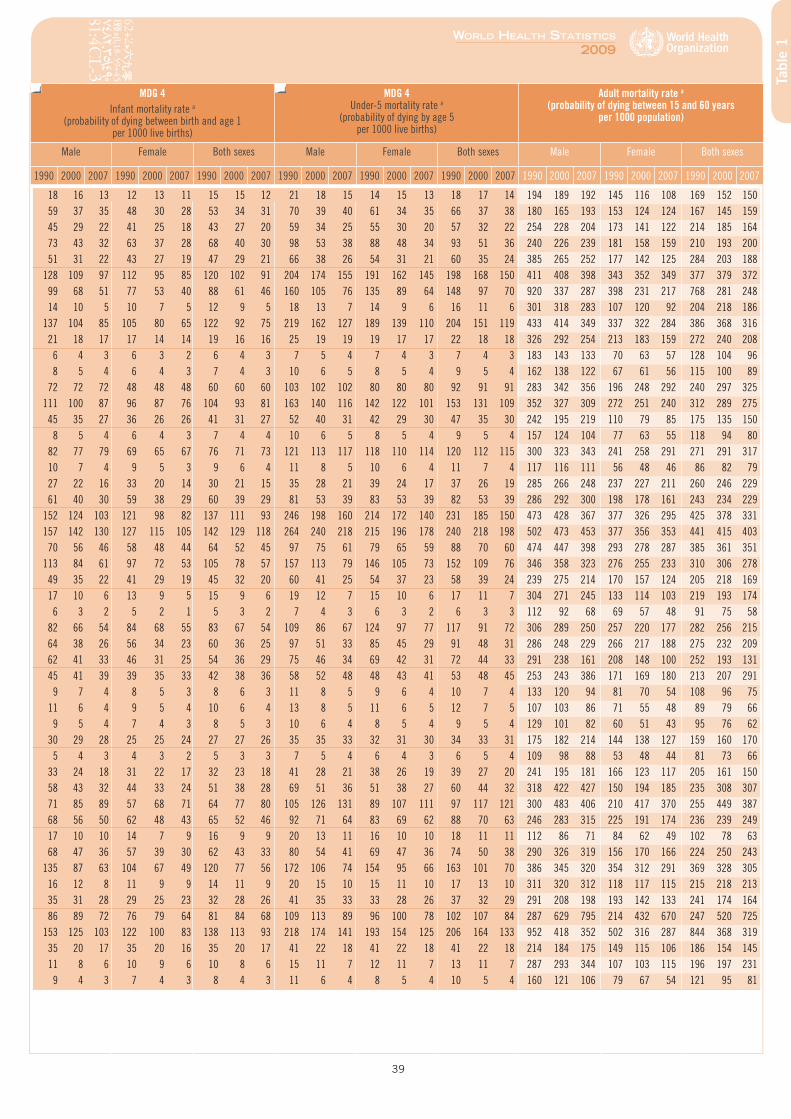
39
World HealtH StatiSticS
2009
Tabl
e 1
MDG 4Infant mortality rate a
(probability of dying between birth and age 1per 1000 live births)
MDG 4 Under-5 mortality rate a
(probability of dying by age 5 per 1000 live births)
Adult mortality rate a (probability of dying between 15 and 60 years
per 1000 population)
Male Female Both sexes Male Female Both sexes Male Female Both sexes
1990 2000 2007 1990 2000 2007 1990 2000 2007 1990 2000 2007 1990 2000 2007 1990 2000 2007 1990 2000 2007 1990 2000 2007 1990 2000 2007
18 16 13 12 13 11 15 15 12 21 18 15 14 15 13 18 17 14 194 189 192 145 116 108 169 152 15059 37 35 48 30 28 53 34 31 70 39 40 61 34 35 66 37 38 180 165 193 153 124 124 167 145 15945 29 22 41 25 18 43 27 20 59 34 25 55 30 20 57 32 22 254 228 204 173 141 122 214 185 16473 43 32 63 37 28 68 40 30 98 53 38 88 48 34 93 51 36 240 226 239 181 158 159 210 193 20051 31 22 43 27 19 47 29 21 66 38 26 54 31 21 60 35 24 385 265 252 177 142 125 284 203 188
128 109 97 112 95 85 120 102 91 204 174 155 191 162 145 198 168 150 411 408 398 343 352 349 377 379 37299 68 51 77 53 40 88 61 46 160 105 76 135 89 64 148 97 70 920 337 287 398 231 217 768 281 24814 10 5 10 7 5 12 9 5 18 13 7 14 9 6 16 11 6 301 318 283 107 120 92 204 218 186
137 104 85 105 80 65 122 92 75 219 162 127 189 139 110 204 151 119 433 414 349 337 322 284 386 368 31621 18 17 17 14 14 19 16 16 25 19 19 19 17 17 22 18 18 326 292 254 213 183 159 272 240 2086 4 3 6 3 2 6 4 3 7 5 4 7 4 3 7 4 3 183 143 133 70 63 57 128 104 968 5 4 6 4 3 7 4 3 10 6 5 8 5 4 9 5 4 162 138 122 67 61 56 115 100 89
72 72 72 48 48 48 60 60 60 103 102 102 80 80 80 92 91 91 283 342 356 196 248 292 240 297 325111 100 87 96 87 76 104 93 81 163 140 116 142 122 101 153 131 109 352 327 309 272 251 240 312 289 27545 35 27 36 26 26 41 31 27 52 40 31 42 29 30 47 35 30 242 195 219 110 79 85 175 135 150
8 5 4 6 4 3 7 4 4 10 6 5 8 5 4 9 5 4 157 124 104 77 63 55 118 94 8082 77 79 69 65 67 76 71 73 121 113 117 118 110 114 120 112 115 300 323 343 241 258 291 271 291 31710 7 4 9 5 3 9 6 4 11 8 5 10 6 4 11 7 4 117 116 111 56 48 46 86 82 7927 22 16 33 20 14 30 21 15 35 28 21 39 24 17 37 26 19 285 266 248 237 227 211 260 246 22961 40 30 59 38 29 60 39 29 81 53 39 83 53 39 82 53 39 286 292 300 198 178 161 243 234 229
152 124 103 121 98 82 137 111 93 246 198 160 214 172 140 231 185 150 473 428 367 377 326 295 425 378 331157 142 130 127 115 105 142 129 118 264 240 218 215 196 178 240 218 198 502 473 453 377 356 353 441 415 40370 56 46 58 48 44 64 52 45 97 75 61 79 65 59 88 70 60 474 447 398 293 278 287 385 361 351
113 84 61 97 72 53 105 78 57 157 113 79 146 105 73 152 109 76 346 358 323 276 255 233 310 306 27849 35 22 41 29 19 45 32 20 60 41 25 54 37 23 58 39 24 239 275 214 170 157 124 205 218 16917 10 6 13 9 5 15 9 6 19 12 7 15 10 6 17 11 7 304 271 245 133 114 103 219 193 1746 3 2 5 2 1 5 3 2 7 4 3 6 3 2 6 3 3 112 92 68 69 57 48 91 75 58
82 66 54 84 68 55 83 67 54 109 86 67 124 97 77 117 91 72 306 289 250 257 220 177 282 256 21564 38 26 56 34 23 60 36 25 97 51 33 85 45 29 91 48 31 286 248 229 266 217 188 275 232 20962 41 33 46 31 25 54 36 29 75 46 34 69 42 31 72 44 33 291 238 161 208 148 100 252 193 13145 41 39 39 35 33 42 38 36 58 52 48 48 43 41 53 48 45 253 243 386 171 169 180 213 207 2919 7 4 8 5 3 8 6 3 11 8 5 9 6 4 10 7 4 133 120 94 81 70 54 108 96 75
11 6 4 9 5 4 10 6 4 13 8 5 11 6 5 12 7 5 107 103 86 71 55 48 89 79 669 5 4 7 4 3 8 5 3 10 6 4 8 5 4 9 5 4 129 101 82 60 51 43 95 76 62
30 29 28 25 25 24 27 27 26 35 35 33 32 31 30 34 33 31 175 182 214 144 138 127 159 160 1705 4 3 4 3 2 5 3 3 7 5 4 6 4 3 6 5 4 109 98 88 53 48 44 81 73 66
33 24 18 31 22 17 32 23 18 41 28 21 38 26 19 39 27 20 241 195 181 166 123 117 205 161 15058 43 32 44 33 24 51 38 28 69 51 36 51 38 27 60 44 32 318 422 427 150 194 185 235 308 30771 85 89 57 68 71 64 77 80 105 126 131 89 107 111 97 117 121 300 483 406 210 417 370 255 449 38768 56 50 62 48 43 65 52 46 92 71 64 83 69 62 88 70 63 246 283 315 225 191 174 236 239 24917 10 10 14 7 9 16 9 9 20 13 11 16 10 10 18 11 11 112 86 71 84 62 49 102 78 6368 47 36 57 39 30 62 43 33 80 54 41 69 47 36 74 50 38 290 326 319 156 170 166 224 250 243
135 87 63 104 67 49 120 77 56 172 106 74 154 95 66 163 101 70 386 345 320 354 312 291 369 328 30516 12 8 11 9 9 14 11 9 20 15 10 15 11 10 17 13 10 311 320 312 118 117 115 215 218 21335 31 28 29 25 23 32 28 26 41 35 33 33 28 26 37 32 29 291 208 198 193 142 133 241 174 16486 89 72 76 79 64 81 84 68 109 113 89 96 100 78 102 107 84 287 629 795 214 432 670 247 520 725
153 125 103 122 100 83 138 113 93 218 174 141 193 154 125 206 164 133 952 418 352 502 316 287 844 368 31935 20 17 35 20 16 35 20 17 41 22 18 41 22 18 41 22 18 214 184 175 149 115 106 186 154 14511 8 6 10 9 6 10 8 6 15 11 7 12 11 7 13 11 7 287 293 344 107 103 115 196 197 2319 4 3 7 4 3 8 4 3 11 6 4 8 5 4 10 5 4 160 121 106 79 67 54 121 95 81
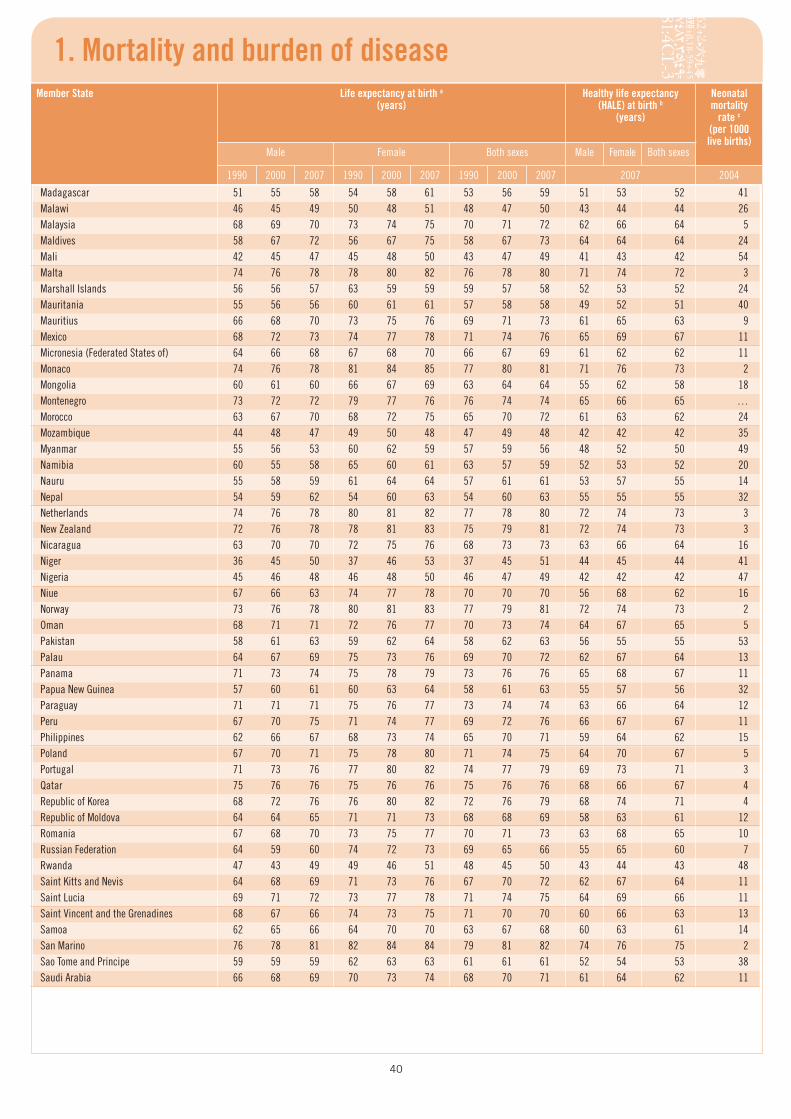
40
1. Mortality and burden of diseaseMember State Life expectancy at birth a
(years)Healthy life expectancy
(HALE) at birth b (years)
Neonatal mortality
rate c (per 1000 live births)
Male Female Both sexes Male Female Both sexes
1990 2000 2007 1990 2000 2007 1990 2000 2007 2007 2004
Madagascar 51 55 58 54 58 61 53 56 59 51 53 52 41Malawi 46 45 49 50 48 51 48 47 50 43 44 44 26Malaysia 68 69 70 73 74 75 70 71 72 62 66 64 5Maldives 58 67 72 56 67 75 58 67 73 64 64 64 24Mali 42 45 47 45 48 50 43 47 49 41 43 42 54Malta 74 76 78 78 80 82 76 78 80 71 74 72 3Marshall Islands 56 56 57 63 59 59 59 57 58 52 53 52 24Mauritania 55 56 56 60 61 61 57 58 58 49 52 51 40Mauritius 66 68 70 73 75 76 69 71 73 61 65 63 9Mexico 68 72 73 74 77 78 71 74 76 65 69 67 11Micronesia (Federated States of) 64 66 68 67 68 70 66 67 69 61 62 62 11Monaco 74 76 78 81 84 85 77 80 81 71 76 73 2Mongolia 60 61 60 66 67 69 63 64 64 55 62 58 18Montenegro 73 72 72 79 77 76 76 74 74 65 66 65 …Morocco 63 67 70 68 72 75 65 70 72 61 63 62 24Mozambique 44 48 47 49 50 48 47 49 48 42 42 42 35Myanmar 55 56 53 60 62 59 57 59 56 48 52 50 49Namibia 60 55 58 65 60 61 63 57 59 52 53 52 20Nauru 55 58 59 61 64 64 57 61 61 53 57 55 14Nepal 54 59 62 54 60 63 54 60 63 55 55 55 32Netherlands 74 76 78 80 81 82 77 78 80 72 74 73 3New Zealand 72 76 78 78 81 83 75 79 81 72 74 73 3Nicaragua 63 70 70 72 75 76 68 73 73 63 66 64 16Niger 36 45 50 37 46 53 37 45 51 44 45 44 41Nigeria 45 46 48 46 48 50 46 47 49 42 42 42 47Niue 67 66 63 74 77 78 70 70 70 56 68 62 16Norway 73 76 78 80 81 83 77 79 81 72 74 73 2Oman 68 71 71 72 76 77 70 73 74 64 67 65 5Pakistan 58 61 63 59 62 64 58 62 63 56 55 55 53Palau 64 67 69 75 73 76 69 70 72 62 67 64 13Panama 71 73 74 75 78 79 73 76 76 65 68 67 11Papua New Guinea 57 60 61 60 63 64 58 61 63 55 57 56 32Paraguay 71 71 71 75 76 77 73 74 74 63 66 64 12Peru 67 70 75 71 74 77 69 72 76 66 67 67 11Philippines 62 66 67 68 73 74 65 70 71 59 64 62 15Poland 67 70 71 75 78 80 71 74 75 64 70 67 5Portugal 71 73 76 77 80 82 74 77 79 69 73 71 3Qatar 75 76 76 75 76 76 75 76 76 68 66 67 4Republic of Korea 68 72 76 76 80 82 72 76 79 68 74 71 4Republic of Moldova 64 64 65 71 71 73 68 68 69 58 63 61 12Romania 67 68 70 73 75 77 70 71 73 63 68 65 10Russian Federation 64 59 60 74 72 73 69 65 66 55 65 60 7Rwanda 47 43 49 49 46 51 48 45 50 43 44 43 48Saint Kitts and Nevis 64 68 69 71 73 76 67 70 72 62 67 64 11Saint Lucia 69 71 72 73 77 78 71 74 75 64 69 66 11Saint Vincent and the Grenadines 68 67 66 74 73 75 71 70 70 60 66 63 13Samoa 62 65 66 64 70 70 63 67 68 60 63 61 14San Marino 76 78 81 82 84 84 79 81 82 74 76 75 2Sao Tome and Principe 59 59 59 62 63 63 61 61 61 52 54 53 38Saudi Arabia 66 68 69 70 73 74 68 70 71 61 64 62 11
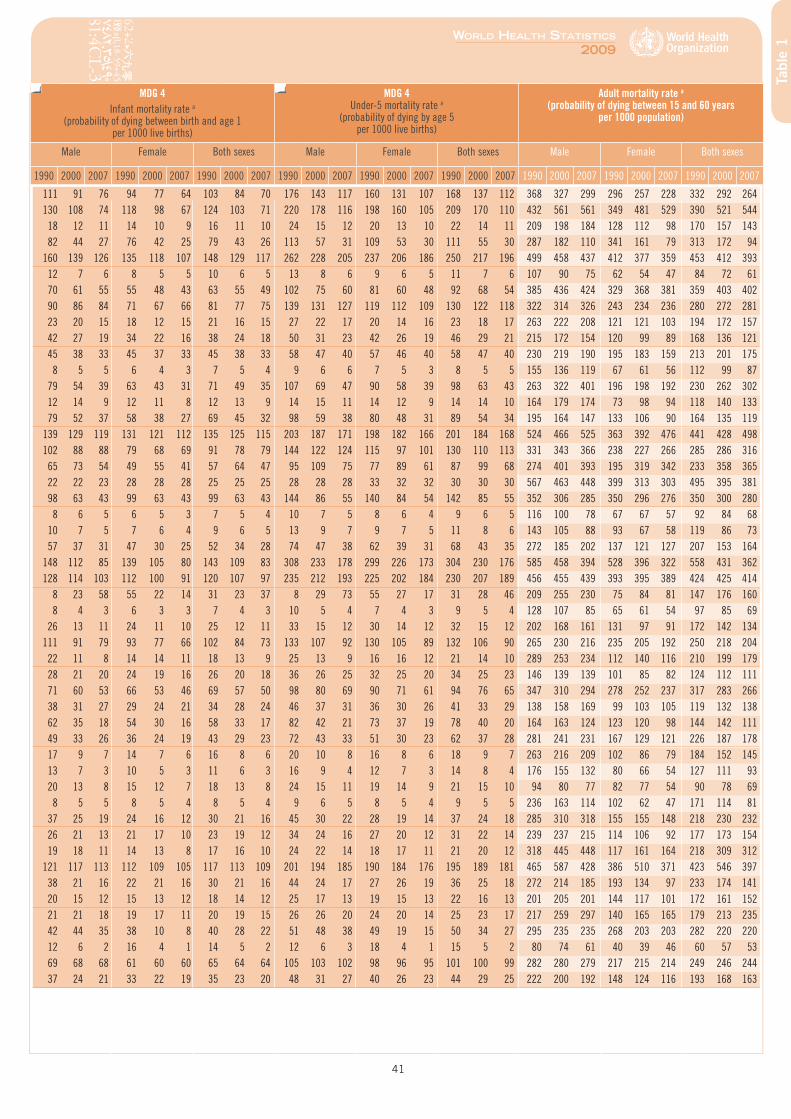
41
World HealtH StatiSticS
2009
Tabl
e 1
MDG 4Infant mortality rate a
(probability of dying between birth and age 1per 1000 live births)
MDG 4 Under-5 mortality rate a
(probability of dying by age 5 per 1000 live births)
Adult mortality rate a (probability of dying between 15 and 60 years
per 1000 population)
Male Female Both sexes Male Female Both sexes Male Female Both sexes
1990 2000 2007 1990 2000 2007 1990 2000 2007 1990 2000 2007 1990 2000 2007 1990 2000 2007 1990 2000 2007 1990 2000 2007 1990 2000 2007
111 91 76 94 77 64 103 84 70 176 143 117 160 131 107 168 137 112 368 327 299 296 257 228 332 292 264130 108 74 118 98 67 124 103 71 220 178 116 198 160 105 209 170 110 432 561 561 349 481 529 390 521 54418 12 11 14 10 9 16 11 10 24 15 12 20 13 10 22 14 11 209 198 184 128 112 98 170 157 14382 44 27 76 42 25 79 43 26 113 57 31 109 53 30 111 55 30 287 182 110 341 161 79 313 172 94
160 139 126 135 118 107 148 129 117 262 228 205 237 206 186 250 217 196 499 458 437 412 377 359 453 412 39312 7 6 8 5 5 10 6 5 13 8 6 9 6 5 11 7 6 107 90 75 62 54 47 84 72 6170 61 55 55 48 43 63 55 49 102 75 60 81 60 48 92 68 54 385 436 424 329 368 381 359 403 40290 86 84 71 67 66 81 77 75 139 131 127 119 112 109 130 122 118 322 314 326 243 234 236 280 272 28123 20 15 18 12 15 21 16 15 27 22 17 20 14 16 23 18 17 263 222 208 121 121 103 194 172 15742 27 19 34 22 16 38 24 18 50 31 23 42 26 19 46 29 21 215 172 154 120 99 89 168 136 12145 38 33 45 37 33 45 38 33 58 47 40 57 46 40 58 47 40 230 219 190 195 183 159 213 201 1758 5 5 6 4 3 7 5 4 9 6 6 7 5 3 8 5 5 155 136 119 67 61 56 112 99 87
79 54 39 63 43 31 71 49 35 107 69 47 90 58 39 98 63 43 263 322 401 196 198 192 230 262 30212 14 9 12 11 8 12 13 9 14 15 11 14 12 9 14 14 10 164 179 174 73 98 94 118 140 13379 52 37 58 38 27 69 45 32 98 59 38 80 48 31 89 54 34 195 164 147 133 106 90 164 135 119
139 129 119 131 121 112 135 125 115 203 187 171 198 182 166 201 184 168 524 466 525 363 392 476 441 428 498102 88 88 79 68 69 91 78 79 144 122 124 115 97 101 130 110 113 331 343 366 238 227 266 285 286 31665 73 54 49 55 41 57 64 47 95 109 75 77 89 61 87 99 68 274 401 393 195 319 342 233 358 36522 22 23 28 28 28 25 25 25 28 28 28 33 32 32 30 30 30 567 463 448 399 313 303 495 395 38198 63 43 99 63 43 99 63 43 144 86 55 140 84 54 142 85 55 352 306 285 350 296 276 350 300 2808 6 5 6 5 3 7 5 4 10 7 5 8 6 4 9 6 5 116 100 78 67 67 57 92 84 68
10 7 5 7 6 4 9 6 5 13 9 7 9 7 5 11 8 6 143 105 88 93 67 58 119 86 7357 37 31 47 30 25 52 34 28 74 47 38 62 39 31 68 43 35 272 185 202 137 121 127 207 153 164
148 112 85 139 105 80 143 109 83 308 233 178 299 226 173 304 230 176 585 458 394 528 396 322 558 431 362128 114 103 112 100 91 120 107 97 235 212 193 225 202 184 230 207 189 456 455 439 393 395 389 424 425 414
8 23 58 55 22 14 31 23 37 8 29 73 55 27 17 31 28 46 209 255 230 75 84 81 147 176 1608 4 3 6 3 3 7 4 3 10 5 4 7 4 3 9 5 4 128 107 85 65 61 54 97 85 69
26 13 11 24 11 10 25 12 11 33 15 12 30 14 12 32 15 12 202 168 161 131 97 91 172 142 134111 91 79 93 77 66 102 84 73 133 107 92 130 105 89 132 106 90 265 230 216 235 205 192 250 218 20422 11 8 14 14 11 18 13 9 25 13 9 16 16 12 21 14 10 289 253 234 112 140 116 210 199 17928 21 20 24 19 16 26 20 18 36 26 25 32 25 20 34 25 23 146 139 139 101 85 82 124 112 11171 60 53 66 53 46 69 57 50 98 80 69 90 71 61 94 76 65 347 310 294 278 252 237 317 283 26638 31 27 29 24 21 34 28 24 46 37 31 36 30 26 41 33 29 138 158 169 99 103 105 119 132 13862 35 18 54 30 16 58 33 17 82 42 21 73 37 19 78 40 20 164 163 124 123 120 98 144 142 11149 33 26 36 24 19 43 29 23 72 43 33 51 30 23 62 37 28 281 241 231 167 129 121 226 187 17817 9 7 14 7 6 16 8 6 20 10 8 16 8 6 18 9 7 263 216 209 102 86 79 184 152 14513 7 3 10 5 3 11 6 3 16 9 4 12 7 3 14 8 4 176 155 132 80 66 54 127 111 9320 13 8 15 12 7 18 13 8 24 15 11 19 14 9 21 15 10 94 80 77 82 77 54 90 78 698 5 5 8 5 4 8 5 4 9 6 5 8 5 4 9 5 5 236 163 114 102 62 47 171 114 81
37 25 19 24 16 12 30 21 16 45 30 22 28 19 14 37 24 18 285 310 318 155 155 148 218 230 23226 21 13 21 17 10 23 19 12 34 24 16 27 20 12 31 22 14 239 237 215 114 106 92 177 173 15419 18 11 14 13 8 17 16 10 24 22 14 18 17 11 21 20 12 318 445 448 117 161 164 218 309 312
121 117 113 112 109 105 117 113 109 201 194 185 190 184 176 195 189 181 465 587 428 386 510 371 423 546 39738 21 16 22 21 16 30 21 16 44 24 17 27 26 19 36 25 18 272 214 185 193 134 97 233 174 14120 15 12 15 13 12 18 14 12 25 17 13 19 15 13 22 16 13 201 205 201 144 117 101 172 161 15221 21 18 19 17 11 20 19 15 26 26 20 24 20 14 25 23 17 217 259 297 140 165 165 179 213 23542 44 35 38 10 8 40 28 22 51 48 38 49 19 15 50 34 27 295 235 235 268 203 203 282 220 22012 6 2 16 4 1 14 5 2 12 6 3 18 4 1 15 5 2 80 74 61 40 39 46 60 57 5369 68 68 61 60 60 65 64 64 105 103 102 98 96 95 101 100 99 282 280 279 217 215 214 249 246 24437 24 21 33 22 19 35 23 20 48 31 27 40 26 23 44 29 25 222 200 192 148 124 116 193 168 163
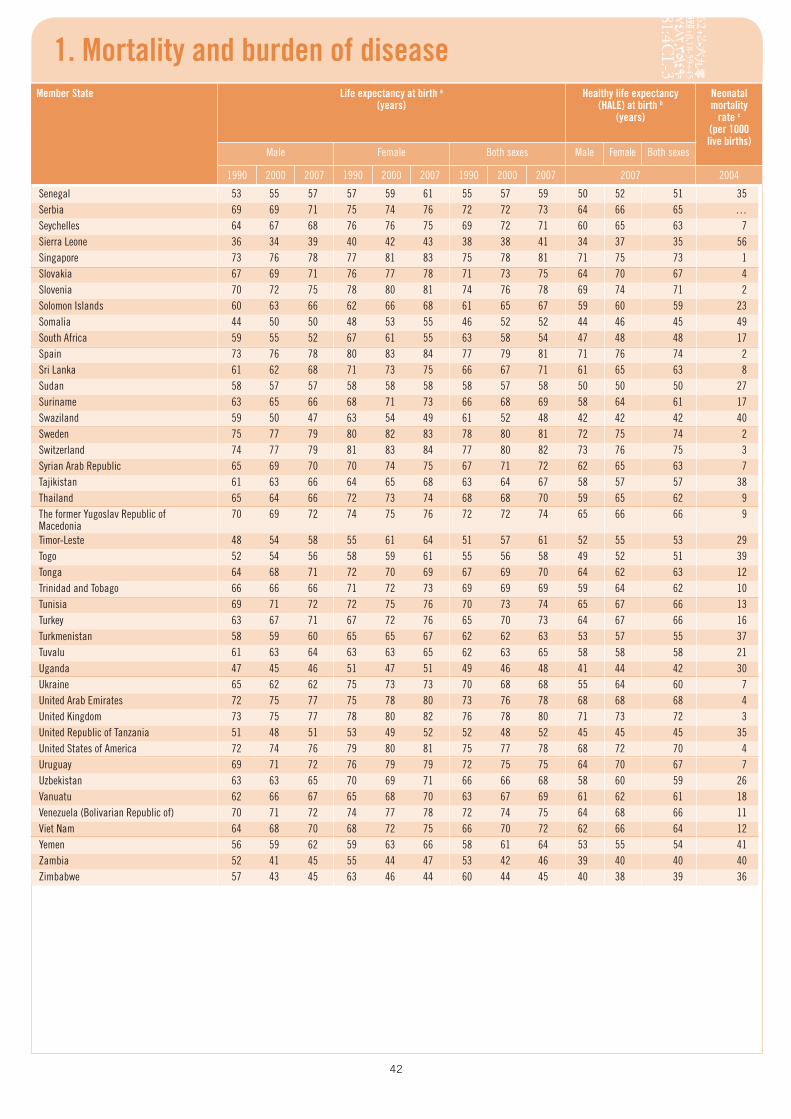
42
1. Mortality and burden of diseaseMember State Life expectancy at birth a
(years)Healthy life expectancy
(HALE) at birth b (years)
Neonatal mortality
rate c (per 1000 live births)
Male Female Both sexes Male Female Both sexes
1990 2000 2007 1990 2000 2007 1990 2000 2007 2007 2004
Senegal 53 55 57 57 59 61 55 57 59 50 52 51 35Serbia 69 69 71 75 74 76 72 72 73 64 66 65 …Seychelles 64 67 68 76 76 75 69 72 71 60 65 63 7Sierra Leone 36 34 39 40 42 43 38 38 41 34 37 35 56Singapore 73 76 78 77 81 83 75 78 81 71 75 73 1Slovakia 67 69 71 76 77 78 71 73 75 64 70 67 4Slovenia 70 72 75 78 80 81 74 76 78 69 74 71 2Solomon Islands 60 63 66 62 66 68 61 65 67 59 60 59 23Somalia 44 50 50 48 53 55 46 52 52 44 46 45 49South Africa 59 55 52 67 61 55 63 58 54 47 48 48 17Spain 73 76 78 80 83 84 77 79 81 71 76 74 2Sri Lanka 61 62 68 71 73 75 66 67 71 61 65 63 8Sudan 58 57 57 58 58 58 58 57 58 50 50 50 27Suriname 63 65 66 68 71 73 66 68 69 58 64 61 17Swaziland 59 50 47 63 54 49 61 52 48 42 42 42 40Sweden 75 77 79 80 82 83 78 80 81 72 75 74 2Switzerland 74 77 79 81 83 84 77 80 82 73 76 75 3Syrian Arab Republic 65 69 70 70 74 75 67 71 72 62 65 63 7Tajikistan 61 63 66 64 65 68 63 64 67 58 57 57 38Thailand 65 64 66 72 73 74 68 68 70 59 65 62 9The former Yugoslav Republic of Macedonia
70 69 72 74 75 76 72 72 74 65 66 66 9
Timor-Leste 48 54 58 55 61 64 51 57 61 52 55 53 29Togo 52 54 56 58 59 61 55 56 58 49 52 51 39Tonga 64 68 71 72 70 69 67 69 70 64 62 63 12Trinidad and Tobago 66 66 66 71 72 73 69 69 69 59 64 62 10Tunisia 69 71 72 72 75 76 70 73 74 65 67 66 13Turkey 63 67 71 67 72 76 65 70 73 64 67 66 16Turkmenistan 58 59 60 65 65 67 62 62 63 53 57 55 37Tuvalu 61 63 64 63 63 65 62 63 65 58 58 58 21Uganda 47 45 46 51 47 51 49 46 48 41 44 42 30Ukraine 65 62 62 75 73 73 70 68 68 55 64 60 7United Arab Emirates 72 75 77 75 78 80 73 76 78 68 68 68 4United Kingdom 73 75 77 78 80 82 76 78 80 71 73 72 3United Republic of Tanzania 51 48 51 53 49 52 52 48 52 45 45 45 35United States of America 72 74 76 79 80 81 75 77 78 68 72 70 4Uruguay 69 71 72 76 79 79 72 75 75 64 70 67 7Uzbekistan 63 63 65 70 69 71 66 66 68 58 60 59 26Vanuatu 62 66 67 65 68 70 63 67 69 61 62 61 18Venezuela (Bolivarian Republic of) 70 71 72 74 77 78 72 74 75 64 68 66 11Viet Nam 64 68 70 68 72 75 66 70 72 62 66 64 12Yemen 56 59 62 59 63 66 58 61 64 53 55 54 41Zambia 52 41 45 55 44 47 53 42 46 39 40 40 40Zimbabwe 57 43 45 63 46 44 60 44 45 40 38 39 36
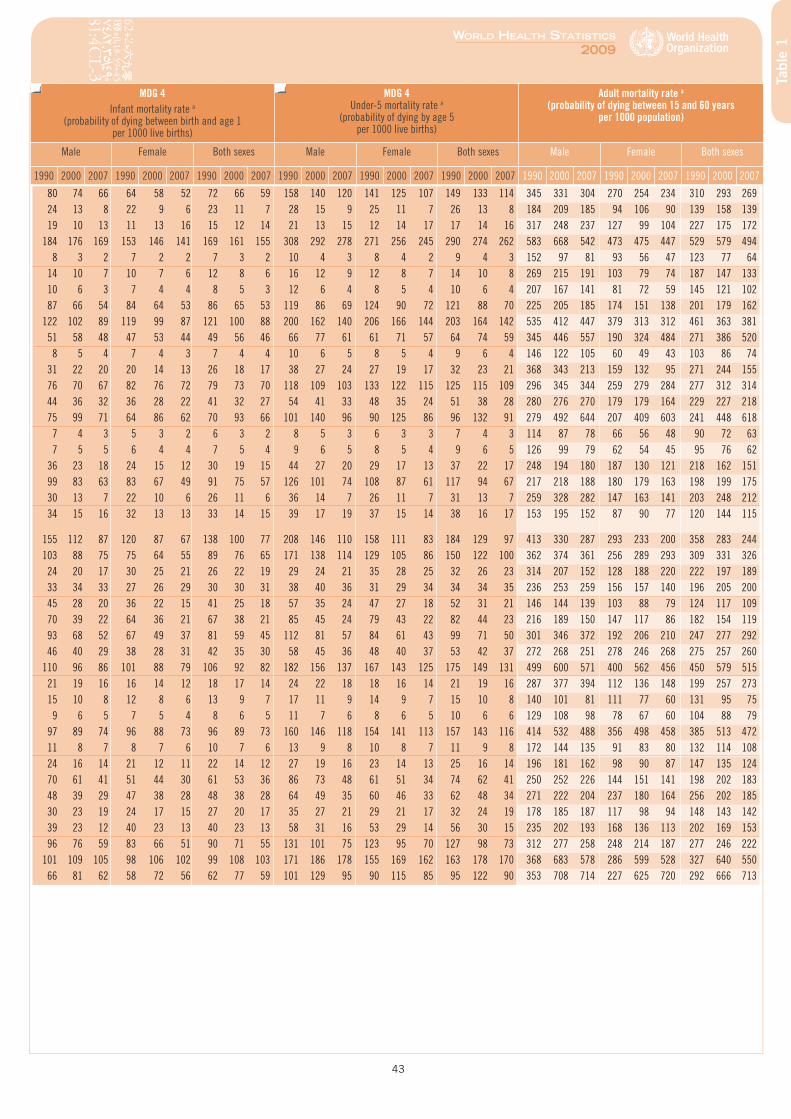
43
World HealtH StatiSticS
2009
Tabl
e 1
MDG 4Infant mortality rate a
(probability of dying between birth and age 1per 1000 live births)
MDG 4 Under-5 mortality rate a
(probability of dying by age 5 per 1000 live births)
Adult mortality rate a (probability of dying between 15 and 60 years
per 1000 population)
Male Female Both sexes Male Female Both sexes Male Female Both sexes
1990 2000 2007 1990 2000 2007 1990 2000 2007 1990 2000 2007 1990 2000 2007 1990 2000 2007 1990 2000 2007 1990 2000 2007 1990 2000 2007
80 74 66 64 58 52 72 66 59 158 140 120 141 125 107 149 133 114 345 331 304 270 254 234 310 293 26924 13 8 22 9 6 23 11 7 28 15 9 25 11 7 26 13 8 184 209 185 94 106 90 139 158 13919 10 13 11 13 16 15 12 14 21 13 15 12 14 17 17 14 16 317 248 237 127 99 104 227 175 172
184 176 169 153 146 141 169 161 155 308 292 278 271 256 245 290 274 262 583 668 542 473 475 447 529 579 4948 3 2 7 2 2 7 3 2 10 4 3 8 4 2 9 4 3 152 97 81 93 56 47 123 77 64
14 10 7 10 7 6 12 8 6 16 12 9 12 8 7 14 10 8 269 215 191 103 79 74 187 147 13310 6 3 7 4 4 8 5 3 12 6 4 8 5 4 10 6 4 207 167 141 81 72 59 145 121 10287 66 54 84 64 53 86 65 53 119 86 69 124 90 72 121 88 70 225 205 185 174 151 138 201 179 162
122 102 89 119 99 87 121 100 88 200 162 140 206 166 144 203 164 142 535 412 447 379 313 312 461 363 38151 58 48 47 53 44 49 56 46 66 77 61 61 71 57 64 74 59 345 446 557 190 324 484 271 386 5208 5 4 7 4 3 7 4 4 10 6 5 8 5 4 9 6 4 146 122 105 60 49 43 103 86 74
31 22 20 20 14 13 26 18 17 38 27 24 27 19 17 32 23 21 368 343 213 159 132 95 271 244 15576 70 67 82 76 72 79 73 70 118 109 103 133 122 115 125 115 109 296 345 344 259 279 284 277 312 31444 36 32 36 28 22 41 32 27 54 41 33 48 35 24 51 38 28 280 276 270 179 179 164 229 227 21875 99 71 64 86 62 70 93 66 101 140 96 90 125 86 96 132 91 279 492 644 207 409 603 241 448 618
7 4 3 5 3 2 6 3 2 8 5 3 6 3 3 7 4 3 114 87 78 66 56 48 90 72 637 5 5 6 4 4 7 5 4 9 6 5 8 5 4 9 6 5 126 99 79 62 54 45 95 76 62
36 23 18 24 15 12 30 19 15 44 27 20 29 17 13 37 22 17 248 194 180 187 130 121 218 162 15199 83 63 83 67 49 91 75 57 126 101 74 108 87 61 117 94 67 217 218 188 180 179 163 198 199 17530 13 7 22 10 6 26 11 6 36 14 7 26 11 7 31 13 7 259 328 282 147 163 141 203 248 21234 15 16 32 13 13 33 14 15 39 17 19 37 15 14 38 16 17 153 195 152 87 90 77 120 144 115
155 112 87 120 87 67 138 100 77 208 146 110 158 111 83 184 129 97 413 330 287 293 233 200 358 283 244103 88 75 75 64 55 89 76 65 171 138 114 129 105 86 150 122 100 362 374 361 256 289 293 309 331 32624 20 17 30 25 21 26 22 19 29 24 21 35 28 25 32 26 23 314 207 152 128 188 220 222 197 18933 34 33 27 26 29 30 30 31 38 40 36 31 29 34 34 34 35 236 253 259 156 157 140 196 205 20045 28 20 36 22 15 41 25 18 57 35 24 47 27 18 52 31 21 146 144 139 103 88 79 124 117 10970 39 22 64 36 21 67 38 21 85 45 24 79 43 22 82 44 23 216 189 150 147 117 86 182 154 11993 68 52 67 49 37 81 59 45 112 81 57 84 61 43 99 71 50 301 346 372 192 206 210 247 277 29246 40 29 38 28 31 42 35 30 58 45 36 48 40 37 53 42 37 272 268 251 278 246 268 275 257 260
110 96 86 101 88 79 106 92 82 182 156 137 167 143 125 175 149 131 499 600 571 400 562 456 450 579 51521 19 16 16 14 12 18 17 14 24 22 18 18 16 14 21 19 16 287 377 394 112 136 148 199 257 27315 10 8 12 8 6 13 9 7 17 11 9 14 9 7 15 10 8 140 101 81 111 77 60 131 95 759 6 5 7 5 4 8 6 5 11 7 6 8 6 5 10 6 6 129 108 98 78 67 60 104 88 79
97 89 74 96 88 73 96 89 73 160 146 118 154 141 113 157 143 116 414 532 488 356 498 458 385 513 47211 8 7 8 7 6 10 7 6 13 9 8 10 8 7 11 9 8 172 144 135 91 83 80 132 114 10824 16 14 21 12 11 22 14 12 27 19 16 23 14 13 25 16 14 196 181 162 98 90 87 147 135 12470 61 41 51 44 30 61 53 36 86 73 48 61 51 34 74 62 41 250 252 226 144 151 141 198 202 18348 39 29 47 38 28 48 38 28 64 49 35 60 46 33 62 48 34 271 222 204 237 180 164 256 202 18530 23 19 24 17 15 27 20 17 35 27 21 29 21 17 32 24 19 178 185 187 117 98 94 148 143 14239 23 12 40 23 13 40 23 13 58 31 16 53 29 14 56 30 15 235 202 193 168 136 113 202 169 15396 76 59 83 66 51 90 71 55 131 101 75 123 95 70 127 98 73 312 277 258 248 214 187 277 246 222
101 109 105 98 106 102 99 108 103 171 186 178 155 169 162 163 178 170 368 683 578 286 599 528 327 640 55066 81 62 58 72 56 62 77 59 101 129 95 90 115 85 95 122 90 353 708 714 227 625 720 292 666 713
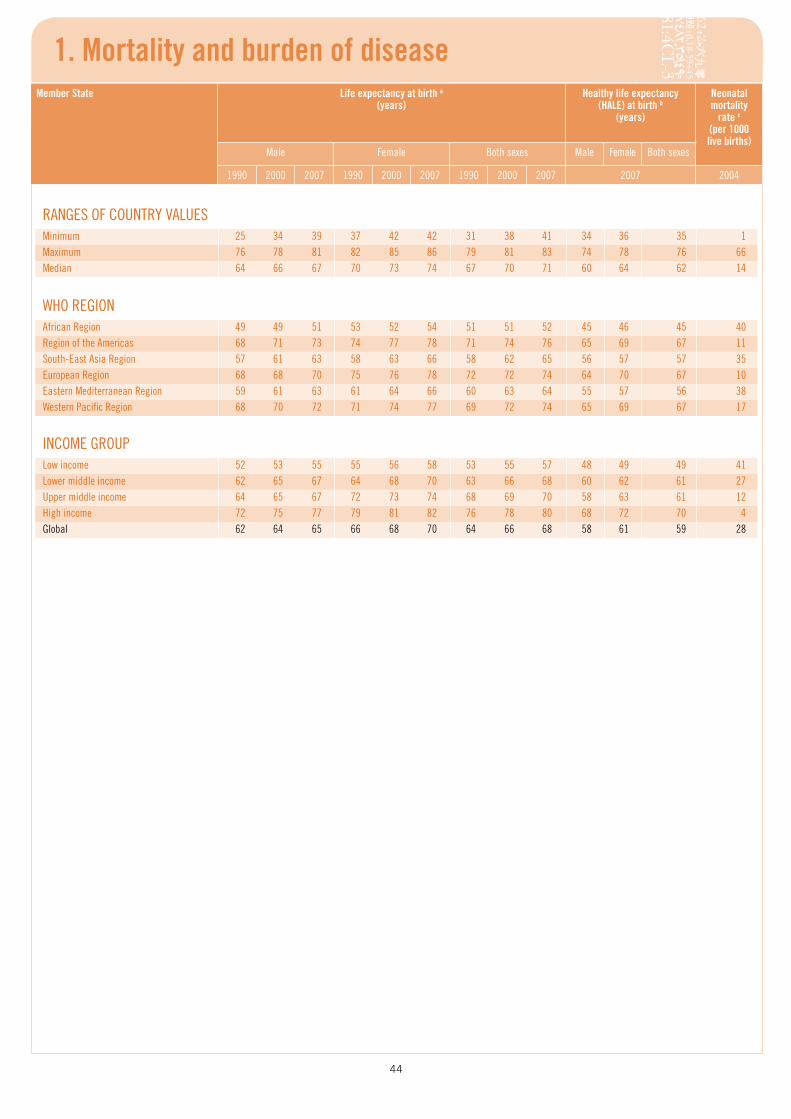
44
1. Mortality and burden of diseaseMember State Life expectancy at birth a
(years)Healthy life expectancy
(HALE) at birth b (years)
Neonatal mortality
rate c (per 1000 live births)
Male Female Both sexes Male Female Both sexes
1990 2000 2007 1990 2000 2007 1990 2000 2007 2007 2004
WHO REGIONAfrican Region 49 49 51 53 52 54 51 51 52 45 46 45 40Region of the Americas 68 71 73 74 77 78 71 74 76 65 69 67 11South-East Asia Region 57 61 63 58 63 66 58 62 65 56 57 57 35European Region 68 68 70 75 76 78 72 72 74 64 70 67 10Eastern Mediterranean Region 59 61 63 61 64 66 60 63 64 55 57 56 38Western Pacific Region 68 70 72 71 74 77 69 72 74 65 69 67 17
RANGES OF COUNTRY VALUESMinimum 25 34 39 37 42 42 31 38 41 34 36 35 1Maximum 76 78 81 82 85 86 79 81 83 74 78 76 66Median 64 66 67 70 73 74 67 70 71 60 64 62 14
INCOME GROUPLow income 52 53 55 55 56 58 53 55 57 48 49 49 41Lower middle income 62 65 67 64 68 70 63 66 68 60 62 61 27Upper middle income 64 65 67 72 73 74 68 69 70 58 63 61 12High income 72 75 77 79 81 82 76 78 80 68 72 70 4Global 62 64 65 66 68 70 64 66 68 58 61 59 28
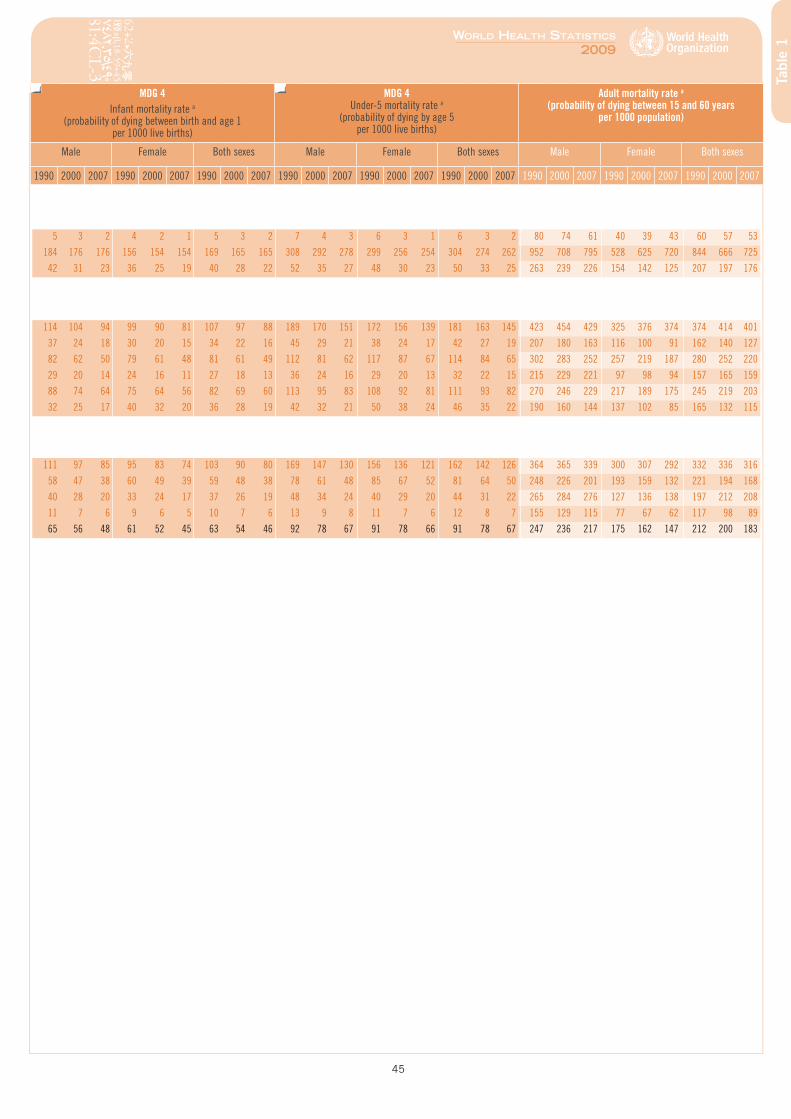
45
World HealtH StatiSticS
2009
Tabl
e 1
MDG 4Infant mortality rate a
(probability of dying between birth and age 1per 1000 live births)
MDG 4 Under-5 mortality rate a
(probability of dying by age 5 per 1000 live births)
Adult mortality rate a (probability of dying between 15 and 60 years
per 1000 population)
Male Female Both sexes Male Female Both sexes Male Female Both sexes
1990 2000 2007 1990 2000 2007 1990 2000 2007 1990 2000 2007 1990 2000 2007 1990 2000 2007 1990 2000 2007 1990 2000 2007 1990 2000 2007
114 104 94 99 90 81 107 97 88 189 170 151 172 156 139 181 163 145 423 454 429 325 376 374 374 414 401
37 24 18 30 20 15 34 22 16 45 29 21 38 24 17 42 27 19 207 180 163 116 100 91 162 140 127
82 62 50 79 61 48 81 61 49 112 81 62 117 87 67 114 84 65 302 283 252 257 219 187 280 252 220
29 20 14 24 16 11 27 18 13 36 24 16 29 20 13 32 22 15 215 229 221 97 98 94 157 165 159
88 74 64 75 64 56 82 69 60 113 95 83 108 92 81 111 93 82 270 246 229 217 189 175 245 219 203
32 25 17 40 32 20 36 28 19 42 32 21 50 38 24 46 35 22 190 160 144 137 102 85 165 132 115
5 3 2 4 2 1 5 3 2 7 4 3 6 3 1 6 3 2 80 74 61 40 39 43 60 57 53
184 176 176 156 154 154 169 165 165 308 292 278 299 256 254 304 274 262 952 708 795 528 625 720 844 666 725
42 31 23 36 25 19 40 28 22 52 35 27 48 30 23 50 33 25 263 239 226 154 142 125 207 197 176
111 97 85 95 83 74 103 90 80 169 147 130 156 136 121 162 142 126 364 365 339 300 307 292 332 336 316
58 47 38 60 49 39 59 48 38 78 61 48 85 67 52 81 64 50 248 226 201 193 159 132 221 194 168
40 28 20 33 24 17 37 26 19 48 34 24 40 29 20 44 31 22 265 284 276 127 136 138 197 212 208
11 7 6 9 6 5 10 7 6 13 9 8 11 7 6 12 8 7 155 129 115 77 67 62 117 98 89
65 56 48 61 52 45 63 54 46 92 78 67 91 78 66 91 78 67 247 236 217 175 162 147 212 200 183

World HealtH StatiSticS
2009
47
Cause-specific mortality and morbidity
Out of every 10 deaths worldwide, 6 are due to noncommunicable conditions; 3 to communicable, reproductive or nutritional conditions; and 1 to injuries. Many developing countries have mortality patterns that reflect high levels of infectious diseases and the risk of death during pregnancy and childbirth, in addition to the cancers, cardiovascular diseases and chronic respiratory diseases that account for most deaths in the developed world.
Years of life lost (YLL) take into account the age at which deaths occur by giving greater weight to deaths occurring at younger ages and lower weight to deaths occurring at older ages. Globally, communicable diseases account for 51% of years of life lost, with noncommunicable diseases accounting for 34% and injuries for 14%. However, there are large variations across regions. In high-income countries, communicable diseases account for only 8% of years of life lost, compared with 68% in low-income countries.
This table includes country-specific results from death registration, health system information systems, incidence and prevalence surveys, survey and census data on child deaths, sibling deaths and deaths in the household as well as studies on deaths due to HIV/AIDS and conflict. There are considerable uncertainty ranges for many countries due to limitations in data availability, quality and timeliness. Uncertainty in estimated all-cause mortality for 2007 ranges from ±1% for high-income countries to ±15–20% for sub-Saharan Africa, reflecting a large difference in data availability. Uncertainty ranges are generally larger for deaths from specific causes. For example, the relative uncertainty for deaths from ischaemic heart disease ranges from around ±12% for high-income countries to ±25–35% for sub-Saharan Africa.
For any given disease, incidence is the number of new cases each year, prevalence is the number of people with the disease at a point in time, and mortality is the number who die from that cause each year.
While global tuberculosis prevalence is estimated to have decreased between 1990 and 2007 due to improved treatment, incidence has increased over this period, mainly due to a resurgence in the WHO African and European Regions. These numbers are surrounded by much uncertainty due to an absence of population-based data on the rates of clinically confirmed tuberculosis cases. In most countries, tuberculosis case-detection estimates are based primarily on the number of people with pulmonary tuberculosis who present to health facilities; those who do not reach health facilities are not included in the calculations.
The prevalence of HIV infection is highest in the African Region. Two thirds of the global total of 33 million people with HIV live in this region. In countries with generalized epidemics, HIV prevalence is estimated from antenatal clinic attendees and population-based surveys. In concentrated and low level epidemics (where HIV prevalence in pregnant women is below 1%), estimates are derived from surveillance of populations with high-risk behaviours.
Tabl
e 2
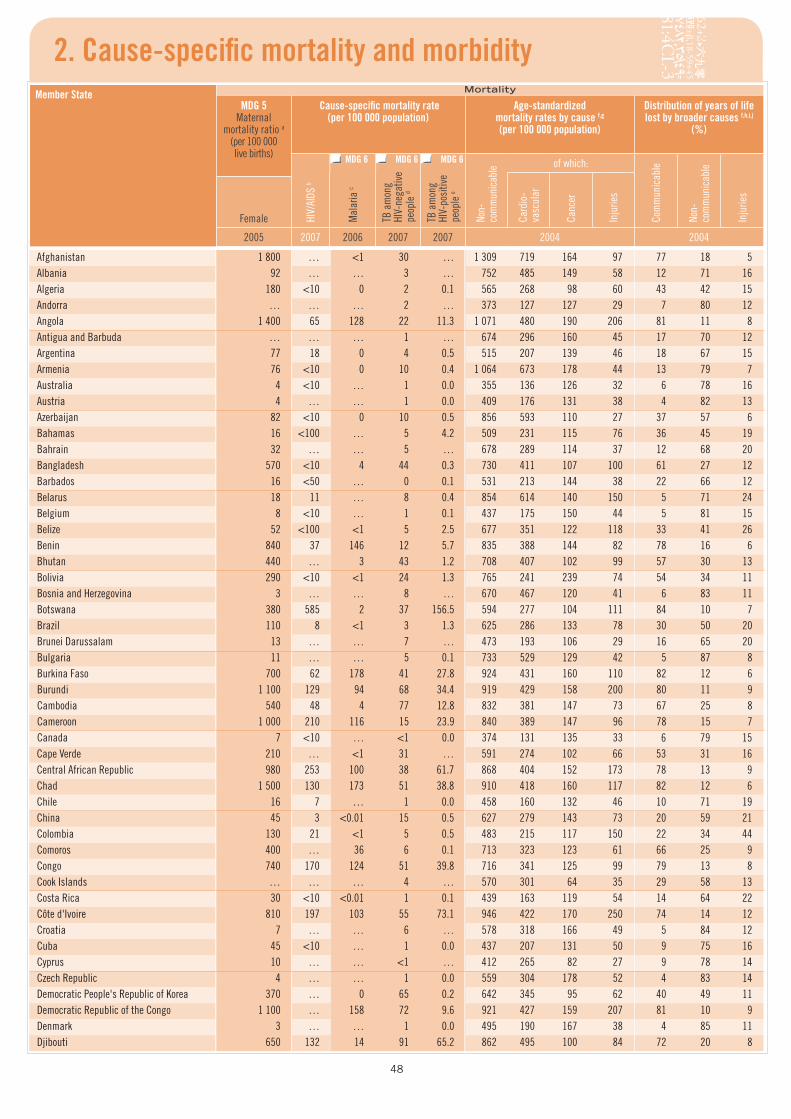
48
2. Cause-specific mortality and morbidityMember State Mortality
MDG 5 Maternal
mortality ratio a (per 100 000 live births)
Cause-specific mortality rate (per 100 000 population)
Age-standardized mortality rates by cause f,g (per 100 000 population)
Distribution of years of life lost by broader causes f,h,i,j
(%)
HIV/
AIDS
b
Mal
aria
c
TB a
mon
g HI
V-ne
gativ
e pe
ople
d
TB a
mon
g HI
V-po
sitiv
e pe
ople
e
Non-
co
mm
unic
able of which:
Com
mun
icab
le
Non-
co
mm
unic
able
Inju
ries
Card
io-
vasc
ular
Canc
er
Inju
ries
Female
2005 2007 2006 2007 2007 2004 2004
MDG 6 MDG 6MDG 6
Afghanistan 1 800 … <1 30 … 1 309 719 164 97 77 18 5Albania 92 … … 3 … 752 485 149 58 12 71 16Algeria 180 <10 0 2 0.1 565 268 98 60 43 42 15Andorra … … … 2 … 373 127 127 29 7 80 12Angola 1 400 65 128 22 11.3 1 071 480 190 206 81 11 8Antigua and Barbuda … … … 1 … 674 296 160 45 17 70 12Argentina 77 18 0 4 0.5 515 207 139 46 18 67 15Armenia 76 <10 0 10 0.4 1 064 673 178 44 13 79 7Australia 4 <10 … 1 0.0 355 136 126 32 6 78 16Austria 4 … … 1 0.0 409 176 131 38 4 82 13Azerbaijan 82 <10 0 10 0.5 856 593 110 27 37 57 6Bahamas 16 <100 … 5 4.2 509 231 115 76 36 45 19Bahrain 32 … … 5 … 678 289 114 37 12 68 20Bangladesh 570 <10 4 44 0.3 730 411 107 100 61 27 12Barbados 16 <50 … 0 0.1 531 213 144 38 22 66 12Belarus 18 11 … 8 0.4 854 614 140 150 5 71 24Belgium 8 <10 … 1 0.1 437 175 150 44 5 81 15Belize 52 <100 <1 5 2.5 677 351 122 118 33 41 26Benin 840 37 146 12 5.7 835 388 144 82 78 16 6Bhutan 440 … 3 43 1.2 708 407 102 99 57 30 13Bolivia 290 <10 <1 24 1.3 765 241 239 74 54 34 11Bosnia and Herzegovina 3 … … 8 … 670 467 120 41 6 83 11Botswana 380 585 2 37 156.5 594 277 104 111 84 10 7Brazil 110 8 <1 3 1.3 625 286 133 78 30 50 20Brunei Darussalam 13 … … 7 … 473 193 106 29 16 65 20Bulgaria 11 … … 5 0.1 733 529 129 42 5 87 8Burkina Faso 700 62 178 41 27.8 924 431 160 110 82 12 6Burundi 1 100 129 94 68 34.4 919 429 158 200 80 11 9Cambodia 540 48 4 77 12.8 832 381 147 73 67 25 8Cameroon 1 000 210 116 15 23.9 840 389 147 96 78 15 7Canada 7 <10 … <1 0.0 374 131 135 33 6 79 15Cape Verde 210 … <1 31 … 591 274 102 66 53 31 16Central African Republic 980 253 100 38 61.7 868 404 152 173 78 13 9Chad 1 500 130 173 51 38.8 910 418 160 117 82 12 6Chile 16 7 … 1 0.0 458 160 132 46 10 71 19China 45 3 <0.01 15 0.5 627 279 143 73 20 59 21Colombia 130 21 <1 5 0.5 483 215 117 150 22 34 44Comoros 400 … 36 6 0.1 713 323 123 61 66 25 9Congo 740 170 124 51 39.8 716 341 125 99 79 13 8Cook Islands … … … 4 … 570 301 64 35 29 58 13Costa Rica 30 <10 <0.01 1 0.1 439 163 119 54 14 64 22Côte d'Ivoire 810 197 103 55 73.1 946 422 170 250 74 14 12Croatia 7 … … 6 … 578 318 166 49 5 84 12Cuba 45 <10 … 1 0.0 437 207 131 50 9 75 16Cyprus 10 … … <1 … 412 265 82 27 9 78 14Czech Republic 4 … … 1 0.0 559 304 178 52 4 83 14Democratic People's Republic of Korea 370 … 0 65 0.2 642 345 95 62 40 49 11Democratic Republic of the Congo 1 100 … 158 72 9.6 921 427 159 207 81 10 9Denmark 3 … … 1 0.0 495 190 167 38 4 85 11Djibouti 650 132 14 91 65.2 862 495 100 84 72 20 8
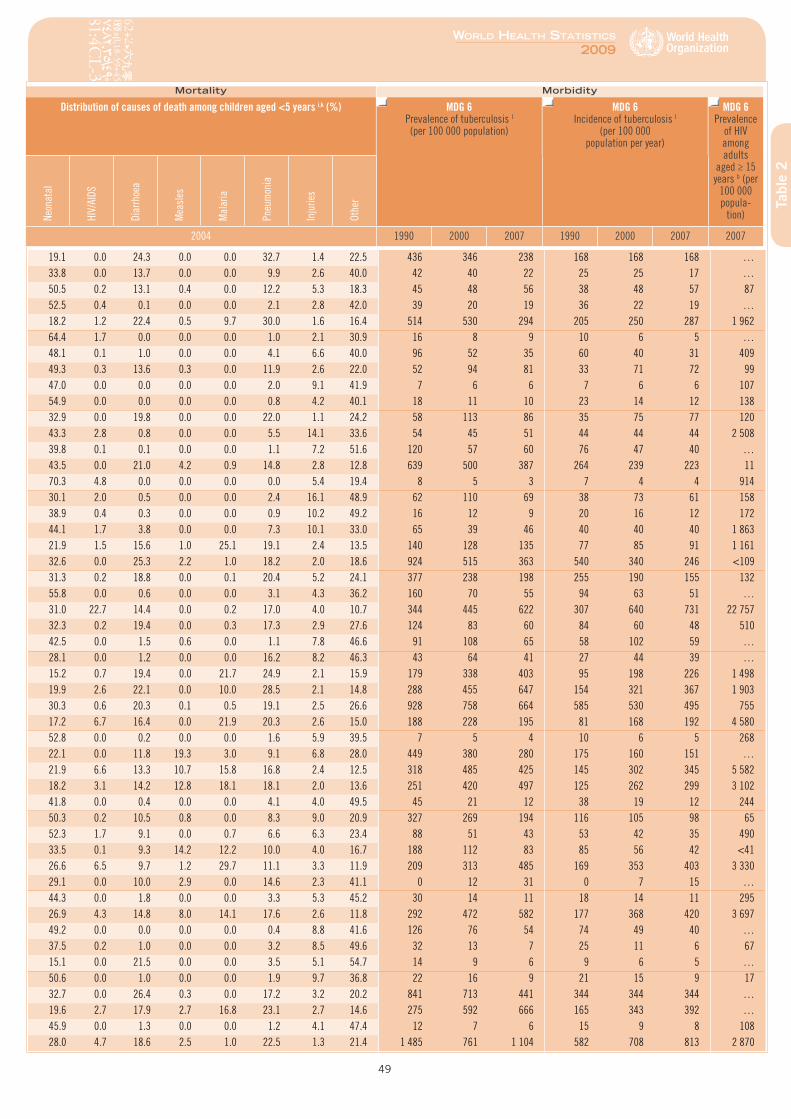
49
World HealtH StatiSticS
2009
Mortality Morbidity
Distribution of causes of death among children aged <5 years i,k (%) MDG 6 Prevalence of tuberculosis l (per 100 000 population)
MDG 6 Incidence of tuberculosis l
(per 100 000 population per year)
MDG 6 Prevalence
of HIV among adults
aged ≥ 15 years b (per
100 000 popula-
tion)Neon
atal
HIV/
AIDS
Diar
rhoe
a
Mea
sles
Mal
aria
Pneu
mon
ia
Inju
ries
Othe
r
2004 1990 2000 2007 1990 2000 2007 2007
Tabl
e 2
19.1 0.0 24.3 0.0 0.0 32.7 1.4 22.5 436 346 238 168 168 168 …33.8 0.0 13.7 0.0 0.0 9.9 2.6 40.0 42 40 22 25 25 17 …50.5 0.2 13.1 0.4 0.0 12.2 5.3 18.3 45 48 56 38 48 57 8752.5 0.4 0.1 0.0 0.0 2.1 2.8 42.0 39 20 19 36 22 19 …18.2 1.2 22.4 0.5 9.7 30.0 1.6 16.4 514 530 294 205 250 287 1 96264.4 1.7 0.0 0.0 0.0 1.0 2.1 30.9 16 8 9 10 6 5 …48.1 0.1 1.0 0.0 0.0 4.1 6.6 40.0 96 52 35 60 40 31 40949.3 0.3 13.6 0.3 0.0 11.9 2.6 22.0 52 94 81 33 71 72 9947.0 0.0 0.0 0.0 0.0 2.0 9.1 41.9 7 6 6 7 6 6 10754.9 0.0 0.0 0.0 0.0 0.8 4.2 40.1 18 11 10 23 14 12 13832.9 0.0 19.8 0.0 0.0 22.0 1.1 24.2 58 113 86 35 75 77 12043.3 2.8 0.8 0.0 0.0 5.5 14.1 33.6 54 45 51 44 44 44 2 50839.8 0.1 0.1 0.0 0.0 1.1 7.2 51.6 120 57 60 76 47 40 …43.5 0.0 21.0 4.2 0.9 14.8 2.8 12.8 639 500 387 264 239 223 1170.3 4.8 0.0 0.0 0.0 0.0 5.4 19.4 8 5 3 7 4 4 91430.1 2.0 0.5 0.0 0.0 2.4 16.1 48.9 62 110 69 38 73 61 15838.9 0.4 0.3 0.0 0.0 0.9 10.2 49.2 16 12 9 20 16 12 17244.1 1.7 3.8 0.0 0.0 7.3 10.1 33.0 65 39 46 40 40 40 1 86321.9 1.5 15.6 1.0 25.1 19.1 2.4 13.5 140 128 135 77 85 91 1 16132.6 0.0 25.3 2.2 1.0 18.2 2.0 18.6 924 515 363 540 340 246 <10931.3 0.2 18.8 0.0 0.1 20.4 5.2 24.1 377 238 198 255 190 155 13255.8 0.0 0.6 0.0 0.0 3.1 4.3 36.2 160 70 55 94 63 51 …31.0 22.7 14.4 0.0 0.2 17.0 4.0 10.7 344 445 622 307 640 731 22 75732.3 0.2 19.4 0.0 0.3 17.3 2.9 27.6 124 83 60 84 60 48 51042.5 0.0 1.5 0.6 0.0 1.1 7.8 46.6 91 108 65 58 102 59 …28.1 0.0 1.2 0.0 0.0 16.2 8.2 46.3 43 64 41 27 44 39 …15.2 0.7 19.4 0.0 21.7 24.9 2.1 15.9 179 338 403 95 198 226 1 49819.9 2.6 22.1 0.0 10.0 28.5 2.1 14.8 288 455 647 154 321 367 1 90330.3 0.6 20.3 0.1 0.5 19.1 2.5 26.6 928 758 664 585 530 495 75517.2 6.7 16.4 0.0 21.9 20.3 2.6 15.0 188 228 195 81 168 192 4 58052.8 0.0 0.2 0.0 0.0 1.6 5.9 39.5 7 5 4 10 6 5 26822.1 0.0 11.8 19.3 3.0 9.1 6.8 28.0 449 380 280 175 160 151 …21.9 6.6 13.3 10.7 15.8 16.8 2.4 12.5 318 485 425 145 302 345 5 58218.2 3.1 14.2 12.8 18.1 18.1 2.0 13.6 251 420 497 125 262 299 3 10241.8 0.0 0.4 0.0 0.0 4.1 4.0 49.5 45 21 12 38 19 12 24450.3 0.2 10.5 0.8 0.0 8.3 9.0 20.9 327 269 194 116 105 98 6552.3 1.7 9.1 0.0 0.7 6.6 6.3 23.4 88 51 43 53 42 35 49033.5 0.1 9.3 14.2 12.2 10.0 4.0 16.7 188 112 83 85 56 42 <4126.6 6.5 9.7 1.2 29.7 11.1 3.3 11.9 209 313 485 169 353 403 3 33029.1 0.0 10.0 2.9 0.0 14.6 2.3 41.1 0 12 31 0 7 15 …44.3 0.0 1.8 0.0 0.0 3.3 5.3 45.2 30 14 11 18 14 11 29526.9 4.3 14.8 8.0 14.1 17.6 2.6 11.8 292 472 582 177 368 420 3 69749.2 0.0 0.0 0.0 0.0 0.4 8.8 41.6 126 76 54 74 49 40 …37.5 0.2 1.0 0.0 0.0 3.2 8.5 49.6 32 13 7 25 11 6 6715.1 0.0 21.5 0.0 0.0 3.5 5.1 54.7 14 9 6 9 6 5 …50.6 0.0 1.0 0.0 0.0 1.9 9.7 36.8 22 16 9 21 15 9 1732.7 0.0 26.4 0.3 0.0 17.2 3.2 20.2 841 713 441 344 344 344 …19.6 2.7 17.9 2.7 16.8 23.1 2.7 14.6 275 592 666 165 343 392 …45.9 0.0 1.3 0.0 0.0 1.2 4.1 47.4 12 7 6 15 9 8 10828.0 4.7 18.6 2.5 1.0 22.5 1.3 21.4 1 485 761 1 104 582 708 813 2 870
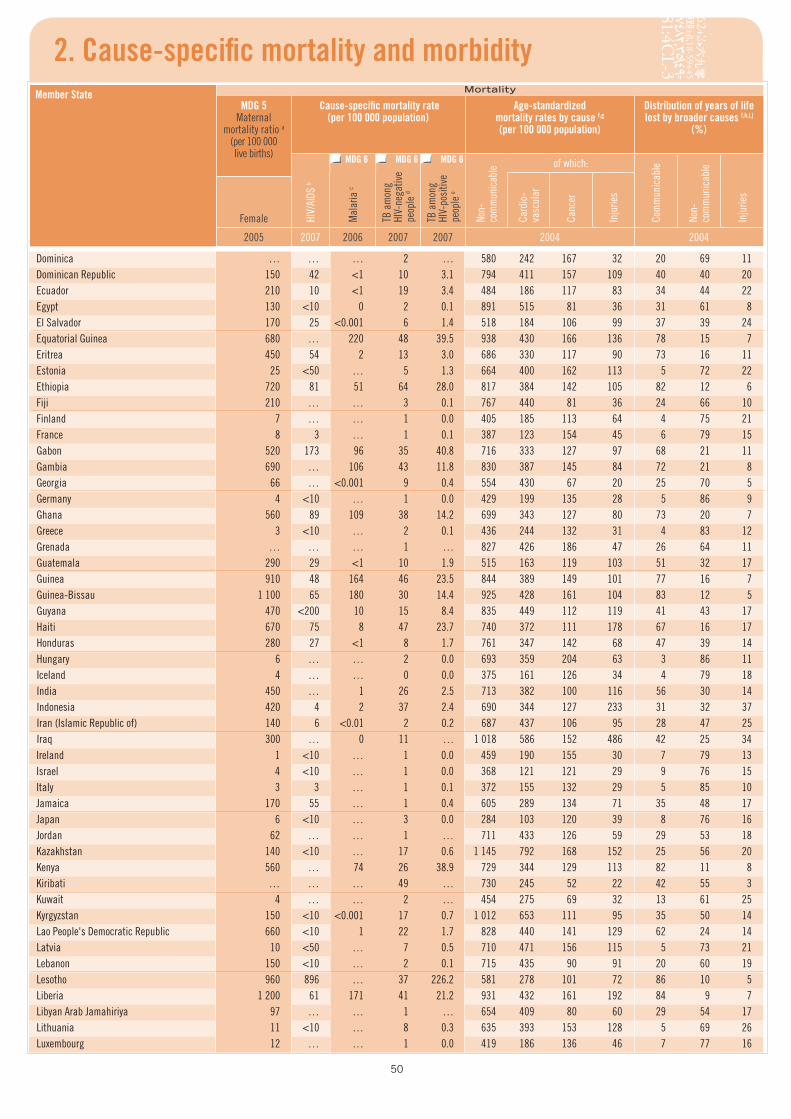
50
2. Cause-specific mortality and morbidityMember State Mortality
MDG 5 Maternal
mortality ratio a (per 100 000 live births)
Cause-specific mortality rate (per 100 000 population)
Age-standardized mortality rates by cause f,g (per 100 000 population)
Distribution of years of life lost by broader causes f,h,i,j
(%)
HIV/
AIDS
b
Mal
aria
c
TB a
mon
g HI
V-ne
gativ
e pe
ople
d
TB a
mon
g HI
V-po
sitiv
e pe
ople
e
Non-
co
mm
unic
able of which:
Com
mun
icab
le
Non-
co
mm
unic
able
Inju
ries
Card
io-
vasc
ular
Canc
er
Inju
ries
Female
2005 2007 2006 2007 2007 2004 2004
MDG 6 MDG 6MDG 6
Dominica … … … 2 … 580 242 167 32 20 69 11Dominican Republic 150 42 <1 10 3.1 794 411 157 109 40 40 20Ecuador 210 10 <1 19 3.4 484 186 117 83 34 44 22Egypt 130 <10 0 2 0.1 891 515 81 36 31 61 8El Salvador 170 25 <0.001 6 1.4 518 184 106 99 37 39 24Equatorial Guinea 680 … 220 48 39.5 938 430 166 136 78 15 7Eritrea 450 54 2 13 3.0 686 330 117 90 73 16 11Estonia 25 <50 … 5 1.3 664 400 162 113 5 72 22Ethiopia 720 81 51 64 28.0 817 384 142 105 82 12 6Fiji 210 … … 3 0.1 767 440 81 36 24 66 10Finland 7 … … 1 0.0 405 185 113 64 4 75 21France 8 3 … 1 0.1 387 123 154 45 6 79 15Gabon 520 173 96 35 40.8 716 333 127 97 68 21 11Gambia 690 … 106 43 11.8 830 387 145 84 72 21 8Georgia 66 … <0.001 9 0.4 554 430 67 20 25 70 5Germany 4 <10 … 1 0.0 429 199 135 28 5 86 9Ghana 560 89 109 38 14.2 699 343 127 80 73 20 7Greece 3 <10 … 2 0.1 436 244 132 31 4 83 12Grenada … … … 1 … 827 426 186 47 26 64 11Guatemala 290 29 <1 10 1.9 515 163 119 103 51 32 17Guinea 910 48 164 46 23.5 844 389 149 101 77 16 7Guinea-Bissau 1 100 65 180 30 14.4 925 428 161 104 83 12 5Guyana 470 <200 10 15 8.4 835 449 112 119 41 43 17Haiti 670 75 8 47 23.7 740 372 111 178 67 16 17Honduras 280 27 <1 8 1.7 761 347 142 68 47 39 14Hungary 6 … … 2 0.0 693 359 204 63 3 86 11Iceland 4 … … 0 0.0 375 161 126 34 4 79 18India 450 … 1 26 2.5 713 382 100 116 56 30 14Indonesia 420 4 2 37 2.4 690 344 127 233 31 32 37Iran (Islamic Republic of) 140 6 <0.01 2 0.2 687 437 106 95 28 47 25Iraq 300 … 0 11 … 1 018 586 152 486 42 25 34Ireland 1 <10 … 1 0.0 459 190 155 30 7 79 13Israel 4 <10 … 1 0.0 368 121 121 29 9 76 15Italy 3 3 … 1 0.1 372 155 132 29 5 85 10Jamaica 170 55 … 1 0.4 605 289 134 71 35 48 17Japan 6 <10 … 3 0.0 284 103 120 39 8 76 16Jordan 62 … … 1 … 711 433 126 59 29 53 18Kazakhstan 140 <10 … 17 0.6 1 145 792 168 152 25 56 20Kenya 560 … 74 26 38.9 729 344 129 113 82 11 8Kiribati … … … 49 … 730 245 52 22 42 55 3Kuwait 4 … … 2 … 454 275 69 32 13 61 25Kyrgyzstan 150 <10 <0.001 17 0.7 1 012 653 111 95 35 50 14Lao People's Democratic Republic 660 <10 1 22 1.7 828 440 141 129 62 24 14Latvia 10 <50 … 7 0.5 710 471 156 115 5 73 21Lebanon 150 <10 … 2 0.1 715 435 90 91 20 60 19Lesotho 960 896 … 37 226.2 581 278 101 72 86 10 5Liberia 1 200 61 171 41 21.2 931 432 161 192 84 9 7Libyan Arab Jamahiriya 97 … … 1 … 654 409 80 60 29 54 17Lithuania 11 <10 … 8 0.3 635 393 153 128 5 69 26Luxembourg 12 … … 1 0.0 419 186 136 46 7 77 16
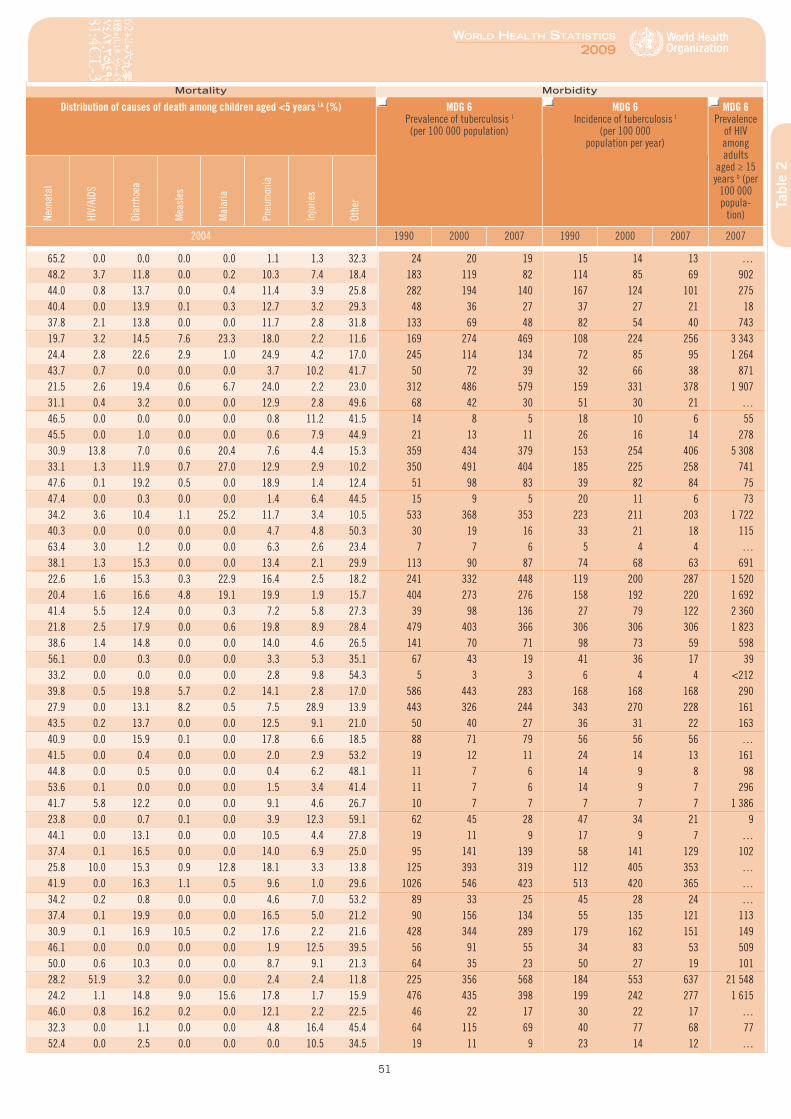
51
World HealtH StatiSticS
2009
Mortality Morbidity
Distribution of causes of death among children aged <5 years i,k (%) MDG 6 Prevalence of tuberculosis l (per 100 000 population)
MDG 6 Incidence of tuberculosis l
(per 100 000 population per year)
MDG 6 Prevalence
of HIV among adults
aged ≥ 15 years b (per
100 000 popula-
tion)Neon
atal
HIV/
AIDS
Diar
rhoe
a
Mea
sles
Mal
aria
Pneu
mon
ia
Inju
ries
Othe
r
2004 1990 2000 2007 1990 2000 2007 2007
Tabl
e 2
65.2 0.0 0.0 0.0 0.0 1.1 1.3 32.3 24 20 19 15 14 13 …48.2 3.7 11.8 0.0 0.2 10.3 7.4 18.4 183 119 82 114 85 69 90244.0 0.8 13.7 0.0 0.4 11.4 3.9 25.8 282 194 140 167 124 101 27540.4 0.0 13.9 0.1 0.3 12.7 3.2 29.3 48 36 27 37 27 21 1837.8 2.1 13.8 0.0 0.0 11.7 2.8 31.8 133 69 48 82 54 40 74319.7 3.2 14.5 7.6 23.3 18.0 2.2 11.6 169 274 469 108 224 256 3 34324.4 2.8 22.6 2.9 1.0 24.9 4.2 17.0 245 114 134 72 85 95 1 26443.7 0.7 0.0 0.0 0.0 3.7 10.2 41.7 50 72 39 32 66 38 87121.5 2.6 19.4 0.6 6.7 24.0 2.2 23.0 312 486 579 159 331 378 1 90731.1 0.4 3.2 0.0 0.0 12.9 2.8 49.6 68 42 30 51 30 21 …46.5 0.0 0.0 0.0 0.0 0.8 11.2 41.5 14 8 5 18 10 6 5545.5 0.0 1.0 0.0 0.0 0.6 7.9 44.9 21 13 11 26 16 14 27830.9 13.8 7.0 0.6 20.4 7.6 4.4 15.3 359 434 379 153 254 406 5 30833.1 1.3 11.9 0.7 27.0 12.9 2.9 10.2 350 491 404 185 225 258 74147.6 0.1 19.2 0.5 0.0 18.9 1.4 12.4 51 98 83 39 82 84 7547.4 0.0 0.3 0.0 0.0 1.4 6.4 44.5 15 9 5 20 11 6 7334.2 3.6 10.4 1.1 25.2 11.7 3.4 10.5 533 368 353 223 211 203 1 72240.3 0.0 0.0 0.0 0.0 4.7 4.8 50.3 30 19 16 33 21 18 11563.4 3.0 1.2 0.0 0.0 6.3 2.6 23.4 7 7 6 5 4 4 …38.1 1.3 15.3 0.0 0.0 13.4 2.1 29.9 113 90 87 74 68 63 69122.6 1.6 15.3 0.3 22.9 16.4 2.5 18.2 241 332 448 119 200 287 1 52020.4 1.6 16.6 4.8 19.1 19.9 1.9 15.7 404 273 276 158 192 220 1 69241.4 5.5 12.4 0.0 0.3 7.2 5.8 27.3 39 98 136 27 79 122 2 36021.8 2.5 17.9 0.0 0.6 19.8 8.9 28.4 479 403 366 306 306 306 1 82338.6 1.4 14.8 0.0 0.0 14.0 4.6 26.5 141 70 71 98 73 59 59856.1 0.0 0.3 0.0 0.0 3.3 5.3 35.1 67 43 19 41 36 17 3933.2 0.0 0.0 0.0 0.0 2.8 9.8 54.3 5 3 3 6 4 4 <21239.8 0.5 19.8 5.7 0.2 14.1 2.8 17.0 586 443 283 168 168 168 29027.9 0.0 13.1 8.2 0.5 7.5 28.9 13.9 443 326 244 343 270 228 16143.5 0.2 13.7 0.0 0.0 12.5 9.1 21.0 50 40 27 36 31 22 16340.9 0.0 15.9 0.1 0.0 17.8 6.6 18.5 88 71 79 56 56 56 …41.5 0.0 0.4 0.0 0.0 2.0 2.9 53.2 19 12 11 24 14 13 16144.8 0.0 0.5 0.0 0.0 0.4 6.2 48.1 11 7 6 14 9 8 9853.6 0.1 0.0 0.0 0.0 1.5 3.4 41.4 11 7 6 14 9 7 29641.7 5.8 12.2 0.0 0.0 9.1 4.6 26.7 10 7 7 7 7 7 1 38623.8 0.0 0.7 0.1 0.0 3.9 12.3 59.1 62 45 28 47 34 21 944.1 0.0 13.1 0.0 0.0 10.5 4.4 27.8 19 11 9 17 9 7 …37.4 0.1 16.5 0.0 0.0 14.0 6.9 25.0 95 141 139 58 141 129 10225.8 10.0 15.3 0.9 12.8 18.1 3.3 13.8 125 393 319 112 405 353 …41.9 0.0 16.3 1.1 0.5 9.6 1.0 29.6 1026 546 423 513 420 365 …34.2 0.2 0.8 0.0 0.0 4.6 7.0 53.2 89 33 25 45 28 24 …37.4 0.1 19.9 0.0 0.0 16.5 5.0 21.2 90 156 134 55 135 121 11330.9 0.1 16.9 10.5 0.2 17.6 2.2 21.6 428 344 289 179 162 151 14946.1 0.0 0.0 0.0 0.0 1.9 12.5 39.5 56 91 55 34 83 53 50950.0 0.6 10.3 0.0 0.0 8.7 9.1 21.3 64 35 23 50 27 19 10128.2 51.9 3.2 0.0 0.0 2.4 2.4 11.8 225 356 568 184 553 637 21 54824.2 1.1 14.8 9.0 15.6 17.8 1.7 15.9 476 435 398 199 242 277 1 61546.0 0.8 16.2 0.2 0.0 12.1 2.2 22.5 46 22 17 30 22 17 …32.3 0.0 1.1 0.0 0.0 4.8 16.4 45.4 64 115 69 40 77 68 7752.4 0.0 2.5 0.0 0.0 0.0 10.5 34.5 19 11 9 23 14 12 …
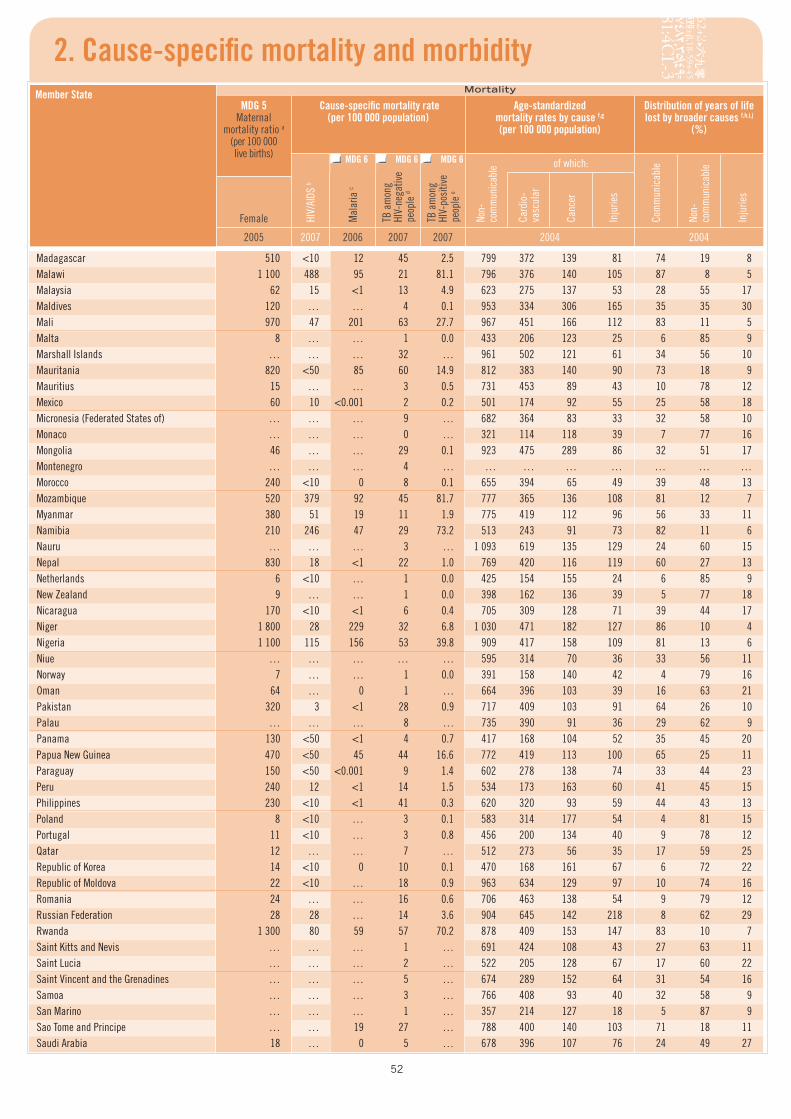
52
2. Cause-specific mortality and morbidityMember State Mortality
MDG 5 Maternal
mortality ratio a (per 100 000 live births)
Cause-specific mortality rate (per 100 000 population)
Age-standardized mortality rates by cause f,g (per 100 000 population)
Distribution of years of life lost by broader causes f,h,i,j
(%)
HIV/
AIDS
b
Mal
aria
c
TB a
mon
g HI
V-ne
gativ
e pe
ople
d
TB a
mon
g HI
V-po
sitiv
e pe
ople
e
Non-
co
mm
unic
able of which:
Com
mun
icab
le
Non-
co
mm
unic
able
Inju
ries
Card
io-
vasc
ular
Canc
er
Inju
ries
Female
2005 2007 2006 2007 2007 2004 2004
MDG 6 MDG 6MDG 6
Madagascar 510 <10 12 45 2.5 799 372 139 81 74 19 8Malawi 1 100 488 95 21 81.1 796 376 140 105 87 8 5Malaysia 62 15 <1 13 4.9 623 275 137 53 28 55 17Maldives 120 … … 4 0.1 953 334 306 165 35 35 30Mali 970 47 201 63 27.7 967 451 166 112 83 11 5Malta 8 … … 1 0.0 433 206 123 25 6 85 9Marshall Islands … … … 32 … 961 502 121 61 34 56 10Mauritania 820 <50 85 60 14.9 812 383 140 90 73 18 9Mauritius 15 … … 3 0.5 731 453 89 43 10 78 12Mexico 60 10 <0.001 2 0.2 501 174 92 55 25 58 18Micronesia (Federated States of) … … … 9 … 682 364 83 33 32 58 10Monaco … … … 0 … 321 114 118 39 7 77 16Mongolia 46 … … 29 0.1 923 475 289 86 32 51 17Montenegro … … … 4 … … … … … … … …Morocco 240 <10 0 8 0.1 655 394 65 49 39 48 13Mozambique 520 379 92 45 81.7 777 365 136 108 81 12 7Myanmar 380 51 19 11 1.9 775 419 112 96 56 33 11Namibia 210 246 47 29 73.2 513 243 91 73 82 11 6Nauru … … … 3 … 1 093 619 135 129 24 60 15Nepal 830 18 <1 22 1.0 769 420 116 119 60 27 13Netherlands 6 <10 … 1 0.0 425 154 155 24 6 85 9New Zealand 9 … … 1 0.0 398 162 136 39 5 77 18Nicaragua 170 <10 <1 6 0.4 705 309 128 71 39 44 17Niger 1 800 28 229 32 6.8 1 030 471 182 127 86 10 4Nigeria 1 100 115 156 53 39.8 909 417 158 109 81 13 6Niue … … … … … 595 314 70 36 33 56 11Norway 7 … … 1 0.0 391 158 140 42 4 79 16Oman 64 … 0 1 … 664 396 103 39 16 63 21Pakistan 320 3 <1 28 0.9 717 409 103 91 64 26 10Palau … … … 8 … 735 390 91 36 29 62 9Panama 130 <50 <1 4 0.7 417 168 104 52 35 45 20Papua New Guinea 470 <50 45 44 16.6 772 419 113 100 65 25 11Paraguay 150 <50 <0.001 9 1.4 602 278 138 74 33 44 23Peru 240 12 <1 14 1.5 534 173 163 60 41 45 15Philippines 230 <10 <1 41 0.3 620 320 93 59 44 43 13Poland 8 <10 … 3 0.1 583 314 177 54 4 81 15Portugal 11 <10 … 3 0.8 456 200 134 40 9 78 12Qatar 12 … … 7 … 512 273 56 35 17 59 25Republic of Korea 14 <10 0 10 0.1 470 168 161 67 6 72 22Republic of Moldova 22 <10 … 18 0.9 963 634 129 97 10 74 16Romania 24 … … 16 0.6 706 463 138 54 9 79 12Russian Federation 28 28 … 14 3.6 904 645 142 218 8 62 29Rwanda 1 300 80 59 57 70.2 878 409 153 147 83 10 7Saint Kitts and Nevis … … … 1 … 691 424 108 43 27 63 11Saint Lucia … … … 2 … 522 205 128 67 17 60 22Saint Vincent and the Grenadines … … … 5 … 674 289 152 64 31 54 16Samoa … … … 3 … 766 408 93 40 32 58 9San Marino … … … 1 … 357 214 127 18 5 87 9Sao Tome and Principe … … 19 27 … 788 400 140 103 71 18 11Saudi Arabia 18 … 0 5 … 678 396 107 76 24 49 27
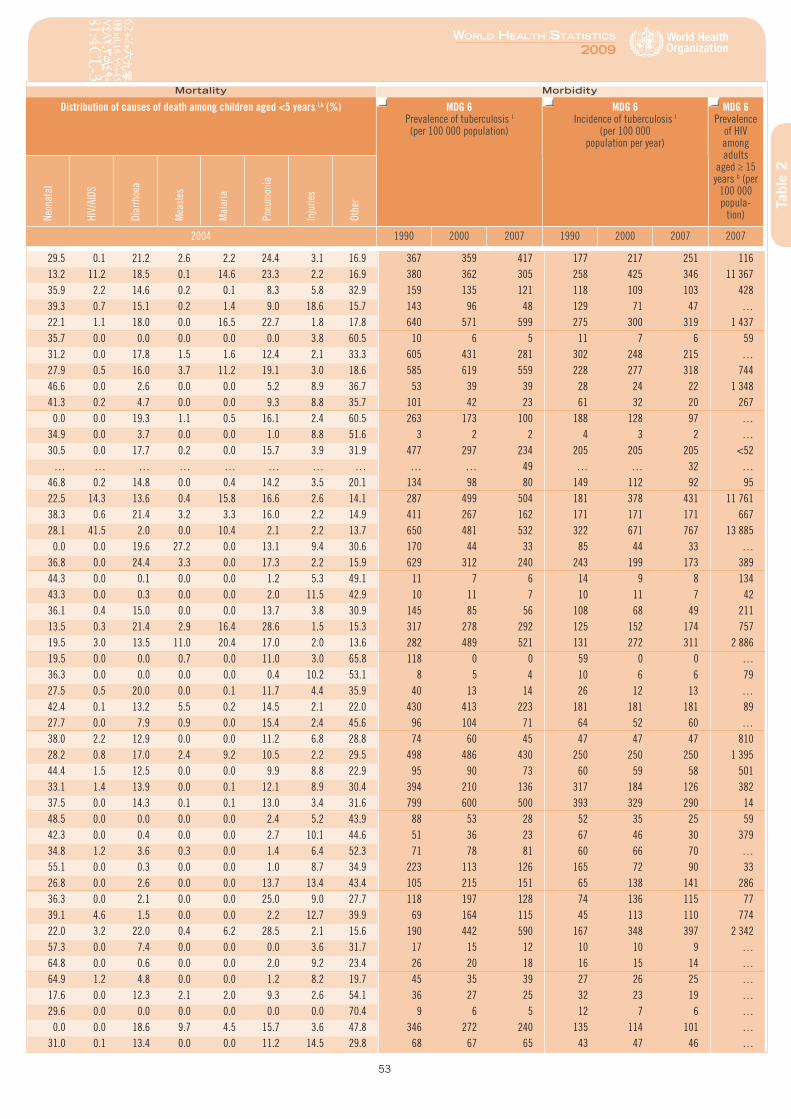
53
World HealtH StatiSticS
2009
Mortality Morbidity
Distribution of causes of death among children aged <5 years i,k (%) MDG 6 Prevalence of tuberculosis l (per 100 000 population)
MDG 6 Incidence of tuberculosis l
(per 100 000 population per year)
MDG 6 Prevalence
of HIV among adults
aged ≥ 15 years b (per
100 000 popula-
tion)Neon
atal
HIV/
AIDS
Diar
rhoe
a
Mea
sles
Mal
aria
Pneu
mon
ia
Inju
ries
Othe
r
2004 1990 2000 2007 1990 2000 2007 2007
Tabl
e 2
29.5 0.1 21.2 2.6 2.2 24.4 3.1 16.9 367 359 417 177 217 251 11613.2 11.2 18.5 0.1 14.6 23.3 2.2 16.9 380 362 305 258 425 346 11 36735.9 2.2 14.6 0.2 0.1 8.3 5.8 32.9 159 135 121 118 109 103 42839.3 0.7 15.1 0.2 1.4 9.0 18.6 15.7 143 96 48 129 71 47 …22.1 1.1 18.0 0.0 16.5 22.7 1.8 17.8 640 571 599 275 300 319 1 43735.7 0.0 0.0 0.0 0.0 0.0 3.8 60.5 10 6 5 11 7 6 5931.2 0.0 17.8 1.5 1.6 12.4 2.1 33.3 605 431 281 302 248 215 …27.9 0.5 16.0 3.7 11.2 19.1 3.0 18.6 585 619 559 228 277 318 74446.6 0.0 2.6 0.0 0.0 5.2 8.9 36.7 53 39 39 28 24 22 1 34841.3 0.2 4.7 0.0 0.0 9.3 8.8 35.7 101 42 23 61 32 20 267
0.0 0.0 19.3 1.1 0.5 16.1 2.4 60.5 263 173 100 188 128 97 …34.9 0.0 3.7 0.0 0.0 1.0 8.8 51.6 3 2 2 4 3 2 …30.5 0.0 17.7 0.2 0.0 15.7 3.9 31.9 477 297 234 205 205 205 <52
… … … … … … … … … … 49 … … 32 …46.8 0.2 14.8 0.0 0.4 14.2 3.5 20.1 134 98 80 149 112 92 9522.5 14.3 13.6 0.4 15.8 16.6 2.6 14.1 287 499 504 181 378 431 11 76138.3 0.6 21.4 3.2 3.3 16.0 2.2 14.9 411 267 162 171 171 171 66728.1 41.5 2.0 0.0 10.4 2.1 2.2 13.7 650 481 532 322 671 767 13 885
0.0 0.0 19.6 27.2 0.0 13.1 9.4 30.6 170 44 33 85 44 33 …36.8 0.0 24.4 3.3 0.0 17.3 2.2 15.9 629 312 240 243 199 173 38944.3 0.0 0.1 0.0 0.0 1.2 5.3 49.1 11 7 6 14 9 8 13443.3 0.0 0.3 0.0 0.0 2.0 11.5 42.9 10 11 7 10 11 7 4236.1 0.4 15.0 0.0 0.0 13.7 3.8 30.9 145 85 56 108 68 49 21113.5 0.3 21.4 2.9 16.4 28.6 1.5 15.3 317 278 292 125 152 174 75719.5 3.0 13.5 11.0 20.4 17.0 2.0 13.6 282 489 521 131 272 311 2 88619.5 0.0 0.0 0.7 0.0 11.0 3.0 65.8 118 0 0 59 0 0 …36.3 0.0 0.0 0.0 0.0 0.4 10.2 53.1 8 5 4 10 6 6 7927.5 0.5 20.0 0.0 0.1 11.7 4.4 35.9 40 13 14 26 12 13 …42.4 0.1 13.2 5.5 0.2 14.5 2.1 22.0 430 413 223 181 181 181 8927.7 0.0 7.9 0.9 0.0 15.4 2.4 45.6 96 104 71 64 52 60 …38.0 2.2 12.9 0.0 0.0 11.2 6.8 28.8 74 60 45 47 47 47 81028.2 0.8 17.0 2.4 9.2 10.5 2.2 29.5 498 486 430 250 250 250 1 39544.4 1.5 12.5 0.0 0.0 9.9 8.8 22.9 95 90 73 60 59 58 50133.1 1.4 13.9 0.0 0.1 12.1 8.9 30.4 394 210 136 317 184 126 38237.5 0.0 14.3 0.1 0.1 13.0 3.4 31.6 799 600 500 393 329 290 1448.5 0.0 0.0 0.0 0.0 2.4 5.2 43.9 88 53 28 52 35 25 5942.3 0.0 0.4 0.0 0.0 2.7 10.1 44.6 51 36 23 67 46 30 37934.8 1.2 3.6 0.3 0.0 1.4 6.4 52.3 71 78 81 60 66 70 …55.1 0.0 0.3 0.0 0.0 1.0 8.7 34.9 223 113 126 165 72 90 3326.8 0.0 2.6 0.0 0.0 13.7 13.4 43.4 105 215 151 65 138 141 28636.3 0.0 2.1 0.0 0.0 25.0 9.0 27.7 118 197 128 74 136 115 7739.1 4.6 1.5 0.0 0.0 2.2 12.7 39.9 69 164 115 45 113 110 77422.0 3.2 22.0 0.4 6.2 28.5 2.1 15.6 190 442 590 167 348 397 2 34257.3 0.0 7.4 0.0 0.0 0.0 3.6 31.7 17 15 12 10 10 9 …64.8 0.0 0.6 0.0 0.0 2.0 9.2 23.4 26 20 18 16 15 14 …64.9 1.2 4.8 0.0 0.0 1.2 8.2 19.7 45 35 39 27 26 25 …17.6 0.0 12.3 2.1 2.0 9.3 2.6 54.1 36 27 25 32 23 19 …29.6 0.0 0.0 0.0 0.0 0.0 0.0 70.4 9 6 5 12 7 6 …
0.0 0.0 18.6 9.7 4.5 15.7 3.6 47.8 346 272 240 135 114 101 …31.0 0.1 13.4 0.0 0.0 11.2 14.5 29.8 68 67 65 43 47 46 …
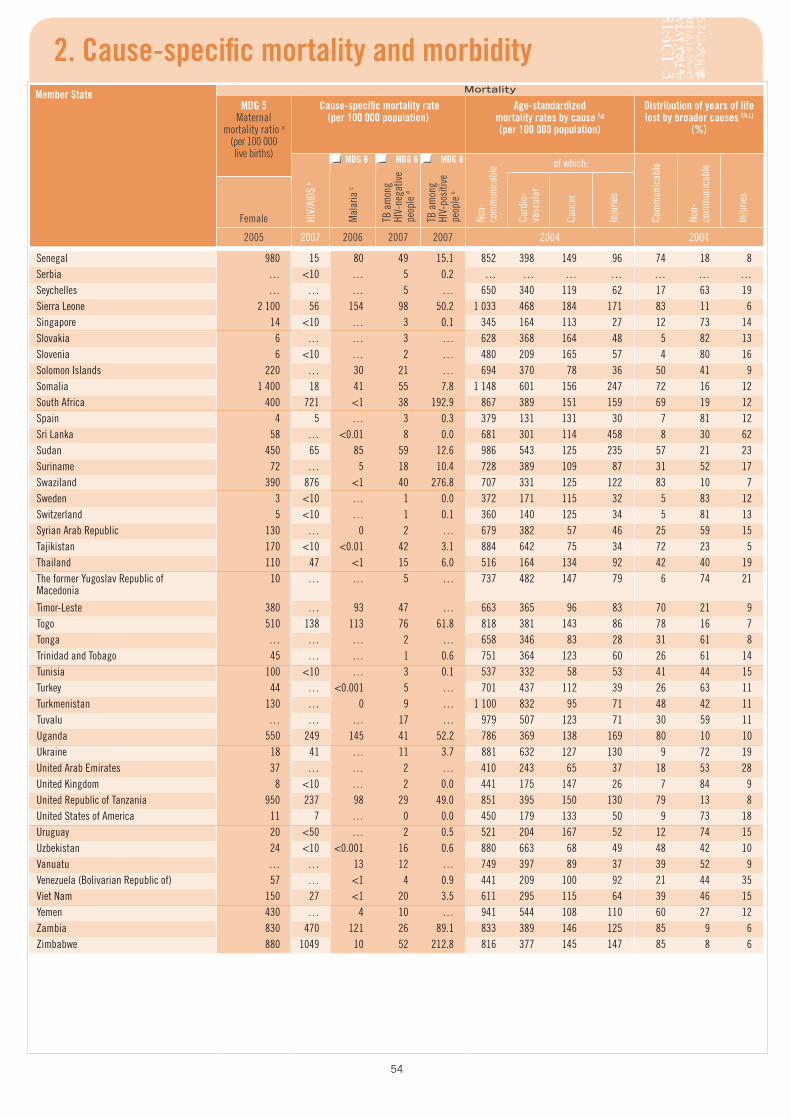
54
2. Cause-specific mortality and morbidityMember State Mortality
MDG 5 Maternal
mortality ratio a (per 100 000 live births)
Cause-specific mortality rate (per 100 000 population)
Age-standardized mortality rates by cause f,g (per 100 000 population)
Distribution of years of life lost by broader causes f,h,i,j
(%)
HIV/
AIDS
b
Mal
aria
c
TB a
mon
g HI
V-ne
gativ
e pe
ople
d
TB a
mon
g HI
V-po
sitiv
e pe
ople
e
Non-
co
mm
unic
able of which:
Com
mun
icab
le
Non-
co
mm
unic
able
Inju
ries
Card
io-
vasc
ular
Canc
er
Inju
ries
Female
2005 2007 2006 2007 2007 2004 2004
MDG 6 MDG 6MDG 6
Senegal 980 15 80 49 15.1 852 398 149 96 74 18 8Serbia … <10 … 5 0.2 … … … … … … …Seychelles … … … 5 … 650 340 119 62 17 63 19Sierra Leone 2 100 56 154 98 50.2 1 033 468 184 171 83 11 6Singapore 14 <10 … 3 0.1 345 164 113 27 12 73 14Slovakia 6 … … 3 … 628 368 164 48 5 82 13Slovenia 6 <10 … 2 … 480 209 165 57 4 80 16Solomon Islands 220 … 30 21 … 694 370 78 36 50 41 9Somalia 1 400 18 41 55 7.8 1 148 601 156 247 72 16 12South Africa 400 721 <1 38 192.9 867 389 151 159 69 19 12Spain 4 5 … 3 0.3 379 131 131 30 7 81 12Sri Lanka 58 … <0.01 8 0.0 681 301 114 458 8 30 62Sudan 450 65 85 59 12.6 986 543 125 235 57 21 23Suriname 72 … 5 18 10.4 728 389 109 87 31 52 17Swaziland 390 876 <1 40 276.8 707 331 125 122 83 10 7Sweden 3 <10 … 1 0.0 372 171 115 32 5 83 12Switzerland 5 <10 … 1 0.1 360 140 125 34 5 81 13Syrian Arab Republic 130 … 0 2 … 679 382 57 46 25 59 15Tajikistan 170 <10 <0.01 42 3.1 884 642 75 34 72 23 5Thailand 110 47 <1 15 6.0 516 164 134 92 42 40 19The former Yugoslav Republic of Macedonia
10 … … 5 … 737 482 147 79 6 74 21
Timor-Leste 380 … 93 47 … 663 365 96 83 70 21 9Togo 510 138 113 76 61.8 818 381 143 86 78 16 7Tonga … … … 2 … 658 346 83 28 31 61 8Trinidad and Tobago 45 … … 1 0.6 751 364 123 60 26 61 14Tunisia 100 <10 … 3 0.1 537 332 58 53 41 44 15Turkey 44 … <0.001 5 … 701 437 112 39 26 63 11Turkmenistan 130 … 0 9 … 1 100 832 95 71 48 42 11Tuvalu … … … 17 … 979 507 123 71 30 59 11Uganda 550 249 145 41 52.2 786 369 138 169 80 10 10Ukraine 18 41 … 11 3.7 881 632 127 130 9 72 19United Arab Emirates 37 … … 2 … 410 243 65 37 18 53 28United Kingdom 8 <10 … 2 0.0 441 175 147 26 7 84 9United Republic of Tanzania 950 237 98 29 49.0 851 395 150 130 79 13 8United States of America 11 7 … 0 0.0 450 179 133 50 9 73 18Uruguay 20 <50 … 2 0.5 521 204 167 52 12 74 15Uzbekistan 24 <10 <0.001 16 0.6 880 663 68 49 48 42 10Vanuatu … … 13 12 … 749 397 89 37 39 52 9Venezuela (Bolivarian Republic of) 57 … <1 4 0.9 441 209 100 92 21 44 35Viet Nam 150 27 <1 20 3.5 611 295 115 64 39 46 15Yemen 430 … 4 10 … 941 544 108 110 60 27 12Zambia 830 470 121 26 89.1 833 389 146 125 85 9 6Zimbabwe 880 1049 10 52 212.8 816 377 145 147 85 8 6
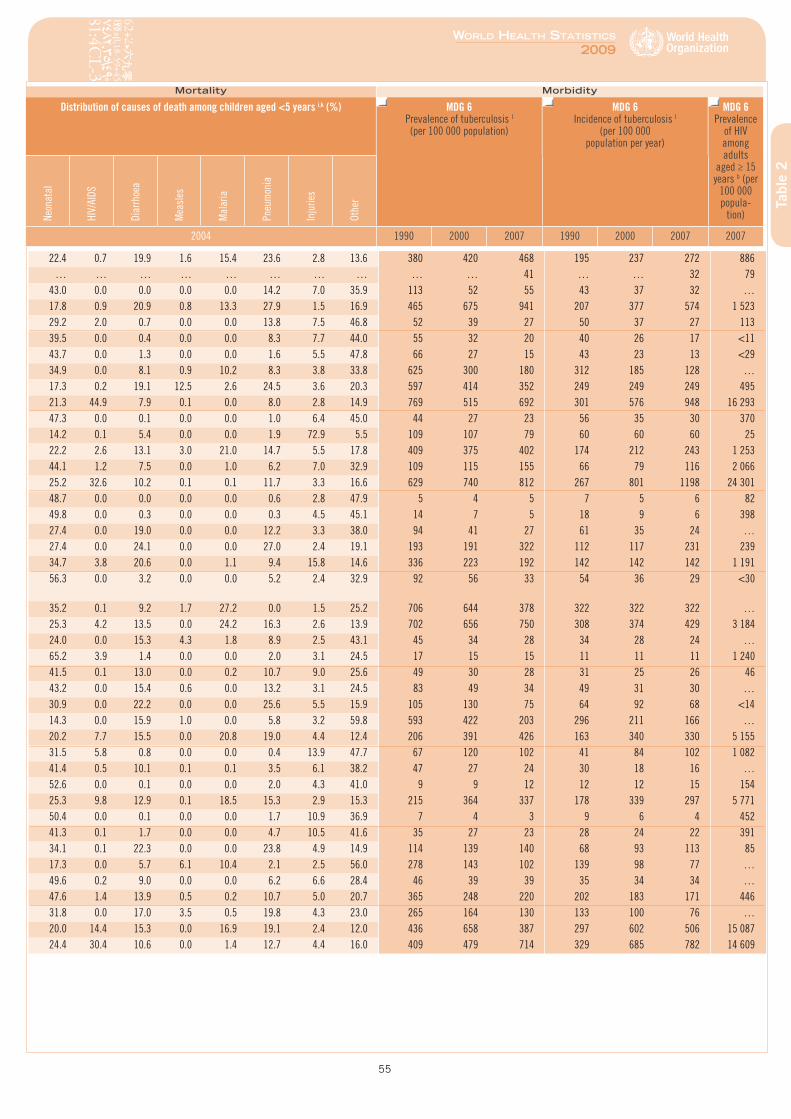
55
World HealtH StatiSticS
2009
Mortality Morbidity
Distribution of causes of death among children aged <5 years i,k (%) MDG 6 Prevalence of tuberculosis l (per 100 000 population)
MDG 6 Incidence of tuberculosis l
(per 100 000 population per year)
MDG 6 Prevalence
of HIV among adults
aged ≥ 15 years b (per
100 000 popula-
tion)Neon
atal
HIV/
AIDS
Diar
rhoe
a
Mea
sles
Mal
aria
Pneu
mon
ia
Inju
ries
Othe
r
2004 1990 2000 2007 1990 2000 2007 2007
Tabl
e 2
22.4 0.7 19.9 1.6 15.4 23.6 2.8 13.6 380 420 468 195 237 272 886… … … … … … … … … … 41 … … 32 79
43.0 0.0 0.0 0.0 0.0 14.2 7.0 35.9 113 52 55 43 37 32 …17.8 0.9 20.9 0.8 13.3 27.9 1.5 16.9 465 675 941 207 377 574 1 52329.2 2.0 0.7 0.0 0.0 13.8 7.5 46.8 52 39 27 50 37 27 11339.5 0.0 0.4 0.0 0.0 8.3 7.7 44.0 55 32 20 40 26 17 <1143.7 0.0 1.3 0.0 0.0 1.6 5.5 47.8 66 27 15 43 23 13 <2934.9 0.0 8.1 0.9 10.2 8.3 3.8 33.8 625 300 180 312 185 128 …17.3 0.2 19.1 12.5 2.6 24.5 3.6 20.3 597 414 352 249 249 249 49521.3 44.9 7.9 0.1 0.0 8.0 2.8 14.9 769 515 692 301 576 948 16 29347.3 0.0 0.1 0.0 0.0 1.0 6.4 45.0 44 27 23 56 35 30 37014.2 0.1 5.4 0.0 0.0 1.9 72.9 5.5 109 107 79 60 60 60 2522.2 2.6 13.1 3.0 21.0 14.7 5.5 17.8 409 375 402 174 212 243 1 25344.1 1.2 7.5 0.0 1.0 6.2 7.0 32.9 109 115 155 66 79 116 2 06625.2 32.6 10.2 0.1 0.1 11.7 3.3 16.6 629 740 812 267 801 1198 24 30148.7 0.0 0.0 0.0 0.0 0.6 2.8 47.9 5 4 5 7 5 6 8249.8 0.0 0.3 0.0 0.0 0.3 4.5 45.1 14 7 5 18 9 6 39827.4 0.0 19.0 0.0 0.0 12.2 3.3 38.0 94 41 27 61 35 24 …27.4 0.0 24.1 0.0 0.0 27.0 2.4 19.1 193 191 322 112 117 231 23934.7 3.8 20.6 0.0 1.1 9.4 15.8 14.6 336 223 192 142 142 142 1 19156.3 0.0 3.2 0.0 0.0 5.2 2.4 32.9 92 56 33 54 36 29 <30
35.2 0.1 9.2 1.7 27.2 0.0 1.5 25.2 706 644 378 322 322 322 …25.3 4.2 13.5 0.0 24.2 16.3 2.6 13.9 702 656 750 308 374 429 3 18424.0 0.0 15.3 4.3 1.8 8.9 2.5 43.1 45 34 28 34 28 24 …65.2 3.9 1.4 0.0 0.0 2.0 3.1 24.5 17 15 15 11 11 11 1 24041.5 0.1 13.0 0.0 0.2 10.7 9.0 25.6 49 30 28 31 25 26 4643.2 0.0 15.4 0.6 0.0 13.2 3.1 24.5 83 49 34 49 31 30 …30.9 0.0 22.2 0.0 0.0 25.6 5.5 15.9 105 130 75 64 92 68 <1414.3 0.0 15.9 1.0 0.0 5.8 3.2 59.8 593 422 203 296 211 166 …20.2 7.7 15.5 0.0 20.8 19.0 4.4 12.4 206 391 426 163 340 330 5 15531.5 5.8 0.8 0.0 0.0 0.4 13.9 47.7 67 120 102 41 84 102 1 08241.4 0.5 10.1 0.1 0.1 3.5 6.1 38.2 47 27 24 30 18 16 …52.6 0.0 0.1 0.0 0.0 2.0 4.3 41.0 9 9 12 12 12 15 15425.3 9.8 12.9 0.1 18.5 15.3 2.9 15.3 215 364 337 178 339 297 5 77150.4 0.0 0.1 0.0 0.0 1.7 10.9 36.9 7 4 3 9 6 4 45241.3 0.1 1.7 0.0 0.0 4.7 10.5 41.6 35 27 23 28 24 22 39134.1 0.1 22.3 0.0 0.0 23.8 4.9 14.9 114 139 140 68 93 113 8517.3 0.0 5.7 6.1 10.4 2.1 2.5 56.0 278 143 102 139 98 77 …49.6 0.2 9.0 0.0 0.0 6.2 6.6 28.4 46 39 39 35 34 34 …47.6 1.4 13.9 0.5 0.2 10.7 5.0 20.7 365 248 220 202 183 171 44631.8 0.0 17.0 3.5 0.5 19.8 4.3 23.0 265 164 130 133 100 76 …20.0 14.4 15.3 0.0 16.9 19.1 2.4 12.0 436 658 387 297 602 506 15 08724.4 30.4 10.6 0.0 1.4 12.7 4.4 16.0 409 479 714 329 685 782 14 609
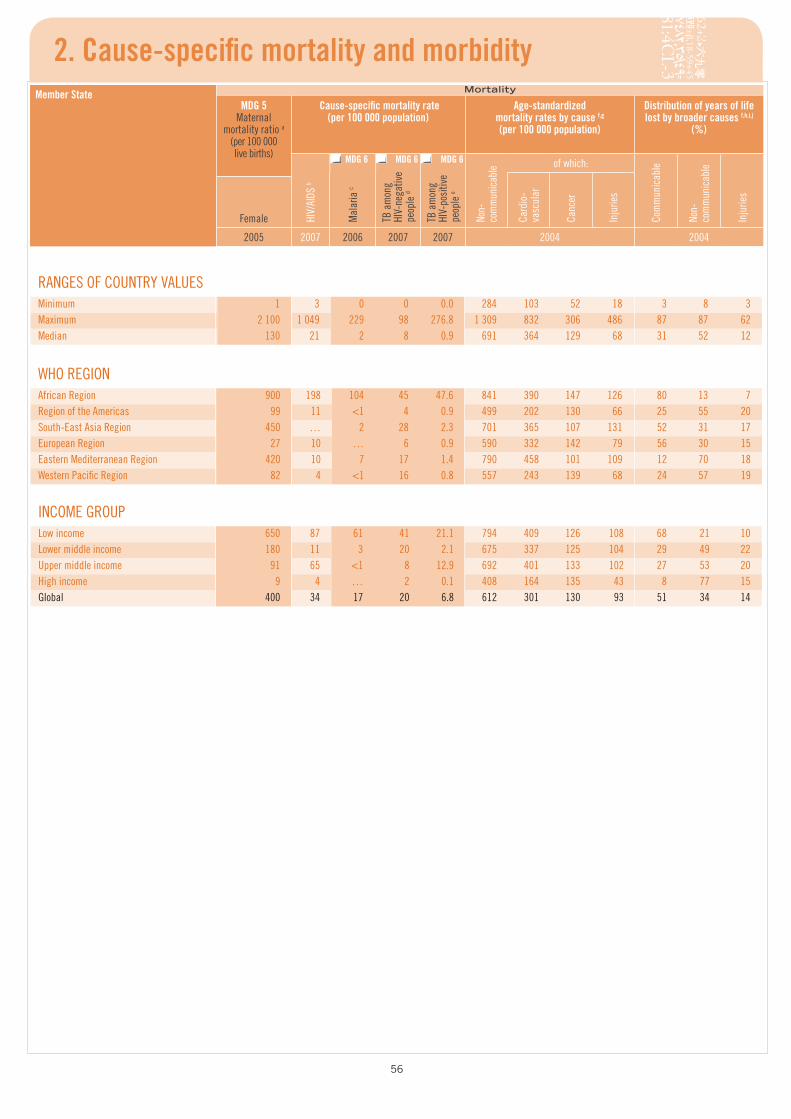
56
2. Cause-specific mortality and morbidityMember State Mortality
MDG 5 Maternal
mortality ratio a (per 100 000 live births)
Cause-specific mortality rate (per 100 000 population)
Age-standardized mortality rates by cause f,g (per 100 000 population)
Distribution of years of life lost by broader causes f,h,i,j
(%)
HIV/
AIDS
b
Mal
aria
c
TB a
mon
g HI
V-ne
gativ
e pe
ople
d
TB a
mon
g HI
V-po
sitiv
e pe
ople
e
Non-
co
mm
unic
able of which:
Com
mun
icab
le
Non-
co
mm
unic
able
Inju
ries
Card
io-
vasc
ular
Canc
er
Inju
ries
Female
2005 2007 2006 2007 2007 2004 2004
MDG 6 MDG 6MDG 6
WHO REGIONAfrican Region 900 198 104 45 47.6 841 390 147 126 80 13 7Region of the Americas 99 11 <1 4 0.9 499 202 130 66 25 55 20South-East Asia Region 450 … 2 28 2.3 701 365 107 131 52 31 17European Region 27 10 … 6 0.9 590 332 142 79 56 30 15Eastern Mediterranean Region 420 10 7 17 1.4 790 458 101 109 12 70 18Western Pacific Region 82 4 <1 16 0.8 557 243 139 68 24 57 19
RANGES OF COUNTRY VALUESMinimum 1 3 0 0 0.0 284 103 52 18 3 8 3Maximum 2 100 1 049 229 98 276.8 1 309 832 306 486 87 87 62Median 130 21 2 8 0.9 691 364 129 68 31 52 12
INCOME GROUPLow income 650 87 61 41 21.1 794 409 126 108 68 21 10Lower middle income 180 11 3 20 2.1 675 337 125 104 29 49 22Upper middle income 91 65 <1 8 12.9 692 401 133 102 27 53 20High income 9 4 … 2 0.1 408 164 135 43 8 77 15Global 400 34 17 20 6.8 612 301 130 93 51 34 14
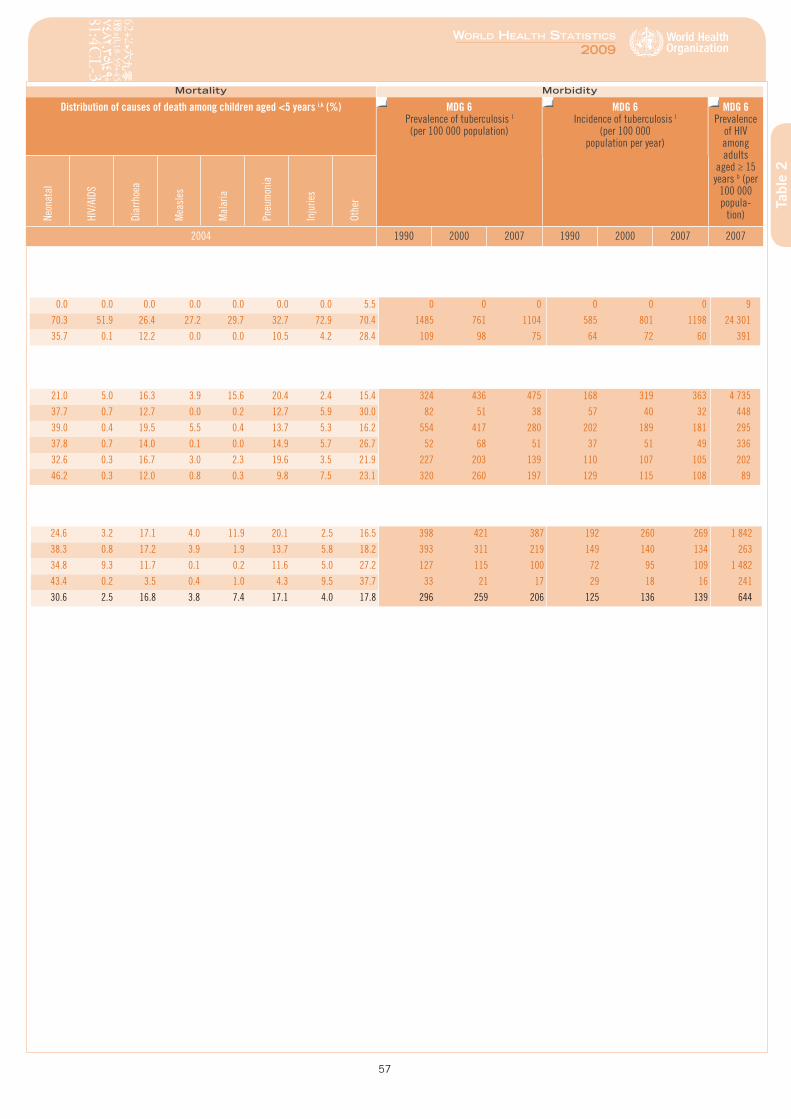
57
World HealtH StatiSticS
2009
Mortality Morbidity
Distribution of causes of death among children aged <5 years i,k (%) MDG 6 Prevalence of tuberculosis l (per 100 000 population)
MDG 6 Incidence of tuberculosis l
(per 100 000 population per year)
MDG 6 Prevalence
of HIV among adults
aged ≥ 15 years b (per
100 000 popula-
tion)Neon
atal
HIV/
AIDS
Diar
rhoe
a
Mea
sles
Mal
aria
Pneu
mon
ia
Inju
ries
Othe
r
2004 1990 2000 2007 1990 2000 2007 2007
Tabl
e 2
21.0 5.0 16.3 3.9 15.6 20.4 2.4 15.4 324 436 475 168 319 363 4 735
37.7 0.7 12.7 0.0 0.2 12.7 5.9 30.0 82 51 38 57 40 32 448
39.0 0.4 19.5 5.5 0.4 13.7 5.3 16.2 554 417 280 202 189 181 295
37.8 0.7 14.0 0.1 0.0 14.9 5.7 26.7 52 68 51 37 51 49 336
32.6 0.3 16.7 3.0 2.3 19.6 3.5 21.9 227 203 139 110 107 105 202
46.2 0.3 12.0 0.8 0.3 9.8 7.5 23.1 320 260 197 129 115 108 89
0.0 0.0 0.0 0.0 0.0 0.0 0.0 5.5 0 0 0 0 0 0 9
70.3 51.9 26.4 27.2 29.7 32.7 72.9 70.4 1485 761 1104 585 801 1198 24 301
35.7 0.1 12.2 0.0 0.0 10.5 4.2 28.4 109 98 75 64 72 60 391
24.6 3.2 17.1 4.0 11.9 20.1 2.5 16.5 398 421 387 192 260 269 1 842
38.3 0.8 17.2 3.9 1.9 13.7 5.8 18.2 393 311 219 149 140 134 263
34.8 9.3 11.7 0.1 0.2 11.6 5.0 27.2 127 115 100 72 95 109 1 482
43.4 0.2 3.5 0.4 1.0 4.3 9.5 37.7 33 21 17 29 18 16 241
30.6 2.5 16.8 3.8 7.4 17.1 4.0 17.8 296 259 206 125 136 139 644

World HealtH StatiSticS
2009
59
Selected infectious diseasesThis table is compiled from countries’ most recent reports of cases of selected infectious diseases. These are officially reported numbers, but vary greatly in quality, representativeness, comparability and information value. The selection of diseases for inclusion in this table was made primarily on the availability of data. Where possible, the table distinguishes between zero cases reported and no information available for a country.
In isolation, these numbers provide no indication of the relative risk of disease, nor of the quality of disease reporting in different countries. However, this table does indicate the current status of officially reported infectious disease data at the global level and the major reporting gaps. Given the variation in the methods countries use to obtain these numbers, no attempt has been made to calculate incidence or prevalence. Further information on disease incidence and prevalence and immunization coverage rates for vaccine-preventable diseases can be obtained from the relevant disease-specific programmes at WHO.
To interpret these numbers, one needs to consider both epidemiological patterns and data collection efforts in specific countries. Some diseases – malaria and yellow fever, for example – are endemic to certain geographical regions, but are extremely rare elsewhere. Diseases such as plague are prone to outbreaks which cause case numbers to fluctuate wildly over time. Some diseases are best tackled with preventive measures such as mass drug treatment, so reporting the number of cases is a lower priority than estimating the population at risk. For vaccine-preventable diseases, case numbers are affected by immunization rates. Diseases such as H5N1 influenza, Japanese encephalitis and malaria are difficult to identify without specialized laboratory tests that are often not available in developing countries. In many settings, cases of some diseases – malaria is a common example – are identified through clinical signs and symptoms alone. Some diseases are reported under the International Health Regulations, while other diseases are monitored by countries or by WHO in the context of specific control programmes.
Despite ongoing efforts to enhance disease surveillance and response, many countries face challenges in accurately identifying, diagnosing and reporting infectious diseases due to the remoteness of communities, lack of transport and a communication infrastructure, and shortage of skilled health-care workers and laboratory facilities to ensure accurate diagnosis. No inference can be drawn from these figures about a country’s effort or progress in controlling particular diseases.
Case numbers are a poor indication of the burden of disease. Diseases such as H5N1 influenza and plague have high mortality rates, while diseases such as polio and leprosy have low mortality but result in heavy losses of healthy years of life. Some diseases with very small case numbers can potentially cause devastating epidemics, so mandatory reporting is essential. For diseases that are considered eradicable, such as leprosy and polio, case reporting is essential to ensure eradication efforts are targeted to the affected areas. In 2007, over 200 000 new cases of leprosy were reported globally and 1385 new cases of polio. The true numbers of cases are likely to be higher.
Tabl
e 3
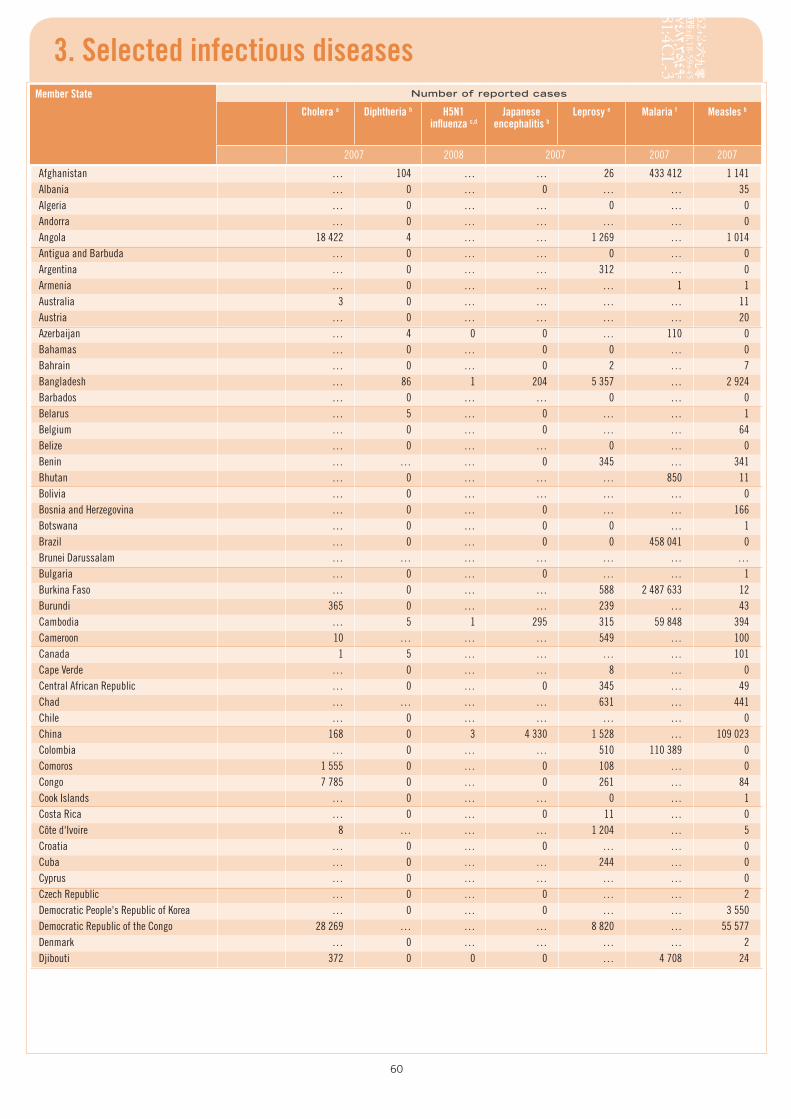
60
3. Selected infectious diseasesMember State Number of reported cases
Cholera a Diphtheria b H5N1 influenza c,d
Japanese encephalitis b
Leprosy e Malaria f Measles b
2007 2008 2007 2007 2007
Afghanistan … 104 … … 26 433 412 1 141Albania … 0 … 0 … … 35Algeria … 0 … … 0 … 0Andorra … 0 … … … … 0Angola 18 422 4 … … 1 269 … 1 014Antigua and Barbuda … 0 … … 0 … 0Argentina … 0 … … 312 … 0Armenia … 0 … … … 1 1Australia 3 0 … … … … 11Austria … 0 … … … … 20Azerbaijan … 4 0 0 … 110 0Bahamas … 0 … 0 0 … 0Bahrain … 0 … 0 2 … 7Bangladesh … 86 1 204 5 357 … 2 924Barbados … 0 … … 0 … 0Belarus … 5 … 0 … … 1Belgium … 0 … 0 … … 64Belize … 0 … … 0 … 0Benin … … … 0 345 … 341Bhutan … 0 … … … 850 11Bolivia … 0 … … … … 0Bosnia and Herzegovina … 0 … 0 … … 166Botswana … 0 … 0 0 … 1Brazil … 0 … 0 0 458 041 0Brunei Darussalam … … … … … … …Bulgaria … 0 … 0 … … 1Burkina Faso … 0 … … 588 2 487 633 12Burundi 365 0 … … 239 … 43Cambodia … 5 1 295 315 59 848 394Cameroon 10 … … … 549 … 100Canada 1 5 … … … … 101Cape Verde … 0 … … 8 … 0Central African Republic … 0 … 0 345 … 49Chad … … … … 631 … 441Chile … 0 … … … … 0China 168 0 3 4 330 1 528 … 109 023Colombia … 0 … … 510 110 389 0Comoros 1 555 0 … 0 108 … 0Congo 7 785 0 … 0 261 … 84Cook Islands … 0 … … 0 … 1Costa Rica … 0 … 0 11 … 0Côte d'Ivoire 8 … … … 1 204 … 5Croatia … 0 … 0 … … 0Cuba … 0 … … 244 … 0Cyprus … 0 … … … … 0Czech Republic … 0 … 0 … … 2Democratic People's Republic of Korea … 0 … 0 … … 3 550Democratic Republic of the Congo 28 269 … … … 8 820 … 55 577Denmark … 0 … … … … 2Djibouti 372 0 0 0 … 4 708 24
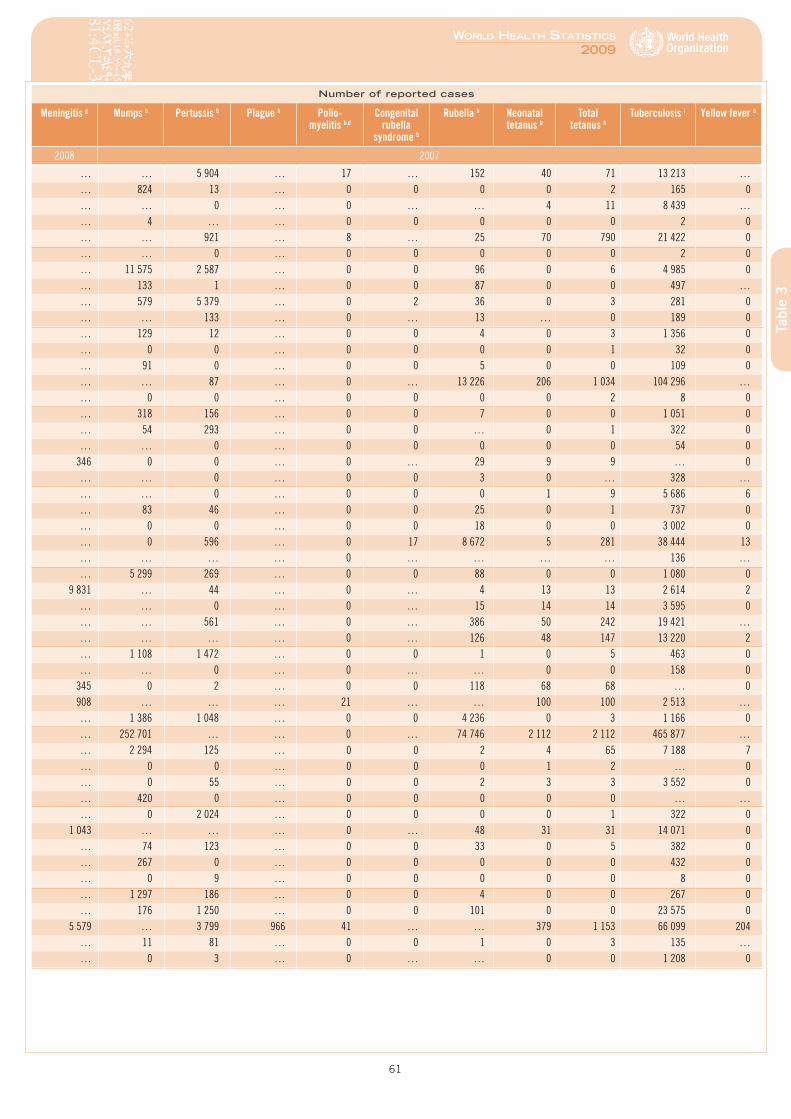
61
World HealtH StatiSticS
2009
Tabl
e 3
Number of reported cases
Meningitis g Mumps b Pertussis b Plague h Polio- myelitis b,d
Congenital rubella
syndrome b
Rubella b Neonatal tetanus b
Total tetanus b
Tuberculosis i Yellow fever b
2008 2007
… … 5 904 … 17 … 152 40 71 13 213 …… 824 13 … 0 0 0 0 2 165 0… … 0 … 0 … … 4 11 8 439 …… 4 … … 0 0 0 0 0 2 0… … 921 … 8 … 25 70 790 21 422 0… … 0 … 0 0 0 0 0 2 0… 11 575 2 587 … 0 0 96 0 6 4 985 0… 133 1 … 0 0 87 0 0 497 …… 579 5 379 … 0 2 36 0 3 281 0… … 133 … 0 … 13 … 0 189 0… 129 12 … 0 0 4 0 3 1 356 0… 0 0 … 0 0 0 0 1 32 0… 91 0 … 0 0 5 0 0 109 0… … 87 … 0 … 13 226 206 1 034 104 296 …… 0 0 … 0 0 0 0 2 8 0… 318 156 … 0 0 7 0 0 1 051 0… 54 293 … 0 0 … 0 1 322 0… … 0 … 0 0 0 0 0 54 0
346 0 0 … 0 … 29 9 9 … 0… … 0 … 0 0 3 0 … 328 …… … 0 … 0 0 0 1 9 5 686 6… 83 46 … 0 0 25 0 1 737 0… 0 0 … 0 0 18 0 0 3 002 0… 0 596 … 0 17 8 672 5 281 38 444 13… … … … 0 … … … … 136 …… 5 299 269 … 0 0 88 0 0 1 080 0
9 831 … 44 … 0 … 4 13 13 2 614 2… … 0 … 0 … 15 14 14 3 595 0… … 561 … 0 … 386 50 242 19 421 …… … … … 0 … 126 48 147 13 220 2… 1 108 1 472 … 0 0 1 0 5 463 0… … 0 … 0 … … 0 0 158 0
345 0 2 … 0 0 118 68 68 … 0 908 … … … 21 … … 100 100 2 513 …
… 1 386 1 048 … 0 0 4 236 0 3 1 166 0… 252 701 … … 0 … 74 746 2 112 2 112 465 877 …… 2 294 125 … 0 0 2 4 65 7 188 7… 0 0 … 0 0 0 1 2 … 0… 0 55 … 0 0 2 3 3 3 552 0… 420 0 … 0 0 0 0 0 … …… 0 2 024 … 0 0 0 0 1 322 0
1 043 … … … 0 … 48 31 31 14 071 0… 74 123 … 0 0 33 0 5 382 0… 267 0 … 0 0 0 0 0 432 0… 0 9 … 0 0 0 0 0 8 0… 1 297 186 … 0 0 4 0 0 267 0… 176 1 250 … 0 0 101 0 0 23 575 0
5 579 … 3 799 966 41 … … 379 1 153 66 099 204… 11 81 … 0 0 1 0 3 135 …… 0 3 … 0 … … 0 0 1 208 0
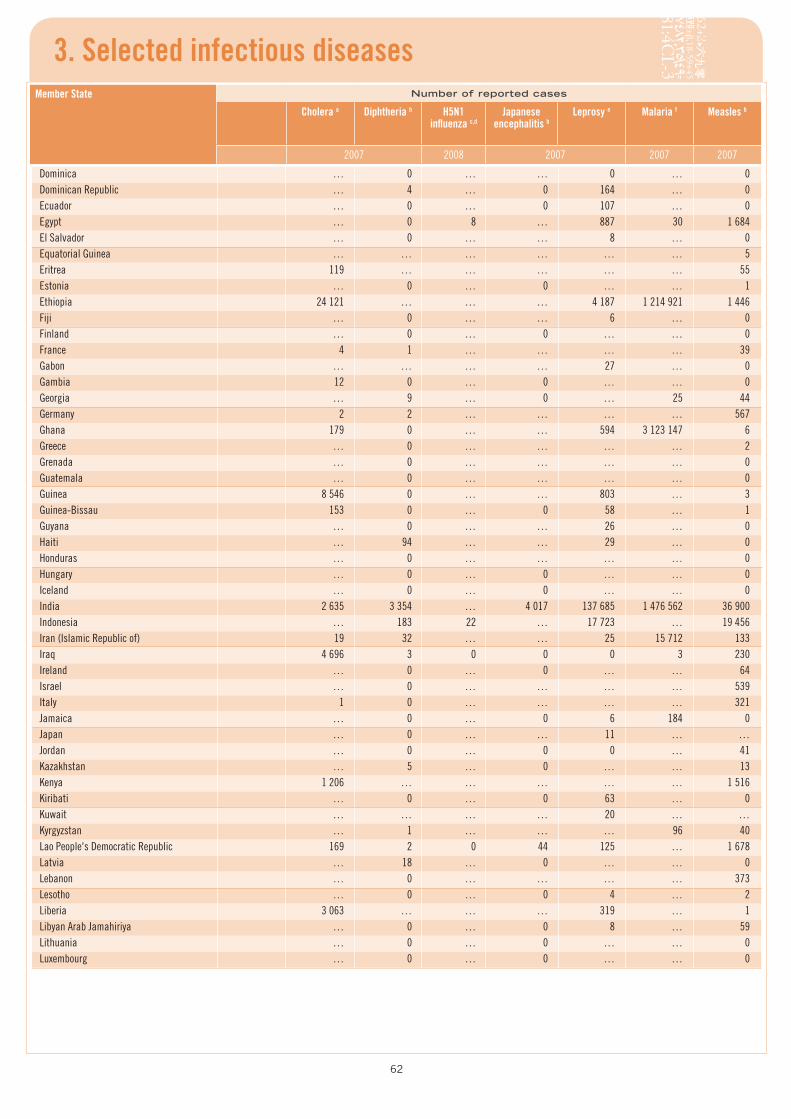
62
3. Selected infectious diseasesMember State Number of reported cases
Cholera a Diphtheria b H5N1 influenza c,d
Japanese encephalitis b
Leprosy e Malaria f Measles b
2007 2008 2007 2007 2007
Dominica … 0 … … 0 … 0Dominican Republic … 4 … 0 164 … 0Ecuador … 0 … 0 107 … 0Egypt … 0 8 … 887 30 1 684El Salvador … 0 … … 8 … 0Equatorial Guinea … … … … … … 5Eritrea 119 … … … … … 55Estonia … 0 … 0 … … 1Ethiopia 24 121 … … … 4 187 1 214 921 1 446Fiji … 0 … … 6 … 0Finland … 0 … 0 … … 0France 4 1 … … … … 39Gabon … … … … 27 … 0Gambia 12 0 … 0 … … 0Georgia … 9 … 0 … 25 44Germany 2 2 … … … … 567Ghana 179 0 … … 594 3 123 147 6Greece … 0 … … … … 2Grenada … 0 … … … … 0Guatemala … 0 … … … … 0Guinea 8 546 0 … … 803 … 3Guinea-Bissau 153 0 … 0 58 … 1Guyana … 0 … … 26 … 0Haiti … 94 … … 29 … 0Honduras … 0 … … … … 0Hungary … 0 … 0 … … 0Iceland … 0 … 0 … … 0India 2 635 3 354 … 4 017 137 685 1 476 562 36 900Indonesia … 183 22 … 17 723 … 19 456Iran (Islamic Republic of) 19 32 … … 25 15 712 133Iraq 4 696 3 0 0 0 3 230Ireland … 0 … 0 … … 64Israel … 0 … … … … 539Italy 1 0 … … … … 321Jamaica … 0 … 0 6 184 0Japan … 0 … … 11 … …Jordan … 0 … 0 0 … 41Kazakhstan … 5 … 0 … … 13Kenya 1 206 … … … … … 1 516Kiribati … 0 … 0 63 … 0Kuwait … … … … 20 … …Kyrgyzstan … 1 … … … 96 40Lao People's Democratic Republic 169 2 0 44 125 … 1 678Latvia … 18 … 0 … … 0Lebanon … 0 … … … … 373Lesotho … 0 … 0 4 … 2Liberia 3 063 … … … 319 … 1Libyan Arab Jamahiriya … 0 … 0 8 … 59Lithuania … 0 … 0 … … 0Luxembourg … 0 … 0 … … 0
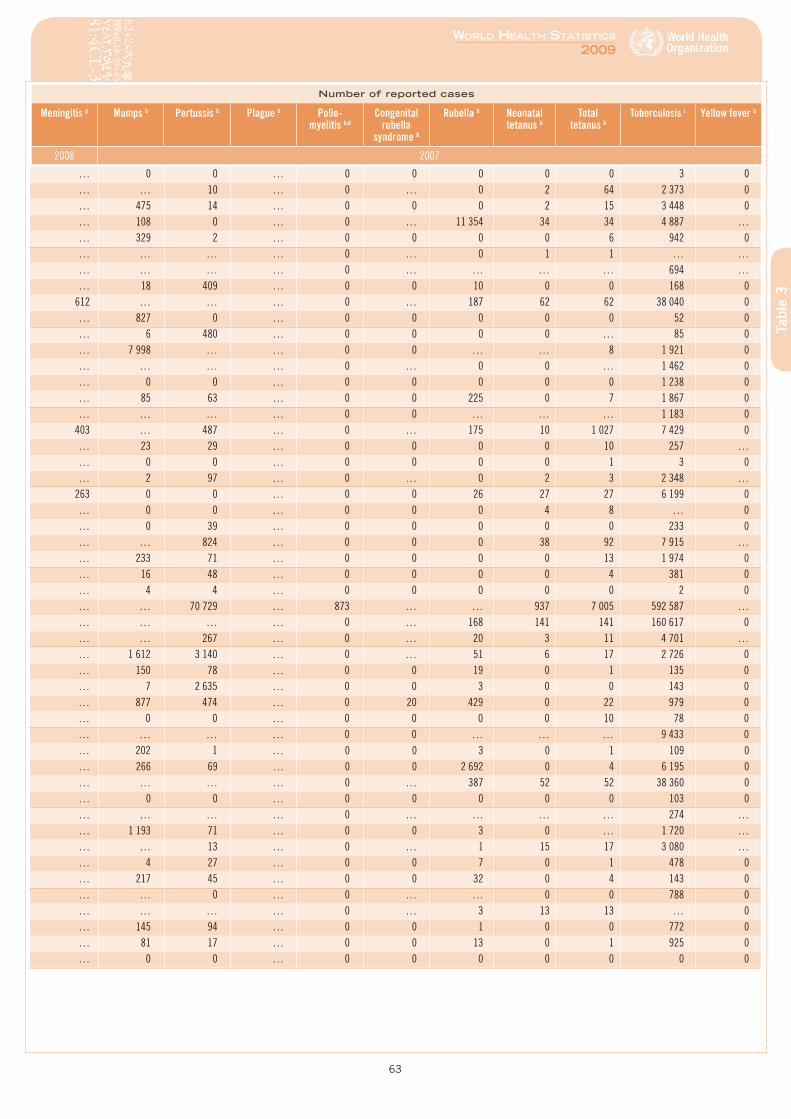
63
World HealtH StatiSticS
2009
Tabl
e 3
Number of reported cases
Meningitis g Mumps b Pertussis b Plague h Polio- myelitis b,d
Congenital rubella
syndrome b
Rubella b Neonatal tetanus b
Total tetanus b
Tuberculosis i Yellow fever b
2008 2007
… 0 0 … 0 0 0 0 0 3 0… … 10 … 0 … 0 2 64 2 373 0… 475 14 … 0 0 0 2 15 3 448 0… 108 0 … 0 … 11 354 34 34 4 887 …… 329 2 … 0 0 0 0 6 942 0… … … … 0 … 0 1 1 … …… … … … 0 … … … … 694 …… 18 409 … 0 0 10 0 0 168 0
612 … … … 0 … 187 62 62 38 040 0… 827 0 … 0 0 0 0 0 52 0… 6 480 … 0 0 0 0 … 85 0… 7 998 … … 0 0 … … 8 1 921 0… … … … 0 … 0 0 … 1 462 0… 0 0 … 0 0 0 0 0 1 238 0… 85 63 … 0 0 225 0 7 1 867 0… … … … 0 0 … … … 1 183 0
403 … 487 … 0 … 175 10 1 027 7 429 0… 23 29 … 0 0 0 0 10 257 …… 0 0 … 0 0 0 0 1 3 0… 2 97 … 0 … 0 2 3 2 348 …
263 0 0 … 0 0 26 27 27 6 199 0… 0 0 … 0 0 0 4 8 … 0… 0 39 … 0 0 0 0 0 233 0… … 824 … 0 0 0 38 92 7 915 …… 233 71 … 0 0 0 0 13 1 974 0… 16 48 … 0 0 0 0 4 381 0… 4 4 … 0 0 0 0 0 2 0… … 70 729 … 873 … … 937 7 005 592 587 …… … … … 0 … 168 141 141 160 617 0… … 267 … 0 … 20 3 11 4 701 …… 1 612 3 140 … 0 … 51 6 17 2 726 0… 150 78 … 0 0 19 0 1 135 0… 7 2 635 … 0 0 3 0 0 143 0… 877 474 … 0 20 429 0 22 979 0… 0 0 … 0 0 0 0 10 78 0… … … … 0 0 … … … 9 433 0… 202 1 … 0 0 3 0 1 109 0… 266 69 … 0 0 2 692 0 4 6 195 0… … … … 0 … 387 52 52 38 360 0… 0 0 … 0 0 0 0 0 103 0… … … … 0 … … … … 274 …… 1 193 71 … 0 0 3 0 … 1 720 …… … 13 … 0 … 1 15 17 3 080 …… 4 27 … 0 0 7 0 1 478 0… 217 45 … 0 0 32 0 4 143 0… … 0 … 0 … … 0 0 788 0… … … … 0 … 3 13 13 … 0… 145 94 … 0 0 1 0 0 772 0… 81 17 … 0 0 13 0 1 925 0… 0 0 … 0 0 0 0 0 0 0
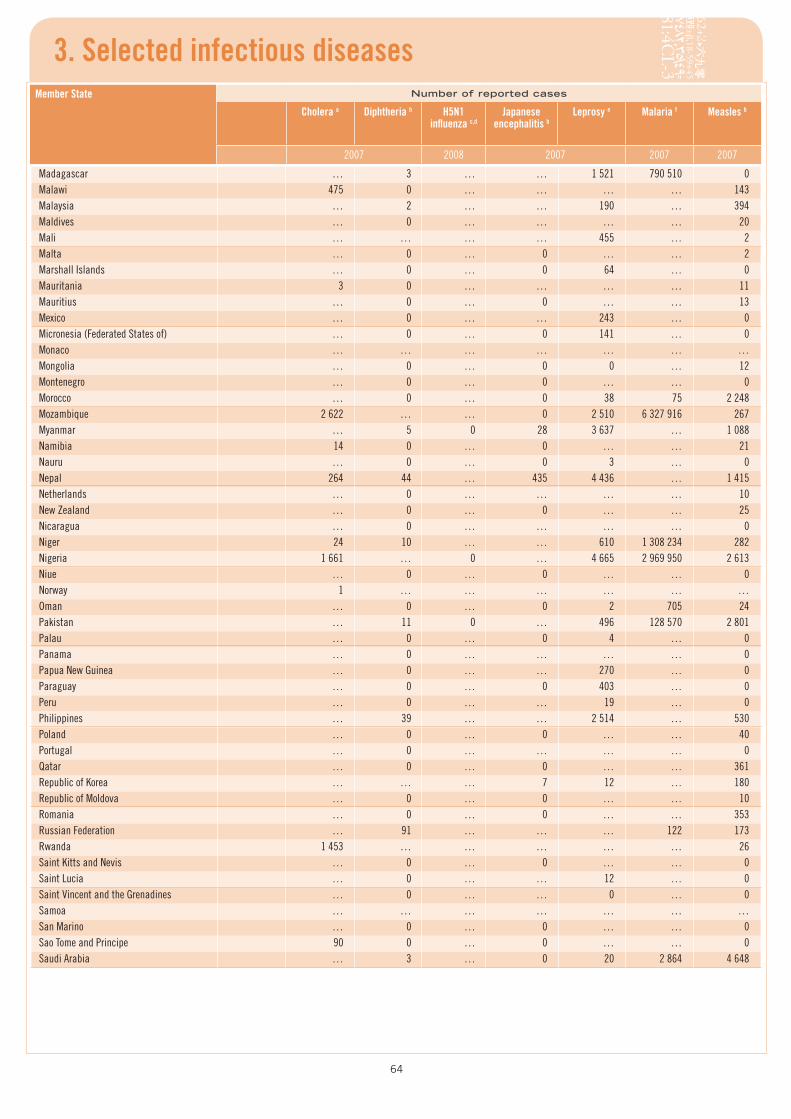
64
3. Selected infectious diseasesMember State Number of reported cases
Cholera a Diphtheria b H5N1 influenza c,d
Japanese encephalitis b
Leprosy e Malaria f Measles b
2007 2008 2007 2007 2007
Madagascar … 3 … … 1 521 790 510 0Malawi 475 0 … … … … 143Malaysia … 2 … … 190 … 394Maldives … 0 … … … … 20Mali … … … … 455 … 2Malta … 0 … 0 … … 2Marshall Islands … 0 … 0 64 … 0Mauritania 3 0 … … … … 11Mauritius … 0 … 0 … … 13Mexico … 0 … … 243 … 0Micronesia (Federated States of) … 0 … 0 141 … 0Monaco … … … … … … …Mongolia … 0 … 0 0 … 12Montenegro … 0 … 0 … … 0Morocco … 0 … 0 38 75 2 248Mozambique 2 622 … … 0 2 510 6 327 916 267Myanmar … 5 0 28 3 637 … 1 088Namibia 14 0 … 0 … … 21Nauru … 0 … 0 3 … 0Nepal 264 44 … 435 4 436 … 1 415Netherlands … 0 … … … … 10New Zealand … 0 … 0 … … 25Nicaragua … 0 … … … … 0Niger 24 10 … … 610 1 308 234 282Nigeria 1 661 … 0 … 4 665 2 969 950 2 613Niue … 0 … 0 … … 0Norway 1 … … … … … …Oman … 0 … 0 2 705 24Pakistan … 11 0 … 496 128 570 2 801Palau … 0 … 0 4 … 0Panama … 0 … … … … 0Papua New Guinea … 0 … … 270 … 0Paraguay … 0 … 0 403 … 0Peru … 0 … … 19 … 0Philippines … 39 … … 2 514 … 530Poland … 0 … 0 … … 40Portugal … 0 … … … … 0Qatar … 0 … 0 … … 361Republic of Korea … … … 7 12 … 180Republic of Moldova … 0 … 0 … … 10Romania … 0 … 0 … … 353Russian Federation … 91 … … … 122 173Rwanda 1 453 … … … … … 26Saint Kitts and Nevis … 0 … 0 … … 0Saint Lucia … 0 … … 12 … 0Saint Vincent and the Grenadines … 0 … … 0 … 0Samoa … … … … … … …San Marino … 0 … 0 … … 0Sao Tome and Principe 90 0 … 0 … … 0Saudi Arabia … 3 … 0 20 2 864 4 648
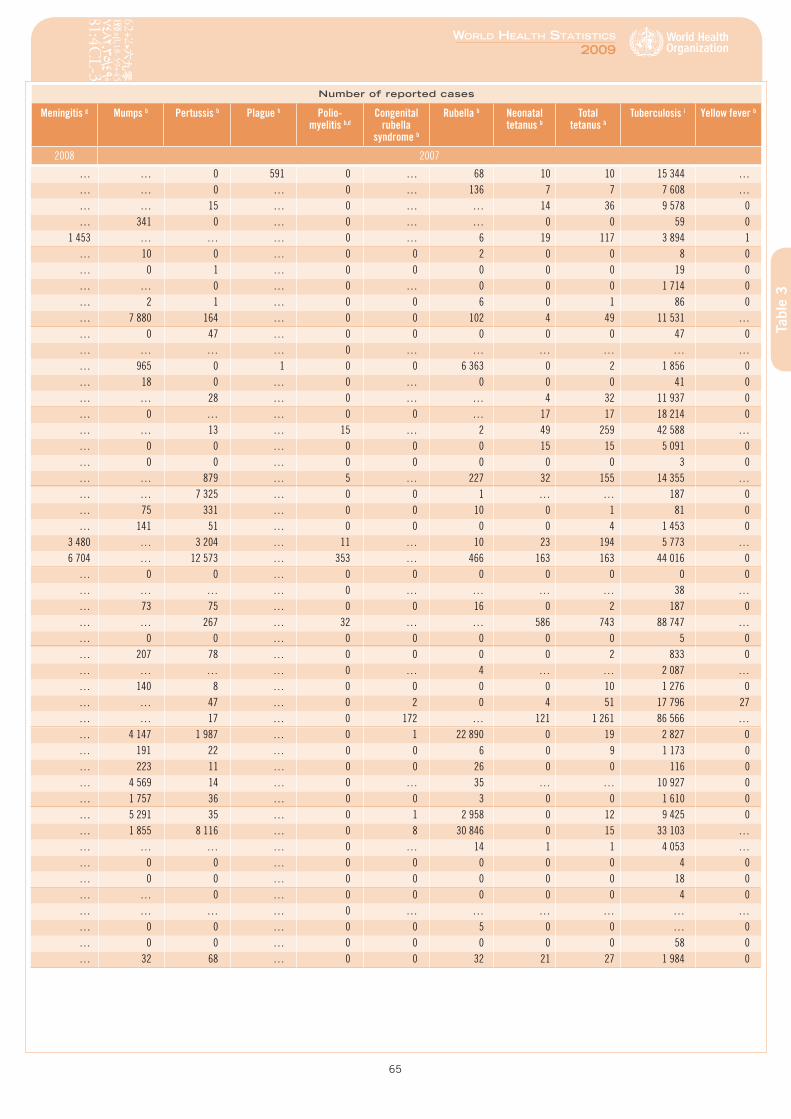
65
World HealtH StatiSticS
2009
Tabl
e 3
Number of reported cases
Meningitis g Mumps b Pertussis b Plague h Polio- myelitis b,d
Congenital rubella
syndrome b
Rubella b Neonatal tetanus b
Total tetanus b
Tuberculosis i Yellow fever b
2008 2007
… … 0 591 0 … 68 10 10 15 344 …… … 0 … 0 … 136 7 7 7 608 …… … 15 … 0 … … 14 36 9 578 0… 341 0 … 0 … … 0 0 59 0
1 453 … … … 0 … 6 19 117 3 894 1… 10 0 … 0 0 2 0 0 8 0… 0 1 … 0 0 0 0 0 19 0… … 0 … 0 … 0 0 0 1 714 0… 2 1 … 0 0 6 0 1 86 0… 7 880 164 … 0 0 102 4 49 11 531 …… 0 47 … 0 0 0 0 0 47 0… … … … 0 … … … … … …… 965 0 1 0 0 6 363 0 2 1 856 0… 18 0 … 0 … 0 0 0 41 0… … 28 … 0 … … 4 32 11 937 0… 0 … … 0 0 … 17 17 18 214 0… … 13 … 15 … 2 49 259 42 588 …… 0 0 … 0 0 0 15 15 5 091 0… 0 0 … 0 0 0 0 0 3 0… … 879 … 5 … 227 32 155 14 355 …… … 7 325 … 0 0 1 … … 187 0… 75 331 … 0 0 10 0 1 81 0… 141 51 … 0 0 0 0 4 1 453 0
3 480 … 3 204 … 11 … 10 23 194 5 773 … 6 704 … 12 573 … 353 … 466 163 163 44 016 0
… 0 0 … 0 0 0 0 0 0 0… … … … 0 … … … … 38 …… 73 75 … 0 0 16 0 2 187 0… … 267 … 32 … … 586 743 88 747 …… 0 0 … 0 0 0 0 0 5 0… 207 78 … 0 0 0 0 2 833 0… … … … 0 … 4 … … 2 087 …… 140 8 … 0 0 0 0 10 1 276 0… … 47 … 0 2 0 4 51 17 796 27… … 17 … 0 172 … 121 1 261 86 566 …… 4 147 1 987 … 0 1 22 890 0 19 2 827 0… 191 22 … 0 0 6 0 9 1 173 0… 223 11 … 0 0 26 0 0 116 0… 4 569 14 … 0 … 35 … … 10 927 0… 1 757 36 … 0 0 3 0 0 1 610 0… 5 291 35 … 0 1 2 958 0 12 9 425 0… 1 855 8 116 … 0 8 30 846 0 15 33 103 …… … … … 0 … 14 1 1 4 053 …… 0 0 … 0 0 0 0 0 4 0… 0 0 … 0 0 0 0 0 18 0… … 0 … 0 0 0 0 0 4 0… … … … 0 … … … … … …… 0 0 … 0 0 5 0 0 … 0… 0 0 … 0 0 0 0 0 58 0… 32 68 … 0 0 32 21 27 1 984 0
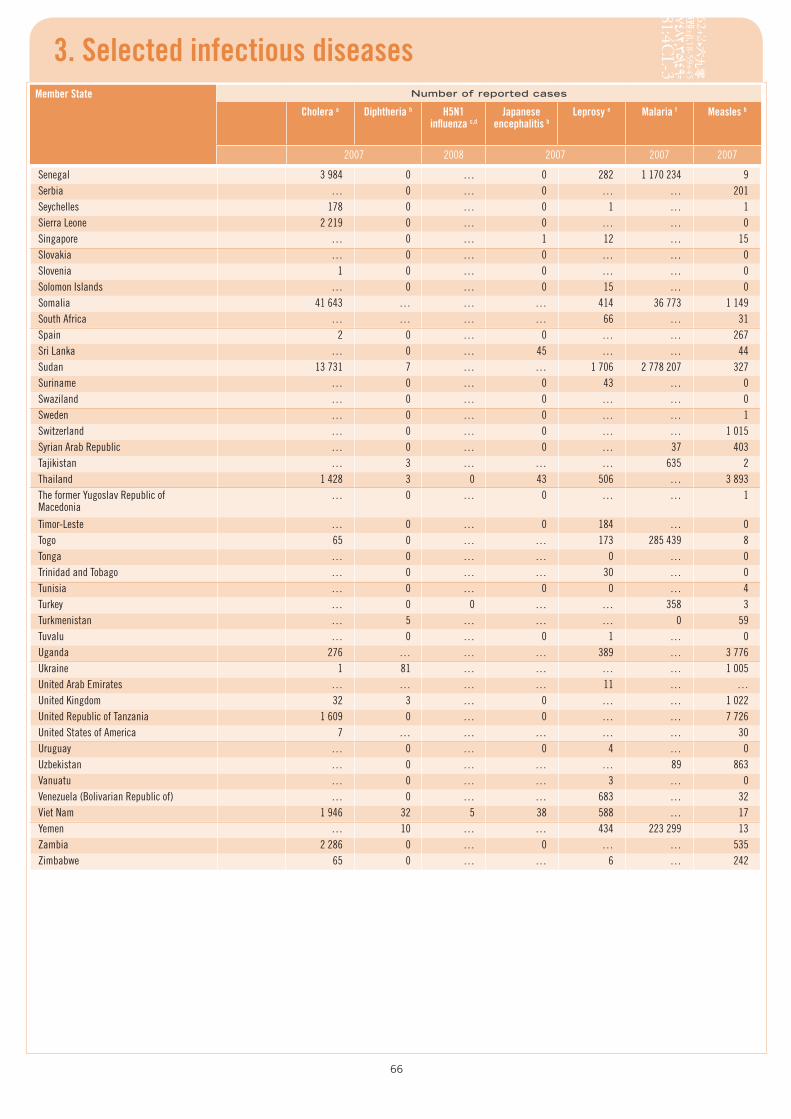
66
3. Selected infectious diseasesMember State Number of reported cases
Cholera a Diphtheria b H5N1 influenza c,d
Japanese encephalitis b
Leprosy e Malaria f Measles b
2007 2008 2007 2007 2007
Senegal 3 984 0 … 0 282 1 170 234 9Serbia … 0 … 0 … … 201Seychelles 178 0 … 0 1 … 1Sierra Leone 2 219 0 … 0 … … 0Singapore … 0 … 1 12 … 15Slovakia … 0 … 0 … … 0Slovenia 1 0 … 0 … … 0Solomon Islands … 0 … 0 15 … 0Somalia 41 643 … … … 414 36 773 1 149South Africa … … … … 66 … 31Spain 2 0 … 0 … … 267Sri Lanka … 0 … 45 … … 44Sudan 13 731 7 … … 1 706 2 778 207 327Suriname … 0 … 0 43 … 0Swaziland … 0 … 0 … … 0Sweden … 0 … 0 … … 1Switzerland … 0 … 0 … … 1 015Syrian Arab Republic … 0 … 0 … 37 403Tajikistan … 3 … … … 635 2Thailand 1 428 3 0 43 506 … 3 893The former Yugoslav Republic of Macedonia
… 0 … 0 … … 1
Timor-Leste … 0 … 0 184 … 0Togo 65 0 … … 173 285 439 8Tonga … 0 … … 0 … 0Trinidad and Tobago … 0 … … 30 … 0Tunisia … 0 … 0 0 … 4Turkey … 0 0 … … 358 3Turkmenistan … 5 … … … 0 59Tuvalu … 0 … 0 1 … 0Uganda 276 … … … 389 … 3 776Ukraine 1 81 … … … … 1 005United Arab Emirates … … … … 11 … …United Kingdom 32 3 … 0 … … 1 022United Republic of Tanzania 1 609 0 … 0 … … 7 726United States of America 7 … … … … … 30Uruguay … 0 … 0 4 … 0Uzbekistan … 0 … … … 89 863Vanuatu … 0 … … 3 … 0Venezuela (Bolivarian Republic of) … 0 … … 683 … 32Viet Nam 1 946 32 5 38 588 … 17Yemen … 10 … … 434 223 299 13Zambia 2 286 0 … 0 … … 535Zimbabwe 65 0 … … 6 … 242
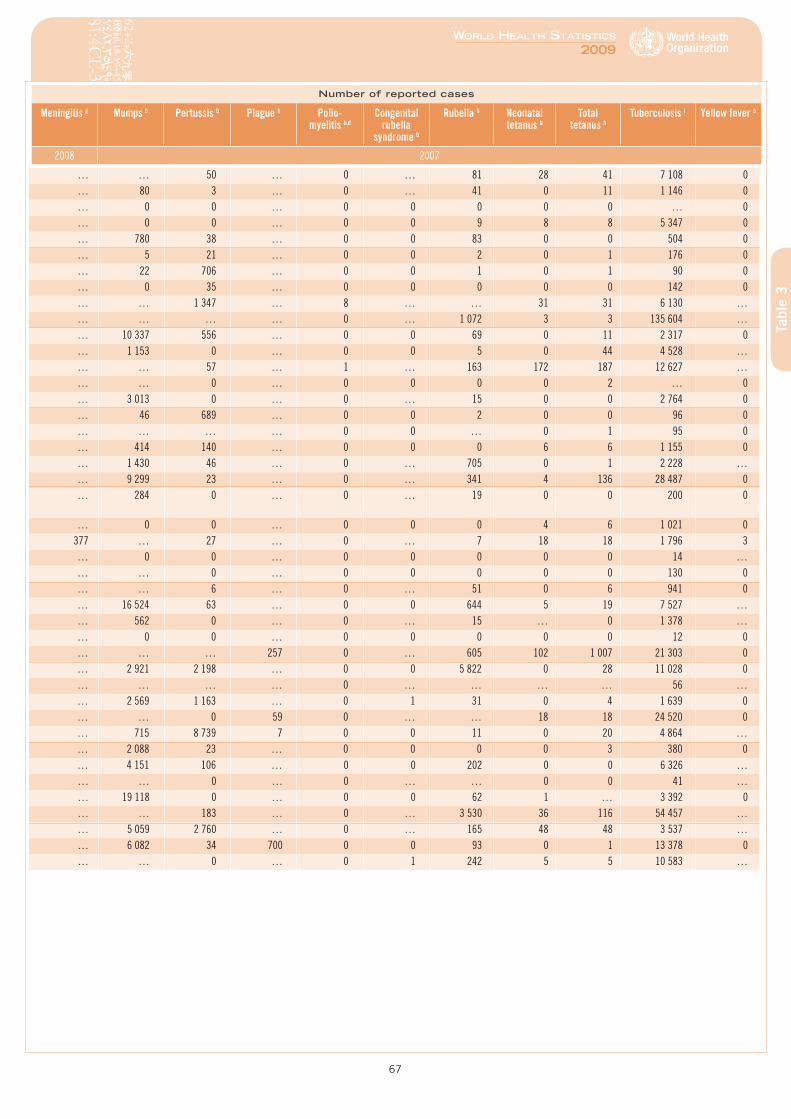
67
World HealtH StatiSticS
2009
Tabl
e 3
Number of reported cases
Meningitis g Mumps b Pertussis b Plague h Polio- myelitis b,d
Congenital rubella
syndrome b
Rubella b Neonatal tetanus b
Total tetanus b
Tuberculosis i Yellow fever b
2008 2007
… … 50 … 0 … 81 28 41 7 108 0… 80 3 … 0 … 41 0 11 1 146 0… 0 0 … 0 0 0 0 0 … 0… 0 0 … 0 0 9 8 8 5 347 0… 780 38 … 0 0 83 0 0 504 0… 5 21 … 0 0 2 0 1 176 0… 22 706 … 0 0 1 0 1 90 0… 0 35 … 0 0 0 0 0 142 0… … 1 347 … 8 … … 31 31 6 130 …… … … … 0 … 1 072 3 3 135 604 …… 10 337 556 … 0 0 69 0 11 2 317 0… 1 153 0 … 0 0 5 0 44 4 528 …… … 57 … 1 … 163 172 187 12 627 …… … 0 … 0 0 0 0 2 … 0… 3 013 0 … 0 … 15 0 0 2 764 0… 46 689 … 0 0 2 0 0 96 0… … … … 0 0 … 0 1 95 0… 414 140 … 0 0 0 6 6 1 155 0… 1 430 46 … 0 … 705 0 1 2 228 …… 9 299 23 … 0 … 341 4 136 28 487 0… 284 0 … 0 … 19 0 0 200 0
… 0 0 … 0 0 0 4 6 1 021 0 377 … 27 … 0 … 7 18 18 1 796 3
… 0 0 … 0 0 0 0 0 14 …… … 0 … 0 0 0 0 0 130 0… … 6 … 0 … 51 0 6 941 0… 16 524 63 … 0 0 644 5 19 7 527 …… 562 0 … 0 … 15 … 0 1 378 …… 0 0 … 0 0 0 0 0 12 0… … … 257 0 … 605 102 1 007 21 303 0… 2 921 2 198 … 0 0 5 822 0 28 11 028 0… … … … 0 … … … … 56 …… 2 569 1 163 … 0 1 31 0 4 1 639 0… … 0 59 0 … … 18 18 24 520 0… 715 8 739 7 0 0 11 0 20 4 864 …… 2 088 23 … 0 0 0 0 3 380 0… 4 151 106 … 0 0 202 0 0 6 326 …… … 0 … 0 … … 0 0 41 …… 19 118 0 … 0 0 62 1 … 3 392 0… … 183 … 0 … 3 530 36 116 54 457 …… 5 059 2 760 … 0 … 165 48 48 3 537 …… 6 082 34 700 0 0 93 0 1 13 378 0… … 0 … 0 1 242 5 5 10 583 …
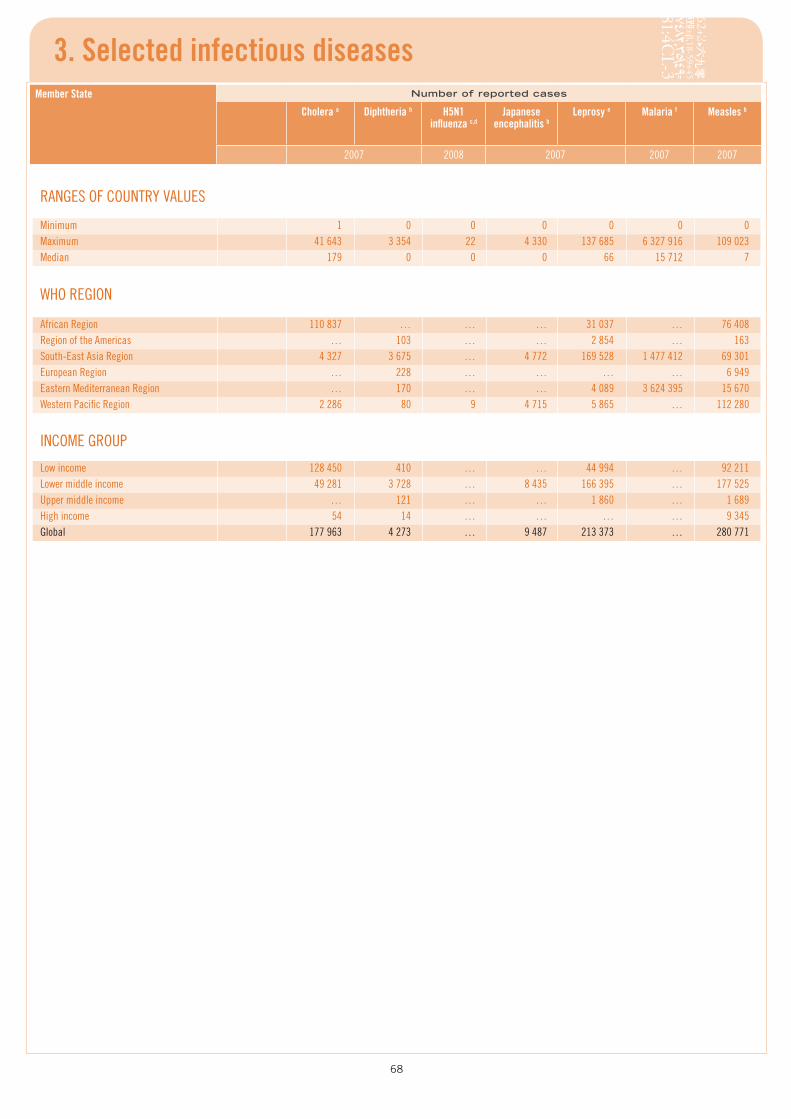
68
3. Selected infectious diseasesMember State Number of reported cases
Cholera a Diphtheria b H5N1 influenza c,d
Japanese encephalitis b
Leprosy e Malaria f Measles b
2007 2008 2007 2007 2007
RANGES OF COUNTRY VALUES
Minimum 1 0 0 0 0 0 0Maximum 41 643 3 354 22 4 330 137 685 6 327 916 109 023Median 179 0 0 0 66 15 712 7
WHO REGION
African Region 110 837 … … … 31 037 … 76 408Region of the Americas … 103 … … 2 854 … 163South-East Asia Region 4 327 3 675 … 4 772 169 528 1 477 412 69 301European Region … 228 … … … … 6 949Eastern Mediterranean Region … 170 … … 4 089 3 624 395 15 670Western Pacific Region 2 286 80 9 4 715 5 865 … 112 280
INCOME GROUP
Low income 128 450 410 … … 44 994 … 92 211Lower middle income 49 281 3 728 … 8 435 166 395 … 177 525Upper middle income … 121 … … 1 860 … 1 689High income 54 14 … … … … 9 345Global 177 963 4 273 … 9 487 213 373 … 280 771
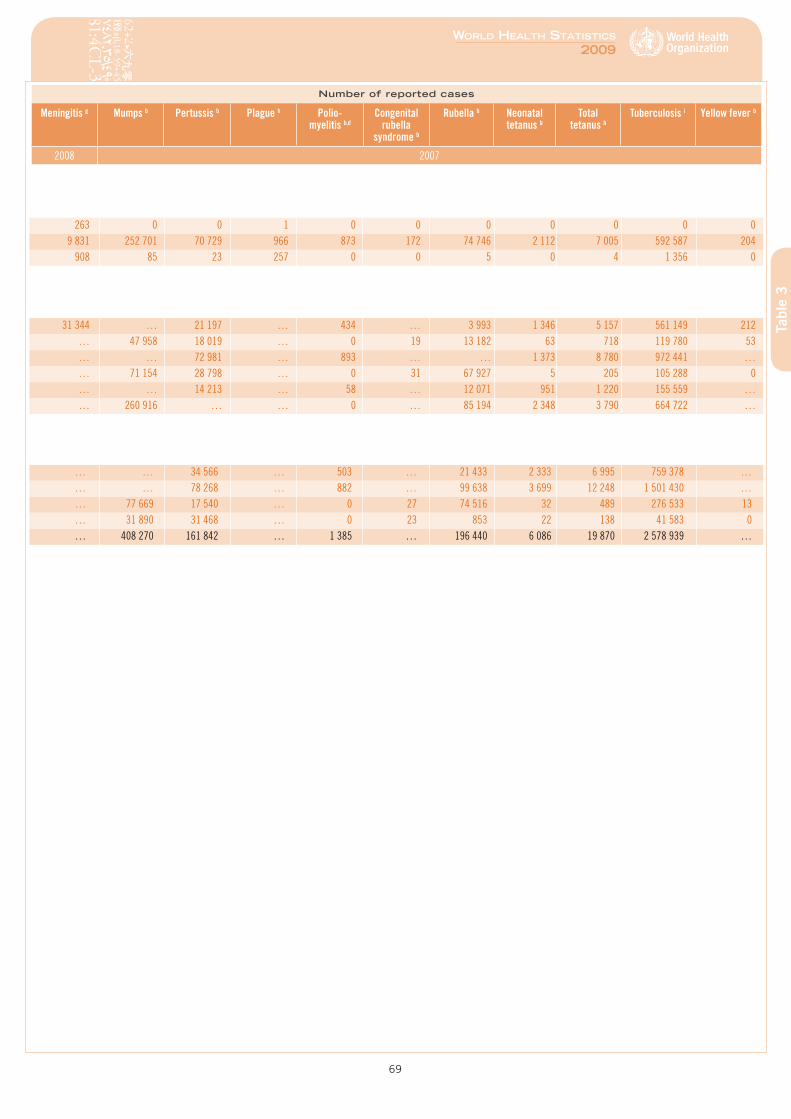
69
World HealtH StatiSticS
2009
Tabl
e 3
Number of reported cases
Meningitis g Mumps b Pertussis b Plague h Polio- myelitis b,d
Congenital rubella
syndrome b
Rubella b Neonatal tetanus b
Total tetanus b
Tuberculosis i Yellow fever b
2008 2007
263 0 0 1 0 0 0 0 0 0 0 9 831 252 701 70 729 966 873 172 74 746 2 112 7 005 592 587 204
908 85 23 257 0 0 5 0 4 1 356 0
31 344 … 21 197 … 434 … 3 993 1 346 5 157 561 149 212… 47 958 18 019 … 0 19 13 182 63 718 119 780 53… … 72 981 … 893 … … 1 373 8 780 972 441 …… 71 154 28 798 … 0 31 67 927 5 205 105 288 0… … 14 213 … 58 … 12 071 951 1 220 155 559 …… 260 916 … … 0 … 85 194 2 348 3 790 664 722 …
… … 34 566 … 503 … 21 433 2 333 6 995 759 378 …… … 78 268 … 882 … 99 638 3 699 12 248 1 501 430 …… 77 669 17 540 … 0 27 74 516 32 489 276 533 13… 31 890 31 468 … 0 23 853 22 138 41 583 0… 408 270 161 842 … 1 385 … 196 440 6 086 19 870 2 578 939 …

World HealtH StatiSticS
2009
71
Health service coverageHealth service coverage indicators reflect the extent to which people in need actually receive important health interventions. Such indicators include the care of women during pregnancy and childbirth, reproductive health services, immunization to prevent common childhood infections, vitamin A supplementation in children, and treatment for common childhood diseases and infectious diseases in adults.
The data show that there have been significant improvements in the coverage of public health interventions since 1990. For example, immunization rates for measles, diphtheria, pertussis and tetanus, hepatitis B, and Haemophilus influenzae type B have increased in most regions. However, there are significant variations between regions. The highest immunization rates are found in the Americas and Europe and the lowest rates in the South-East Asia Region.
Coverage indicators are typically calculated by dividing the number of people receiving a defined intervention by the population eligible for or in need of the intervention. For example, the indicator on immunization coverage among 1-year-old children is calculated from the number of children having received a specific vaccine divided by the total population of children under one in each country. For indicators on antenatal care and skilled attendance at delivery, the denominator is live births.
The main sources of data on coverage are household surveys and respondents’ answers to questions about service use. The principle types of surveys are the Expanded Programme on Immunization (EPI) 30-cluster survey, the UNICEF Multiple Indicator Cluster Survey (MICS), and the Demographic and Health Survey (DHS).
The other source of data is administrative records of routine service provision, which provide data on the numerator. The denominator is estimated on the basis of census projections.
Neither source of data is perfect: administrative records tend to overestimate coverage as a result of double counting in the numerator and uncertainty in the denominator. Household surveys are generally considered to be more reliable but are subject to respondent reporting errors as well as to margins of uncertainty due to sampling errors. In generating global estimates, it is good practice to reconcile data from multiple sources in order to maximize the accuracy of the estimate.
Regional aggregates are not available for several coverage indicators, reflecting limited availability of data for several indicators and also due to the fact that some conditions – such as malaria – are not of public health significance in several countries.
Tabl
e 4
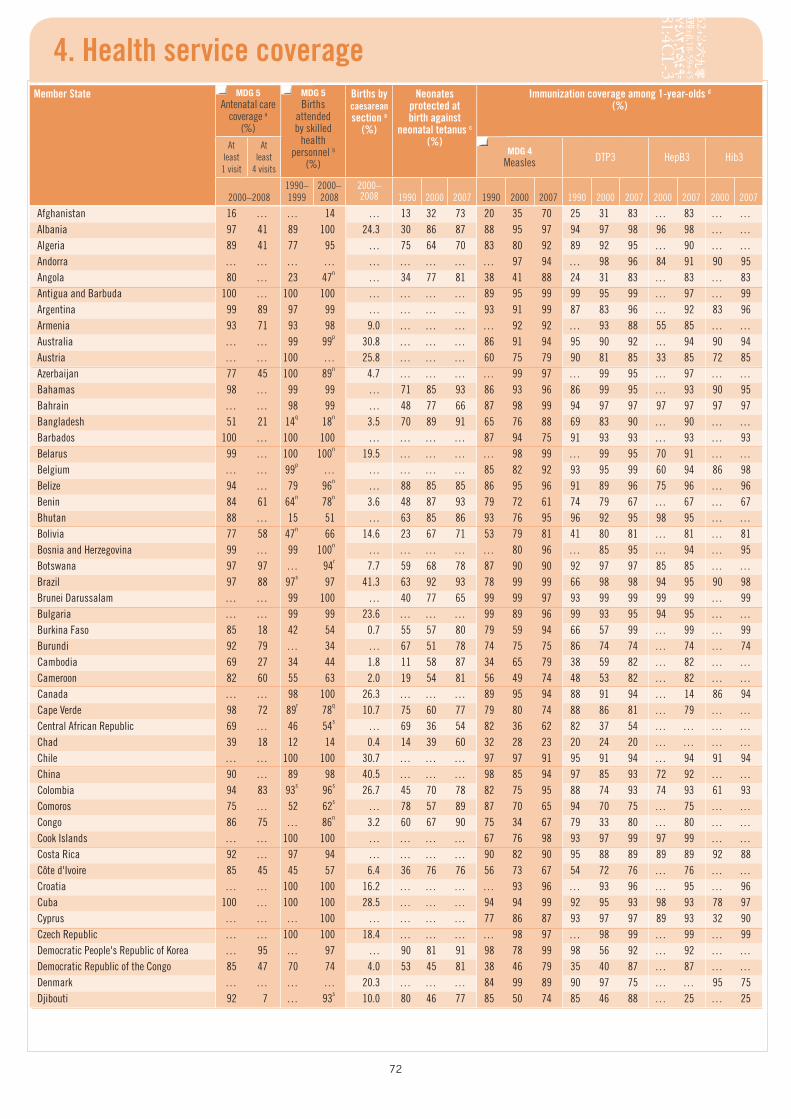
72
4. Health service coverageMember State MDG 5
A ntenatal care c overage a
(%)
MDG 5 Births
a ttended by skilled
health p ersonnel b
(%)
Births by caesarean section a
(%)
Neonates protected at birth against
neonatal tetanus c
(%)
Immunization coverage among 1-year-olds d
(%)
Atleast1 visit
Atleast
4 visits
MDG 4 Measles DTP3 HepB3 Hib3
2000–20081990– 1999
2000– 2008
2000– 2008 1990 2000 2007 1990 2000 2007 1990 2000 2007 2000 2007 2000 2007
Afghanistan 16 … … 14 … 13 32 73 20 35 70 25 31 83 … 83 … …Albania 97 41 89 100 24.3 30 86 87 88 95 97 94 97 98 96 98 … …Algeria 89 41 77 95 … 75 64 70 83 80 92 89 92 95 … 90 … …Andorra … … … … … … … … … 97 94 … 98 96 84 91 90 95Angola 80 … 23 47n … 34 77 81 38 41 88 24 31 83 … 83 … 83Antigua and Barbuda 100 … 100 100 … … … … 89 95 99 99 95 99 … 97 … 99Argentina 99 89 97 99 … … … … 93 91 99 87 83 96 … 92 83 96Armenia 93 71 93 98 9.0 … … … … 92 92 … 93 88 55 85 … …Australia … … 99 99p 30.8 … … … 86 91 94 95 90 92 … 94 90 94Austria … … 100 … 25.8 … … … 60 75 79 90 81 85 33 85 72 85Azerbaijan 77 45 100 89n 4.7 … … … … 99 97 … 99 95 … 97 … …Bahamas 98 … 99 99 … 71 85 93 86 93 96 86 99 95 … 93 90 95Bahrain … … 98 99 … 48 77 66 87 98 99 94 97 97 97 97 97 97Bangladesh 51 21 14q 18n 3.5 70 89 91 65 76 88 69 83 90 … 90 … …Barbados 100 … 100 100 … … … … 87 94 75 91 93 93 … 93 … 93Belarus 99 … 100 100n 19.5 … … … … 98 99 … 99 95 70 91 … …Belgium … … 99p … … … … … 85 82 92 93 95 99 60 94 86 98Belize 94 … 79 96n … 88 85 85 86 95 96 91 89 96 75 96 … 96Benin 84 61 64n 78n 3.6 48 87 93 79 72 61 74 79 67 … 67 … 67Bhutan 88 … 15 51 … 63 85 86 93 76 95 96 92 95 98 95 … …Bolivia 77 58 47n 66 14.6 23 67 71 53 79 81 41 80 81 … 81 … 81Bosnia and Herzegovina 99 … 99 100n … … … … … 80 96 … 85 95 … 94 … 95Botswana 97 97 … 94r 7.7 59 68 78 87 90 90 92 97 97 85 85 … …Brazil 97 88 97s 97 41.3 63 92 93 78 99 99 66 98 98 94 95 90 98Brunei Darussalam … … 99 100 … 40 77 65 99 99 97 93 99 99 99 99 … 99Bulgaria … … 99 99 23.6 … … … 99 89 96 99 93 95 94 95 … …Burkina Faso 85 18 42 54 0.7 55 57 80 79 59 94 66 57 99 … 99 … 99Burundi 92 79 … 34 … 67 51 78 74 75 75 86 74 74 … 74 … 74Cambodia 69 27 34 44 1.8 11 58 87 34 65 79 38 59 82 … 82 … …Cameroon 82 60 55 63 2.0 19 54 81 56 49 74 48 53 82 … 82 … …Canada … … 98 100 26.3 … … … 89 95 94 88 91 94 … 14 86 94Cape Verde 98 72 89r 78q 10.7 75 60 77 79 80 74 88 86 81 … 79 … …Central African Republic 69 … 46 54s … 69 36 54 82 36 62 82 37 54 … … … …Chad 39 18 12 14 0.4 14 39 60 32 28 23 20 24 20 … … … …Chile … … 100 100 30.7 … … … 97 97 91 95 91 94 … 94 91 94China 90 … 89 98 40.5 … … … 98 85 94 97 85 93 72 92 … …Colombia 94 83 93s 96s 26.7 45 70 78 82 75 95 88 74 93 74 93 61 93Comoros 75 … 52 62s … 78 57 89 87 70 65 94 70 75 … 75 … …Congo 86 75 … 86n 3.2 60 67 90 75 34 67 79 33 80 … 80 … …Cook Islands … … 100 100 … … … … 67 76 98 93 97 99 97 99 … …Costa Rica 92 … 97 94 … … … … 90 82 90 95 88 89 89 89 92 88Côte d'Ivoire 85 45 45 57 6.4 36 76 76 56 73 67 54 72 76 … 76 … …Croatia … … 100 100 16.2 … … … … 93 96 … 93 96 … 95 … 96Cuba 100 … 100 100 28.5 … … … 94 94 99 92 95 93 98 93 78 97Cyprus … … … 100 … … … … 77 86 87 93 97 97 89 93 32 90Czech Republic … … 100 100 18.4 … … … … 98 97 … 98 99 … 99 … 99Democratic People's Republic of Korea … 95 … 97 … 90 81 91 98 78 99 98 56 92 … 92 … …Democratic Republic of the Congo 85 47 70 74 4.0 53 45 81 38 46 79 35 40 87 … 87 … …Denmark … … … … 20.3 … … … 84 99 89 90 97 75 … … 95 75Djibouti 92 7 … 93s 10.0 80 46 77 85 50 74 85 46 88 … 25 … 25
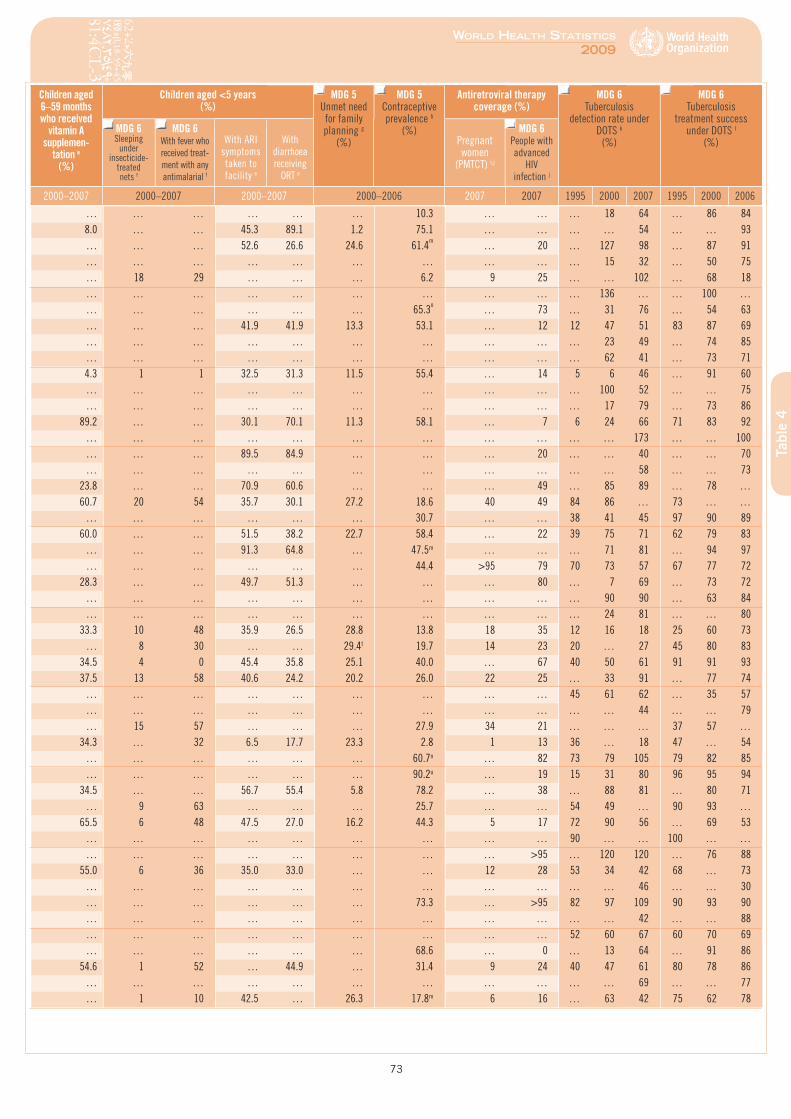
73
World HealtH StatiSticS
2009
Tabl
e 4
Children aged 6–59 months who received
vitamin A supplemen-
tation e(%)
Children aged <5 years (%)
MDG 5Unmet need for family planning g
(%)
MDG 5 Contraceptive prevalence h
(%)
Antiretroviral therapy coverage (%)
MDG 6 Tuberculosis
detection rate under DOTS k
(%)
MDG 6 Tuberculosis
treatment success under DOTS l
(%)MDG 6Sleeping
under insecticide-
treated nets f
MDG 6With fever who received treat-ment with any antimalarial f
With ARI symptoms taken to facility e
With diarrhoea receiving
ORT e
Pregnant women
(PMTCT) i,j
MDG 6People with advanced
HIV infection j
2000–2007 2000–2007 2000–2007 2000–2006 2007 2007 1995 2000 2007 1995 2000 2006
… … … … … … 10.3 … … … 18 64 … 86 848.0 … … 45.3 89.1 1.2 75.1 … … … … 54 … … 93… … … 52.6 26.6 24.6 61.4m … 20 … 127 98 … 87 91… … … … … … … … … … 15 32 … 50 75… 18 29 … … … 6.2 9 25 … … 102 … 68 18… … … … … … … … … … 136 … … 100 …… … … … … … 65.3o … 73 … 31 76 … 54 63… … … 41.9 41.9 13.3 53.1 … 12 12 47 51 83 87 69… … … … … … … … … … 23 49 … 74 85… … … … … … … … … … 62 41 … 73 714.3 1 1 32.5 31.3 11.5 55.4 … 14 5 6 46 … 91 60… … … … … … … … … … 100 52 … … 75… … … … … … … … … … 17 79 … 73 86
89.2 … … 30.1 70.1 11.3 58.1 … 7 6 24 66 71 83 92… … … … … … … … … … … 173 … … 100… … … 89.5 84.9 … … … 20 … … 40 … … 70… … … … … … … … … … … 58 … … 73
23.8 … … 70.9 60.6 … … … 49 … 85 89 … 78 …60.7 20 54 35.7 30.1 27.2 18.6 40 49 84 86 … 73 … …
… … … … … … 30.7 … … 38 41 45 97 90 8960.0 … … 51.5 38.2 22.7 58.4 … 22 39 75 71 62 79 83
… … … 91.3 64.8 … 47.5m … … … 71 81 … 94 97… … … … … … 44.4 >95 79 70 73 57 67 77 72
28.3 … … 49.7 51.3 … … … 80 … 7 69 … 73 72… … … … … … … … … … 90 90 … 63 84… … … … … … … … … … 24 81 … … 80
33.3 10 48 35.9 26.5 28.8 13.8 18 35 12 16 18 25 60 73… 8 30 … … 29.4t 19.7 14 23 20 … 27 45 80 83
34.5 4 0 45.4 35.8 25.1 40.0 … 67 40 50 61 91 91 9337.5 13 58 40.6 24.2 20.2 26.0 22 25 … 33 91 … 77 74
… … … … … … … … … 45 61 62 … 35 57… … … … … … … … … … … 44 … … 79… 15 57 … … … 27.9 34 21 … … … 37 57 …
34.3 … 32 6.5 17.7 23.3 2.8 1 13 36 … 18 47 … 54… … … … … … 60.7n … 82 73 79 105 79 82 85… … … … … … 90.2u … 19 15 31 80 96 95 94
34.5 … … 56.7 55.4 5.8 78.2 … 38 … 88 81 … 80 71… 9 63 … … … 25.7 … … 54 49 … 90 93 …
65.5 6 48 47.5 27.0 16.2 44.3 5 17 72 90 56 … 69 53… … … … … … … … … 90 … … 100 … …… … … … … … … … >95 … 120 120 … 76 88
55.0 6 36 35.0 33.0 … … 12 28 53 34 42 68 … 73… … … … … … … … … … … 46 … … 30… … … … … … 73.3 … >95 82 97 109 90 93 90… … … … … … … … … … … 42 … … 88… … … … … … … … … 52 60 67 60 70 69… … … … … … 68.6 … 0 … 13 64 … 91 86
54.6 1 52 … 44.9 … 31.4 9 24 40 47 61 80 78 86… … … … … … … … … … … 69 … … 77… 1 10 42.5 … 26.3 17.8m 6 16 … 63 42 75 62 78
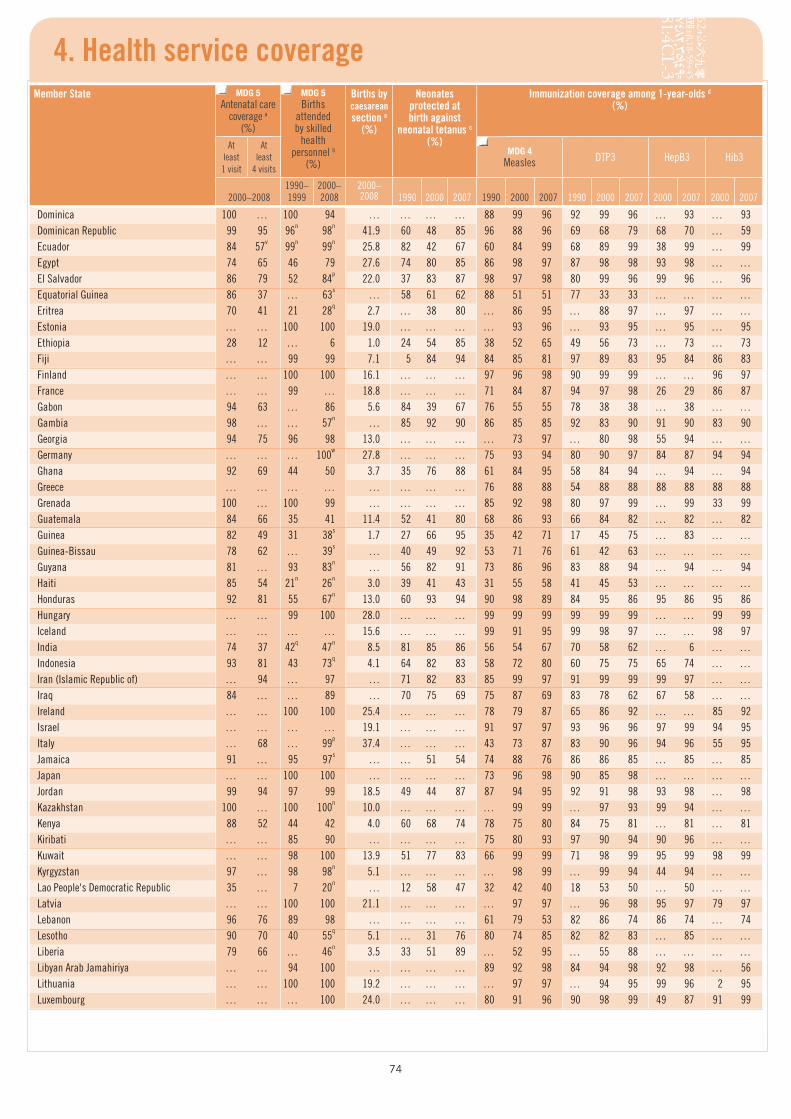
74
4. Health service coverageMember State MDG 5
A ntenatal care c overage a
(%)
MDG 5 Births
a ttended by skilled
health p ersonnel b
(%)
Births by caesarean section a
(%)
Neonates protected at birth against
neonatal tetanus c
(%)
Immunization coverage among 1-year-olds d
(%)
Atleast1 visit
Atleast
4 visits
MDG 4 Measles DTP3 HepB3 Hib3
2000–20081990– 1999
2000– 2008
2000– 2008 1990 2000 2007 1990 2000 2007 1990 2000 2007 2000 2007 2000 2007
Dominica 100 … 100 94 … … … … 88 99 96 92 99 96 … 93 … 93Dominican Republic 99 95 96n 98n 41.9 60 48 85 96 88 96 69 68 79 68 70 … 59Ecuador 84 57v 99n 99n 25.8 82 42 67 60 84 99 68 89 99 38 99 … 99Egypt 74 65 46 79 27.6 74 80 85 86 98 97 87 98 98 93 98 … …El Salvador 86 79 52 84p 22.0 37 83 87 98 97 98 80 99 96 99 96 … 96Equatorial Guinea 86 37 … 63s … 58 61 62 88 51 51 77 33 33 … … … …Eritrea 70 41 21 28q 2.7 … 38 80 … 86 95 … 88 97 … 97 … …Estonia … … 100 100 19.0 … … … … 93 96 … 93 95 … 95 … 95Ethiopia 28 12 … 6 1.0 24 54 85 38 52 65 49 56 73 … 73 … 73Fiji … … 99 99 7.1 5 84 94 84 85 81 97 89 83 95 84 86 83Finland … … 100 100 16.1 … … … 97 96 98 90 99 99 … … 96 97France … … 99 … 18.8 … … … 71 84 87 94 97 98 26 29 86 87Gabon 94 63 … 86 5.6 84 39 67 76 55 55 78 38 38 … 38 … …Gambia 98 … … 57n … 85 92 90 86 85 85 92 83 90 91 90 83 90Georgia 94 75 96 98 13.0 … … … … 73 97 … 80 98 55 94 … …Germany … … … 100w 27.8 … … … 75 93 94 80 90 97 84 87 94 94Ghana 92 69 44 50 3.7 35 76 88 61 84 95 58 84 94 … 94 … 94Greece … … … … … … … … 76 88 88 54 88 88 88 88 88 88Grenada 100 … 100 99 … … … … 85 92 98 80 97 99 … 99 33 99Guatemala 84 66 35 41 11.4 52 41 80 68 86 93 66 84 82 … 82 … 82Guinea 82 49 31 38s 1.7 27 66 95 35 42 71 17 45 75 … 83 … …Guinea-Bissau 78 62 … 39s … 40 49 92 53 71 76 61 42 63 … … … …Guyana 81 … 93 83n … 56 82 91 73 86 96 83 88 94 … 94 … 94Haiti 85 54 21n 26n 3.0 39 41 43 31 55 58 41 45 53 … … … …Honduras 92 81 55 67n 13.0 60 93 94 90 98 89 84 95 86 95 86 95 86Hungary … … 99 100 28.0 … … … 99 99 99 99 99 99 … … 99 99Iceland … … … … 15.6 … … … 99 91 95 99 98 97 … … 98 97India 74 37 42q 47n 8.5 81 85 86 56 54 67 70 58 62 … 6 … …Indonesia 93 81 43 73q 4.1 64 82 83 58 72 80 60 75 75 65 74 … …Iran (Islamic Republic of) … 94 … 97 … 71 82 83 85 99 97 91 99 99 99 97 … …Iraq 84 … … 89 … 70 75 69 75 87 69 83 78 62 67 58 … …Ireland … … 100 100 25.4 … … … 78 79 87 65 86 92 … … 85 92Israel … … … … 19.1 … … … 91 97 97 93 96 96 97 99 94 95Italy … 68 … 99p 37.4 … … … 43 73 87 83 90 96 94 96 55 95Jamaica 91 … 95 97s … … 51 54 74 88 76 86 86 85 … 85 … 85Japan … … 100 100 … … … … 73 96 98 90 85 98 … … … …Jordan 99 94 97 99 18.5 49 44 87 87 94 95 92 91 98 93 98 … 98Kazakhstan 100 … 100 100n 10.0 … … … … 99 99 … 97 93 99 94 … …Kenya 88 52 44 42 4.0 60 68 74 78 75 80 84 75 81 … 81 … 81Kiribati … … 85 90 … … … … 75 80 93 97 90 94 90 96 … …Kuwait … … 98 100 13.9 51 77 83 66 99 99 71 98 99 95 99 98 99Kyrgyzstan 97 … 98 98n 5.1 … … … … 98 99 … 99 94 44 94 … …Lao People's Democratic Republic 35 … 7 20n … 12 58 47 32 42 40 18 53 50 … 50 … …Latvia … … 100 100 21.1 … … … … 97 97 … 96 98 95 97 79 97Lebanon 96 76 89 98 … … … … 61 79 53 82 86 74 86 74 … 74Lesotho 90 70 40 55q 5.1 … 31 76 80 74 85 82 82 83 … 85 … …Liberia 79 66 … 46n 3.5 33 51 89 … 52 95 … 55 88 … … … …Libyan Arab Jamahiriya … … 94 100 … … … … 89 92 98 84 94 98 92 98 … 56Lithuania … … 100 100 19.2 … … … … 97 97 … 94 95 99 96 2 95Luxembourg … … … 100 24.0 … … … 80 91 96 90 98 99 49 87 91 99
75
World HealtH StatiSticS
2009
Tabl
e 4
Children aged 6–59 months who received
vitamin A supplemen-
tation e(%)
Children aged <5 years (%)
MDG 5Unmet need for family planning g
(%)
MDG 5 Contraceptive prevalence h
(%)
Antiretroviral therapy coverage (%)
MDG 6 Tuberculosis
detection rate under DOTS k
(%)
MDG 6 Tuberculosis
treatment success under DOTS l
(%)MDG 6Sleeping
under insecticide-
treated nets f
MDG 6With fever who received treat-ment with any antimalarial f
With ARI symptoms taken to facility e
With diarrhoea receiving
ORT e
Pregnant women
(PMTCT) i,j
MDG 6People with advanced
HIV infection j
2000–2007 2000–2007 2000–2007 2000–2006 2007 2007 1995 2000 2007 1995 2000 2006
… … … … … … … … … … … 61 … … 50… … … 67.3 46.3 10.9 69.8 … 38 … 6 66 … 79 78… … … … … 5.0 72.7 … 42 … … 46 … … 74
11.1 … … 63.4 35.7 10.3 59.2 … 9 50 54 72 … 87 87… … … … … 8.9 67.3 … 51 … 56 65 … 79 91… 1 49 … … … … 14 31 86 … … 89 … …
38.0 4 4 43.6 55.7 27.0 8.0 7 13 … 43 35 … 76 90… … … … … … … … … … 64 76 … 70 68
45.8 42 10 18.7 27.5 33.8 14.7 7 29 15 31 28 61 80 84… … … … … … … … … 51 58 67 86 85 66… … … … … … … … … … … 0 … … …… … … … … 3.2t 81.8 … … … … 0 … … …… … … 47.7 35.4 28.0 32.7 21 42 … … 66 … … 46
80.1 49 63 68.9 48.2 … 9.6 … 18 74 … 64 76 … 58… … … 73.6 50.1 16.4 47.3 … … 18 34 113 58 63 75… … … … … … … … … … … 54 … 77 …
60.2 22 61 33.6 37.0 34.0 25.2 21 15 16 38 36 54 50 76… … … … … … … … … … … 0 … … …… … … … … … … … … … … … … … …… … … … … … 43.3 … 37 43 50 40 61 86 47
68.2 1 44 42.0 36.6 21.2 9.1 11 27 45 55 53 78 68 7558.6 39 46 4.3 46.3 … 7.6 24 20 … 46 … … … …
… … … 64.1 51.7 … 34.6 … 45 … 11 39 … 91 6828.7 … 5 31.5 43.8 37.5 32.0 22 41 … 19 49 … 73 8248.7 … 1 53.9 55.7 16.9 65.2 … 47 … 106 87 … 89 86
… … … … … … … … 22 … 25 51 … 64 46… … … … … … … … … … … 0 … … …
18.2 … 12 67.3 26.0 12.8 56.3 … … 0 12 68 79 84 8675.1 0 1 61.3 48.4 8.6 60.3 … 15 1 20 68 91 87 91
… … … … … … 73.8 … 5 42 58 68 … 85 83… 0 1 … … … 49.8m … … … 51 37 … 92 84… … … … … … … … … … … 0 … … …… … … … … … … … … … 7 61 … 78 74… … … … … … … … … … 31 0 80 74 …… … … 75.0 39.0 … 69.0 … 43 … 100 83 67 45 41… … … … … … 52.0 … … … 23 77 … 70 538.5 … … 75.0 24.9 11.0 55.8 … … 106 70 81 … 90 71… … … 70.5 74.0 … … … 23 … 94 69 … 79 72
33.3 6 27 49.1 29.2 24.5 39.3 69 38 58 53 72 75 80 85… … … … … … … … … … 34 66 … 91 90… … … … … … … … … … 65 90 … 69 78
47.0 … … 62.1 20.4 … … … 14 … 42 60 … 82 8218.1 18 9 32.3 50.5 39.5 32.2 … >95 … 40 78 70 77 92
… … … … … … … … 15 … 72 89 61 72 73… … … … … … … … 26 41 65 62 … 92 90
54.6 … … 58.8 75.2 30.9 37.3 32 26 63 78 16 47 … 6643.0 3 … 62.2 58.1 … … 7 17 … 32 … 79 80 …
… … … … … … … … … … 113 162 … … 77… … … … … … … … 18 … 2 90 … 92 74… … … … … … … … … … … 0 … … …
76
4. Health service coverageMember State MDG 5
A ntenatal care c overage a
(%)
MDG 5 Births
a ttended by skilled
health p ersonnel b
(%)
Births by caesarean section a
(%)
Neonates protected at birth against
neonatal tetanus c
(%)
Immunization coverage among 1-year-olds d
(%)
Atleast1 visit
Atleast
4 visits
MDG 4 Measles DTP3 HepB3 Hib3
2000–20081990– 1999
2000– 2008
2000– 2008 1990 2000 2007 1990 2000 2007 1990 2000 2007 2000 2007 2000 2007
Madagascar 80 40 47 51s 1.0 45 58 72 47 56 81 46 57 82 … 82 … …Malawi 92 57 50 54 3.1 81 84 86 81 73 83 87 75 87 … 87 … 87Malaysia 79 … 81 100 … 82 88 89 70 88 90 90 95 96 94 87 … 89Maldives 100 91 … 84 … 86 95 94 96 99 97 94 97 98 90 98 … …Mali 70 35 40r 49r 1.6 45 50 89 43 49 68 42 40 68 … 68 … 44Malta … … … 100w 34.3 … … … 80 74 79 63 94 74 … 82 93 72Marshall Islands … … 95 95 … … … … 52 94 94 92 39 93 36 93 45 83Mauritania 75 16 40 61n 3.2 24 44 60 38 62 67 33 40 75 … 74 … …Mauritius … … 99 99p 37.0 61 79 86 76 84 98 85 88 97 88 97 … 96Mexico … … 74 94 36.1 59 81 87 75 96 96 53 97 98 97 98 97 98Micronesia (Federated States of) … … 93 88 … … … … 81 85 92 85 85 79 87 90 75 79Monaco … … … … … … … … 99 99 99 99 99 99 99 99 99 99Mongolia 99 … 99 99 … … … … 92 92 98 84 95 95 93 98 … 78Montenegro 97 … … 99s 11.4 … … … … … 90 … … 92 … 90 … 89Morocco 68 31 40 63 5.4 66 86 85 79 93 95 81 95 95 43 95 … 90Mozambique 85 53 44q 48q 1.9 37 75 82 59 71 77 46 68 72 … 72 … …Myanmar 76 66y 46 57 … 62 86 91 68 84 81 88 82 86 … 85 … …Namibia 95 70 68 81 12.7 23 74 82 … 69 69 … 79 86 … … … …Nauru … … … 97 … … … … … 8 99 74 44 99 58 99 … …Nepal 44 29 9q 19 2.7 35 64 83 57 71 81 43 72 82 … 82 … …Netherlands … … 100 100 13.7 … … … 94 96 96 97 97 96 … … 96 96New Zealand … … 93p 94p 23.5 … … … 90 85 79 90 90 88 90 88 90 78Nicaragua 90 78 61 74 19.6 39 91 94 82 86 99 66 83 87 83 87 83 87Niger 46 15 18 18 1.0 17 57 72 25 34 47 22 31 39 … … … …Nigeria 58 47 42n 35n 1.7 61 51 53 54 35 62 56 24 54 … 41 … …Niue … … 100 100 … … … … 99 99 99 99 99 99 99 99 99 99Norway … … … … 16.6 … … … 87 88 92 86 90 93 … … 93 95Oman 100 83 91 98 … 93 94 95 98 99 97 98 99 99 99 99 … 99Pakistan 61 28 19q 39n 7.3 50 71 81 50 56 80 54 61 83 … 83 … …Palau … … 100 100 … … … … 98 83 91 99 96 94 96 91 96 95Panama … … 86 91 … … … … 73 97 89 86 98 88 … 88 … 88Papua New Guinea … … 47 39p 4.7 78 24 60 67 62 58 68 59 60 57 59 … …Paraguay 94 79 61 77 26.9 66 47 81 69 92 80 67 68 66 … 66 … 66Peru 91 87 56 73n 15.8 19 65 82 64 97 99 72 91 80 … 80 38 80Philippines 88 70 56 60 7.3 57 72 65 85 80 92 88 79 87 19 88 … …Poland … … 100 100 … … … … 95 97 98 96 98 99 99 98 … 88Portugal … … 100 100 34.0 … … … 85 87 95 89 96 97 58 97 86 97Qatar … … 99 100 … … … … 79 91 92 82 80 94 89 94 80 94Republic of Korea … … 100 100 37.7 … … … 93 95 92 74 97 91 93 91 … …Republic of Moldova 98 89 99p 100n 8.5 … … … … 87 96 … 91 92 88 95 … …Romania 94 76 99p 99 21.4 … … … 92 98 97 96 99 97 98 99 … …Russian Federation … … 99 100 17.2 … … … … 97 99 … 97 98 … 98 … …Rwanda 96 13 26 52q 2.9 85 81 82 83 74 99 84 90 97 … 97 … 96Saint Kitts and Nevis 100 … 100 100 … … … … 99 99 99 99 99 99 99 99 12 99Saint Lucia 99 … 100 98 … … … … 82 88 94 89 70 99 … 99 … 99Saint Vincent and the Grenadines 95 … 100 100 … … … … 96 96 99 98 99 99 … 99 … 99Samoa … … 100 100 … 38 … 5 89 93 63 90 99 71 96 69 … …San Marino … … … … … … … … … 74 92 99 96 92 94 92 92 92Sao Tome and Principe 97 … … 81 … … … … 71 69 86 92 82 97 … 99 … …Saudi Arabia … … 91 96 11.6 … … … 88 94 96 92 95 96 93 96 96 96
77
World HealtH StatiSticS
2009
Tabl
e 4
Children aged 6–59 months who received
vitamin A supplemen-
tation e(%)
Children aged <5 years (%)
MDG 5Unmet need for family planning g
(%)
MDG 5 Contraceptive prevalence h
(%)
Antiretroviral therapy coverage (%)
MDG 6 Tuberculosis
detection rate under DOTS k
(%)
MDG 6 Tuberculosis
treatment success under DOTS l
(%)MDG 6Sleeping
under insecticide-
treated nets f
MDG 6With fever who received treat-ment with any antimalarial f
With ARI symptoms taken to facility e
With diarrhoea receiving
ORT e
Pregnant women
(PMTCT) i,j
MDG 6People with advanced
HIV infection j
2000–2007 2000–2007 2000–2007 2000–2006 2007 2007 1995 2000 2007 1995 2000 2006
76.2 … 34 47.9 42.7 23.6 27.1 … 4 52 … 69 55 70 7865.4 23 24 36.5 61.1 27.6 41.7m 32 35 42 44 41 71 73 78
… … … … … … … … 35 64 73 80 69 78 48… … … … … 37.0x 39.0 … … 107 75 92 97 97 91
72.0 27 32 38.1 24.3 28.5 8.1 … 41 17 17 23 59 … 76… … … … … … … … … … 41 74 100 100 100… … … … … … … … … … 19 33 … 91 75… 2 33 … … 31.6 8.0 … 23 … … 39 … … 41… … … … … 3.3 75.9 … 22 86 88 69 … 93 92… … … … … … 70.9 … 57 … 64 99 … 76 80… … … … … … … … … 12 24 97 80 93 90… … … … … … … … … … … … … … …
64.7 … … 62.6 62.8 4.6 69.0 … … 8 61 76 … 87 88… … … 89.4 98.1 … … … … … … 0 … … …
25.5 … … 37.8 28.0 10.0 63.0 … 31 91 89 93 90 89 8749.8 … 15 55.4 54.1 18.4 16.5 46 24 59 47 49 39 75 83
… … … … … 19.1 37.0 … 15 … 50 116 66 82 8451.5 … 14 71.5 69.3 25.1 43.7 64 88 22 82 84 … 56 76
… … … … … … … … … … 90 90 … 25 10087.5 … … 34.3 29.3 24.6 48.0 … 7 … 57 66 … 86 88
… … … … … … … … … 77 46 11 72 76 …… … … … … … … … … … 40 60 … 30 70
65.3 … 2 57.7 54.1 14.6 68.6 … 30 72 78 97 80 82 8969.6 56 33 47.2 26.2 15.8 11.2 … 10 … 41 53 … 65 7733.7 1 34 32.8 29.4 16.9 12.6 7 26 11 12 23 49 79 76
… … … … … … … … … … … … … … …… … … … … … … … … … 28 33 77 70 93… … … … … … … … … … 123 125 84 93 86
60.2 … … 80.5 47.2 … 27.6 … 3 1 3 67 70 74 88… … … … … … … … … 90 … 90 67 … 60… … … … … … … … 56 … 32 98 … 67 79… … … … … … … 4 38 … 7 15 … 63 73… … … … … 6.6 72.8 … 22 14 4 58 51 77 83… … … 66.8 36.6 8.1 71.3 … 48 102 88 93 83 90 78
76.0 … … 54.8 57.6 17.3 48.9 … 31 0 44 75 … 88 88… … … … … … … … 36 … 4 66 … 72 75… … … … … … 67.1z … … 79 92 87 69 79 87… … … … … … … … … 33 29 44 81 66 69… … … … … … … … … 30 … 14 76 … 81… … … 59.7 34.9 6.7 67.8 … 58 … … 67 … 83 62… … … … … 11.9 70.0 … 73 … 10 85 … 80 83… … … … … … … … 16 … 5 49 65 68 58
84.1 13 12 27.9 18.6 37.9 17.4 60 71 34 32 25 … 61 86… … … … … … … … … … 0 155 … … 100… … … … … … … … … … 56 139 … 100 80… … … … … … … … … … 55 … … 100 …… … … … … … … … … 73 70 … 80 92 …… … … … … … … … … … 113 … … 0 …… 42 25 … … … 29.3 … … … … … … … …… … … … … … … … … … 36 39 … 73 69
78
4. Health service coverageMember State MDG 5
A ntenatal care c overage a
(%)
MDG 5 Births
a ttended by skilled
health p ersonnel b
(%)
Births by caesarean section a
(%)
Neonates protected at birth against
neonatal tetanus c
(%)
Immunization coverage among 1-year-olds d
(%)
Atleast1 visit
Atleast
4 visits
MDG 4 Measles DTP3 HepB3 Hib3
2000–20081990– 1999
2000– 2008
2000– 2008 1990 2000 2007 1990 2000 2007 1990 2000 2007 2000 2007 2000 2007
Senegal 87 40 47 52s 3.3 45 65 86 51 48 84 51 52 94 … 94 … 94Serbia 98 … … 99s 14.7 … … … 83 89 95 84 95 94 … 99 … 89Seychelles … … … … … … … … 86 97 99 99 98 99 97 99 … …Sierra Leone 87 68 … 42q … 85 57 94 … 37 67 … 44 64 … 64 … 64Singapore … … 100 100p … … … … 84 96 95 85 98 96 97 95 … …Slovakia … … 100 100 20.0 … … … … 98 99 … 99 99 99 99 59 99Slovenia … … 100 100 16.3 … … … … 95 96 … 91 97 … … … 98Solomon Islands … … 85 43p … 71 75 84 70 87 78 77 82 79 77 79 … …Somalia 26 6 34s 33r … 23 48 68 30 38 34 19 33 39 … … … …South Africa 92 56 84 91 20.6 … 68 72 79 77 83 72 79 97 88 97 88 97Spain … … … … 25.0 … … … 99 94 97 86 95 96 77 96 92 96Sri Lanka 99 … … 99 … 72 92 91 80 99 98 86 99 98 … 98 … …Sudan 64 … 85 49r 4.5 72 61 72 57 58 79 62 62 84 … 78 … …Suriname 90 … 80 90n … 92 92 93 65 70 85 83 71 84 … 84 … 84Swaziland 85 79 … 74s 7.9 63 91 86 85 72 91 89 77 95 76 95 … …Sweden … … … … 16.5 … … … 96 91 96 99 99 99 … 4 98 99Switzerland … … … 100w 28.9 … … … 90 81 86 90 88 93 … … 86 92Syrian Arab Republic 84 42 76 93n 14.8 63 90 92 87 96 98 91 97 99 90 98 … 99Tajikistan 77 … 81 83n 2.1 … … … … 87 85 … 83 86 … 84 … …Thailand 98 74 85 97n 17.4aa 75 85 89 80 94 96 92 97 98 95 96 … …The former Yugoslav Republic of Macedonia
94 … 94 98n 11.4 … … … … 97 96 … 95 95 … 96 … …
Timor-Leste 61 30 … 19 … 39 55 59 … … 63 … … 70 … … … …Togo 84 … 51 62s … 47 63 82 73 58 80 77 64 88 … … … …Tonga … … … 99 … … … … 86 95 99 94 95 99 97 99 … 99Trinidad and Tobago 96 … 99 98 … … … … 70 90 91 82 90 88 … 89 74 88Tunisia 92 68 81 90 20.5 40 86 86 93 95 98 93 97 98 94 98 … …Turkey 81 54 81 83 21.2 20 50 69 78 86 96 84 85 96 71 96 … 76Turkmenistan 99 83 … 100 3.4 … … … … 97 99 … 97 98 … 98 … …Tuvalu … … 99 100 … … … … 95 81 95 99 82 97 81 97 … …Uganda 94 47 38 42 3.1 41 70 85 52 59 68 45 56 64 … 68 … 68Ukraine 99 75ac 100 99 10.4 … … … … 99 98 … 99 98 4 96 … 11United Arab Emirates … … 99 100 15.2 … … … 80 94 92 85 94 92 92 92 92 92United Kingdom … … 99 … 22.0 … … … 87 88 86 84 92 92 … … 92 92United Republic of Tanzania 78 62 39n 46n 3.2 77 84 88 80 78 90 78 79 83 … 83 … …United States of America … … 98 99 30.2 … … … 90 91 93 90 94 96 90 92 93 94Uruguay 97 … 99 99 23.8 … … … 97 89 96 97 90 94 92 94 88 94Uzbekistan 99 … 98 100n 4.9 … … … … 99 99 … 96 96 5 98 … …Vanuatu … … 89 93 … 47 86 88 66 94 65 76 90 76 75 76 … …Venezuela (Bolivarian Republic of) 94 … 95 95 25.1 … … 51 61 84 55 63 77 71 5 71 2 71Viet Nam 91 29 77 88n 9.9 24 86 86 88 97 83 88 96 92 … 67 … …Yemen 47 14 22 36 … 17 54 52 69 71 74 84 76 87 15 87 … 87Zambia 94 72 47 47q 2.1 62 78 89 90 85 85 91 78 80 … 80 … 80Zimbabwe 94 71 69 69 4.8 57 76 78 87 75 66 88 76 62 76 62 … …
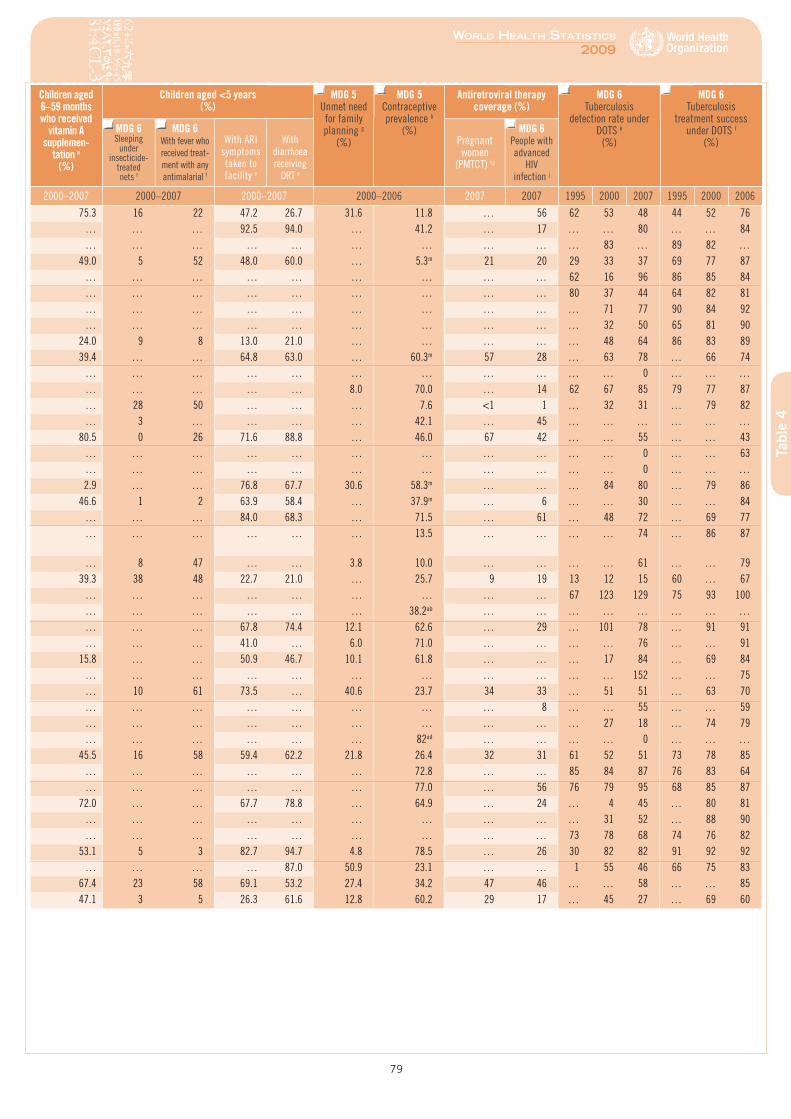
79
World HealtH StatiSticS
2009
Tabl
e 4
Children aged 6–59 months who received
vitamin A supplemen-
tation e(%)
Children aged <5 years (%)
MDG 5Unmet need for family planning g
(%)
MDG 5 Contraceptive prevalence h
(%)
Antiretroviral therapy coverage (%)
MDG 6 Tuberculosis
detection rate under DOTS k
(%)
MDG 6 Tuberculosis
treatment success under DOTS l
(%)MDG 6Sleeping
under insecticide-
treated nets f
MDG 6With fever who received treat-ment with any antimalarial f
With ARI symptoms taken to facility e
With diarrhoea receiving
ORT e
Pregnant women
(PMTCT) i,j
MDG 6People with advanced
HIV infection j
2000–2007 2000–2007 2000–2007 2000–2006 2007 2007 1995 2000 2007 1995 2000 2006
75.3 16 22 47.2 26.7 31.6 11.8 … 56 62 53 48 44 52 76… … … 92.5 94.0 … 41.2 … 17 … … 80 … … 84… … … … … … … … … … 83 … 89 82 …
49.0 5 52 48.0 60.0 … 5.3m 21 20 29 33 37 69 77 87… … … … … … … … … 62 16 96 86 85 84… … … … … … … … … 80 37 44 64 82 81… … … … … … … … … … 71 77 90 84 92… … … … … … … … … … 32 50 65 81 90
24.0 9 8 13.0 21.0 … … … … … 48 64 86 83 8939.4 … … 64.8 63.0 … 60.3m 57 28 … 63 78 … 66 74
… … … … … … … … … … … 0 … … …… … … … … 8.0 70.0 … 14 62 67 85 79 77 87… 28 50 … … … 7.6 <1 1 … 32 31 … 79 82… 3 … … … … 42.1 … 45 … … … … … …
80.5 0 26 71.6 88.8 … 46.0 67 42 … … 55 … … 43… … … … … … … … … … … 0 … … 63… … … … … … … … … … … 0 … … …2.9 … … 76.8 67.7 30.6 58.3m … … … 84 80 … 79 86
46.6 1 2 63.9 58.4 … 37.9m … 6 … … 30 … … 84… … … 84.0 68.3 … 71.5 … 61 … 48 72 … 69 77… … … … … … 13.5 … … … … 74 … 86 87
… 8 47 … … 3.8 10.0 … … … … 61 … … 7939.3 38 48 22.7 21.0 … 25.7 9 19 13 12 15 60 … 67
… … … … … … … … … 67 123 129 75 93 100… … … … … … 38.2ab … … … … … … … …… … … 67.8 74.4 12.1 62.6 … 29 … 101 78 … 91 91… … … 41.0 … 6.0 71.0 … … … … 76 … … 91
15.8 … … 50.9 46.7 10.1 61.8 … … … 17 84 … 69 84… … … … … … … … … … … 152 … … 75… 10 61 73.5 … 40.6 23.7 34 33 … 51 51 … 63 70… … … … … … … … 8 … … 55 … … 59… … … … … … … … … … 27 18 … 74 79… … … … … … 82ad … … … … 0 … … …
45.5 16 58 59.4 62.2 21.8 26.4 32 31 61 52 51 73 78 85… … … … … … 72.8 … … 85 84 87 76 83 64… … … … … … 77.0 … 56 76 79 95 68 85 87
72.0 … … 67.7 78.8 … 64.9 … 24 … 4 45 … 80 81… … … … … … … … … … 31 52 … 88 90… … … … … … … … … 73 78 68 74 76 82
53.1 5 3 82.7 94.7 4.8 78.5 … 26 30 82 82 91 92 92… … … … 87.0 50.9 23.1 … … 1 55 46 66 75 83
67.4 23 58 69.1 53.2 27.4 34.2 47 46 … … 58 … … 8547.1 3 5 26.3 61.6 12.8 60.2 29 17 … 45 27 … 69 60
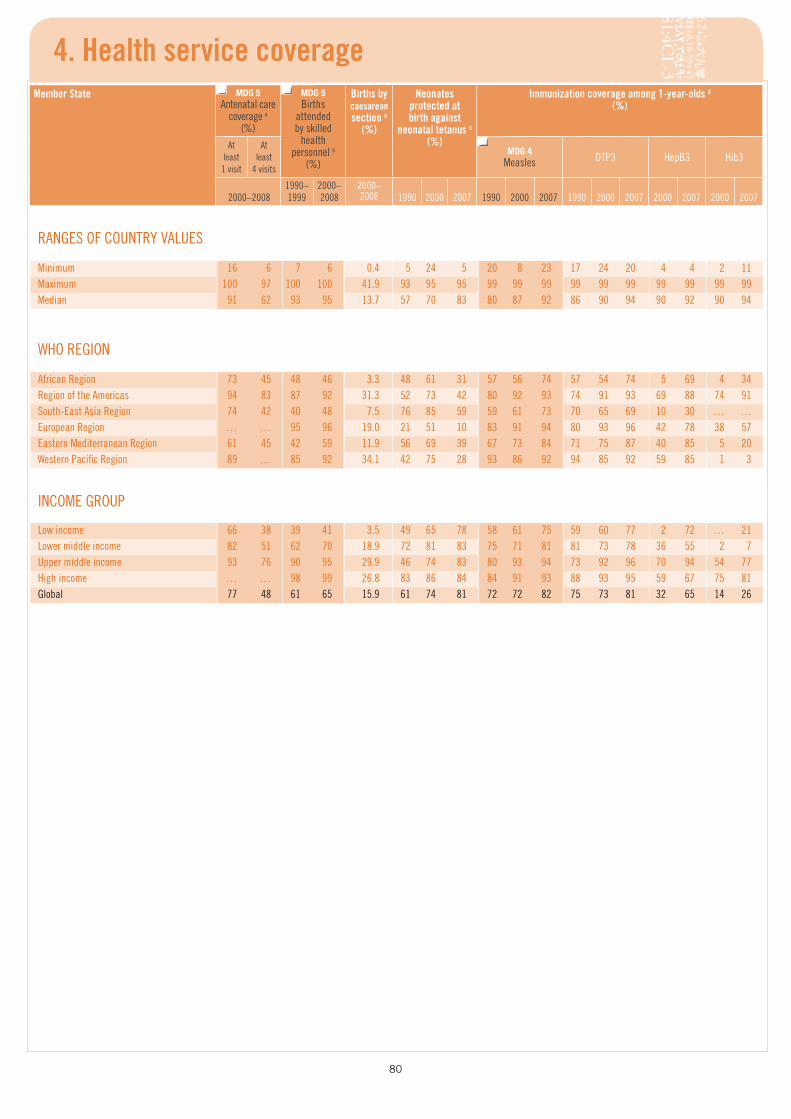
80
4. Health service coverageMember State MDG 5
A ntenatal care c overage a
(%)
MDG 5 Births
a ttended by skilled
health p ersonnel b
(%)
Births by caesarean section a
(%)
Neonates protected at birth against
neonatal tetanus c
(%)
Immunization coverage among 1-year-olds d
(%)
Atleast1 visit
Atleast
4 visits
MDG 4 Measles DTP3 HepB3 Hib3
2000–20081990– 1999
2000– 2008
2000– 2008 1990 2000 2007 1990 2000 2007 1990 2000 2007 2000 2007 2000 2007
RANGES OF COUNTRY VALUES
Minimum 16 6 7 6 0.4 5 24 5 20 8 23 17 24 20 4 4 2 11Maximum 100 97 100 100 41.9 93 95 95 99 99 99 99 99 99 99 99 99 99Median 91 62 93 95 13.7 57 70 83 80 87 92 86 90 94 90 92 90 94
WHO REGION
African Region 73 45 48 46 3.3 48 61 31 57 56 74 57 54 74 5 69 4 34Region of the Americas 94 83 87 92 31.3 52 73 42 80 92 93 74 91 93 69 88 74 91South-East Asia Region 74 42 40 48 7.5 76 85 59 59 61 73 70 65 69 10 30 … …European Region … … 95 96 19.0 21 51 10 83 91 94 80 93 96 42 78 38 57Eastern Mediterranean Region 61 45 42 59 11.9 56 69 39 67 73 84 71 75 87 40 85 5 20Western Pacific Region 89 … 85 92 34.1 42 75 28 93 86 92 94 85 92 59 85 1 3
INCOME GROUP
Low income 66 38 39 41 3.5 49 65 78 58 61 75 59 60 77 2 72 … 21Lower middle income 82 51 62 70 18.9 72 81 83 75 71 81 81 73 78 36 55 2 7Upper middle income 93 76 90 95 29.9 46 74 83 80 93 94 73 92 96 70 94 54 77High income … … 98 99 26.8 83 86 84 84 91 93 88 93 95 59 67 75 81Global 77 48 61 65 15.9 61 74 81 72 72 82 75 73 81 32 65 14 26
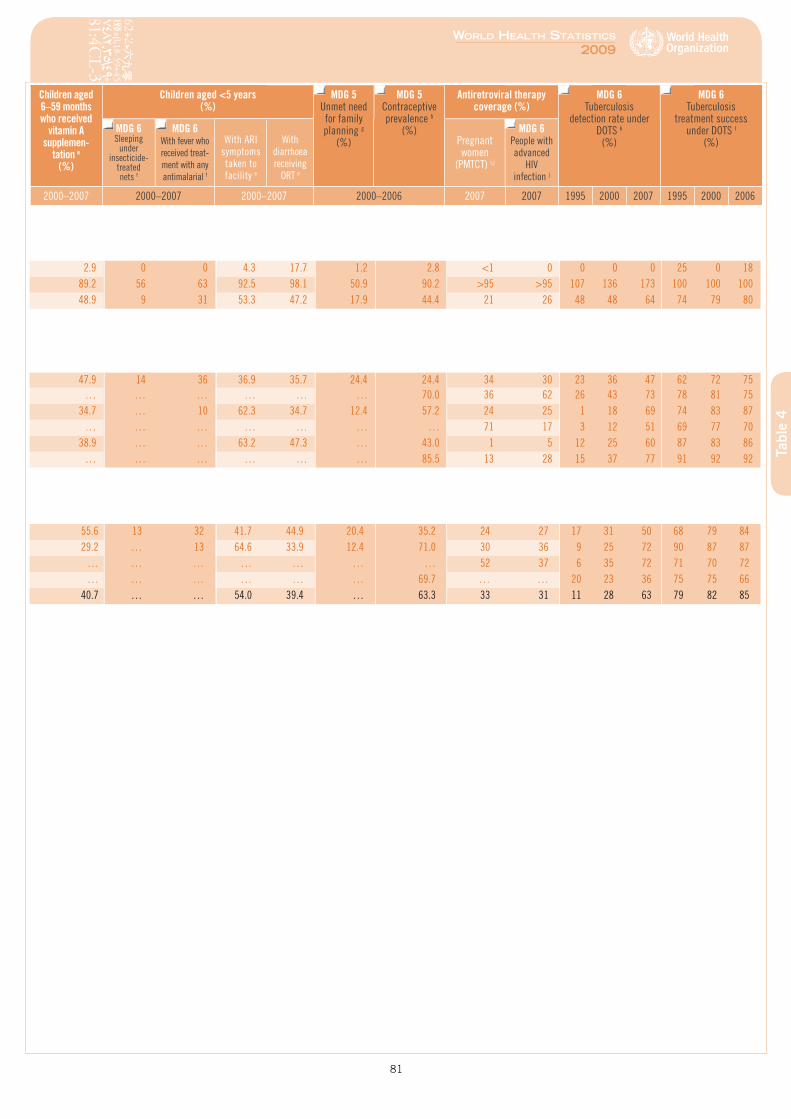
81
World HealtH StatiSticS
2009
Tabl
e 4
Children aged 6–59 months who received
vitamin A supplemen-
tation e(%)
Children aged <5 years (%)
MDG 5Unmet need for family planning g
(%)
MDG 5 Contraceptive prevalence h
(%)
Antiretroviral therapy coverage (%)
MDG 6 Tuberculosis
detection rate under DOTS k
(%)
MDG 6 Tuberculosis
treatment success under DOTS l
(%)MDG 6Sleeping
under insecticide-
treated nets f
MDG 6With fever who received treat-ment with any antimalarial f
With ARI symptoms taken to facility e
With diarrhoea receiving
ORT e
Pregnant women
(PMTCT) i,j
MDG 6People with advanced
HIV infection j
2000–2007 2000–2007 2000–2007 2000–2006 2007 2007 1995 2000 2007 1995 2000 2006
2.9 0 0 4.3 17.7 1.2 2.8 <1 0 0 0 0 25 0 1889.2 56 63 92.5 98.1 50.9 90.2 >95 >95 107 136 173 100 100 10048.9 9 31 53.3 47.2 17.9 44.4 21 26 48 48 64 74 79 80
47.9 14 36 36.9 35.7 24.4 24.4 34 30 23 36 47 62 72 75… … … … … … 70.0 36 62 26 43 73 78 81 75
34.7 … 10 62.3 34.7 12.4 57.2 24 25 1 18 69 74 83 87… … … … … … … 71 17 3 12 51 69 77 70
38.9 … … 63.2 47.3 … 43.0 1 5 12 25 60 87 83 86… … … … … … 85.5 13 28 15 37 77 91 92 92
55.6 13 32 41.7 44.9 20.4 35.2 24 27 17 31 50 68 79 8429.2 … 13 64.6 33.9 12.4 71.0 30 36 9 25 72 90 87 87
… … … … … … … 52 37 6 35 72 71 70 72… … … … … … 69.7 … … 20 23 36 75 75 66
40.7 … … 54.0 39.4 … 63.3 33 31 11 28 63 79 82 85

World HealtH StatiSticS
2009
83
Risk factorsCertain risk factors are associated with increased mortality and morbidity. The most common preventable risks are: poor infant feeding practices, low birth weight, being overweight or obese, childhood and maternal under-nutrition, unsafe sex, use of tobacco, harmful use of alcohol, unsafe water and lack of sanitation. Collectively, these preventable risks contribute to over 40% of the 58 million deaths that occur worldwide annually and one third of global loss of healthy life years.
Exclusive breastfeeding among children under six months of age has increased in recent years and the rate in developing countries is almost 40%. Low birth weight is an important predictor of health and survival of the newborn and reflects maternal malnutrition, ill-health and overwork and inadequate health care in pregnancy. The countries with the highest incidence of low-birth-weight infants are located in Africa or South-East Asia, where at least 22% of infants are affected. A high proportion of infants are not weighed at birth, and estimates rely on mothers’ subjective assessments.
Child growth is the most widely used indicator of nutritional status. Fewer data are available on levels of obesity in children, but in some countries in the European Region as many as 20% of children are overweight.
The prevalence of current tobacco smoking is an important predictor of the future burden of tobacco-related diseases. In 36 countries, over 25% of youths smoke.
Harmful use of alcohol can cause chronic alcohol dependence, hepatic cirrhosis, cancer and acute injuries. Of the 20 countries with the highest alcohol consumption per capita, 18 are European. Factors that influence the reliability of this indicator include: unmeasured informal production, tourist consumption, stockpiling, waste and spillage, smuggling, duty-free sales and variations in beverage strength.
Unsafe water supplies and inadequate sanitation and hygiene increase the transmission of diarrhoeal diseases, schistosomiasis, trachoma, hepatitis and cholera. Although more people have access to safe water and improved sanitation globally compared with those in 2000, rapid population growth has hampered improvements in many countries. Close to a billion people are still without access to improved water supplies, half of whom live in the African and Western Pacific Regions. Over 2 billion people are without improved sanitation.
Data on risk factors and health-related behaviours are generally drawn from household surveys. Where data are not available, statistical techniques may be used to develop estimates.
Tabl
e 5
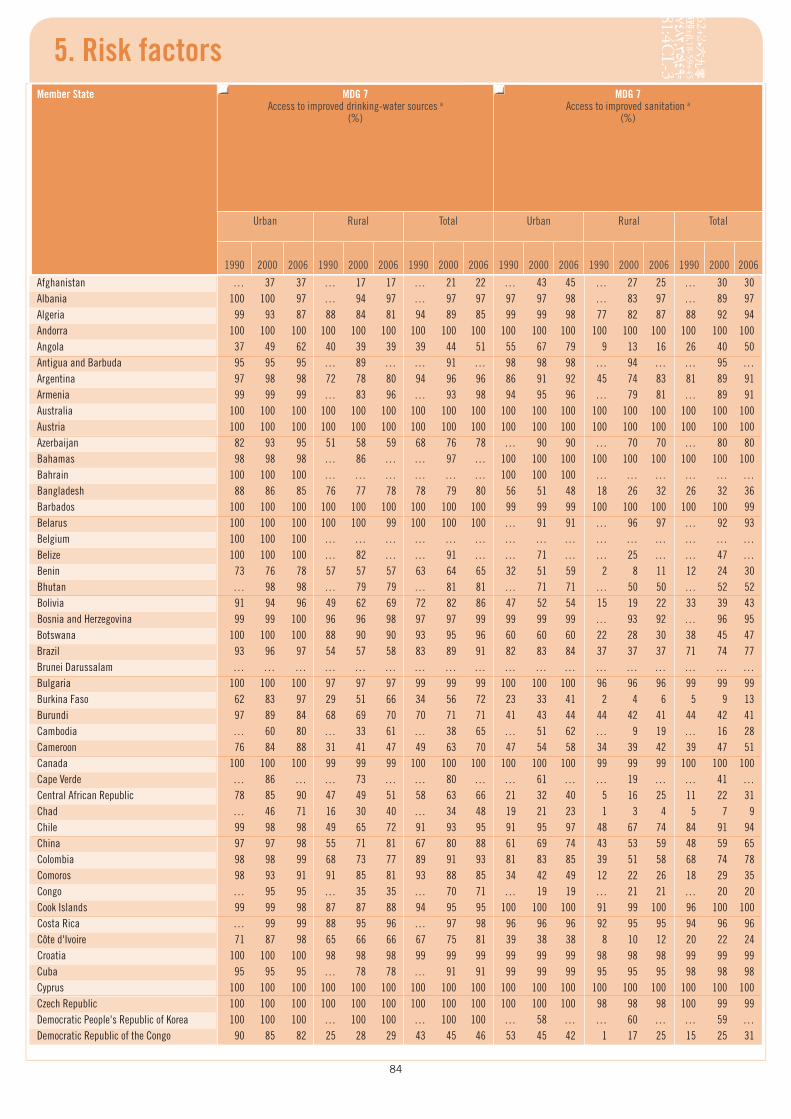
84
5. Risk factorsMember State MDG 7
Access to improved drinking-water sources a (%)
MDG 7 Access to improved sanitation a
(%)
Urban Rural Total Urban Rural Total
1990 2000 2006 1990 2000 2006 1990 2000 2006 1990 2000 2006 1990 2000 2006 1990 2000 2006
Afghanistan … 37 37 … 17 17 … 21 22 … 43 45 … 27 25 … 30 30Albania 100 100 97 … 94 97 … 97 97 97 97 98 … 83 97 … 89 97Algeria 99 93 87 88 84 81 94 89 85 99 99 98 77 82 87 88 92 94Andorra 100 100 100 100 100 100 100 100 100 100 100 100 100 100 100 100 100 100Angola 37 49 62 40 39 39 39 44 51 55 67 79 9 13 16 26 40 50Antigua and Barbuda 95 95 95 … 89 … … 91 … 98 98 98 … 94 … … 95 …Argentina 97 98 98 72 78 80 94 96 96 86 91 92 45 74 83 81 89 91Armenia 99 99 99 … 83 96 … 93 98 94 95 96 … 79 81 … 89 91Australia 100 100 100 100 100 100 100 100 100 100 100 100 100 100 100 100 100 100Austria 100 100 100 100 100 100 100 100 100 100 100 100 100 100 100 100 100 100Azerbaijan 82 93 95 51 58 59 68 76 78 … 90 90 … 70 70 … 80 80Bahamas 98 98 98 … 86 … … 97 … 100 100 100 100 100 100 100 100 100Bahrain 100 100 100 … … … … … … 100 100 100 … … … … … …Bangladesh 88 86 85 76 77 78 78 79 80 56 51 48 18 26 32 26 32 36Barbados 100 100 100 100 100 100 100 100 100 99 99 99 100 100 100 100 100 99Belarus 100 100 100 100 100 99 100 100 100 … 91 91 … 96 97 … 92 93Belgium 100 100 100 … … … … … … … … … … … … … … …Belize 100 100 100 … 82 … … 91 … … 71 … … 25 … … 47 …Benin 73 76 78 57 57 57 63 64 65 32 51 59 2 8 11 12 24 30Bhutan … 98 98 … 79 79 … 81 81 … 71 71 … 50 50 … 52 52Bolivia 91 94 96 49 62 69 72 82 86 47 52 54 15 19 22 33 39 43Bosnia and Herzegovina 99 99 100 96 96 98 97 97 99 99 99 99 … 93 92 … 96 95Botswana 100 100 100 88 90 90 93 95 96 60 60 60 22 28 30 38 45 47Brazil 93 96 97 54 57 58 83 89 91 82 83 84 37 37 37 71 74 77Brunei Darussalam … … … … … … … … … … … … … … … … … …Bulgaria 100 100 100 97 97 97 99 99 99 100 100 100 96 96 96 99 99 99Burkina Faso 62 83 97 29 51 66 34 56 72 23 33 41 2 4 6 5 9 13Burundi 97 89 84 68 69 70 70 71 71 41 43 44 44 42 41 44 42 41Cambodia … 60 80 … 33 61 … 38 65 … 51 62 … 9 19 … 16 28Cameroon 76 84 88 31 41 47 49 63 70 47 54 58 34 39 42 39 47 51Canada 100 100 100 99 99 99 100 100 100 100 100 100 99 99 99 100 100 100Cape Verde … 86 … … 73 … … 80 … … 61 … … 19 … … 41 …Central African Republic 78 85 90 47 49 51 58 63 66 21 32 40 5 16 25 11 22 31Chad … 46 71 16 30 40 … 34 48 19 21 23 1 3 4 5 7 9Chile 99 98 98 49 65 72 91 93 95 91 95 97 48 67 74 84 91 94China 97 97 98 55 71 81 67 80 88 61 69 74 43 53 59 48 59 65Colombia 98 98 99 68 73 77 89 91 93 81 83 85 39 51 58 68 74 78Comoros 98 93 91 91 85 81 93 88 85 34 42 49 12 22 26 18 29 35Congo … 95 95 … 35 35 … 70 71 … 19 19 … 21 21 … 20 20Cook Islands 99 99 98 87 87 88 94 95 95 100 100 100 91 99 100 96 100 100Costa Rica … 99 99 88 95 96 … 97 98 96 96 96 92 95 95 94 96 96Côte d'Ivoire 71 87 98 65 66 66 67 75 81 39 38 38 8 10 12 20 22 24Croatia 100 100 100 98 98 98 99 99 99 99 99 99 98 98 98 99 99 99Cuba 95 95 95 … 78 78 … 91 91 99 99 99 95 95 95 98 98 98Cyprus 100 100 100 100 100 100 100 100 100 100 100 100 100 100 100 100 100 100Czech Republic 100 100 100 100 100 100 100 100 100 100 100 100 98 98 98 100 99 99Democratic People's Republic of Korea 100 100 100 … 100 100 … 100 100 … 58 … … 60 … … 59 …Democratic Republic of the Congo 90 85 82 25 28 29 43 45 46 53 45 42 1 17 25 15 25 31
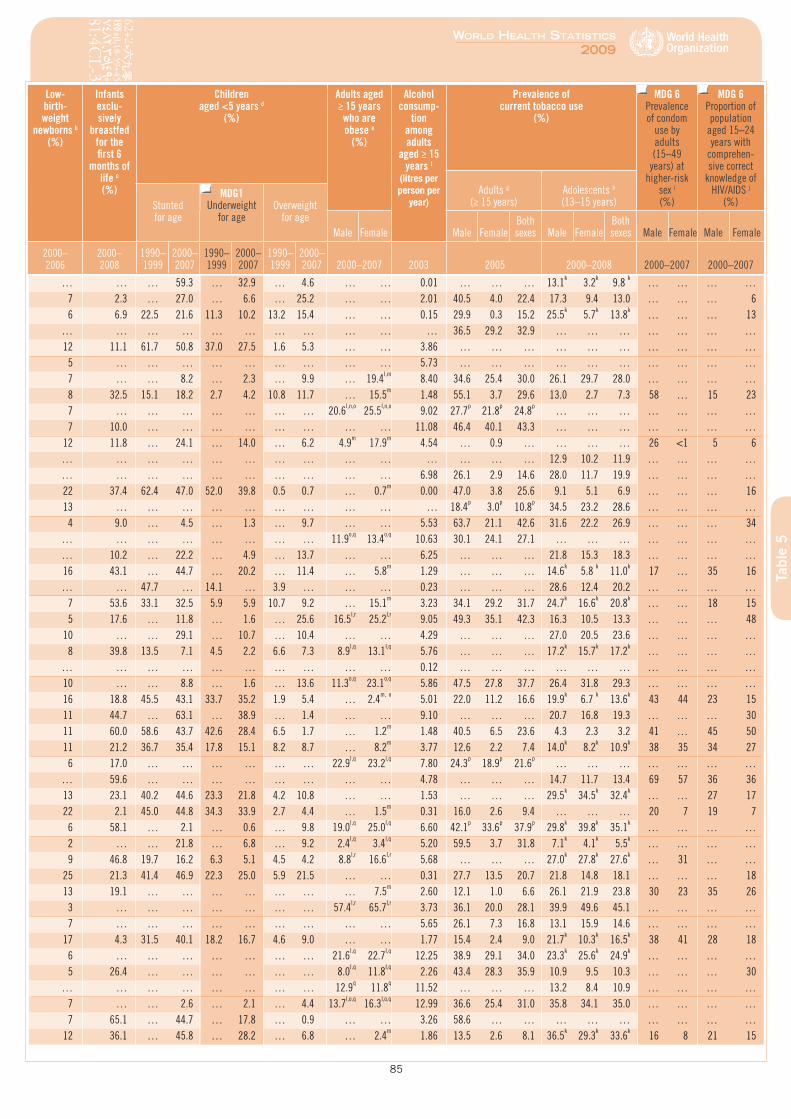
85
World HealtH StatiSticS
2009
Tabl
e 5
Low- birth-weight
newborns b (%)
Infants exclu-sively
breastfed for the first 6
months of life c (%)
Children aged <5 years d
(%)
Adults aged ≥ 15 years
who are obese e
(%)
Alcohol consump-
tion among adults
aged ≥ 15 years f
(litres per person per
year)
Prevalence of current tobacco use
(%)
MDG 6 Prevalence of condom
use by adults (15–49
years) at higher-risk
sex i (%)
MDG 6 Proportion of population
aged 15–24 years with
comprehen-sive correct
knowledge of HIV/AIDS j
(%)Adults g
(≥ 15 years)Adolescents h (13–15 years)Stunted
for age
MDG1Underweight
for ageOverweight
for ageMale Female Male Female
Both sexes Male Female
Both sexes Male Female Male Female
2000– 2006
2000– 2008
1990– 1999
2000– 2007
1990– 1999
2000– 2007
1990– 1999
2000– 2007 2000–2007 2003 2005 2000–2008 2000–2007 2000–2007
… … … 59.3 … 32.9 … 4.6 … … 0.01 … … … 13.1k 3.2k 9.8 k … … … … 7 2.3 … 27.0 … 6.6 … 25.2 … … 2.01 40.5 4.0 22.4 17.3 9.4 13.0 … … … 6 6 6.9 22.5 21.6 11.3 10.2 13.2 15.4 … … 0.15 29.9 0.3 15.2 25.5k 5.7k 13.8k … … … 13… … … … … … … … … … … 36.5 29.2 32.9 … … … … … … …
12 11.1 61.7 50.8 37.0 27.5 1.6 5.3 … … 3.86 … … … … … … … … … … 5 … … … … … … … … … 5.73 … … … … … … … … … … 7 … … 8.2 … 2.3 … 9.9 … 19.4l,m 8.40 34.6 25.4 30.0 26.1 29.7 28.0 … … … … 8 32.5 15.1 18.2 2.7 4.2 10.8 11.7 … 15.5m 1.48 55.1 3.7 29.6 13.0 2.7 7.3 58 … 15 23 7 … … … … … … … 20.6l,n,o 25.5l,n,o 9.02 27.7p 21.8p 24.8p … … … … … … … 7 10.0 … … … … … … … … 11.08 46.4 40.1 43.3 … … … … … … …
12 11.8 … 24.1 … 14.0 … 6.2 4.9m 17.9m 4.54 … 0.9 … … … … 26 <1 5 6… … … … … … … … … … … … … … 12.9 10.2 11.9 … … … …… … … … … … … … … … 6.98 26.1 2.9 14.6 28.0 11.7 19.9 … … … …
22 37.4 62.4 47.0 52.0 39.8 0.5 0.7 … 0.7m 0.00 47.0 3.8 25.6 9.1 5.1 6.9 … … … 16 13 … … … … … … … … … … 18.4p 3.0p 10.8p 34.5 23.2 28.6 … … … … 4 9.0 … 4.5 … 1.3 … 9.7 … … 5.53 63.7 21.1 42.6 31.6 22.2 26.9 … … … 34… … … … … … … … 11.9o,q 13.4o,q 10.63 30.1 24.1 27.1 … … … … … … …… 10.2 … 22.2 … 4.9 … 13.7 … … 6.25 … … … 21.8 15.3 18.3 … … … …
16 43.1 … 44.7 … 20.2 … 11.4 … 5.8m 1.29 … … … 14.6k 5.8 k 11.0k 17 … 35 16… … 47.7 … 14.1 … 3.9 … … … 0.23 … … … 28.6 12.4 20.2 … … … … 7 53.6 33.1 32.5 5.9 5.9 10.7 9.2 … 15.1m 3.23 34.1 29.2 31.7 24.7k 16.6k 20.8k … … 18 15 5 17.6 … 11.8 … 1.6 … 25.6 16.5l,r 25.2l,r 9.05 49.3 35.1 42.3 16.3 10.5 13.3 … … … 48
10 … … 29.1 … 10.7 … 10.4 … … 4.29 … … … 27.0 20.5 23.6 … … … … 8 39.8 13.5 7.1 4.5 2.2 6.6 7.3 8.9l,q 13.1l,q 5.76 … … … 17.2k 15.7k 17.2k … … … …… … … … … … … … … … 0.12 … … … … … … … … … …
10 … … 8.8 … 1.6 … 13.6 11.3o,q 23.1o,q 5.86 47.5 27.8 37.7 26.4 31.8 29.3 … … … … 16 18.8 45.5 43.1 33.7 35.2 1.9 5.4 … 2.4m, o 5.01 22.0 11.2 16.6 19.9k 6.7 k 13.6k 43 44 23 15 11 44.7 … 63.1 … 38.9 … 1.4 … … 9.10 … … … 20.7 16.8 19.3 … … … 30 11 60.0 58.6 43.7 42.6 28.4 6.5 1.7 … 1.2m 1.48 40.5 6.5 23.6 4.3 2.3 3.2 41 … 45 50 11 21.2 36.7 35.4 17.8 15.1 8.2 8.7 … 8.2m 3.77 12.6 2.2 7.4 14.0k 8.2k 10.9k 38 35 34 27 6 17.0 … … … … … … 22.9l,q 23.2l,q 7.80 24.3p 18.9p 21.6p … … … … … … …… 59.6 … … … … … … … … 4.78 … … … 14.7 11.7 13.4 69 57 36 36
13 23.1 40.2 44.6 23.3 21.8 4.2 10.8 … … 1.53 … … … 29.5k 34.5k 32.4k … … 27 17 22 2.1 45.0 44.8 34.3 33.9 2.7 4.4 … 1.5m 0.31 16.0 2.6 9.4 … … … 20 7 19 7
6 58.1 … 2.1 … 0.6 … 9.8 19.0l,q 25.0l,q 6.60 42.1p 33.6p 37.9p 29.8k 39.8k 35.1k … … … … 2 … … 21.8 … 6.8 … 9.2 2.4l,q 3.4l,q 5.20 59.5 3.7 31.8 7.1k 4.1k 5.5k … … … … 9 46.8 19.7 16.2 6.3 5.1 4.5 4.2 8.8l,r 16.6l,r 5.68 … … … 27.0k 27.8k 27.6k … 31 … …
25 21.3 41.4 46.9 22.3 25.0 5.9 21.5 … … 0.31 27.7 13.5 20.7 21.8 14.8 18.1 … … … 18 13 19.1 … … … … … … … 7.5m 2.60 12.1 1.0 6.6 26.1 21.9 23.8 30 23 35 26
3 … … … … … … … 57.4l,r 65.7l,r 3.73 36.1 20.0 28.1 39.9 49.6 45.1 … … … … 7 … … … … … … … … … 5.65 26.1 7.3 16.8 13.1 15.9 14.6 … … … …
17 4.3 31.5 40.1 18.2 16.7 4.6 9.0 … … 1.77 15.4 2.4 9.0 21.7k 10.3k 16.5k 38 41 28 18 6 … … … … … … … 21.6l,q 22.7l,q 12.25 38.9 29.1 34.0 23.3k 25.6k 24.9k … … … … 5 26.4 … … … … … … 8.0l,q 11.8l,q 2.26 43.4 28.3 35.9 10.9 9.5 10.3 … … … 30… … … … … … … … 12.9q 11.8q 11.52 … … … 13.2 8.4 10.9 … … … … 7 … … 2.6 … 2.1 … 4.4 13.7l,o,q 16.3l,o,q 12.99 36.6 25.4 31.0 35.8 34.1 35.0 … … … … 7 65.1 … 44.7 … 17.8 … 0.9 … … 3.26 58.6 … … … … … … … … …
12 36.1 … 45.8 … 28.2 … 6.8 … 2.4m 1.86 13.5 2.6 8.1 36.5k 29.3k 33.6k 16 8 21 15
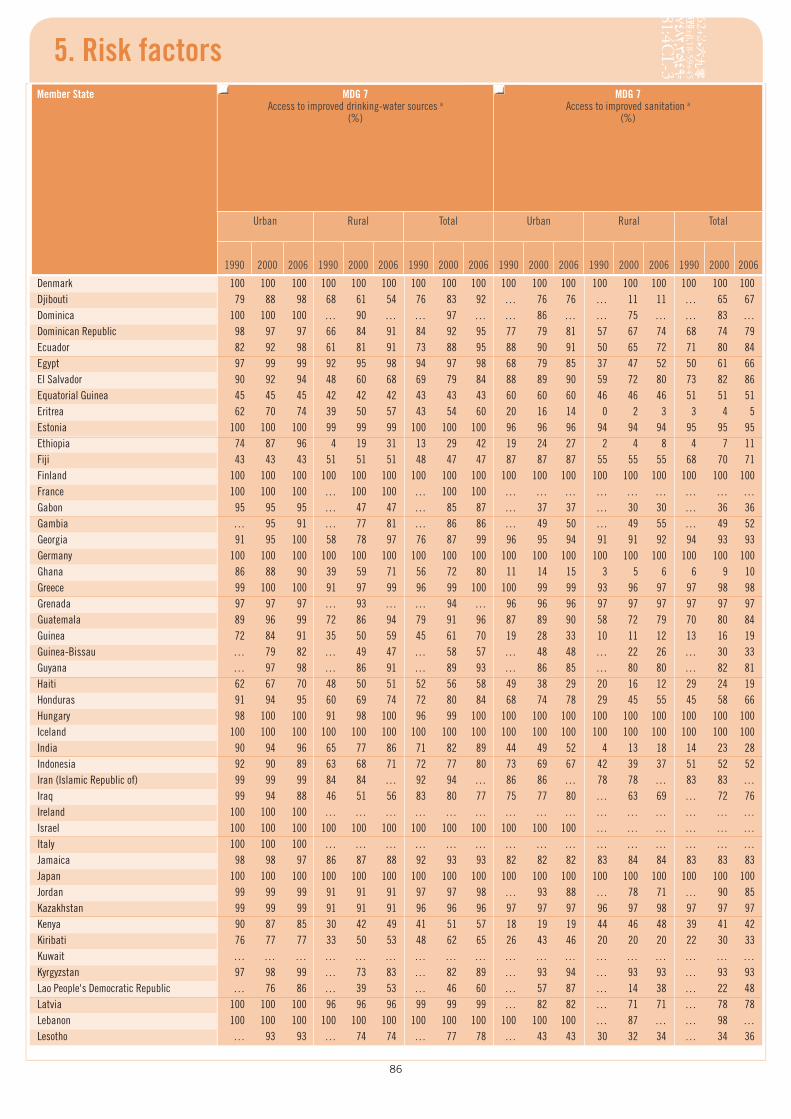
86
5. Risk factorsMember State MDG 7
Access to improved drinking-water sources a (%)
MDG 7 Access to improved sanitation a
(%)
Urban Rural Total Urban Rural Total
1990 2000 2006 1990 2000 2006 1990 2000 2006 1990 2000 2006 1990 2000 2006 1990 2000 2006
Denmark 100 100 100 100 100 100 100 100 100 100 100 100 100 100 100 100 100 100Djibouti 79 88 98 68 61 54 76 83 92 … 76 76 … 11 11 … 65 67Dominica 100 100 100 … 90 … … 97 … … 86 … … 75 … … 83 …Dominican Republic 98 97 97 66 84 91 84 92 95 77 79 81 57 67 74 68 74 79Ecuador 82 92 98 61 81 91 73 88 95 88 90 91 50 65 72 71 80 84Egypt 97 99 99 92 95 98 94 97 98 68 79 85 37 47 52 50 61 66El Salvador 90 92 94 48 60 68 69 79 84 88 89 90 59 72 80 73 82 86Equatorial Guinea 45 45 45 42 42 42 43 43 43 60 60 60 46 46 46 51 51 51Eritrea 62 70 74 39 50 57 43 54 60 20 16 14 0 2 3 3 4 5Estonia 100 100 100 99 99 99 100 100 100 96 96 96 94 94 94 95 95 95Ethiopia 74 87 96 4 19 31 13 29 42 19 24 27 2 4 8 4 7 11Fiji 43 43 43 51 51 51 48 47 47 87 87 87 55 55 55 68 70 71Finland 100 100 100 100 100 100 100 100 100 100 100 100 100 100 100 100 100 100France 100 100 100 … 100 100 … 100 100 … … … … … … … … …Gabon 95 95 95 … 47 47 … 85 87 … 37 37 … 30 30 … 36 36Gambia … 95 91 … 77 81 … 86 86 … 49 50 … 49 55 … 49 52Georgia 91 95 100 58 78 97 76 87 99 96 95 94 91 91 92 94 93 93Germany 100 100 100 100 100 100 100 100 100 100 100 100 100 100 100 100 100 100Ghana 86 88 90 39 59 71 56 72 80 11 14 15 3 5 6 6 9 10Greece 99 100 100 91 97 99 96 99 100 100 99 99 93 96 97 97 98 98Grenada 97 97 97 … 93 … … 94 … 96 96 96 97 97 97 97 97 97Guatemala 89 96 99 72 86 94 79 91 96 87 89 90 58 72 79 70 80 84Guinea 72 84 91 35 50 59 45 61 70 19 28 33 10 11 12 13 16 19Guinea-Bissau … 79 82 … 49 47 … 58 57 … 48 48 … 22 26 … 30 33Guyana … 97 98 … 86 91 … 89 93 … 86 85 … 80 80 … 82 81Haiti 62 67 70 48 50 51 52 56 58 49 38 29 20 16 12 29 24 19Honduras 91 94 95 60 69 74 72 80 84 68 74 78 29 45 55 45 58 66Hungary 98 100 100 91 98 100 96 99 100 100 100 100 100 100 100 100 100 100Iceland 100 100 100 100 100 100 100 100 100 100 100 100 100 100 100 100 100 100India 90 94 96 65 77 86 71 82 89 44 49 52 4 13 18 14 23 28Indonesia 92 90 89 63 68 71 72 77 80 73 69 67 42 39 37 51 52 52Iran (Islamic Republic of) 99 99 99 84 84 … 92 94 … 86 86 … 78 78 … 83 83 …Iraq 99 94 88 46 51 56 83 80 77 75 77 80 … 63 69 … 72 76Ireland 100 100 100 … … … … … … … … … … … … … … …Israel 100 100 100 100 100 100 100 100 100 100 100 100 … … … … … …Italy 100 100 100 … … … … … … … … … … … … … … …Jamaica 98 98 97 86 87 88 92 93 93 82 82 82 83 84 84 83 83 83Japan 100 100 100 100 100 100 100 100 100 100 100 100 100 100 100 100 100 100Jordan 99 99 99 91 91 91 97 97 98 … 93 88 … 78 71 … 90 85Kazakhstan 99 99 99 91 91 91 96 96 96 97 97 97 96 97 98 97 97 97Kenya 90 87 85 30 42 49 41 51 57 18 19 19 44 46 48 39 41 42Kiribati 76 77 77 33 50 53 48 62 65 26 43 46 20 20 20 22 30 33Kuwait … … … … … … … … … … … … … … … … … …Kyrgyzstan 97 98 99 … 73 83 … 82 89 … 93 94 … 93 93 … 93 93Lao People's Democratic Republic … 76 86 … 39 53 … 46 60 … 57 87 … 14 38 … 22 48Latvia 100 100 100 96 96 96 99 99 99 … 82 82 … 71 71 … 78 78Lebanon 100 100 100 100 100 100 100 100 100 100 100 100 … 87 … … 98 …Lesotho … 93 93 … 74 74 … 77 78 … 43 43 30 32 34 … 34 36
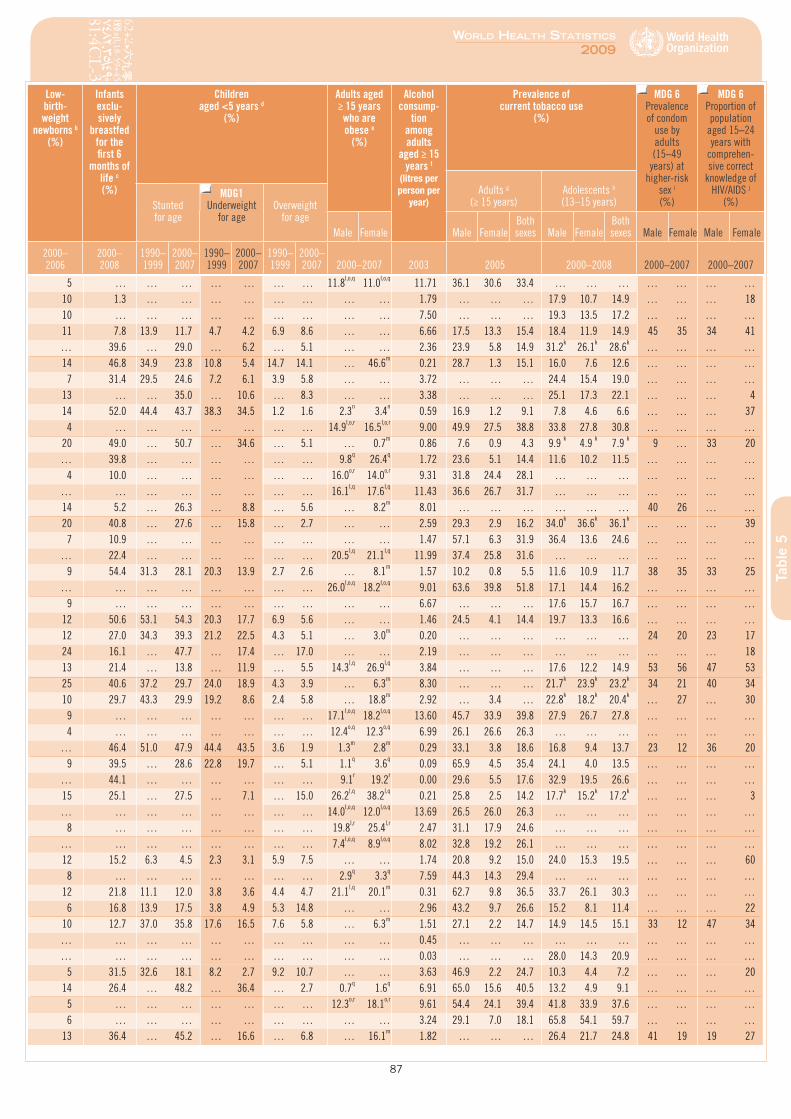
87
World HealtH StatiSticS
2009
Tabl
e 5
Low- birth-weight
newborns b (%)
Infants exclu-sively
breastfed for the first 6
months of life c (%)
Children aged <5 years d
(%)
Adults aged ≥ 15 years
who are obese e
(%)
Alcohol consump-
tion among adults
aged ≥ 15 years f
(litres per person per
year)
Prevalence of current tobacco use
(%)
MDG 6 Prevalence of condom
use by adults (15–49
years) at higher-risk
sex i (%)
MDG 6 Proportion of population
aged 15–24 years with
comprehen-sive correct
knowledge of HIV/AIDS j
(%)Adults g
(≥ 15 years)Adolescents h (13–15 years)Stunted
for age
MDG1Underweight
for ageOverweight
for ageMale Female Male Female
Both sexes Male Female
Both sexes Male Female Male Female
2000– 2006
2000– 2008
1990– 1999
2000– 2007
1990– 1999
2000– 2007
1990– 1999
2000– 2007 2000–2007 2003 2005 2000–2008 2000–2007 2000–2007
5 … … … … … … … 11.8l,o,q 11.0l,o,q 11.71 36.1 30.6 33.4 … … … … … … … 10 1.3 … … … … … … … … 1.79 … … … 17.9 10.7 14.9 … … … 18 10 … … … … … … … … … 7.50 … … … 19.3 13.5 17.2 … … … … 11 7.8 13.9 11.7 4.7 4.2 6.9 8.6 … … 6.66 17.5 13.3 15.4 18.4 11.9 14.9 45 35 34 41… 39.6 … 29.0 … 6.2 … 5.1 … … 2.36 23.9 5.8 14.9 31.2k 26.1k 28.6k … … … …
14 46.8 34.9 23.8 10.8 5.4 14.7 14.1 … 46.6m 0.21 28.7 1.3 15.1 16.0 7.6 12.6 … … … … 7 31.4 29.5 24.6 7.2 6.1 3.9 5.8 … … 3.72 … … … 24.4 15.4 19.0 … … … …
13 … … 35.0 … 10.6 … 8.3 … … 3.38 … … … 25.1 17.3 22.1 … … … 4 14 52.0 44.4 43.7 38.3 34.5 1.2 1.6 2.3n 3.4n 0.59 16.9 1.2 9.1 7.8 4.6 6.6 … … … 37
4 … … … … … … … 14.9l,o,r 16.5l,o,r 9.00 49.9 27.5 38.8 33.8 27.8 30.8 … … … … 20 49.0 … 50.7 … 34.6 … 5.1 … 0.7m 0.86 7.6 0.9 4.3 9.9 k 4.9 k 7.9 k 9 … 33 20… 39.8 … … … … … … 9.8q 26.4q 1.72 23.6 5.1 14.4 11.6 10.2 11.5 … … … … 4 10.0 … … … … … … 16.0o,r 14.0o,r 9.31 31.8 24.4 28.1 … … … … … … …… … … … … … … … 16.1l,q 17.6l,q 11.43 36.6 26.7 31.7 … … … … … … …
14 5.2 … 26.3 … 8.8 … 5.6 … 8.2m 8.01 … … … … … … 40 26 … … 20 40.8 … 27.6 … 15.8 … 2.7 … … 2.59 29.3 2.9 16.2 34.0k 36.6k 36.1k … … … 39 7 10.9 … … … … … … … … 1.47 57.1 6.3 31.9 36.4 13.6 24.6 … … … …… 22.4 … … … … … … 20.5l,q 21.1l,q 11.99 37.4 25.8 31.6 … … … … … … … 9 54.4 31.3 28.1 20.3 13.9 2.7 2.6 … 8.1m 1.57 10.2 0.8 5.5 11.6 10.9 11.7 38 35 33 25… … … … … … … … 26.0l,o,q 18.2l,o,q 9.01 63.6 39.8 51.8 17.1 14.4 16.2 … … … … 9 … … … … … … … … … 6.67 … … … 17.6 15.7 16.7 … … … …
12 50.6 53.1 54.3 20.3 17.7 6.9 5.6 … … 1.46 24.5 4.1 14.4 19.7 13.3 16.6 … … … … 12 27.0 34.3 39.3 21.2 22.5 4.3 5.1 … 3.0m 0.20 … … … … … … 24 20 23 17 24 16.1 … 47.7 … 17.4 … 17.0 … … 2.19 … … … … … … … … … 18 13 21.4 … 13.8 … 11.9 … 5.5 14.3l,q 26.9l,q 3.84 … … … 17.6 12.2 14.9 53 56 47 53 25 40.6 37.2 29.7 24.0 18.9 4.3 3.9 … 6.3m 8.30 … … … 21.7k 23.9k 23.2k 34 21 40 34 10 29.7 43.3 29.9 19.2 8.6 2.4 5.8 … 18.8m 2.92 … 3.4 … 22.8k 18.2k 20.4k … 27 … 30 9 … … … … … … … 17.1l,o,q 18.2l,o,q 13.60 45.7 33.9 39.8 27.9 26.7 27.8 … … … … 4 … … … … … … … 12.4o,q 12.3o,q 6.99 26.1 26.6 26.3 … … … … … … …… 46.4 51.0 47.9 44.4 43.5 3.6 1.9 1.3m 2.8m 0.29 33.1 3.8 18.6 16.8 9.4 13.7 23 12 36 20 9 39.5 … 28.6 22.8 19.7 … 5.1 1.1q 3.6q 0.09 65.9 4.5 35.4 24.1 4.0 13.5 … … … …… 44.1 … … … … … … 9.1r 19.2r 0.00 29.6 5.5 17.6 32.9 19.5 26.6 … … … …
15 25.1 … 27.5 … 7.1 … 15.0 26.2l,q 38.2l,q 0.21 25.8 2.5 14.2 17.7k 15.2k 17.2k … … … 3… … … … … … … … 14.0l,o,q 12.0l,o,q 13.69 26.5 26.0 26.3 … … … … … … … 8 … … … … … … … 19.8l,r 25.4l,r 2.47 31.1 17.9 24.6 … … … … … … …… … … … … … … … 7.4l,o,q 8.9l,o,q 8.02 32.8 19.2 26.1 … … … … … … …
12 15.2 6.3 4.5 2.3 3.1 5.9 7.5 … … 1.74 20.8 9.2 15.0 24.0 15.3 19.5 … … … 60 8 … … … … … … … 2.9q 3.3q 7.59 44.3 14.3 29.4 … … … … … … …
12 21.8 11.1 12.0 3.8 3.6 4.4 4.7 21.1l,q 20.1m 0.31 62.7 9.8 36.5 33.7 26.1 30.3 … … … … 6 16.8 13.9 17.5 3.8 4.9 5.3 14.8 … … 2.96 43.2 9.7 26.6 15.2 8.1 11.4 … … … 22
10 12.7 37.0 35.8 17.6 16.5 7.6 5.8 … 6.3m 1.51 27.1 2.2 14.7 14.9 14.5 15.1 33 12 47 34… … … … … … … … … … 0.45 … … … … … … … … … …… … … … … … … … … … 0.03 … … … 28.0 14.3 20.9 … … … … 5 31.5 32.6 18.1 8.2 2.7 9.2 10.7 … … 3.63 46.9 2.2 24.7 10.3 4.4 7.2 … … … 20
14 26.4 … 48.2 … 36.4 … 2.7 0.7q 1.6q 6.91 65.0 15.6 40.5 13.2 4.9 9.1 … … … … 5 … … … … … … … 12.3o,r 18.1o,r 9.61 54.4 24.1 39.4 41.8 33.9 37.6 … … … … 6 … … … … … … … … … 3.24 29.1 7.0 18.1 65.8 54.1 59.7 … … … …
13 36.4 … 45.2 … 16.6 … 6.8 … 16.1m 1.82 … … … 26.4 21.7 24.8 41 19 19 27
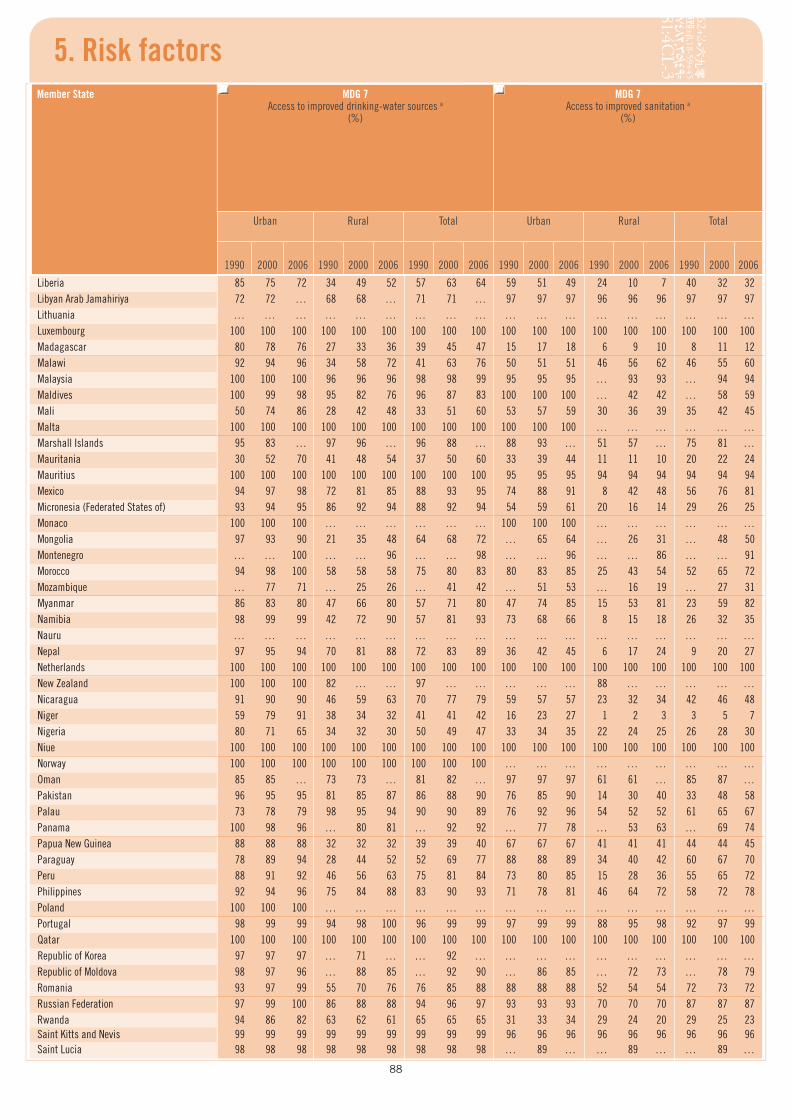
88
5. Risk factorsMember State MDG 7
Access to improved drinking-water sources a (%)
MDG 7 Access to improved sanitation a
(%)
Urban Rural Total Urban Rural Total
1990 2000 2006 1990 2000 2006 1990 2000 2006 1990 2000 2006 1990 2000 2006 1990 2000 2006
Liberia 85 75 72 34 49 52 57 63 64 59 51 49 24 10 7 40 32 32Libyan Arab Jamahiriya 72 72 … 68 68 … 71 71 … 97 97 97 96 96 96 97 97 97Lithuania … … … … … … … … … … … … … … … … … …Luxembourg 100 100 100 100 100 100 100 100 100 100 100 100 100 100 100 100 100 100Madagascar 80 78 76 27 33 36 39 45 47 15 17 18 6 9 10 8 11 12Malawi 92 94 96 34 58 72 41 63 76 50 51 51 46 56 62 46 55 60Malaysia 100 100 100 96 96 96 98 98 99 95 95 95 … 93 93 … 94 94Maldives 100 99 98 95 82 76 96 87 83 100 100 100 … 42 42 … 58 59Mali 50 74 86 28 42 48 33 51 60 53 57 59 30 36 39 35 42 45Malta 100 100 100 100 100 100 100 100 100 100 100 100 … … … … … …Marshall Islands 95 83 … 97 96 … 96 88 … 88 93 … 51 57 … 75 81 …Mauritania 30 52 70 41 48 54 37 50 60 33 39 44 11 11 10 20 22 24Mauritius 100 100 100 100 100 100 100 100 100 95 95 95 94 94 94 94 94 94Mexico 94 97 98 72 81 85 88 93 95 74 88 91 8 42 48 56 76 81Micronesia (Federated States of) 93 94 95 86 92 94 88 92 94 54 59 61 20 16 14 29 26 25Monaco 100 100 100 … … … … … … 100 100 100 … … … … … …Mongolia 97 93 90 21 35 48 64 68 72 … 65 64 … 26 31 … 48 50Montenegro … … 100 … … 96 … … 98 … … 96 … … 86 … … 91Morocco 94 98 100 58 58 58 75 80 83 80 83 85 25 43 54 52 65 72Mozambique … 77 71 … 25 26 … 41 42 … 51 53 … 16 19 … 27 31Myanmar 86 83 80 47 66 80 57 71 80 47 74 85 15 53 81 23 59 82Namibia 98 99 99 42 72 90 57 81 93 73 68 66 8 15 18 26 32 35Nauru … … … … … … … … … … … … … … … … … …Nepal 97 95 94 70 81 88 72 83 89 36 42 45 6 17 24 9 20 27Netherlands 100 100 100 100 100 100 100 100 100 100 100 100 100 100 100 100 100 100New Zealand 100 100 100 82 … … 97 … … … … … 88 … … … … …Nicaragua 91 90 90 46 59 63 70 77 79 59 57 57 23 32 34 42 46 48Niger 59 79 91 38 34 32 41 41 42 16 23 27 1 2 3 3 5 7Nigeria 80 71 65 34 32 30 50 49 47 33 34 35 22 24 25 26 28 30Niue 100 100 100 100 100 100 100 100 100 100 100 100 100 100 100 100 100 100Norway 100 100 100 100 100 100 100 100 100 … … … … … … … … …Oman 85 85 … 73 73 … 81 82 … 97 97 97 61 61 … 85 87 …Pakistan 96 95 95 81 85 87 86 88 90 76 85 90 14 30 40 33 48 58Palau 73 78 79 98 95 94 90 90 89 76 92 96 54 52 52 61 65 67Panama 100 98 96 … 80 81 … 92 92 … 77 78 … 53 63 … 69 74Papua New Guinea 88 88 88 32 32 32 39 39 40 67 67 67 41 41 41 44 44 45Paraguay 78 89 94 28 44 52 52 69 77 88 88 89 34 40 42 60 67 70Peru 88 91 92 46 56 63 75 81 84 73 80 85 15 28 36 55 65 72Philippines 92 94 96 75 84 88 83 90 93 71 78 81 46 64 72 58 72 78Poland 100 100 100 … … … … … … … … … … … … … … …Portugal 98 99 99 94 98 100 96 99 99 97 99 99 88 95 98 92 97 99Qatar 100 100 100 100 100 100 100 100 100 100 100 100 100 100 100 100 100 100Republic of Korea 97 97 97 … 71 … … 92 … … … … … … … … … …Republic of Moldova 98 97 96 … 88 85 … 92 90 … 86 85 … 72 73 … 78 79Romania 93 97 99 55 70 76 76 85 88 88 88 88 52 54 54 72 73 72Russian Federation 97 99 100 86 88 88 94 96 97 93 93 93 70 70 70 87 87 87Rwanda 94 86 82 63 62 61 65 65 65 31 33 34 29 24 20 29 25 23Saint Kitts and Nevis 99 99 99 99 99 99 99 99 99 96 96 96 96 96 96 96 96 96Saint Lucia 98 98 98 98 98 98 98 98 98 … 89 … … 89 … … 89 …
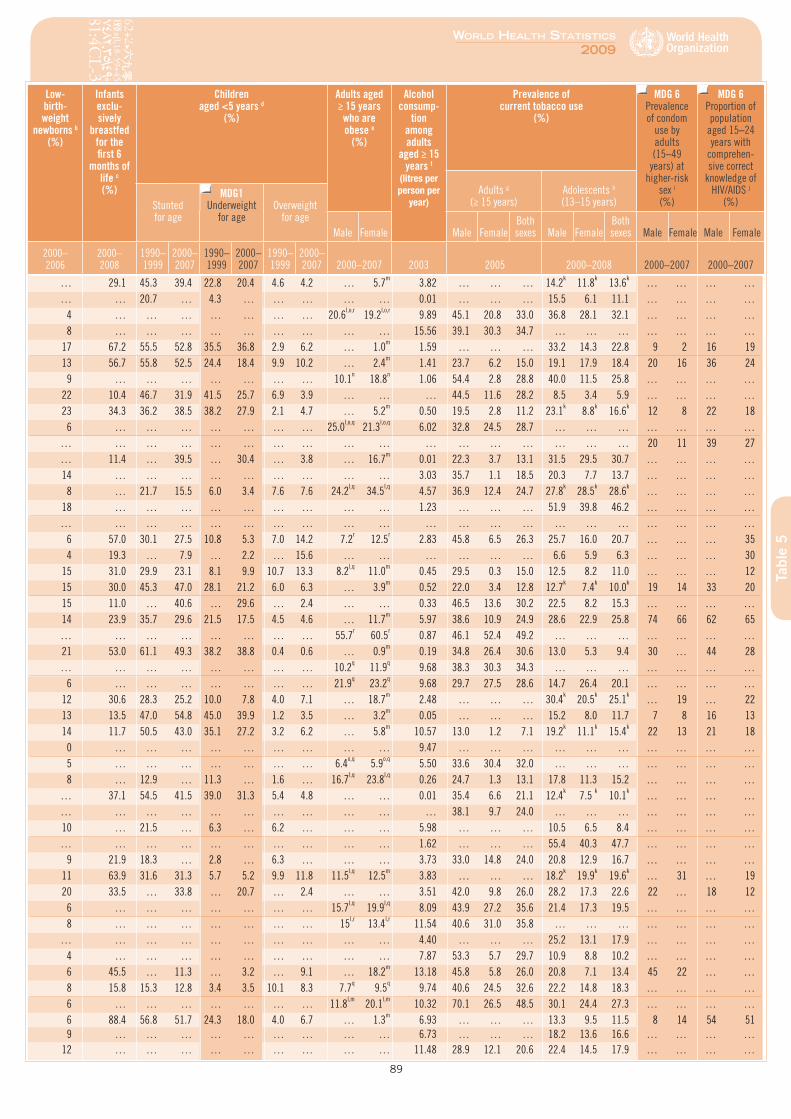
89
World HealtH StatiSticS
2009
Tabl
e 5
Low- birth-weight
newborns b (%)
Infants exclu-sively
breastfed for the first 6
months of life c (%)
Children aged <5 years d
(%)
Adults aged ≥ 15 years
who are obese e
(%)
Alcohol consump-
tion among adults
aged ≥ 15 years f
(litres per person per
year)
Prevalence of current tobacco use
(%)
MDG 6 Prevalence of condom
use by adults (15–49
years) at higher-risk
sex i (%)
MDG 6 Proportion of population
aged 15–24 years with
comprehen-sive correct
knowledge of HIV/AIDS j
(%)Adults g
(≥ 15 years)Adolescents h (13–15 years)Stunted
for age
MDG1Underweight
for ageOverweight
for ageMale Female Male Female
Both sexes Male Female
Both sexes Male Female Male Female
2000– 2006
2000– 2008
1990– 1999
2000– 2007
1990– 1999
2000– 2007
1990– 1999
2000– 2007 2000–2007 2003 2005 2000–2008 2000–2007 2000–2007
… 29.1 45.3 39.4 22.8 20.4 4.6 4.2 … 5.7m 3.82 … … … 14.2k 11.8k 13.6k … … … …… … 20.7 … 4.3 … … … … … 0.01 … … … 15.5 6.1 11.1 … … … … 4 … … … … … … … 20.6l,o,r 19.2l,o,r 9.89 45.1 20.8 33.0 36.8 28.1 32.1 … … … … 8 … … … … … … … … … 15.56 39.1 30.3 34.7 … … … … … … …
17 67.2 55.5 52.8 35.5 36.8 2.9 6.2 … 1.0m 1.59 … … … 33.2 14.3 22.8 9 2 16 19 13 56.7 55.8 52.5 24.4 18.4 9.9 10.2 … 2.4m 1.41 23.7 6.2 15.0 19.1 17.9 18.4 20 16 36 24
9 … … … … … … … 10.1n 18.8n 1.06 54.4 2.8 28.8 40.0 11.5 25.8 … … … … 22 10.4 46.7 31.9 41.5 25.7 6.9 3.9 … … … 44.5 11.6 28.2 8.5 3.4 5.9 … … … … 23 34.3 36.2 38.5 38.2 27.9 2.1 4.7 … 5.2m 0.50 19.5 2.8 11.2 23.1k 8.8k 16.6k 12 8 22 18
6 … … … … … … … 25.0l,o,q 21.3l,o,q 6.02 32.8 24.5 28.7 … … … … … … …… … … … … … … … … … … … … … … … … 20 11 39 27… 11.4 … 39.5 … 30.4 … 3.8 … 16.7m 0.01 22.3 3.7 13.1 31.5 29.5 30.7 … … … …
14 … … … … … … … … … 3.03 35.7 1.1 18.5 20.3 7.7 13.7 … … … … 8 … 21.7 15.5 6.0 3.4 7.6 7.6 24.2l,q 34.5l,q 4.57 36.9 12.4 24.7 27.8k 28.5k 28.6k … … … …
18 … … … … … … … … … 1.23 … … … 51.9 39.8 46.2 … … … …… … … … … … … … … … … … … … … … … … … … … 6 57.0 30.1 27.5 10.8 5.3 7.0 14.2 7.2r 12.5r 2.83 45.8 6.5 26.3 25.7 16.0 20.7 … … … 35 4 19.3 … 7.9 … 2.2 … 15.6 … … … … … … 6.6 5.9 6.3 … … … 30
15 31.0 29.9 23.1 8.1 9.9 10.7 13.3 8.2l,q 11.0m 0.45 29.5 0.3 15.0 12.5 8.2 11.0 … … … 12 15 30.0 45.3 47.0 28.1 21.2 6.0 6.3 … 3.9m 0.52 22.0 3.4 12.8 12.7k 7.4k 10.0k 19 14 33 20 15 11.0 … 40.6 … 29.6 … 2.4 … … 0.33 46.5 13.6 30.2 22.5 8.2 15.3 … … … … 14 23.9 35.7 29.6 21.5 17.5 4.5 4.6 … 11.7m 5.97 38.6 10.9 24.9 28.6 22.9 25.8 74 66 62 65… … … … … … … … 55.7r 60.5r 0.87 46.1 52.4 49.2 … … … … … … …
21 53.0 61.1 49.3 38.2 38.8 0.4 0.6 … 0.9m 0.19 34.8 26.4 30.6 13.0 5.3 9.4 30 … 44 28… … … … … … … … 10.2q 11.9q 9.68 38.3 30.3 34.3 … … … … … … … 6 … … … … … … … 21.9q 23.2q 9.68 29.7 27.5 28.6 14.7 26.4 20.1 … … … …
12 30.6 28.3 25.2 10.0 7.8 4.0 7.1 … 18.7m 2.48 … … … 30.4k 20.5k 25.1k … 19 … 22 13 13.5 47.0 54.8 45.0 39.9 1.2 3.5 … 3.2m 0.05 … … … 15.2 8.0 11.7 7 8 16 13 14 11.7 50.5 43.0 35.1 27.2 3.2 6.2 … 5.8m 10.57 13.0 1.2 7.1 19.2k 11.1k 15.4k 22 13 21 18 0 … … … … … … … … … 9.47 … … … … … … … … … … 5 … … … … … … … 6.4o,q 5.9o,q 5.50 33.6 30.4 32.0 … … … … … … … 8 … 12.9 … 11.3 … 1.6 … 16.7l,q 23.8l,q 0.26 24.7 1.3 13.1 17.8 11.3 15.2 … … … …… 37.1 54.5 41.5 39.0 31.3 5.4 4.8 … … 0.01 35.4 6.6 21.1 12.4k 7.5 k 10.1k … … … …… … … … … … … … … … … 38.1 9.7 24.0 … … … … … … …
10 … 21.5 … 6.3 … 6.2 … … … 5.98 … … … 10.5 6.5 8.4 … … … …… … … … … … … … … … 1.62 … … … 55.4 40.3 47.7 … … … … 9 21.9 18.3 … 2.8 … 6.3 … … … 3.73 33.0 14.8 24.0 20.8 12.9 16.7 … … … …
11 63.9 31.6 31.3 5.7 5.2 9.9 11.8 11.5l,q 12.5m 3.83 … … … 18.2k 19.9k 19.6k … 31 … 19 20 33.5 … 33.8 … 20.7 … 2.4 … … 3.51 42.0 9.8 26.0 28.2 17.3 22.6 22 … 18 12 6 … … … … … … … 15.7l,q 19.9l,q 8.09 43.9 27.2 35.6 21.4 17.3 19.5 … … … … 8 … … … … … … … 15l,r 13.4l,r 11.54 40.6 31.0 35.8 … … … … … … …… … … … … … … … … … 4.40 … … … 25.2 13.1 17.9 … … … … 4 … … … … … … … … … 7.87 53.3 5.7 29.7 10.9 8.8 10.2 … … … … 6 45.5 … 11.3 … 3.2 … 9.1 … 18.2m 13.18 45.8 5.8 26.0 20.8 7.1 13.4 45 22 … … 8 15.8 15.3 12.8 3.4 3.5 10.1 8.3 7.7q 9.5q 9.74 40.6 24.5 32.6 22.2 14.8 18.3 … … … … 6 … … … … … … … 11.8l,m 20.1l,m 10.32 70.1 26.5 48.5 30.1 24.4 27.3 … … … … 6 88.4 56.8 51.7 24.3 18.0 4.0 6.7 … 1.3m 6.93 … … … 13.3 9.5 11.5 8 14 54 51 9 … … … … … … … … … 6.73 … … … 18.2 13.6 16.6 … … … …
12 … … … … … … … … … 11.48 28.9 12.1 20.6 22.4 14.5 17.9 … … … …
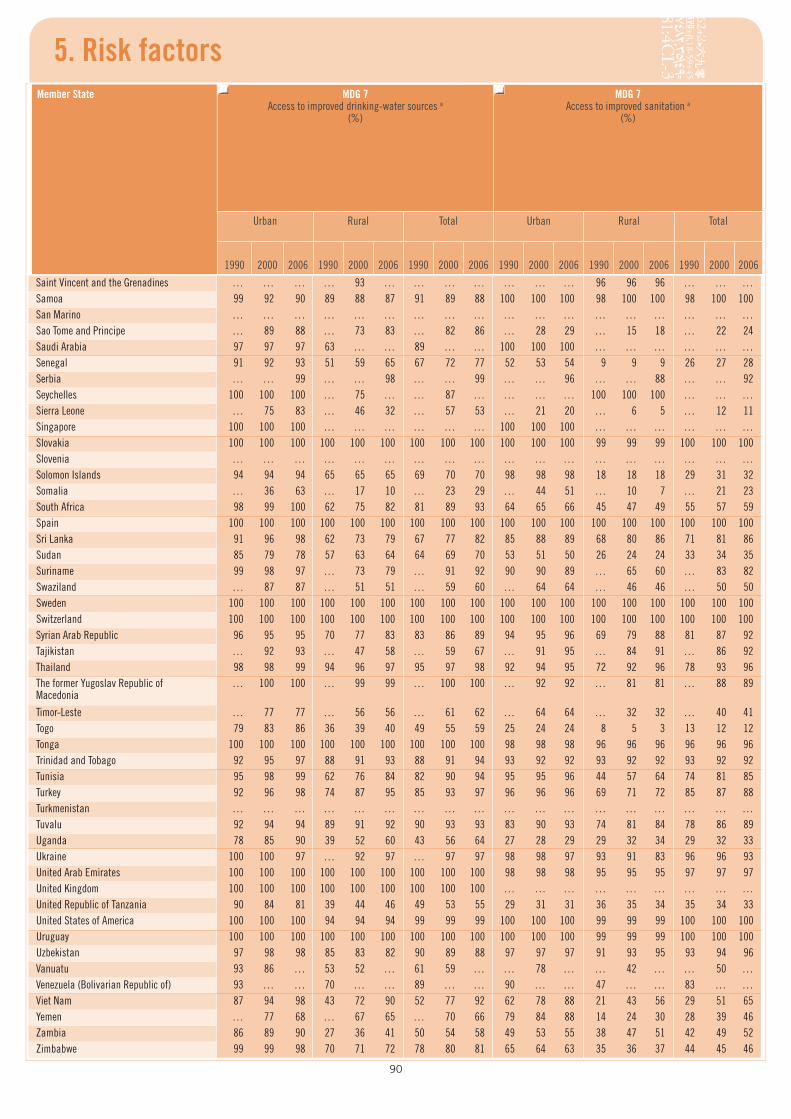
90
5. Risk factorsMember State MDG 7
Access to improved drinking-water sources a (%)
MDG 7 Access to improved sanitation a
(%)
Urban Rural Total Urban Rural Total
1990 2000 2006 1990 2000 2006 1990 2000 2006 1990 2000 2006 1990 2000 2006 1990 2000 2006
Saint Vincent and the Grenadines … … … … 93 … … … … … … … 96 96 96 … … …Samoa 99 92 90 89 88 87 91 89 88 100 100 100 98 100 100 98 100 100San Marino … … … … … … … … … … … … … … … … … …Sao Tome and Principe … 89 88 … 73 83 … 82 86 … 28 29 … 15 18 … 22 24Saudi Arabia 97 97 97 63 … … 89 … … 100 100 100 … … … … … …Senegal 91 92 93 51 59 65 67 72 77 52 53 54 9 9 9 26 27 28Serbia … … 99 … … 98 … … 99 … … 96 … … 88 … … 92Seychelles 100 100 100 … 75 … … 87 … … … … 100 100 100 … … …Sierra Leone … 75 83 … 46 32 … 57 53 … 21 20 … 6 5 … 12 11Singapore 100 100 100 … … … … … … 100 100 100 … … … … … …Slovakia 100 100 100 100 100 100 100 100 100 100 100 100 99 99 99 100 100 100Slovenia … … … … … … … … … … … … … … … … … …Solomon Islands 94 94 94 65 65 65 69 70 70 98 98 98 18 18 18 29 31 32Somalia … 36 63 … 17 10 … 23 29 … 44 51 … 10 7 … 21 23South Africa 98 99 100 62 75 82 81 89 93 64 65 66 45 47 49 55 57 59Spain 100 100 100 100 100 100 100 100 100 100 100 100 100 100 100 100 100 100Sri Lanka 91 96 98 62 73 79 67 77 82 85 88 89 68 80 86 71 81 86Sudan 85 79 78 57 63 64 64 69 70 53 51 50 26 24 24 33 34 35Suriname 99 98 97 … 73 79 … 91 92 90 90 89 … 65 60 … 83 82Swaziland … 87 87 … 51 51 … 59 60 … 64 64 … 46 46 … 50 50Sweden 100 100 100 100 100 100 100 100 100 100 100 100 100 100 100 100 100 100Switzerland 100 100 100 100 100 100 100 100 100 100 100 100 100 100 100 100 100 100Syrian Arab Republic 96 95 95 70 77 83 83 86 89 94 95 96 69 79 88 81 87 92Tajikistan … 92 93 … 47 58 … 59 67 … 91 95 … 84 91 … 86 92Thailand 98 98 99 94 96 97 95 97 98 92 94 95 72 92 96 78 93 96The former Yugoslav Republic of Macedonia
… 100 100 … 99 99 … 100 100 … 92 92 … 81 81 … 88 89
Timor-Leste … 77 77 … 56 56 … 61 62 … 64 64 … 32 32 … 40 41Togo 79 83 86 36 39 40 49 55 59 25 24 24 8 5 3 13 12 12Tonga 100 100 100 100 100 100 100 100 100 98 98 98 96 96 96 96 96 96Trinidad and Tobago 92 95 97 88 91 93 88 91 94 93 92 92 93 92 92 93 92 92Tunisia 95 98 99 62 76 84 82 90 94 95 95 96 44 57 64 74 81 85Turkey 92 96 98 74 87 95 85 93 97 96 96 96 69 71 72 85 87 88Turkmenistan … … … … … … … … … … … … … … … … … …Tuvalu 92 94 94 89 91 92 90 93 93 83 90 93 74 81 84 78 86 89Uganda 78 85 90 39 52 60 43 56 64 27 28 29 29 32 34 29 32 33Ukraine 100 100 97 … 92 97 … 97 97 98 98 97 93 91 83 96 96 93United Arab Emirates 100 100 100 100 100 100 100 100 100 98 98 98 95 95 95 97 97 97United Kingdom 100 100 100 100 100 100 100 100 100 … … … … … … … … …United Republic of Tanzania 90 84 81 39 44 46 49 53 55 29 31 31 36 35 34 35 34 33United States of America 100 100 100 94 94 94 99 99 99 100 100 100 99 99 99 100 100 100Uruguay 100 100 100 100 100 100 100 100 100 100 100 100 99 99 99 100 100 100Uzbekistan 97 98 98 85 83 82 90 89 88 97 97 97 91 93 95 93 94 96Vanuatu 93 86 … 53 52 … 61 59 … … 78 … … 42 … … 50 …Venezuela (Bolivarian Republic of) 93 … … 70 … … 89 … … 90 … … 47 … … 83 … …Viet Nam 87 94 98 43 72 90 52 77 92 62 78 88 21 43 56 29 51 65Yemen … 77 68 … 67 65 … 70 66 79 84 88 14 24 30 28 39 46Zambia 86 89 90 27 36 41 50 54 58 49 53 55 38 47 51 42 49 52Zimbabwe 99 99 98 70 71 72 78 80 81 65 64 63 35 36 37 44 45 46
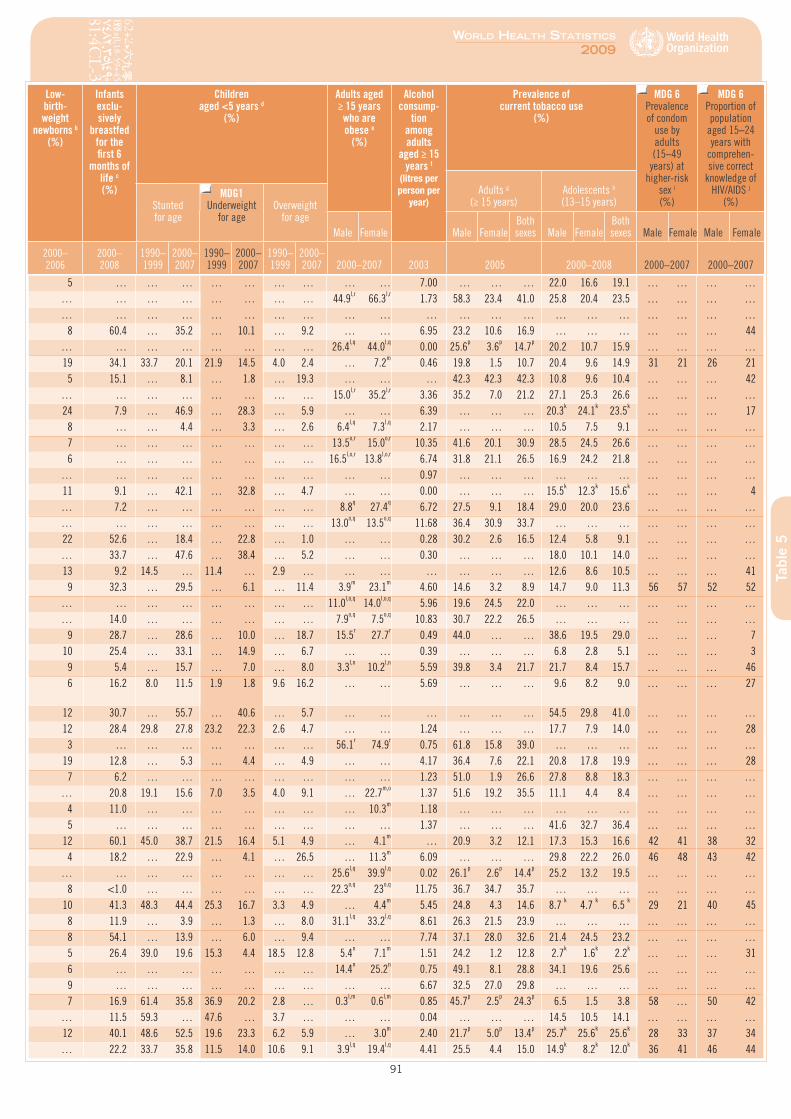
91
World HealtH StatiSticS
2009
Tabl
e 5
Low- birth-weight
newborns b (%)
Infants exclu-sively
breastfed for the first 6
months of life c (%)
Children aged <5 years d
(%)
Adults aged ≥ 15 years
who are obese e
(%)
Alcohol consump-
tion among adults
aged ≥ 15 years f
(litres per person per
year)
Prevalence of current tobacco use
(%)
MDG 6 Prevalence of condom
use by adults (15–49
years) at higher-risk
sex i (%)
MDG 6 Proportion of population
aged 15–24 years with
comprehen-sive correct
knowledge of HIV/AIDS j
(%)Adults g
(≥ 15 years)Adolescents h (13–15 years)Stunted
for age
MDG1Underweight
for ageOverweight
for ageMale Female Male Female
Both sexes Male Female
Both sexes Male Female Male Female
2000– 2006
2000– 2008
1990– 1999
2000– 2007
1990– 1999
2000– 2007
1990– 1999
2000– 2007 2000–2007 2003 2005 2000–2008 2000–2007 2000–2007
5 … … … … … … … … … 7.00 … … … 22.0 16.6 19.1 … … … …… … … … … … … … 44.9l,r 66.3l,r 1.73 58.3 23.4 41.0 25.8 20.4 23.5 … … … …… … … … … … … … … … … … … … … … … … … … … 8 60.4 … 35.2 … 10.1 … 9.2 … … 6.95 23.2 10.6 16.9 … … … … … … 44… … … … … … … … 26.4l,q 44.0l,q 0.00 25.6p 3.6p 14.7p 20.2 10.7 15.9 … … … …
19 34.1 33.7 20.1 21.9 14.5 4.0 2.4 … 7.2m 0.46 19.8 1.5 10.7 20.4 9.6 14.9 31 21 26 21 5 15.1 … 8.1 … 1.8 … 19.3 … … … 42.3 42.3 42.3 10.8 9.6 10.4 … … … 42… … … … … … … … 15.0l,r 35.2l,r 3.36 35.2 7.0 21.2 27.1 25.3 26.6 … … … …
24 7.9 … 46.9 … 28.3 … 5.9 … … 6.39 … … … 20.3k 24.1k 23.5k … … … 17 8 … … 4.4 … 3.3 … 2.6 6.4l,q 7.3l,q 2.17 … … … 10.5 7.5 9.1 … … … … 7 … … … … … … … 13.5o,r 15.0o,r 10.35 41.6 20.1 30.9 28.5 24.5 26.6 … … … … 6 … … … … … … … 16.5l,o,r 13.8l,o,r 6.74 31.8 21.1 26.5 16.9 24.2 21.8 … … … …… … … … … … … … … … 0.97 … … … … … … … … … …
11 9.1 … 42.1 … 32.8 … 4.7 … … 0.00 … … … 15.5k 12.3k 15.6k … … … 4… 7.2 … … … … … … 8.8q 27.4q 6.72 27.5 9.1 18.4 29.0 20.0 23.6 … … … …… … … … … … … … 13.0o,q 13.5o,q 11.68 36.4 30.9 33.7 … … … … … … …
22 52.6 … 18.4 … 22.8 … 1.0 … … 0.28 30.2 2.6 16.5 12.4 5.8 9.1 … … … …… 33.7 … 47.6 … 38.4 … 5.2 … … 0.30 … … … 18.0 10.1 14.0 … … … …
13 9.2 14.5 … 11.4 … 2.9 … … … … … … … 12.6 8.6 10.5 … … … 41 9 32.3 … 29.5 … 6.1 … 11.4 3.9m 23.1m 4.60 14.6 3.2 8.9 14.7 9.0 11.3 56 57 52 52… … … … … … … … 11.0l,o,q 14.0l,o,q 5.96 19.6 24.5 22.0 … … … … … … …… 14.0 … … … … … … 7.9o,q 7.5o,q 10.83 30.7 22.2 26.5 … … … … … … … 9 28.7 … 28.6 … 10.0 … 18.7 15.5r 27.7r 0.49 44.0 … … 38.6 19.5 29.0 … … … 7
10 25.4 … 33.1 … 14.9 … 6.7 … … 0.39 … … … 6.8 2.8 5.1 … … … 3 9 5.4 … 15.7 … 7.0 … 8.0 3.3l,n 10.2l,n 5.59 39.8 3.4 21.7 21.7 8.4 15.7 … … … 46 6 16.2 8.0 11.5 1.9 1.8 9.6 16.2 … … 5.69 … … … 9.6 8.2 9.0 … … … 27
12 30.7 … 55.7 … 40.6 … 5.7 … … … … … … 54.5 29.8 41.0 … … … … 12 28.4 29.8 27.8 23.2 22.3 2.6 4.7 … … 1.24 … … … 17.7 7.9 14.0 … … … 28 3 … … … … … … … 56.1r 74.9r 0.75 61.8 15.8 39.0 … … … … … … …
19 12.8 … 5.3 … 4.4 … 4.9 … … 4.17 36.4 7.6 22.1 20.8 17.8 19.9 … … … 28 7 6.2 … … … … … … … … 1.23 51.0 1.9 26.6 27.8 8.8 18.3 … … … …… 20.8 19.1 15.6 7.0 3.5 4.0 9.1 … 22.7m,o 1.37 51.6 19.2 35.5 11.1 4.4 8.4 … … … … 4 11.0 … … … … … … … 10.3m 1.18 … … … … … … … … … … 5 … … … … … … … … … 1.37 … … … 41.6 32.7 36.4 … … … …
12 60.1 45.0 38.7 21.5 16.4 5.1 4.9 … 4.1m … 20.9 3.2 12.1 17.3 15.3 16.6 42 41 38 32 4 18.2 … 22.9 … 4.1 … 26.5 … 11.3m 6.09 … … … 29.8 22.2 26.0 46 48 43 42… … … … … … … … 25.6l,q 39.9l,q 0.02 26.1p 2.6p 14.4p 25.2 13.2 19.5 … … … … 8 <1.0 … … … … … … 22.3o,q 23o,q 11.75 36.7 34.7 35.7 … … … … … … …
10 41.3 48.3 44.4 25.3 16.7 3.3 4.9 … 4.4m 5.45 24.8 4.3 14.6 8.7 k 4.7 k 6.5 k 29 21 40 45 8 11.9 … 3.9 … 1.3 … 8.0 31.1l,q 33.2l,q 8.61 26.3 21.5 23.9 … … … … … … … 8 54.1 … 13.9 … 6.0 … 9.4 … … 7.74 37.1 28.0 32.6 21.4 24.5 23.2 … … … … 5 26.4 39.0 19.6 15.3 4.4 18.5 12.8 5.4n 7.1m 1.51 24.2 1.2 12.8 2.7k 1.6k 2.2k … … … 31 6 … … … … … … … 14.4n 25.2n 0.75 49.1 8.1 28.8 34.1 19.6 25.6 … … … … 9 … … … … … … … … … 6.67 32.5 27.0 29.8 … … … … … … … 7 16.9 61.4 35.8 36.9 20.2 2.8 … 0.3l,m 0.6l,m 0.85 45.7p 2.5p 24.3p 6.5 1.5 3.8 58 … 50 42… 11.5 59.3 … 47.6 … 3.7 … … … 0.04 … … … 14.5 10.5 14.1 … … … …
12 40.1 48.6 52.5 19.6 23.3 6.2 5.9 … 3.0m 2.40 21.7p 5.0p 13.4p 25.7k 25.6k 25.6k 28 33 37 34… 22.2 33.7 35.8 11.5 14.0 10.6 9.1 3.9l,q 19.4l,q 4.41 25.5 4.4 15.0 14.9k 8.2k 12.0k 36 41 46 44
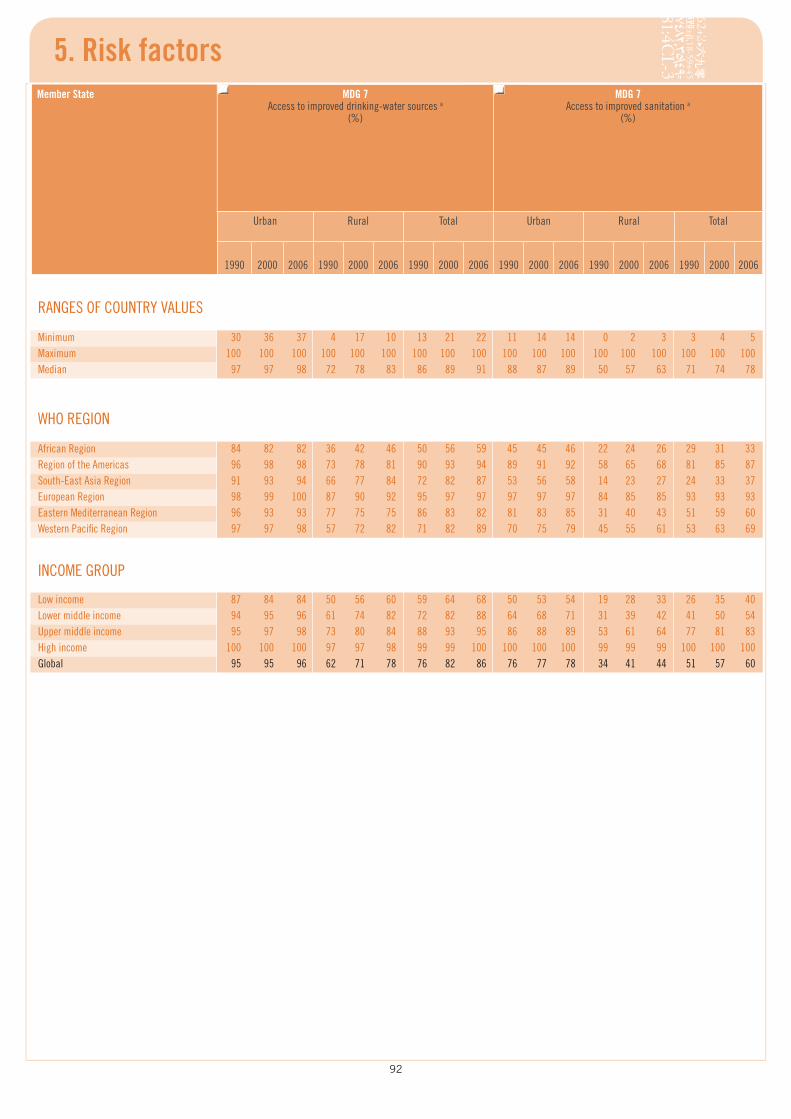
92
5. Risk factorsMember State MDG 7
Access to improved drinking-water sources a (%)
MDG 7 Access to improved sanitation a
(%)
Urban Rural Total Urban Rural Total
1990 2000 2006 1990 2000 2006 1990 2000 2006 1990 2000 2006 1990 2000 2006 1990 2000 2006
RANGES OF COUNTRY VALUES
Minimum 30 36 37 4 17 10 13 21 22 11 14 14 0 2 3 3 4 5Maximum 100 100 100 100 100 100 100 100 100 100 100 100 100 100 100 100 100 100Median 97 97 98 72 78 83 86 89 91 88 87 89 50 57 63 71 74 78
WHO REGION
African Region 84 82 82 36 42 46 50 56 59 45 45 46 22 24 26 29 31 33Region of the Americas 96 98 98 73 78 81 90 93 94 89 91 92 58 65 68 81 85 87South-East Asia Region 91 93 94 66 77 84 72 82 87 53 56 58 14 23 27 24 33 37European Region 98 99 100 87 90 92 95 97 97 97 97 97 84 85 85 93 93 93Eastern Mediterranean Region 96 93 93 77 75 75 86 83 82 81 83 85 31 40 43 51 59 60Western Pacific Region 97 97 98 57 72 82 71 82 89 70 75 79 45 55 61 53 63 69
INCOME GROUP
Low income 87 84 84 50 56 60 59 64 68 50 53 54 19 28 33 26 35 40Lower middle income 94 95 96 61 74 82 72 82 88 64 68 71 31 39 42 41 50 54Upper middle income 95 97 98 73 80 84 88 93 95 86 88 89 53 61 64 77 81 83High income 100 100 100 97 97 98 99 99 100 100 100 100 99 99 99 100 100 100Global 95 95 96 62 71 78 76 82 86 76 77 78 34 41 44 51 57 60
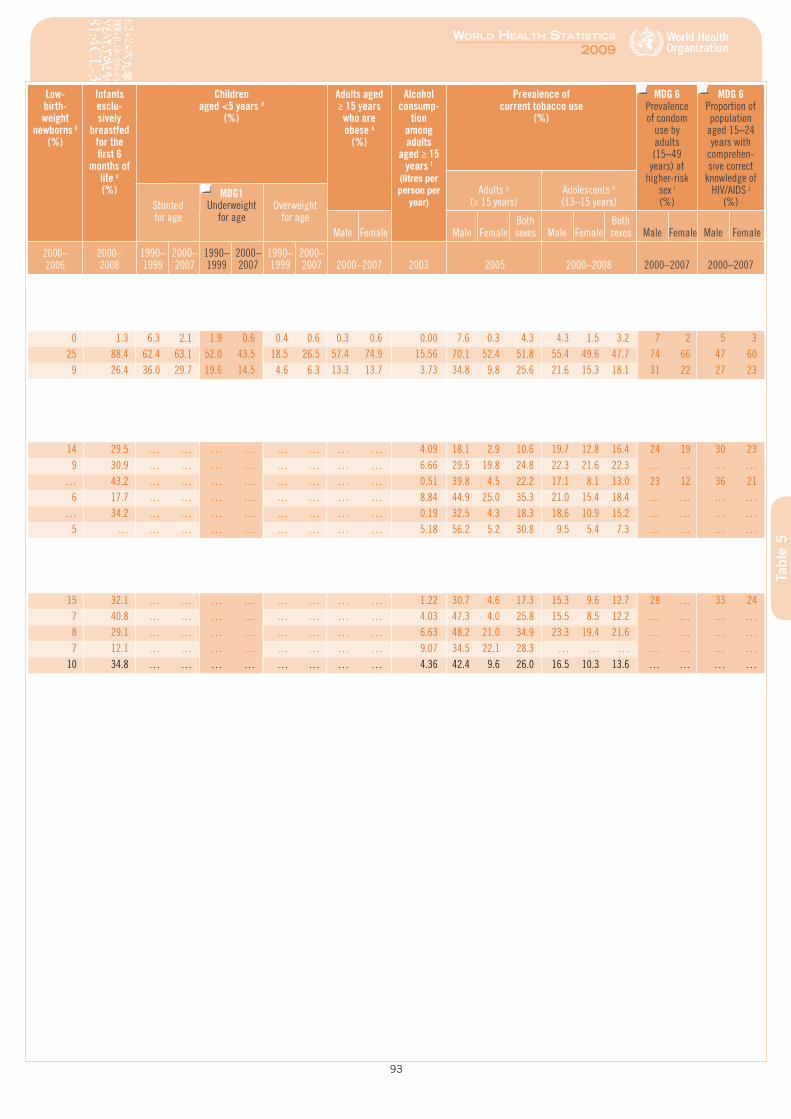
93
World HealtH StatiSticS
2009
Tabl
e 5
Low- birth-weight
newborns b (%)
Infants exclu-sively
breastfed for the first 6
months of life c (%)
Children aged <5 years d
(%)
Adults aged ≥ 15 years
who are obese e
(%)
Alcohol consump-
tion among adults
aged ≥ 15 years f
(litres per person per
year)
Prevalence of current tobacco use
(%)
MDG 6 Prevalence of condom
use by adults (15–49
years) at higher-risk
sex i (%)
MDG 6 Proportion of population
aged 15–24 years with
comprehen-sive correct
knowledge of HIV/AIDS j
(%)Adults g
(≥ 15 years)Adolescents h (13–15 years)Stunted
for age
MDG1Underweight
for ageOverweight
for ageMale Female Male Female
Both sexes Male Female
Both sexes Male Female Male Female
2000– 2006
2000– 2008
1990– 1999
2000– 2007
1990– 1999
2000– 2007
1990– 1999
2000– 2007 2000–2007 2003 2005 2000–2008 2000–2007 2000–2007
0 1.3 6.3 2.1 1.9 0.6 0.4 0.6 0.3 0.6 0.00 7.6 0.3 4.3 4.3 1.5 3.2 7 2 5 325 88.4 62.4 63.1 52.0 43.5 18.5 26.5 57.4 74.9 15.56 70.1 52.4 51.8 55.4 49.6 47.7 74 66 47 60
9 26.4 36.0 29.7 19.6 14.5 4.6 6.3 13.3 13.7 3.73 34.8 9.8 25.6 21.6 15.3 18.1 31 22 27 23
14 29.5 … … … … … … … … 4.09 18.1 2.9 10.6 19.7 12.8 16.4 24 19 30 239 30.9 … … … … … … … … 6.66 29.5 19.8 24.8 22.3 21.6 22.3 … … … …
… 43.2 … … … … … … … … 0.51 39.8 4.5 22.2 17.1 8.1 13.0 23 12 36 216 17.7 … … … … … … … … 8.84 44.9 25.0 35.3 21.0 15.4 18.4 … … … …
… 34.2 … … … … … … … … 0.19 32.5 4.3 18.3 18.6 10.9 15.2 … … … …5 … … … … … … … … … 5.18 56.2 5.2 30.8 9.5 5.4 7.3 … … … …
15 32.1 … … … … … … … … 1.22 30.7 4.6 17.3 15.3 9.6 12.7 28 … 33 247 40.8 … … … … … … … … 4.03 47.3 4.0 25.8 15.5 8.5 12.2 … … … …8 29.1 … … … … … … … … 6.63 48.2 21.0 34.9 23.3 19.4 21.6 … … … …7 12.1 … … … … … … … … 9.07 34.5 22.1 28.3 … … … … … … …
10 34.8 … … … … … … … … 4.36 42.4 9.6 26.0 16.5 10.3 13.6 … … … …

World HealtH StatiSticS
2009
95
Health workforce, infrastructure, essential medicinesData on the resources available to the health system are essential to enable governments to determine how best to meet the health-related needs of the population.
Data indicate that globally, there are 13 physicians per 10 000 population, with large variations between countries and regions. In the African Region, there are only 2 physicians per 10 000 compared with 32 per 10 000 in the European Region. Globally, there are 28 nurses and midwives per 10 000 population, ranging from a low of 11 per 10 000 in the African Region to a high of 79 per 10 000 in the European Region.
While there are no gold standards for assessing the sufficiency of the health workforce, WHO estimates that countries with fewer than 23 health-care professionals (counting only physicians, nurses and midwives) per 10 000 population will be unlikely to achieve adequate coverage rates for the key primary health-care interventions prioritized by the Millennium Development Goals.
Estimates of the numbers and density of the health workforce refer to the active health workforce: people currently participating in the health labour market. The data are derived from multiple sources including: national population censuses, labour force and employment surveys, health facility assessments and routine administrative information systems (including registries on public expenditure, staffing and payroll as well as professional training, registration and licensure). This diversity of sources means there is considerable variability in the coverage and quality of the data and it is not always clear whether both the public and private sectors are included.
Hospital beds are used to indicate the availability of inpatient services. There is no global norm for the density of hospital beds in relation to total population. In the European Region, there are 63 hospital beds per 10 000 population compared with 10 per 10 000 in the African Region. Statistics on hospital bed density are generally drawn from routine administrative records but in some settings only public sector beds are included.
In most developing countries the availability of medicines – where these are provided through public health facilities at a low cost or free of charge – is very poor. In all regions, availability is better in the private sector, but can still be poor. Surveys in about 30 developing countries indicate that only 35 % of selected medicines were available in the public sector and 63 % were available in the private sector. In the private sector, medicines cost on average about 650% more than the international reference price, while in the public sector – where patients pay for medicines – the average cost is 250% more than the international reference price.
Tabl
e 6
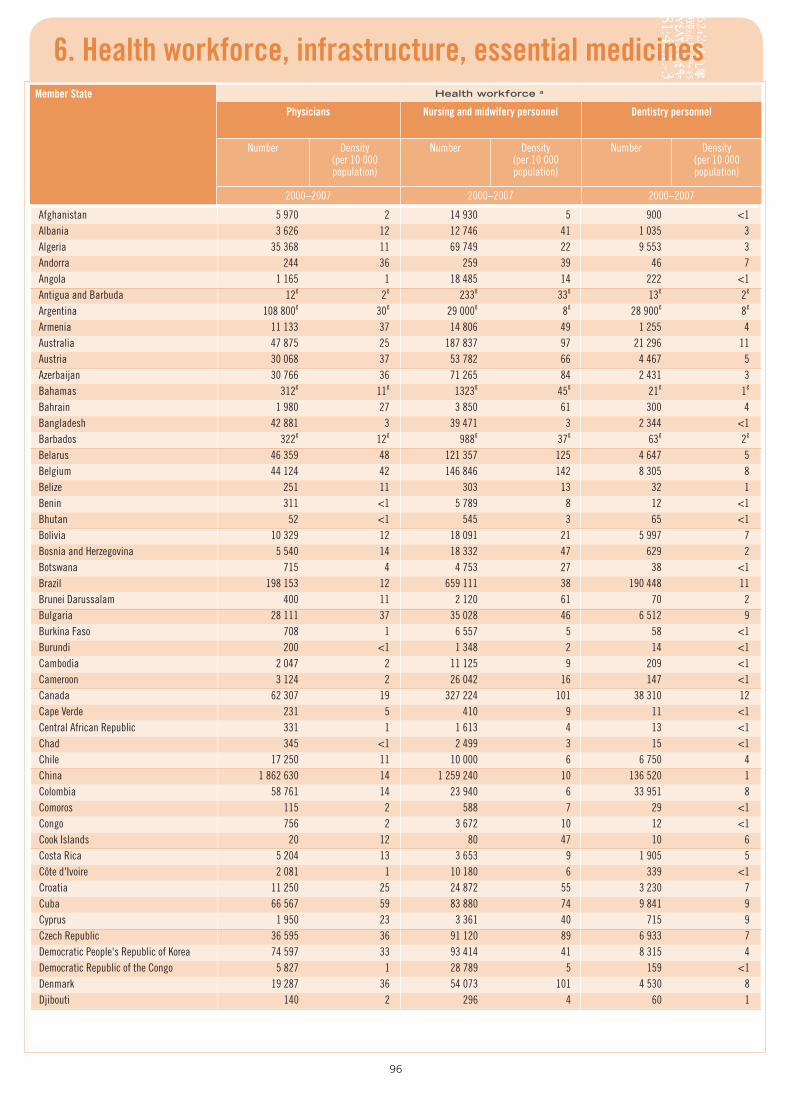
96
6. Health workforce, infrastructure, essential medicinesMember State Health workforce a
Physicians Nursing and midwifery personnel Dentistry personnel
Number Density (per 10 000 population)
Number Density (per 10 000 population)
Number Density (per 10 000 population)
2000–2007 2000–2007 2000–2007
Afghanistan 5 970 2 14 930 5 900 <1Albania 3 626 12 12 746 41 1 035 3Algeria 35 368 11 69 749 22 9 553 3Andorra 244 36 259 39 46 7Angola 1 165 1 18 485 14 222 <1Antigua and Barbuda 12g 2g 233g 33g 13g 2g
Argentina 108 800g 30g 29 000g 8g 28 900g 8g
Armenia 11 133 37 14 806 49 1 255 4Australia 47 875 25 187 837 97 21 296 11Austria 30 068 37 53 782 66 4 467 5Azerbaijan 30 766 36 71 265 84 2 431 3Bahamas 312g 11g 1323g 45g 21g 1g
Bahrain 1 980 27 3 850 61 300 4Bangladesh 42 881 3 39 471 3 2 344 <1Barbados 322g 12g 988g 37g 63g 2g
Belarus 46 359 48 121 357 125 4 647 5Belgium 44 124 42 146 846 142 8 305 8Belize 251 11 303 13 32 1Benin 311 <1 5 789 8 12 <1Bhutan 52 <1 545 3 65 <1Bolivia 10 329 12 18 091 21 5 997 7Bosnia and Herzegovina 5 540 14 18 332 47 629 2Botswana 715 4 4 753 27 38 <1Brazil 198 153 12 659 111 38 190 448 11Brunei Darussalam 400 11 2 120 61 70 2Bulgaria 28 111 37 35 028 46 6 512 9Burkina Faso 708 1 6 557 5 58 <1Burundi 200 <1 1 348 2 14 <1Cambodia 2 047 2 11 125 9 209 <1Cameroon 3 124 2 26 042 16 147 <1Canada 62 307 19 327 224 101 38 310 12Cape Verde 231 5 410 9 11 <1Central African Republic 331 1 1 613 4 13 <1Chad 345 <1 2 499 3 15 <1Chile 17 250 11 10 000 6 6 750 4China 1 862 630 14 1 259 240 10 136 520 1Colombia 58 761 14 23 940 6 33 951 8Comoros 115 2 588 7 29 <1Congo 756 2 3 672 10 12 <1Cook Islands 20 12 80 47 10 6Costa Rica 5 204 13 3 653 9 1 905 5Côte d'Ivoire 2 081 1 10 180 6 339 <1Croatia 11 250 25 24 872 55 3 230 7Cuba 66 567 59 83 880 74 9 841 9Cyprus 1 950 23 3 361 40 715 9Czech Republic 36 595 36 91 120 89 6 933 7Democratic People's Republic of Korea 74 597 33 93 414 41 8 315 4Democratic Republic of the Congo 5 827 1 28 789 5 159 <1Denmark 19 287 36 54 073 101 4 530 8Djibouti 140 2 296 4 60 1
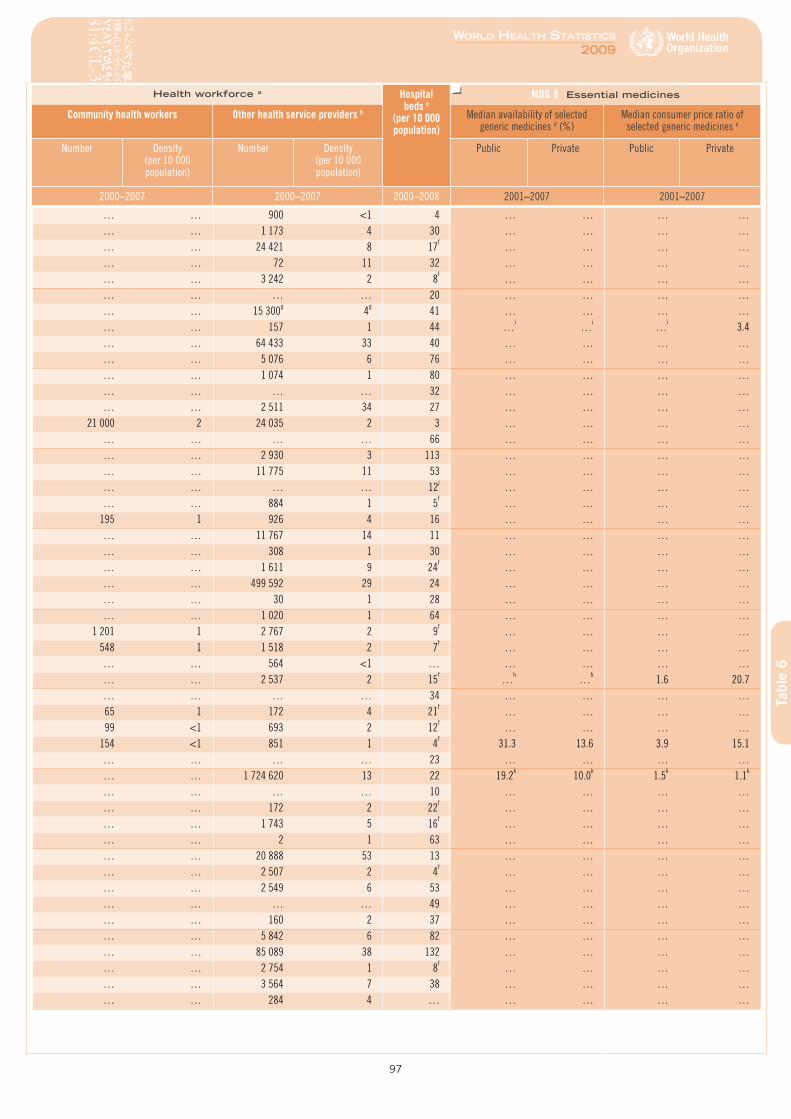
6. Health workforce, infrastructure, essential medicines
97
World HealtH StatiSticS
2009
Tabl
e 6
Health workforce a Hospital beds c
(per 10 000 population)
MDG 8 Essential medicines
Community health workers Other health service providers b Median availability of selected generic medicines d (%)
Median consumer price ratio of selected generic medicines e
Number Density (per 10 000 population)
Number Density (per 10 000 population)
Public Private Public Private
2000–2007 2000–2007 2000–2008 2001–2007 2001–2007
… … 900 <1 4 … … … …… … 1 173 4 30 … … … …… … 24 421 8 17f … … … …… … 72 11 32 … … … …… … 3 242 2 8f … … … …… … … … 20 … … … …… … 15 300g 4g 41 … … … …… … 157 1 44 …i …i …i 3.4… … 64 433 33 40 … … … …… … 5 076 6 76 … … … …… … 1 074 1 80 … … … …… … … … 32 … … … …… … 2 511 34 27 … … … …
21 000 2 24 035 2 3 … … … …… … … … 66 … … … …… … 2 930 3 113 … … … …… … 11 775 11 53 … … … …… … … … 12j … … … …… … 884 1 5f … … … …
195 1 926 4 16 … … … …… … 11 767 14 11 … … … …… … 308 1 30 … … … …… … 1 611 9 24f … … … …… … 499 592 29 24 … … … …… … 30 1 28 … … … …… … 1 020 1 64 … … … …
1 201 1 2 767 2 9f … … … … 548 1 1 518 2 7f … … … …
… … 564 <1 … … … … …… … 2 537 2 15f …h …h 1.6 20.7… … … … 34 … … … …
65 1 172 4 21f … … … … 99 <1 693 2 12f … … … …
154 <1 851 1 4f 31.3 13.6 3.9 15.1… … … … 23 … … … …… … 1 724 620 13 22 19.2k 10.0k 1.5k 1.1k
… … … … 10 … … … …… … 172 2 22f … … … …… … 1 743 5 16f … … … …… … 2 1 63 … … … …… … 20 888 53 13 … … … …… … 2 507 2 4f … … … …… … 2 549 6 53 … … … …… … … … 49 … … … …… … 160 2 37 … … … …… … 5 842 6 82 … … … …… … 85 089 38 132 … … … …… … 2 754 1 8f … … … …… … 3 564 7 38 … … … …… … 284 4 … … … … …
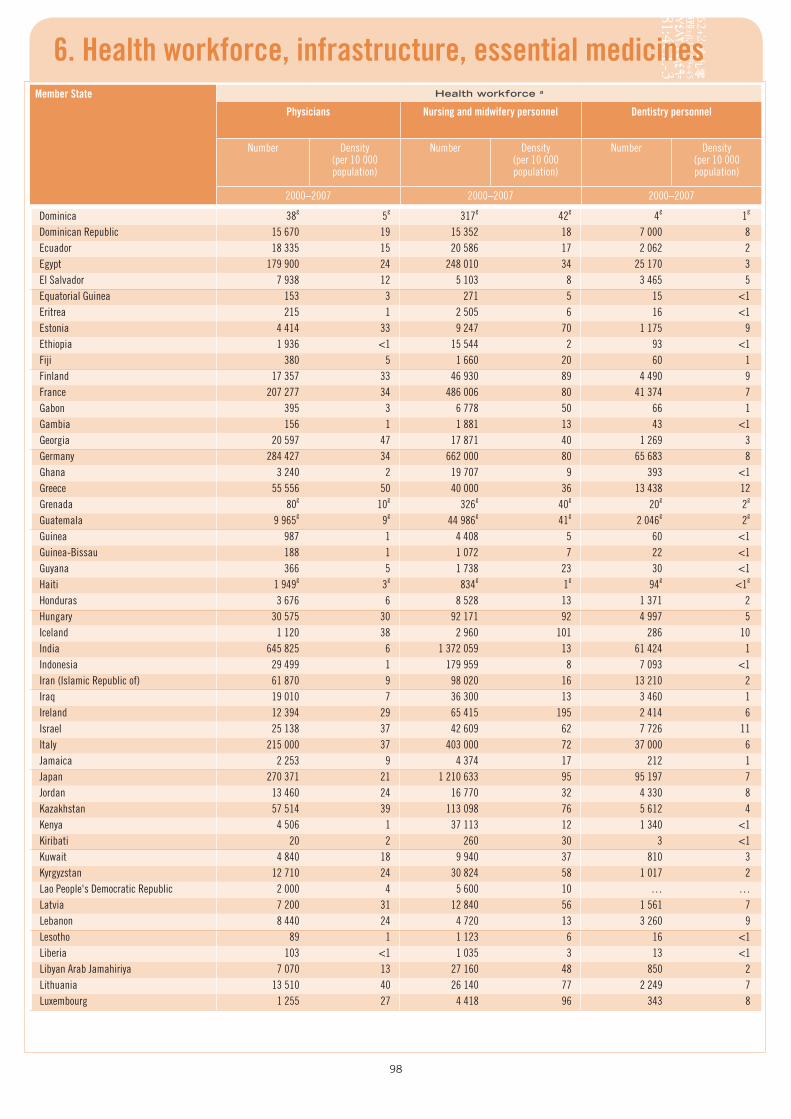
98
6. Health workforce, infrastructure, essential medicinesMember State Health workforce a
Physicians Nursing and midwifery personnel Dentistry personnel
Number Density (per 10 000 population)
Number Density (per 10 000 population)
Number Density (per 10 000 population)
2000–2007 2000–2007 2000–2007
Dominica 38g 5g 317g 42g 4g 1g
Dominican Republic 15 670 19 15 352 18 7 000 8Ecuador 18 335 15 20 586 17 2 062 2Egypt 179 900 24 248 010 34 25 170 3El Salvador 7 938 12 5 103 8 3 465 5Equatorial Guinea 153 3 271 5 15 <1Eritrea 215 1 2 505 6 16 <1Estonia 4 414 33 9 247 70 1 175 9Ethiopia 1 936 <1 15 544 2 93 <1Fiji 380 5 1 660 20 60 1Finland 17 357 33 46 930 89 4 490 9France 207 277 34 486 006 80 41 374 7Gabon 395 3 6 778 50 66 1Gambia 156 1 1 881 13 43 <1Georgia 20 597 47 17 871 40 1 269 3Germany 284 427 34 662 000 80 65 683 8Ghana 3 240 2 19 707 9 393 <1Greece 55 556 50 40 000 36 13 438 12Grenada 80g 10g 326g 40g 20g 2g
Guatemala 9 965g 9g 44 986g 41g 2 046g 2g
Guinea 987 1 4 408 5 60 <1Guinea-Bissau 188 1 1 072 7 22 <1Guyana 366 5 1 738 23 30 <1Haiti 1 949g 3g 834g 1g 94g <1g
Honduras 3 676 6 8 528 13 1 371 2Hungary 30 575 30 92 171 92 4 997 5Iceland 1 120 38 2 960 101 286 10India 645 825 6 1 372 059 13 61 424 1Indonesia 29 499 1 179 959 8 7 093 <1Iran (Islamic Republic of) 61 870 9 98 020 16 13 210 2Iraq 19 010 7 36 300 13 3 460 1Ireland 12 394 29 65 415 195 2 414 6Israel 25 138 37 42 609 62 7 726 11Italy 215 000 37 403 000 72 37 000 6Jamaica 2 253 9 4 374 17 212 1Japan 270 371 21 1 210 633 95 95 197 7Jordan 13 460 24 16 770 32 4 330 8Kazakhstan 57 514 39 113 098 76 5 612 4Kenya 4 506 1 37 113 12 1 340 <1Kiribati 20 2 260 30 3 <1Kuwait 4 840 18 9 940 37 810 3Kyrgyzstan 12 710 24 30 824 58 1 017 2Lao People's Democratic Republic 2 000 4 5 600 10 … …Latvia 7 200 31 12 840 56 1 561 7Lebanon 8 440 24 4 720 13 3 260 9Lesotho 89 1 1 123 6 16 <1Liberia 103 <1 1 035 3 13 <1Libyan Arab Jamahiriya 7 070 13 27 160 48 850 2Lithuania 13 510 40 26 140 77 2 249 7Luxembourg 1 255 27 4 418 96 343 8
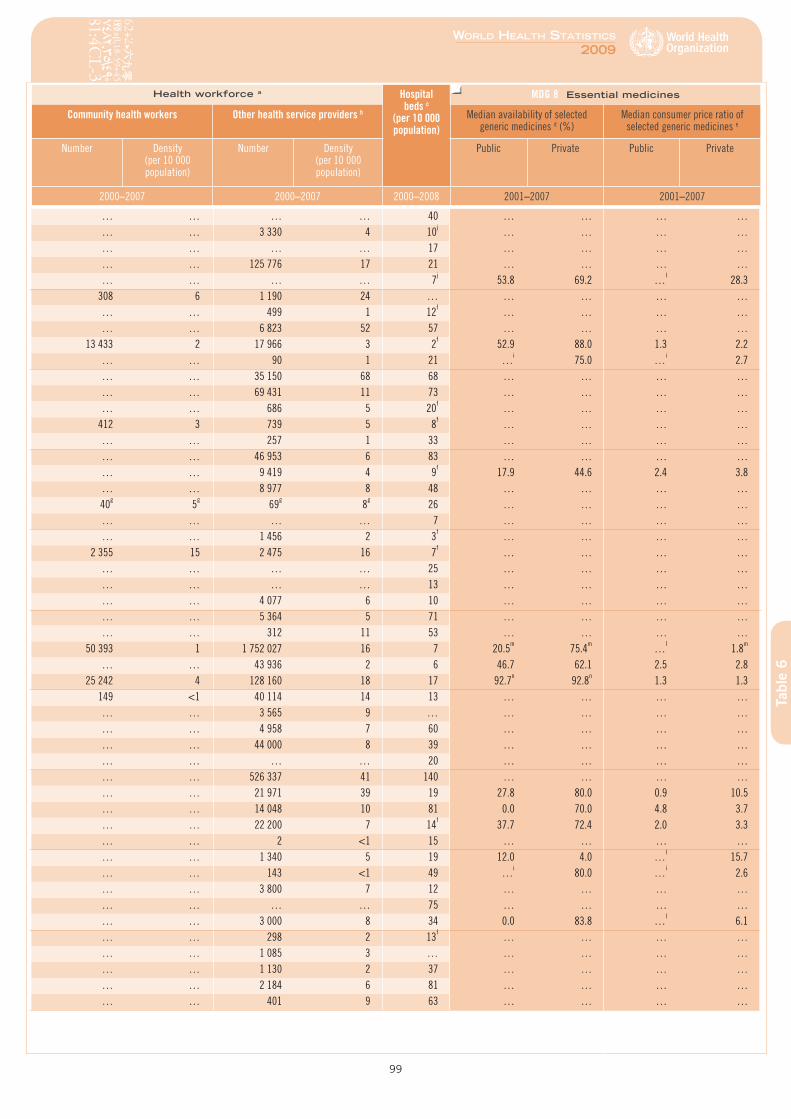
6. Health workforce, infrastructure, essential medicines
99
World HealtH StatiSticS
2009
Tabl
e 6
Health workforce a Hospital beds c
(per 10 000 population)
MDG 8 Essential medicines
Community health workers Other health service providers b Median availability of selected generic medicines d (%)
Median consumer price ratio of selected generic medicines e
Number Density (per 10 000 population)
Number Density (per 10 000 population)
Public Private Public Private
2000–2007 2000–2007 2000–2008 2001–2007 2001–2007
… … … … 40 … … … …… … 3 330 4 10j … … … …… … … … 17 … … … …… … 125 776 17 21 … … … …… … … … 7j 53.8 69.2 …l 28.3
308 6 1 190 24 … … … … …… … 499 1 12f … … … …… … 6 823 52 57 … … … …
13 433 2 17 966 3 2f 52.9 88.0 1.3 2.2… … 90 1 21 …i 75.0 …i 2.7… … 35 150 68 68 … … … …… … 69 431 11 73 … … … …… … 686 5 20f … … … …
412 3 739 5 8f … … … …… … 257 1 33 … … … …… … 46 953 6 83 … … … …… … 9 419 4 9f 17.9 44.6 2.4 3.8… … 8 977 8 48 … … … …40g 5g 69g 8g 26 … … … …… … … … 7 … … … …… … 1 456 2 3f … … … …
2 355 15 2 475 16 7f … … … …… … … … 25 … … … …… … … … 13 … … … …… … 4 077 6 10 … … … …… … 5 364 5 71 … … … …… … 312 11 53 … … … …
50 393 1 1 752 027 16 7 20.5m 75.4m …l 1.8m
… … 43 936 2 6 46.7 62.1 2.5 2.8 25 242 4 128 160 18 17 92.7n 92.8n 1.3 1.3
149 <1 40 114 14 13 … … … …… … 3 565 9 … … … … …… … 4 958 7 60 … … … …… … 44 000 8 39 … … … …… … … … 20 … … … …… … 526 337 41 140 … … … …… … 21 971 39 19 27.8 80.0 0.9 10.5… … 14 048 10 81 0.0 70.0 4.8 3.7… … 22 200 7 14f 37.7 72.4 2.0 3.3… … 2 <1 15 … … … …… … 1 340 5 19 12.0 4.0 …l 15.7… … 143 <1 49 …i 80.0 …i 2.6… … 3 800 7 12 … … … …… … … … 75 … … … …… … 3 000 8 34 0.0 83.8 …l 6.1… … 298 2 13f … … … …… … 1 085 3 … … … … …… … 1 130 2 37 … … … …… … 2 184 6 81 … … … …… … 401 9 63 … … … …
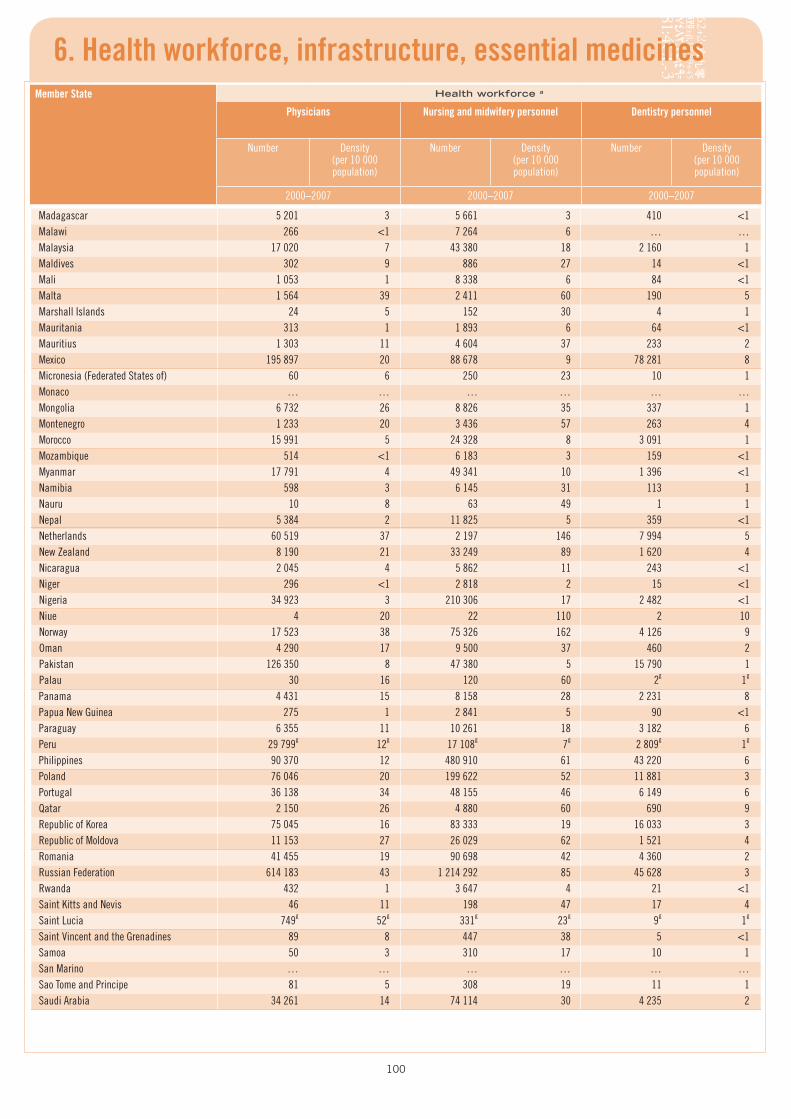
100
6. Health workforce, infrastructure, essential medicinesMember State Health workforce a
Physicians Nursing and midwifery personnel Dentistry personnel
Number Density (per 10 000 population)
Number Density (per 10 000 population)
Number Density (per 10 000 population)
2000–2007 2000–2007 2000–2007
Madagascar 5 201 3 5 661 3 410 <1Malawi 266 <1 7 264 6 … …Malaysia 17 020 7 43 380 18 2 160 1Maldives 302 9 886 27 14 <1Mali 1 053 1 8 338 6 84 <1Malta 1 564 39 2 411 60 190 5Marshall Islands 24 5 152 30 4 1Mauritania 313 1 1 893 6 64 <1Mauritius 1 303 11 4 604 37 233 2Mexico 195 897 20 88 678 9 78 281 8Micronesia (Federated States of) 60 6 250 23 10 1Monaco … … … … … …Mongolia 6 732 26 8 826 35 337 1Montenegro 1 233 20 3 436 57 263 4Morocco 15 991 5 24 328 8 3 091 1Mozambique 514 <1 6 183 3 159 <1Myanmar 17 791 4 49 341 10 1 396 <1Namibia 598 3 6 145 31 113 1Nauru 10 8 63 49 1 1Nepal 5 384 2 11 825 5 359 <1Netherlands 60 519 37 2 197 146 7 994 5New Zealand 8 190 21 33 249 89 1 620 4Nicaragua 2 045 4 5 862 11 243 <1Niger 296 <1 2 818 2 15 <1Nigeria 34 923 3 210 306 17 2 482 <1Niue 4 20 22 110 2 10Norway 17 523 38 75 326 162 4 126 9Oman 4 290 17 9 500 37 460 2Pakistan 126 350 8 47 380 5 15 790 1Palau 30 16 120 60 2g 1g
Panama 4 431 15 8 158 28 2 231 8Papua New Guinea 275 1 2 841 5 90 <1Paraguay 6 355 11 10 261 18 3 182 6Peru 29 799g 12g 17 108g 7g 2 809g 1g
Philippines 90 370 12 480 910 61 43 220 6Poland 76 046 20 199 622 52 11 881 3Portugal 36 138 34 48 155 46 6 149 6Qatar 2 150 26 4 880 60 690 9Republic of Korea 75 045 16 83 333 19 16 033 3Republic of Moldova 11 153 27 26 029 62 1 521 4Romania 41 455 19 90 698 42 4 360 2Russian Federation 614 183 43 1 214 292 85 45 628 3Rwanda 432 1 3 647 4 21 <1Saint Kitts and Nevis 46 11 198 47 17 4Saint Lucia 749g 52g 331g 23g 9g 1g
Saint Vincent and the Grenadines 89 8 447 38 5 <1Samoa 50 3 310 17 10 1San Marino … … … … … …Sao Tome and Principe 81 5 308 19 11 1Saudi Arabia 34 261 14 74 114 30 4 235 2
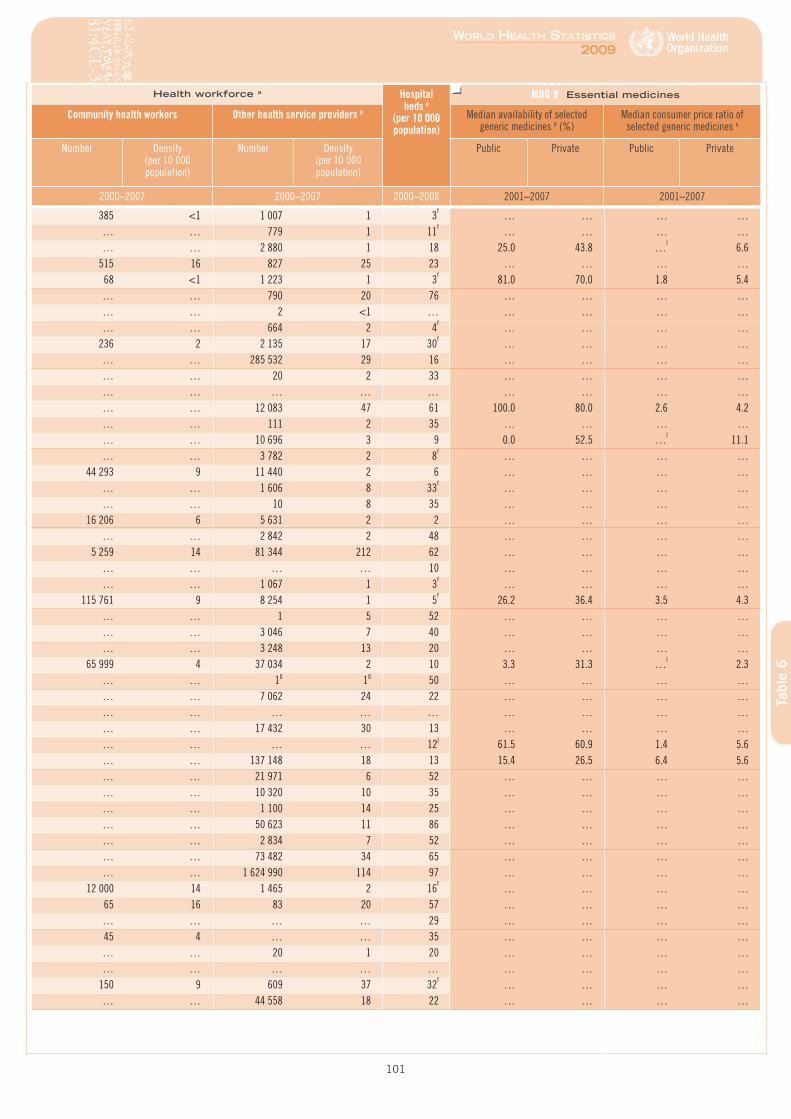
6. Health workforce, infrastructure, essential medicines
101
World HealtH StatiSticS
2009
Tabl
e 6
Health workforce a Hospital beds c
(per 10 000 population)
MDG 8 Essential medicines
Community health workers Other health service providers b Median availability of selected generic medicines d (%)
Median consumer price ratio of selected generic medicines e
Number Density (per 10 000 population)
Number Density (per 10 000 population)
Public Private Public Private
2000–2007 2000–2007 2000–2008 2001–2007 2001–2007
385 <1 1 007 1 3f … … … …… … 779 1 11f … … … …… … 2 880 1 18 25.0 43.8 …l 6.6
515 16 827 25 23 … … … … 68 <1 1 223 1 3f 81.0 70.0 1.8 5.4… … 790 20 76 … … … …… … 2 <1 … … … … …… … 664 2 4f … … … …
236 2 2 135 17 30f … … … …… … 285 532 29 16 … … … …… … 20 2 33 … … … …… … … … … … … … …… … 12 083 47 61 100.0 80.0 2.6 4.2… … 111 2 35 … … … …… … 10 696 3 9 0.0 52.5 …l 11.1… … 3 782 2 8f … … … …
44 293 9 11 440 2 6 … … … …… … 1 606 8 33f … … … …… … 10 8 35 … … … …
16 206 6 5 631 2 2 … … … …… … 2 842 2 48 … … … …
5 259 14 81 344 212 62 … … … …… … … … 10 … … … …… … 1 067 1 3f … … … …
115 761 9 8 254 1 5f 26.2 36.4 3.5 4.3… … 1 5 52 … … … …… … 3 046 7 40 … … … …… … 3 248 13 20 … … … …
65 999 4 37 034 2 10 3.3 31.3 …l 2.3… … 1g 1g 50 … … … …… … 7 062 24 22 … … … …… … … … … … … … …… … 17 432 30 13 … … … …… … … … 12j 61.5 60.9 1.4 5.6… … 137 148 18 13 15.4 26.5 6.4 5.6… … 21 971 6 52 … … … …… … 10 320 10 35 … … … …… … 1 100 14 25 … … … …… … 50 623 11 86 … … … …… … 2 834 7 52 … … … …… … 73 482 34 65 … … … …… … 1 624 990 114 97 … … … …
12 000 14 1 465 2 16f … … … … 65 16 83 20 57 … … … …… … … … 29 … … … …
45 4 … … 35 … … … …… … 20 1 20 … … … …… … … … … … … … …
150 9 609 37 32f … … … …… … 44 558 18 22 … … … …
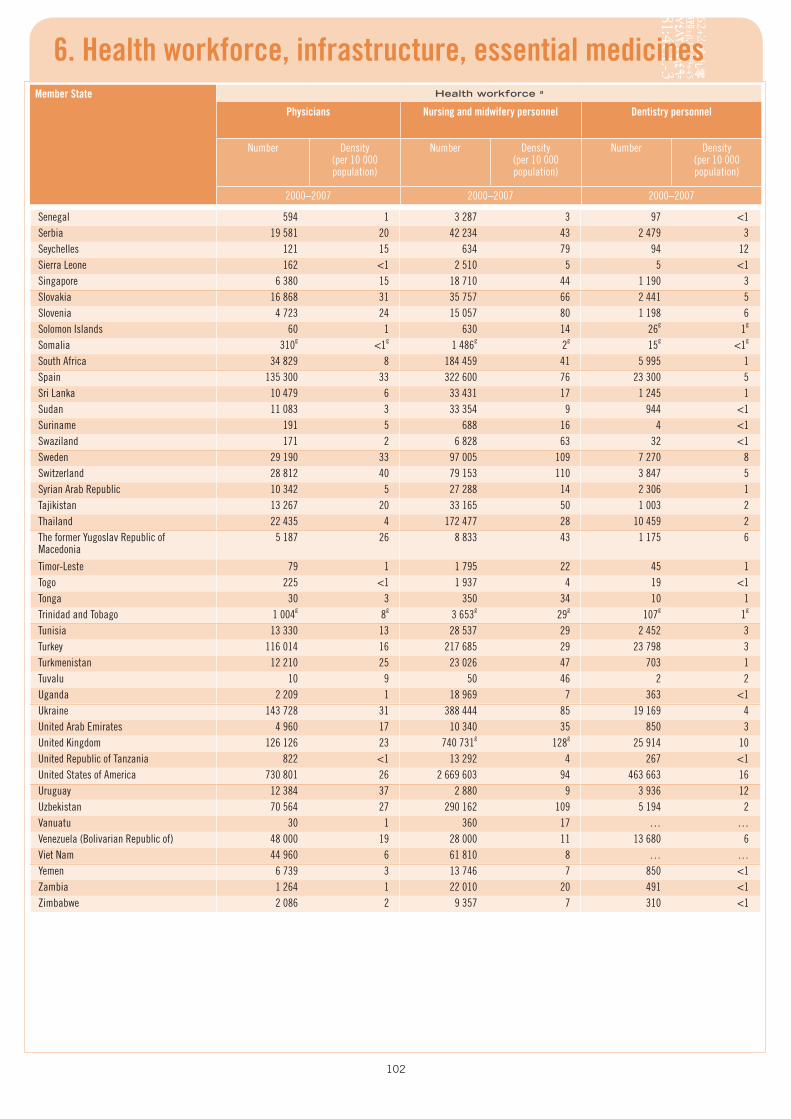
102
6. Health workforce, infrastructure, essential medicinesMember State Health workforce a
Physicians Nursing and midwifery personnel Dentistry personnel
Number Density (per 10 000 population)
Number Density (per 10 000 population)
Number Density (per 10 000 population)
2000–2007 2000–2007 2000–2007
Senegal 594 1 3 287 3 97 <1Serbia 19 581 20 42 234 43 2 479 3Seychelles 121 15 634 79 94 12Sierra Leone 162 <1 2 510 5 5 <1Singapore 6 380 15 18 710 44 1 190 3Slovakia 16 868 31 35 757 66 2 441 5Slovenia 4 723 24 15 057 80 1 198 6Solomon Islands 60 1 630 14 26g 1g
Somalia 310g <1g 1 486g 2g 15g <1g
South Africa 34 829 8 184 459 41 5 995 1Spain 135 300 33 322 600 76 23 300 5Sri Lanka 10 479 6 33 431 17 1 245 1Sudan 11 083 3 33 354 9 944 <1Suriname 191 5 688 16 4 <1Swaziland 171 2 6 828 63 32 <1Sweden 29 190 33 97 005 109 7 270 8Switzerland 28 812 40 79 153 110 3 847 5Syrian Arab Republic 10 342 5 27 288 14 2 306 1Tajikistan 13 267 20 33 165 50 1 003 2Thailand 22 435 4 172 477 28 10 459 2The former Yugoslav Republic of Macedonia
5 187 26 8 833 43 1 175 6
Timor-Leste 79 1 1 795 22 45 1Togo 225 <1 1 937 4 19 <1Tonga 30 3 350 34 10 1Trinidad and Tobago 1 004g 8g 3 653g 29g 107g 1g
Tunisia 13 330 13 28 537 29 2 452 3Turkey 116 014 16 217 685 29 23 798 3Turkmenistan 12 210 25 23 026 47 703 1Tuvalu 10 9 50 46 2 2Uganda 2 209 1 18 969 7 363 <1Ukraine 143 728 31 388 444 85 19 169 4United Arab Emirates 4 960 17 10 340 35 850 3United Kingdom 126 126 23 740 731g 128g 25 914 10United Republic of Tanzania 822 <1 13 292 4 267 <1United States of America 730 801 26 2 669 603 94 463 663 16Uruguay 12 384 37 2 880 9 3 936 12Uzbekistan 70 564 27 290 162 109 5 194 2Vanuatu 30 1 360 17 … …Venezuela (Bolivarian Republic of) 48 000 19 28 000 11 13 680 6Viet Nam 44 960 6 61 810 8 … …Yemen 6 739 3 13 746 7 850 <1Zambia 1 264 1 22 010 20 491 <1Zimbabwe 2 086 2 9 357 7 310 <1
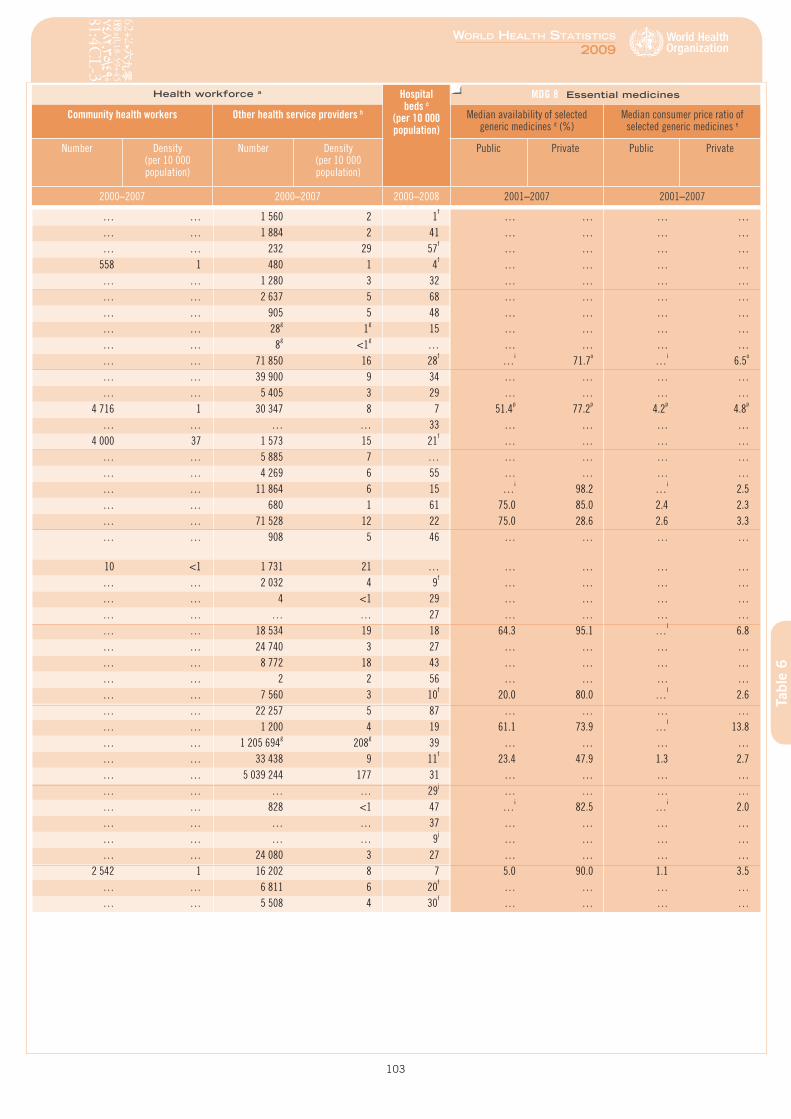
6. Health workforce, infrastructure, essential medicines
103
World HealtH StatiSticS
2009
Tabl
e 6
Health workforce a Hospital beds c
(per 10 000 population)
MDG 8 Essential medicines
Community health workers Other health service providers b Median availability of selected generic medicines d (%)
Median consumer price ratio of selected generic medicines e
Number Density (per 10 000 population)
Number Density (per 10 000 population)
Public Private Public Private
2000–2007 2000–2007 2000–2008 2001–2007 2001–2007
… … 1 560 2 1f … … … …… … 1 884 2 41 … … … …… … 232 29 57f … … … …
558 1 480 1 4f … … … …… … 1 280 3 32 … … … …… … 2 637 5 68 … … … …… … 905 5 48 … … … …… … 28g 1g 15 … … … …… … 8g <1g … … … … …… … 71 850 16 28f …i 71.7o …i 6.5o
… … 39 900 9 34 … … … …… … 5 405 3 29 … … … …
4 716 1 30 347 8 7 51.4p 77.2p 4.2p 4.8p
… … … … 33 … … … … 4 000 37 1 573 15 21f … … … …
… … 5 885 7 … … … … …… … 4 269 6 55 … … … …… … 11 864 6 15 …i 98.2 …i 2.5… … 680 1 61 75.0 85.0 2.4 2.3… … 71 528 12 22 75.0 28.6 2.6 3.3… … 908 5 46 … … … …
10 <1 1 731 21 … … … … …… … 2 032 4 9f … … … …… … 4 <1 29 … … … …… … … … 27 … … … …… … 18 534 19 18 64.3 95.1 …l 6.8… … 24 740 3 27 … … … …… … 8 772 18 43 … … … …… … 2 2 56 … … … …… … 7 560 3 10f 20.0 80.0 …l 2.6… … 22 257 5 87 … … … …… … 1 200 4 19 61.1 73.9 …l 13.8… … 1 205 694g 208g 39 … … … …… … 33 438 9 11f 23.4 47.9 1.3 2.7… … 5 039 244 177 31 … … … …… … … … 29j … … … …… … 828 <1 47 …i 82.5 …i 2.0… … … … 37 … … … …… … … … 9j … … … …… … 24 080 3 27 … … … …
2 542 1 16 202 8 7 5.0 90.0 1.1 3.5… … 6 811 6 20f … … … …… … 5 508 4 30f … … … …
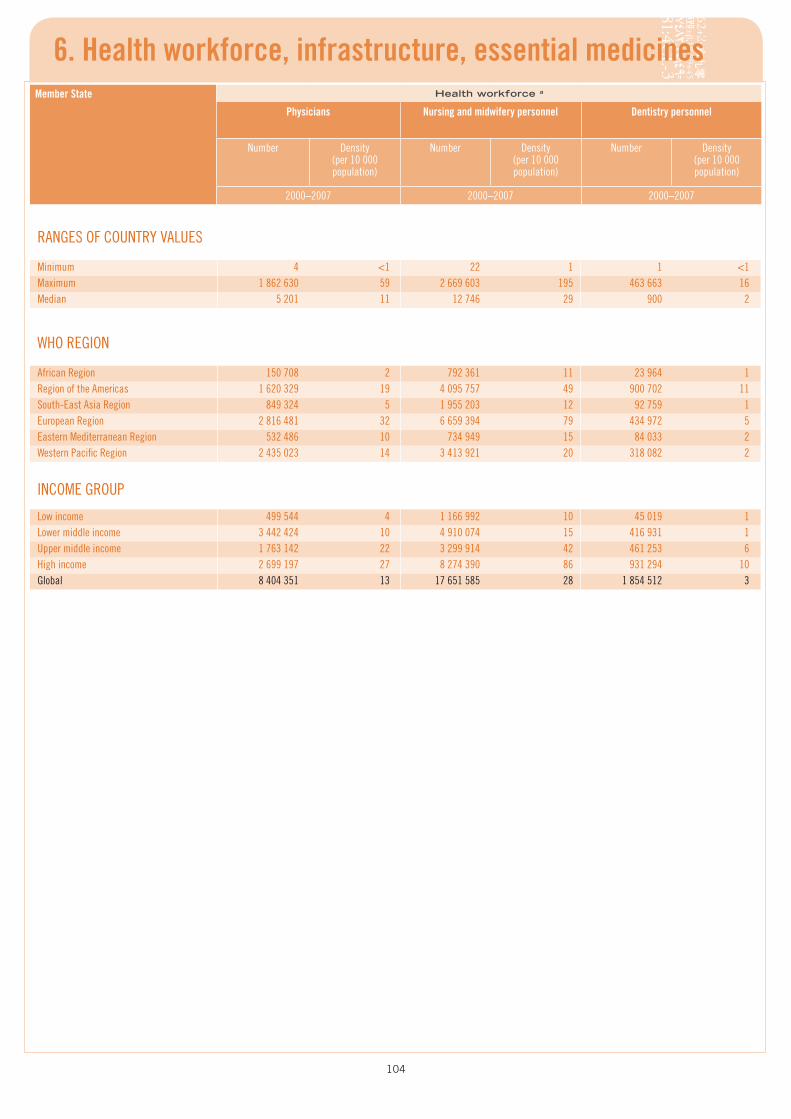
104
6. Health workforce, infrastructure, essential medicinesMember State Health workforce a
Physicians Nursing and midwifery personnel Dentistry personnel
Number Density (per 10 000 population)
Number Density (per 10 000 population)
Number Density (per 10 000 population)
2000–2007 2000–2007 2000–2007
RANGES OF COUNTRY VALUES
Minimum 4 <1 22 1 1 <1Maximum 1 862 630 59 2 669 603 195 463 663 16Median 5 201 11 12 746 29 900 2
WHO REGION
African Region 150 708 2 792 361 11 23 964 1Region of the Americas 1 620 329 19 4 095 757 49 900 702 11South-East Asia Region 849 324 5 1 955 203 12 92 759 1European Region 2 816 481 32 6 659 394 79 434 972 5Eastern Mediterranean Region 532 486 10 734 949 15 84 033 2Western Pacific Region 2 435 023 14 3 413 921 20 318 082 2
INCOME GROUP
Low income 499 544 4 1 166 992 10 45 019 1Lower middle income 3 442 424 10 4 910 074 15 416 931 1Upper middle income 1 763 142 22 3 299 914 42 461 253 6High income 2 699 197 27 8 274 390 86 931 294 10Global 8 404 351 13 17 651 585 28 1 854 512 3
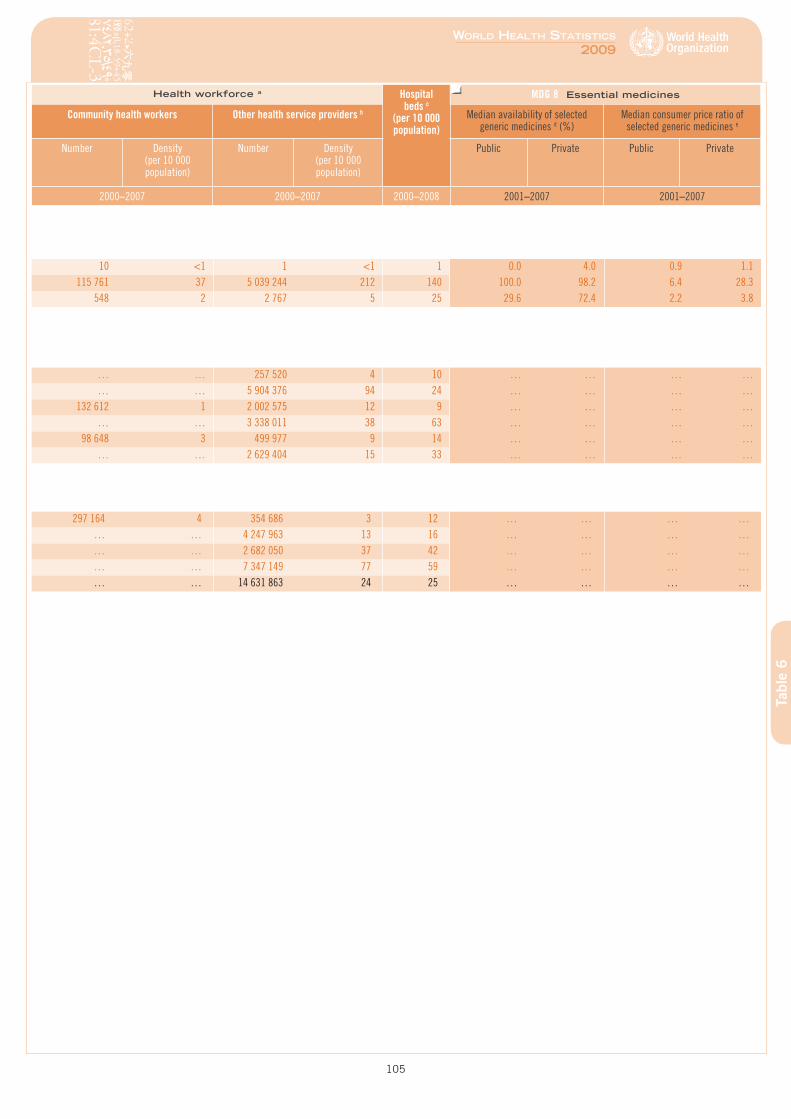
6. Health workforce, infrastructure, essential medicines
105
World HealtH StatiSticS
2009
Tabl
e 6
Health workforce a Hospital beds c
(per 10 000 population)
MDG 8 Essential medicines
Community health workers Other health service providers b Median availability of selected generic medicines d (%)
Median consumer price ratio of selected generic medicines e
Number Density (per 10 000 population)
Number Density (per 10 000 population)
Public Private Public Private
2000–2007 2000–2007 2000–2008 2001–2007 2001–2007
10 <1 1 <1 1 0.0 4.0 0.9 1.1 115 761 37 5 039 244 212 140 100.0 98.2 6.4 28.3
548 2 2 767 5 25 29.6 72.4 2.2 3.8
… … 257 520 4 10 … … … …… … 5 904 376 94 24 … … … …
132 612 1 2 002 575 12 9 … … … …… … 3 338 011 38 63 … … … …
98 648 3 499 977 9 14 … … … …… … 2 629 404 15 33 … … … …
297 164 4 354 686 3 12 … … … …… … 4 247 963 13 16 … … … …… … 2 682 050 37 42 … … … …… … 7 347 149 77 59 … … … …… … 14 631 863 24 25 … … … …

World HealtH StatiSticS
2009
107
Health expenditureGlobally in 2006, expenditure on health was about 8.7% of gross domestic product, with the highest level in the Americas at 12.8% and the lowest in the South-East Asia Region at 3.4%. This translates to about US$ 716 per capita on the average but there is tremendous variation ranging from a very low US$ 31 per capita in the South-East Asia Region to a high of US$ 2636 per capita in the Americas.
The share of government in health spending varies from 76% in Europe to 34% in South-East Asia. Where government expenditure in health is low, the shortfall is made up in low-income countries by private spending, about 85% of which is out of pocket. This means that payment is made at the point of accessing health services. Such payment does not allow for pooling of risks and leads to a high probability of catastrophic payments that can result in poverty for the household.
External resources are becoming a major source of health funding in low-income countries. From a share of 12% of total health expenditure in 2000, external resources represented 17% of low-income country health expenditure in 2006. Some low-income countries have two thirds of their total health expenditure funded by external resources. In these situations, predictability of aid is an important concern.
These data are generated from sources that WHO has been collecting for over 10 years. The most comprehensive and consistent data on health financing are generated from national health accounts that collect expenditure information within an internationally recognized framework. National health accounts trace the financing as it flows from sources which provide the funds to agents who decide on the use of the funds to providers and beneficiaries of health services. Not all countries have or update national health accounts and, in these instances, data are obtained through technical contacts in country or from publicly available documents and reports. Missing values are estimated using various accounting techniques depending on the data available for each country. WHO sends all such estimates to the respective ministries of health every year for validation.
Tabl
e 7
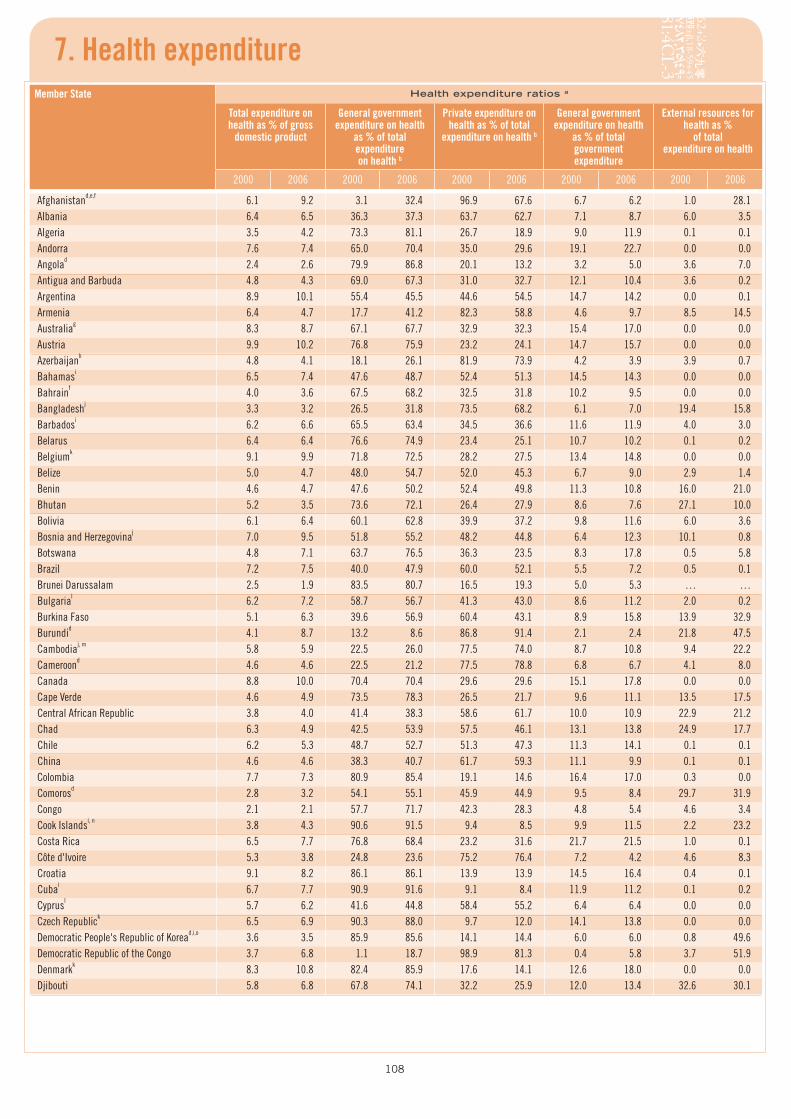
108
7. Health expenditureMember State Health expenditure ratios a
Total expenditure on health as % of gross
domestic product
General government expenditure on health
as % of total expenditure on health b
Private expenditure on health as % of total
expenditure on health b
General government expenditure on health
as % of total government expenditure
External resources for health as %
of total expenditure on health
2000 2006 2000 2006 2000 2006 2000 2006 2000 2006
Afghanistand,e,f 6.1 9.2 3.1 32.4 96.9 67.6 6.7 6.2 1.0 28.1Albania 6.4 6.5 36.3 37.3 63.7 62.7 7.1 8.7 6.0 3.5Algeria 3.5 4.2 73.3 81.1 26.7 18.9 9.0 11.9 0.1 0.1Andorra 7.6 7.4 65.0 70.4 35.0 29.6 19.1 22.7 0.0 0.0Angolad 2.4 2.6 79.9 86.8 20.1 13.2 3.2 5.0 3.6 7.0Antigua and Barbuda 4.8 4.3 69.0 67.3 31.0 32.7 12.1 10.4 3.6 0.2Argentina 8.9 10.1 55.4 45.5 44.6 54.5 14.7 14.2 0.0 0.1Armenia 6.4 4.7 17.7 41.2 82.3 58.8 4.6 9.7 8.5 14.5Australiag 8.3 8.7 67.1 67.7 32.9 32.3 15.4 17.0 0.0 0.0Austria 9.9 10.2 76.8 75.9 23.2 24.1 14.7 15.7 0.0 0.0Azerbaijanh 4.8 4.1 18.1 26.1 81.9 73.9 4.2 3.9 3.9 0.7Bahamasi 6.5 7.4 47.6 48.7 52.4 51.3 14.5 14.3 0.0 0.0Bahrainf 4.0 3.6 67.5 68.2 32.5 31.8 10.2 9.5 0.0 0.0Bangladeshj 3.3 3.2 26.5 31.8 73.5 68.2 6.1 7.0 19.4 15.8Barbadosi 6.2 6.6 65.5 63.4 34.5 36.6 11.6 11.9 4.0 3.0Belarus 6.4 6.4 76.6 74.9 23.4 25.1 10.7 10.2 0.1 0.2Belgiumk 9.1 9.9 71.8 72.5 28.2 27.5 13.4 14.8 0.0 0.0Belize 5.0 4.7 48.0 54.7 52.0 45.3 6.7 9.0 2.9 1.4Benin 4.6 4.7 47.6 50.2 52.4 49.8 11.3 10.8 16.0 21.0Bhutan 5.2 3.5 73.6 72.1 26.4 27.9 8.6 7.6 27.1 10.0Bolivia 6.1 6.4 60.1 62.8 39.9 37.2 9.8 11.6 6.0 3.6Bosnia and Herzegovinaj 7.0 9.5 51.8 55.2 48.2 44.8 6.4 12.3 10.1 0.8Botswana 4.8 7.1 63.7 76.5 36.3 23.5 8.3 17.8 0.5 5.8Brazil 7.2 7.5 40.0 47.9 60.0 52.1 5.5 7.2 0.5 0.1Brunei Darussalam 2.5 1.9 83.5 80.7 16.5 19.3 5.0 5.3 … …Bulgarial 6.2 7.2 58.7 56.7 41.3 43.0 8.6 11.2 2.0 0.2Burkina Faso 5.1 6.3 39.6 56.9 60.4 43.1 8.9 15.8 13.9 32.9Burundid 4.1 8.7 13.2 8.6 86.8 91.4 2.1 2.4 21.8 47.5Cambodiaj, m 5.8 5.9 22.5 26.0 77.5 74.0 8.7 10.8 9.4 22.2Cameroond 4.6 4.6 22.5 21.2 77.5 78.8 6.8 6.7 4.1 8.0Canada 8.8 10.0 70.4 70.4 29.6 29.6 15.1 17.8 0.0 0.0Cape Verde 4.6 4.9 73.5 78.3 26.5 21.7 9.6 11.1 13.5 17.5Central African Republic 3.8 4.0 41.4 38.3 58.6 61.7 10.0 10.9 22.9 21.2Chad 6.3 4.9 42.5 53.9 57.5 46.1 13.1 13.8 24.9 17.7Chile 6.2 5.3 48.7 52.7 51.3 47.3 11.3 14.1 0.1 0.1China 4.6 4.6 38.3 40.7 61.7 59.3 11.1 9.9 0.1 0.1Colombia 7.7 7.3 80.9 85.4 19.1 14.6 16.4 17.0 0.3 0.0Comorosd 2.8 3.2 54.1 55.1 45.9 44.9 9.5 8.4 29.7 31.9Congo 2.1 2.1 57.7 71.7 42.3 28.3 4.8 5.4 4.6 3.4Cook Islandsi, n 3.8 4.3 90.6 91.5 9.4 8.5 9.9 11.5 2.2 23.2Costa Rica 6.5 7.7 76.8 68.4 23.2 31.6 21.7 21.5 1.0 0.1Côte d'Ivoire 5.3 3.8 24.8 23.6 75.2 76.4 7.2 4.2 4.6 8.3Croatia 9.1 8.2 86.1 86.1 13.9 13.9 14.5 16.4 0.4 0.1Cubai 6.7 7.7 90.9 91.6 9.1 8.4 11.9 11.2 0.1 0.2Cyprusl 5.7 6.2 41.6 44.8 58.4 55.2 6.4 6.4 0.0 0.0Czech Republick 6.5 6.9 90.3 88.0 9.7 12.0 14.1 13.8 0.0 0.0Democratic People's Republic of Koread,i,o 3.6 3.5 85.9 85.6 14.1 14.4 6.0 6.0 0.8 49.6Democratic Republic of the Congo 3.7 6.8 1.1 18.7 98.9 81.3 0.4 5.8 3.7 51.9Denmarkk 8.3 10.8 82.4 85.9 17.6 14.1 12.6 18.0 0.0 0.0Djibouti 5.8 6.8 67.8 74.1 32.2 25.9 12.0 13.4 32.6 30.1
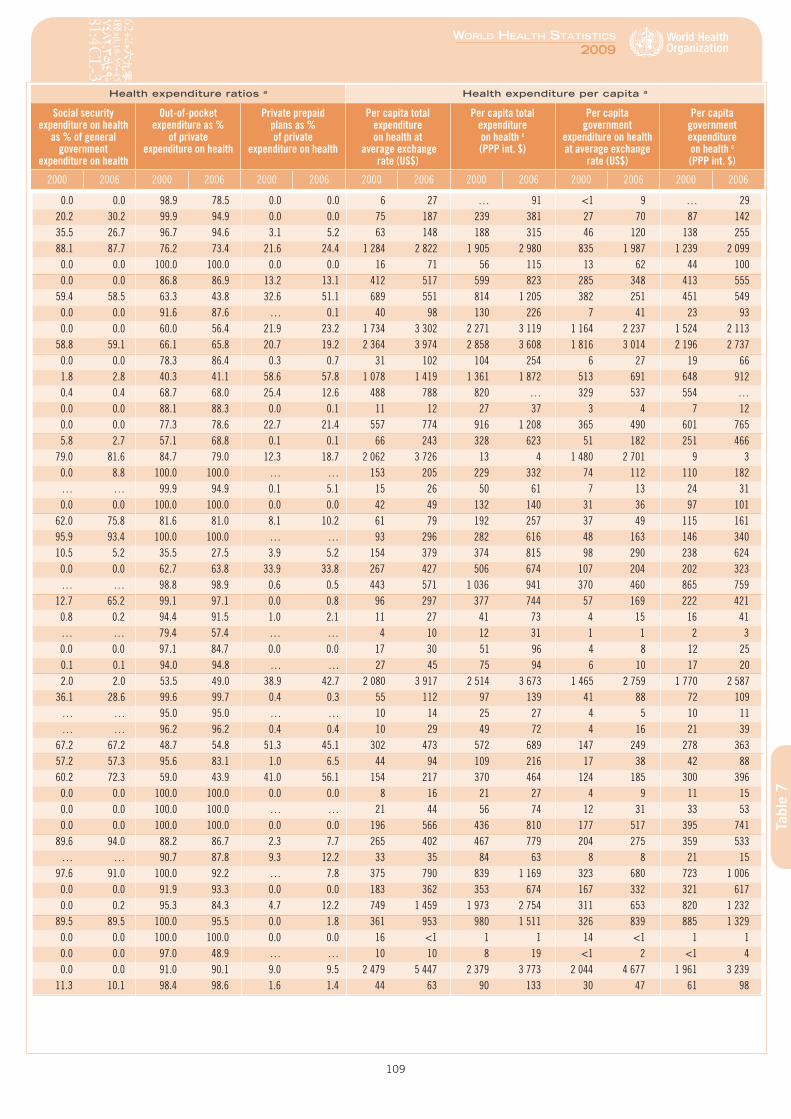
7. Health expenditure
109
World HealtH StatiSticS
2009
Tabl
e 7
Health expenditure ratios a Health expenditure per capita a
Social security expenditure on health
as % of general government
expenditure on health
Out-of-pocket expenditure as %
of private expenditure on health
Private prepaid plans as % of private
expenditure on health
Per capita total expenditure on health at
average exchange rate (US$)
Per capita total expenditure on health c (PPP int. $)
Per capita government
expenditure on health at average exchange
rate (US$)
Per capita government expenditure on health c (PPP int. $)
2000 2006 2000 2006 2000 2006 2000 2006 2000 2006 2000 2006 2000 2006
0.0 0.0 98.9 78.5 0.0 0.0 6 27 … 91 <1 9 … 2920.2 30.2 99.9 94.9 0.0 0.0 75 187 239 381 27 70 87 14235.5 26.7 96.7 94.6 3.1 5.2 63 148 188 315 46 120 138 25588.1 87.7 76.2 73.4 21.6 24.4 1 284 2 822 1 905 2 980 835 1 987 1 239 2 0990.0 0.0 100.0 100.0 0.0 0.0 16 71 56 115 13 62 44 1000.0 0.0 86.8 86.9 13.2 13.1 412 517 599 823 285 348 413 555
59.4 58.5 63.3 43.8 32.6 51.1 689 551 814 1 205 382 251 451 5490.0 0.0 91.6 87.6 … 0.1 40 98 130 226 7 41 23 930.0 0.0 60.0 56.4 21.9 23.2 1 734 3 302 2 271 3 119 1 164 2 237 1 524 2 113
58.8 59.1 66.1 65.8 20.7 19.2 2 364 3 974 2 858 3 608 1 816 3 014 2 196 2 7370.0 0.0 78.3 86.4 0.3 0.7 31 102 104 254 6 27 19 661.8 2.8 40.3 41.1 58.6 57.8 1 078 1 419 1 361 1 872 513 691 648 9120.4 0.4 68.7 68.0 25.4 12.6 488 788 820 … 329 537 554 …0.0 0.0 88.1 88.3 0.0 0.1 11 12 27 37 3 4 7 120.0 0.0 77.3 78.6 22.7 21.4 557 774 916 1 208 365 490 601 7655.8 2.7 57.1 68.8 0.1 0.1 66 243 328 623 51 182 251 466
79.0 81.6 84.7 79.0 12.3 18.7 2 062 3 726 13 4 1 480 2 701 9 30.0 8.8 100.0 100.0 … … 153 205 229 332 74 112 110 182… … 99.9 94.9 0.1 5.1 15 26 50 61 7 13 24 310.0 0.0 100.0 100.0 0.0 0.0 42 49 132 140 31 36 97 101
62.0 75.8 81.6 81.0 8.1 10.2 61 79 192 257 37 49 115 16195.9 93.4 100.0 100.0 … … 93 296 282 616 48 163 146 34010.5 5.2 35.5 27.5 3.9 5.2 154 379 374 815 98 290 238 6240.0 0.0 62.7 63.8 33.9 33.8 267 427 506 674 107 204 202 323… … 98.8 98.9 0.6 0.5 443 571 1 036 941 370 460 865 759
12.7 65.2 99.1 97.1 0.0 0.8 96 297 377 744 57 169 222 4210.8 0.2 94.4 91.5 1.0 2.1 11 27 41 73 4 15 16 41… … 79.4 57.4 … … 4 10 12 31 1 1 2 30.0 0.0 97.1 84.7 0.0 0.0 17 30 51 96 4 8 12 250.1 0.1 94.0 94.8 … … 27 45 75 94 6 10 17 202.0 2.0 53.5 49.0 38.9 42.7 2 080 3 917 2 514 3 673 1 465 2 759 1 770 2 587
36.1 28.6 99.6 99.7 0.4 0.3 55 112 97 139 41 88 72 109… … 95.0 95.0 … … 10 14 25 27 4 5 10 11… … 96.2 96.2 0.4 0.4 10 29 49 72 4 16 21 39
67.2 67.2 48.7 54.8 51.3 45.1 302 473 572 689 147 249 278 36357.2 57.3 95.6 83.1 1.0 6.5 44 94 109 216 17 38 42 8860.2 72.3 59.0 43.9 41.0 56.1 154 217 370 464 124 185 300 3960.0 0.0 100.0 100.0 0.0 0.0 8 16 21 27 4 9 11 150.0 0.0 100.0 100.0 … … 21 44 56 74 12 31 33 530.0 0.0 100.0 100.0 0.0 0.0 196 566 436 810 177 517 395 741
89.6 94.0 88.2 86.7 2.3 7.7 265 402 467 779 204 275 359 533… … 90.7 87.8 9.3 12.2 33 35 84 63 8 8 21 15
97.6 91.0 100.0 92.2 … 7.8 375 790 839 1 169 323 680 723 1 0060.0 0.0 91.9 93.3 0.0 0.0 183 362 353 674 167 332 321 6170.0 0.2 95.3 84.3 4.7 12.2 749 1 459 1 973 2 754 311 653 820 1 232
89.5 89.5 100.0 95.5 0.0 1.8 361 953 980 1 511 326 839 885 1 3290.0 0.0 100.0 100.0 0.0 0.0 16 <1 1 1 14 <1 1 10.0 0.0 97.0 48.9 … … 10 10 8 19 <1 2 <1 40.0 0.0 91.0 90.1 9.0 9.5 2 479 5 447 2 379 3 773 2 044 4 677 1 961 3 239
11.3 10.1 98.4 98.6 1.6 1.4 44 63 90 133 30 47 61 98
110
7. Health expenditureMember State Health expenditure ratios a
Total expenditure on health as % of gross
domestic product
General government expenditure on health
as % of total expenditure on health b
Private expenditure on health as % of total
expenditure on health b
General government expenditure on health
as % of total government expenditure
External resources for health as %
of total expenditure on health
2000 2006 2000 2006 2000 2006 2000 2006 2000 2006
Dominica 5.9 5.9 69.0 63.0 31.0 37.0 8.6 7.8 3.7 0.8Dominican Republic 6.3 5.6 34.5 37.0 65.5 63.0 15.9 10.4 2.0 1.9Ecuadorp 4.2 5.3 31.2 43.6 68.8 56.4 6.4 7.3 4.1 0.7Egypt 5.6 6.3 40.1 41.4 59.9 58.6 7.5 7.3 1.0 0.8El Salvador 8.0 6.6 45.2 61.8 54.8 38.2 14.3 15.7 0.9 3.2Equatorial Guinea 1.9 2.1 50.7 80.4 49.3 19.6 7.8 6.9 9.6 3.5Eritrea 5.5 3.6 49.7 45.9 50.3 54.1 4.0 4.2 24.7 37.6Estonial 5.3 5.2 77.5 73.3 22.5 26.7 11.3 11.1 0.9 0.6Ethiopia 4.3 3.9 53.6 59.3 46.4 40.7 8.5 10.0 16.4 42.7Fiji 4.7 3.7 69.0 69.8 31.0 30.2 10.3 8.4 6.2 2.1Finland 7.0 8.2 73.4 76.0 26.6 24.0 10.6 12.7 0.0 0.0France 10.1 11.0 79.4 79.7 20.6 20.3 15.5 16.7 0.0 0.0Gabond 4.5 4.5 67.9 73.0 32.1 27.0 14.0 14.0 1.5 1.8Gambia 4.4 5.0 44.6 56.8 55.4 43.2 8.8 11.2 29.5 34.7Georgiaj 7.4 8.4 16.7 21.5 83.3 78.5 6.4 5.6 5.1 6.7Germany 10.3 10.6 79.7 76.9 20.3 23.1 18.2 17.9 0.0 0.0Ghana 7.2 5.1 41.4 34.2 58.6 65.8 10.8 4.4 9.5 22.6Greece 7.9 9.5 60.0 62.0 40.0 38.0 8.6 11.6 … …Grenada 6.4 6.9 68.3 63.5 31.7 36.5 13.2 9.0 … 0.8Guatemala 5.5 5.3 39.8 37.7 60.2 62.3 16.7 14.7 3.4 1.0Guinea 5.3 5.8 12.4 14.1 87.6 85.9 4.0 4.7 9.0 11.8Guinea-Bissau 7.0 5.8 14.3 26.3 85.7 73.7 2.3 4.0 41.0 33.4Guyana 5.5 5.9 84.5 85.8 15.5 14.2 10.0 9.0 4.2 27.4Haiti 6.3 8.4 40.3 67.6 59.7 32.4 23.3 29.8 31.2 65.8Honduras 5.4 6.4 55.9 47.8 44.1 52.2 15.1 15.0 8.8 5.4Hungary 6.9 8.3 70.7 70.9 29.3 29.1 10.5 11.3 0.0 …Icelandk 9.6 9.1 81.0 82.0 19.0 18.0 18.4 18.0 0.0 0.0India 4.3 3.6 21.8 25.0 78.2 75.0 3.3 3.4 0.6 1.0Indonesiaj 1.6 2.5 38.3 50.5 61.7 49.5 3.8 6.2 10.8 2.2Iran (Islamic Republic of)r 5.9 6.8 37.0 50.7 63.0 49.3 9.6 11.5 0.0 0.1Iraqd,i,s 1.5 3.5 26.9 78.1 73.1 21.9 1.3 3.4 24.8 13.6Ireland 6.3 7.5 73.5 78.3 26.5 21.7 14.7 17.2 0.0 0.0Israel 7.8 8.0 62.8 56.0 37.2 44.0 10.2 9.9 2.6 2.3Italy 8.1 9.0 72.5 77.2 27.5 22.8 12.7 14.2 0.0 0.0Jamaica 6.2 4.7 52.6 53.1 47.4 46.9 6.6 4.2 1.8 1.7Japan 7.7 8.1 81.3 81.3 18.7 18.7 16.0 17.9 0.0 0.0Jordant 9.4 9.7 46.5 43.3 53.5 56.7 10.3 8.7 4.6 4.7Kazakhstan 4.2 3.6 51.0 64.3 49.0 35.7 9.2 10.4 7.4 0.3Kenya 4.5 4.6 48.2 47.8 51.8 52.2 11.6 9.7 8.3 14.9Kiribati 12.1 13.1 88.0 86.9 12.0 13.1 8.7 7.8 26.4 0.4Kuwait 3.1 2.2 78.1 78.2 21.9 21.8 8.8 4.9 0.0 0.0Kyrgyzstan 4.7 6.4 44.3 43.0 55.7 57.0 8.3 8.7 9.9 10.0Lao People's Democratic Republic 3.2 4.0 32.5 18.6 67.5 81.4 5.1 3.7 30.3 12.9Latvia 6.0 6.6 54.4 59.2 45.6 40.8 8.8 10.8 0.5 0.2Lebanon 10.9 8.8 30.0 44.3 70.0 55.7 7.8 11.3 2.1 1.9Lesotho 6.2 6.8 51.0 58.9 49.0 41.1 6.5 8.2 3.1 14.3Liberiad 3.7 4.8 17.8 25.8 82.2 74.2 4.4 9.8 13.9 50.7Libyan Arab Jamahiriyad 3.7 2.4 61.7 66.3 38.3 33.7 7.2 5.4 0.0 0.0Lithuanial 6.5 6.2 69.7 70.0 30.3 30.0 11.6 12.9 1.7 1.8Luxembourg 5.8 7.3 89.3 90.9 10.7 9.1 13.9 17.1 0.0 0.0
7. Health expenditure
111
World HealtH StatiSticS
2009
Tabl
e 7
Health expenditure ratios a Health expenditure per capita a
Social security expenditure on health
as % of general government
expenditure on health
Out-of-pocket expenditure as %
of private expenditure on health
Private prepaid plans as % of private
expenditure on health
Per capita total expenditure on health at
average exchange rate (US$)
Per capita total expenditure on health c (PPP int. $)
Per capita government
expenditure on health at average exchange
rate (US$)
Per capita government expenditure on health c (PPP int. $)
2000 2006 2000 2006 2000 2006 2000 2006 2000 2006 2000 2006 2000 2006
0.0 0.0 88.9 81.1 11.1 18.9 235 275 387 487 162 173 267 30717.0 27.1 71.9 64.3 18.7 23.5 172 206 333 379 59 76 115 14028.0 41.4 85.3 85.6 4.8 5.7 54 166 202 379 17 73 63 16523.8 26.4 94.1 94.9 0.4 0.2 82 92 208 320 33 38 84 13244.2 47.7 94.6 88.9 5.4 11.1 169 181 351 360 77 112 159 2230.0 0.0 89.2 75.6 0.0 0.0 51 440 160 633 26 353 81 5090.0 0.0 100.0 100.0 0.0 0.0 9 8 33 19 5 4 16 9
88.2 83.9 88.5 93.3 0.0 3.9 219 632 521 958 169 464 404 7020.0 0.0 79.1 80.6 0.5 3.0 5 7 19 26 3 4 10 160.0 0.0 79.1 79.1 15.0 15.0 98 139 160 164 68 97 110 114
19.5 19.6 78.8 77.6 9.8 9.1 1 639 3 232 1 794 2 656 1 203 2 455 1 316 2 01884.1 93.6 34.4 33.2 61.5 63.0 2 193 3 937 2 542 3 420 1 740 3 139 2 018 2 7272.0 1.8 100.0 100.0 … … 193 351 552 628 131 256 375 4580.0 0.0 85.3 71.2 3.7 4.6 13 15 39 57 6 9 18 32
44.0 51.5 93.4 91.9 0.5 1.4 48 147 153 337 8 32 26 7387.3 87.9 55.1 57.1 40.8 39.7 2 371 3 718 2 670 3 465 1 890 2 858 2 127 2 664
… … 79.6 77.8 6.1 6.0 18 33 65 76 7 11 27 2646.0 50.8 94.5 94.8 5.5 5.2 919 2 280 1 449 2 547 551 1 414 869 1 5800.0 0.0 100.0 95.4 … … 261 333 388 485 179 212 265 308
52.3 45.4 89.7 91.4 4.2 3.1 95 143 218 267 38 54 87 1011.8 1.5 99.5 99.5 0.0 0.0 20 20 47 65 2 3 6 95.3 3.0 53.0 55.8 0.0 0.0 11 12 34 29 2 3 5 80.0 0.0 100.0 100.0 … … 53 72 116 144 45 62 98 1240.0 … 84.3 89.6 … … 26 42 61 89 10 29 25 60
14.3 15.8 85.4 87.1 7.3 7.3 62 99 138 226 35 47 77 10883.9 84.8 89.8 77.6 0.6 4.5 326 929 852 1 492 231 659 602 1 05833.4 33.5 100.0 100.0 0.0 0.0 2 940 4 994 2 738 3 207 2 383 4 093 2 219 2 6285.8 4.9 92.1 91.4 1.0 1.1 19 29 63 86 4 7 14 227.4 17.3 63.0 70.4 8.3 8.4 12 39 37 82 5 20 14 42
42.3 41.0 95.9 94.8 3.2 4.4 65 215 387 678 24 109 143 344… … 100.0 100.0 … … 18 62 84 146 5 49 23 1141.2 0.9 41.0 57.2 28.5 38.6 1 723 3 871 1 950 3 106 1 267 3 030 1 434 2 431
72.4 72.3 78.5 75.3 10.4 14.4 1 557 1 675 1 845 2 034 978 938 1 159 1 1380.1 0.1 89.1 88.5 3.2 4.1 1 547 2 813 2 061 2 631 1 122 2 172 1 495 2 0310.0 0.0 65.0 63.7 30.0 32.0 189 180 313 307 99 95 164 163
80.9 78.7 90.1 80.8 1.7 13.7 2 827 2 759 1 967 2 581 2 298 2 242 1 598 2 0970.6 0.5 74.7 75.9 5.5 7.4 166 238 302 435 77 103 141 1880.0 0.0 99.0 98.4 0.1 0.1 51 190 198 352 26 122 101 227
10.9 8.8 80.1 80.0 7.1 6.9 18 29 51 67 9 14 25 320.0 0.0 100.0 100.0 0.0 0.0 70 121 154 230 61 105 135 2000.0 0.0 93.9 91.6 6.1 8.4 523 803 903 956 408 628 705 748
10.0 20.9 89.3 94.1 … … 13 35 62 115 6 15 27 501.4 11.5 91.8 76.1 0.0 0.4 11 24 41 80 3 4 13 15
87.7 88.1 96.8 97.2 3.2 2.2 197 582 456 1 018 107 345 248 60352.1 53.1 80.1 76.1 17.3 19.9 485 494 801 859 145 219 240 3810.0 0.0 73.1 68.9 … … 28 51 65 98 14 30 33 570.0 0.0 66.0 65.7 0.0 0.0 7 7 14 15 1 2 3 4… … 100.0 100.0 0.0 0.0 237 219 385 355 146 145 238 235
88.3 84.5 86.2 98.3 0.3 1.3 212 547 543 981 148 383 378 68782.6 77.3 65.2 70.7 10.1 18.7 2 708 6 506 3 137 5 494 2 418 5 912 2 800 4 992
112
7. Health expenditureMember State Health expenditure ratios a
Total expenditure on health as % of gross
domestic product
General government expenditure on health
as % of total expenditure on health b
Private expenditure on health as % of total
expenditure on health b
General government expenditure on health
as % of total government expenditure
External resources for health as %
of total expenditure on health
2000 2006 2000 2006 2000 2006 2000 2006 2000 2006
Madagascar 2.7 3.2 54.5 62.8 45.5 37.2 8.4 9.3 27.3 49.4Malawi 6.1 12.9 43.8 69.0 56.2 31.0 7.3 17.1 26.9 59.6Malaysia 3.2 4.3 52.4 44.6 47.6 55.4 6.2 7.0 0.6 0.0Maldivesj 5.8 8.1 70.8 79.7 29.2 20.3 10.9 9.2 3.3 0.4Mali 6.3 5.8 32.9 49.6 67.1 50.4 9.5 12.2 7.8 17.6Malta 6.8 8.4 72.5 77.0 27.5 23.0 12.0 14.7 0.0 0.0Marshall Islandsi 20.3 14.4 98.0 97.4 2.0 2.6 21.1 14.7 11.4 66.1Mauritaniad 2.8 2.2 71.2 69.5 28.8 30.5 6.5 5.3 23.6 18.0Mauritius 3.8 3.9 52.0 51.1 48.0 48.9 8.7 9.4 1.4 1.0Mexico 5.6 6.6 46.6 44.2 53.4 55.8 12.5 11.8 1.0 0.0Micronesia (Federated States of) 8.4 13.3 93.9 96.0 6.1 4.0 10.5 18.9 38.4 57.1Monacod 3.0 4.5 75.3 74.1 24.7 25.9 17.4 15.6 0.0 0.0Mongolia 5.8 5.7 67.3 73.7 32.7 26.3 10.7 12.7 23.1 1.5Montenegrou 7.8 8.3 71.6 71.9 28.4 28.1 14.4 13.5 … 1.3Morocco 4.2 5.3 29.4 26.2 70.6 73.8 4.0 4.8 0.8 2.5Mozambique 4.8 5.0 68.5 70.8 31.5 29.2 13.9 12.5 32.5 60.3Myanmarv 2.1 2.2 13.4 13.1 86.6 86.9 1.2 1.5 1.1 11.2Namibia 7.0 5.4 68.9 66.7 31.1 33.3 13.1 10.5 3.8 21.1Naurui 11.3 13.8 72.7 67.3 27.3 32.7 11.2 38.1 9.8 0.0Nepalj 5.1 5.1 24.9 30.5 75.1 69.5 7.7 9.2 15.2 15.7Netherlands 8.0 9.4 63.1 80.0 36.9 20.0 11.4 16.4 0.0 0.0New Zealand 8.1 9.3 79.1 77.8 20.9 22.2 16.4 18.4 0.0 0.0Nicaragua 7.1 9.6 51.5 48.2 48.5 51.8 12.9 17.0 8.4 7.7Niger 3.5 5.9 54.5 54.7 45.5 45.3 10.9 17.8 40.0 32.8Nigeria 5.0 3.8 33.5 29.7 66.5 70.3 4.2 3.5 16.2 5.9Niuei 8.0 13.6 98.2 98.6 1.8 1.4 6.3 10.8 4.5 66.3Norway 8.4 8.7 82.5 83.6 17.5 16.4 16.4 17.9 0.0 0.0Oman 3.1 2.3 82.3 82.3 17.7 17.7 7.3 5.4 0.0 0.0Pakistan 2.4 2.0 20.0 16.4 80.0 83.6 1.8 1.3 0.9 3.2Palaui, j 9.5 10.5 89.1 80.8 10.9 19.2 11.3 11.3 14.4 12.9Panama 7.8 7.3 68.1 68.8 31.9 31.2 21.3 11.5 1.0 0.2Papua New Guinea 4.0 3.2 81.7 82.0 18.3 18.0 9.9 7.3 23.8 11.2Paraguay 9.2 7.6 40.2 38.3 59.8 61.7 17.5 13.2 2.8 0.8Peru 4.7 4.4 53.0 58.3 47.0 41.7 12.1 13.8 2.0 1.5Philippines 3.4 3.8 47.6 32.9 52.4 67.1 7.0 6.1 3.5 2.9Polandk 5.5 6.2 70.0 70.0 30.0 30.0 9.4 9.9 0.0 0.1Portugal 8.8 10.2 72.5 70.5 27.5 29.5 14.9 15.5 0.0 0.0Qatarf 2.3 4.3 68.8 78.2 31.2 21.8 5.6 9.7 0.0 0.0Republic of Korea 4.5 6.4 48.8 55.7 51.2 44.3 9.3 11.7 0.0 0.0Republic of Moldovaq 5.9 9.4 50.3 46.9 49.7 53.1 8.7 11.0 16.7 4.6Romanial 5.3 4.5 67.3 76.9 32.7 23.1 9.2 7.9 5.6 0.0Russian Federation 5.4 5.3 59.9 63.2 40.1 36.8 9.6 10.8 0.2 0.1Rwanda 4.2 10.9 39.2 42.5 60.8 57.5 8.2 18.8 52.0 52.4Saint Kitts and Nevis 5.4 5.8 60.3 61.3 39.7 38.7 9.5 9.5 5.3 0.0Saint Lucia 5.8 6.3 58.5 57.8 41.5 42.2 11.7 10.9 0.4 0.2Saint Vincent and the Grenadines 5.7 5.6 63.9 62.4 36.1 37.6 10.8 9.3 0.2 0.0Samoaj 5.6 5.0 70.9 83.0 29.1 17.0 10.8 10.5 17.3 4.3San Marino 7.5 7.2 85.8 85.4 14.2 14.6 20.4 13.8 0.0 0.0Sao Tome and Principef 6.3 6.3 80.5 85.0 19.5 15.0 7.6 10.3 27.5 50.5Saudi Arabia 4.0 3.3 76.4 77.0 23.6 23.0 9.2 8.7 0.0 0.0
7. Health expenditure
113
World HealtH StatiSticS
2009
Tabl
e 7
Health expenditure ratios a Health expenditure per capita a
Social security expenditure on health
as % of general government
expenditure on health
Out-of-pocket expenditure as %
of private expenditure on health
Private prepaid plans as % of private
expenditure on health
Per capita total expenditure on health at
average exchange rate (US$)
Per capita total expenditure on health c (PPP int. $)
Per capita government
expenditure on health at average exchange
rate (US$)
Per capita government expenditure on health c (PPP int. $)
2000 2006 2000 2006 2000 2006 2000 2006 2000 2006 2000 2006 2000 2006
… … 52.8 52.5 10.8 10.7 7 9 21 28 4 6 11 180.0 0.0 42.4 28.4 9.1 15.7 9 21 38 62 4 14 17 430.6 0.8 75.4 73.2 11.9 14.4 128 259 289 544 67 115 151 2420.0 0.0 97.1 97.5 0.0 0.0 132 245 170 422 93 195 120 336… … 99.1 99.5 0.1 0.5 17 31 52 67 5 15 17 330.0 0.0 96.9 90.4 3.1 8.0 641 1 308 2 864 4 223 465 1 008 2 075 3 254
35.0 12.3 100.0 100.0 0.0 0.0 418 358 580 520 410 349 568 5060.0 0.0 100.0 100.0 0.0 0.0 12 19 40 41 8 13 28 29… … 74.6 80.6 8.3 10.0 146 230 302 488 76 118 157 250
67.6 60.2 95.3 93.9 4.7 6.1 327 527 507 778 152 233 236 34421.4 22.2 100.0 100.0 0.0 0.0 170 284 216 375 160 273 202 36098.5 98.4 83.1 83.6 16.9 16.4 3 775 6 353 4 377 5 585 2 843 4 706 3 297 4 13724.5 50.0 36.2 44.0 0.0 0.0 26 70 108 164 17 52 73 12198.8 97.0 100.0 100.0 … … 114 348 442 718 81 250 316 5160.0 0.0 76.6 77.3 23.4 22.7 54 113 109 207 16 30 32 540.0 0.0 40.9 40.6 0.6 0.6 11 16 21 36 8 11 15 263.1 1.8 99.2 99.4 0.0 0.0 3 5 11 24 <1 1 1 31.8 2.3 18.2 15.7 77.3 79.1 127 174 243 261 88 116 167 1740.0 0.0 24.4 84.4 0.0 0.0 375 758 940 1 214 273 510 684 8160.0 0.0 91.2 85.2 0.1 0.4 12 17 40 52 3 5 10 16
93.9 95.1 24.3 29.3 43.0 28.7 1 925 3 872 2 337 3 481 1 214 3 097 1 474 2 7850.0 0.0 69.9 74.6 28.5 21.2 1 109 2 421 1 686 2 448 877 1 884 1 333 1 906
16.2 23.9 90.2 98.1 5.9 1.4 55 92 133 235 28 44 69 113… … 87.6 96.5 11.3 3.0 5 16 16 38 3 9 9 210.0 0.0 92.7 90.4 5.1 6.7 17 33 59 59 6 10 20 180.0 0.0 100.0 100.0 0.0 0.0 323 1 043 496 1 261 317 1 028 487 1 243
17.1 14.9 95.5 95.2 0.0 0.0 3 156 6 267 3 039 4 519 2 603 5 241 2 507 3 7790.0 0.0 65.1 57.7 20.2 22.9 254 332 461 526 209 273 380 4330.0 0.0 98.2 97.9 … … 12 16 40 47 2 3 8 80.0 0.0 100.0 40.3 0.0 43.3 594 811 1 046 1 402 529 655 932 1 133
50.0 47.7 81.3 80.6 18.7 19.2 306 380 560 738 208 262 381 5070.0 0.0 56.0 41.5 5.5 6.3 26 29 64 62 21 24 52 51
53.0 35.3 88.6 87.7 10.9 11.3 122 117 309 312 49 45 124 11942.9 39.7 79.4 77.5 17.2 19.0 98 149 232 316 52 87 123 18414.7 25.8 77.2 83.5 11.1 9.7 34 52 80 120 16 17 38 3982.6 83.9 100.0 85.4 0.8 1.9 247 555 583 919 173 389 408 6431.3 1.2 80.8 77.3 11.1 13.8 970 1 864 1 509 2 199 704 1 315 1 095 1 5520.0 0.0 84.5 88.2 … … 659 2 759 1 259 … 454 2 157 866 …
79.3 77.3 81.5 81.0 8.4 7.6 494 1 168 747 1 467 241 651 364 8170.0 75.0 97.9 97.7 … 0.4 21 90 86 242 10 42 43 113
89.4 85.0 100.0 96.8 0.0 1.7 87 256 320 472 59 197 215 36340.3 42.3 74.7 81.5 8.1 10.2 95 367 410 698 57 232 246 4416.4 4.1 40.7 38.6 0.9 9.2 9 33 24 89 4 14 9 380.0 0.0 94.2 94.6 5.8 5.4 387 570 541 768 233 350 326 4714.9 3.4 95.4 93.8 4.6 6.2 251 350 429 594 147 202 251 3430.0 0.0 100.0 100.0 … … 164 230 282 393 105 144 180 2450.3 0.7 81.3 76.1 0.0 0.0 74 117 155 193 52 97 110 161
100.0 84.4 94.8 95.7 5.2 4.3 2 154 3 527 2 870 3 238 1 849 3 011 2 463 2 7640.0 0.0 100.0 100.0 0.0 0.0 21 49 … 95 17 42 … 81… … 28.3 13.4 42.4 52.1 362 492 692 720 276 379 529 554
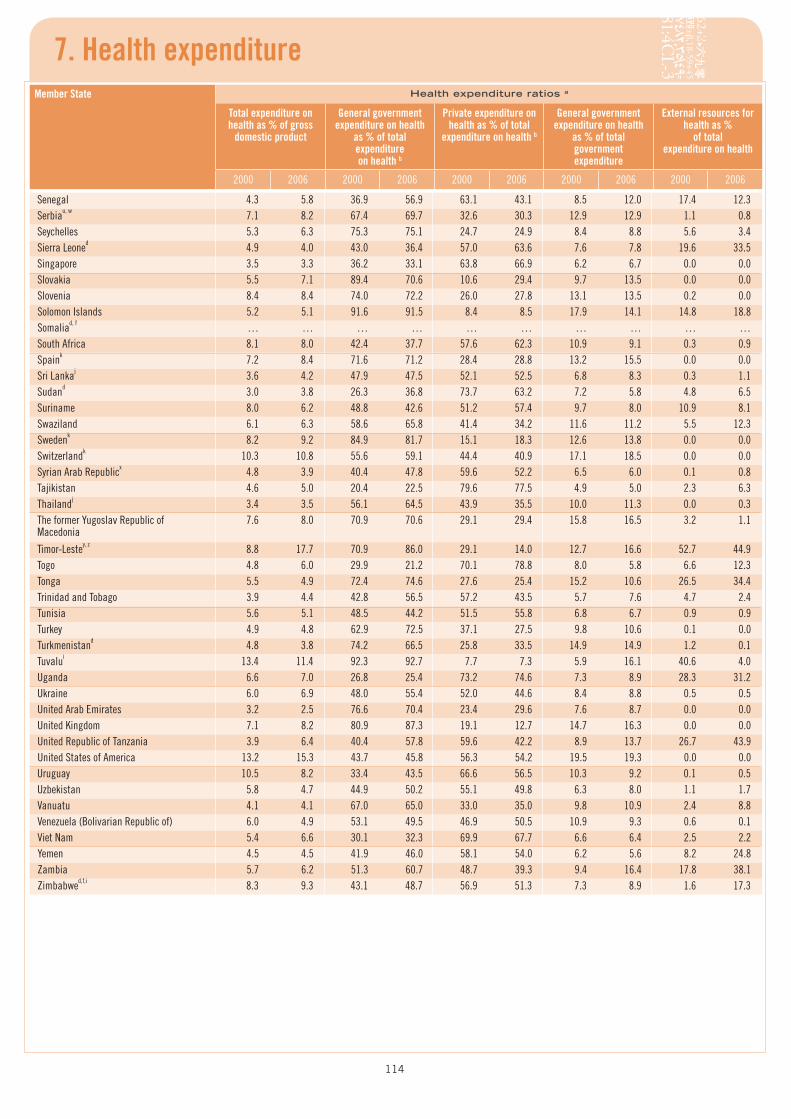
114
7. Health expenditureMember State Health expenditure ratios a
Total expenditure on health as % of gross
domestic product
General government expenditure on health
as % of total expenditure on health b
Private expenditure on health as % of total
expenditure on health b
General government expenditure on health
as % of total government expenditure
External resources for health as %
of total expenditure on health
2000 2006 2000 2006 2000 2006 2000 2006 2000 2006
Senegal 4.3 5.8 36.9 56.9 63.1 43.1 8.5 12.0 17.4 12.3Serbiau, w 7.1 8.2 67.4 69.7 32.6 30.3 12.9 12.9 1.1 0.8Seychelles 5.3 6.3 75.3 75.1 24.7 24.9 8.4 8.8 5.6 3.4Sierra Leoned 4.9 4.0 43.0 36.4 57.0 63.6 7.6 7.8 19.6 33.5Singapore 3.5 3.3 36.2 33.1 63.8 66.9 6.2 6.7 0.0 0.0Slovakia 5.5 7.1 89.4 70.6 10.6 29.4 9.7 13.5 0.0 0.0Slovenia 8.4 8.4 74.0 72.2 26.0 27.8 13.1 13.5 0.2 0.0Solomon Islands 5.2 5.1 91.6 91.5 8.4 8.5 17.9 14.1 14.8 18.8Somaliad, f … … … … … … … … … …South Africa 8.1 8.0 42.4 37.7 57.6 62.3 10.9 9.1 0.3 0.9Spaink 7.2 8.4 71.6 71.2 28.4 28.8 13.2 15.5 0.0 0.0Sri Lankaj 3.6 4.2 47.9 47.5 52.1 52.5 6.8 8.3 0.3 1.1Sudand 3.0 3.8 26.3 36.8 73.7 63.2 7.2 5.8 4.8 6.5Suriname 8.0 6.2 48.8 42.6 51.2 57.4 9.7 8.0 10.9 8.1Swaziland 6.1 6.3 58.6 65.8 41.4 34.2 11.6 11.2 5.5 12.3Swedenk 8.2 9.2 84.9 81.7 15.1 18.3 12.6 13.8 0.0 0.0Switzerlandk 10.3 10.8 55.6 59.1 44.4 40.9 17.1 18.5 0.0 0.0Syrian Arab Republicx 4.8 3.9 40.4 47.8 59.6 52.2 6.5 6.0 0.1 0.8Tajikistan 4.6 5.0 20.4 22.5 79.6 77.5 4.9 5.0 2.3 6.3Thailandj 3.4 3.5 56.1 64.5 43.9 35.5 10.0 11.3 0.0 0.3The former Yugoslav Republic of Macedonia
7.6 8.0 70.9 70.6 29.1 29.4 15.8 16.5 3.2 1.1
Timor-Lestey, z 8.8 17.7 70.9 86.0 29.1 14.0 12.7 16.6 52.7 44.9Togo 4.8 6.0 29.9 21.2 70.1 78.8 8.0 5.8 6.6 12.3Tonga 5.5 4.9 72.4 74.6 27.6 25.4 15.2 10.6 26.5 34.4Trinidad and Tobago 3.9 4.4 42.8 56.5 57.2 43.5 5.7 7.6 4.7 2.4Tunisia 5.6 5.1 48.5 44.2 51.5 55.8 6.8 6.7 0.9 0.9Turkey 4.9 4.8 62.9 72.5 37.1 27.5 9.8 10.6 0.1 0.0Turkmenistand 4.8 3.8 74.2 66.5 25.8 33.5 14.9 14.9 1.2 0.1Tuvalui 13.4 11.4 92.3 92.7 7.7 7.3 5.9 16.1 40.6 4.0Uganda 6.6 7.0 26.8 25.4 73.2 74.6 7.3 8.9 28.3 31.2Ukraine 6.0 6.9 48.0 55.4 52.0 44.6 8.4 8.8 0.5 0.5United Arab Emirates 3.2 2.5 76.6 70.4 23.4 29.6 7.6 8.7 0.0 0.0United Kingdom 7.1 8.2 80.9 87.3 19.1 12.7 14.7 16.3 0.0 0.0United Republic of Tanzania 3.9 6.4 40.4 57.8 59.6 42.2 8.9 13.7 26.7 43.9United States of America 13.2 15.3 43.7 45.8 56.3 54.2 19.5 19.3 0.0 0.0Uruguay 10.5 8.2 33.4 43.5 66.6 56.5 10.3 9.2 0.1 0.5Uzbekistan 5.8 4.7 44.9 50.2 55.1 49.8 6.3 8.0 1.1 1.7Vanuatu 4.1 4.1 67.0 65.0 33.0 35.0 9.8 10.9 2.4 8.8Venezuela (Bolivarian Republic of) 6.0 4.9 53.1 49.5 46.9 50.5 10.9 9.3 0.6 0.1Viet Nam 5.4 6.6 30.1 32.3 69.9 67.7 6.6 6.4 2.5 2.2Yemen 4.5 4.5 41.9 46.0 58.1 54.0 6.2 5.6 8.2 24.8Zambia 5.7 6.2 51.3 60.7 48.7 39.3 9.4 16.4 17.8 38.1Zimbabwed,f,i 8.3 9.3 43.1 48.7 56.9 51.3 7.3 8.9 1.6 17.3
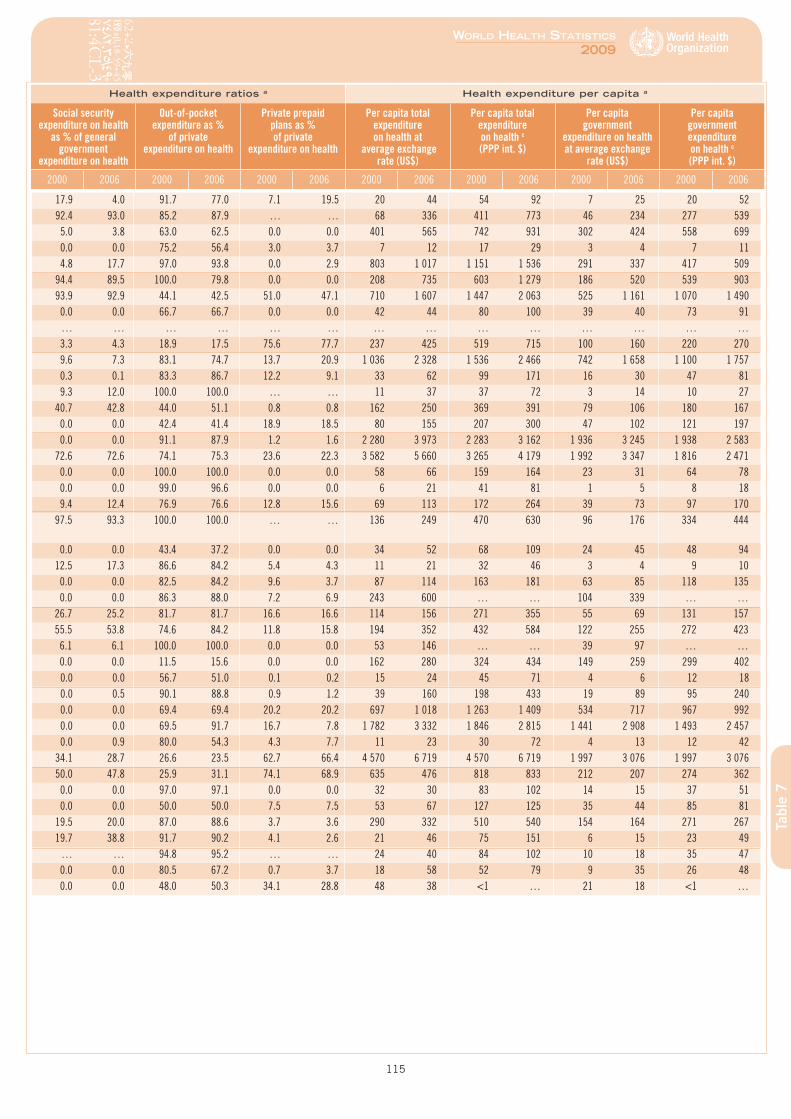
7. Health expenditure
115
World HealtH StatiSticS
2009
Tabl
e 7
Health expenditure ratios a Health expenditure per capita a
Social security expenditure on health
as % of general government
expenditure on health
Out-of-pocket expenditure as %
of private expenditure on health
Private prepaid plans as % of private
expenditure on health
Per capita total expenditure on health at
average exchange rate (US$)
Per capita total expenditure on health c (PPP int. $)
Per capita government
expenditure on health at average exchange
rate (US$)
Per capita government expenditure on health c (PPP int. $)
2000 2006 2000 2006 2000 2006 2000 2006 2000 2006 2000 2006 2000 2006
17.9 4.0 91.7 77.0 7.1 19.5 20 44 54 92 7 25 20 5292.4 93.0 85.2 87.9 … … 68 336 411 773 46 234 277 5395.0 3.8 63.0 62.5 0.0 0.0 401 565 742 931 302 424 558 6990.0 0.0 75.2 56.4 3.0 3.7 7 12 17 29 3 4 7 114.8 17.7 97.0 93.8 0.0 2.9 803 1 017 1 151 1 536 291 337 417 509
94.4 89.5 100.0 79.8 0.0 0.0 208 735 603 1 279 186 520 539 90393.9 92.9 44.1 42.5 51.0 47.1 710 1 607 1 447 2 063 525 1 161 1 070 1 4900.0 0.0 66.7 66.7 0.0 0.0 42 44 80 100 39 40 73 91… … … … … … … … … … … … … …3.3 4.3 18.9 17.5 75.6 77.7 237 425 519 715 100 160 220 2709.6 7.3 83.1 74.7 13.7 20.9 1 036 2 328 1 536 2 466 742 1 658 1 100 1 7570.3 0.1 83.3 86.7 12.2 9.1 33 62 99 171 16 30 47 819.3 12.0 100.0 100.0 … … 11 37 37 72 3 14 10 27
40.7 42.8 44.0 51.1 0.8 0.8 162 250 369 391 79 106 180 1670.0 0.0 42.4 41.4 18.9 18.5 80 155 207 300 47 102 121 1970.0 0.0 91.1 87.9 1.2 1.6 2 280 3 973 2 283 3 162 1 936 3 245 1 938 2 583
72.6 72.6 74.1 75.3 23.6 22.3 3 582 5 660 3 265 4 179 1 992 3 347 1 816 2 4710.0 0.0 100.0 100.0 0.0 0.0 58 66 159 164 23 31 64 780.0 0.0 99.0 96.6 0.0 0.0 6 21 41 81 1 5 8 189.4 12.4 76.9 76.6 12.8 15.6 69 113 172 264 39 73 97 170
97.5 93.3 100.0 100.0 … … 136 249 470 630 96 176 334 444
0.0 0.0 43.4 37.2 0.0 0.0 34 52 68 109 24 45 48 9412.5 17.3 86.6 84.2 5.4 4.3 11 21 32 46 3 4 9 100.0 0.0 82.5 84.2 9.6 3.7 87 114 163 181 63 85 118 1350.0 0.0 86.3 88.0 7.2 6.9 243 600 … … 104 339 … …
26.7 25.2 81.7 81.7 16.6 16.6 114 156 271 355 55 69 131 15755.5 53.8 74.6 84.2 11.8 15.8 194 352 432 584 122 255 272 4236.1 6.1 100.0 100.0 0.0 0.0 53 146 … … 39 97 … …0.0 0.0 11.5 15.6 0.0 0.0 162 280 324 434 149 259 299 4020.0 0.0 56.7 51.0 0.1 0.2 15 24 45 71 4 6 12 180.0 0.5 90.1 88.8 0.9 1.2 39 160 198 433 19 89 95 2400.0 0.0 69.4 69.4 20.2 20.2 697 1 018 1 263 1 409 534 717 967 9920.0 0.0 69.5 91.7 16.7 7.8 1 782 3 332 1 846 2 815 1 441 2 908 1 493 2 4570.0 0.9 80.0 54.3 4.3 7.7 11 23 30 72 4 13 12 42
34.1 28.7 26.6 23.5 62.7 66.4 4 570 6 719 4 570 6 719 1 997 3 076 1 997 3 07650.0 47.8 25.9 31.1 74.1 68.9 635 476 818 833 212 207 274 3620.0 0.0 97.0 97.1 0.0 0.0 32 30 83 102 14 15 37 510.0 0.0 50.0 50.0 7.5 7.5 53 67 127 125 35 44 85 81
19.5 20.0 87.0 88.6 3.7 3.6 290 332 510 540 154 164 271 26719.7 38.8 91.7 90.2 4.1 2.6 21 46 75 151 6 15 23 49
… … 94.8 95.2 … … 24 40 84 102 10 18 35 470.0 0.0 80.5 67.2 0.7 3.7 18 58 52 79 9 35 26 480.0 0.0 48.0 50.3 34.1 28.8 48 38 <1 … 21 18 <1 …
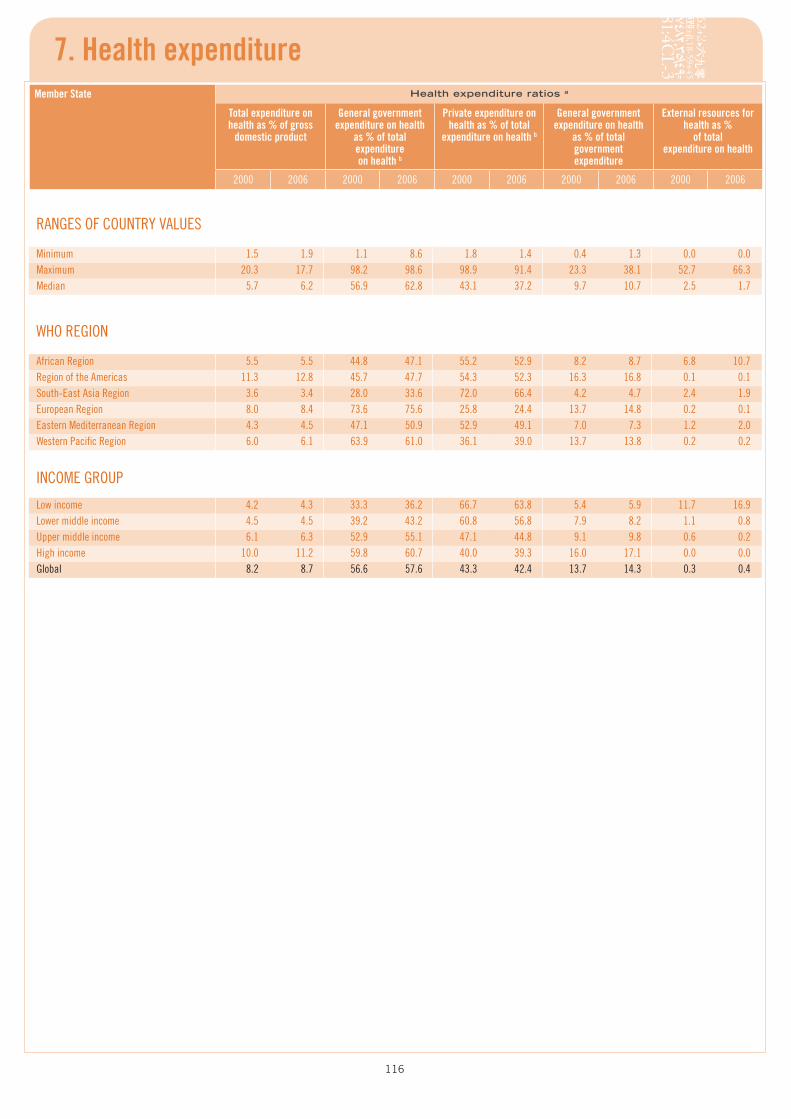
116
7. Health expenditureMember State Health expenditure ratios a
Total expenditure on health as % of gross
domestic product
General government expenditure on health
as % of total expenditure on health b
Private expenditure on health as % of total
expenditure on health b
General government expenditure on health
as % of total government expenditure
External resources for health as %
of total expenditure on health
2000 2006 2000 2006 2000 2006 2000 2006 2000 2006
RANGES OF COUNTRY VALUES
Minimum 1.5 1.9 1.1 8.6 1.8 1.4 0.4 1.3 0.0 0.0Maximum 20.3 17.7 98.2 98.6 98.9 91.4 23.3 38.1 52.7 66.3Median 5.7 6.2 56.9 62.8 43.1 37.2 9.7 10.7 2.5 1.7
WHO REGION
African Region 5.5 5.5 44.8 47.1 55.2 52.9 8.2 8.7 6.8 10.7Region of the Americas 11.3 12.8 45.7 47.7 54.3 52.3 16.3 16.8 0.1 0.1South-East Asia Region 3.6 3.4 28.0 33.6 72.0 66.4 4.2 4.7 2.4 1.9European Region 8.0 8.4 73.6 75.6 25.8 24.4 13.7 14.8 0.2 0.1Eastern Mediterranean Region 4.3 4.5 47.1 50.9 52.9 49.1 7.0 7.3 1.2 2.0Western Pacific Region 6.0 6.1 63.9 61.0 36.1 39.0 13.7 13.8 0.2 0.2
INCOME GROUP
Low income 4.2 4.3 33.3 36.2 66.7 63.8 5.4 5.9 11.7 16.9Lower middle income 4.5 4.5 39.2 43.2 60.8 56.8 7.9 8.2 1.1 0.8Upper middle income 6.1 6.3 52.9 55.1 47.1 44.8 9.1 9.8 0.6 0.2High income 10.0 11.2 59.8 60.7 40.0 39.3 16.0 17.1 0.0 0.0Global 8.2 8.7 56.6 57.6 43.3 42.4 13.7 14.3 0.3 0.4
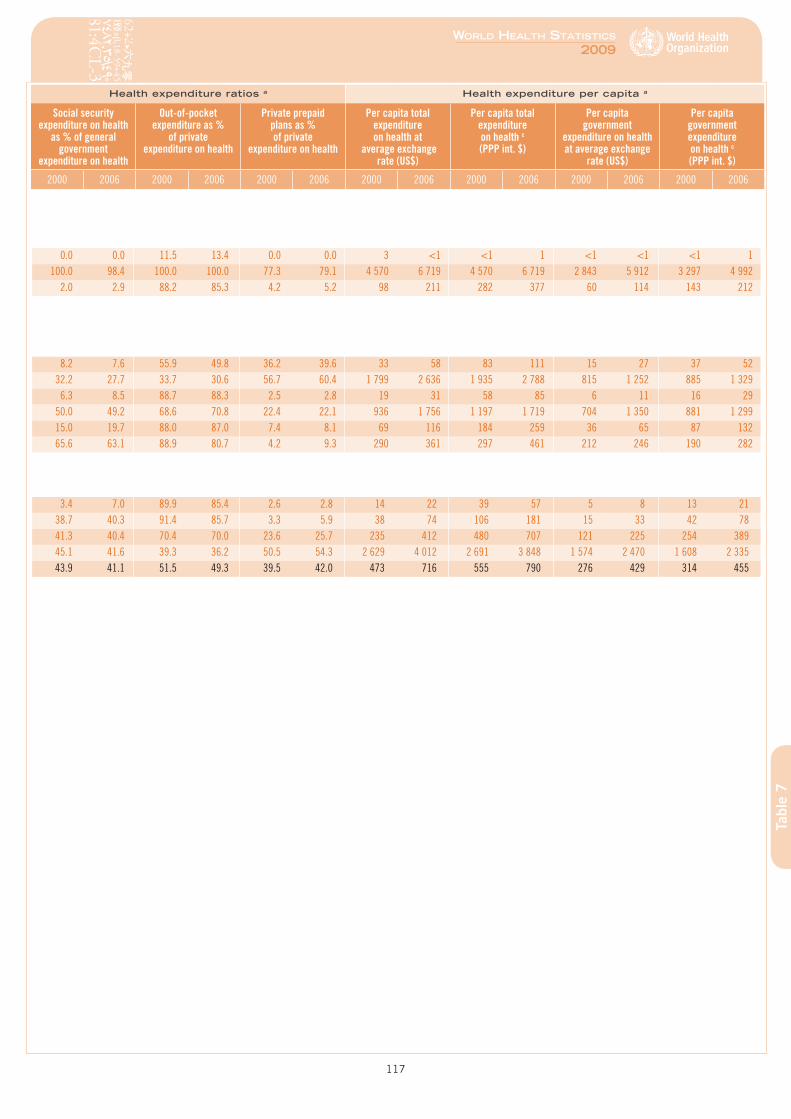
7. Health expenditure
117
World HealtH StatiSticS
2009
Tabl
e 7
Health expenditure ratios a Health expenditure per capita a
Social security expenditure on health
as % of general government
expenditure on health
Out-of-pocket expenditure as %
of private expenditure on health
Private prepaid plans as % of private
expenditure on health
Per capita total expenditure on health at
average exchange rate (US$)
Per capita total expenditure on health c (PPP int. $)
Per capita government
expenditure on health at average exchange
rate (US$)
Per capita government expenditure on health c (PPP int. $)
2000 2006 2000 2006 2000 2006 2000 2006 2000 2006 2000 2006 2000 2006
0.0 0.0 11.5 13.4 0.0 0.0 3 <1 <1 1 <1 <1 <1 1100.0 98.4 100.0 100.0 77.3 79.1 4 570 6 719 4 570 6 719 2 843 5 912 3 297 4 992
2.0 2.9 88.2 85.3 4.2 5.2 98 211 282 377 60 114 143 212
8.2 7.6 55.9 49.8 36.2 39.6 33 58 83 111 15 27 37 5232.2 27.7 33.7 30.6 56.7 60.4 1 799 2 636 1 935 2 788 815 1 252 885 1 3296.3 8.5 88.7 88.3 2.5 2.8 19 31 58 85 6 11 16 29
50.0 49.2 68.6 70.8 22.4 22.1 936 1 756 1 197 1 719 704 1 350 881 1 29915.0 19.7 88.0 87.0 7.4 8.1 69 116 184 259 36 65 87 13265.6 63.1 88.9 80.7 4.2 9.3 290 361 297 461 212 246 190 282
3.4 7.0 89.9 85.4 2.6 2.8 14 22 39 57 5 8 13 2138.7 40.3 91.4 85.7 3.3 5.9 38 74 106 181 15 33 42 7841.3 40.4 70.4 70.0 23.6 25.7 235 412 480 707 121 225 254 38945.1 41.6 39.3 36.2 50.5 54.3 2 629 4 012 2 691 3 848 1 574 2 470 1 608 2 33543.9 41.1 51.5 49.3 39.5 42.0 473 716 555 790 276 429 314 455

World HealtH StatiSticS
2009
119
Health inequitiesIn general, global reporting of health indicators focuses on national averages. However, data on the distribution of health within countries and between population subgroups are equally important. Such data help to identify health inequities – unfair and avoidable differences in health – that arise from factors such as socioeconomic status (education, occupation and household wealth or income), geographical location, ethnicity and sex.
This section presents data using three health indicators − births attended by skilled health personnel, measles immunization coverage among 1-year-old children, and under-5 mortality − disaggregated according to urban or rural residence, household wealth and maternal educational level.
The evidence from 90 countries that have the necessary data shows that in many countries there are significant inequities. For example, in half the countries, child mortality rates are at least 1.4 times higher in rural areas compared with urban areas and at least 1.9 times higher among the poorest 20% of households compared with the richest 20% of households. In 64% of countries, the proportion of births attended by skilled personnel is at least 20% higher in urban than in rural areas. There appears to be less inequity in measles immunization; the urban–rural difference is 20% or higher in only 10% of countries.
The main source of these data are Demographic and Health Surveys and Multiple Indicator Cluster Surveys. For the disaggregations by household wealth, the total population is grouped into wealth quintiles based on relative differences in household wealth within the country, not on an absolute wealth criterion. The estimates are subject to normal sample variability which is usually indicated by confidence intervals. However, only point estimates are shown in this table.
The data presented refer to ratios and differences between the most advantaged and least advantaged groups. More complex measures are needed to reflect the situation across all population groups such as the middle household wealth or education groups. Work is under way to reach consensus around the conceptual and statistical issues involved in constructing and interpreting these inequity measures.
Tabl
e 8
120
8. Health inequitiesMember State Year MDG 5 Births attended by skilled health personnel a,b (%)
Place of residence
Wealth quintile
Education level of mother e
Rura
l
Urba
n
Ratio
urb
an–r
ural
Diffe
renc
e ur
ban–
rura
l
Lowe
st
High
est
Ratio
hig
hest
–low
est
Diffe
renc
e hi
ghes
t–lo
west
Lowe
st
High
est
Ratio
hig
hest
–low
est
Diffe
renc
e hi
ghes
t–lo
west
Afghanistan … … … … … … … … … … … …Albaniaf 2005 100 100 1.0 0 99 100 1.0 1 … … … …Algeriaf 2006 92 98 1.1 6 … … … … … … … …Andorra … … … … … … … … … … … …Angola … … … … … … … … … … … …Antigua and Barbuda … … … … … … … … … … … …Argentina … … … … … … … … … … … …Armeniag 2005 98 99 1.0 1 93 100 1.1 7 … … … …Australia … … … … … … … … … … … …Austria … … … … … … … … … … … …Azerbaijan 2006 81 97 1.2 16 78 100 1.3 22 83 89 1.1 5Bahamas … … … … … … … … … … … …Bahrain … … … … … … … … … … … …Bangladesh 2004 9 30 3.3 21 3 40 11.6 36 4 28 6.5 24Barbados … … … … … … … … … … … …Belarusf 2005 100 100 1.0 0 100 100 1.0 0 … … … …Belgium … … … … … … … … … … … …Belizef 2006 93 99 1.1 7 … … … … … … … …Benin 2006 74 86 1.2 12 56 97 1.7 42 72 98 1.4 26Bhutan … … … … … … … … … … … …Bolivia 2003 39 78 2.0 39 34 99 2.9 65 30 90 3.0 60Bosnia and Herzegovinaf 2006 100 100 1.0 0 99 100 1.0 0 … … … …Botswana … … … … … … … … … … … …Brazil 1996 73 92 1.3 19 72 99 1.4 27 66 95 1.4 29Brunei Darussalam … … … … … … … … … … … …Bulgaria … … … … … … … … … … … …Burkina Faso 2003 31 88 2.9 57 39 91 2.3 52 33 95 2.9 62Burundi … … … … … … … … … … … …Cambodia 2005 39 70 1.8 31 21 90 4.3 69 22 80 3.6 58Cameroon 2004 44 84 1.9 40 29 95 3.2 65 23 92 4.0 69Canada … … … … … … … … … … … …Cape Verde … … … … … … … … … … … …Central African Republicf 2006 35 83 2.4 48 27 89 3.3 62 34 88 2.6 55Chad 2004 6 46 7.1 39 4 55 15.4 52 9 67 7.2 57Chile … … … … … … … … … … … …China … … … … … … … … … … … …Colombia 2005 77 97 1.3 20 72 99 1.4 27 67 97 1.4 30Comorosh 1996 43 79 1.8 36 26 85 3.2 59 41 83 2.0 42Congo 2005 74 97 1.3 23 70 98 1.4 28 62 93 1.5 30Cook Islands … … … … … … … … … … … …Costa Rica … … … … … … … … … … … …Côte d'Ivoiref 2006 40 84 2.1 44 29 95 3.3 66 47 87 1.8 40Croatia … … … … … … … … … … … …Cuba … … … … … … … … … … … …Cyprus … … … … … … … … … … … …Czech Republic … … … … … … … … … … … …Democratic People's Republic of Korea … … … … … … … … … … … …Democratic Republic of the Congo 2007 63 91 1.4 28 59 98 1.7 39 59 89 1.5 29Denmark … … … … … … … … … … … …Djiboutif 2006 40 95 2.3 54 … … … … … … … …
8. Health inequities
121
World HealtH StatiSticS
2009
Tabl
e 8
MDG 4 Measles immunization coverage among 1-year-olds a,c (%)
MDG 4 Under-5 mortality rate a,d (probability of dying by age 5 per 1000 live births)
Place of residence
Wealth quintile Education level of mother e
Place of residence
Wealth quintile Education level of mother e
Rura
l
Urba
n
Ratio
urb
an–r
ural
Diffe
renc
e ur
ban–
rura
l
Lowe
st
High
est
Ratio
hig
hest
–low
est
Diffe
renc
e hi
ghes
t–lo
west
Lowe
st
High
est
Ratio
hig
hest
–low
est
Diffe
renc
e hi
ghes
t–lo
west
Rura
l
Urba
n
Ratio
rura
l–ur
ban
Diffe
renc
e ru
ral–
urba
n
Lowe
st
High
est
Ratio
lowe
st–h
ighe
st
Diffe
renc
e lo
west
–hig
hest
Lowe
st
High
est
Ratio
lowe
st–h
ighe
st
Diffe
renc
e lo
west
–hig
hest
… … … … … … … … … … … … … … … … … … … … … … … …… … … … … … … … … … … … 19 20 1.0 –1 … … … … … … … …… … … … … … … … … … … … … … … … … … … … … … … …… … … … … … … … … … … … … … … … … … … … … … … …… … … … … … … … … … … … … … … … … … … … … … … …… … … … … … … … … … … … … … … … … … … … … … … …… … … … … … … … … … … … … … … … … … … … … … … …80 67 0.8 –13 72 (62) 0.8 –11 … … … … 42 26 1.6 16 52 23 2.3 29 … … … …… … … … … … … … … … … … … … … … … … … … … … … …… … … … … … … … … … … … … … … … … … … … … … … …44 64 1.5 20 50 83 1.7 34 46 55 1.2 9 64 52 1.2 12 … … … … 68 58 1.2 10… … … … … … … … … … … … … … … … … … … … … … … …… … … … … … … … … … … … … … … … … … … … … … … …74 83 1.1 9 60 91 1.5 31 62 88 1.4 25 98 92 1.1 6 121 72 1.7 49 114 68 1.7 46… … … … … … … … … … … … … … … … … … … … … … … …99 98 1.0 –1 100 98 1.0 –2 … … … … … … … … … … … … … … … …… … … … … … … … … … … … … … … … … … … … … … … …79 91 1.2 12 … … … … … … … … 27 26 1.0 1 … … … … … … … …57 68 1.2 11 48 76 1.6 28 57 82 1.5 26 145 116 1.3 30 151 83 1.8 68 143 78 1.8 65… … … … … … … … … … … … … … … … … … … … … … … …60 67 1.1 6 62 74 1.2 11 61 74 1.2 13 113 77 1.5 37 105 32 3.3 73 145 48 3.0 9780 74 0.9 –6 72 76 1.1 4 … … … … … … … … … … … … … … … …… … … … … … … … … … … … … … … … … … … … … … … …77 90 1.2 14 78 90 1.2 12 67 91 1.3 23 79 49 1.6 30 99 33 3.0 66 119 37 3.2 82… … … … … … … … … … … … … … … … … … … … … … … …… … … … … … … … … … … … … … … … … … … … … … … …53 73 1.4 20 48 71 1.5 23 54 80 1.5 26 202 136 1.5 65 206 144 1.4 62 198 108 1.8 90… … … … … … … … … … … … … … … … … … … … … … … …77 79 1.0 3 70 82 1.2 13 64 91 1.4 27 111 76 1.5 35 127 43 3.0 84 136 53 2.6 8358 73 1.2 14 52 83 1.6 31 46 79 1.7 33 169 119 1.4 50 189 88 2.1 101 186 93 2.0 92… … … … … … … … … … … … … … … … … … … … … … … …… … … … … … … … … … … … … … … … … … … … … … … …… … … … … … … … … … … … 199 126 1.6 73 223 112 2.0 111 187 107 1.7 8019 38 2.0 18 8 38 4.6 30 18 54 3.0 36 208 179 1.2 29 176 187 0.9 –11 200 143 1.4 57… … … … … … … … … … … … … … … … … … … … … … … …… … … … … … … … … … … … … … … … … … … … … … … …76 85 1.1 9 69 90 1.3 21 70 86 1.2 16 33 23 1.4 10 39 16 2.4 23 51 20 2.5 3064 63 1.0 –1 51 86 1.7 35 59 76 1.3 17 123 81 1.5 42 129 87 1.5 42 121 75 1.6 4657 76 1.3 20 49 84 1.7 36 44 75 1.7 31 136 108 1.3 28 135 85 1.6 50 202 101 2.0 101… … … … … … … … … … … … … … … … … … … … … … … …… … … … … … … … … … … … … … … … … … … … … … … …78 94 1.2 16 69 98 1.4 29 80 95 1.2 16 … … … … … … … … … … … …… … … … … … … … … … … … … … … … … … … … … … … …… … … … … … … … … … … … … … … … … … … … … … … …… … … … … … … … … … … … … … … … … … … … … … … …… … … … … … … … … … … … … … … … … … … … … … … …… … … … … … … … … … … … … … … … … … … … … … … …56 73 1.3 17 51 85 1.7 34 49 77 1.6 28 177 122 1.5 55 184 97 1.9 87 209 112 1.9 97… … … … … … … … … … … … … … … … … … … … … … … …… … … … … … … … … … … … 73 95 0.8 –22 … … … … … … … …
122
8. Health inequitiesMember State Year MDG 5 Births attended by skilled health personnel a,b (%)
Place of residence
Wealth quintile
Education level of mother e
Rura
l
Urba
n
Ratio
urb
an–r
ural
Diffe
renc
e ur
ban–
rura
l
Lowe
st
High
est
Ratio
hig
hest
–low
est
Diffe
renc
e hi
ghes
t–lo
west
Lowe
st
High
est
Ratio
hig
hest
–low
est
Diffe
renc
e hi
ghes
t–lo
west
Dominica … … … … … … … … … … … …Dominican Republic 2007 94 96 1.0 2 95 99 1.0 4 86 97 1.1 12Ecuador … … … … … … … … … … … …Egypt 2005 66 89 1.3 23 51 96 1.9 45 54 89 1.6 35El Salvador … … … … … … … … … … … …Equatorial Guinea … … … … … … … … … … … …Eritrea 2002 10 65 6.2 54 7 81 12.1 74 12 88 7.3 76Estonia … … … … … … … … … … … …Ethiopia 2005 3 45 17.2 42 1 27 38.0 26 2 58 25.1 55Fiji … … … … … … … … … … … …Finland … … … … … … … … … … … …France … … … … … … … … … … … …Gabon 2000 69 93 1.3 24 67 97 1.4 30 84 93 1.1 9Gambiaf 2006 43 83 1.9 40 28 89 3.1 60 49 85 1.7 36Georgiaf 2005 98 99 1.0 1 95 99 1.0 3 … … … …Germany … … … … … … … … … … … …Ghana 2003 31 80 2.6 49 21 90 4.4 70 30 68 2.3 38Greece … … … … … … … … … … … …Grenada … … … … … … … … … … … …Guatemala 1998–1999 25 66 2.6 41 9 92 10.4 83 22 85 3.9 63Guinea 2005 26 81 3.2 55 15 87 6.0 73 33 84 2.6 51Guinea-Bissauf 2006 27 69 2.6 42 19 79 4.0 59 28 80 2.9 52Guyanaf 2006 82 89 1.1 7 64 93 1.5 29 … … … …Haiti 2005 15 47 3.0 31 6 68 10.5 61 9 60 6.6 51Honduras 2005 50 90 1.8 40 33 99 2.9 65 37 96 2.6 59Hungary … … … … … … … … … … … …Iceland … … … … … … … … … … … …India 2005–2006 38 74 2.0 36 19 89 4.6 69 … … … …Indonesia 2002–2003 55 79 1.4 24 40 94 2.3 54 32 86 2.6 53Iran (Islamic Republic of) … … … … … … … … … … … …Iraqf 2006 78 95 1.2 17 … … … … 79 96 1.2 17Ireland … … … … … … … … … … … …Israel … … … … … … … … … … … …Italy … … … … … … … … … … … …Jamaicaf 2005 94 99 1.0 4 … … … … … … … …Japan … … … … … … … … … … … …Jordan 2007 99 99 1.0 1 98 100 1.0 2 … … … …Kazakhstanf 2006 100 100 1.0 0 100 100 1.0 0 … … … …Kenya 2003 35 72 2.1 38 17 75 4.4 58 16 72 4.6 56Kiribati … … … … … … … … … … … …Kuwait … … … … … … … … … … … …Kyrgyzstanf 2006 96 100 1.0 4 93 100 1.1 7 … … … …Lao People's Democratic Republicf 2006 11 68 6.2 57 3 81 27.1 78 3 63 18.5 59Latvia … … … … … … … … … … … …Lebanon … … … … … … … … … … … …Lesotho 2004 50 88 1.8 38 34 83 2.5 50 21 73 3.5 52Liberia 2007 32 79 2.5 47 26 81 3.2 56 36 75 2.1 39Libyan Arab Jamahiriya … … … … … … … … … … … …Lithuania … … … … … … … … … … … …Luxembourg … … … … … … … … … … … …
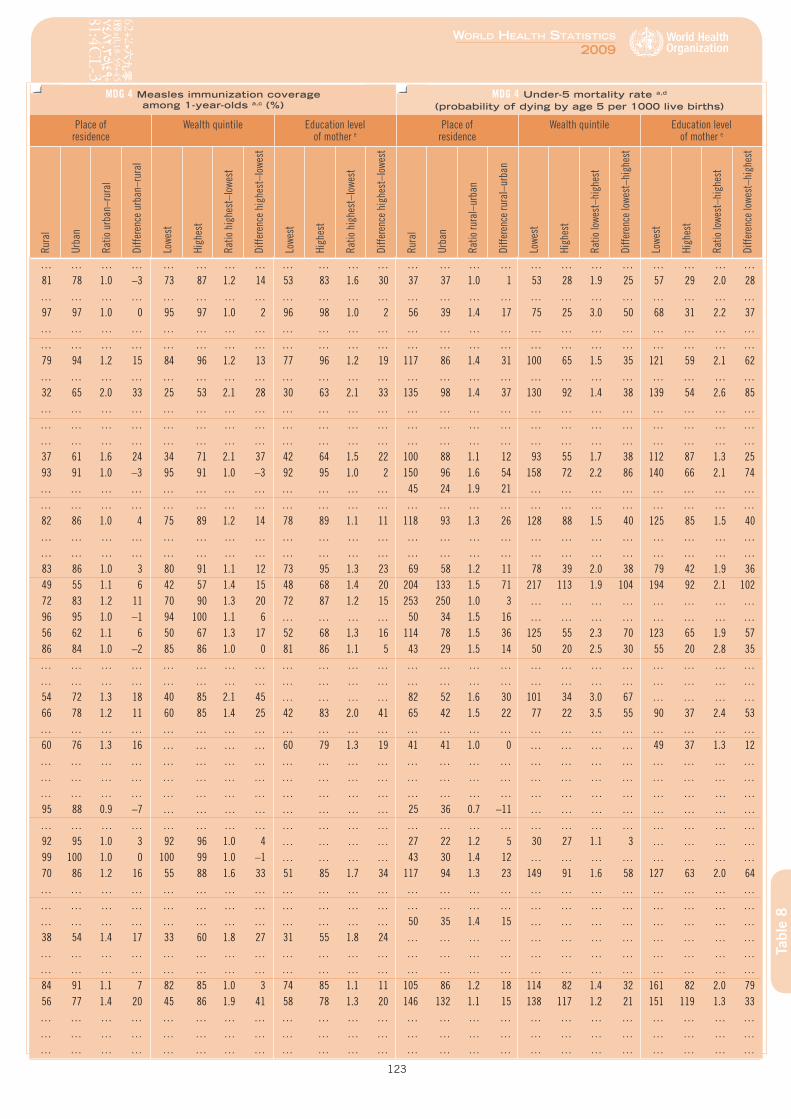
8. Health inequities
123
World HealtH StatiSticS
2009
Tabl
e 8
MDG 4 Measles immunization coverage among 1-year-olds a,c (%)
MDG 4 Under-5 mortality rate a,d (probability of dying by age 5 per 1000 live births)
Place of residence
Wealth quintile Education level of mother e
Place of residence
Wealth quintile Education level of mother e
Rura
l
Urba
n
Ratio
urb
an–r
ural
Diffe
renc
e ur
ban–
rura
l
Lowe
st
High
est
Ratio
hig
hest
–low
est
Diffe
renc
e hi
ghes
t–lo
west
Lowe
st
High
est
Ratio
hig
hest
–low
est
Diffe
renc
e hi
ghes
t–lo
west
Rura
l
Urba
n
Ratio
rura
l–ur
ban
Diffe
renc
e ru
ral–
urba
n
Lowe
st
High
est
Ratio
lowe
st–h
ighe
st
Diffe
renc
e lo
west
–hig
hest
Lowe
st
High
est
Ratio
lowe
st–h
ighe
st
Diffe
renc
e lo
west
–hig
hest
… … … … … … … … … … … … … … … … … … … … … … … …81 78 1.0 –3 73 87 1.2 14 53 83 1.6 30 37 37 1.0 1 53 28 1.9 25 57 29 2.0 28… … … … … … … … … … … … … … … … … … … … … … … …97 97 1.0 0 95 97 1.0 2 96 98 1.0 2 56 39 1.4 17 75 25 3.0 50 68 31 2.2 37… … … … … … … … … … … … … … … … … … … … … … … …… … … … … … … … … … … … … … … … … … … … … … … …79 94 1.2 15 84 96 1.2 13 77 96 1.2 19 117 86 1.4 31 100 65 1.5 35 121 59 2.1 62… … … … … … … … … … … … … … … … … … … … … … … …32 65 2.0 33 25 53 2.1 28 30 63 2.1 33 135 98 1.4 37 130 92 1.4 38 139 54 2.6 85… … … … … … … … … … … … … … … … … … … … … … … …… … … … … … … … … … … … … … … … … … … … … … … …… … … … … … … … … … … … … … … … … … … … … … … …37 61 1.6 24 34 71 2.1 37 42 64 1.5 22 100 88 1.1 12 93 55 1.7 38 112 87 1.3 2593 91 1.0 –3 95 91 1.0 –3 92 95 1.0 2 150 96 1.6 54 158 72 2.2 86 140 66 2.1 74… … … … … … … … … … … … 45 24 1.9 21 … … … … … … … …… … … … … … … … … … … … … … … … … … … … … … … …82 86 1.0 4 75 89 1.2 14 78 89 1.1 11 118 93 1.3 26 128 88 1.5 40 125 85 1.5 40… … … … … … … … … … … … … … … … … … … … … … … …… … … … … … … … … … … … … … … … … … … … … … … …83 86 1.0 3 80 91 1.1 12 73 95 1.3 23 69 58 1.2 11 78 39 2.0 38 79 42 1.9 3649 55 1.1 6 42 57 1.4 15 48 68 1.4 20 204 133 1.5 71 217 113 1.9 104 194 92 2.1 10272 83 1.2 11 70 90 1.3 20 72 87 1.2 15 253 250 1.0 3 … … … … … … … …96 95 1.0 –1 94 100 1.1 6 … … … … 50 34 1.5 16 … … … … … … … …56 62 1.1 6 50 67 1.3 17 52 68 1.3 16 114 78 1.5 36 125 55 2.3 70 123 65 1.9 5786 84 1.0 –2 85 86 1.0 0 81 86 1.1 5 43 29 1.5 14 50 20 2.5 30 55 20 2.8 35… … … … … … … … … … … … … … … … … … … … … … … …… … … … … … … … … … … … … … … … … … … … … … … …54 72 1.3 18 40 85 2.1 45 … … … … 82 52 1.6 30 101 34 3.0 67 … … … …66 78 1.2 11 60 85 1.4 25 42 83 2.0 41 65 42 1.5 22 77 22 3.5 55 90 37 2.4 53… … … … … … … … … … … … … … … … … … … … … … … …60 76 1.3 16 … … … … 60 79 1.3 19 41 41 1.0 0 … … … … 49 37 1.3 12… … … … … … … … … … … … … … … … … … … … … … … …… … … … … … … … … … … … … … … … … … … … … … … …… … … … … … … … … … … … … … … … … … … … … … … …95 88 0.9 –7 … … … … … … … … 25 36 0.7 –11 … … … … … … … …… … … … … … … … … … … … … … … … … … … … … … … …92 95 1.0 3 92 96 1.0 4 … … … … 27 22 1.2 5 30 27 1.1 3 … … … …99 100 1.0 0 100 99 1.0 –1 … … … … 43 30 1.4 12 … … … … … … … …70 86 1.2 16 55 88 1.6 33 51 85 1.7 34 117 94 1.3 23 149 91 1.6 58 127 63 2.0 64… … … … … … … … … … … … … … … … … … … … … … … …… … … … … … … … … … … … … … … … … … … … … … … …… … … … … … … … … … … … 50 35 1.4 15 … … … … … … … …38 54 1.4 17 33 60 1.8 27 31 55 1.8 24 … … … … … … … … … … … …… … … … … … … … … … … … … … … … … … … … … … … …… … … … … … … … … … … … … … … … … … … … … … … …84 91 1.1 7 82 85 1.0 3 74 85 1.1 11 105 86 1.2 18 114 82 1.4 32 161 82 2.0 7956 77 1.4 20 45 86 1.9 41 58 78 1.3 20 146 132 1.1 15 138 117 1.2 21 151 119 1.3 33… … … … … … … … … … … … … … … … … … … … … … … …… … … … … … … … … … … … … … … … … … … … … … … …… … … … … … … … … … … … … … … … … … … … … … … …
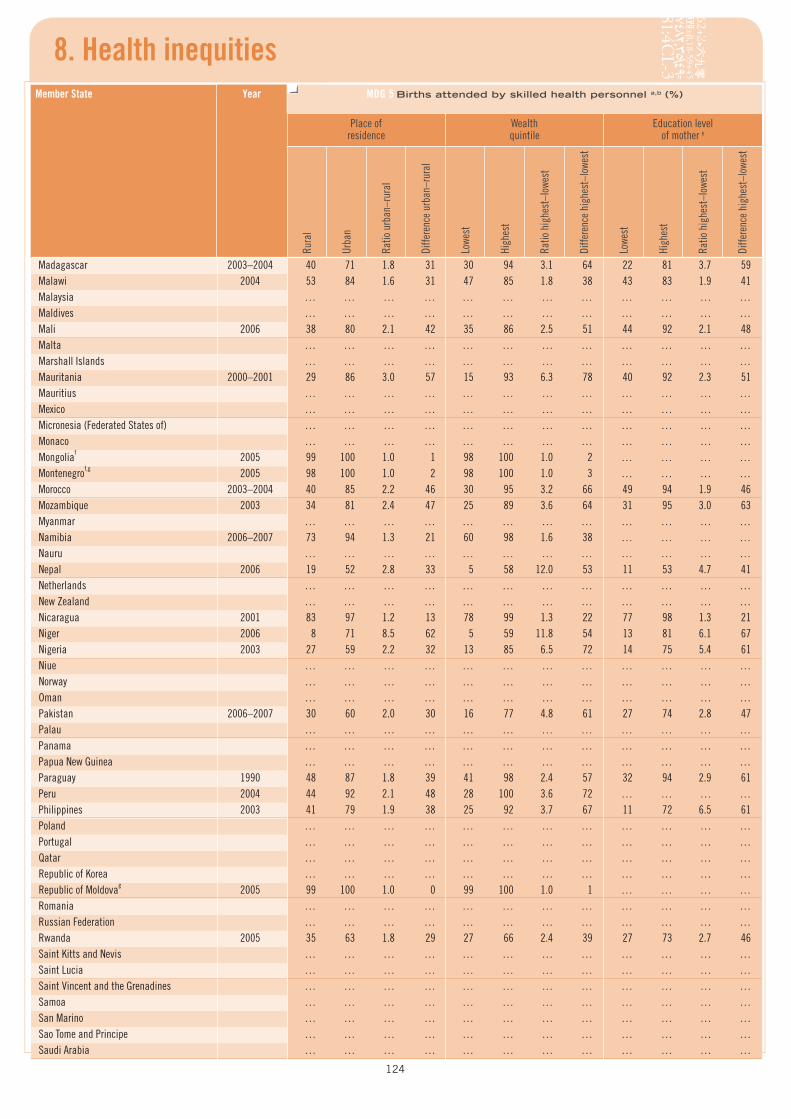
124
8. Health inequitiesMember State Year MDG 5 Births attended by skilled health personnel a,b (%)
Place of residence
Wealth quintile
Education level of mother e
Rura
l
Urba
n
Ratio
urb
an–r
ural
Diffe
renc
e ur
ban–
rura
l
Lowe
st
High
est
Ratio
hig
hest
–low
est
Diffe
renc
e hi
ghes
t–lo
west
Lowe
st
High
est
Ratio
hig
hest
–low
est
Diffe
renc
e hi
ghes
t–lo
west
Madagascar 2003–2004 40 71 1.8 31 30 94 3.1 64 22 81 3.7 59Malawi 2004 53 84 1.6 31 47 85 1.8 38 43 83 1.9 41Malaysia … … … … … … … … … … … …Maldives … … … … … … … … … … … …Mali 2006 38 80 2.1 42 35 86 2.5 51 44 92 2.1 48Malta … … … … … … … … … … … …Marshall Islands … … … … … … … … … … … …Mauritania 2000–2001 29 86 3.0 57 15 93 6.3 78 40 92 2.3 51Mauritius … … … … … … … … … … … …Mexico … … … … … … … … … … … …Micronesia (Federated States of) … … … … … … … … … … … …Monaco … … … … … … … … … … … …Mongoliaf 2005 99 100 1.0 1 98 100 1.0 2 … … … …Montenegrof,g 2005 98 100 1.0 2 98 100 1.0 3 … … … …Morocco 2003–2004 40 85 2.2 46 30 95 3.2 66 49 94 1.9 46Mozambique 2003 34 81 2.4 47 25 89 3.6 64 31 95 3.0 63Myanmar … … … … … … … … … … … …Namibia 2006–2007 73 94 1.3 21 60 98 1.6 38 … … … …Nauru … … … … … … … … … … … …Nepal 2006 19 52 2.8 33 5 58 12.0 53 11 53 4.7 41Netherlands … … … … … … … … … … … …New Zealand … … … … … … … … … … … …Nicaragua 2001 83 97 1.2 13 78 99 1.3 22 77 98 1.3 21Niger 2006 8 71 8.5 62 5 59 11.8 54 13 81 6.1 67Nigeria 2003 27 59 2.2 32 13 85 6.5 72 14 75 5.4 61Niue … … … … … … … … … … … …Norway … … … … … … … … … … … …Oman … … … … … … … … … … … …Pakistan 2006–2007 30 60 2.0 30 16 77 4.8 61 27 74 2.8 47Palau … … … … … … … … … … … …Panama … … … … … … … … … … … …Papua New Guinea … … … … … … … … … … … …Paraguay 1990 48 87 1.8 39 41 98 2.4 57 32 94 2.9 61Peru 2004 44 92 2.1 48 28 100 3.6 72 … … … …Philippines 2003 41 79 1.9 38 25 92 3.7 67 11 72 6.5 61Poland … … … … … … … … … … … …Portugal … … … … … … … … … … … …Qatar … … … … … … … … … … … …Republic of Korea … … … … … … … … … … … …Republic of Moldovag 2005 99 100 1.0 0 99 100 1.0 1 … … … …Romania … … … … … … … … … … … …Russian Federation … … … … … … … … … … … …Rwanda 2005 35 63 1.8 29 27 66 2.4 39 27 73 2.7 46Saint Kitts and Nevis … … … … … … … … … … … …Saint Lucia … … … … … … … … … … … …Saint Vincent and the Grenadines … … … … … … … … … … … …Samoa … … … … … … … … … … … …San Marino … … … … … … … … … … … …Sao Tome and Principe … … … … … … … … … … … …Saudi Arabia … … … … … … … … … … … …
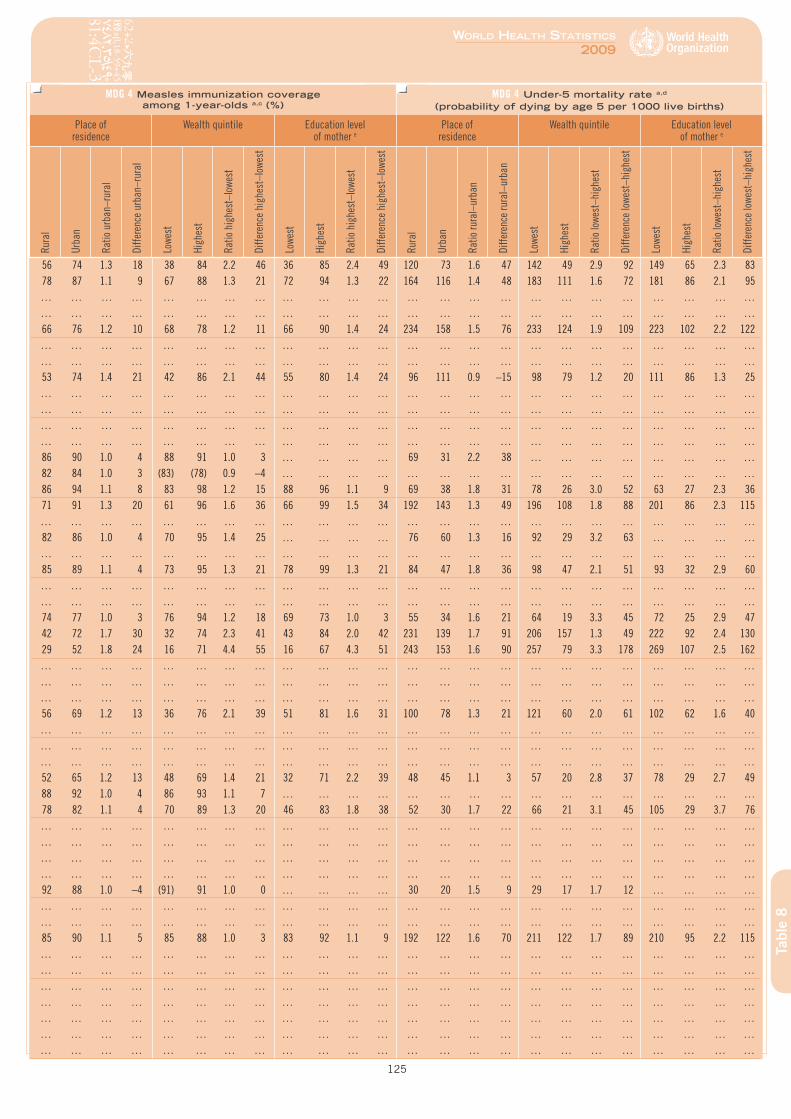
8. Health inequities
125
World HealtH StatiSticS
2009
Tabl
e 8
MDG 4 Measles immunization coverage among 1-year-olds a,c (%)
MDG 4 Under-5 mortality rate a,d (probability of dying by age 5 per 1000 live births)
Place of residence
Wealth quintile Education level of mother e
Place of residence
Wealth quintile Education level of mother e
Rura
l
Urba
n
Ratio
urb
an–r
ural
Diffe
renc
e ur
ban–
rura
l
Lowe
st
High
est
Ratio
hig
hest
–low
est
Diffe
renc
e hi
ghes
t–lo
west
Lowe
st
High
est
Ratio
hig
hest
–low
est
Diffe
renc
e hi
ghes
t–lo
west
Rura
l
Urba
n
Ratio
rura
l–ur
ban
Diffe
renc
e ru
ral–
urba
n
Lowe
st
High
est
Ratio
lowe
st–h
ighe
st
Diffe
renc
e lo
west
–hig
hest
Lowe
st
High
est
Ratio
lowe
st–h
ighe
st
Diffe
renc
e lo
west
–hig
hest
56 74 1.3 18 38 84 2.2 46 36 85 2.4 49 120 73 1.6 47 142 49 2.9 92 149 65 2.3 8378 87 1.1 9 67 88 1.3 21 72 94 1.3 22 164 116 1.4 48 183 111 1.6 72 181 86 2.1 95… … … … … … … … … … … … … … … … … … … … … … … …… … … … … … … … … … … … … … … … … … … … … … … …66 76 1.2 10 68 78 1.2 11 66 90 1.4 24 234 158 1.5 76 233 124 1.9 109 223 102 2.2 122… … … … … … … … … … … … … … … … … … … … … … … …… … … … … … … … … … … … … … … … … … … … … … … …53 74 1.4 21 42 86 2.1 44 55 80 1.4 24 96 111 0.9 –15 98 79 1.2 20 111 86 1.3 25… … … … … … … … … … … … … … … … … … … … … … … …… … … … … … … … … … … … … … … … … … … … … … … …… … … … … … … … … … … … … … … … … … … … … … … …… … … … … … … … … … … … … … … … … … … … … … … …86 90 1.0 4 88 91 1.0 3 … … … … 69 31 2.2 38 … … … … … … … …82 84 1.0 3 (83) (78) 0.9 –4 … … … … … … … … … … … … … … … …86 94 1.1 8 83 98 1.2 15 88 96 1.1 9 69 38 1.8 31 78 26 3.0 52 63 27 2.3 3671 91 1.3 20 61 96 1.6 36 66 99 1.5 34 192 143 1.3 49 196 108 1.8 88 201 86 2.3 115… … … … … … … … … … … … … … … … … … … … … … … …82 86 1.0 4 70 95 1.4 25 … … … … 76 60 1.3 16 92 29 3.2 63 … … … …… … … … … … … … … … … … … … … … … … … … … … … …85 89 1.1 4 73 95 1.3 21 78 99 1.3 21 84 47 1.8 36 98 47 2.1 51 93 32 2.9 60… … … … … … … … … … … … … … … … … … … … … … … …… … … … … … … … … … … … … … … … … … … … … … … …74 77 1.0 3 76 94 1.2 18 69 73 1.0 3 55 34 1.6 21 64 19 3.3 45 72 25 2.9 4742 72 1.7 30 32 74 2.3 41 43 84 2.0 42 231 139 1.7 91 206 157 1.3 49 222 92 2.4 13029 52 1.8 24 16 71 4.4 55 16 67 4.3 51 243 153 1.6 90 257 79 3.3 178 269 107 2.5 162… … … … … … … … … … … … … … … … … … … … … … … …… … … … … … … … … … … … … … … … … … … … … … … …… … … … … … … … … … … … … … … … … … … … … … … …56 69 1.2 13 36 76 2.1 39 51 81 1.6 31 100 78 1.3 21 121 60 2.0 61 102 62 1.6 40… … … … … … … … … … … … … … … … … … … … … … … …… … … … … … … … … … … … … … … … … … … … … … … …… … … … … … … … … … … … … … … … … … … … … … … …52 65 1.2 13 48 69 1.4 21 32 71 2.2 39 48 45 1.1 3 57 20 2.8 37 78 29 2.7 4988 92 1.0 4 86 93 1.1 7 … … … … … … … … … … … … … … … …78 82 1.1 4 70 89 1.3 20 46 83 1.8 38 52 30 1.7 22 66 21 3.1 45 105 29 3.7 76… … … … … … … … … … … … … … … … … … … … … … … …… … … … … … … … … … … … … … … … … … … … … … … …… … … … … … … … … … … … … … … … … … … … … … … …… … … … … … … … … … … … … … … … … … … … … … … …92 88 1.0 –4 (91) 91 1.0 0 … … … … 30 20 1.5 9 29 17 1.7 12 … … … …… … … … … … … … … … … … … … … … … … … … … … … …… … … … … … … … … … … … … … … … … … … … … … … …85 90 1.1 5 85 88 1.0 3 83 92 1.1 9 192 122 1.6 70 211 122 1.7 89 210 95 2.2 115… … … … … … … … … … … … … … … … … … … … … … … …… … … … … … … … … … … … … … … … … … … … … … … …… … … … … … … … … … … … … … … … … … … … … … … …… … … … … … … … … … … … … … … … … … … … … … … …… … … … … … … … … … … … … … … … … … … … … … … …… … … … … … … … … … … … … … … … … … … … … … … …… … … … … … … … … … … … … … … … … … … … … … … …
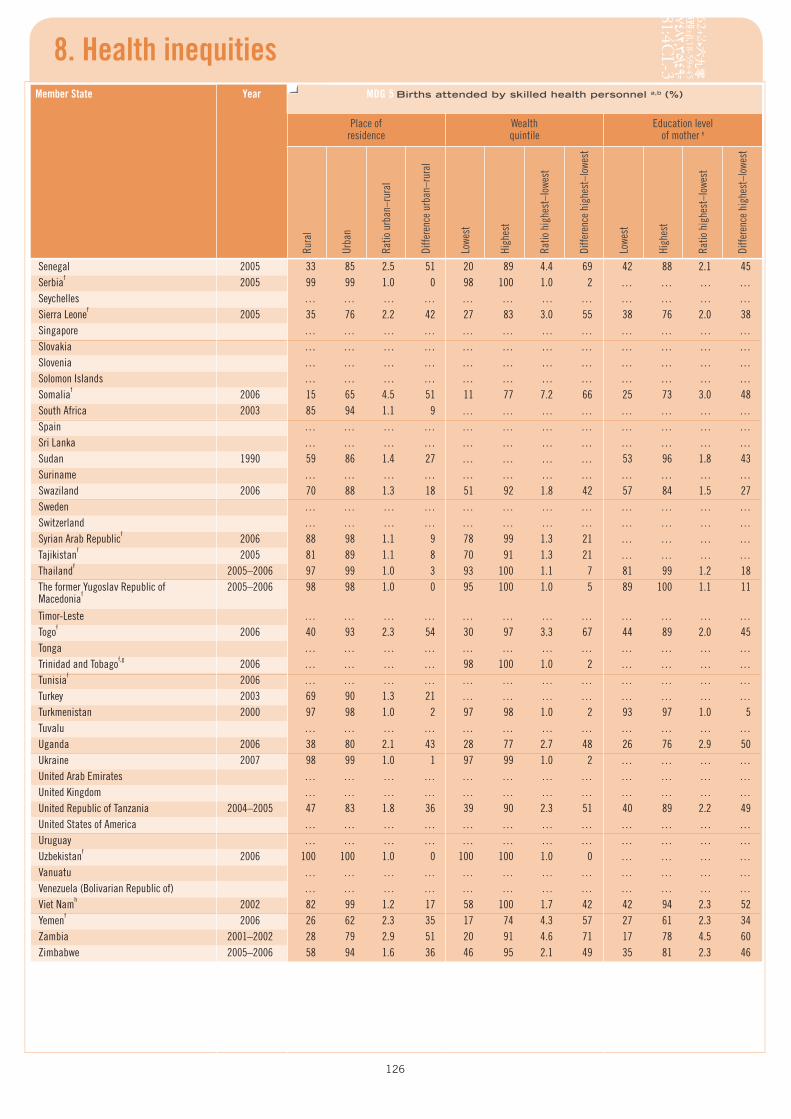
126
8. Health inequitiesMember State Year MDG 5 Births attended by skilled health personnel a,b (%)
Place of residence
Wealth quintile
Education level of mother e
Rura
l
Urba
n
Ratio
urb
an–r
ural
Diffe
renc
e ur
ban–
rura
l
Lowe
st
High
est
Ratio
hig
hest
–low
est
Diffe
renc
e hi
ghes
t–lo
west
Lowe
st
High
est
Ratio
hig
hest
–low
est
Diffe
renc
e hi
ghes
t–lo
west
Senegal 2005 33 85 2.5 51 20 89 4.4 69 42 88 2.1 45Serbiaf 2005 99 99 1.0 0 98 100 1.0 2 … … … …Seychelles … … … … … … … … … … … …Sierra Leonef 2005 35 76 2.2 42 27 83 3.0 55 38 76 2.0 38Singapore … … … … … … … … … … … …Slovakia … … … … … … … … … … … …Slovenia … … … … … … … … … … … …Solomon Islands … … … … … … … … … … … …Somaliaf 2006 15 65 4.5 51 11 77 7.2 66 25 73 3.0 48South Africa 2003 85 94 1.1 9 … … … … … … … …Spain … … … … … … … … … … … …Sri Lanka … … … … … … … … … … … …Sudan 1990 59 86 1.4 27 … … … … 53 96 1.8 43Suriname … … … … … … … … … … … …Swaziland 2006 70 88 1.3 18 51 92 1.8 42 57 84 1.5 27Sweden … … … … … … … … … … … …Switzerland … … … … … … … … … … … …Syrian Arab Republicf 2006 88 98 1.1 9 78 99 1.3 21 … … … …Tajikistanf 2005 81 89 1.1 8 70 91 1.3 21 … … … …Thailandf 2005–2006 97 99 1.0 3 93 100 1.1 7 81 99 1.2 18The former Yugoslav Republic of Macedoniaf
2005–2006 98 98 1.0 0 95 100 1.0 5 89 100 1.1 11
Timor-Leste … … … … … … … … … … … …Togof 2006 40 93 2.3 54 30 97 3.3 67 44 89 2.0 45Tonga … … … … … … … … … … … …Trinidad and Tobagof,g 2006 … … … … 98 100 1.0 2 … … … …Tunisiaf 2006 … … … … … … … … … … … …Turkey 2003 69 90 1.3 21 … … … … … … … …Turkmenistan 2000 97 98 1.0 2 97 98 1.0 2 93 97 1.0 5Tuvalu … … … … … … … … … … … …Uganda 2006 38 80 2.1 43 28 77 2.7 48 26 76 2.9 50Ukraine 2007 98 99 1.0 1 97 99 1.0 2 … … … …United Arab Emirates … … … … … … … … … … … …United Kingdom … … … … … … … … … … … …United Republic of Tanzania 2004–2005 47 83 1.8 36 39 90 2.3 51 40 89 2.2 49United States of America … … … … … … … … … … … …Uruguay … … … … … … … … … … … …Uzbekistanf 2006 100 100 1.0 0 100 100 1.0 0 … … … …Vanuatu … … … … … … … … … … … …Venezuela (Bolivarian Republic of) … … … … … … … … … … … …Viet Namh 2002 82 99 1.2 17 58 100 1.7 42 42 94 2.3 52Yemenf 2006 26 62 2.3 35 17 74 4.3 57 27 61 2.3 34Zambia 2001–2002 28 79 2.9 51 20 91 4.6 71 17 78 4.5 60Zimbabwe 2005–2006 58 94 1.6 36 46 95 2.1 49 35 81 2.3 46
8. Health inequities
127
World HealtH StatiSticS
2009
Tabl
e 8
MDG 4 Measles immunization coverage among 1-year-olds a,c (%)
MDG 4 Under-5 mortality rate a,d (probability of dying by age 5 per 1000 live births)
Place of residence
Wealth quintile Education level of mother e
Place of residence
Wealth quintile Education level of mother e
Rura
l
Urba
n
Ratio
urb
an–r
ural
Diffe
renc
e ur
ban–
rura
l
Lowe
st
High
est
Ratio
hig
hest
–low
est
Diffe
renc
e hi
ghes
t–lo
west
Lowe
st
High
est
Ratio
hig
hest
–low
est
Diffe
renc
e hi
ghes
t–lo
west
Rura
l
Urba
n
Ratio
rura
l–ur
ban
Diffe
renc
e ru
ral–
urba
n
Lowe
st
High
est
Ratio
lowe
st–h
ighe
st
Diffe
renc
e lo
west
–hig
hest
Lowe
st
High
est
Ratio
lowe
st–h
ighe
st
Diffe
renc
e lo
west
–hig
hest
71 77 1.1 6 71 81 1.1 10 69 95 1.4 26 160 91 1.8 69 183 64 2.9 119 152 60 2.5 9289 85 1.0 –4 87 84 1.0 –3 … … … … … … … … … … … … … … … …… … … … … … … … … … … … … … … … … … … … … … … …75 84 1.1 9 66 84 1.3 18 75 87 1.2 12 279 207 1.3 72 … … … … 279 164 1.7 115… … … … … … … … … … … … … … … … … … … … … … … …… … … … … … … … … … … … … … … … … … … … … … … …… … … … … … … … … … … … … … … … … … … … … … … …… … … … … … … … … … … … … … … … … … … … … … … …23 40 1.8 17 22 47 2.1 25 24 48 2.0 25 136 134 1.0 2 … … … … … … … …68 59 0.9 –9 … … … … … … … … … … … … … … … … … … … …… … … … … … … … … … … … … … … … … … … … … … … …… … … … … … … … … … … … … … … … … … … … … … … …56 70 1.2 14 … … … … 50 85 1.7 35 144 117 1.2 27 … … … … 152 84 1.8 68… … … … … … … … … … … … … … … … … … … … … … … …91 95 1.0 4 89 93 1.0 4 84 93 1.1 9 105 107 1.0 –2 118 101 1.2 17 150 95 1.6 55… … … … … … … … … … … … … … … … … … … … … … … …… … … … … … … … … … … … … … … … … … … … … … … …91 94 1.0 3 89 97 1.1 9 … … … … 24 19 1.3 5 22 20 1.1 2 … … … …90 96 1.1 6 89 96 1.1 8 … … … … 83 70 1.2 13 … … … … … … … …96 96 1.0 0 96 99 1.0 3 90 96 1.1 6 … … … … … … … … … … … …88 89 1.0 2 80 93 1.2 13 71 92 1.3 21 26 10 2.6 16 … … … … … … … …
… … … … … … … … … … … … … … … … … … … … … … … …61 67 1.1 6 57 72 1.3 15 50 82 1.6 32 143 73 2.0 70 150 62 2.4 88 145 64 2.3 81… … … … … … … … … … … … … … … … … … … … … … … …… … … … (98) (85) 0.9 –13 … … … … … … … … … … … … … … … …97 99 1.0 2 … … … … … … … … … … … … … … … … … … … …69 84 1.2 15 … … … … … … … … 50 30 1.7 20 … … … … … … … …92 82 0.9 –10 91 80 0.9 –11 74 88 1.2 14 100 73 1.4 27 106 70 1.5 36 133 88 1.5 45… … … … … … … … … … … … … … … … … … … … … … … …67 77 1.1 10 66 73 1.1 7 64 82 1.3 18 147 115 1.3 32 172 108 1.6 64 164 91 1.8 73… … … … … … … … … … … … 20 18 1.1 2 … … … … … … … …… … … … … … … … … … … … … … … … … … … … … … … …… … … … … … … … … … … … … … … … … … … … … … … …78 90 1.2 12 65 91 1.4 26 65 90 1.4 25 138 108 1.3 30 137 93 1.5 44 160 76 2.1 84… … … … … … … … … … … … … … … … … … … … … … … …… … … … … … … … … … … … … … … … … … … … … … … …98 97 1.0 0 97 98 1.0 1 … … … … 59 51 1.2 8 72 42 1.7 30 … … … …… … … … … … … … … … … … … … … … … … … … … … … …… … … … … … … … … … … … … … … … … … … … … … … …81 94 1.2 14 64 98 1.5 33 49 93 1.9 44 36 16 2.2 19 53 16 3.3 37 66 29 2.3 3859 80 1.4 22 52 86 1.6 33 60 81 1.4 21 86 57 1.5 29 118 37 3.2 81 … … … …84 86 1.0 2 81 88 1.1 7 80 87 1.1 7 182 140 1.3 42 192 92 2.1 99 198 121 1.6 7763 72 1.1 8 54 74 1.4 20 30 71 2.3 41 72 64 1.1 8 72 57 1.3 15 69 68 1.0 1
128
8. Health inequitiesMember State Year MDG 5 Births attended by skilled health personnel a,b (%)
Place of residence
Wealth quintile
Education level of mother e
Rura
l
Urba
n
Ratio
urb
an–r
ural
Diffe
renc
e ur
ban–
rura
l
Lowe
st
High
est
Ratio
hig
hest
–low
est
Diffe
renc
e hi
ghes
t–lo
west
Lowe
st
High
est
Ratio
hig
hest
–low
est
Diffe
renc
e hi
ghes
t–lo
west
RANGES OF COUNTRY VALUES
Minimum 3 30 … … 1 27 … … 2 28 … …Maximum 100 100 … … 100 100 … … 93 100 … …Median 50 88 … … 35 94 … … 35 87 … …
8. Health inequities
129
World HealtH StatiSticS
2009
Tabl
e 8
MDG 4 Measles immunization coverage among 1-year-olds a,c (%)
MDG 4 Under-5 mortality rate a,d (probability of dying by age 5 per 1000 live births)
Place of residence
Wealth quintile Education level of mother e
Place of residence
Wealth quintile Education level of mother e
Rura
l
Urba
n
Ratio
urb
an–r
ural
Diffe
renc
e ur
ban–
rura
l
Lowe
st
High
est
Ratio
hig
hest
–low
est
Diffe
renc
e hi
ghes
t–lo
west
Lowe
st
High
est
Ratio
hig
hest
–low
est
Diffe
renc
e hi
ghes
t–lo
west
Rura
l
Urba
n
Ratio
rura
l–ur
ban
Diffe
renc
e ru
ral–
urba
n
Lowe
st
High
est
Ratio
lowe
st–h
ighe
st
Diffe
renc
e lo
west
–hig
hest
Lowe
st
High
est
Ratio
lowe
st–h
ighe
st
Diffe
renc
e lo
west
–hig
hest
19 38 … … 8 38 … … 16 48 … … 19 10 … … 22 16 … … 49 20 … …99 100 … … 100 100 … … 96 99 … … 279 250 … … 257 187 … … 279 164 … …76 83 … … 70 86 … … 60 85 … … 99 75 … … 121 64 … … 139 68 … …

World HealtH StatiSticS
2009
131
Demographic and socioeconomic statisticsDemographic and socioeconomic factors are major determinants of health. As fertility declines, income rises, populations age and become more urbanized, and epidemiological profiles also shift, with an increasing share of the burden of disease accounted for by noncommunicable diseases, accidents and other external causes. Increasing education, especially of women, also has a major impact on the use of health care and on health status.
Data on demographic and socioeconomic trends are also important for making statistics comparable across countries. Disease incidence, prevalence and mortality rates require reliable population-based denominators.
The world’s population continues to grow but at a slower rate than a decade ago. The average annual growth rate was 1.3% for 1997–2007 compared with 1.6% for 1987–1997. There are large regional differences in growth rates. The growth rate in Africa is over 10 times that of the European Region, where populations are actually shrinking in several countries. Regions with higher growth rates tend to have younger populations; in the African Region, 43% of people are under the age of 15 compared with only 18% in the European Region and 28% globally.
Fertility is also on the decline worldwide, particularly in the Eastern Mediterranean Region, where women now have two children fewer than the previous generation. Despite such declines, fertility is still relatively high compared with other regions, at an average of 3.4 children per women compared with 2.7 in South-East Asia and 2.2 in the Americas. In the African Region in 2007, the average women had around 5 children, only a slight decline from the fertility levels of 1990. By contrast, levels of fertility in the European Region are below replacement level, with an average of 1.6 children per woman.
The world’s population is shifting towards urban areas, with an estimated 49% living in urban areas in 2007 compared with 43% in 1990. The definition of an urban area varies from one country to another, making regional comparisons unreliable.
Since 1990, the gross national income per capita has almost doubled. The highest percentage change over the period of 1990–2007 is in the South-East Asia and Western Pacific Regions where it has increased by about 190%.
These demographic and socioeconomic data are drawn from a variety of sources both in countries and from organizations including the World Bank, United Nations Educational, Scientific and Cultural Organization (UNESCO) and the United Nations. They are based on a combination of administrative records, population-based surveys, census and civil registration data and statistical modelling to account for missing values. For more information about the sources and methods for a particular indicator, please refer to the relevant footnotes and the responsible organization’s web site.
Tabl
e 9
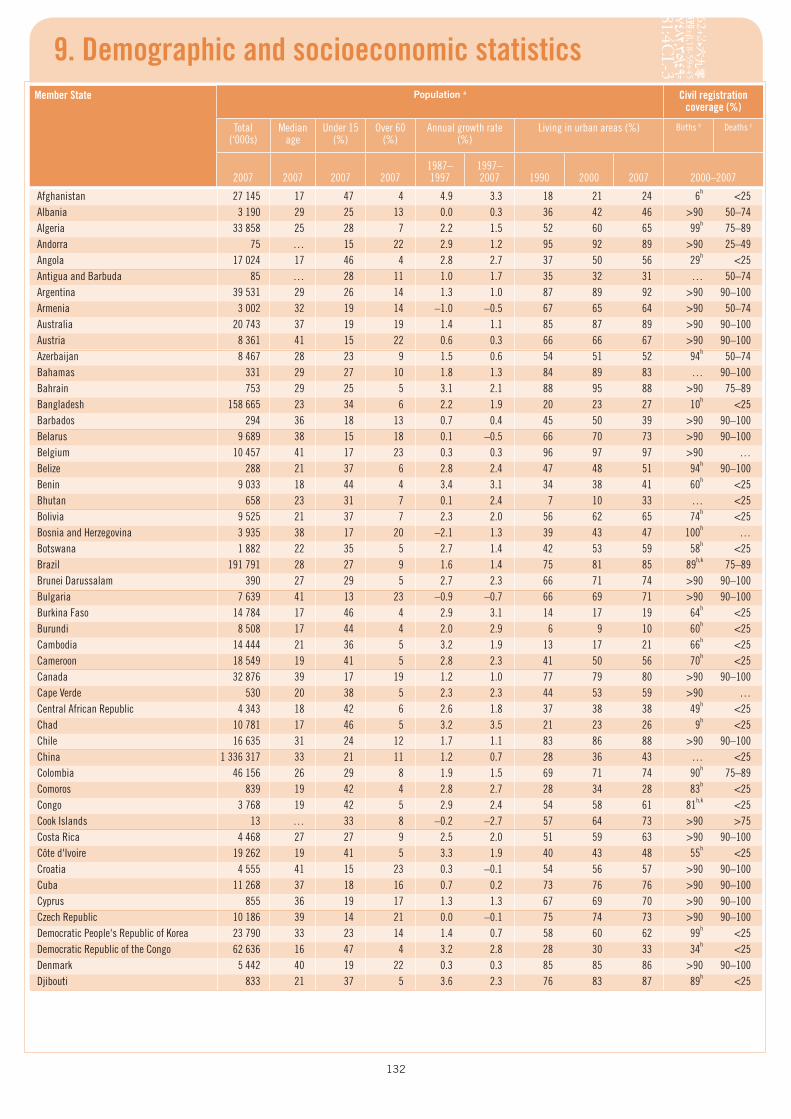
132
9. Demographic and socioeconomic statisticsMember State Population a Civil registration
coverage (%)
Total (‘000s)
Median age
Under 15 (%)
Over 60 (%)
Annual growth rate (%)
Living in urban areas (%) Births b Deaths c
2007 2007 2007 20071987– 1997
1997– 2007 1990 2000 2007 2000–2007
Afghanistan 27 145 17 47 4 4.9 3.3 18 21 24 6h <25Albania 3 190 29 25 13 0.0 0.3 36 42 46 >90 50–74Algeria 33 858 25 28 7 2.2 1.5 52 60 65 99h 75–89Andorra 75 … 15 22 2.9 1.2 95 92 89 >90 25–49Angola 17 024 17 46 4 2.8 2.7 37 50 56 29h <25Antigua and Barbuda 85 … 28 11 1.0 1.7 35 32 31 … 50–74Argentina 39 531 29 26 14 1.3 1.0 87 89 92 >90 90–100Armenia 3 002 32 19 14 –1.0 –0.5 67 65 64 >90 50–74Australia 20 743 37 19 19 1.4 1.1 85 87 89 >90 90–100Austria 8 361 41 15 22 0.6 0.3 66 66 67 >90 90–100Azerbaijan 8 467 28 23 9 1.5 0.6 54 51 52 94h 50–74Bahamas 331 29 27 10 1.8 1.3 84 89 83 … 90–100Bahrain 753 29 25 5 3.1 2.1 88 95 88 >90 75–89Bangladesh 158 665 23 34 6 2.2 1.9 20 23 27 10h <25Barbados 294 36 18 13 0.7 0.4 45 50 39 >90 90–100Belarus 9 689 38 15 18 0.1 –0.5 66 70 73 >90 90–100Belgium 10 457 41 17 23 0.3 0.3 96 97 97 >90 …Belize 288 21 37 6 2.8 2.4 47 48 51 94h 90–100Benin 9 033 18 44 4 3.4 3.1 34 38 41 60h <25Bhutan 658 23 31 7 0.1 2.4 7 10 33 … <25Bolivia 9 525 21 37 7 2.3 2.0 56 62 65 74h <25Bosnia and Herzegovina 3 935 38 17 20 –2.1 1.3 39 43 47 100h …Botswana 1 882 22 35 5 2.7 1.4 42 53 59 58h <25Brazil 191 791 28 27 9 1.6 1.4 75 81 85 89h,k 75–89Brunei Darussalam 390 27 29 5 2.7 2.3 66 71 74 >90 90–100Bulgaria 7 639 41 13 23 –0.9 –0.7 66 69 71 >90 90–100Burkina Faso 14 784 17 46 4 2.9 3.1 14 17 19 64h <25Burundi 8 508 17 44 4 2.0 2.9 6 9 10 60h <25Cambodia 14 444 21 36 5 3.2 1.9 13 17 21 66h <25Cameroon 18 549 19 41 5 2.8 2.3 41 50 56 70h <25Canada 32 876 39 17 19 1.2 1.0 77 79 80 >90 90–100Cape Verde 530 20 38 5 2.3 2.3 44 53 59 >90 …Central African Republic 4 343 18 42 6 2.6 1.8 37 38 38 49h <25Chad 10 781 17 46 5 3.2 3.5 21 23 26 9h <25Chile 16 635 31 24 12 1.7 1.1 83 86 88 >90 90–100China 1 336 317 33 21 11 1.2 0.7 28 36 43 … <25Colombia 46 156 26 29 8 1.9 1.5 69 71 74 90h 75–89Comoros 839 19 42 4 2.8 2.7 28 34 28 83h <25Congo 3 768 19 42 5 2.9 2.4 54 58 61 81h,k <25Cook Islands 13 … 33 8 –0.2 –2.7 57 64 73 >90 >75Costa Rica 4 468 27 27 9 2.5 2.0 51 59 63 >90 90–100Côte d'Ivoire 19 262 19 41 5 3.3 1.9 40 43 48 55h <25Croatia 4 555 41 15 23 0.3 –0.1 54 56 57 >90 90–100Cuba 11 268 37 18 16 0.7 0.2 73 76 76 >90 90–100Cyprus 855 36 19 17 1.3 1.3 67 69 70 >90 90–100Czech Republic 10 186 39 14 21 0.0 –0.1 75 74 73 >90 90–100Democratic People's Republic of Korea 23 790 33 23 14 1.4 0.7 58 60 62 99h <25Democratic Republic of the Congo 62 636 16 47 4 3.2 2.8 28 30 33 34h <25Denmark 5 442 40 19 22 0.3 0.3 85 85 86 >90 90–100Djibouti 833 21 37 5 3.6 2.3 76 83 87 89h <25
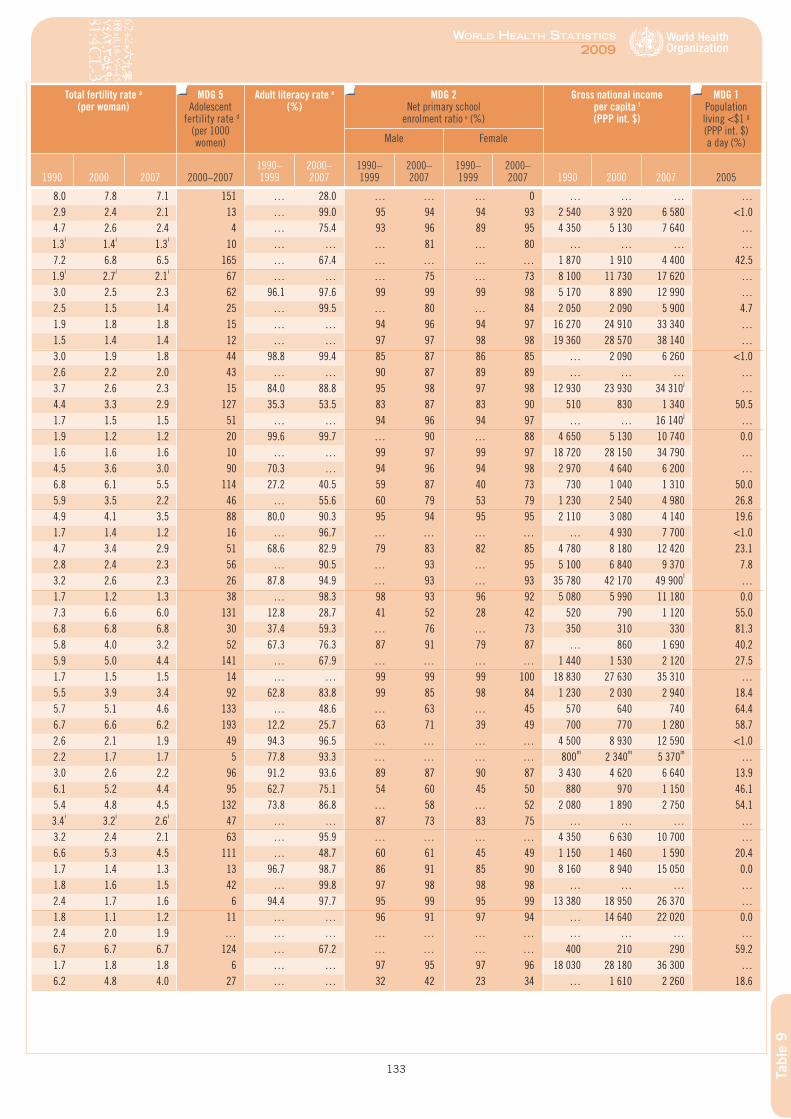
9. Demographic and socioeconomic statistics
133
World HealtH StatiSticS
2009
Tabl
e 9
Total fertility rate a (per woman)
MDG 5Adolescent
fertility rate d (per 1000 women)
Adult literacy rate e
(%)MDG 2
Net primary school enrolment ratio e (%)
Gross national income per capita f (PPP int. $)
MDG 1 Population living <$1 g (PPP int. $) a day (%)Male Female
1990 2000 2007 2000–20071990– 1999
2000–2007
1990–1999
2000–2007
1990–1999
2000–2007 1990 2000 2007 2005
8.0 7.8 7.1 151 … 28.0 … … … 0 … … … …2.9 2.4 2.1 13 … 99.0 95 94 94 93 2 540 3 920 6 580 <1.04.7 2.6 2.4 4 … 75.4 93 96 89 95 4 350 5 130 7 640 …1.3i 1.4i 1.3i 10 … … … 81 … 80 … … … …7.2 6.8 6.5 165 … 67.4 … … … … 1 870 1 910 4 400 42.51.9i 2.7i 2.1i 67 … … … 75 … 73 8 100 11 730 17 620 …3.0 2.5 2.3 62 96.1 97.6 99 99 99 98 5 170 8 890 12 990 …2.5 1.5 1.4 25 … 99.5 … 80 … 84 2 050 2 090 5 900 4.71.9 1.8 1.8 15 … … 94 96 94 97 16 270 24 910 33 340 …1.5 1.4 1.4 12 … … 97 97 98 98 19 360 28 570 38 140 …3.0 1.9 1.8 44 98.8 99.4 85 87 86 85 … 2 090 6 260 <1.02.6 2.2 2.0 43 … … 90 87 89 89 … … … …3.7 2.6 2.3 15 84.0 88.8 95 98 97 98 12 930 23 930 34 310j …4.4 3.3 2.9 127 35.3 53.5 83 87 83 90 510 830 1 340 50.51.7 1.5 1.5 51 … … 94 96 94 97 … … 16 140j …1.9 1.2 1.2 20 99.6 99.7 … 90 … 88 4 650 5 130 10 740 0.01.6 1.6 1.6 10 … … 99 97 99 97 18 720 28 150 34 790 …4.5 3.6 3.0 90 70.3 … 94 96 94 98 2 970 4 640 6 200 …6.8 6.1 5.5 114 27.2 40.5 59 87 40 73 730 1 040 1 310 50.05.9 3.5 2.2 46 … 55.6 60 79 53 79 1 230 2 540 4 980 26.84.9 4.1 3.5 88 80.0 90.3 95 94 95 95 2 110 3 080 4 140 19.61.7 1.4 1.2 16 … 96.7 … … … … … 4 930 7 700 <1.04.7 3.4 2.9 51 68.6 82.9 79 83 82 85 4 780 8 180 12 420 23.12.8 2.4 2.3 56 … 90.5 … 93 … 95 5 100 6 840 9 370 7.83.2 2.6 2.3 26 87.8 94.9 … 93 … 93 35 780 42 170 49 900l …1.7 1.2 1.3 38 … 98.3 98 93 96 92 5 080 5 990 11 180 0.07.3 6.6 6.0 131 12.8 28.7 41 52 28 42 520 790 1 120 55.06.8 6.8 6.8 30 37.4 59.3 … 76 … 73 350 310 330 81.35.8 4.0 3.2 52 67.3 76.3 87 91 79 87 … 860 1 690 40.25.9 5.0 4.4 141 … 67.9 … … … … 1 440 1 530 2 120 27.51.7 1.5 1.5 14 … … 99 99 99 100 18 830 27 630 35 310 …5.5 3.9 3.4 92 62.8 83.8 99 85 98 84 1 230 2 030 2 940 18.45.7 5.1 4.6 133 … 48.6 … 63 … 45 570 640 740 64.46.7 6.6 6.2 193 12.2 25.7 63 71 39 49 700 770 1 280 58.72.6 2.1 1.9 49 94.3 96.5 … … … … 4 500 8 930 12 590 <1.02.2 1.7 1.7 5 77.8 93.3 … … … … 800m 2 340m 5 370m …3.0 2.6 2.2 96 91.2 93.6 89 87 90 87 3 430 4 620 6 640 13.96.1 5.2 4.4 95 62.7 75.1 54 60 45 50 880 970 1 150 46.15.4 4.8 4.5 132 73.8 86.8 … 58 … 52 2 080 1 890 2 750 54.13.4i 3.2i 2.6i 47 … … 87 73 83 75 … … … …3.2 2.4 2.1 63 … 95.9 … … … … 4 350 6 630 10 700 …6.6 5.3 4.5 111 … 48.7 60 61 45 49 1 150 1 460 1 590 20.41.7 1.4 1.3 13 96.7 98.7 86 91 85 90 8 160 8 940 15 050 0.01.8 1.6 1.5 42 … 99.8 97 98 98 98 … … … …2.4 1.7 1.6 6 94.4 97.7 95 99 95 99 13 380 18 950 26 370 …1.8 1.1 1.2 11 … … 96 91 97 94 … 14 640 22 020 0.02.4 2.0 1.9 … … … … … … … … … … …6.7 6.7 6.7 124 … 67.2 … … … … 400 210 290 59.21.7 1.8 1.8 6 … … 97 95 97 96 18 030 28 180 36 300 …6.2 4.8 4.0 27 … … 32 42 23 34 … 1 610 2 260 18.6
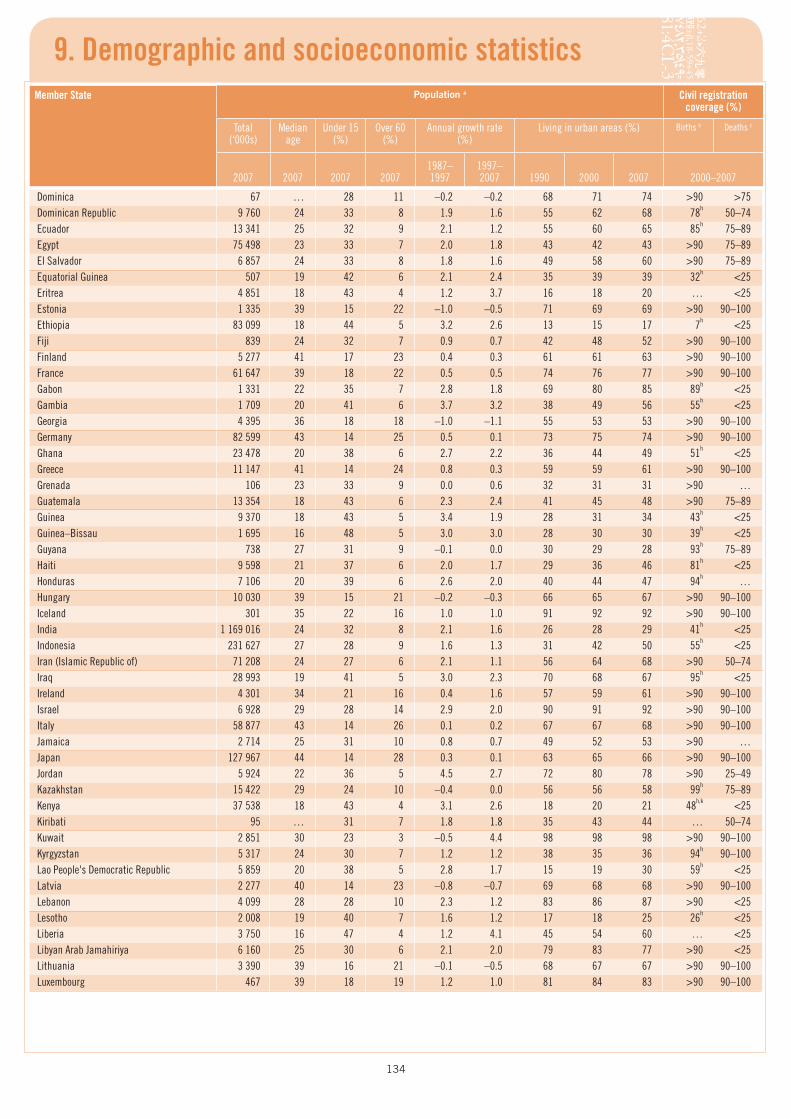
134
9. Demographic and socioeconomic statisticsMember State Population a Civil registration
coverage (%)
Total (‘000s)
Median age
Under 15 (%)
Over 60 (%)
Annual growth rate (%)
Living in urban areas (%) Births b Deaths c
2007 2007 2007 20071987– 1997
1997– 2007 1990 2000 2007 2000–2007
Dominica 67 … 28 11 –0.2 –0.2 68 71 74 >90 >75Dominican Republic 9 760 24 33 8 1.9 1.6 55 62 68 78h 50–74Ecuador 13 341 25 32 9 2.1 1.2 55 60 65 85h 75–89Egypt 75 498 23 33 7 2.0 1.8 43 42 43 >90 75–89El Salvador 6 857 24 33 8 1.8 1.6 49 58 60 >90 75–89Equatorial Guinea 507 19 42 6 2.1 2.4 35 39 39 32h <25Eritrea 4 851 18 43 4 1.2 3.7 16 18 20 … <25Estonia 1 335 39 15 22 –1.0 –0.5 71 69 69 >90 90–100Ethiopia 83 099 18 44 5 3.2 2.6 13 15 17 7h <25Fiji 839 24 32 7 0.9 0.7 42 48 52 >90 90–100Finland 5 277 41 17 23 0.4 0.3 61 61 63 >90 90–100France 61 647 39 18 22 0.5 0.5 74 76 77 >90 90–100Gabon 1 331 22 35 7 2.8 1.8 69 80 85 89h <25Gambia 1 709 20 41 6 3.7 3.2 38 49 56 55h <25Georgia 4 395 36 18 18 –1.0 –1.1 55 53 53 >90 90–100Germany 82 599 43 14 25 0.5 0.1 73 75 74 >90 90–100Ghana 23 478 20 38 6 2.7 2.2 36 44 49 51h <25Greece 11 147 41 14 24 0.8 0.3 59 59 61 >90 90–100Grenada 106 23 33 9 0.0 0.6 32 31 31 >90 …Guatemala 13 354 18 43 6 2.3 2.4 41 45 48 >90 75–89Guinea 9 370 18 43 5 3.4 1.9 28 31 34 43h <25Guinea–Bissau 1 695 16 48 5 3.0 3.0 28 30 30 39h <25Guyana 738 27 31 9 –0.1 0.0 30 29 28 93h 75–89Haiti 9 598 21 37 6 2.0 1.7 29 36 46 81h <25Honduras 7 106 20 39 6 2.6 2.0 40 44 47 94h …Hungary 10 030 39 15 21 –0.2 –0.3 66 65 67 >90 90–100Iceland 301 35 22 16 1.0 1.0 91 92 92 >90 90–100India 1 169 016 24 32 8 2.1 1.6 26 28 29 41h <25Indonesia 231 627 27 28 9 1.6 1.3 31 42 50 55h <25Iran (Islamic Republic of) 71 208 24 27 6 2.1 1.1 56 64 68 >90 50–74Iraq 28 993 19 41 5 3.0 2.3 70 68 67 95h <25Ireland 4 301 34 21 16 0.4 1.6 57 59 61 >90 90–100Israel 6 928 29 28 14 2.9 2.0 90 91 92 >90 90–100Italy 58 877 43 14 26 0.1 0.2 67 67 68 >90 90–100Jamaica 2 714 25 31 10 0.8 0.7 49 52 53 >90 …Japan 127 967 44 14 28 0.3 0.1 63 65 66 >90 90–100Jordan 5 924 22 36 5 4.5 2.7 72 80 78 >90 25–49Kazakhstan 15 422 29 24 10 –0.4 0.0 56 56 58 99h 75–89Kenya 37 538 18 43 4 3.1 2.6 18 20 21 48h,k <25Kiribati 95 … 31 7 1.8 1.8 35 43 44 … 50–74Kuwait 2 851 30 23 3 –0.5 4.4 98 98 98 >90 90–100Kyrgyzstan 5 317 24 30 7 1.2 1.2 38 35 36 94h 90–100Lao People's Democratic Republic 5 859 20 38 5 2.8 1.7 15 19 30 59h <25Latvia 2 277 40 14 23 –0.8 –0.7 69 68 68 >90 90–100Lebanon 4 099 28 28 10 2.3 1.2 83 86 87 >90 <25Lesotho 2 008 19 40 7 1.6 1.2 17 18 25 26h <25Liberia 3 750 16 47 4 1.2 4.1 45 54 60 … <25Libyan Arab Jamahiriya 6 160 25 30 6 2.1 2.0 79 83 77 >90 <25Lithuania 3 390 39 16 21 –0.1 –0.5 68 67 67 >90 90–100Luxembourg 467 39 18 19 1.2 1.0 81 84 83 >90 90–100
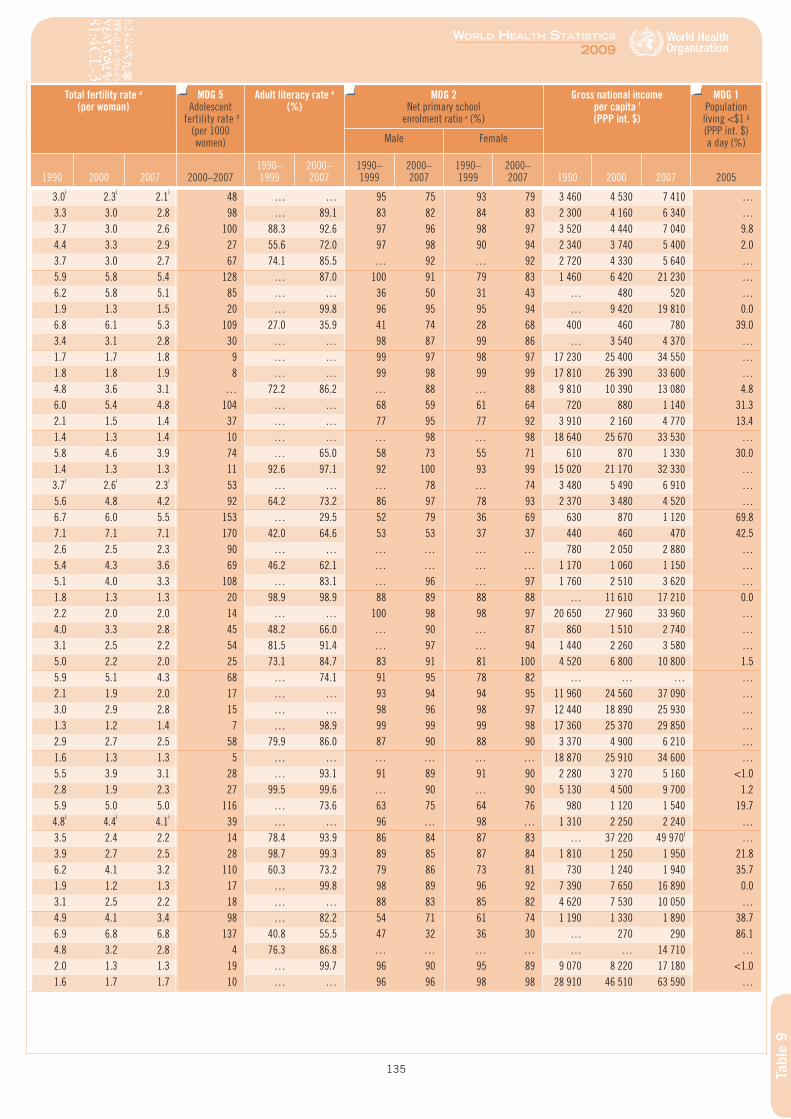
9. Demographic and socioeconomic statistics
135
World HealtH StatiSticS
2009
Tabl
e 9
Total fertility rate a (per woman)
MDG 5Adolescent
fertility rate d (per 1000 women)
Adult literacy rate e
(%)MDG 2
Net primary school enrolment ratio e (%)
Gross national income per capita f (PPP int. $)
MDG 1 Population living <$1 g (PPP int. $) a day (%)Male Female
1990 2000 2007 2000–20071990– 1999
2000–2007
1990–1999
2000–2007
1990–1999
2000–2007 1990 2000 2007 2005
3.0i 2.3i 2.1i 48 … … 95 75 93 79 3 460 4 530 7 410 …3.3 3.0 2.8 98 … 89.1 83 82 84 83 2 300 4 160 6 340 …3.7 3.0 2.6 100 88.3 92.6 97 96 98 97 3 520 4 440 7 040 9.84.4 3.3 2.9 27 55.6 72.0 97 98 90 94 2 340 3 740 5 400 2.03.7 3.0 2.7 67 74.1 85.5 … 92 … 92 2 720 4 330 5 640 …5.9 5.8 5.4 128 … 87.0 100 91 79 83 1 460 6 420 21 230 …6.2 5.8 5.1 85 … … 36 50 31 43 … 480 520 …1.9 1.3 1.5 20 … 99.8 96 95 95 94 … 9 420 19 810 0.06.8 6.1 5.3 109 27.0 35.9 41 74 28 68 400 460 780 39.03.4 3.1 2.8 30 … … 98 87 99 86 … 3 540 4 370 …1.7 1.7 1.8 9 … … 99 97 98 97 17 230 25 400 34 550 …1.8 1.8 1.9 8 … … 99 98 99 99 17 810 26 390 33 600 …4.8 3.6 3.1 … 72.2 86.2 … 88 … 88 9 810 10 390 13 080 4.86.0 5.4 4.8 104 … … 68 59 61 64 720 880 1 140 31.32.1 1.5 1.4 37 … … 77 95 77 92 3 910 2 160 4 770 13.41.4 1.3 1.4 10 … … … 98 … 98 18 640 25 670 33 530 …5.8 4.6 3.9 74 … 65.0 58 73 55 71 610 870 1 330 30.01.4 1.3 1.3 11 92.6 97.1 92 100 93 99 15 020 21 170 32 330 …3.7i 2.6i 2.3i 53 … … … 78 … 74 3 480 5 490 6 910 …5.6 4.8 4.2 92 64.2 73.2 86 97 78 93 2 370 3 480 4 520 …6.7 6.0 5.5 153 … 29.5 52 79 36 69 630 870 1 120 69.87.1 7.1 7.1 170 42.0 64.6 53 53 37 37 440 460 470 42.52.6 2.5 2.3 90 … … … … … … 780 2 050 2 880 …5.4 4.3 3.6 69 46.2 62.1 … … … … 1 170 1 060 1 150 …5.1 4.0 3.3 108 … 83.1 … 96 … 97 1 760 2 510 3 620 …1.8 1.3 1.3 20 98.9 98.9 88 89 88 88 … 11 610 17 210 0.02.2 2.0 2.0 14 … … 100 98 98 97 20 650 27 960 33 960 …4.0 3.3 2.8 45 48.2 66.0 … 90 … 87 860 1 510 2 740 …3.1 2.5 2.2 54 81.5 91.4 … 97 … 94 1 440 2 260 3 580 …5.0 2.2 2.0 25 73.1 84.7 83 91 81 100 4 520 6 800 10 800 1.55.9 5.1 4.3 68 … 74.1 91 95 78 82 … … … …2.1 1.9 2.0 17 … … 93 94 94 95 11 960 24 560 37 090 …3.0 2.9 2.8 15 … … 98 96 98 97 12 440 18 890 25 930 …1.3 1.2 1.4 7 … 98.9 99 99 99 98 17 360 25 370 29 850 …2.9 2.7 2.5 58 79.9 86.0 87 90 88 90 3 370 4 900 6 210 …1.6 1.3 1.3 5 … … … … … … 18 870 25 910 34 600 …5.5 3.9 3.1 28 … 93.1 91 89 91 90 2 280 3 270 5 160 <1.02.8 1.9 2.3 27 99.5 99.6 … 90 … 90 5 130 4 500 9 700 1.25.9 5.0 5.0 116 … 73.6 63 75 64 76 980 1 120 1 540 19.74.8i 4.4i 4.1i 39 … … 96 … 98 … 1 310 2 250 2 240 …3.5 2.4 2.2 14 78.4 93.9 86 84 87 83 … 37 220 49 970j …3.9 2.7 2.5 28 98.7 99.3 89 85 87 84 1 810 1 250 1 950 21.86.2 4.1 3.2 110 60.3 73.2 79 86 73 81 730 1 240 1 940 35.71.9 1.2 1.3 17 … 99.8 98 89 96 92 7 390 7 650 16 890 0.03.1 2.5 2.2 18 … … 88 83 85 82 4 620 7 530 10 050 …4.9 4.1 3.4 98 … 82.2 54 71 61 74 1 190 1 330 1 890 38.76.9 6.8 6.8 137 40.8 55.5 47 32 36 30 … 270 290 86.14.8 3.2 2.8 4 76.3 86.8 … … … … … … 14 710 …2.0 1.3 1.3 19 … 99.7 96 90 95 89 9 070 8 220 17 180 <1.01.6 1.7 1.7 10 … … 96 96 98 98 28 910 46 510 63 590 …
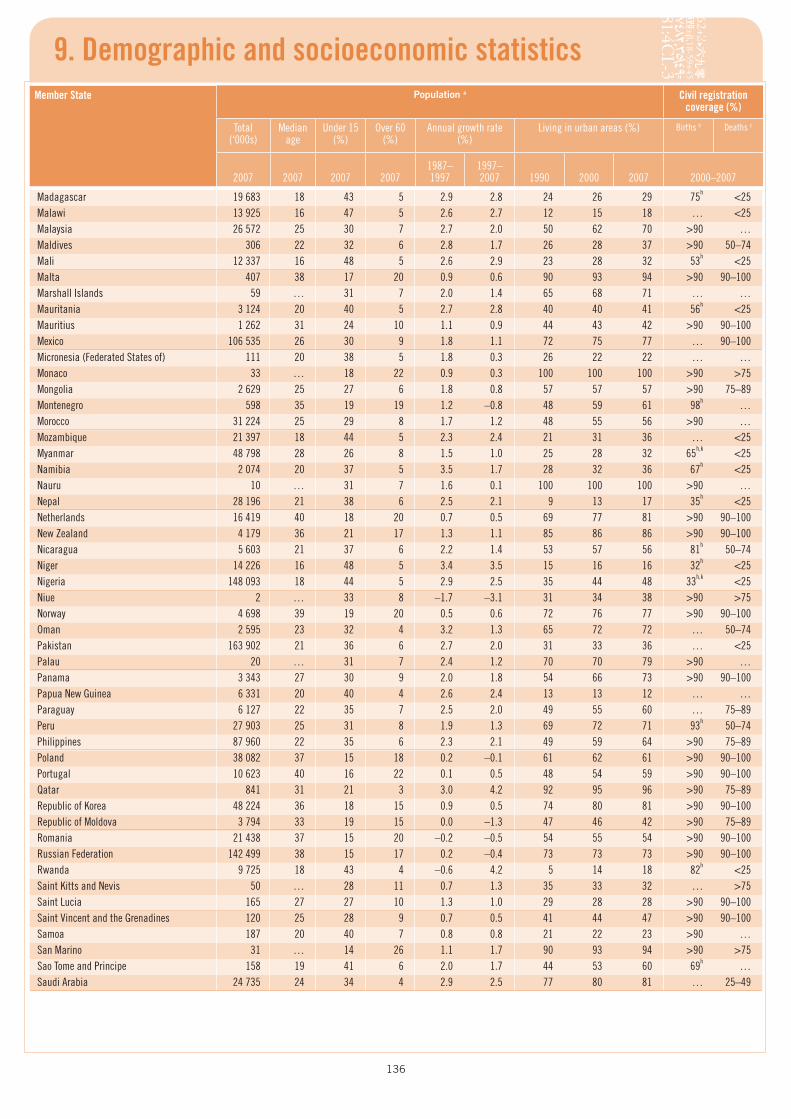
136
9. Demographic and socioeconomic statisticsMember State Population a Civil registration
coverage (%)
Total (‘000s)
Median age
Under 15 (%)
Over 60 (%)
Annual growth rate (%)
Living in urban areas (%) Births b Deaths c
2007 2007 2007 20071987– 1997
1997– 2007 1990 2000 2007 2000–2007
Madagascar 19 683 18 43 5 2.9 2.8 24 26 29 75h <25Malawi 13 925 16 47 5 2.6 2.7 12 15 18 … <25Malaysia 26 572 25 30 7 2.7 2.0 50 62 70 >90 …Maldives 306 22 32 6 2.8 1.7 26 28 37 >90 50–74Mali 12 337 16 48 5 2.6 2.9 23 28 32 53h <25Malta 407 38 17 20 0.9 0.6 90 93 94 >90 90–100Marshall Islands 59 … 31 7 2.0 1.4 65 68 71 … …Mauritania 3 124 20 40 5 2.7 2.8 40 40 41 56h <25Mauritius 1 262 31 24 10 1.1 0.9 44 43 42 >90 90–100Mexico 106 535 26 30 9 1.8 1.1 72 75 77 … 90–100Micronesia (Federated States of) 111 20 38 5 1.8 0.3 26 22 22 … …Monaco 33 … 18 22 0.9 0.3 100 100 100 >90 >75Mongolia 2 629 25 27 6 1.8 0.8 57 57 57 >90 75–89Montenegro 598 35 19 19 1.2 –0.8 48 59 61 98h …Morocco 31 224 25 29 8 1.7 1.2 48 55 56 >90 …Mozambique 21 397 18 44 5 2.3 2.4 21 31 36 … <25Myanmar 48 798 28 26 8 1.5 1.0 25 28 32 65h,k <25Namibia 2 074 20 37 5 3.5 1.7 28 32 36 67h <25Nauru 10 … 31 7 1.6 0.1 100 100 100 >90 …Nepal 28 196 21 38 6 2.5 2.1 9 13 17 35h <25Netherlands 16 419 40 18 20 0.7 0.5 69 77 81 >90 90–100New Zealand 4 179 36 21 17 1.3 1.1 85 86 86 >90 90–100Nicaragua 5 603 21 37 6 2.2 1.4 53 57 56 81h 50–74Niger 14 226 16 48 5 3.4 3.5 15 16 16 32h <25Nigeria 148 093 18 44 5 2.9 2.5 35 44 48 33h,k <25Niue 2 … 33 8 –1.7 –3.1 31 34 38 >90 >75Norway 4 698 39 19 20 0.5 0.6 72 76 77 >90 90–100Oman 2 595 23 32 4 3.2 1.3 65 72 72 … 50–74Pakistan 163 902 21 36 6 2.7 2.0 31 33 36 … <25Palau 20 … 31 7 2.4 1.2 70 70 79 >90 …Panama 3 343 27 30 9 2.0 1.8 54 66 73 >90 90–100Papua New Guinea 6 331 20 40 4 2.6 2.4 13 13 12 … …Paraguay 6 127 22 35 7 2.5 2.0 49 55 60 … 75–89Peru 27 903 25 31 8 1.9 1.3 69 72 71 93h 50–74Philippines 87 960 22 35 6 2.3 2.1 49 59 64 >90 75–89Poland 38 082 37 15 18 0.2 –0.1 61 62 61 >90 90–100Portugal 10 623 40 16 22 0.1 0.5 48 54 59 >90 90–100Qatar 841 31 21 3 3.0 4.2 92 95 96 >90 75–89Republic of Korea 48 224 36 18 15 0.9 0.5 74 80 81 >90 90–100Republic of Moldova 3 794 33 19 15 0.0 –1.3 47 46 42 >90 75–89Romania 21 438 37 15 20 –0.2 –0.5 54 55 54 >90 90–100Russian Federation 142 499 38 15 17 0.2 –0.4 73 73 73 >90 90–100Rwanda 9 725 18 43 4 –0.6 4.2 5 14 18 82h <25Saint Kitts and Nevis 50 … 28 11 0.7 1.3 35 33 32 … >75Saint Lucia 165 27 27 10 1.3 1.0 29 28 28 >90 90–100Saint Vincent and the Grenadines 120 25 28 9 0.7 0.5 41 44 47 >90 90–100Samoa 187 20 40 7 0.8 0.8 21 22 23 >90 …San Marino 31 … 14 26 1.1 1.7 90 93 94 >90 >75Sao Tome and Principe 158 19 41 6 2.0 1.7 44 53 60 69h …Saudi Arabia 24 735 24 34 4 2.9 2.5 77 80 81 … 25–49
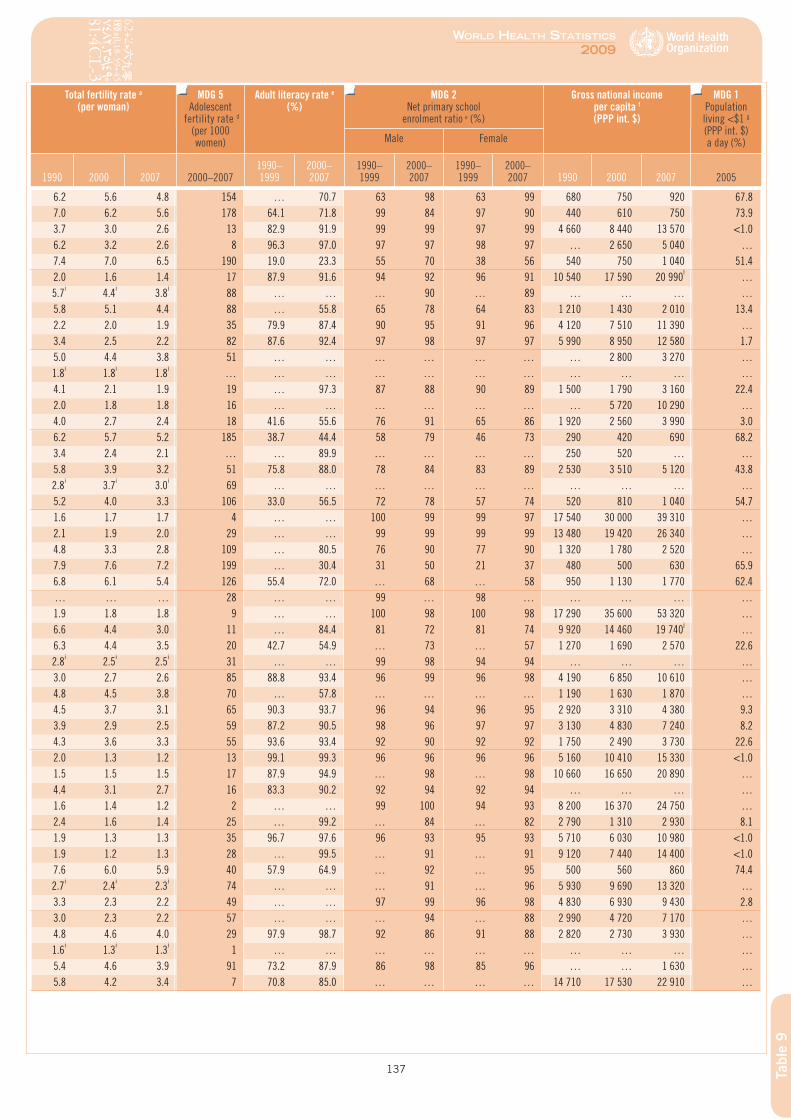
9. Demographic and socioeconomic statistics
137
World HealtH StatiSticS
2009
Tabl
e 9
Total fertility rate a (per woman)
MDG 5Adolescent
fertility rate d (per 1000 women)
Adult literacy rate e
(%)MDG 2
Net primary school enrolment ratio e (%)
Gross national income per capita f (PPP int. $)
MDG 1 Population living <$1 g (PPP int. $) a day (%)Male Female
1990 2000 2007 2000–20071990– 1999
2000–2007
1990–1999
2000–2007
1990–1999
2000–2007 1990 2000 2007 2005
6.2 5.6 4.8 154 … 70.7 63 98 63 99 680 750 920 67.87.0 6.2 5.6 178 64.1 71.8 99 84 97 90 440 610 750 73.93.7 3.0 2.6 13 82.9 91.9 99 99 97 99 4 660 8 440 13 570 <1.06.2 3.2 2.6 8 96.3 97.0 97 97 98 97 … 2 650 5 040 …7.4 7.0 6.5 190 19.0 23.3 55 70 38 56 540 750 1 040 51.42.0 1.6 1.4 17 87.9 91.6 94 92 96 91 10 540 17 590 20 990l …5.7i 4.4i 3.8i 88 … … … 90 … 89 … … … …5.8 5.1 4.4 88 … 55.8 65 78 64 83 1 210 1 430 2 010 13.42.2 2.0 1.9 35 79.9 87.4 90 95 91 96 4 120 7 510 11 390 …3.4 2.5 2.2 82 87.6 92.4 97 98 97 97 5 990 8 950 12 580 1.75.0 4.4 3.8 51 … … … … … … … 2 800 3 270 …1.8i 1.8i 1.8i … … … … … … … … … … …4.1 2.1 1.9 19 … 97.3 87 88 90 89 1 500 1 790 3 160 22.42.0 1.8 1.8 16 … … … … … … … 5 720 10 290 …4.0 2.7 2.4 18 41.6 55.6 76 91 65 86 1 920 2 560 3 990 3.06.2 5.7 5.2 185 38.7 44.4 58 79 46 73 290 420 690 68.23.4 2.4 2.1 … … 89.9 … … … … 250 520 … …5.8 3.9 3.2 51 75.8 88.0 78 84 83 89 2 530 3 510 5 120 43.82.8i 3.7i 3.0i 69 … … … … … … … … … …5.2 4.0 3.3 106 33.0 56.5 72 78 57 74 520 810 1 040 54.71.6 1.7 1.7 4 … … 100 99 99 97 17 540 30 000 39 310 …2.1 1.9 2.0 29 … … 99 99 99 99 13 480 19 420 26 340 …4.8 3.3 2.8 109 … 80.5 76 90 77 90 1 320 1 780 2 520 …7.9 7.6 7.2 199 … 30.4 31 50 21 37 480 500 630 65.96.8 6.1 5.4 126 55.4 72.0 … 68 … 58 950 1 130 1 770 62.4… … … 28 … … 99 … 98 … … … … …1.9 1.8 1.8 9 … … 100 98 100 98 17 290 35 600 53 320 …6.6 4.4 3.0 11 … 84.4 81 72 81 74 9 920 14 460 19 740j …6.3 4.4 3.5 20 42.7 54.9 … 73 … 57 1 270 1 690 2 570 22.62.8i 2.5i 2.5i 31 … … 99 98 94 94 … … … …3.0 2.7 2.6 85 88.8 93.4 96 99 96 98 4 190 6 850 10 610 …4.8 4.5 3.8 70 … 57.8 … … … … 1 190 1 630 1 870 …4.5 3.7 3.1 65 90.3 93.7 96 94 96 95 2 920 3 310 4 380 9.33.9 2.9 2.5 59 87.2 90.5 98 96 97 97 3 130 4 830 7 240 8.24.3 3.6 3.3 55 93.6 93.4 92 90 92 92 1 750 2 490 3 730 22.62.0 1.3 1.2 13 99.1 99.3 96 96 96 96 5 160 10 410 15 330 <1.01.5 1.5 1.5 17 87.9 94.9 … 98 … 98 10 660 16 650 20 890 …4.4 3.1 2.7 16 83.3 90.2 92 94 92 94 … … … …1.6 1.4 1.2 2 … … 99 100 94 93 8 200 16 370 24 750 …2.4 1.6 1.4 25 … 99.2 … 84 … 82 2 790 1 310 2 930 8.11.9 1.3 1.3 35 96.7 97.6 96 93 95 93 5 710 6 030 10 980 <1.01.9 1.2 1.3 28 … 99.5 … 91 … 91 9 120 7 440 14 400 <1.07.6 6.0 5.9 40 57.9 64.9 … 92 … 95 500 560 860 74.42.7i 2.4i 2.3i 74 … … … 91 … 96 5 930 9 690 13 320 …3.3 2.3 2.2 49 … … 97 99 96 98 4 830 6 930 9 430 2.83.0 2.3 2.2 57 … … … 94 … 88 2 990 4 720 7 170 …4.8 4.6 4.0 29 97.9 98.7 92 86 91 88 2 820 2 730 3 930 …1.6i 1.3i 1.3i 1 … … … … … … … … … …5.4 4.6 3.9 91 73.2 87.9 86 98 85 96 … … 1 630 …5.8 4.2 3.4 7 70.8 85.0 … … … … 14 710 17 530 22 910 …
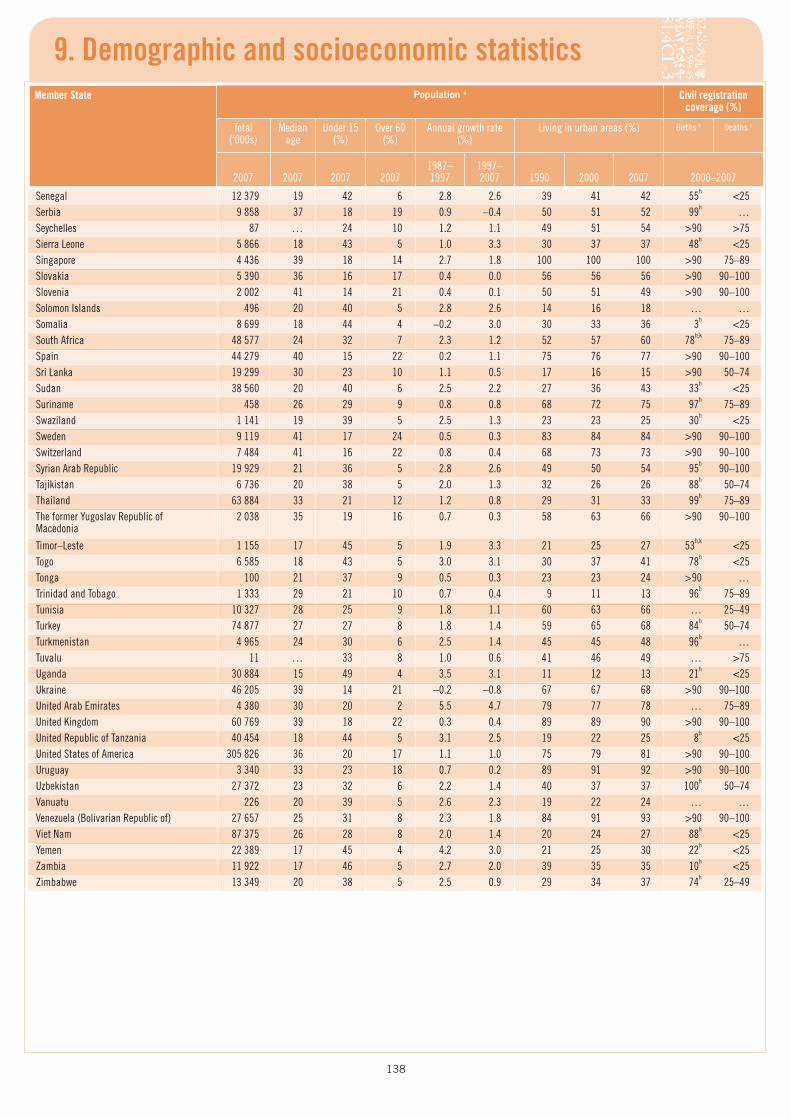
138
9. Demographic and socioeconomic statisticsMember State Population a Civil registration
coverage (%)
Total (‘000s)
Median age
Under 15 (%)
Over 60 (%)
Annual growth rate (%)
Living in urban areas (%) Births b Deaths c
2007 2007 2007 20071987– 1997
1997– 2007 1990 2000 2007 2000–2007
Senegal 12 379 19 42 6 2.8 2.6 39 41 42 55h <25Serbia 9 858 37 18 19 0.9 –0.4 50 51 52 99h …Seychelles 87 … 24 10 1.2 1.1 49 51 54 >90 >75Sierra Leone 5 866 18 43 5 1.0 3.3 30 37 37 48h <25Singapore 4 436 39 18 14 2.7 1.8 100 100 100 >90 75–89Slovakia 5 390 36 16 17 0.4 0.0 56 56 56 >90 90–100Slovenia 2 002 41 14 21 0.4 0.1 50 51 49 >90 90–100Solomon Islands 496 20 40 5 2.8 2.6 14 16 18 … …Somalia 8 699 18 44 4 –0.2 3.0 30 33 36 3h <25South Africa 48 577 24 32 7 2.3 1.2 52 57 60 78h,k 75–89Spain 44 279 40 15 22 0.2 1.1 75 76 77 >90 90–100Sri Lanka 19 299 30 23 10 1.1 0.5 17 16 15 >90 50–74Sudan 38 560 20 40 6 2.5 2.2 27 36 43 33h <25Suriname 458 26 29 9 0.8 0.8 68 72 75 97h 75–89Swaziland 1 141 19 39 5 2.5 1.3 23 23 25 30h <25Sweden 9 119 41 17 24 0.5 0.3 83 84 84 >90 90–100Switzerland 7 484 41 16 22 0.8 0.4 68 73 73 >90 90–100Syrian Arab Republic 19 929 21 36 5 2.8 2.6 49 50 54 95h 90–100Tajikistan 6 736 20 38 5 2.0 1.3 32 26 26 88h 50–74Thailand 63 884 33 21 12 1.2 0.8 29 31 33 99h 75–89The former Yugoslav Republic of Macedonia
2 038 35 19 16 0.7 0.3 58 63 66 >90 90–100
Timor–Leste 1 155 17 45 5 1.9 3.3 21 25 27 53h,k <25Togo 6 585 18 43 5 3.0 3.1 30 37 41 78h <25Tonga 100 21 37 9 0.5 0.3 23 23 24 >90 …Trinidad and Tobago 1 333 29 21 10 0.7 0.4 9 11 13 96h 75–89Tunisia 10 327 28 25 9 1.8 1.1 60 63 66 … 25–49Turkey 74 877 27 27 8 1.8 1.4 59 65 68 84h 50–74Turkmenistan 4 965 24 30 6 2.5 1.4 45 45 48 96h …Tuvalu 11 … 33 8 1.0 0.6 41 46 49 … >75Uganda 30 884 15 49 4 3.5 3.1 11 12 13 21h <25Ukraine 46 205 39 14 21 –0.2 –0.8 67 67 68 >90 90–100United Arab Emirates 4 380 30 20 2 5.5 4.7 79 77 78 … 75–89United Kingdom 60 769 39 18 22 0.3 0.4 89 89 90 >90 90–100United Republic of Tanzania 40 454 18 44 5 3.1 2.5 19 22 25 8h <25United States of America 305 826 36 20 17 1.1 1.0 75 79 81 >90 90–100Uruguay 3 340 33 23 18 0.7 0.2 89 91 92 >90 90–100Uzbekistan 27 372 23 32 6 2.2 1.4 40 37 37 100h 50–74Vanuatu 226 20 39 5 2.6 2.3 19 22 24 … …Venezuela (Bolivarian Republic of) 27 657 25 31 8 2.3 1.8 84 91 93 >90 90–100Viet Nam 87 375 26 28 8 2.0 1.4 20 24 27 88h <25Yemen 22 389 17 45 4 4.2 3.0 21 25 30 22h <25Zambia 11 922 17 46 5 2.7 2.0 39 35 35 10h <25Zimbabwe 13 349 20 38 5 2.5 0.9 29 34 37 74h 25–49
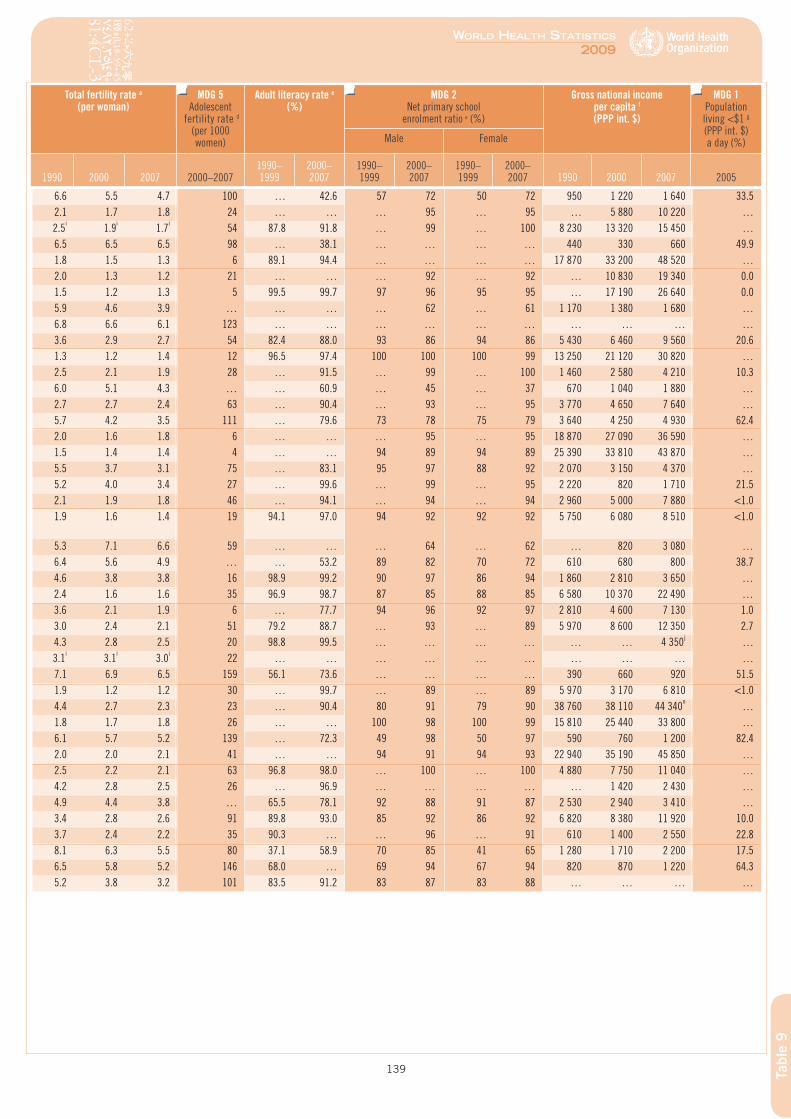
9. Demographic and socioeconomic statistics
139
World HealtH StatiSticS
2009
Tabl
e 9
Total fertility rate a (per woman)
MDG 5Adolescent
fertility rate d (per 1000 women)
Adult literacy rate e
(%)MDG 2
Net primary school enrolment ratio e (%)
Gross national income per capita f (PPP int. $)
MDG 1 Population living <$1 g (PPP int. $) a day (%)Male Female
1990 2000 2007 2000–20071990– 1999
2000–2007
1990–1999
2000–2007
1990–1999
2000–2007 1990 2000 2007 2005
6.6 5.5 4.7 100 … 42.6 57 72 50 72 950 1 220 1 640 33.52.1 1.7 1.8 24 … … … 95 … 95 … 5 880 10 220 …2.5i 1.9i 1.7i 54 87.8 91.8 … 99 … 100 8 230 13 320 15 450 …6.5 6.5 6.5 98 … 38.1 … … … … 440 330 660 49.91.8 1.5 1.3 6 89.1 94.4 … … … … 17 870 33 200 48 520 …2.0 1.3 1.2 21 … … … 92 … 92 … 10 830 19 340 0.01.5 1.2 1.3 5 99.5 99.7 97 96 95 95 … 17 190 26 640 0.05.9 4.6 3.9 … … … … 62 … 61 1 170 1 380 1 680 …6.8 6.6 6.1 123 … … … … … … … … … …3.6 2.9 2.7 54 82.4 88.0 93 86 94 86 5 430 6 460 9 560 20.61.3 1.2 1.4 12 96.5 97.4 100 100 100 99 13 250 21 120 30 820 …2.5 2.1 1.9 28 … 91.5 … 99 … 100 1 460 2 580 4 210 10.36.0 5.1 4.3 … … 60.9 … 45 … 37 670 1 040 1 880 …2.7 2.7 2.4 63 … 90.4 … 93 … 95 3 770 4 650 7 640 …5.7 4.2 3.5 111 … 79.6 73 78 75 79 3 640 4 250 4 930 62.42.0 1.6 1.8 6 … … … 95 … 95 18 870 27 090 36 590 …1.5 1.4 1.4 4 … … 94 89 94 89 25 390 33 810 43 870 …5.5 3.7 3.1 75 … 83.1 95 97 88 92 2 070 3 150 4 370 …5.2 4.0 3.4 27 … 99.6 … 99 … 95 2 220 820 1 710 21.52.1 1.9 1.8 46 … 94.1 … 94 … 94 2 960 5 000 7 880 <1.01.9 1.6 1.4 19 94.1 97.0 94 92 92 92 5 750 6 080 8 510 <1.0
5.3 7.1 6.6 59 … … … 64 … 62 … 820 3 080 …6.4 5.6 4.9 … … 53.2 89 82 70 72 610 680 800 38.74.6 3.8 3.8 16 98.9 99.2 90 97 86 94 1 860 2 810 3 650 …2.4 1.6 1.6 35 96.9 98.7 87 85 88 85 6 580 10 370 22 490 …3.6 2.1 1.9 6 … 77.7 94 96 92 97 2 810 4 600 7 130 1.03.0 2.4 2.1 51 79.2 88.7 … 93 … 89 5 970 8 600 12 350 2.74.3 2.8 2.5 20 98.8 99.5 … … … … … … 4 350j …3.1i 3.1i 3.0i 22 … … … … … … … … … …7.1 6.9 6.5 159 56.1 73.6 … … … … 390 660 920 51.51.9 1.2 1.2 30 … 99.7 … 89 … 89 5 970 3 170 6 810 <1.04.4 2.7 2.3 23 … 90.4 80 91 79 90 38 760 38 110 44 340n …1.8 1.7 1.8 26 … … 100 98 100 99 15 810 25 440 33 800 …6.1 5.7 5.2 139 … 72.3 49 98 50 97 590 760 1 200 82.42.0 2.0 2.1 41 … … 94 91 94 93 22 940 35 190 45 850 …2.5 2.2 2.1 63 96.8 98.0 … 100 … 100 4 880 7 750 11 040 …4.2 2.8 2.5 26 … 96.9 … … … … … 1 420 2 430 …4.9 4.4 3.8 … 65.5 78.1 92 88 91 87 2 530 2 940 3 410 …3.4 2.8 2.6 91 89.8 93.0 85 92 86 92 6 820 8 380 11 920 10.03.7 2.4 2.2 35 90.3 … … 96 … 91 610 1 400 2 550 22.88.1 6.3 5.5 80 37.1 58.9 70 85 41 65 1 280 1 710 2 200 17.56.5 5.8 5.2 146 68.0 … 69 94 67 94 820 870 1 220 64.35.2 3.8 3.2 101 83.5 91.2 83 87 83 88 … … … …
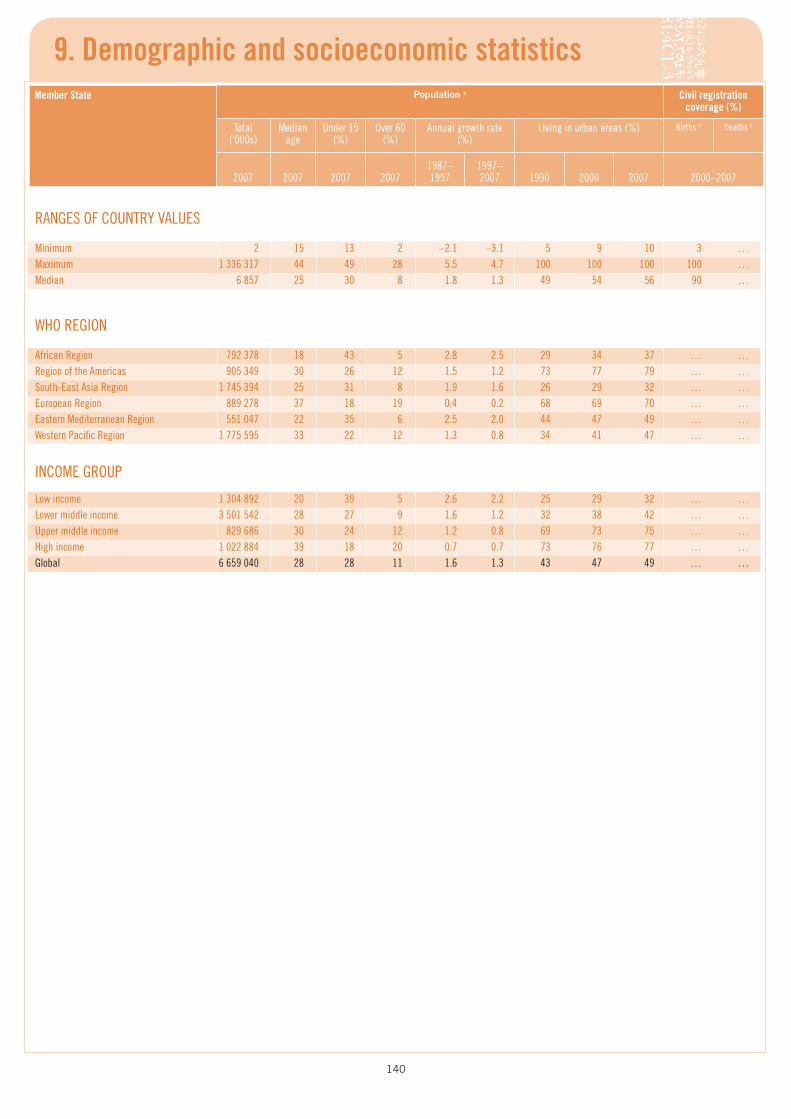
140
9. Demographic and socioeconomic statisticsMember State Population a Civil registration
coverage (%)
Total (‘000s)
Median age
Under 15 (%)
Over 60 (%)
Annual growth rate (%)
Living in urban areas (%) Births b Deaths c
2007 2007 2007 20071987– 1997
1997– 2007 1990 2000 2007 2000–2007
RANGES OF COUNTRY VALUES
Minimum 2 15 13 2 –2.1 –3.1 5 9 10 3 …Maximum 1 336 317 44 49 28 5.5 4.7 100 100 100 100 …Median 6 857 25 30 8 1.8 1.3 49 54 56 90 …
WHO REGION
African Region 792 378 18 43 5 2.8 2.5 29 34 37 … …Region of the Americas 905 349 30 26 12 1.5 1.2 73 77 79 … …South-East Asia Region 1 745 394 25 31 8 1.9 1.6 26 29 32 … …European Region 889 278 37 18 19 0.4 0.2 68 69 70 … …Eastern Mediterranean Region 551 047 22 35 6 2.5 2.0 44 47 49 … …Western Pacific Region 1 775 595 33 22 12 1.3 0.8 34 41 47 … …
INCOME GROUP
Low income 1 304 892 20 39 5 2.6 2.2 25 29 32 … …Lower middle income 3 501 542 28 27 9 1.6 1.2 32 38 42 … …Upper middle income 829 686 30 24 12 1.2 0.8 69 73 75 … …High income 1 022 884 39 18 20 0.7 0.7 73 76 77 … …Global 6 659 040 28 28 11 1.6 1.3 43 47 49 … …
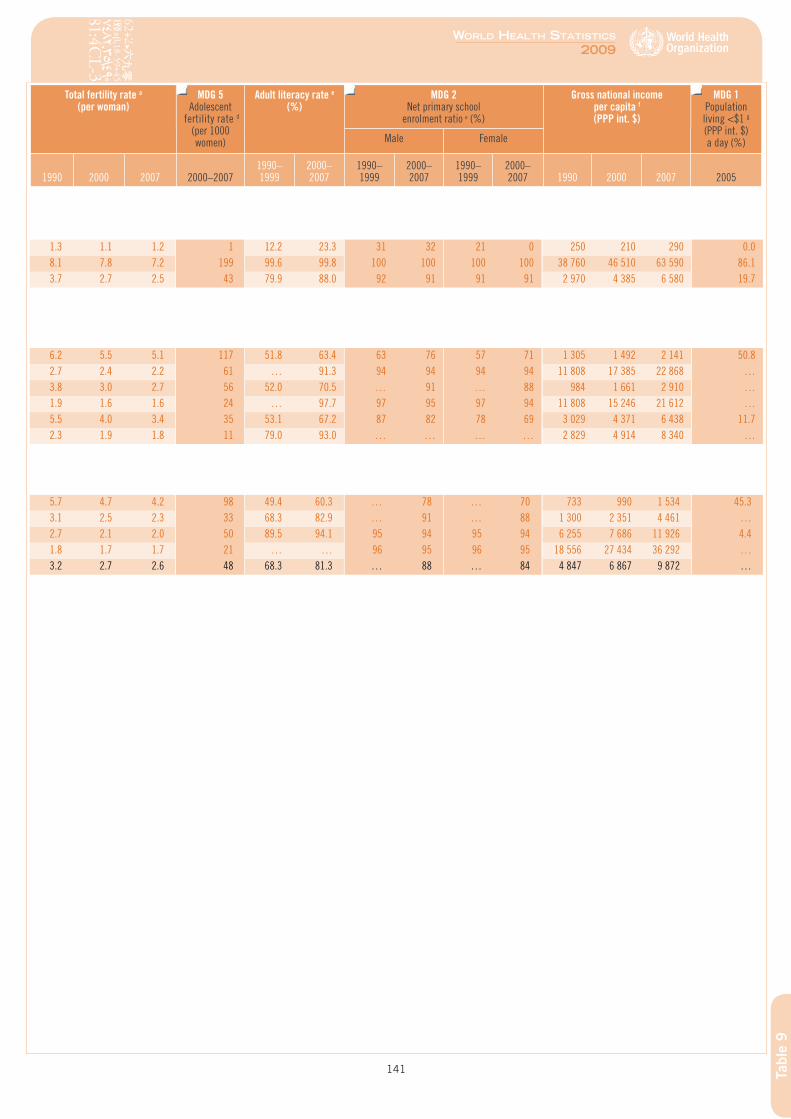
9. Demographic and socioeconomic statistics
141
World HealtH StatiSticS
2009
Tabl
e 9
Total fertility rate a (per woman)
MDG 5Adolescent
fertility rate d (per 1000 women)
Adult literacy rate e
(%)MDG 2
Net primary school enrolment ratio e (%)
Gross national income per capita f (PPP int. $)
MDG 1 Population living <$1 g (PPP int. $) a day (%)Male Female
1990 2000 2007 2000–20071990– 1999
2000–2007
1990–1999
2000–2007
1990–1999
2000–2007 1990 2000 2007 2005
1.3 1.1 1.2 1 12.2 23.3 31 32 21 0 250 210 290 0.08.1 7.8 7.2 199 99.6 99.8 100 100 100 100 38 760 46 510 63 590 86.13.7 2.7 2.5 43 79.9 88.0 92 91 91 91 2 970 4 385 6 580 19.7
6.2 5.5 5.1 117 51.8 63.4 63 76 57 71 1 305 1 492 2 141 50.82.7 2.4 2.2 61 … 91.3 94 94 94 94 11 808 17 385 22 868 …3.8 3.0 2.7 56 52.0 70.5 … 91 … 88 984 1 661 2 910 …1.9 1.6 1.6 24 … 97.7 97 95 97 94 11 808 15 246 21 612 …5.5 4.0 3.4 35 53.1 67.2 87 82 78 69 3 029 4 371 6 438 11.72.3 1.9 1.8 11 79.0 93.0 … … … … 2 829 4 914 8 340 …
5.7 4.7 4.2 98 49.4 60.3 … 78 … 70 733 990 1 534 45.33.1 2.5 2.3 33 68.3 82.9 … 91 … 88 1 300 2 351 4 461 …2.7 2.1 2.0 50 89.5 94.1 95 94 95 94 6 255 7 686 11 926 4.41.8 1.7 1.7 21 … … 96 95 96 95 18 556 27 434 36 292 …3.2 2.7 2.6 48 68.3 81.3 … 88 … 84 4 847 6 867 9 872 …
142
Footnotes
These summary tables represent the best estimates of WHO – based on evidence available in 2004 – rather than the official estimates of Member States. These estimates have been computed using standard categories and methods to ensure cross-national comparability. Therefore, they are not always the same as official national estimates, nor necessarily endorsed by specific Member States.
For indicators with a reference period expressed as a range, figures refer to the latest available year in the range; except in Health inequities, where the figures refer to the period specified. For specific years, indicator definitions and metadata, please refer to http://www.who.int/whosis.
... Data not available or not applicable.
The global, regional and income aggregates for rates and ratios are weighted averages when relevant while for absolute numbers they are the sums. Certain Member States do not have an associated income group and are not included in aggregate calculations. Aggregates are calculated only if data are available for 50% of the population within the group.
Table 1 Mortality and burden of diseasea Life tables for WHO Member States. Geneva, World Health Organization, 2009 (http://www.who.int/whosis/database/
life_tables/life_tables.cfm).b Healthy life expectancy (HALE) estimates use methods described in the statistical annex to The world health report 2004 –
Changing history. Estimates for 2007 have been revised to take into account the Global Burden of Disease estimates for Member States for the year 2004 and may not be entirely comparable with those for 2002 published in World Health Statistics 2007. These estimates have been computed using standard categories and methods to ensure cross-national comparability. Therefore, they are not always the same as official national estimates, nor necessarily endorsed by specific Member States.
c Neonatal and perinatal mortality: country, regional and global estimates 2004. Geneva, World Health Organization, 2007 (http://whqlibdoc.who.int/publications/2007/9789241596145_eng.pdf ).
Table 2 Cause-specific mortality and morbidity a Maternal mortality in 2005: estimates developed by WHO, UNICEF, UNFPA and the World Bank. Geneva, World Health
Organization, 2007 (http://www.who.int/reproductive-health/publications/maternal_mortality_2005/mme_2005.pdf ). Income group aggregates are calculated using World Bank list of economies 2005.
b Based on the 2008 report on the global AIDS epidemic. Geneva, UNAIDS and World Health Organization, 2008. See Annex: HIV and AIDS estimates and data, 2007 and 2001 (http://data.unaids.org/pub/GlobalReport/2008/jc1510_2008_global_report_pp211_234_en.pdf ). Ranges of estimates are available from this document.
c World malaria report 2008. Geneva, World Health Organization, 2008 (http://www.who.int/malaria/wmr2008). See Annex 1: Estimating the numbers of malaria cases and deaths by country in 2006.
d These are classified as deaths from tuberculosis (A15–A19, B90) according to the International statistical classification of diseases and related health problems, tenth revision. Geneva, World Health Organization, 1992. Global tuberculosis control : epidemiology, planning, financing : WHO report 2009. Geneva, World Health Organization, 2009 (WHO/HTM/TB/2009.411) (http://www.who.int/tb/publications/global_report).
e These deaths are classified as HIV disease resulting in tuberculosis (B20.0) according to the International statistical classification of diseases and related health problems, tenth revision. Geneva, World Health Organization, 1992. They are already counted in the number of deaths from HIV/AIDS (B20–B24). Global tuberculosis control : epidemiology, planning, financing : WHO report 2009. Geneva, World Health Organization, 2009 (WHO/HTM/TB/2009.411) (http://www.who.int/tb/publications/global_report).
f Mortality and burden of disease estimates for WHO Member States in 2004. Geneva, World Health Organization, 2009 (http://www.who.int/entity/healthinfo/statistics/bodgbddeathdalyestimates.xls).
g Rates are age-standardized to WHO’s world standard population. Ahmad OB, Boschi-Pinto C, Lopez AD, Murray CJL, Lozano R, Inoue M. Age standardization of rates: a new WHO standard. Geneva, World Health Organization, 2001 (GPE Discussion Paper Series No. 31) (http://www.who.int/healthinfo/paper31.pdf ).
h YLL, years of life lost.
143
World HealtH StatiSticS
2009
Foot
note
s
i The sum of individual proportions may not add up to 100% due to rounding.j Communicable diseases include maternal causes, conditions arising during the perinatal period and nutritional deficiencies.k Neonatal causes include diarrhoea occurring during the neonatal period. Bryce J, Boschi-Pinto C, Shibuya K, Black RE,
WHO Child Health Epidemiology Reference Group. WHO estimates of the causes of death in children. Lancet, 2005, 365:1147–1152. Mortality profiles. Geneva, World Health Organization, 2009 (http://www.who.int/whosis/mort/profiles/en/). Neonatal causes represent causes arising in the perinatal period which is a subset of the causes of death in the neonatal period.
l TB, tuberculosis. Data are for all forms of TB including TB in people with HIV infection. Global tuberculosis control: epidemiology, planning, financing: WHO report 2009. Geneva, World Health Organization, 2009 (WHO/HTM/TB/2009.411) (http://www.who.int/tb/publications/global_report).
Table 3 Selected infectious diseasesa Cholera, 2007. Weekly epidemiological record, 2008, 31:269–284 (http://www.who.int/wer).b WHO/UNICEF estimates of disease incidence [online database]. Geneva, World Health Organization, 2008 (http://www.
who.int/immunization_monitoring/en/globalsummary/timeseries/tsincidencedip.htm).c Confirmed cases reported to WHO’s Department of Epidemic and Pandemic Alert and Response.d Cases are confirmed by laboratory testing.e Global leprosy situation, beginning of 2008. Weekly epidemiological record, 2008, 33:293–300 (http://www.who.int/wer).f World malaria report 2008. Geneva, World Health Organization, 2008 (http://www.who.int/malaria/wmr2008/).g Suspected meningitis cases reported to WHO’s Department of Epidemic and Pandemic Alert and Response. h Cases compiled by the WHO Regional Office for Africa.i Number of new smear-positive cases notified under DOTS to WHO. Global tuberculosis control : epidemiology, planning,
financing : WHO report 2009. Geneva, World Health Organization, 2009 (WHO/HTM/TB/2009.411) (http://www.who.int/tb/publications/global_report).
Table 4 Health service coverage a WHO reproductive health indicators database, 2008 update. Geneva, World Health Organization, 2009 (http://www.who.
int/reproductive-health/global_monitoring/RHRxmls/RHRmainpage.htm).b WHO global database on births attended by skilled health personnel, 2008 update. Geneva, World Health Organization, 2009.
(http://www.who.int/reproductive-health/global_monitoring/index.html).c Proportion of neonates protected at birth against neonatal tetanus through maternal immunization with tetanus toxoid,
based on a mathematical model taking into account the mother’s immunization in infancy, during pregnancy and in tetanus campaigns. The model is described in: Griffiths UK, Wolfson LJ, Quddus A, Younus M, Hafiz RA. Incremental cost–effectiveness of supplementary immunization activities to prevent neonatal tetanus in Pakistan. Bulletin of the World Health Organization, 2004, 82:643–651.
d Measles, measles-containing vaccines (MCV); DTP3, 3 doses of diphtheria–tetanus toxoid–pertussis vaccine; HepB3, 3 doses of hepatitis B vaccine; Hib3, 3 doses of Haemophilus influenzae type B vaccine. WHO/UNICEF estimates of national immunization coverage [online database]. Geneva, World Health Organization, 2008 (http://www.who.int/immunization_monitoring/routine/immunization_coverage/en/index4.html). Estimates based on data available up to September 2008. For countries recommending the first dose of measles vaccine in children older than 12 months of age, the indicator is calculated as the proportion of children less than 24 months of age receiving one dose of measles-containing vaccine.
e Data compiled by WHO from Demographic and Health Surveys (DHS) and Multiple Indicator Cluster Surveys (MICS). (http://www.measuredhs.com, http://www.unicef.org/statistics/index_24302.html).
f World malaria report 2008. Geneva, World Health Organization, 2008 (http://www.who.int/malaria/wmr2008). See Annex 6.g Women with unmet need are those who are married or cohabiting and reportedly fertile but not using contraception at the
time of the survey, and who reported not wanting any more children or wanting to delay the next child.
144
Footnotes
h World contraceptive use 2007 [wall chart]. New York, Population Division, Department of Economic and Social Affairs, United Nations Secretariat, 2008.
i PMTCT, prevention of mother-to-child transmission. Point estimates are published only for countries with a generalized epidemic. Regional and level-of-income aggregates are based on data for all low- and middle-income countries when available.
j Towards universal access: scaling up priority HIV/AIDS interventions in the health sector: progress report, 2008. Geneva, World Health Organization, Joint United Nations Programme on HIV/AIDS, United Nations Children’s Fund, 2008. Ranges of estimates are available from this document.
k TB, tuberculosis; DOTS, internationally recommended TB control strategy. The detection rate is the number of new smear-positive cases notified under DOTS to WHO divided by the estimated number of new smear-positive cases. Global tuberculosis control : epidemiology, planning, financing : WHO report 2009. Geneva, World Health Organization, 2009 (WHO/HTM/TB/2009.411) (http://www.who.int/tb/publications/global_report).
l The treatment success rate is the percentage of new smear-positive patients registered for treatment under DOTS who were cured (with laboratory confirmation) or completed their course of treatment. Global tuberculosis control : epidemiology, planning, financing : WHO report 2009. Geneva, World Health Organization, 2009 (WHO/HTM/TB/2009.411) (http://www.who.int/tb/publications/global_report).
m Data are preliminary or provisional. n Includes <5% of deliveries by cadres of health workers other than doctors, nurses and midwives.o Data pertain to sexually active women of reproductive age.p Institutional births. q Includes deliveries by cadres of health workers other than doctors, nurses and midwives – range not available.r Includes >15% of deliveries by cadres of health workers other than doctors, nurses and midwives.s Includes 5–15% of deliveries by cadres of health workers other than doctors, nurses and midwives.t Unmet for contraceptives reported by women who wish to limit the number of pregnancies they have.u Data pertain to men and women of reproductive age who are cohabiting.v 5 or more visits. w Estimate.x Unmet need for modern methods of contraception.y 3 or more visits.z Data pertain to all women of reproductive age.aa Data from the public sector only.ab Including women in non-cohabiting but regular partnerships.ac 6 or more visits.ad Excluding Northern Ireland.
Table 5 Risk factors a Joint monitoring programme for water supply and sanitation [online database]. Geneva, WHO, UNICEF, 2008 (http://www.
wssinfo.org/en/wecome.html). b UNICEF global database on low birthweight. New York, UNICEF, 2008 (http://www.childinfo.org/low_birthweight_
profiles.php).
c WHO global data bank on infant and young child feeding [online database]. Geneva, World Health Organization, 2009 (http://www.who.int/nutrition/databases/infantfeeding/en/index.html).
145
World HealtH StatiSticS
2009
Foot
note
s
d Global database on child growth and malnutrition [online database]. Geneva, World Health Organization, 2008 (http://www.who.int/nutgrowthdb/database/en). Prevalence estimates are based on WHO standards.
e Comparisons between countries may be limited owing to differences in sample characteristics or survey years. Source: Global database on body mass index (BMI) [online database]. Geneva, World Health Organization, 2008 (http://www.who.int/bmi).
f Global information system on alcohol and health [online database]. Geneva, World Health Organization, 2008 (http://www.who.int/globalatlas/DataQuery/default.asp).
g WHO report on the global tobacco epidemic, 2008: The MPOWER Package. Geneva, World Health Organization, 2008. See Appendix III, Age Standardized Prevalence Estimates for WHO Member States. Definition: Smoking at the time of the survey of any form of tobacco, including cigarettes, cigars, pipes, bidis, etc. For calculating the global number of smokers, non-age standardized prevalence estimates are used.
h WHO/CDC global youth tobacco survey (GYTS). Geneva, World Health Organization, 2009 (http://www.cdc.gov/tobacco/global/GYTS/results.htm). Data relate to tobacco use in any form in the past 30 days.
i Percentage of women and men aged 15–49 who had more than one sexual partner in the past 12 months reporting the use of a condom during their last sexual intercourse. Data is from Demographic and Health Surveys (DHS) and excludes country reported data. 2008 report on the global AIDS epidemic. Geneva, Joint United Nations Programme on HIV/AIDS, World Health Organization, 2008. See Annex 2: Country Progress Indicators.
j Percentage of young women and men aged 15–24 who both correctly identify ways of preventing the sexual transmission of HIV and who reject major misconceptions about HIV transmission. Data is from Demographic and Health Surveys (DHS) and Multiple Indicator Cluster Surveys (MICS) and excludes country reported data. 2008 report on the global AIDS epidemic. Geneva, Joint United Nations Programme on HIV/AIDS, World Health Organization, 2008. See Annex 2: Country Progress Indicators.
k City surveys were extrapolated into country figures reported here.l Lower limit is greater than15. m Upper limit is 49.n Upper limit is between 54 and 60.o Self-reported data.p Data was not validated by country focal point in time for publication of this report.q Upper limit is greater than or equal to 65. r Upper limit is 64.
Table 6 Health workforce, infrastructure, essential medicines a Source: WHO global atlas of the health workforce. Geneva, World Health Organization, 2008 (http://www.who.int/
globalatlas/autologin/hrh_login.asp). Please see this source for the latest updates, disaggregated health workforce statistics and metadata descriptors.
b Depending on the organization of the national health system and data availability, may include a large range of cadres of health service providers such as pharmacists, laboratory health workers, environmental and public health workers, medical assistants, dieticians and nutritionists, rehabilitation therapists, operators of medical and dentistry equipment, optometrists and opticians, personal care workers, psychologists, traditional medicine practitioners and others.
c Sources: PAHO basic indicators 2008. Washington, DC, Pan American Health Organization, 2008 (http://www.paho.org/English/SHA/coredata/tabulator/newTabulator.htm); European health for all database (HFA-DB). Copenhagen, WHO Regional Office for Europe, 2008 (http://data.euro.who.int/hfadb); Country health information profiles (CHIPS). Manila, WHO Regional Office for the Western Pacific, 2008 (http://www.wpro.who.int/countries/countries.htm); Core health indicators and MDGs. New Delhi, WHO Regional Office for South-East Asia, 2008 (http://203.90.70.117/esidas/CoreHealthData.asp); additional data compiled by WHO Regional Office for Africa and WHO Regional Office for the Eastern Mediterranean.
d Source: Surveys of medicine prices and availability using WHO/HAI standard methods conducted between 2001 and 2007. Available from http://www.haiweb.org/medicineprices/. In individual surveys, availability is reported as the percentage of medicine outlets in which a medicine was found on the day of data collection. As baskets of medicines
146
Footnotes
differ by country, results are not exactly comparable across countries. Median availability is determined for the specific list of medicines in each survey and do not account for alternate dosage forms or strengths of these products or therapeutic alternatives. Public sector data may be limited by the fact that the list of survey medicines may not correspond to national essential medicine lists (where these exist), and some public sector facilities may not be expected to stock all of the survey medicines. This has been addressed in the revised edition of the survey tool, which allows public sector data to be analysed by essential medicine list status and level of care.
e Consumer price ratio = ratio of median local unit price to Management Sciences for Health (MSH) international reference price of selected generic medicines. Source: Surveys of medicine prices and availability using WHO/HAI standard methods conducted between 2001 and 2007. Available from http://www.haiweb.org/medicineprices/. Data are unadjusted for differences in MSH reference price year used, exchange rate fluctuations, national inflation rates, variations in purchasing power parities, levels of development or other factors. In each survey, median consumer price ratios are obtained for the basket of medicines surveyed and found in at least four medicine outlets. As baskets of medicines differ by country, results are not exactly comparable across countries. However, data about specific medicines is publicly available on http://www.haiweb.org/medicineprices/ and matched basket comparisons on a subset of medicines can be made.
f Hospital beds include inpatient and maternity beds. Maternity beds are included, while cots and delivery beds are excluded.g Data refer to year prior to 2000.h Availability data were excluded as they were assessed using different methods from those used in the current WHO/HAI
method. i Did not survey public sector medicine outlets.j Refers to the public sector only.k Simple average of two surveys of medicine prices and availability in Shandong and Shanghai provinces, China. l Medicines are provided free to patients in the public sector. m Simple average of seven surveys of medicine prices and availability in India (Chennai, Haryana, Karnataka, Maharashtra
(12 districts), Maharashtra (4 regions), Rajasthan and West Bengal).n As per modifications to the WHO/HAI standard methodology for measuring medicine price and availability, mean %
availability is reported.o Based on a survey of medicine prices and availability in Gauteng province, South Africa.p Simple average of three surveys of medicine prices and availability in Sudan (Gadarif, Khartoum and Kordofan states).
Table 7 Health expenditures a Health expenditure series. Geneva, World Health Organization, February 2009 (latest updates are available on http://
www.who.int.nha/country/en/index.html). The regional, income and global figures are calculated using Purchasing Power Parity (PPP) terms. Ratios with numbers less than 0.05% may appear as zero. For per capita expenditure indicators, this is represented as <1. Countries where fiscal year begins in July; expenditure data have been allocated to the later calendar year, e.g. data for 2006 are for fiscal year 2005–2006.
b In some cases the sum of the ratios of general government and private expenditures on health may not add to 100 because of rounding.
c A new Purchasing Power Parity (PPP) series resulting from the 2005 International Comparison Project (ICP) estimated by the World Bank has been used.
d Estimates should be interpreted with caution as these are derived from scarce data.e Ratios published in this report are calculated using the licit GDP (i.e. excluding opium) and government expenditures
excluding external development budget expenditures.f Missing per capita expenditure on health levels are due to nonavailability of purchasing power parity. International $ values.g About 30% of the expenditure in residential aged care facilities has a health purpose, but it is difficult to estimate routinely
so it is not included in health at present. This health expenditure was about $2.1 billion in 2005–2006 or 0.2% of GDP.
147
World HealtH StatiSticS
2009
Foot
note
s
h Adjustments for currency change were made for the entire series.i Per capita expenditure on health levels is based on preliminary purchasing power parity international $ estimates.j Estimates updated using newly accessed data from national health accounts, surveys, or information provided during
national consultation.k The General Government Expenditure on Health (GGHE) and Private Expenditure on Health (PvtHE) estimates for 2000
correspond to the concepts and definitions described in OECD Health Data, also implemented by WHO/NHA. The GGHE and PvtHE estimates for 2006 correspond to the concepts and definitions adopted by the Joint Health Accounts Questionnaire Eurostat-OECD-WHO.
l For description of 2000 estimates see WHO/NHA web site. 2006 estimates correspond to the concepts and definitions adopted by the Joint Health Accounts Questionnaire Eurostat-OECD-WHO.
m Recent census in the country has shown differences in population data. However, the per capita levels in this table are estimated based on UNPOP data.
n Data for financial year ending 30 June are taken for the later year. Population data revised with United Nations Population Division 2006 revision.
o Exchange rate changed from 2.15 Won in 2001 to 152 Won in 2002. This explains sudden changes in per capita levels between 2000 and 2005.
p The sources of the data reported are financial accounts not the satellite accounts.q Healh expenditure data and the population data after year 2000 do not include those of Transdniestria.r Exchange rate changed in 2002 from multiple to a managed floating exchange rate. Inter-bank market rate used prior to 2002.s The estimates do not include expenditures of northern Iraq. t The public expenditure on health includes contributions from the United Nations Relief and Works Agency for Palestine
Refugees in the Near East (UNRWA) to Palestinian refugees residing in Jordanian territories.u After the declaration of independence on 3 June 2006, Serbia and Montenegro are now separate states. Health expenditures
for the previous years have been estimated separately for each of the countries.v The market exchange rate is used to estimate the per capita figures.w The estimates do not include the expenditures of the provinces of Kosovo and Metohia, which are under the administration
of the United Nations.x The exchange rate used for Syrian Arab Republic is the rate for non-commercial transactions from the Central Bank of Syria.y GDP does not include the income from petroleum.z Fiscal year ended in June up to 2007. Transition period second quarter of 2007 to make fiscal year equal to calendar year.
Expenditure data have been allocated to the previous calendar year, e.g. data for 2005 are for fiscal year 2005–2006 and adjusted for 2007.
Table 8 Health inequities a Sources: Unless otherwise stated, data are derived from Demographic and Health Surveys (DHS) since 1990. The DHS
figures stratified by “place of residence” and “educational level of mother” were extracted using STATcompiler software or DHS reports (http://www.measuredhs.com/, accessed on December 1, 2008). The DHS figures stratified by “wealth quintile” were extracted from DHS reports. When not available in the reports – mostly the case in surveys conducted in 2001 or earlier – the figures were extracted from Gwatkin DR, Rutstein S, Johnson K, Suliman E, Wagstaff A, Amouzou A. Socio-economic differences in health, nutrition and population within developing countries: an overview. Washington, DC, World Bank, 2007 (http://go.worldbank.org/XJK7WKSE40). The figures in the “difference” columns may be affected by rounding.
b Data derived from DHS relate to births occurring in the 5 years preceding the survey, unless otherwise stated. Data derived from MICS relate to births occurring in the 2 years preceding the survey.
c The data refer to coverage of measles or MMR (measles, mumps, rubella) vaccine at 12, 15, 18 or 24 months depending on
148
Footnotes
the country.d For all countries where the source is DHS the under-5 mortality rate relates to the decade preceding the survey, except for
Turkey and India where it relates to the five-year period preceding the survey.e Lowest educational level achieved by mother is “no education”; highest level is “secondary or higher”.f Data are derived from Multiple Indicator Cluster Surveys (MICS) (round 3). All MICS figures were extracted from
country reports available on the UNICEF web site (http://www.childinfo.org/, accessed 13 February 2009).g The figures in parentheses are based on small numbers of cases (25–49 unweighted cases).h Data for “births attended by skilled health personnel” relate to births occurring in the three years preceding the survey.
Table 9 Demographic and socioeconomic statistics a World population prospects: the 2006 revision. New York, Population Division, Department of Economic and Social Affairs,
United Nations Secretariat, 2007. b United Nations demographic yearbook 2006. New York, United Nations Statistics Division, 2008 (http://unstats.un.org/
unsd/demographic/products/dyb/dyb2006.htm). c WHO mortality database: tables [online database]. Geneva, World Health Organization, 2009 (http://www.who.int/
healthinfo/morttables). d World fertility data 2008, CD-ROM, POP/DB/Fert/Rev.2008. New York, Population Division, Department of Economic
and Social Affairs, United Nations Secretariat, 2009.e UNESCO Institute for Statistics data centre [online database]. Montreal, UNESCO Institute for Statistics, 2007 (http://
stats.uis.unesco.org, accessed 13 February 2009). f PPP int. $, purchasing power parity at international dollar rate. World development indicators 2007. Washington, DC,
World Bank, 2008 (http://www.worldbank.org/data, accessed 13 February 2009).g World Bank PovcalNet. Washington, DC, World Bank, 2008 (http://iresearch.worldbank.org/PovcalNet/jsp/index.jsp,
accessed 13 February 2009). These figures reflect the World Bank default poverty line.h The standard definition includes the percentage of children less than five years of age who were registered at the moment of
the survey. The numerator of this indicator includes children whose birth certificate was seen by the interviewer or whose mother or carer says the birth has been registered. The state of the world’s children 2009: Maternal and newborn health. New York, United Nations Children’s Fund, 2009.
i International Data Base (IDB). Washington, DC, US Census Bureau, 2009 (http://www.census.gov/ipc/www/idb, accessed 13 February 2009).
j Data refer to 2005.k Differs from the standard definition.l Data refer to 2006.m For statistical purposes, the data for China do not include Hong Kong and Macao Special Administrative Regions of China.n Data refer to 2004.
WHO regions*
African Region: Algeria, Angola, Benin, Botswana, Burkina Faso, Burundi, Cameroon, Cape Verde, Central African Republic, Chad, Comoros, Congo, Côte d’Ivoire, Democratic Republic of the Congo, Equatorial Guinea, Eritrea,* Ethiopia, Gabon, Gambia, Ghana, Guinea, Guinea-Bissau, Kenya, Lesotho, Liberia, Madagascar, Malawi, Mali, Mauritania, Mauritius, Mozambique, Namibia, Niger, Nigeria, Rwanda, Sao Tome and Principe, Senegal, Seychelles, Sierra Leone, South Africa, Swaziland, Togo, Uganda, United Republic of Tanzania, Zambia, Zimbabwe
149
World HealtH StatiSticS
2009
Foot
note
s
Region of the Americas: Antigua and Barbuda, Argentina, Bahamas, Barbados, Belize, Bolivia, Brazil, Canada, Chile, Colombia, Costa Rica, Cuba, Dominica, Dominican Republic, Ecuador, El Salvador, Grenada, Guatemala, Guyana, Haiti, Honduras, Jamaica, Mexico, Nicaragua, Panama, Paraguay, Peru, Saint Kitts and Nevis, Saint Lucia, Saint Vincent and the Grenadines, Suriname, Trinidad and Tobago, United States of America, Uruguay, Venezuela (Bolivarian Republic of )
South-East Asia Region: Bangladesh, Bhutan, Democratic People’s Republic of Korea, India, Indonesia, Maldives, Myanmar, Nepal, Sri Lanka, Thailand, Timor-Leste*
European Region: Albania, Andorra,* Armenia,* Austria, Azerbaijan,* Belarus, Belgium, Bosnia and Herzegovina,* Bulgaria, Croatia,* Cyprus, Czech Republic,* Denmark, Estonia,* Finland, France, Georgia,* Germany, Greece, Hungary, Iceland, Ireland, Israel, Italy, Kazakhstan,* Kyrgyzstan,* Latvia,* Lithuania,* Luxembourg, Malta, Monaco, Montenegro,* Netherlands, Norway, Poland, Portugal, Republic of Moldova,* Romania, Russian Federation, San Marino, Serbia,* Slovakia,* Slovenia,* Spain, Sweden, Switzerland, Tajikistan,* The former Yugoslav Republic of Macedonia,* Turkey, Turkmenistan,* Ukraine, United Kingdom, Uzbekistan*
Eastern Mediterranean Region: Afghanistan, Bahrain, Djibouti, Egypt, Iran (Islamic Republic of ), Iraq, Jordan, Kuwait, Lebanon, Libyan Arab Jamahiriya, Morocco, Oman, Pakistan, Qatar, Saudi Arabia, Somalia, Sudan, Syrian Arab Republic, Tunisia, United Arab Emirates, Yemen
Western Pacific Region: Australia, Brunei Darussalam, Cambodia, China, Cook Islands, Fiji, Japan, Kiribati, Lao People’s Democratic Republic, Malaysia, Marshall Islands,* Micronesia (Federated States of ),* Mongolia, Nauru,* New Zealand, Niue,* Palau,* Papua New Guinea, Philippines, Republic of Korea, Samoa, Singapore, Solomon Islands, Tonga, Tuvalu,* Vanuatu, Viet Nam
Income groups**
Low income: Afghanistan, Bangladesh, Benin, Burkina Faso, Burundi, Cambodia, Central African Republic, Chad, Comoros, Côte d’Ivoire, Democratic People’s Republic of Korea, Democratic Republic of the Congo, Eritrea, Ethiopia, Gambia, Ghana, Guinea, Guinea-Bissau, Haiti, Kenya, Kyrgyzstan, Lao People’s Democratic Republic, Liberia, Madagascar, Malawi, Mali, Mauritania, Mozambique, Myanmar, Nepal, Niger, Nigeria, Pakistan, Papua New Guinea, Rwanda, Sao Tome and Principe, Senegal, Sierra Leone, Solomon Islands, Somalia, Tajikistan, Togo, Uganda, United Republic of Tanzania, Uzbekistan, Viet Nam, Yemen, Zambia, Zimbabwe
Lower middle income: Albania, Algeria, Angola, Armenia, Azerbaijan, Bhutan, Bolivia, Bosnia and Herzegovina, Cameroon, Cape Verde, China, Colombia, Congo, Djibouti, Dominican Republic, Ecuador, Egypt, El Salvador, Georgia, Guatemala, Guyana, Honduras, India, Indonesia, Iran (Islamic Republic of ), Iraq, Jordan, Kiribati, Lesotho, Maldives, Marshall Islands, Micronesia (Federated States of ), Mongolia, Morocco, Namibia, Nicaragua, Paraguay, Peru, Philippines, Republic of Moldova, Samoa, Sri Lanka, Sudan, Swaziland, Syrian Arab Republic, Thailand, Theformer Yugoslav Republic of Macedonia, Timor-Leste, Tonga, Tunisia, Turkmenistan, Ukraine, Vanuatu
Upper middle income: Argentina, Belarus, Belize, Botswana, Brazil, Bulgaria, Chile, Costa Rica, Croatia, Cuba, Dominica, Fiji, Gabon, Grenada, Jamaica, Kazakhstan, Latvia, Lebanon, Libyan Arab Jamahiriya, Lithuania, Malaysia, Mauritius, Mexico, Montenegro, Palau, Panama, Poland, Romania, Russian Federation, Saint Kitts and Nevis, Saint Lucia, Saint Vincent and the Grenadines, Serbia, Seychelles, South Africa, Suriname, Turkey, Uruguay, Venezuela (Bolivarian Republic of )
High income: Andorra, Antigua and Barbuda, Australia, Austria, Bahamas, Bahrain, Barbados, Belgium, Brunei Darussalam, Canada, Cyprus, Czech Republic, Denmark, Equatorial Guinea, Estonia, Finland, France, Germany, Greece, Hungary, Iceland, Ireland, Israel, Italy, Japan, Kuwait, Luxembourg, Malta, Monaco, Netherlands, New Zealand, Norway, Oman, Portugal, Qatar, Republic of Korea, San Marino, Saudi Arabia, Singapore, Slovakia, Slovenia, Spain, Sweden, Switzerland, Trinidad and Tobago, United Arab Emirates, United Kingdom, United States of America
Cook Islands, Nauru, Niue and Tuvalu are not categorized into income groups and are therefore excluded from the computation of aggregate indices by income group.
* State may have associated figures for periods prior to its membership in WHO.
** World Bank list of economies (July 2008). World Bank, July 2008 (http://siteressources.worldbank.org/DATASTATISTICS/Resources/CLASS.XLS).