economic structure of bangladesh
TRANSCRIPT
1
Economic Structure of Bangladesh
As a developing country, Bangladesh was the world’s 48th largest economy as of FY2011-12, as regarded by the International Monetary Fund. At US$ 848, the per capita income of the country is much lower than its neighbors India and Pakistan. During the first decade of the 21st century, Bangladesh’s economy grew at a rate of 6%-7% annually.
Main Sectors
The economic structure of Bangladesh can be divided into the following three sectors:
• Primary Sector:
With 45% of the workforce engaged in the primary sector (est. 2011), Bangladesh can be
called an agrarian economy. Agriculture contributes 30% of the country's GDP and
enables Bangladesh to achieve its macroeconomic objectives, including food security,
poverty alleviation, human resources development and employment generation.
Cooperatives are increasingly motivating farmers to employ modern machinery.
Bangladesh primarily produces Jute, Rice, Tobacco, Tea, Sugarcane, Pulses and Wheat.
According to the composition of sub sectors, the crop sector contributes 72% of the
production, followed by Fisheries at 10.33%, livestock at 10.11% and forestry at 7.33%.
The unpredictable weather and natural calamities disrupt the country’s economy
frequently. To overcome this problem, the government has several irrigation projects to
conserve rainwater and control floods. The projects also include controlling pests and
using high quality seeds.
• Secondary Sector:
This sector mainly comprises of small and medium enterprises that give employment to
30% of the country’s workforce (est. 2011). It generates 25% of the GDP and 40% of the
gross manufacturing output. Bangladesh’s light engineering sector is one of the largest
and most diverse, producing a wide variety of machinery and spare parts. There are
several mills and factories, producing jute, garments, cotton, paper, textile,
pharmaceuticals and fertilizers, among other things. Some major manufacturing
industries are railways, tea plantation & processing industries, construction sector, ferry
and transport. Infrastructure is developing swiftly in terms of water distribution, power
supply, communications and transportation. Bangladesh features a prominent wealth of
coal mines.
2
• Tertiary Sector:
In the last two decades, Bangladesh has seen incredible growth in its service sector. As of
2011, 25% (2011 est.) of the country’s workforce was employed in this sector. Although
this percentage is lesser than the primary and secondary sectors, a large part of the
country’s GDP comes from service sector. The hospitality industry, in particular, has
shown considerable growth.
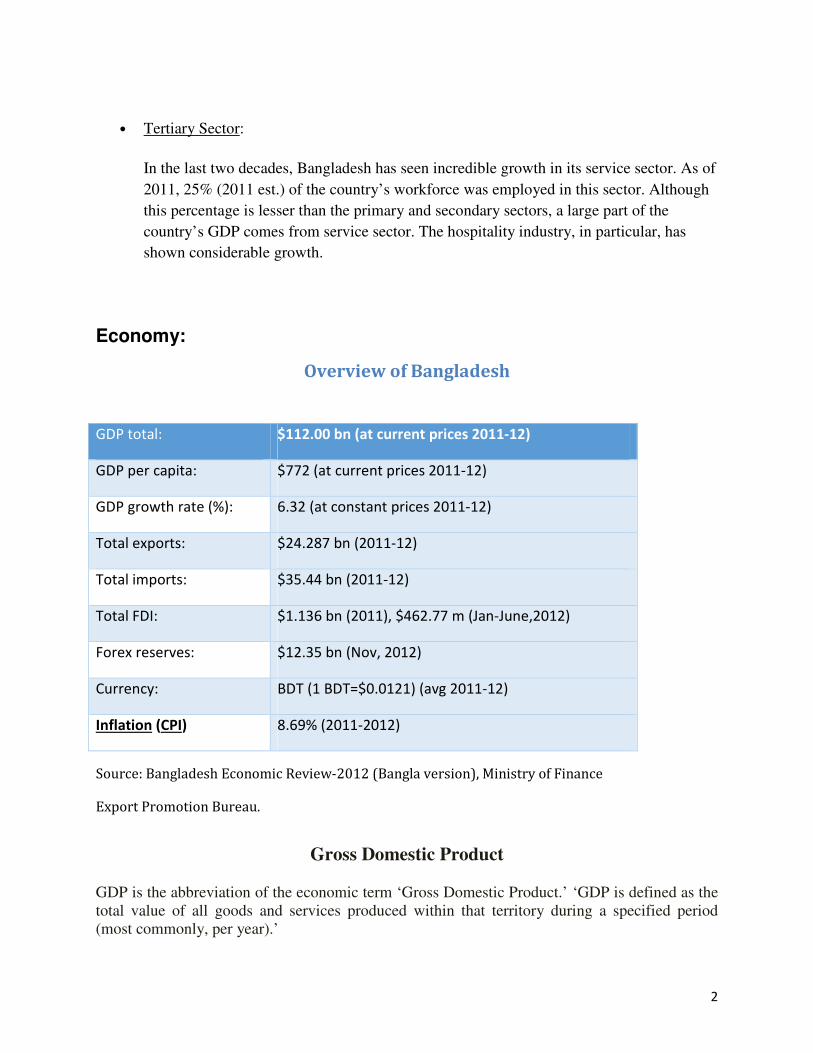
Economy:
Overview of Bangladesh
GDP total: $112.00 bn (at current prices 2011-12)
GDP per capita: $772 (at current prices 2011-12)
GDP growth rate (%): 6.32 (at constant prices 2011-12)
Total exports: $24.287 bn (2011-12)
Total imports: $35.44 bn (2011-12)
Total FDI: $1.136 bn (2011), $462.77 m (Jan-June,2012)
Forex reserves: $12.35 bn (Nov, 2012)
Currency: BDT (1 BDT=$0.0121) (avg 2011-12)
Inflation (CPI) 8.69% (2011-2012)
Source: Bangladesh Economic Review-2012 (Bangla version), Ministry of Finance
Export Promotion Bureau.
Gross Domestic Product GDP is the abbreviation of the economic term ‘Gross Domestic Product.’ ‘GDP is defined as the total value of all goods and services produced within that territory during a specified period (most commonly, per year).’
3
Another definition is that ‘the GDP is the market value of all the goods and services produced by labor and property located in the region, usually a country.’
GDP can be estimated by two following ways---
GDP= consumption + investment + government expenditures + exports - imports
GDP=GNP—‘The net inflow of labor and property incomes from abroad.’ There are two types-----Nominal GDP and Real GDP. Nominal GDP, also called ‘money GDP’,
is calculated on the basis of the current price or today’s price, by which comparison between
GDPs of different years may be incorrect because of the impact of inflation. Real GDP also
called ‘Constant Price GDP’.
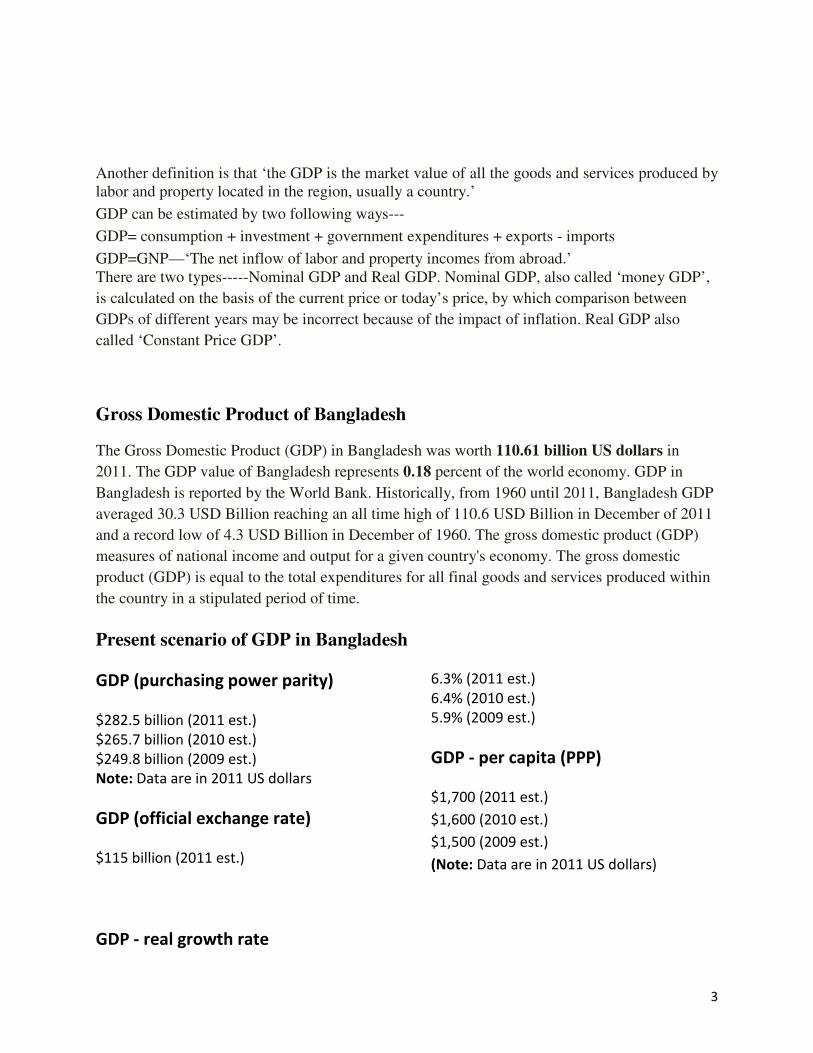
Gross Domestic Product of Bangladesh
The Gross Domestic Product (GDP) in Bangladesh was worth 110.61 billion US dollars in
2011. The GDP value of Bangladesh represents 0.18 percent of the world economy. GDP in
Bangladesh is reported by the World Bank. Historically, from 1960 until 2011, Bangladesh GDP
averaged 30.3 USD Billion reaching an all time high of 110.6 USD Billion in December of 2011
and a record low of 4.3 USD Billion in December of 1960. The gross domestic product (GDP)
measures of national income and output for a given country's economy. The gross domestic
product (GDP) is equal to the total expenditures for all final goods and services produced within
the country in a stipulated period of time.
Present scenario of GDP in Bangladesh
GDP (purchasing power parity)
$282.5 billion (2011 est.)
$265.7 billion (2010 est.)
$249.8 billion (2009 est.)
Note: Data are in 2011 US dollars
GDP (official exchange rate)
$115 billion (2011 est.)
GDP - real growth rate
6.3% (2011 est.)
6.4% (2010 est.)
5.9% (2009 est.)
GDP - per capita (PPP)
$1,700 (2011 est.)
$1,600 (2010 est.)
$1,500 (2009 est.)
(Note: Data are in 2011 US dollars)
4
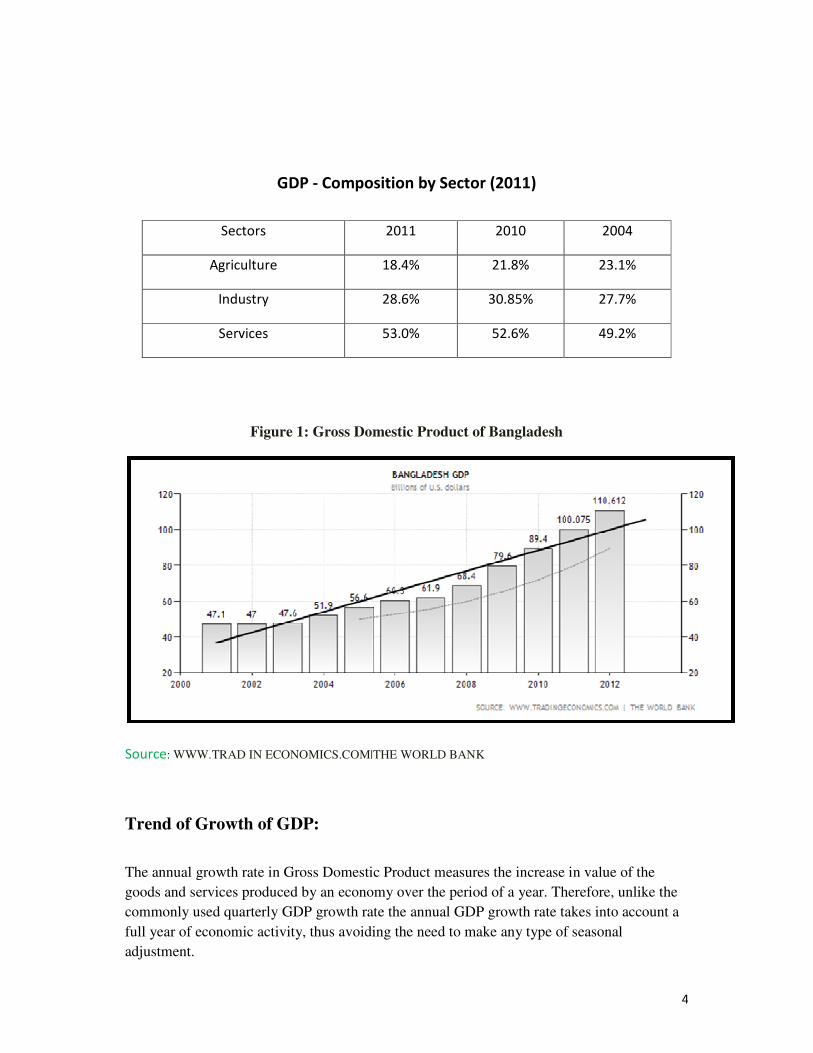
GDP - Composition by Sector (2011)
Sectors 2011 2010 2004
Agriculture 18.4% 21.8% 23.1%
Industry 28.6% 30.85% 27.7%
Services 53.0% 52.6% 49.2%
Figure 1: Gross Domestic Product of Bangladesh
Source: WWW.TRAD IN ECONOMICS.COM|THE WORLD BANK
Trend of Growth of GDP:
The annual growth rate in Gross Domestic Product measures the increase in value of the
goods and services produced by an economy over the period of a year. Therefore, unlike the
commonly used quarterly GDP growth rate the annual GDP growth rate takes into account a
full year of economic activity, thus avoiding the need to make any type of seasonal
adjustment.
5
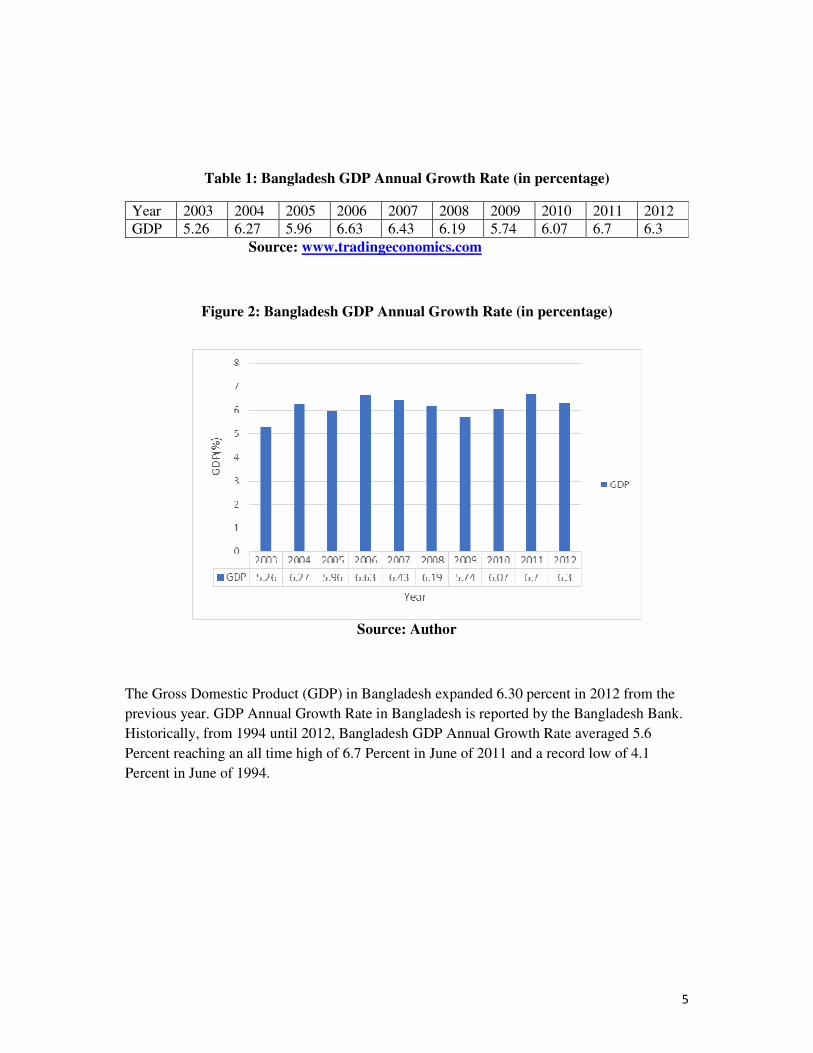
Table 1: Bangladesh GDP Annual Growth Rate (in percentage)
Year 2003 2004 2005 2006 2007 2008 2009 2010 2011 2012
GDP 5.26 6.27 5.96 6.63 6.43 6.19 5.74 6.07 6.7 6.3
Source: www.tradingeconomics.com
Figure 2: Bangladesh GDP Annual Growth Rate (in percentage)
Source: Author
The Gross Domestic Product (GDP) in Bangladesh expanded 6.30 percent in 2012 from the
previous year. GDP Annual Growth Rate in Bangladesh is reported by the Bangladesh Bank.
Historically, from 1994 until 2012, Bangladesh GDP Annual Growth Rate averaged 5.6
Percent reaching an all time high of 6.7 Percent in June of 2011 and a record low of 4.1
Percent in June of 1994.
6
Real and Nominal GDP
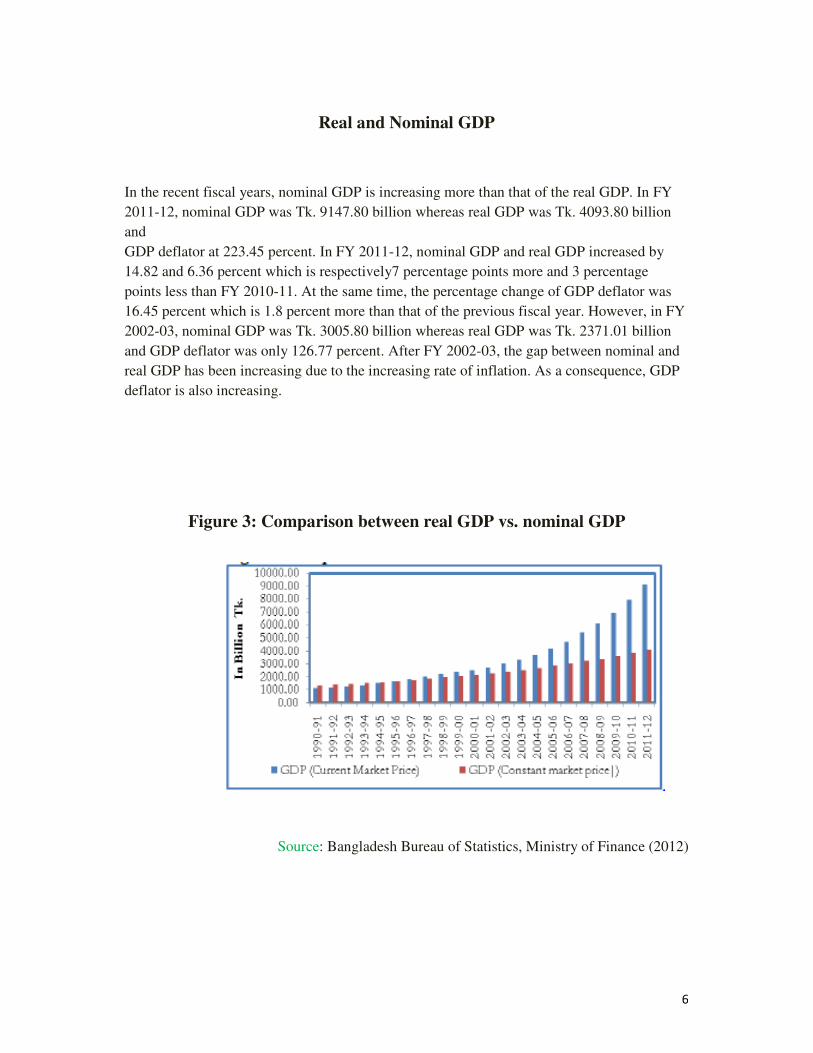
In the recent fiscal years, nominal GDP is increasing more than that of the real GDP. In FY
2011-12, nominal GDP was Tk. 9147.80 billion whereas real GDP was Tk. 4093.80 billion
and
GDP deflator at 223.45 percent. In FY 2011-12, nominal GDP and real GDP increased by
14.82 and 6.36 percent which is respectively7 percentage points more and 3 percentage
points less than FY 2010-11. At the same time, the percentage change of GDP deflator was
16.45 percent which is 1.8 percent more than that of the previous fiscal year. However, in FY
2002-03, nominal GDP was Tk. 3005.80 billion whereas real GDP was Tk. 2371.01 billion
and GDP deflator was only 126.77 percent. After FY 2002-03, the gap between nominal and
real GDP has been increasing due to the increasing rate of inflation. As a consequence, GDP
deflator is also increasing.
Figure 3: Comparison between real GDP vs. nominal GDP
Source: Bangladesh Bureau of Statistics, Ministry of Finance (2012)
7
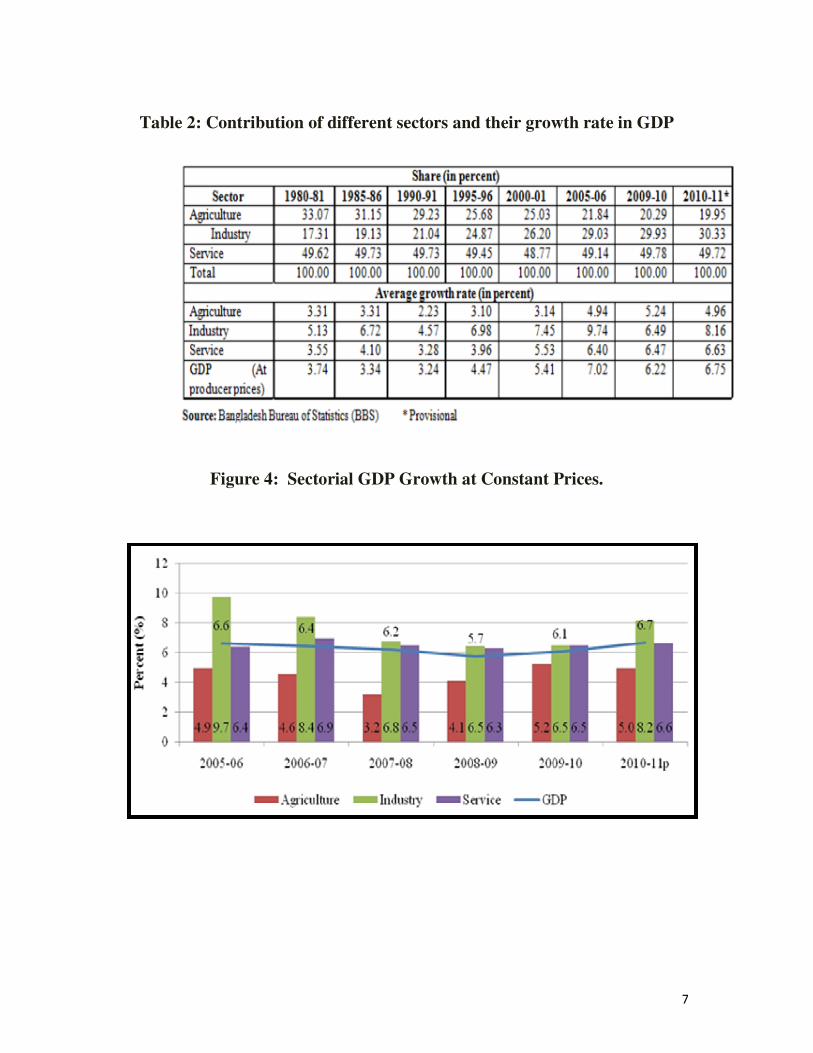
Table 2: Contribution of different sectors and their growth rate in GDP
Figure 4: Sectorial GDP Growth at Constant Prices.
8
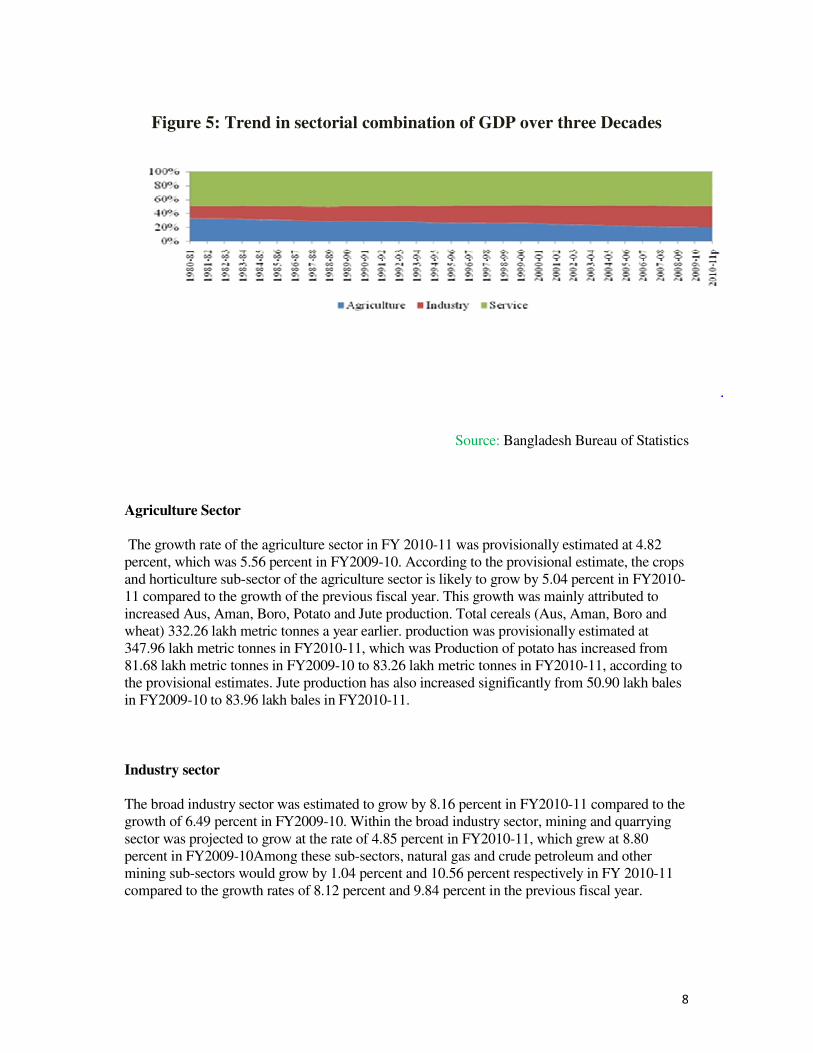
Figure 5: Trend in sectorial combination of GDP over three Decades
Source: Bangladesh Bureau of Statistics
Agriculture Sector
The growth rate of the agriculture sector in FY 2010-11 was provisionally estimated at 4.82 percent, which was 5.56 percent in FY2009-10. According to the provisional estimate, the crops and horticulture sub-sector of the agriculture sector is likely to grow by 5.04 percent in FY2010-11 compared to the growth of the previous fiscal year. This growth was mainly attributed to increased Aus, Aman, Boro, Potato and Jute production. Total cereals (Aus, Aman, Boro and wheat) 332.26 lakh metric tonnes a year earlier. production was provisionally estimated at 347.96 lakh metric tonnes in FY2010-11, which was Production of potato has increased from 81.68 lakh metric tonnes in FY2009-10 to 83.26 lakh metric tonnes in FY2010-11, according to the provisional estimates. Jute production has also increased significantly from 50.90 lakh bales in FY2009-10 to 83.96 lakh bales in FY2010-11.
Industry sector
The broad industry sector was estimated to grow by 8.16 percent in FY2010-11 compared to the growth of 6.49 percent in FY2009-10. Within the broad industry sector, mining and quarrying sector was projected to grow at the rate of 4.85 percent in FY2010-11, which grew at 8.80 percent in FY2009-10Among these sub-sectors, natural gas and crude petroleum and other mining sub-sectors would grow by 1.04 percent and 10.56 percent respectively in FY 2010-11 compared to the growth rates of 8.12 percent and 9.84 percent in the previous fiscal year.
9
Service Sector
The growth in service sector during FY2010-11 was broad-based and almost all the sectors within the broad service sector were estimated to grow moderately compared to the growth of the previous fiscal year. Higher growth in agriculture and industry and expansion of trade related activities helped maintain satisfactory growth in this sector. Among the sectors, the output of the wholesale and retail trade was expected to grow at 6.06 percent in FY2010-11 compared to 5.87 percent growth in the previous fiscal year. This happened due to increased industrial production and imported commodities during the fiscal year. The transport, storage and communication sector was expected to achieve a growth rate of 7.93 percent in FY 2010-11 while the growth rate of this sector was 7.69 percent in FY 2009-10. Post and telecommunication sub-sector are at the forefront with a growth of 17.63 percent in FY 2010-11. The growth rate in the real estate, ranting and business activities sector was provisionally estimated at 3.96 percent in FY 2010-11 compared to 3.89 percent growth in FY 2009-10. Among the other services sectors, the growth rate of public administration and defense, education, and health and social services were expected to grow at the rate of 9.56 percent, 9.47 percent and 8.30 percent respectively in FY 2010-11.
GDP in the Manufacturing Sector
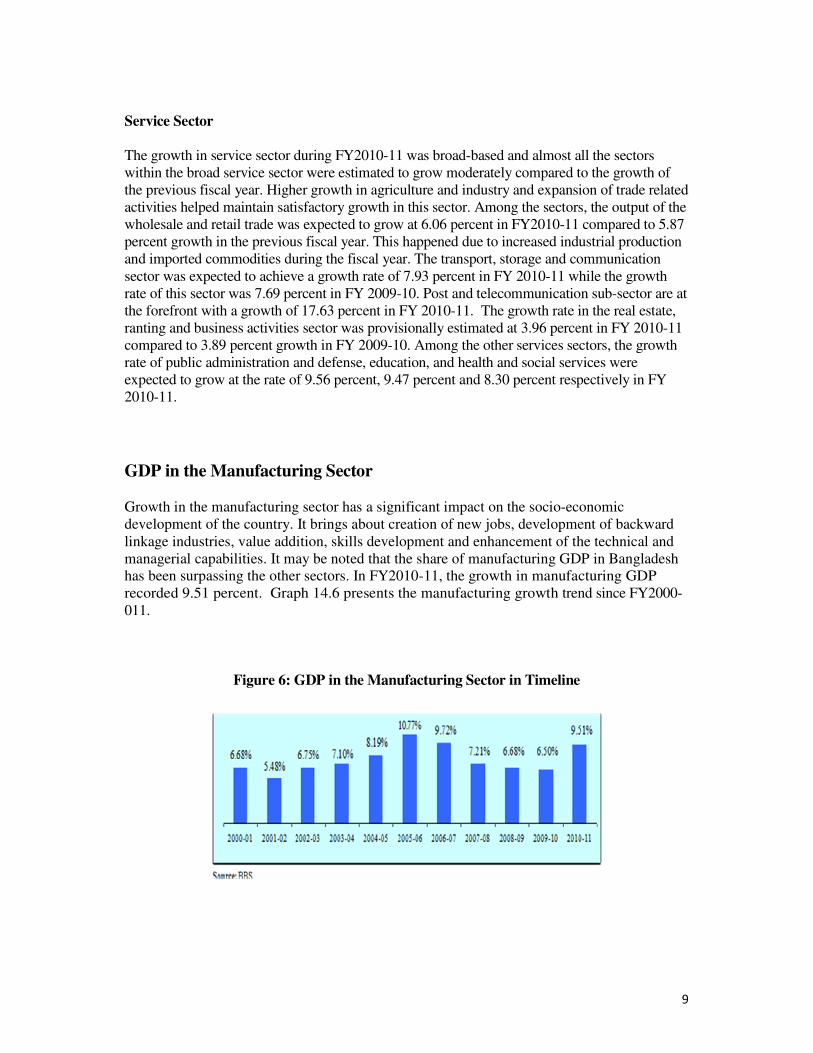
Growth in the manufacturing sector has a significant impact on the socio-economic development of the country. It brings about creation of new jobs, development of backward linkage industries, value addition, skills development and enhancement of the technical and managerial capabilities. It may be noted that the share of manufacturing GDP in Bangladesh has been surpassing the other sectors. In FY2010-11, the growth in manufacturing GDP recorded 9.51 percent. Graph 14.6 presents the manufacturing growth trend since FY2000-011.
Figure 6: GDP in the Manufacturing Sector in Timeline
10
To facilitate an accelerated growth in manufacturing GDP, the Board of Investment has been strengthening its facilitation services to the investors. Among various capacity development initiatives, an online service tracking system is already in place. Preparatory works are in progress to install and implement an Online Registration System.
GNP:
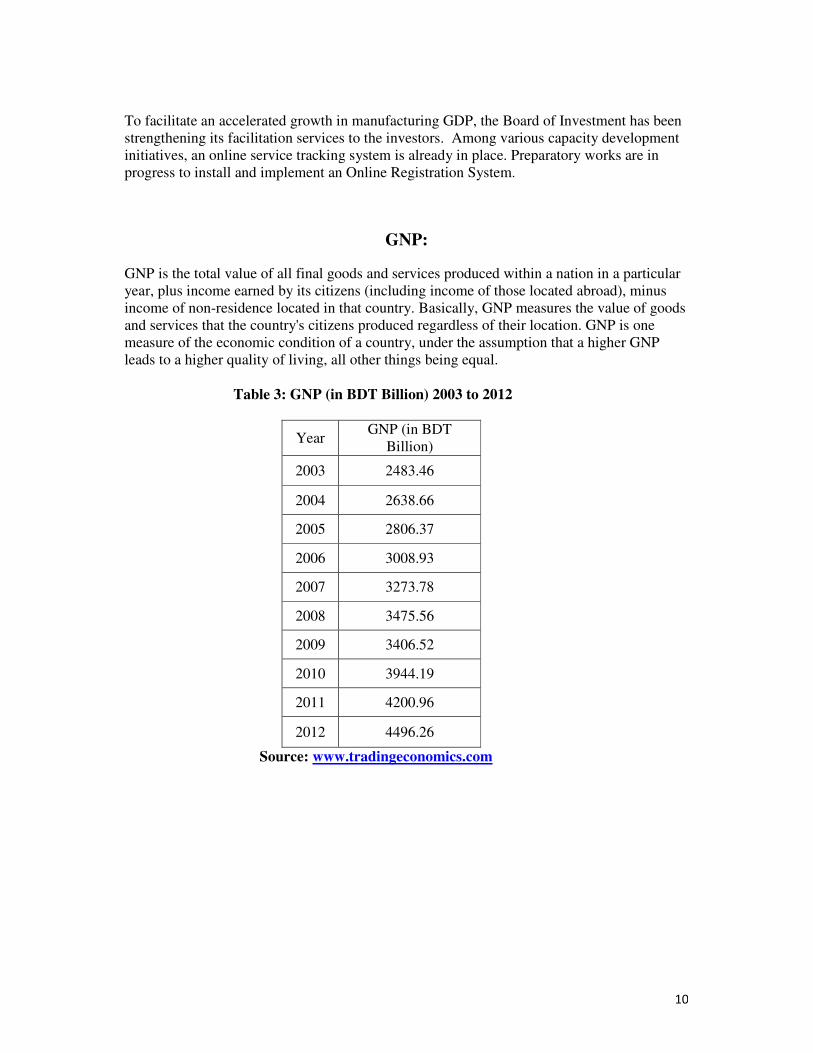
GNP is the total value of all final goods and services produced within a nation in a particular year, plus income earned by its citizens (including income of those located abroad), minus income of non-residence located in that country. Basically, GNP measures the value of goods and services that the country's citizens produced regardless of their location. GNP is one measure of the economic condition of a country, under the assumption that a higher GNP leads to a higher quality of living, all other things being equal. Table 3: GNP (in BDT Billion) 2003 to 2012
Year GNP (in BDT
Billion)
2003 2483.46
2004 2638.66
2005 2806.37
2006 3008.93
2007 3273.78
2008 3475.56
2009 3406.52
2010 3944.19
2011 4200.96
2012 4496.26
Source: www.tradingeconomics.com
11
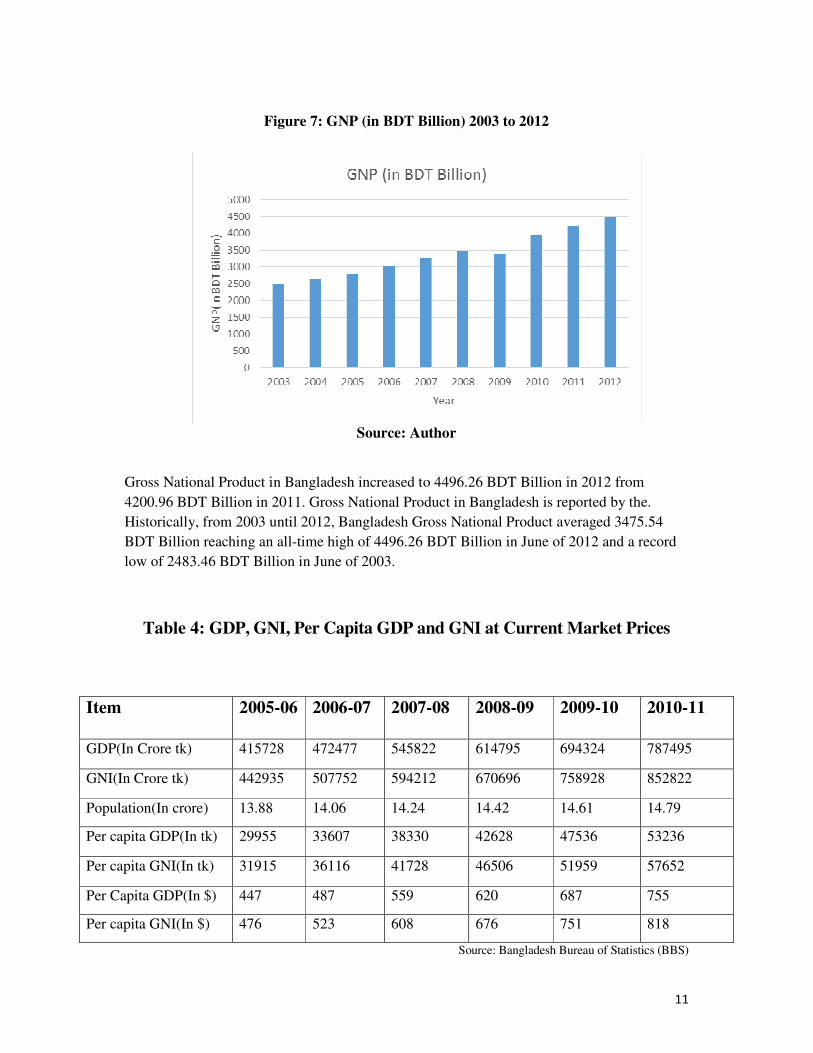
Figure 7: GNP (in BDT Billion) 2003 to 2012
Source: Author
Gross National Product in Bangladesh increased to 4496.26 BDT Billion in 2012 from
4200.96 BDT Billion in 2011. Gross National Product in Bangladesh is reported by the.
Historically, from 2003 until 2012, Bangladesh Gross National Product averaged 3475.54
BDT Billion reaching an all-time high of 4496.26 BDT Billion in June of 2012 and a record
low of 2483.46 BDT Billion in June of 2003.
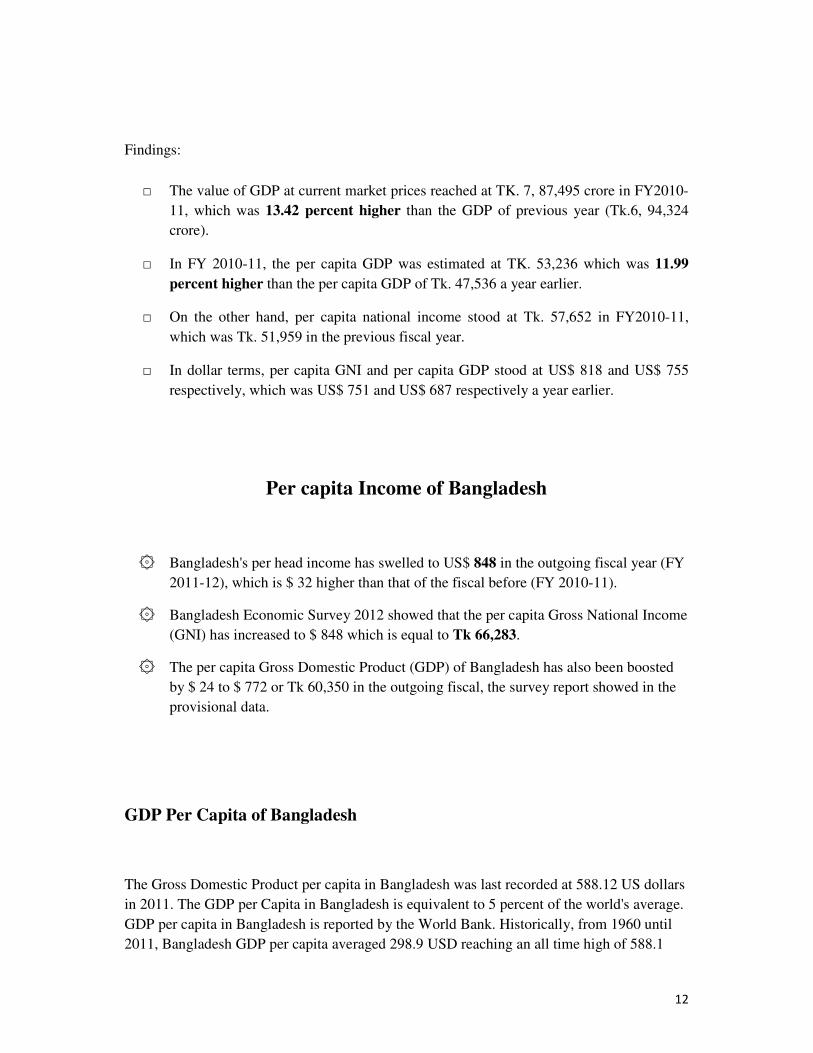
Table 4: GDP, GNI, Per Capita GDP and GNI at Current Market Prices
Item 2005-06 2006-07 2007-08 2008-09 2009-10 2010-11
GDP(In Crore tk) 415728 472477 545822 614795 694324 787495
GNI(In Crore tk) 442935 507752 594212 670696 758928 852822
Population(In crore) 13.88 14.06 14.24 14.42 14.61 14.79
Per capita GDP(In tk) 29955 33607 38330 42628 47536 53236
Per capita GNI(In tk) 31915 36116 41728 46506 51959 57652
Per Capita GDP(In $) 447 487 559 620 687 755
Per capita GNI(In $) 476 523 608 676 751 818
Source: Bangladesh Bureau of Statistics (BBS)
12
Findings:
□ The value of GDP at current market prices reached at TK. 7, 87,495 crore in FY2010-
11, which was 13.42 percent higher than the GDP of previous year (Tk.6, 94,324
crore).
□ In FY 2010-11, the per capita GDP was estimated at TK. 53,236 which was 11.99
percent higher than the per capita GDP of Tk. 47,536 a year earlier.
□ On the other hand, per capita national income stood at Tk. 57,652 in FY2010-11,
which was Tk. 51,959 in the previous fiscal year.
□ In dollar terms, per capita GNI and per capita GDP stood at US$ 818 and US$ 755
respectively, which was US$ 751 and US$ 687 respectively a year earlier.
Per capita Income of Bangladesh
۞ Bangladesh's per head income has swelled to US$ 848 in the outgoing fiscal year (FY
2011-12), which is $ 32 higher than that of the fiscal before (FY 2010-11).
۞ Bangladesh Economic Survey 2012 showed that the per capita Gross National Income
(GNI) has increased to $ 848 which is equal to Tk 66,283.
۞ The per capita Gross Domestic Product (GDP) of Bangladesh has also been boosted
by $ 24 to $ 772 or Tk 60,350 in the outgoing fiscal, the survey report showed in the
provisional data.
GDP Per Capita of Bangladesh
The Gross Domestic Product per capita in Bangladesh was last recorded at 588.12 US dollars
in 2011. The GDP per Capita in Bangladesh is equivalent to 5 percent of the world's average.
GDP per capita in Bangladesh is reported by the World Bank. Historically, from 1960 until
2011, Bangladesh GDP per capita averaged 298.9 USD reaching an all time high of 588.1
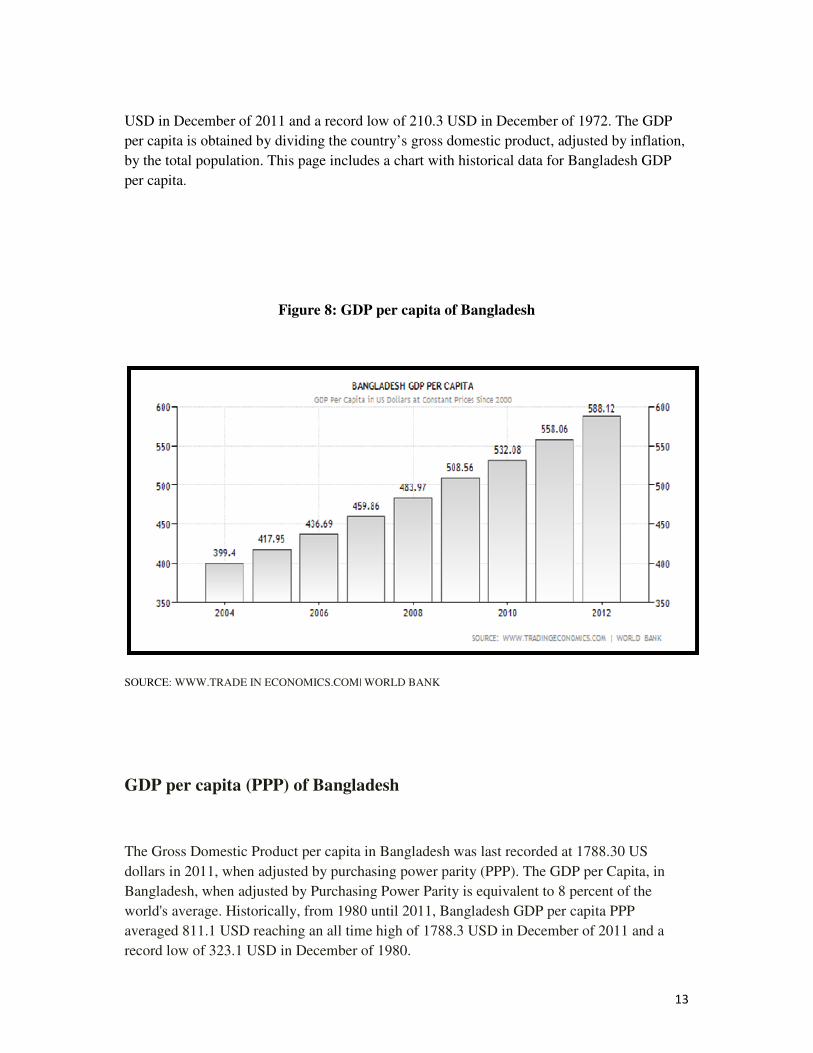
13
USD in December of 2011 and a record low of 210.3 USD in December of 1972. The GDP
per capita is obtained by dividing the country’s gross domestic product, adjusted by inflation,
by the total population. This page includes a chart with historical data for Bangladesh GDP
per capita.
Figure 8: GDP per capita of Bangladesh
SOURCE: WWW.TRADE IN ECONOMICS.COM| WORLD BANK
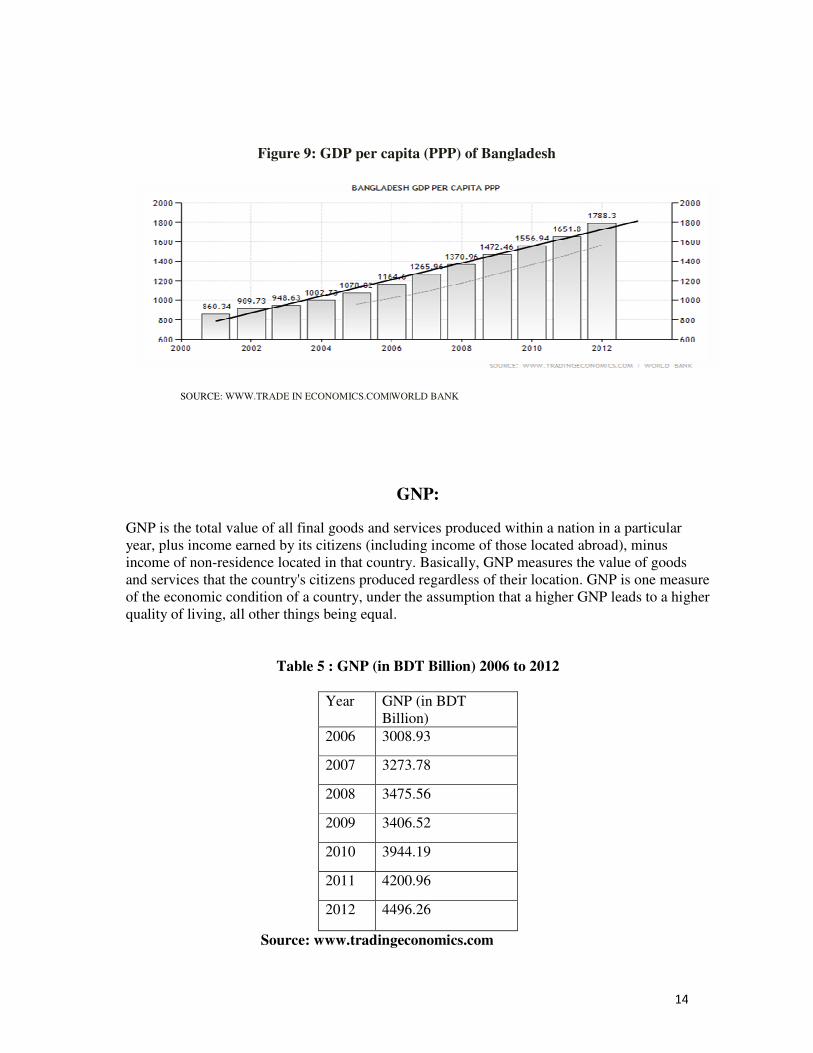
GDP per capita (PPP) of Bangladesh
The Gross Domestic Product per capita in Bangladesh was last recorded at 1788.30 US
dollars in 2011, when adjusted by purchasing power parity (PPP). The GDP per Capita, in
Bangladesh, when adjusted by Purchasing Power Parity is equivalent to 8 percent of the
world's average. Historically, from 1980 until 2011, Bangladesh GDP per capita PPP
averaged 811.1 USD reaching an all time high of 1788.3 USD in December of 2011 and a
record low of 323.1 USD in December of 1980.
14
Figure 9: GDP per capita (PPP) of Bangladesh
SOURCE: WWW.TRADE IN ECONOMICS.COM|WORLD BANK
GNP:
GNP is the total value of all final goods and services produced within a nation in a particular year, plus income earned by its citizens (including income of those located abroad), minus income of non-residence located in that country. Basically, GNP measures the value of goods and services that the country's citizens produced regardless of their location. GNP is one measure of the economic condition of a country, under the assumption that a higher GNP leads to a higher quality of living, all other things being equal.
Table 5 : GNP (in BDT Billion) 2006 to 2012
Year GNP (in BDT Billion)
2006 3008.93
2007 3273.78
2008 3475.56
2009 3406.52
2010 3944.19
2011 4200.96
2012 4496.26
Source: www.tradingeconomics.com
15
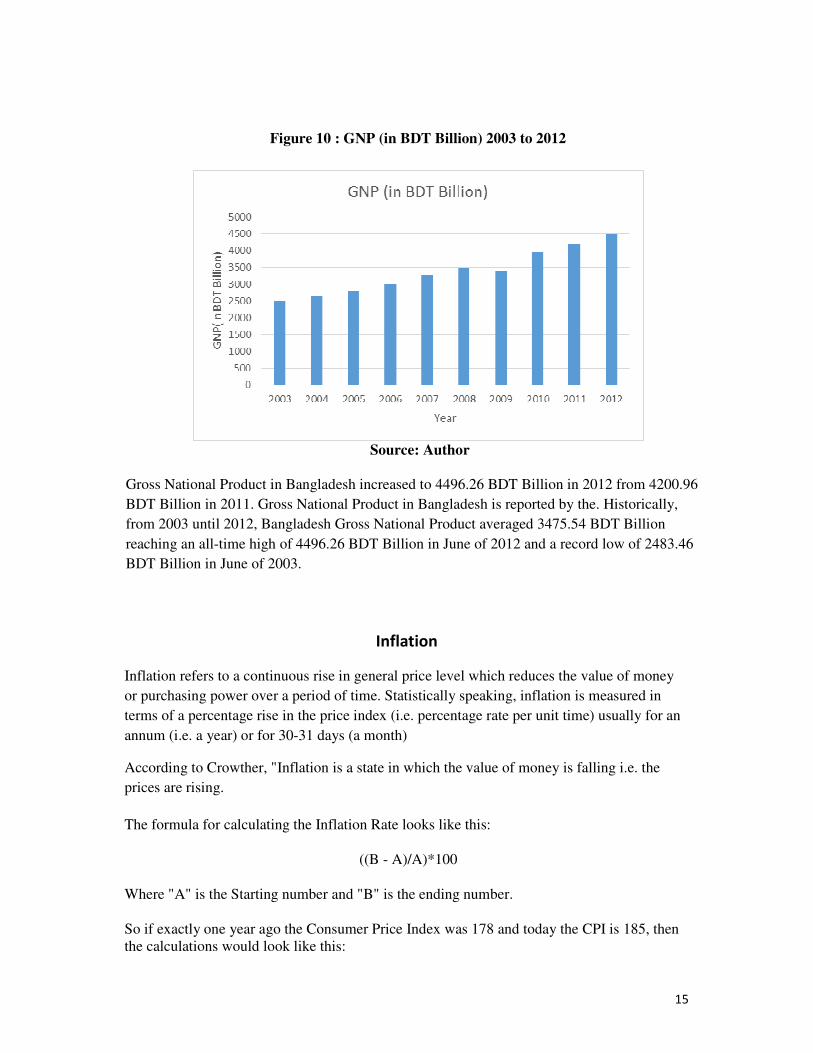
Figure 10 : GNP (in BDT Billion) 2003 to 2012
Source: Author Gross National Product in Bangladesh increased to 4496.26 BDT Billion in 2012 from 4200.96
BDT Billion in 2011. Gross National Product in Bangladesh is reported by the. Historically,
from 2003 until 2012, Bangladesh Gross National Product averaged 3475.54 BDT Billion
reaching an all-time high of 4496.26 BDT Billion in June of 2012 and a record low of 2483.46
BDT Billion in June of 2003.
Inflation
Inflation refers to a continuous rise in general price level which reduces the value of money
or purchasing power over a period of time. Statistically speaking, inflation is measured in
terms of a percentage rise in the price index (i.e. percentage rate per unit time) usually for an
annum (i.e. a year) or for 30-31 days (a month)
According to Crowther, "Inflation is a state in which the value of money is falling i.e. the
prices are rising.
The formula for calculating the Inflation Rate looks like this:
((B - A)/A)*100
Where "A" is the Starting number and "B" is the ending number.
So if exactly one year ago the Consumer Price Index was 178 and today the CPI is 185, then the calculations would look like this:
16
((185-178)/178)*100 or
(7/178)*100 or
0.0393*100 which equals 3.93% inflation over the sample year.
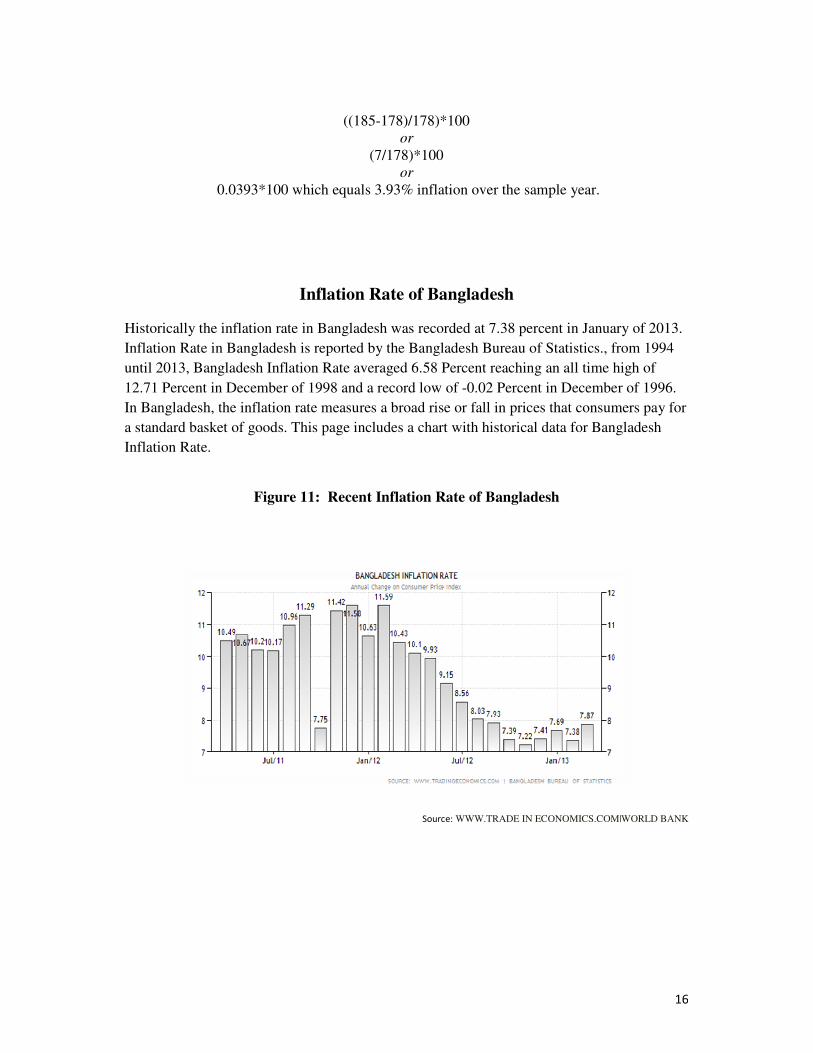
Inflation Rate of Bangladesh
Historically the inflation rate in Bangladesh was recorded at 7.38 percent in January of 2013.
Inflation Rate in Bangladesh is reported by the Bangladesh Bureau of Statistics., from 1994
until 2013, Bangladesh Inflation Rate averaged 6.58 Percent reaching an all time high of
12.71 Percent in December of 1998 and a record low of -0.02 Percent in December of 1996.
In Bangladesh, the inflation rate measures a broad rise or fall in prices that consumers pay for
a standard basket of goods. This page includes a chart with historical data for Bangladesh
Inflation Rate.
Figure 11: Recent Inflation Rate of Bangladesh
Source: WWW.TRADE IN ECONOMICS.COM|WORLD BANK
17
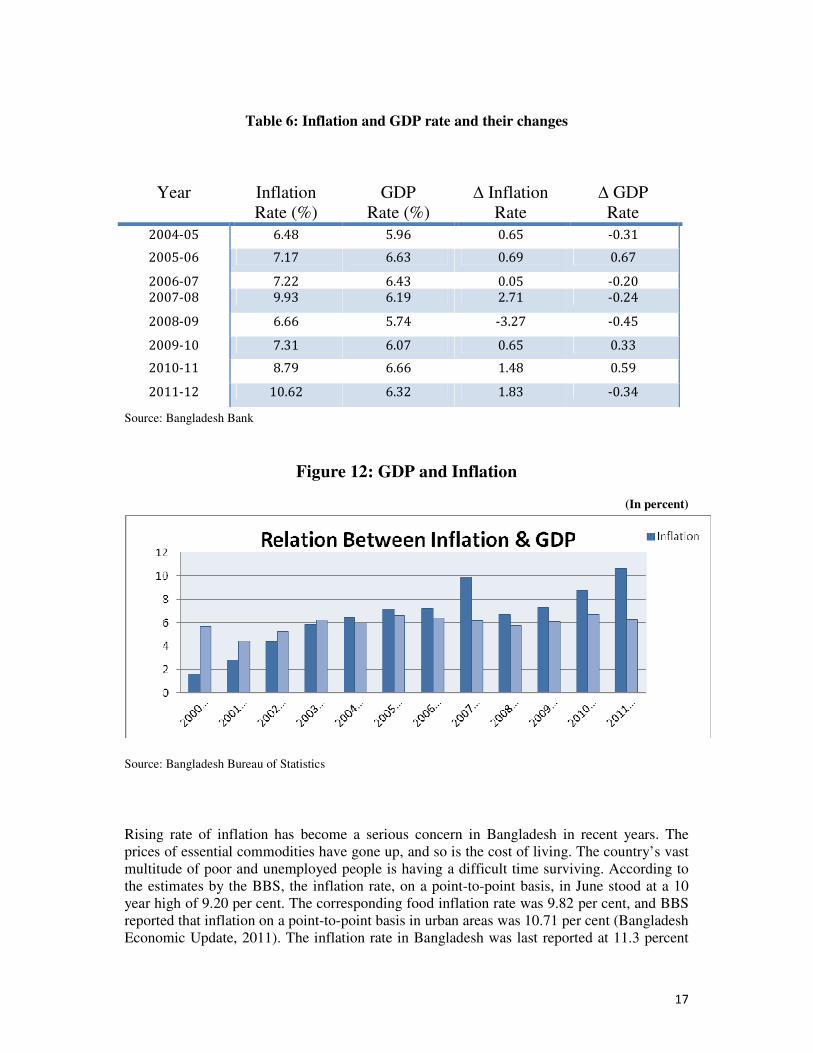
Table 6: Inflation and GDP rate and their changes
Source: Bangladesh Bank
Figure 12: GDP and Inflation
(In percent)
Source: Bangladesh Bureau of Statistics
Rising rate of inflation has become a serious concern in Bangladesh in recent years. The prices of essential commodities have gone up, and so is the cost of living. The country’s vast multitude of poor and unemployed people is having a difficult time surviving. According to the estimates by the BBS, the inflation rate, on a point-to-point basis, in June stood at a 10 year high of 9.20 per cent. The corresponding food inflation rate was 9.82 per cent, and BBS reported that inflation on a point-to-point basis in urban areas was 10.71 per cent (Bangladesh Economic Update, 2011). The inflation rate in Bangladesh was last reported at 11.3 percent
Year Inflation Rate (%)
GDP Rate (%)
∆ Inflation Rate
∆ GDP Rate
2004-05 6.48 5.96 0.65 -0.31
2005-06 7.17 6.63 0.69 0.67
2006-07 7.22 6.43 0.05 -0.20
2007-08 9.93 6.19 2.71 -0.24
2008-09 6.66 5.74 -3.27 -0.45
2009-10 7.31 6.07 0.65 0.33
2010-11 8.79 6.66 1.48 0.59
2011-12 10.62 6.32 1.83 -0.34
18
in August 2011. From the beginning of the year 2011, inflation has continued rising and has crossed the double-digit mark. Inflation continues its upward trend even after crossing the mark. The rate of inflation is higher in the food sector than in the non-food sector. Despite that, the non-food sector is not lagging behind in the rate of increase. From the below figure it is clear that within the span of one year, inflation in the sector increased by seven times. Side by side with the prices of food items, house rent, transport cost, and expenditure on clothing and shoes have also increased (Matin, 2011). As a result, the people are passing their days amid hardship, spending additional money on a static income.
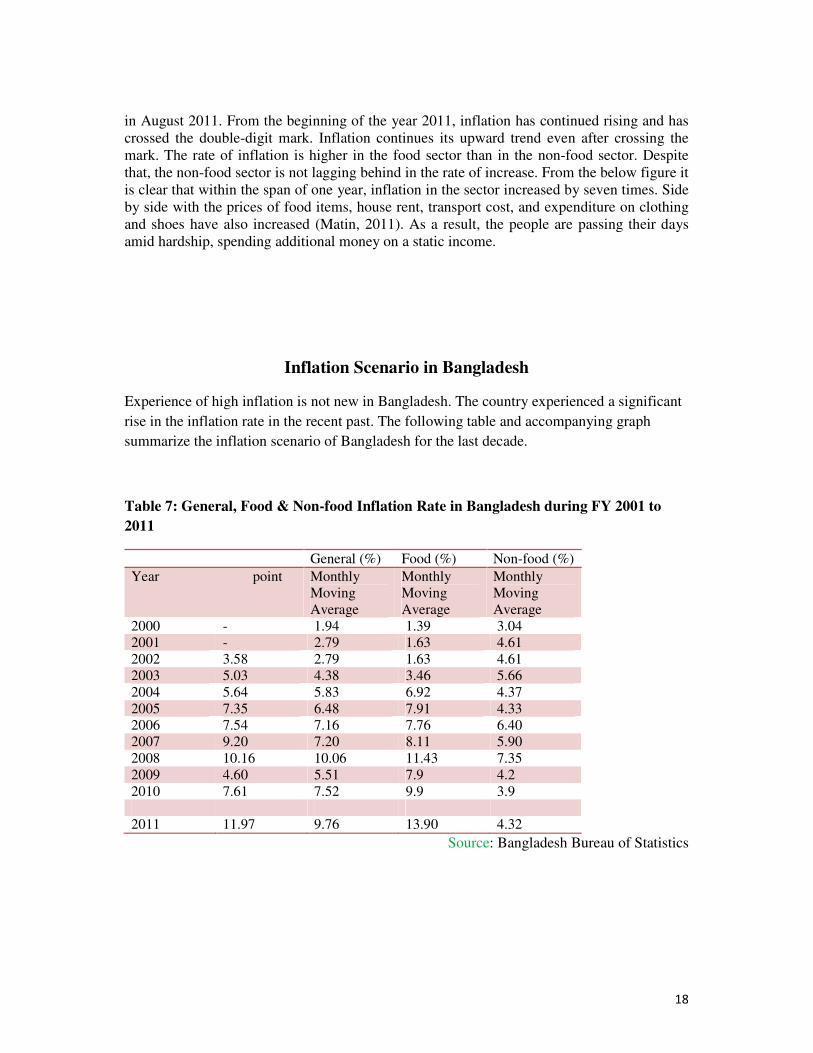
Inflation Scenario in Bangladesh
Experience of high inflation is not new in Bangladesh. The country experienced a significant
rise in the inflation rate in the recent past. The following table and accompanying graph
summarize the inflation scenario of Bangladesh for the last decade.
Table 7: General, Food & Non-food Inflation Rate in Bangladesh during FY 2001 to
2011
General (%) Food (%) Non-food (%)
Year point Monthly Moving Average
Monthly Moving Average
Monthly Moving Average
2000 - 1.94 1.39 3.04 2001 - 2.79 1.63 4.61 2002 3.58 2.79 1.63 4.61 2003 5.03 4.38 3.46 5.66 2004 5.64 5.83 6.92 4.37 2005 7.35 6.48 7.91 4.33 2006 7.54 7.16 7.76 6.40 2007 9.20 7.20 8.11 5.90 2008 10.16 10.06 11.43 7.35 2009 4.60 5.51 7.9 4.2 2010 7.61 7.52 9.9 3.9 2011 11.97 9.76 13.90 4.32
Source: Bangladesh Bureau of Statistics
19
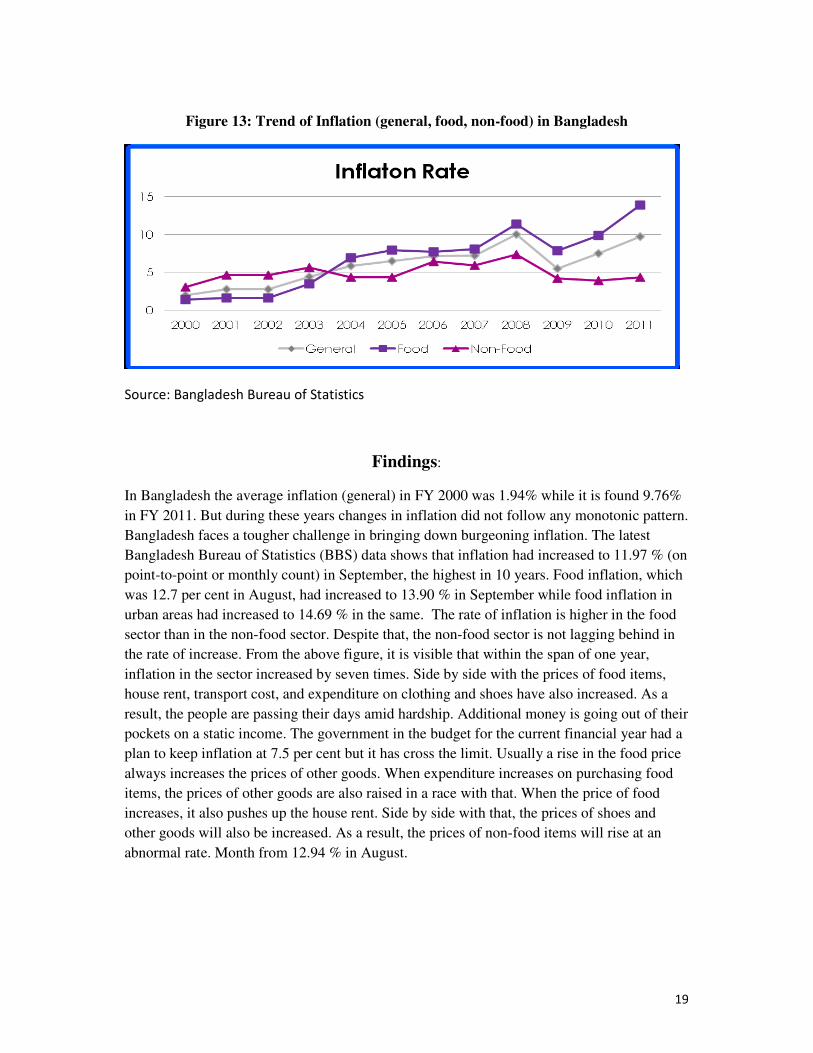
Figure 13: Trend of Inflation (general, food, non-food) in Bangladesh
Source: Bangladesh Bureau of Statistics
Findings:
In Bangladesh the average inflation (general) in FY 2000 was 1.94% while it is found 9.76%
in FY 2011. But during these years changes in inflation did not follow any monotonic pattern.
Bangladesh faces a tougher challenge in bringing down burgeoning inflation. The latest
Bangladesh Bureau of Statistics (BBS) data shows that inflation had increased to 11.97 % (on
point-to-point or monthly count) in September, the highest in 10 years. Food inflation, which
was 12.7 per cent in August, had increased to 13.90 % in September while food inflation in
urban areas had increased to 14.69 % in the same. The rate of inflation is higher in the food
sector than in the non-food sector. Despite that, the non-food sector is not lagging behind in
the rate of increase. From the above figure, it is visible that within the span of one year,
inflation in the sector increased by seven times. Side by side with the prices of food items,
house rent, transport cost, and expenditure on clothing and shoes have also increased. As a
result, the people are passing their days amid hardship. Additional money is going out of their
pockets on a static income. The government in the budget for the current financial year had a
plan to keep inflation at 7.5 per cent but it has cross the limit. Usually a rise in the food price
always increases the prices of other goods. When expenditure increases on purchasing food
items, the prices of other goods are also raised in a race with that. When the price of food
increases, it also pushes up the house rent. Side by side with that, the prices of shoes and
other goods will also be increased. As a result, the prices of non-food items will rise at an
abnormal rate. Month from 12.94 % in August.
20
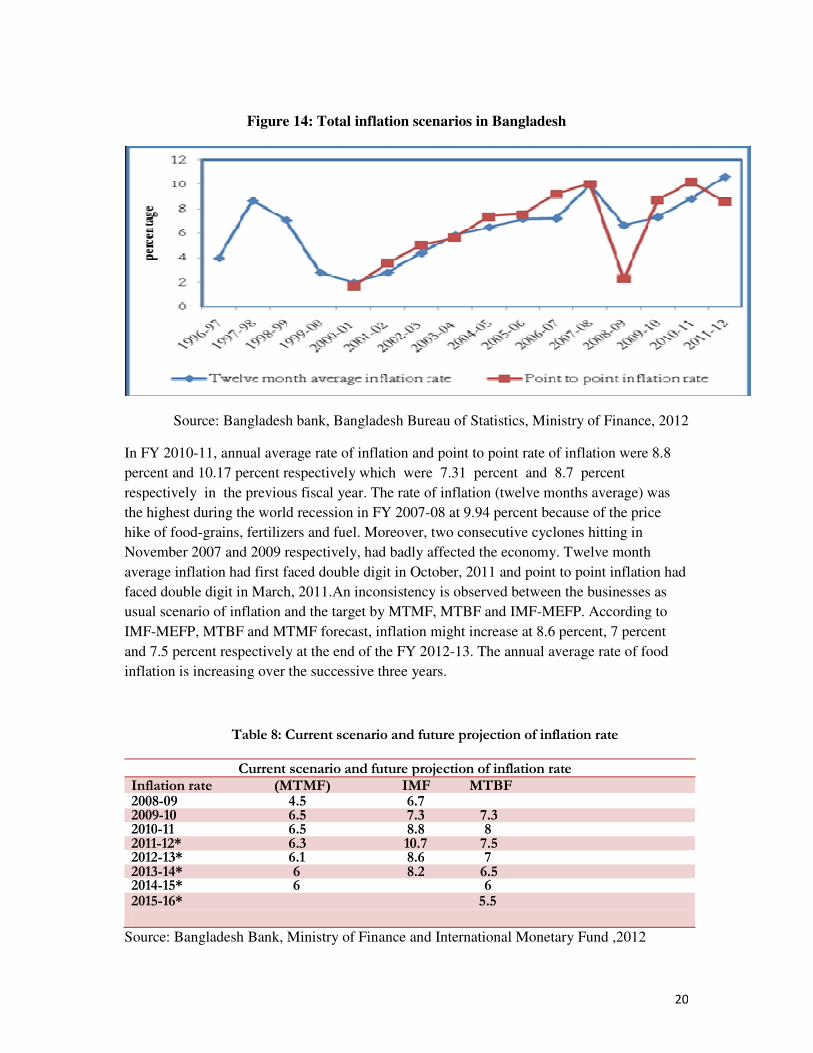
Figure 14: Total inflation scenarios in Bangladesh
Source: Bangladesh bank, Bangladesh Bureau of Statistics, Ministry of Finance, 2012
In FY 2010-11, annual average rate of inflation and point to point rate of inflation were 8.8
percent and 10.17 percent respectively which were 7.31 percent and 8.7 percent
respectively in the previous fiscal year. The rate of inflation (twelve months average) was
the highest during the world recession in FY 2007-08 at 9.94 percent because of the price
hike of food-grains, fertilizers and fuel. Moreover, two consecutive cyclones hitting in
November 2007 and 2009 respectively, had badly affected the economy. Twelve month
average inflation had first faced double digit in October, 2011 and point to point inflation had
faced double digit in March, 2011.An inconsistency is observed between the businesses as
usual scenario of inflation and the target by MTMF, MTBF and IMF-MEFP. According to
IMF-MEFP, MTBF and MTMF forecast, inflation might increase at 8.6 percent, 7 percent
and 7.5 percent respectively at the end of the FY 2012-13. The annual average rate of food
inflation is increasing over the successive three years.
Table 8: Current scenario and future projection of inflation rate
Current scenario and future projection of inflation rate Inflation rate (MTMF) IMF MTBF 2008-09 4.5 6.7 2009-10 6.5 7.3 7.3 2010-11 6.5 8.8 8 2011-12* 6.3 10.7 7.5 2012-13* 6.1 8.6 7 2013-14* 6 8.2 6.5 2014-15* 6 6 2015-16* 5.5
Source: Bangladesh Bank, Ministry of Finance and International Monetary Fund ,2012
21
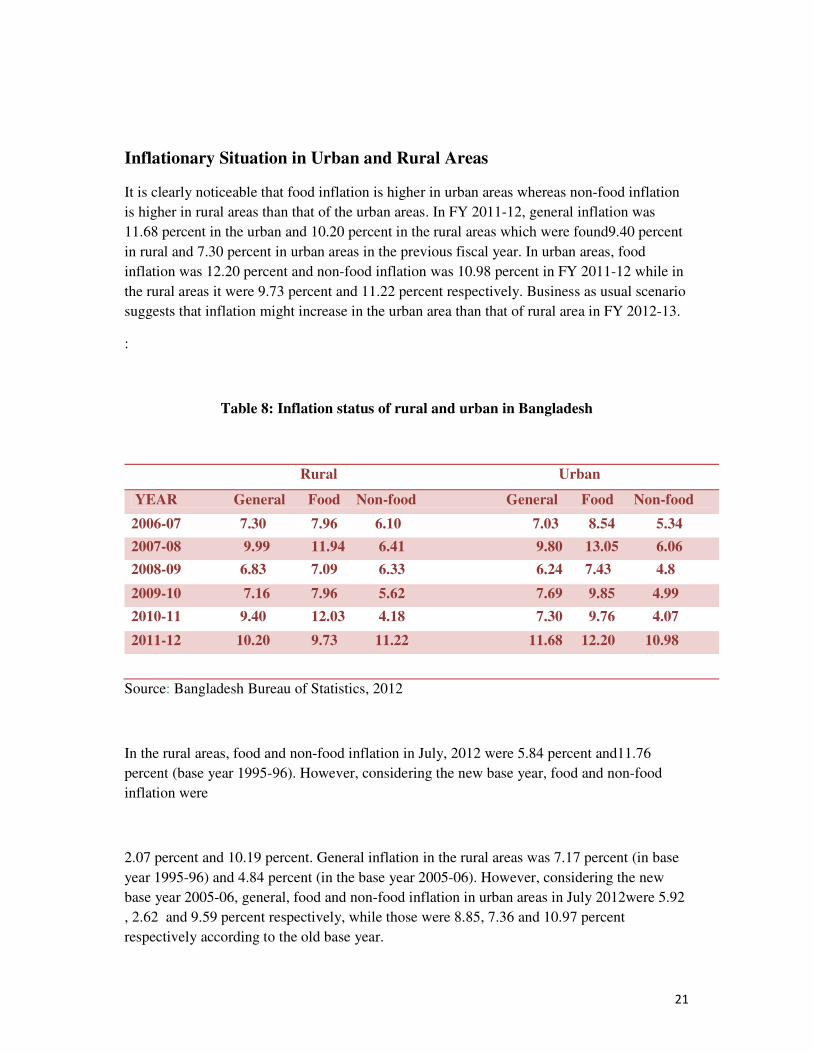
Inflationary Situation in Urban and Rural Areas
It is clearly noticeable that food inflation is higher in urban areas whereas non-food inflation
is higher in rural areas than that of the urban areas. In FY 2011-12, general inflation was
11.68 percent in the urban and 10.20 percent in the rural areas which were found9.40 percent
in rural and 7.30 percent in urban areas in the previous fiscal year. In urban areas, food
inflation was 12.20 percent and non-food inflation was 10.98 percent in FY 2011-12 while in
the rural areas it were 9.73 percent and 11.22 percent respectively. Business as usual scenario
suggests that inflation might increase in the urban area than that of rural area in FY 2012-13.
:
Table 8: Inflation status of rural and urban in Bangladesh
Rural Urban
YEAR General Food Non-food General Food Non-food
2006-07 7.30 7.96 6.10 7.03 8.54 5.34
2007-08 9.99 11.94 6.41 9.80 13.05 6.06
2008-09 6.83 7.09 6.33 6.24 7.43 4.8
2009-10 7.16 7.96 5.62 7.69 9.85 4.99
2010-11 9.40 12.03 4.18 7.30 9.76 4.07
2011-12 10.20 9.73 11.22 11.68 12.20 10.98
Source: Bangladesh Bureau of Statistics, 2012
In the rural areas, food and non-food inflation in July, 2012 were 5.84 percent and11.76
percent (base year 1995-96). However, considering the new base year, food and non-food
inflation were
2.07 percent and 10.19 percent. General inflation in the rural areas was 7.17 percent (in base
year 1995-96) and 4.84 percent (in the base year 2005-06). However, considering the new
base year 2005-06, general, food and non-food inflation in urban areas in July 2012were 5.92
, 2.62 and 9.59 percent respectively, while those were 8.85, 7.36 and 10.97 percent
respectively according to the old base year.
22
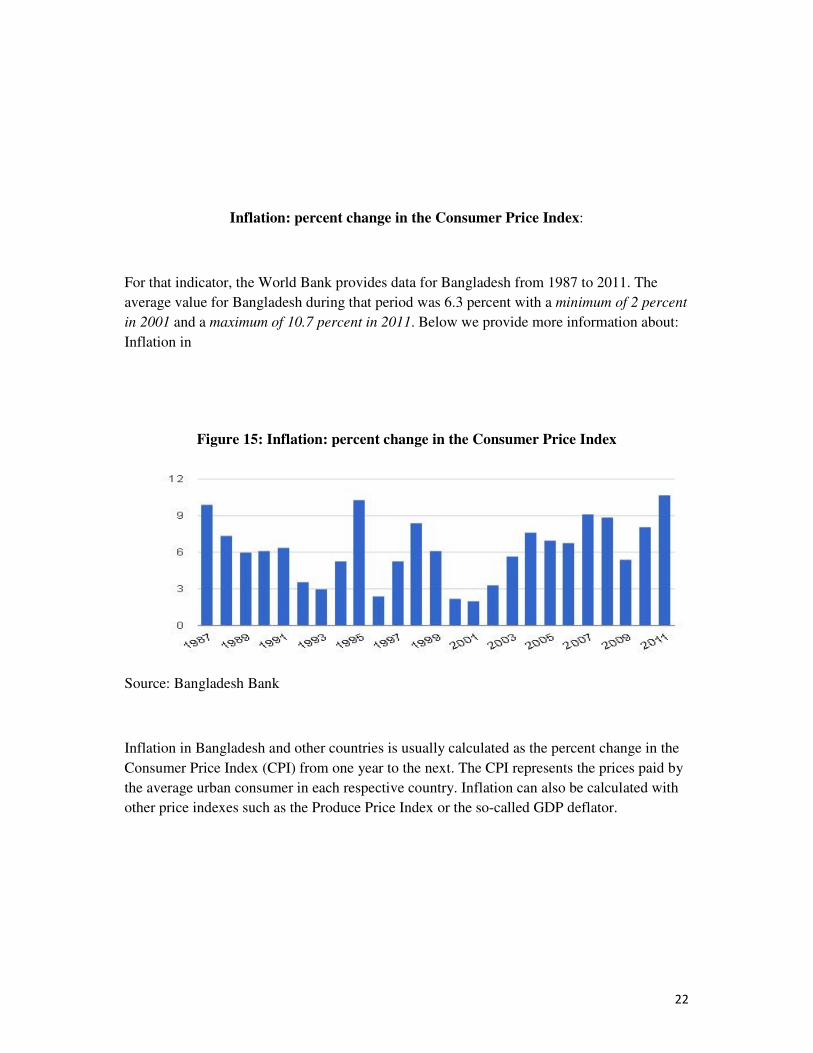
Inflation: percent change in the Consumer Price Index:
For that indicator, the World Bank provides data for Bangladesh from 1987 to 2011. The
average value for Bangladesh during that period was 6.3 percent with a minimum of 2 percent
in 2001 and a maximum of 10.7 percent in 2011. Below we provide more information about:
Inflation in
Figure 15: Inflation: percent change in the Consumer Price Index
Source: Bangladesh Bank
Inflation in Bangladesh and other countries is usually calculated as the percent change in the
Consumer Price Index (CPI) from one year to the next. The CPI represents the prices paid by
the average urban consumer in each respective country. Inflation can also be calculated with
other price indexes such as the Produce Price Index or the so-called GDP deflator.
23
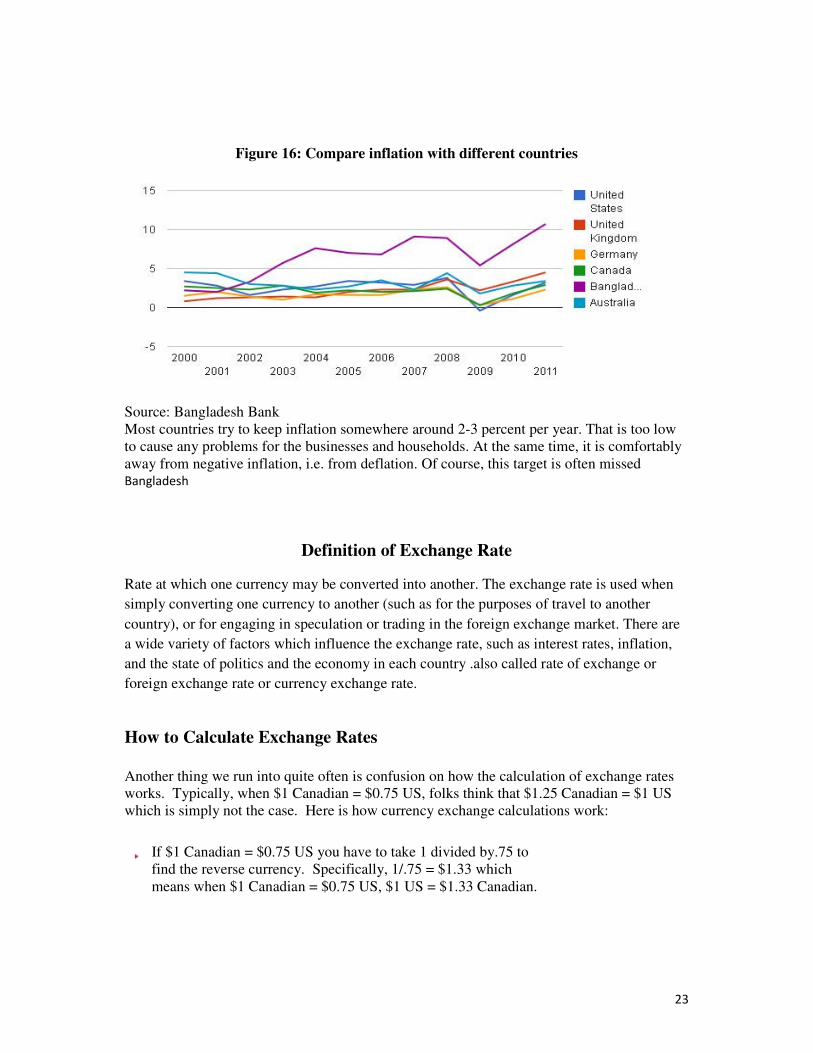
Figure 16: Compare inflation with different countries
Source: Bangladesh Bank Most countries try to keep inflation somewhere around 2-3 percent per year. That is too low to cause any problems for the businesses and households. At the same time, it is comfortably away from negative inflation, i.e. from deflation. Of course, this target is often missed Bangladesh
Definition of Exchange Rate
Rate at which one currency may be converted into another. The exchange rate is used when
simply converting one currency to another (such as for the purposes of travel to another
country), or for engaging in speculation or trading in the foreign exchange market. There are
a wide variety of factors which influence the exchange rate, such as interest rates, inflation,
and the state of politics and the economy in each country .also called rate of exchange or
foreign exchange rate or currency exchange rate.
How to Calculate Exchange Rates
Another thing we run into quite often is confusion on how the calculation of exchange rates works. Typically, when $1 Canadian = $0.75 US, folks think that $1.25 Canadian = $1 US which is simply not the case. Here is how currency exchange calculations work:
If $1 Canadian = $0.75 US you have to take 1 divided by.75 to find the reverse currency. Specifically, 1/.75 = $1.33 which means when $1 Canadian = $0.75 US, $1 US = $1.33 Canadian.
24
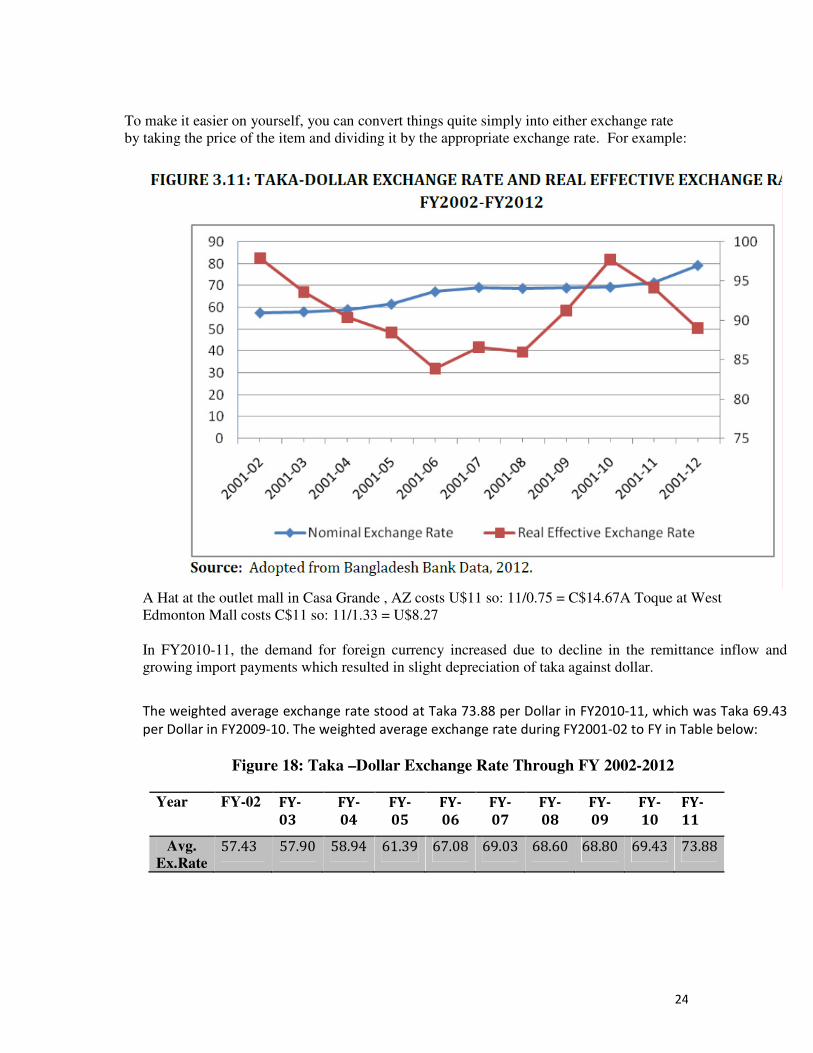
To make it easier on yourself, you can convert things quite simply into either exchange rate by taking the price of the item and dividing it by the appropriate exchange rate. For example:
A Hat at the outlet mall in Casa Grande , AZ costs U$11 so: 11/0.75 = C$14.67A Toque at West Edmonton Mall costs C$11 so: 11/1.33 = U$8.27
In FY2010-11, the demand for foreign currency increased due to decline in the remittance inflow and growing import payments which resulted in slight depreciation of taka against dollar.
The weighted average exchange rate stood at Taka 73.88 per Dollar in FY2010-11, which was Taka 69.43
per Dollar in FY2009-10. The weighted average exchange rate during FY2001-02 to FY in Table below:
Figure 18: Taka –Dollar Exchange Rate Through FY 2002-2012
Year FY-02
FY-
03
FY-
04
FY-
05
FY-
06
FY-
07
FY-
08
FY-
09
FY-
10
FY-
11
Avg. Ex.Rate
57.43 57.90 58.94 61.39 67.08 69.03 68.60 68.80 69.43 73.88
25
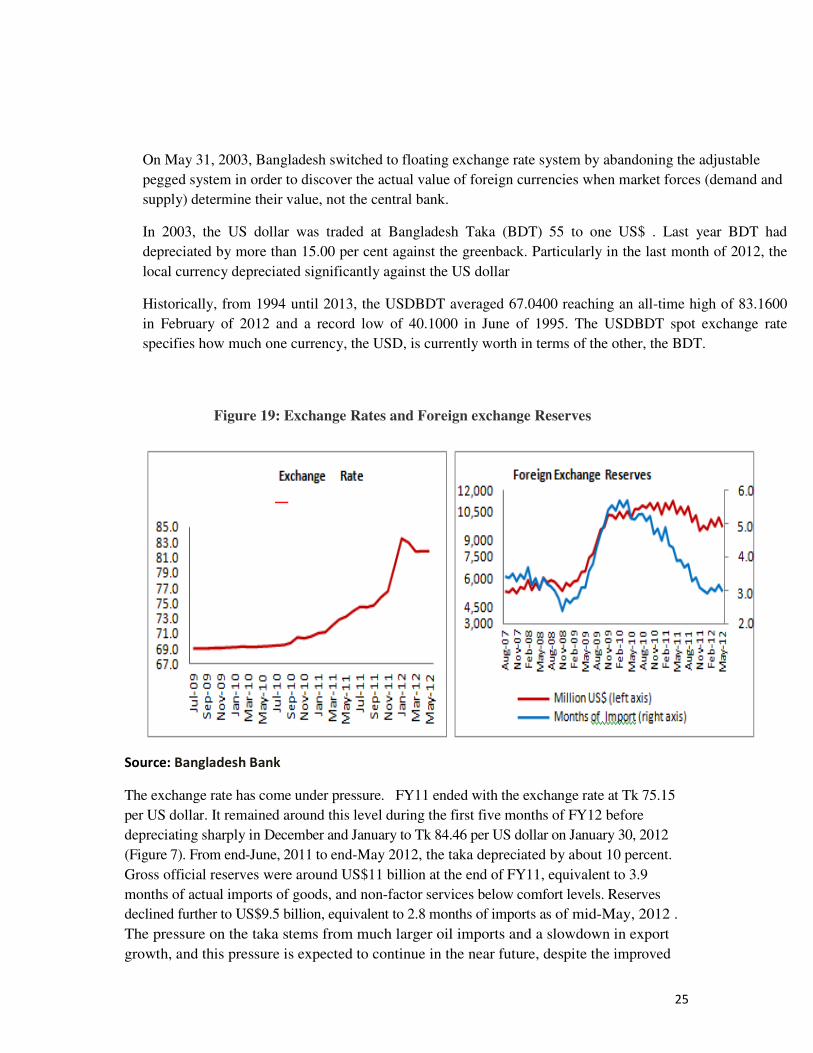
On May 31, 2003, Bangladesh switched to floating exchange rate system by abandoning the adjustable
pegged system in order to discover the actual value of foreign currencies when market forces (demand and
supply) determine their value, not the central bank. In 2003, the US dollar was traded at Bangladesh Taka (BDT) 55 to one US$ . Last year BDT had
depreciated by more than 15.00 per cent against the greenback. Particularly in the last month of 2012, the
local currency depreciated significantly against the US dollar
Historically, from 1994 until 2013, the USDBDT averaged 67.0400 reaching an all-time high of 83.1600
in February of 2012 and a record low of 40.1000 in June of 1995. The USDBDT spot exchange rate
specifies how much one currency, the USD, is currently worth in terms of the other, the BDT.
Figure 19: Exchange Rates and Foreign exchange Reserves
Source: Bangladesh Bank
The exchange rate has come under pressure. FY11 ended with the exchange rate at Tk 75.15
per US dollar. It remained around this level during the first five months of FY12 before
depreciating sharply in December and January to Tk 84.46 per US dollar on January 30, 2012
(Figure 7). From end-June, 2011 to end-May 2012, the taka depreciated by about 10 percent.
Gross official reserves were around US$11 billion at the end of FY11, equivalent to 3.9
months of actual imports of goods, and non-factor services below comfort levels. Reserves
declined further to US$9.5 billion, equivalent to 2.8 months of imports as of mid-May, 2012 .
The pressure on the taka stems from much larger oil imports and a slowdown in export
growth, and this pressure is expected to continue in the near future, despite the improved
26
competitiveness of Bangladesh’s exports arising from a decline in its real effective exchange
rate during December, 2011 and May, 2012. The pressure may ease somewhat if remittances
continue to respond strongly to the recent depreciation of the taka.
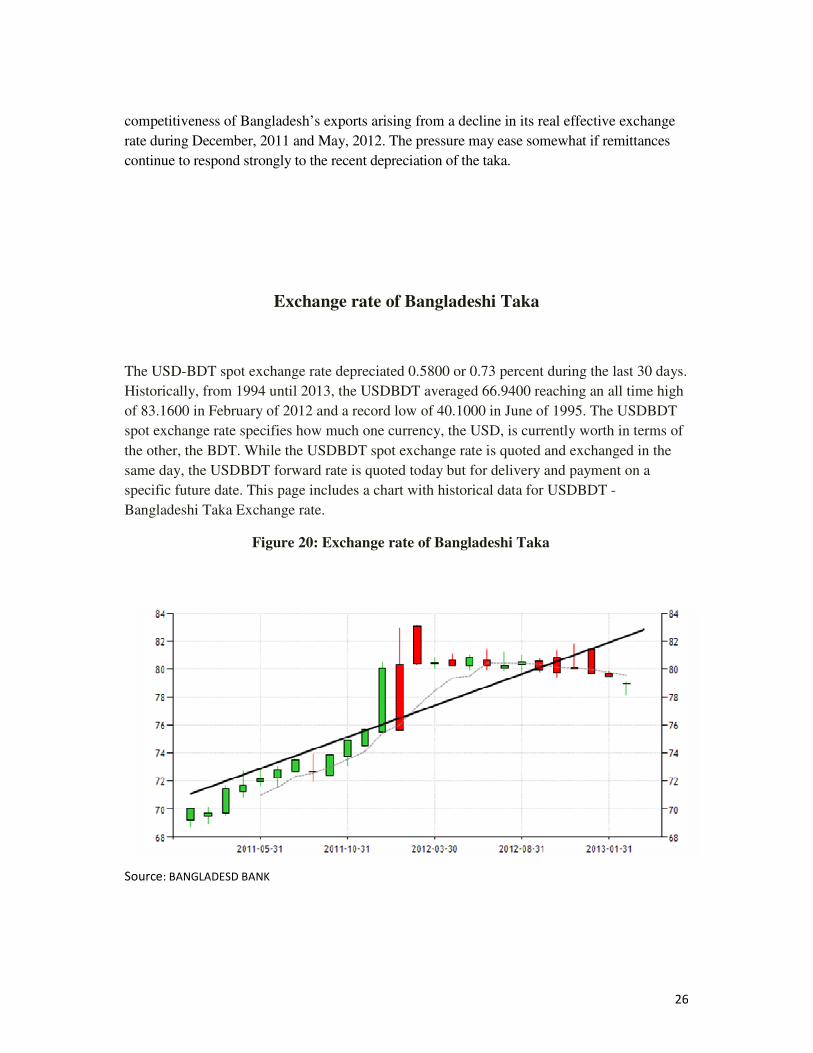
Exchange rate of Bangladeshi Taka
The USD-BDT spot exchange rate depreciated 0.5800 or 0.73 percent during the last 30 days.
Historically, from 1994 until 2013, the USDBDT averaged 66.9400 reaching an all time high
of 83.1600 in February of 2012 and a record low of 40.1000 in June of 1995. The USDBDT
spot exchange rate specifies how much one currency, the USD, is currently worth in terms of
the other, the BDT. While the USDBDT spot exchange rate is quoted and exchanged in the
same day, the USDBDT forward rate is quoted today but for delivery and payment on a
specific future date. This page includes a chart with historical data for USDBDT -
Bangladeshi Taka Exchange rate.
Figure 20: Exchange rate of Bangladeshi Taka
Source: BANGLADESD BANK
27
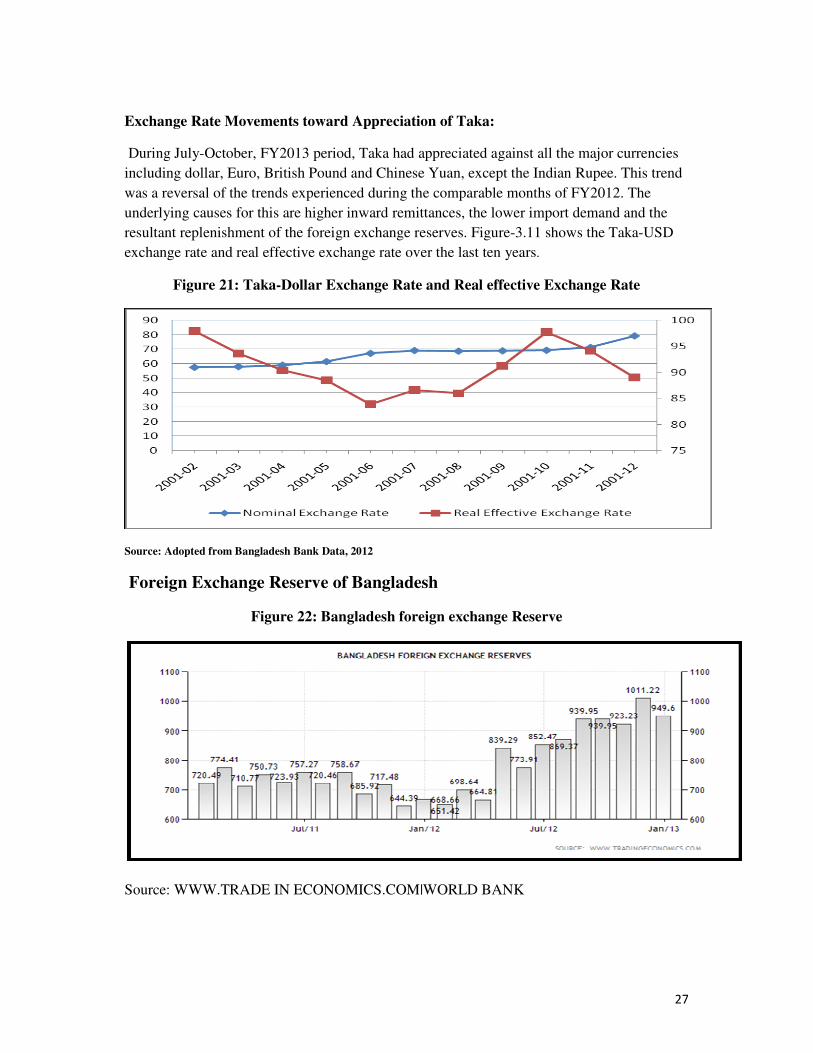
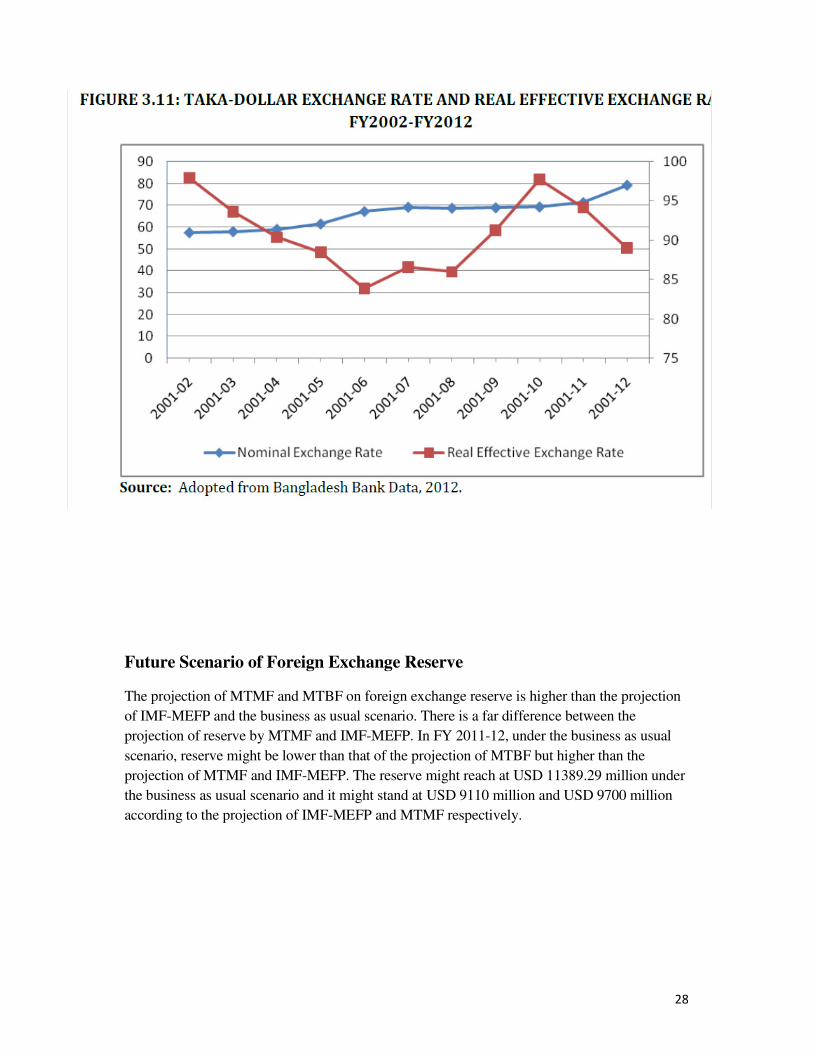
Exchange Rate Movements toward Appreciation of Taka:
During July-October, FY2013 period, Taka had appreciated against all the major currencies
including dollar, Euro, British Pound and Chinese Yuan, except the Indian Rupee. This trend
was a reversal of the trends experienced during the comparable months of FY2012. The
underlying causes for this are higher inward remittances, the lower import demand and the
resultant replenishment of the foreign exchange reserves. Figure-3.11 shows the Taka-USD
exchange rate and real effective exchange rate over the last ten years.
Figure 21: Taka-Dollar Exchange Rate and Real effective Exchange Rate
Source: Adopted from Bangladesh Bank Data, 2012
Foreign Exchange Reserve of Bangladesh
Figure 22: Bangladesh foreign exchange Reserve
Source: WWW.TRADE IN ECONOMICS.COM|WORLD BANK
28
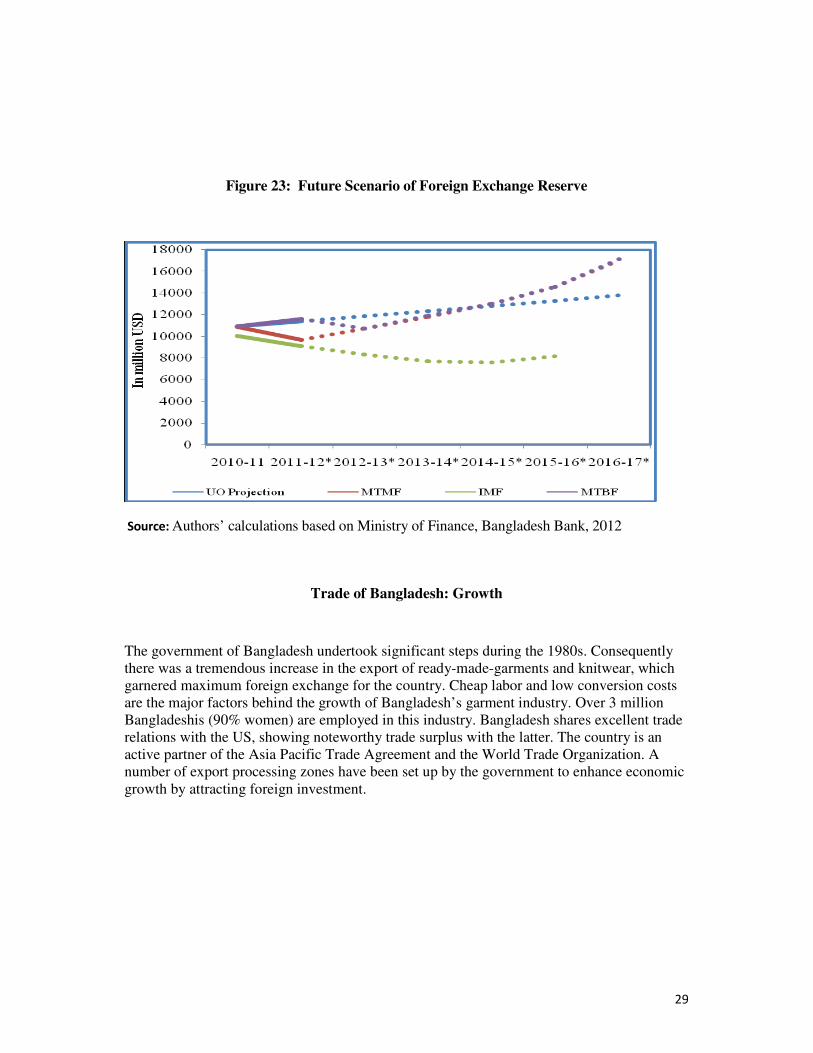
Future Scenario of Foreign Exchange Reserve
The projection of MTMF and MTBF on foreign exchange reserve is higher than the projection
of IMF-MEFP and the business as usual scenario. There is a far difference between the
projection of reserve by MTMF and IMF-MEFP. In FY 2011-12, under the business as usual
scenario, reserve might be lower than that of the projection of MTBF but higher than the
projection of MTMF and IMF-MEFP. The reserve might reach at USD 11389.29 million under
the business as usual scenario and it might stand at USD 9110 million and USD 9700 million
according to the projection of IMF-MEFP and MTMF respectively.
29
Figure 23: Future Scenario of Foreign Exchange Reserve
Source: Authors’ calculations based on Ministry of Finance, Bangladesh Bank, 2012
Trade of Bangladesh: Growth
The government of Bangladesh undertook significant steps during the 1980s. Consequently there was a tremendous increase in the export of ready-made-garments and knitwear, which garnered maximum foreign exchange for the country. Cheap labor and low conversion costs are the major factors behind the growth of Bangladesh’s garment industry. Over 3 million Bangladeshis (90% women) are employed in this industry. Bangladesh shares excellent trade relations with the US, showing noteworthy trade surplus with the latter. The country is an active partner of the Asia Pacific Trade Agreement and the World Trade Organization. A number of export processing zones have been set up by the government to enhance economic growth by attracting foreign investment.
30
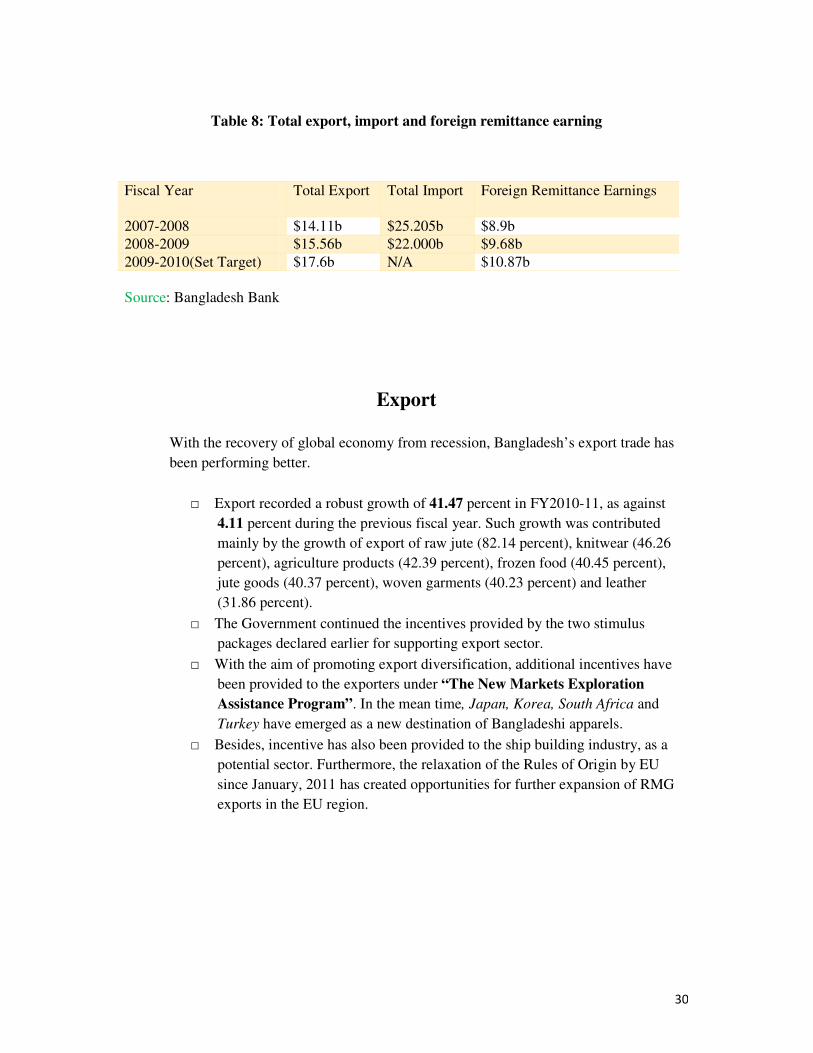
Table 8: Total export, import and foreign remittance earning
Fiscal Year Total Export Total Import Foreign Remittance Earnings
2007-2008 $14.11b $25.205b $8.9b
2008-2009 $15.56b $22.000b $9.68b
2009-2010(Set Target) $17.6b N/A $10.87b
Source: Bangladesh Bank
Export
With the recovery of global economy from recession, Bangladesh’s export trade has
been performing better.
□ Export recorded a robust growth of 41.47 percent in FY2010-11, as against
4.11 percent during the previous fiscal year. Such growth was contributed
mainly by the growth of export of raw jute (82.14 percent), knitwear (46.26
percent), agriculture products (42.39 percent), frozen food (40.45 percent),
jute goods (40.37 percent), woven garments (40.23 percent) and leather
(31.86 percent).
□ The Government continued the incentives provided by the two stimulus
packages declared earlier for supporting export sector.
□ With the aim of promoting export diversification, additional incentives have
been provided to the exporters under “The New Markets Exploration
Assistance Program”. In the mean time, Japan, Korea, South Africa and
Turkey have emerged as a new destination of Bangladeshi apparels.
□ Besides, incentive has also been provided to the ship building industry, as a
potential sector. Furthermore, the relaxation of the Rules of Origin by EU
since January, 2011 has created opportunities for further expansion of RMG
exports in the EU region.
31
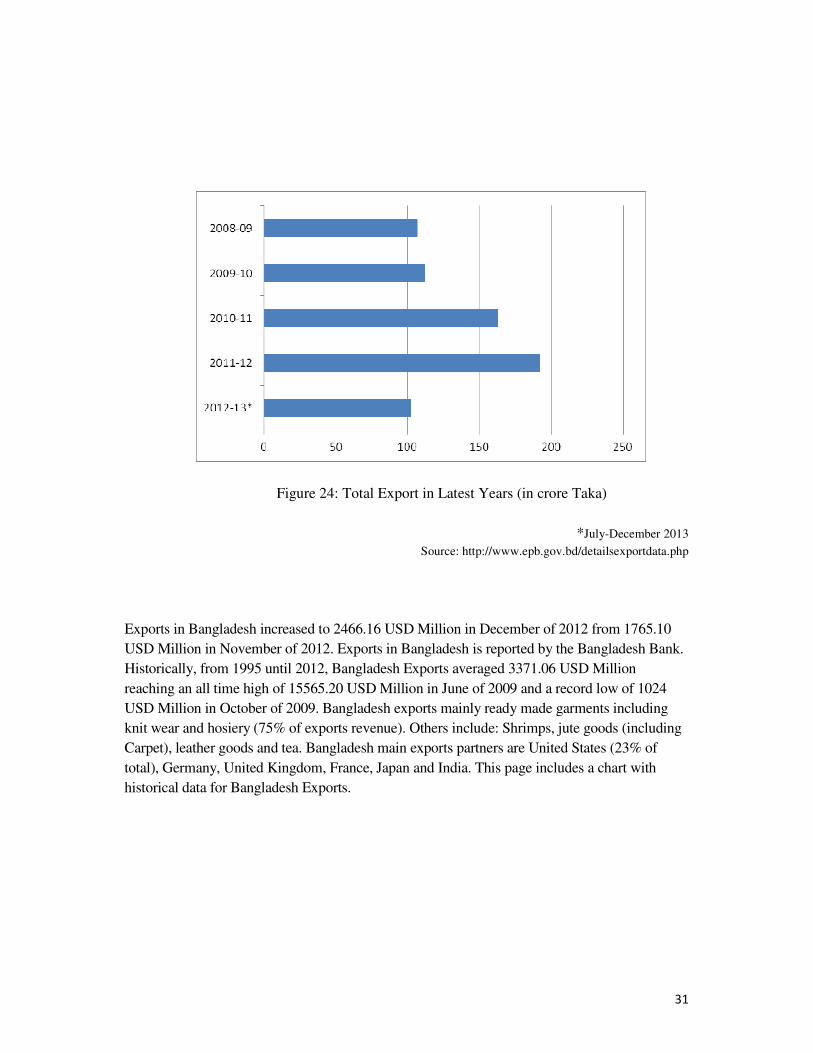
Figure 24: Total Export in Latest Years (in crore Taka)
*July-December 2013
Source: http://www.epb.gov.bd/detailsexportdata.php
Exports in Bangladesh increased to 2466.16 USD Million in December of 2012 from 1765.10
USD Million in November of 2012. Exports in Bangladesh is reported by the Bangladesh Bank.
Historically, from 1995 until 2012, Bangladesh Exports averaged 3371.06 USD Million
reaching an all time high of 15565.20 USD Million in June of 2009 and a record low of 1024
USD Million in October of 2009. Bangladesh exports mainly ready made garments including
knit wear and hosiery (75% of exports revenue). Others include: Shrimps, jute goods (including
Carpet), leather goods and tea. Bangladesh main exports partners are United States (23% of
total), Germany, United Kingdom, France, Japan and India. This page includes a chart with
historical data for Bangladesh Exports.
32
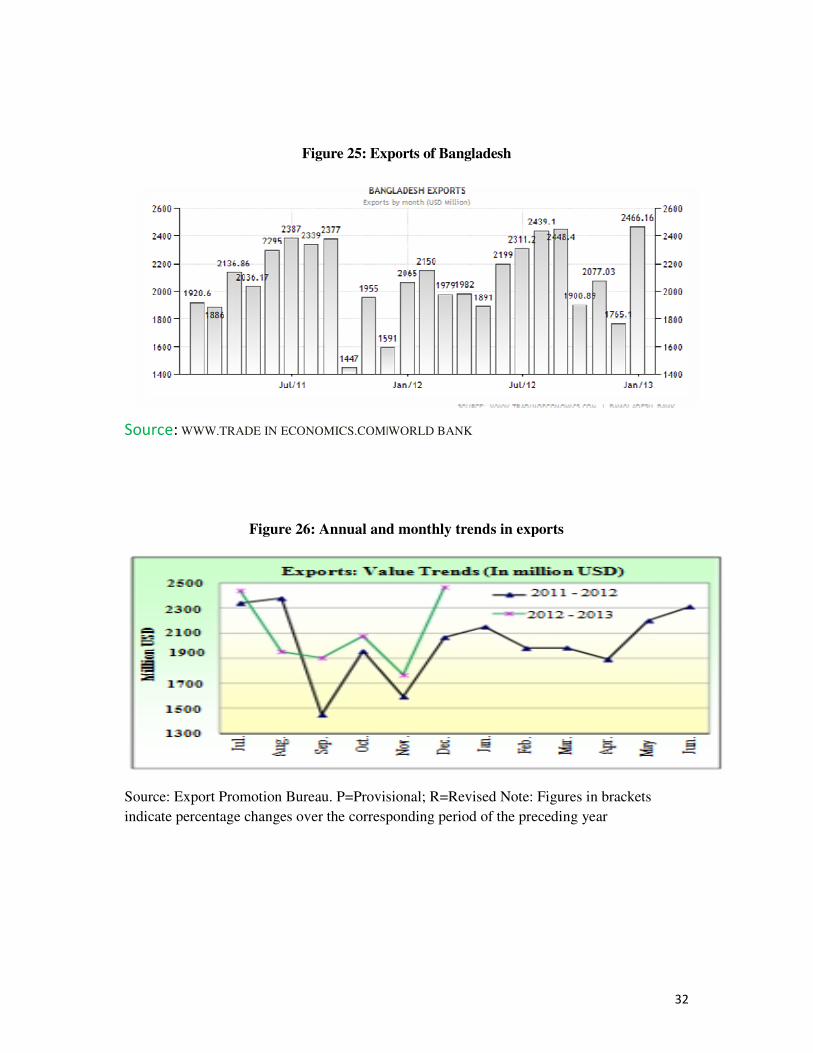
Figure 25: Exports of Bangladesh
Source: WWW.TRADE IN ECONOMICS.COM|WORLD BANK
Figure 26: Annual and monthly trends in exports
Source: Export Promotion Bureau. P=Provisional; R=Revised Note: Figures in brackets
indicate percentage changes over the corresponding period of the preceding year
33
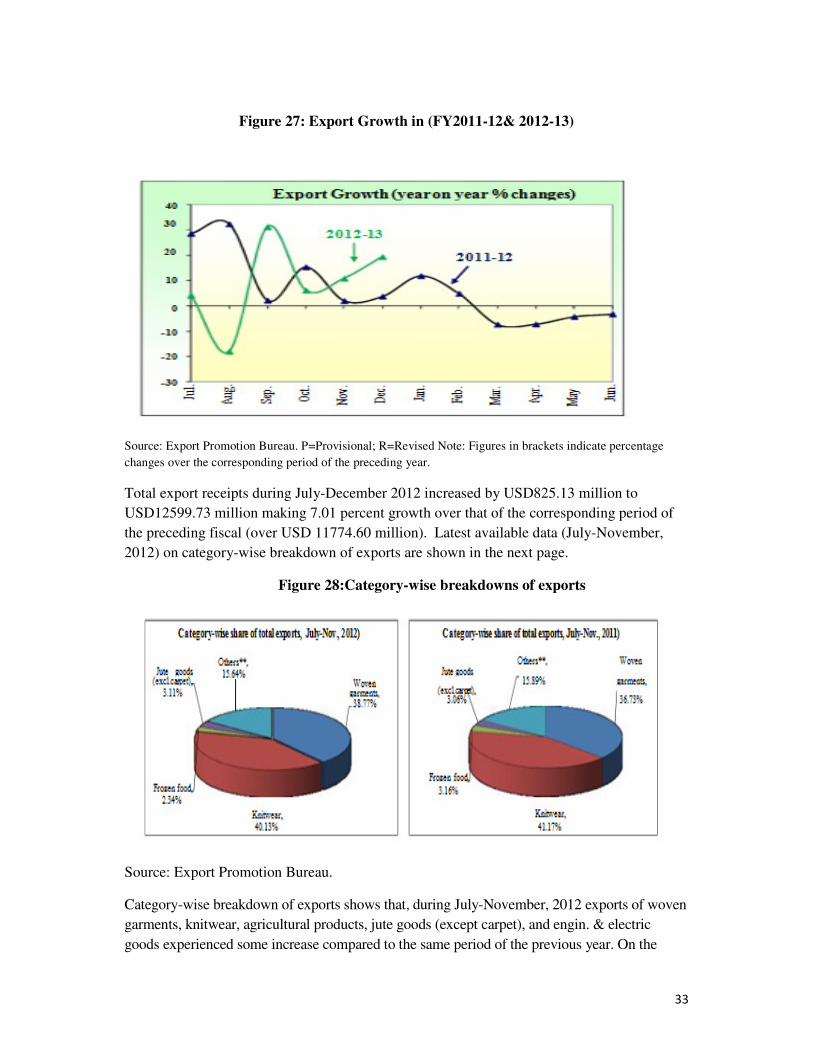
Figure 27: Export Growth in (FY2011-12& 2012-13)
Source: Export Promotion Bureau. P=Provisional; R=Revised Note: Figures in brackets indicate percentage
changes over the corresponding period of the preceding year.
Total export receipts during July-December 2012 increased by USD825.13 million to
USD12599.73 million making 7.01 percent growth over that of the corresponding period of
the preceding fiscal (over USD 11774.60 million). Latest available data (July-November,
2012) on category-wise breakdown of exports are shown in the next page.
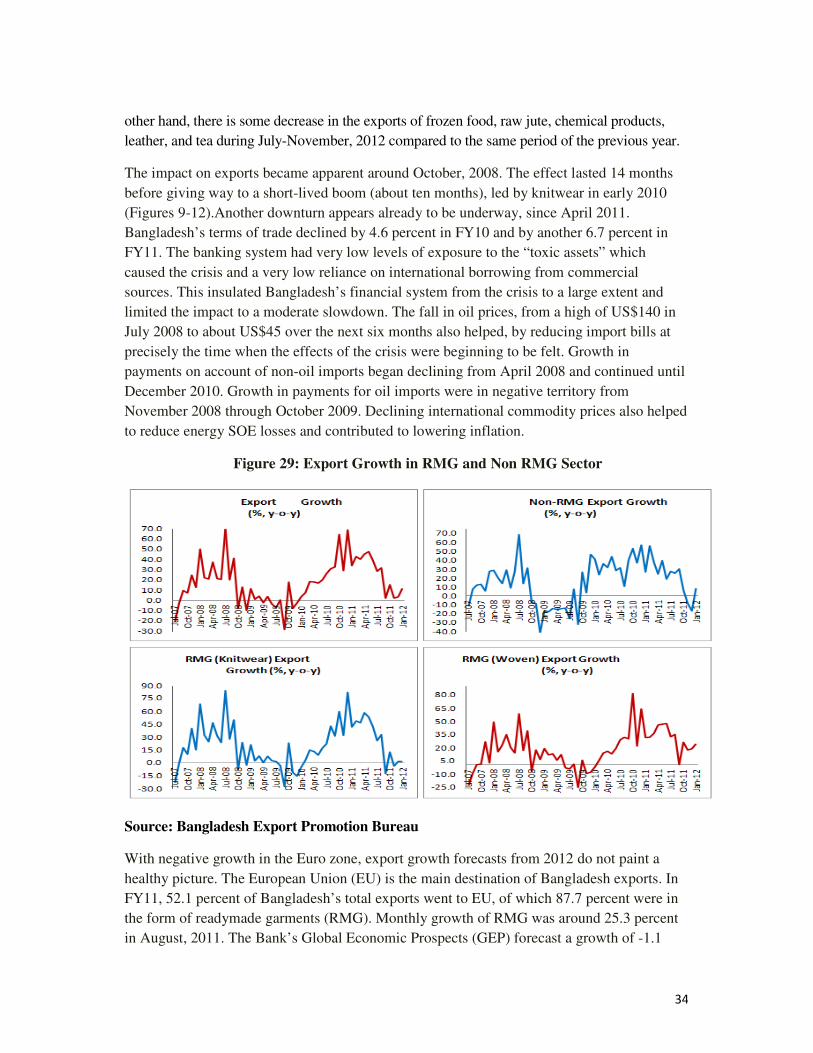
Figure 28:Category-wise breakdowns of exports
Source: Export Promotion Bureau.
Category-wise breakdown of exports shows that, during July-November, 2012 exports of woven
garments, knitwear, agricultural products, jute goods (except carpet), and engin. & electric
goods experienced some increase compared to the same period of the previous year. On the
34
other hand, there is some decrease in the exports of frozen food, raw jute, chemical products,
leather, and tea during July-November, 2012 compared to the same period of the previous year.
The impact on exports became apparent around October, 2008. The effect lasted 14 months
before giving way to a short-lived boom (about ten months), led by knitwear in early 2010
(Figures 9-12).Another downturn appears already to be underway, since April 2011.
Bangladesh’s terms of trade declined by 4.6 percent in FY10 and by another 6.7 percent in
FY11. The banking system had very low levels of exposure to the “toxic assets” which
caused the crisis and a very low reliance on international borrowing from commercial
sources. This insulated Bangladesh’s financial system from the crisis to a large extent and
limited the impact to a moderate slowdown. The fall in oil prices, from a high of US$140 in
July 2008 to about US$45 over the next six months also helped, by reducing import bills at
precisely the time when the effects of the crisis were beginning to be felt. Growth in
payments on account of non-oil imports began declining from April 2008 and continued until
December 2010. Growth in payments for oil imports were in negative territory from
November 2008 through October 2009. Declining international commodity prices also helped
to reduce energy SOE losses and contributed to lowering inflation.
Figure 29: Export Growth in RMG and Non RMG Sector
Source: Bangladesh Export Promotion Bureau
With negative growth in the Euro zone, export growth forecasts from 2012 do not paint a
healthy picture. The European Union (EU) is the main destination of Bangladesh exports. In
FY11, 52.1 percent of Bangladesh’s total exports went to EU, of which 87.7 percent were in
the form of readymade garments (RMG). Monthly growth of RMG was around 25.3 percent
in August, 2011. The Bank’s Global Economic Prospects (GEP) forecast a growth of -1.1
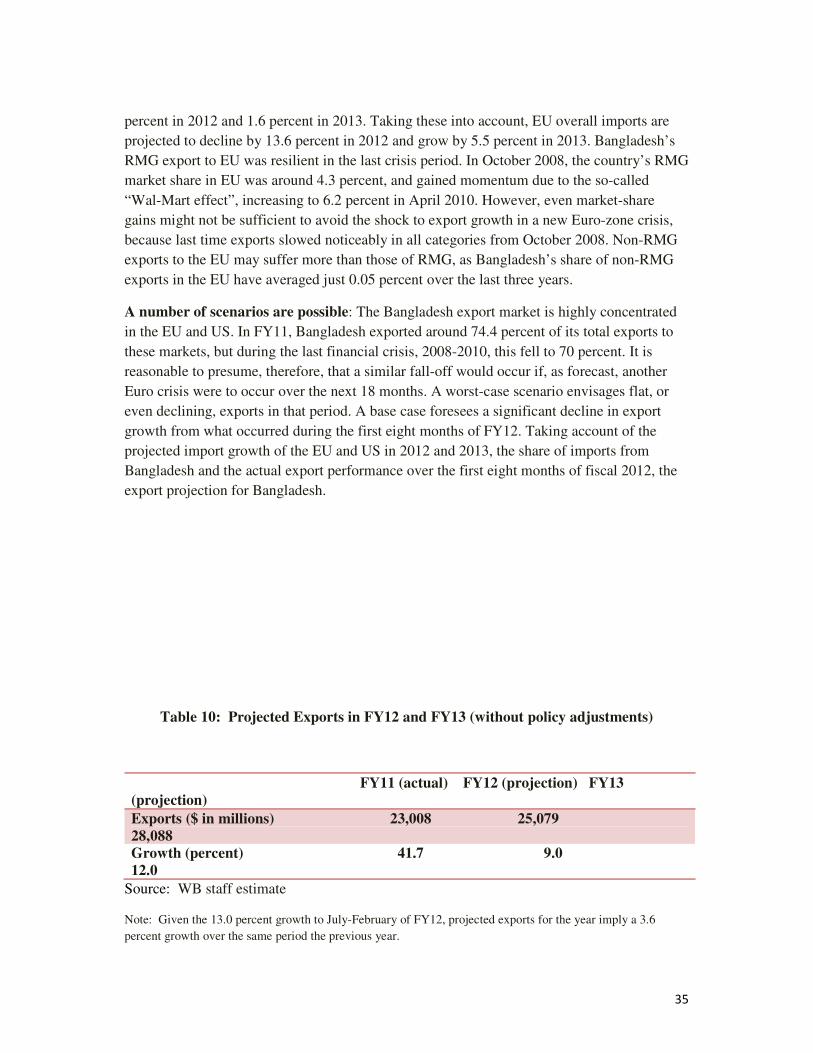
35
percent in 2012 and 1.6 percent in 2013. Taking these into account, EU overall imports are
projected to decline by 13.6 percent in 2012 and grow by 5.5 percent in 2013. Bangladesh’s
RMG export to EU was resilient in the last crisis period. In October 2008, the country’s RMG
market share in EU was around 4.3 percent, and gained momentum due to the so-called
“Wal-Mart effect”, increasing to 6.2 percent in April 2010. However, even market-share
gains might not be sufficient to avoid the shock to export growth in a new Euro-zone crisis,
because last time exports slowed noticeably in all categories from October 2008. Non-RMG
exports to the EU may suffer more than those of RMG, as Bangladesh’s share of non-RMG
exports in the EU have averaged just 0.05 percent over the last three years.
A number of scenarios are possible: The Bangladesh export market is highly concentrated
in the EU and US. In FY11, Bangladesh exported around 74.4 percent of its total exports to
these markets, but during the last financial crisis, 2008-2010, this fell to 70 percent. It is
reasonable to presume, therefore, that a similar fall-off would occur if, as forecast, another
Euro crisis were to occur over the next 18 months. A worst-case scenario envisages flat, or
even declining, exports in that period. A base case foresees a significant decline in export
growth from what occurred during the first eight months of FY12. Taking account of the
projected import growth of the EU and US in 2012 and 2013, the share of imports from
Bangladesh and the actual export performance over the first eight months of fiscal 2012, the
export projection for Bangladesh.
Table 10: Projected Exports in FY12 and FY13 (without policy adjustments)
FY11 (actual) FY12 (projection) FY13 (projection)
Exports ($ in millions) 23,008 25,079 28,088 Growth (percent) 41.7 9.0 12.0
Source: WB staff estimate
Note: Given the 13.0 percent growth to July-February of FY12, projected exports for the year imply a 3.6
percent growth over the same period the previous year.
36
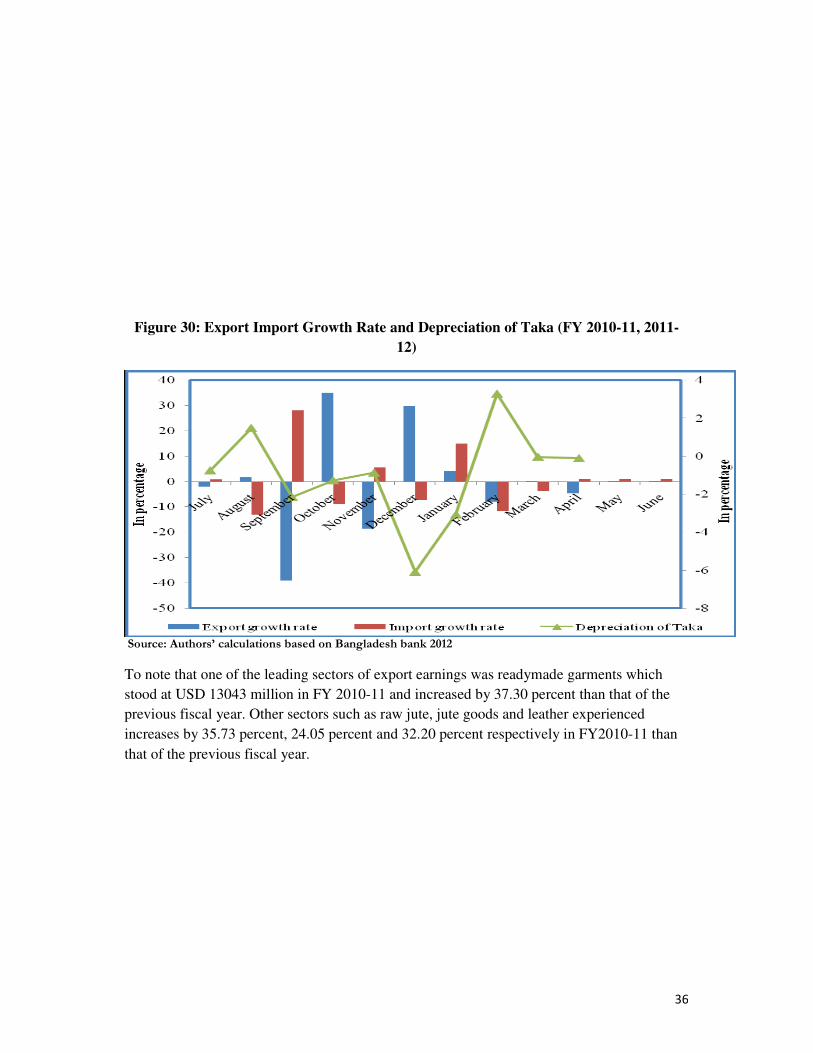
Figure 30: Export Import Growth Rate and Depreciation of Taka (FY 2010-11, 2011-
12)
Source: Authors’ calculations based on Bangladesh bank 2012
To note that one of the leading sectors of export earnings was readymade garments which
stood at USD 13043 million in FY 2010-11 and increased by 37.30 percent than that of the
previous fiscal year. Other sectors such as raw jute, jute goods and leather experienced
increases by 35.73 percent, 24.05 percent and 32.20 percent respectively in FY2010-11 than
that of the previous fiscal year.
37
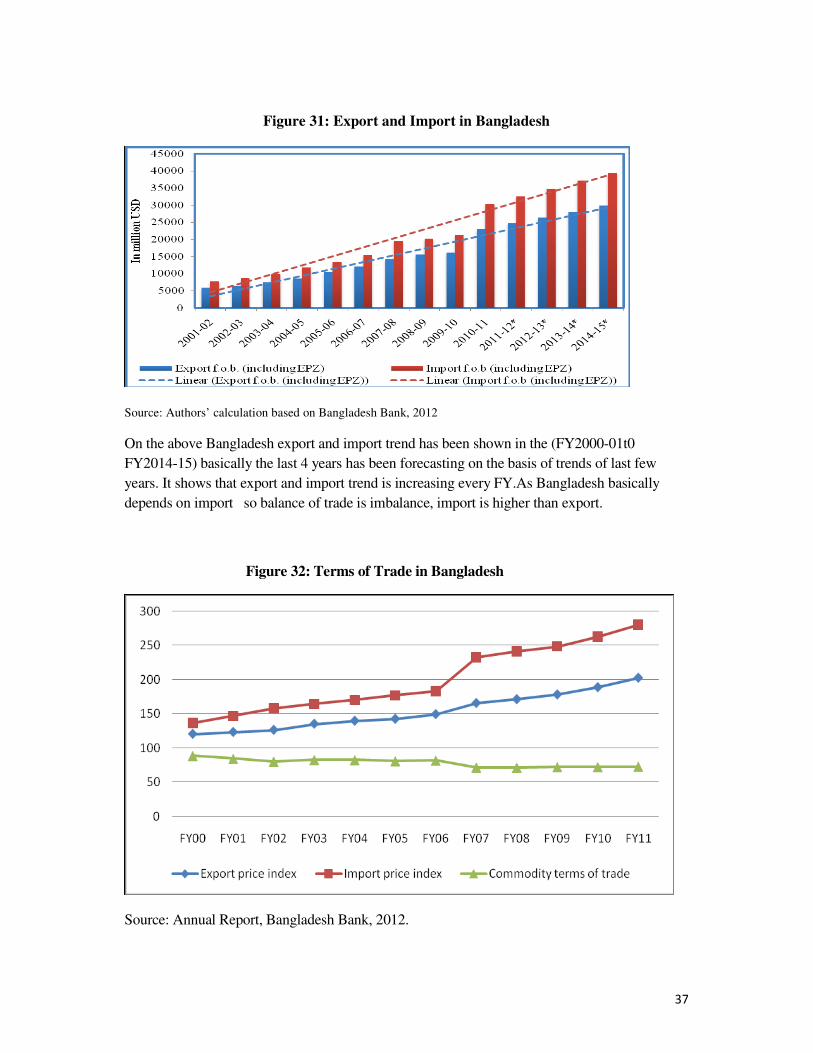
Figure 31: Export and Import in Bangladesh
Source: Authors’ calculation based on Bangladesh Bank, 2012
On the above Bangladesh export and import trend has been shown in the (FY2000-01t0
FY2014-15) basically the last 4 years has been forecasting on the basis of trends of last few
years. It shows that export and import trend is increasing every FY.As Bangladesh basically
depends on import so balance of trade is imbalance, import is higher than export.
Figure 32: Terms of Trade in Bangladesh
Source: Annual Report, Bangladesh Bank, 2012.
38
It is important to mention here that Bangladesh’s terms of trade has been following a declining
trend in recent years. Whilst reliable up to date data is lacking, according to Bangladesh Bank
information, TOT has improved marginally, by 0.5 per cent, in FY2011 compared to the
FY2010. In view of volatility of commodity prices in the global market, a renewed effort to
move up the value chain in exportable, away from basic manufactured items where price
movements are slow, is required to change the situation in Bangladesh’s favors.
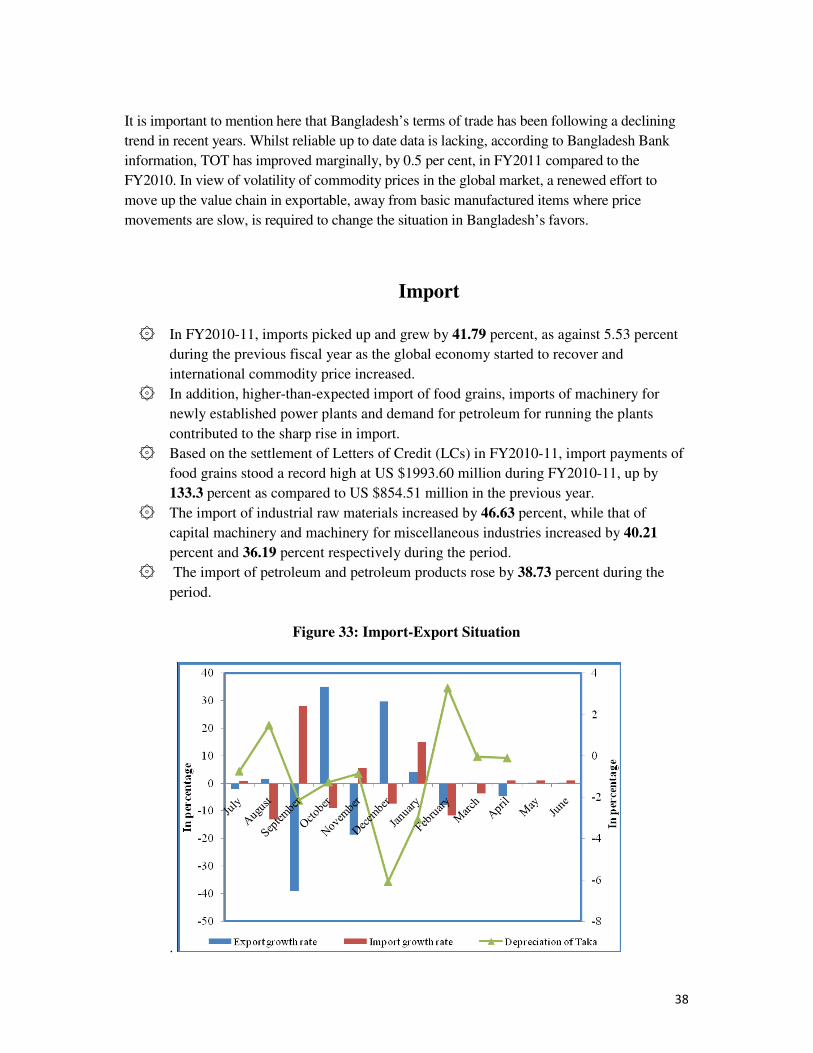
Import
۞ In FY2010-11, imports picked up and grew by 41.79 percent, as against 5.53 percent
during the previous fiscal year as the global economy started to recover and
international commodity price increased.
۞ In addition, higher-than-expected import of food grains, imports of machinery for
newly established power plants and demand for petroleum for running the plants
contributed to the sharp rise in import.
۞ Based on the settlement of Letters of Credit (LCs) in FY2010-11, import payments of
food grains stood a record high at US $1993.60 million during FY2010-11, up by
133.3 percent as compared to US $854.51 million in the previous year.
۞ The import of industrial raw materials increased by 46.63 percent, while that of
capital machinery and machinery for miscellaneous industries increased by 40.21
percent and 36.19 percent respectively during the period.
۞ The import of petroleum and petroleum products rose by 38.73 percent during the
period.
Figure 33: Import-Export Situation
.
39
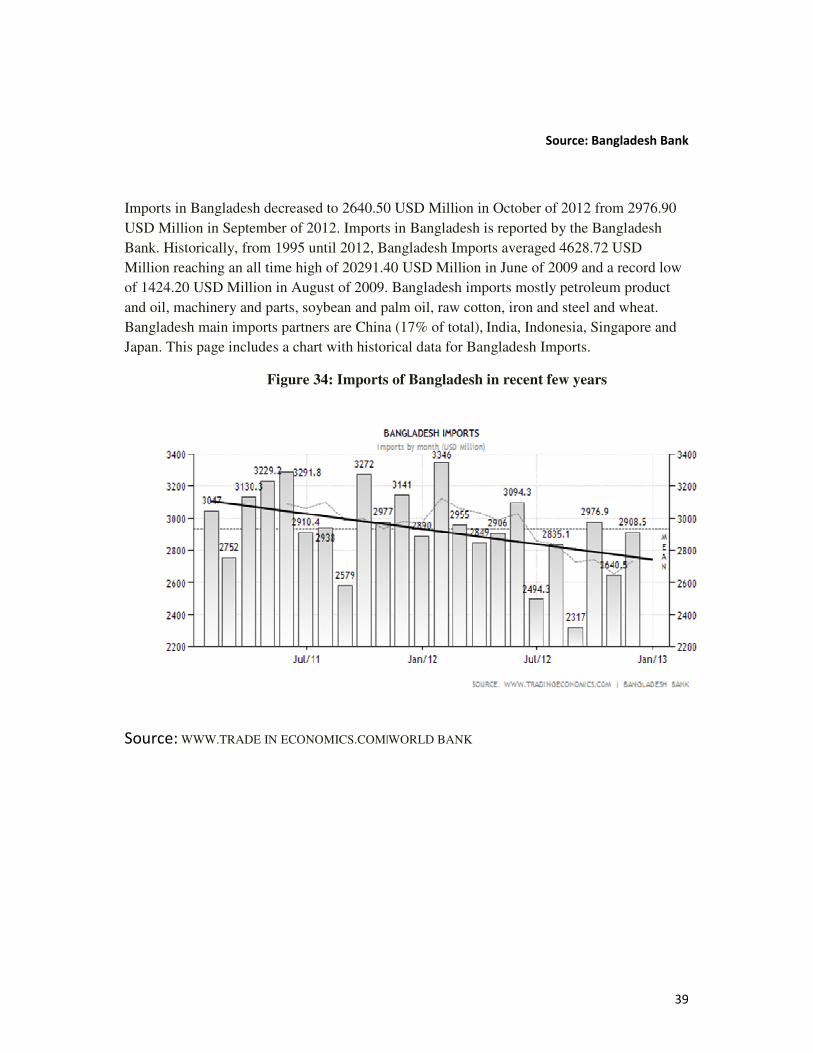
Source: Bangladesh Bank
Imports in Bangladesh decreased to 2640.50 USD Million in October of 2012 from 2976.90
USD Million in September of 2012. Imports in Bangladesh is reported by the Bangladesh
Bank. Historically, from 1995 until 2012, Bangladesh Imports averaged 4628.72 USD
Million reaching an all time high of 20291.40 USD Million in June of 2009 and a record low
of 1424.20 USD Million in August of 2009. Bangladesh imports mostly petroleum product
and oil, machinery and parts, soybean and palm oil, raw cotton, iron and steel and wheat.
Bangladesh main imports partners are China (17% of total), India, Indonesia, Singapore and
Japan. This page includes a chart with historical data for Bangladesh Imports.
Figure 34: Imports of Bangladesh in recent few years
Source: WWW.TRADE IN ECONOMICS.COM|WORLD BANK
40
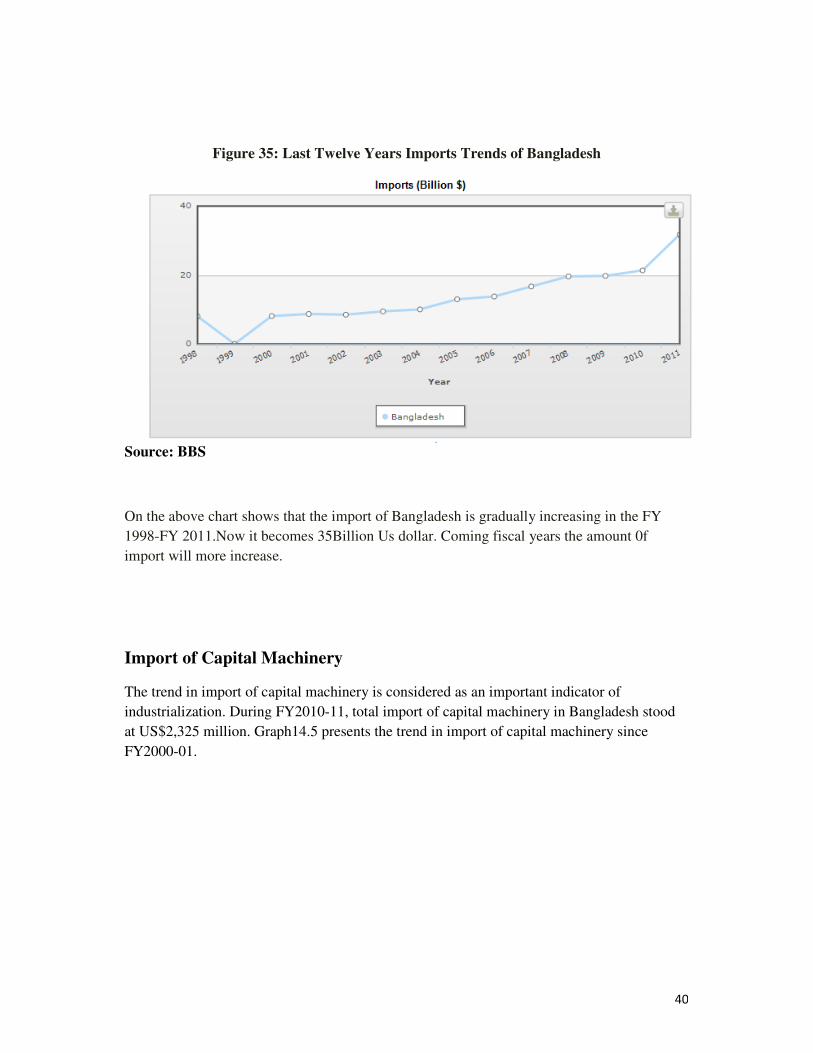
Figure 35: Last Twelve Years Imports Trends of Bangladesh
Source: BBS
On the above chart shows that the import of Bangladesh is gradually increasing in the FY
1998-FY 2011.Now it becomes 35Billion Us dollar. Coming fiscal years the amount 0f
import will more increase.
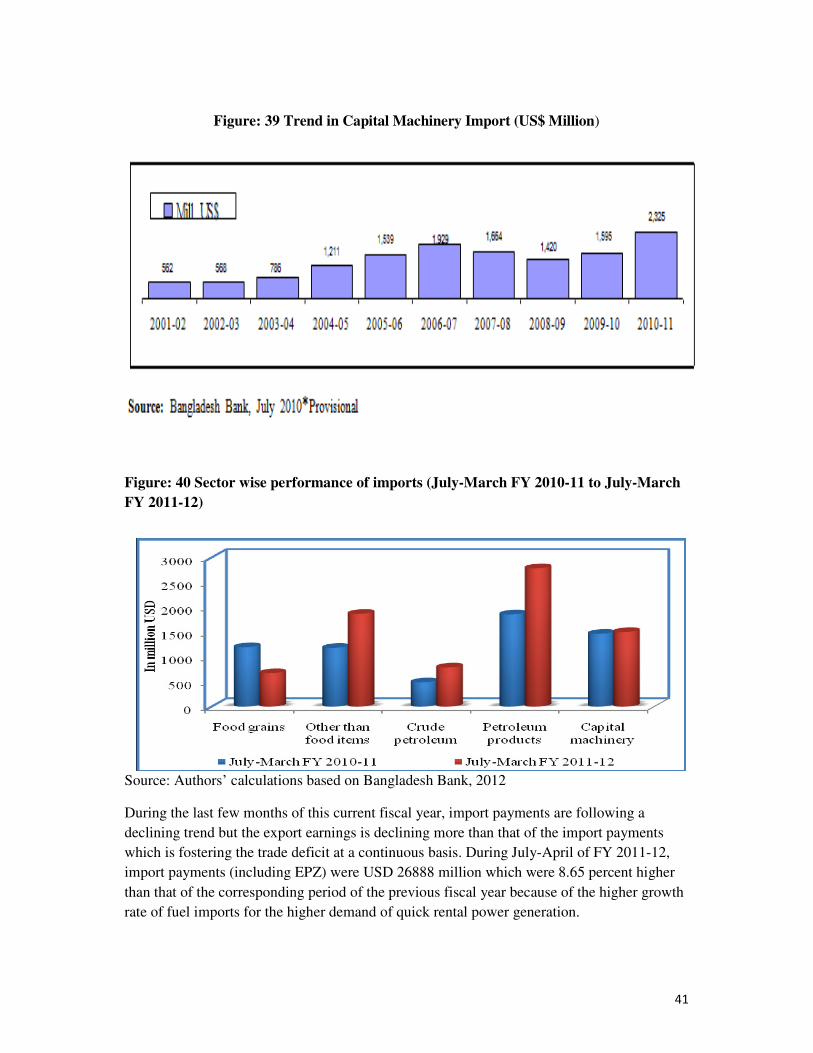
Import of Capital Machinery
The trend in import of capital machinery is considered as an important indicator of
industrialization. During FY2010-11, total import of capital machinery in Bangladesh stood
at US$2,325 million. Graph14.5 presents the trend in import of capital machinery since
FY2000-01.
41
Figure: 39 Trend in Capital Machinery Import (US$ Million)
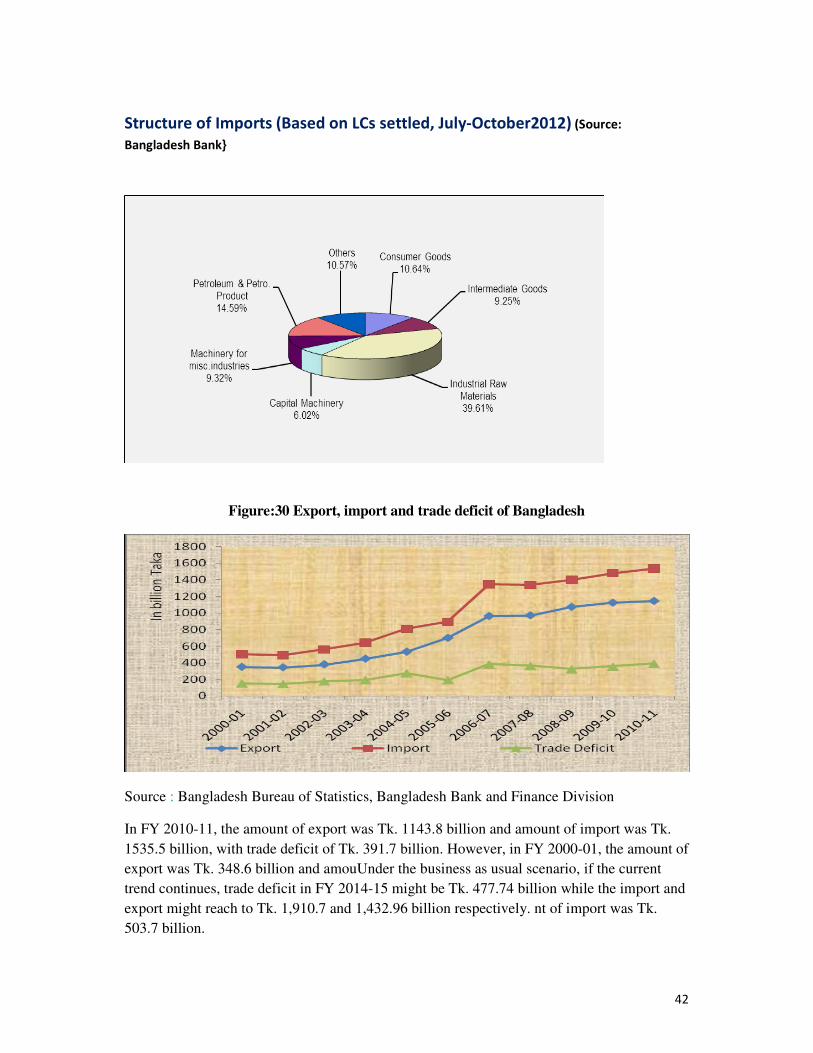
Figure: 40 Sector wise performance of imports (July-March FY 2010-11 to July-March
FY 2011-12)
Source: Authors’ calculations based on Bangladesh Bank, 2012
During the last few months of this current fiscal year, import payments are following a
declining trend but the export earnings is declining more than that of the import payments
which is fostering the trade deficit at a continuous basis. During July-April of FY 2011-12,
import payments (including EPZ) were USD 26888 million which were 8.65 percent higher
than that of the corresponding period of the previous fiscal year because of the higher growth
rate of fuel imports for the higher demand of quick rental power generation.
42
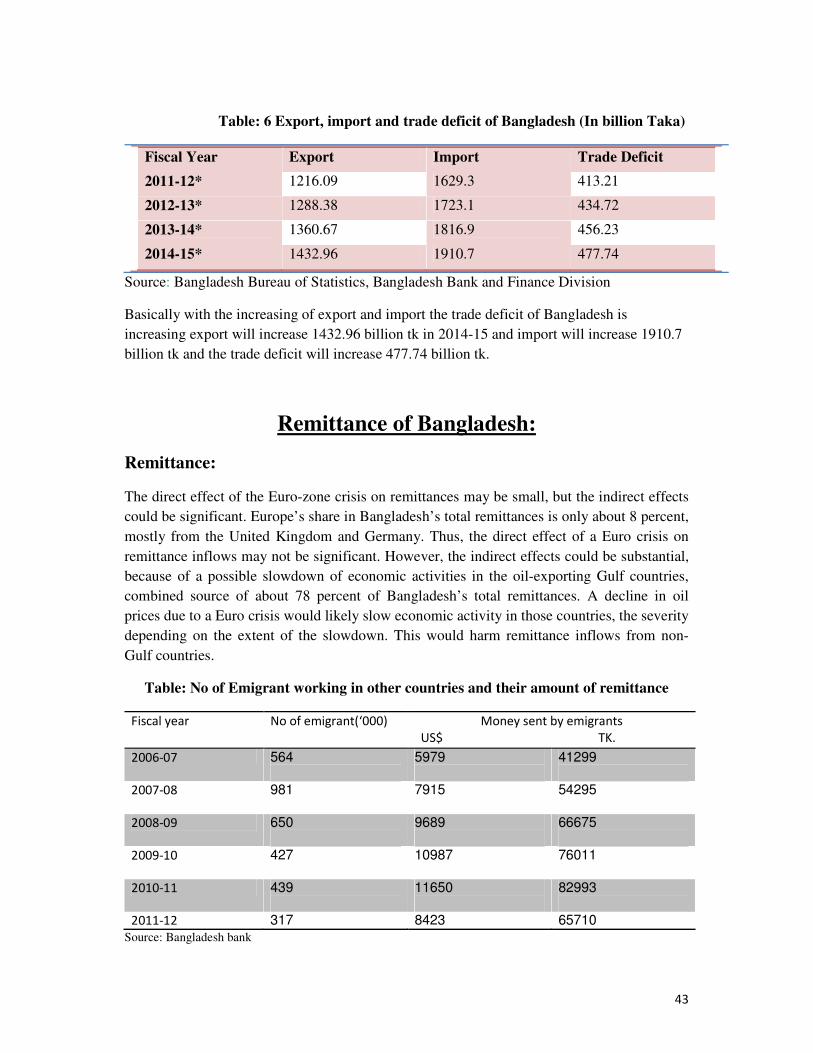
Structure of Imports (Based on LCs settled, July-October2012) (Source:
Bangladesh Bank}
Figure:30 Export, import and trade deficit of Bangladesh
Source : Bangladesh Bureau of Statistics, Bangladesh Bank and Finance Division
In FY 2010-11, the amount of export was Tk. 1143.8 billion and amount of import was Tk.
1535.5 billion, with trade deficit of Tk. 391.7 billion. However, in FY 2000-01, the amount of
export was Tk. 348.6 billion and amouUnder the business as usual scenario, if the current
trend continues, trade deficit in FY 2014-15 might be Tk. 477.74 billion while the import and
export might reach to Tk. 1,910.7 and 1,432.96 billion respectively. nt of import was Tk.
503.7 billion.
43
Table: 6 Export, import and trade deficit of Bangladesh (In billion Taka)
Fiscal Year Export Import Trade Deficit
2011-12* 1216.09 1629.3 413.21
2012-13* 1288.38 1723.1 434.72
2013-14* 1360.67 1816.9 456.23
2014-15* 1432.96 1910.7 477.74
Source: Bangladesh Bureau of Statistics, Bangladesh Bank and Finance Division
Basically with the increasing of export and import the trade deficit of Bangladesh is
increasing export will increase 1432.96 billion tk in 2014-15 and import will increase 1910.7
billion tk and the trade deficit will increase 477.74 billion tk.
Remittance of Bangladesh:
Remittance:
The direct effect of the Euro-zone crisis on remittances may be small, but the indirect effects
could be significant. Europe’s share in Bangladesh’s total remittances is only about 8 percent,
mostly from the United Kingdom and Germany. Thus, the direct effect of a Euro crisis on
remittance inflows may not be significant. However, the indirect effects could be substantial,
because of a possible slowdown of economic activities in the oil-exporting Gulf countries,
combined source of about 78 percent of Bangladesh’s total remittances. A decline in oil
prices due to a Euro crisis would likely slow economic activity in those countries, the severity
depending on the extent of the slowdown. This would harm remittance inflows from non-
Gulf countries.
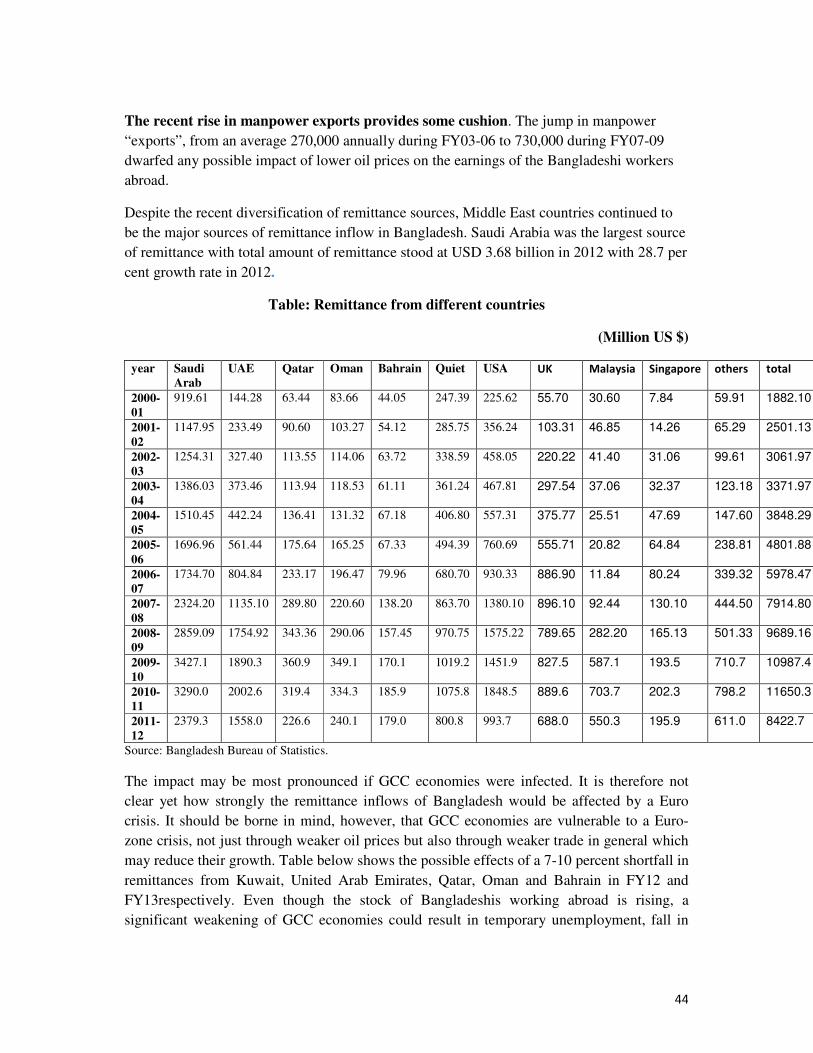
Table: No of Emigrant working in other countries and their amount of remittance
Fiscal year No of emigrant(‘000) Money sent by emigrants
US$ TK.
2006-07 564
5979
41299
2007-08 981
7915
54295
2008-09 650
9689
66675
2009-10 427
10987
76011
2010-11 439
11650
82993
2011-12 317 8423 65710
Source: Bangladesh bank
44
The recent rise in manpower exports provides some cushion. The jump in manpower
“exports”, from an average 270,000 annually during FY03-06 to 730,000 during FY07-09
dwarfed any possible impact of lower oil prices on the earnings of the Bangladeshi workers
abroad.
Despite the recent diversification of remittance sources, Middle East countries continued to
be the major sources of remittance inflow in Bangladesh. Saudi Arabia was the largest source
of remittance with total amount of remittance stood at USD 3.68 billion in 2012 with 28.7 per
cent growth rate in 2012.
Table: Remittance from different countries
(Million US $)
year Saudi Arab
UAE Qatar Oman Bahrain Quiet USA UK Malaysia Singapore others total
2000-01
919.61 144.28 63.44 83.66 44.05 247.39 225.62 55.70 30.60 7.84 59.91 1882.10
2001-02
1147.95 233.49 90.60 103.27 54.12 285.75 356.24 103.31 46.85 14.26 65.29 2501.13
2002-03
1254.31 327.40 113.55 114.06 63.72 338.59 458.05 220.22 41.40 31.06 99.61 3061.97
2003-04
1386.03 373.46 113.94 118.53 61.11 361.24 467.81 297.54 37.06 32.37 123.18 3371.97
2004-05
1510.45 442.24 136.41 131.32 67.18 406.80 557.31 375.77 25.51 47.69 147.60 3848.29
2005-06
1696.96 561.44 175.64 165.25 67.33 494.39 760.69 555.71 20.82 64.84 238.81 4801.88
2006-07
1734.70 804.84 233.17 196.47 79.96 680.70 930.33 886.90 11.84 80.24 339.32 5978.47
2007-08
2324.20 1135.10 289.80 220.60 138.20 863.70 1380.10 896.10 92.44 130.10 444.50 7914.80
2008-09
2859.09 1754.92 343.36 290.06 157.45 970.75 1575.22 789.65 282.20 165.13 501.33 9689.16
2009-10
3427.1 1890.3 360.9 349.1 170.1 1019.2 1451.9 827.5 587.1 193.5 710.7 10987.4
2010-11
3290.0 2002.6 319.4 334.3 185.9 1075.8 1848.5 889.6 703.7 202.3 798.2 11650.3
2011-12
2379.3 1558.0 226.6 240.1 179.0 800.8 993.7 688.0 550.3 195.9 611.0 8422.7
Source: Bangladesh Bureau of Statistics.
The impact may be most pronounced if GCC economies were infected. It is therefore not
clear yet how strongly the remittance inflows of Bangladesh would be affected by a Euro
crisis. It should be borne in mind, however, that GCC economies are vulnerable to a Euro-
zone crisis, not just through weaker oil prices but also through weaker trade in general which
may reduce their growth. Table below shows the possible effects of a 7-10 percent shortfall in
remittances from Kuwait, United Arab Emirates, Qatar, Oman and Bahrain in FY12 and
FY13respectively. Even though the stock of Bangladeshis working abroad is rising, a
significant weakening of GCC economies could result in temporary unemployment, fall in
45
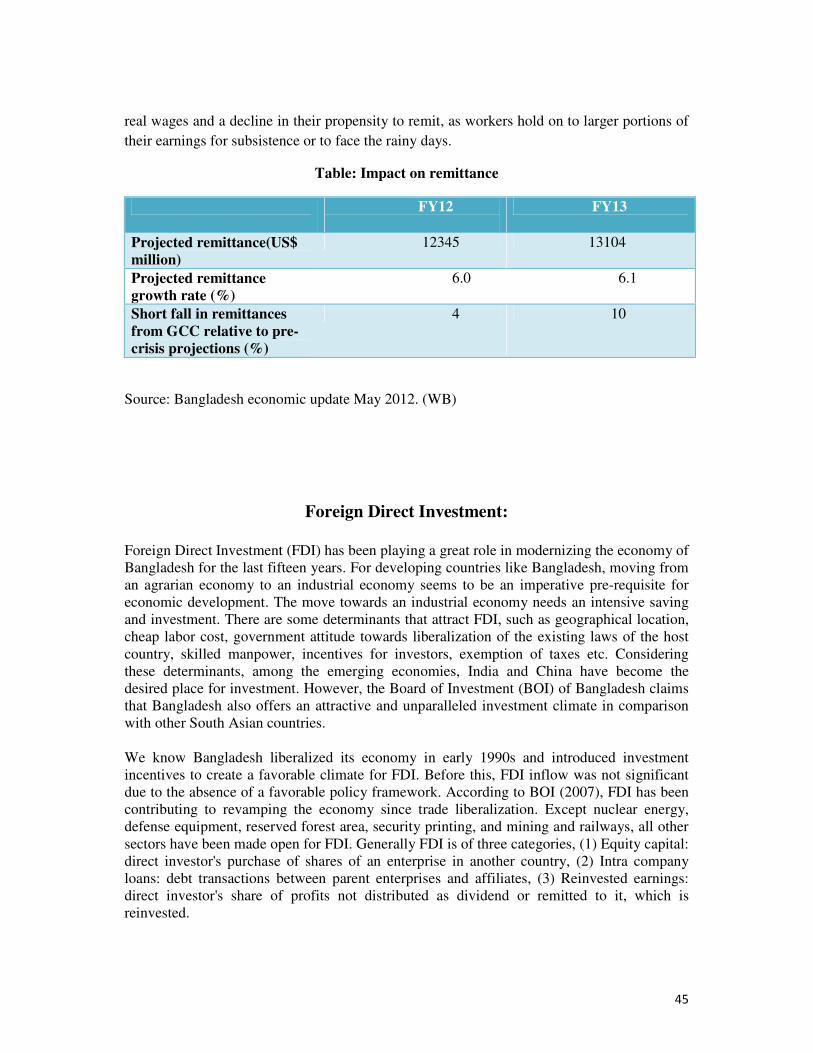
real wages and a decline in their propensity to remit, as workers hold on to larger portions of
their earnings for subsistence or to face the rainy days.
Table: Impact on remittance
FY12
FY13
Projected remittance(US$ million)
12345 13104
Projected remittance growth rate (%)
6.0 6.1
Short fall in remittances from GCC relative to pre-crisis projections (%)
4 10
Source: Bangladesh economic update May 2012. (WB)
Foreign Direct Investment:
Foreign Direct Investment (FDI) has been playing a great role in modernizing the economy of Bangladesh for the last fifteen years. For developing countries like Bangladesh, moving from an agrarian economy to an industrial economy seems to be an imperative pre-requisite for economic development. The move towards an industrial economy needs an intensive saving and investment. There are some determinants that attract FDI, such as geographical location, cheap labor cost, government attitude towards liberalization of the existing laws of the host country, skilled manpower, incentives for investors, exemption of taxes etc. Considering these determinants, among the emerging economies, India and China have become the desired place for investment. However, the Board of Investment (BOI) of Bangladesh claims that Bangladesh also offers an attractive and unparalleled investment climate in comparison with other South Asian countries.
We know Bangladesh liberalized its economy in early 1990s and introduced investment incentives to create a favorable climate for FDI. Before this, FDI inflow was not significant due to the absence of a favorable policy framework. According to BOI (2007), FDI has been contributing to revamping the economy since trade liberalization. Except nuclear energy, defense equipment, reserved forest area, security printing, and mining and railways, all other sectors have been made open for FDI. Generally FDI is of three categories, (1) Equity capital: direct investor's purchase of shares of an enterprise in another country, (2) Intra company loans: debt transactions between parent enterprises and affiliates, (3) Reinvested earnings: direct investor's share of profits not distributed as dividend or remitted to it, which is reinvested.
46
FDI inflow was not at an appreciable level until 2004. In 2002, the total FDI inflow was $ 328.3 million, in 2003 it was $ 350.2 million, and in 2004 it was $ 460.4 million. But in 2005, FDI inflow doubled ($ 854.3 million) compared to 2004. Bangladesh Investment Handbook (2007) stated that this was the second highest volume among South Asian economies. Then the economy experienced a slight downfall in FDI inflow in 2006 and 2007 -- $ 772.9 million and $ 666 million respectively due to political instability.
Inflows of foreign direct investment during 2005-2010 Sector-wise foreign and joint venture investment during 2010-2011.However, in 2008 the economy witnessed the highest ever inflow of $ 1,086 million, an 80% increase in comparison with 2007. In 2009, the economy experienced 35% inflow ($ 700 million) in comparison with 2008. In 2010, there was an increase of nearly $ 200 million, with a total of nearly $ 900 million in comparison with 2009 due mainly to significant increase in equity capital inflow. Besides we see that the inward FDI stock as percentage of Gross Domestic Product (GDP) has also been rising since trade liberalization, though we see a slight downfall in 2007 and 2008.
Although the cheap labor cost and geographical location attract foreign investors here, corruption, political instability, bureaucratic hassles and infrastructural insufficiencies are posing great barriers to FDI inflow.
It is high time for us to compete with other developing countries in attracting FDI since Vietnam, a comparable economy with ours in terms of size and macroeconomic indicators had a growth rate of 5.5% in 2009, which is below ours, but has FDI inflow of $ 4,500 million. Moreover Pakistan, that is assumed to be more vulnerable to political unrest, had a growth rate of only 3.7% in 2009 but has FDI inflow of $ 2,387 million.
FDI is a necessary indicator for our economic growth but is not sufficient. We have to keep in mind that we should be competitive to attract the investors, but in a way that does not affect our economy. The policy makers should be more vigilant in assessing how much investment we need to achieve the aspired GDP growth, how much investment we can make domestically and how much FDI is needed to fill the gap. Then, on the basis of our need, we should go for arranging the competitive investment climate in our country and promoting the country's comparative advantage.
Since the information on Bangladesh, its economic environment and its investment climate, is not available to many prospective foreign investors it should be presented to them so that they can match their demands and priorities with what Bangladesh offers. In that case, the Trade Commission and other actors in international relations should come forward to bridge the information and communication gap.
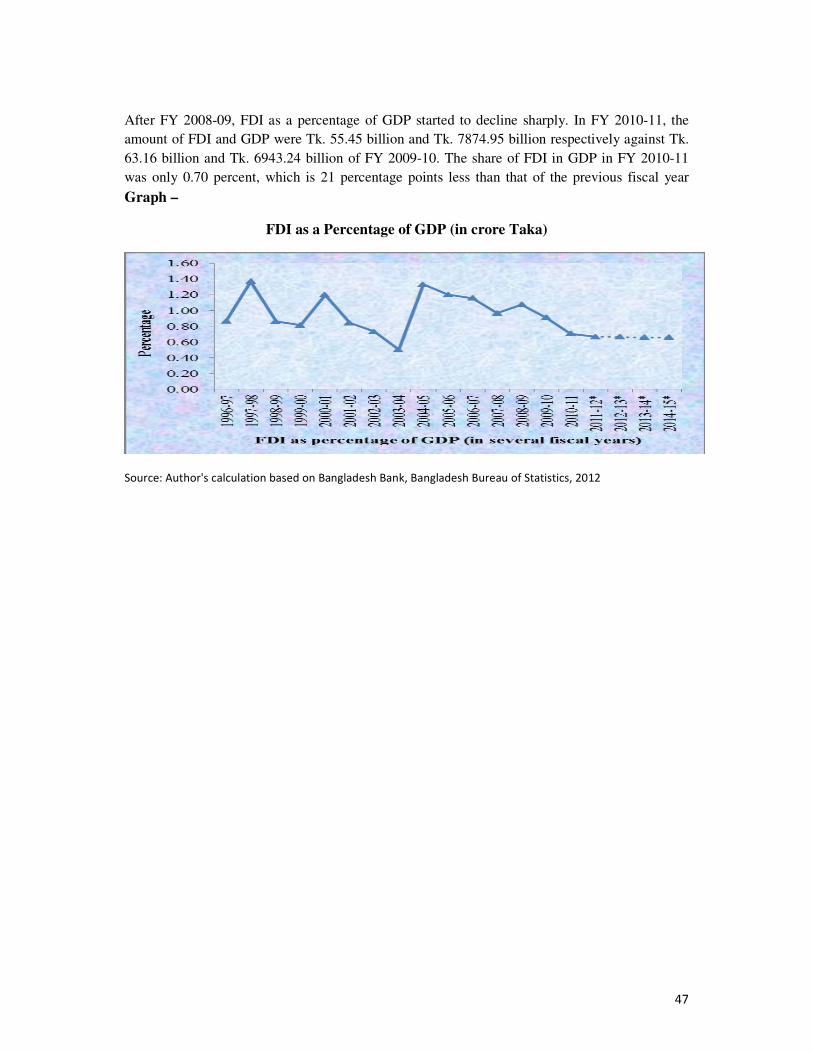
FDI AS A PERCENTAGE OF GDP Although the amount of FDI is increasing over the years, FDI as a percentage of GDP is following a declining trend after FY 2004-05. FDI as a percentage of GDP increased to 1.33 percent in FY 2004-05 while GDP and FDI flow were Tk. 3707.0 billion and Tk. 49.34 billion respectively. Then FDI as a percentage of GDP declined until FY 2007-08 and the scenario changed only in FY 2008-09. The growth of FDI in FY 2008-09 was 24.96 percent higher than that of previous fiscal year and FDI as percentage of GDP increased to 1.07 percent.
47
After FY 2008-09, FDI as a percentage of GDP started to decline sharply. In FY 2010-11, the
amount of FDI and GDP were Tk. 55.45 billion and Tk. 7874.95 billion respectively against Tk.
63.16 billion and Tk. 6943.24 billion of FY 2009-10. The share of FDI in GDP in FY 2010-11
was only 0.70 percent, which is 21 percentage points less than that of the previous fiscal year
Graph –
FDI as a Percentage of GDP (in crore Taka)
Source: Author's calculation based on Bangladesh Bank, Bangladesh Bureau of Statistics, 2012
48
Conclusion
Bangladesh has made some beginnings in converting the gains of macroeconomic
performance into sustained growth but she remains a poor, overpopulated, and inefficiently
governed nation. Although more than half of Gross Domestic Product (GDP) is generated
through the service sector, nearly two thirds of Bangladeshis are employed in the agriculture
sector, with rice as the single most important farm produce. Economic growth is supported by
garment exports and remittances from Bangladeshis working overseas. In 2008, Bangladesh
pursued a monetary policy aimed at maintaining high employment, but it also resulted in
higher inflation rate in the process. In 2008, the country grew at the rate of 4.9% with the per
capita income growth of $1500 US per annum (World Bank 2009).The National Economic
Council of Bangladesh has cleared the Sixth Five Year Plan involving Tk13.47 trillion. It has
been estimated that the gross domestic product (GDP) will grow at 7.3 percent and stand at
eight percent by the end of the plan. The present interim review of macroeconomic
performance of Bangladesh focuses particularly on the developments of the economy during
the first few months of FY2013. This analysis takes developments in FY2012 and targets set
for FY2013 by various policy documents as its benchmarks reviews the movements in major
macroeconomic indicators for the period for which latest data and information are available.
Simultaneously, the review also makes an attempt to project future direction of these
indicators as the economy moves towards the end ofFY2013 in the backdrop of current policy
stance of the government. The currently low tax-GDP ratio has to be increased to support
higher public social spending and to increase the contribution of the government's fiscal
operations to domestic savings .At the same time, serious concerns regarding the quality of
public development spending need to be addressed. Financial sector reforms must be
strengthened in order to reduce the cost of financial intermediation and to reduce resource
wastage, such as through large-scale loan default. More generally, institutional reforms must
address the whole range of factors adversely affecting investment incentives and production
efficiency. The need for this is all the more urgent as Bangladesh faces the risk of a slow
down in export growth because of post-MFA competition in the global readymade garment
market. For more than one reason, Bangladesh's economic growth prospects crucially depend
on sustaining high export growth - through the continued of exports, and through export
diversification as well.
49
References
Websites
www.tradingeconomics.com/bangladesh/gdp-growth (asses’ data on 28th
February 2013 at 10 pm)
www.unnayan.org/reports/beu_July_10.pdf (asses’ data on 28th February 2013
at 10 pm)
www.tradingeconomics.com/bangladesh/gdp-growth-annual/. (asses’ data on
4th March 2013 at 8 pm)
http: //bangladesheconomy.wordpress.com/category/economic-
growthgdpexports-and-foreign-trade/.( asses data on 4th March 2013 at 8 pm)
www.mof.gov.bd/en/budget/rw/real_sector.pdf-... (Asses’data on 4th March
2013 at 8 pm)
http://www.defence.pk/forums/bangladesh-defence/241882-bangladesh-gdp-
grow-6-8-fiscal-3.html7 posts -( 24 Mar 2013)
www.bdresearch.org.bd/home/attachments/.../meu_Nov_2010.pdf (asses’ data
on 5 march 2o13 at 7 am)
www.tradingeconomics.com/bangladesh/gross-national-product (asses’ data on
5th march 2013 at 10 am)
www.boi.gov.bd/index.php/about-bangladesh/bangladesh-at-a-glance (asses’
data on 5th march 2013 at 10 am)
http://www.thefinancialexpress-bd.com/more.php?date=2012-06-
08&news_id=132185 (asses’ data on 11 march 2013 at 9 pm)
http://www.tradingeconomics.com/bangladesh/inflation-cpi (asses’ data on 12th
march 2013 at 7 pm)
www.indexmundi.com › ... › Countries › Bangladesh › Economy (asses’ data on
12th march 3013 at 8 am)
50
www.bdresearch.org.bd/home/attachments/.../meu_Jan-Feb_2011.pd...(asses’
data on 12th march 2013 at 10am)
www.tradingeconomics.com/bangladesh/foreign-exchange-reserves (asses’ data
on 12th march 2013 at 3 pm)
mercury.ethz.ch/service engine/Files/ISN/106180/.../en/84.pdf (asses’ data on
12th march 2013 at 7 pm)
tdrju.net/index.php/tdr/article/view/7/23 (asses’ data on 12th march 2013 at 9
pm)
www.economywatch.com › Asia Economy › Bangladesh Economy (asses’ data
on 12th march 2013 at 11pm)
www.tradingeconomics.com/bangladesh/exports (asses’ data on 15th march
2013 at 11pm)