capabilities and levels of supply chain integration in malaysian smes: a preliminary analysis
TRANSCRIPT
University of WollongongResearch Online
SBS HDR Student Conference 2010
Oct 1st, 2:30 PM - 3:00 PM
Capabilities and Levels of Supply Chain Integrationin Malaysian SMEs: A Preliminary AnalysisSiti Nur Atikah ZulkiffliUniversity of Wollongong
Follow this and additional works at: http://ro.uow.edu.au/sbshdr
Research Online is the open access institutional repository for the University of Wollongong. For further information contact the UOW Library:[email protected]
Siti Nur Atikah Zulkiffli, "Capabilities and Levels of Supply Chain Integration in Malaysian SMEs: A Preliminary Analysis" (October 1,2010). SBS HDR Student Conference. Paper 5.http://ro.uow.edu.au/sbshdr/2010/papers/5
DescriptionThe purpose of this study is to analyse a preliminary data through the descriptive statistics, exploratory factoranalysis (EFA), and reliability test. The analysis is based on a quantitative approach using a questionnairesurvey from a total of 135 Malaysian SMEs’ manufacturing companies. This analysis reveals a good result ofEFA, and reliability test. The most critical limitation of this study is its narrow focused on the manufacturingsector in Malaysian SMEs, thus, preventing the generalisation to other sectors and also to other countries thatmay gain the benefits from the responsiveness of both capabilities and levels of supply chain integration. Also,this study may contribute to the body of knowledge by providing new data and empirical insights into therelationship between CCC, SCOC, levels of supply chain integration, and business performance in MalaysianSMEs.
LocationiC - SBS Teaching Facility
This event is available at Research Online: http://ro.uow.edu.au/sbshdr/2010/papers/5
- 1 -
Capabilities and Levels of Supply Chain Integration in Malaysian
SMEs: A Preliminary Analysis
Siti Nur `Atikah Zulkiffli
Sydney Business School, University of Wollongong, Australia
Email: [email protected]
Abstract The purpose of this study is to analyse a preliminary data through the descriptive statistics, exploratory factor analysis (EFA), and reliability test. The analysis is based on a quantitative approach using a questionnaire survey from a total of 135 Malaysian SMEs’ manufacturing companies. This analysis reveals a good result of EFA, and reliability test. The most critical limitation of this study is its narrow focused on the manufacturing sector in Malaysian SMEs, thus, preventing the generalisation to other sectors and also to other countries that may gain the benefits from the responsiveness of both capabilities and levels of supply chain integration. Also, this study may contribute to the body of knowledge by providing new data and empirical insights into the relationship between CCC, SCOC, levels of supply chain integration, and business performance in Malaysian SMEs.
1. INTRODUCTION
This research discusses four major constructs that might be significant to Malaysian SMEs. The constructs are corporate competitive capabilities (CCC), supply chain operational capabilities (SCOC), levels of supply chain integration, and business performance.
In this study, CCC can be referred as the distinctive competence of firms’ specific abilities. Therefore, firms must recognise their abilities in order to compete effectively in domestics and international market. Then, according to SCOC, it discusses the pattern of decision that relates to the supply chain activities. These include the inside or outside operations activities of a firm, such as sourcing products, demand management, and delivery. This study also considers levels of supply chain integration as an intervening variable. It unites between the domain of CCC and SCOC with business performance. Successful SMEs in Malaysia may require the internal and external function to be integrated into any key of supply chain process that may lead to improve business performance. Finally, business performance of this study refers to the functioning of firms as a result to the execution of several constructs which are CCC, SCOC, and levels of supply chain integration in the manufacturing sector of Malaysian SMEs.
To further analyse the data, this study considers the research question, which is “To what extent attributes of corporate competitive capabilities and supply chain operational capabilities (including levels of supply chain integration) influence the SMEs business performance in the Malaysian manufacturing industry?” However, the current discussion focuses to answer the preliminary result to confirm the feelings of the data through three statistical analyses including descriptive statistics.
- 2 -
The data for this research was provided via a paper-based mail questionnaire. Each of the returned questionnaires was thus manually checked, entered, and analysed through the SPSS software version 17. There were three major steps of analysis preparation. First, the process began with the raw data which was obtained from returned questionnaire. The data was edited, coded, and entered into the actual variables of interest in the data file. Second, the variables were checked through several basic procedures such as screening and cleaning the data, missing data, assessing normality, and checking for the outliers. Finally, the data was analysed for respondents’ characteristics via descriptive statistics, exploratory factor analysis, and reliability test to obtain more meaningful and reliable data.
2. DESCRIPTIVE STATISTICS
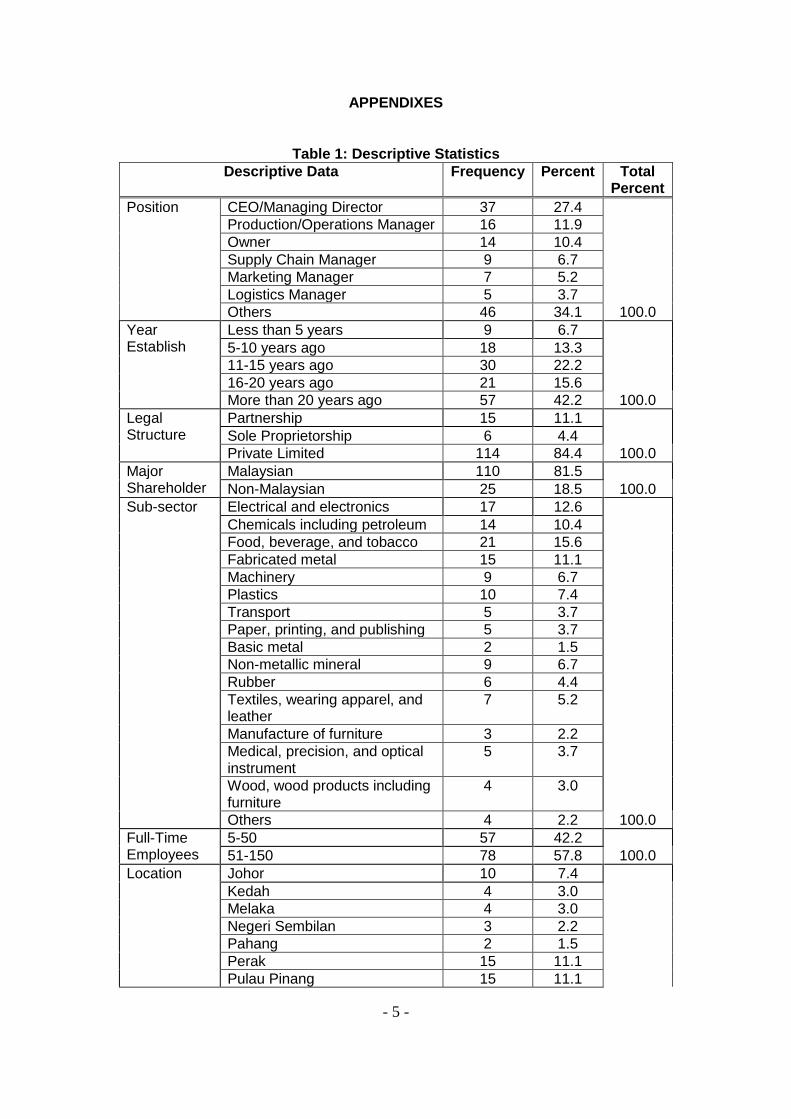
In this study, the descriptive data is derived from Part A of the questionnaire which consists of 16 questions. From the analysis, those questions could be divided into 14 relevant components. Table 1 shows the descriptive data of the study (please see the appendix).
3. EXPLORATORY FACTOR ANALYSIS
Exploratory factor analysis (EFA) is conducted as a validity test for the measurements. Indeed, it is also to validate data for both manifest dependent and independent variables. Besides, it assesses of any possible data reduction and produce result summarisation (Hair et al., 2010). Thus, this study used the Principal Component Analysis (PCA) with Varimax rotation. The next sub-sections discuss the analysis of PCA into four constructs which are corporate competitive capabilities, supply chain operational capabilities, levels of supply chain integration, and business performance. These constructs cover Part B, Part C, Part D, and Part E of the questionnaire.
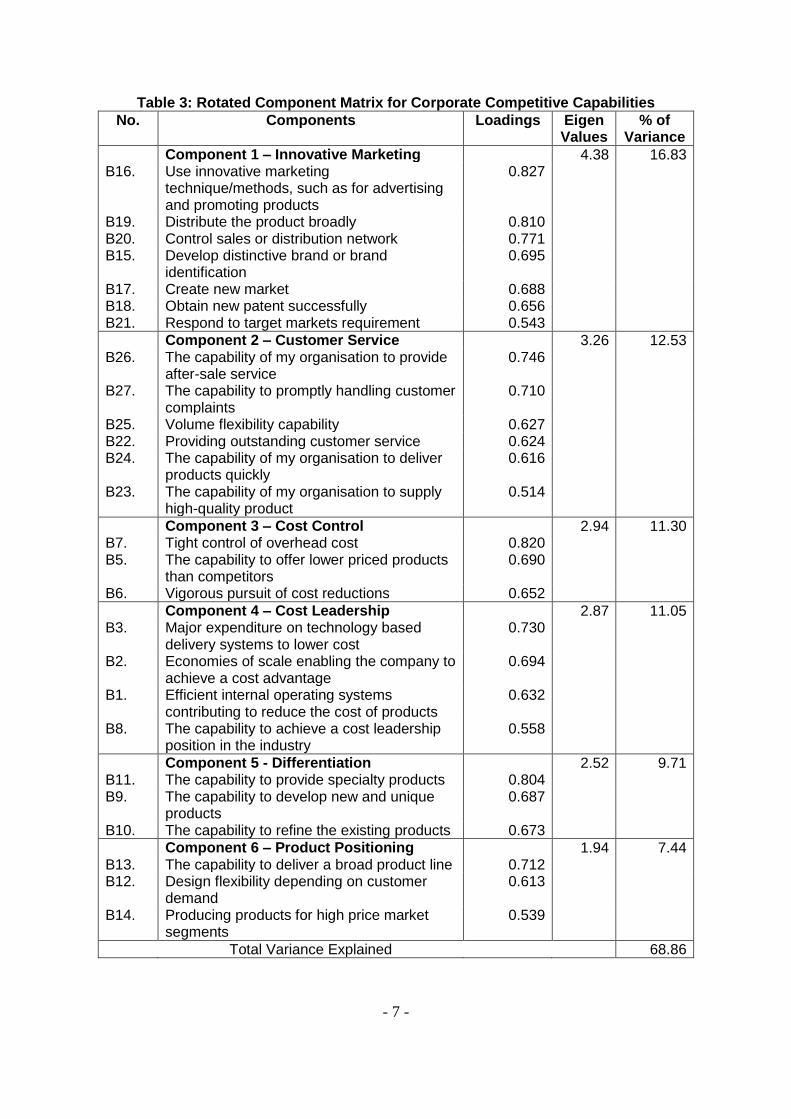
3.1 EFA for Corporate Competitive Capabilities (CCC)
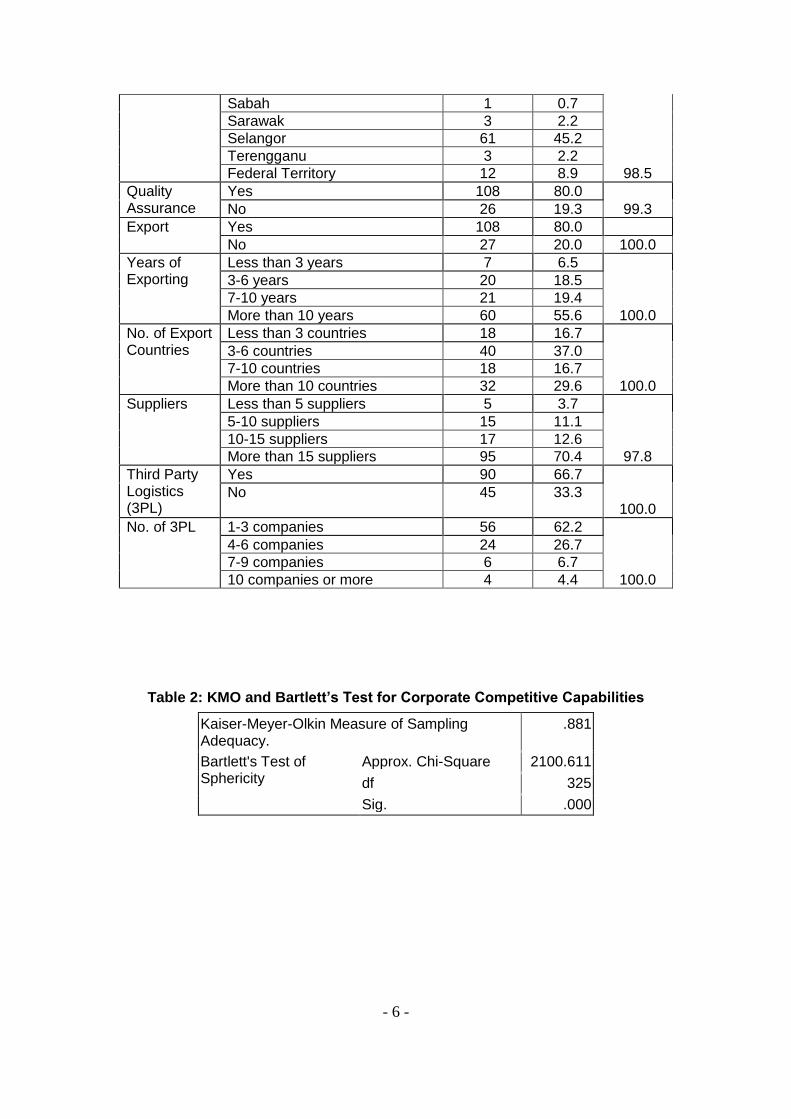
A principal component analysis (PCA) was conducted on 27 variables. After analysis, these variables were reduced to 26 explanatory variables of six components. The components are: (i) innovative marketing, (ii) customer service, (iii) cost control, (iv) cost leadership, (v) differentiation, and (vi) product positioning. These six components identified empirically are similar to the four components that have been mentioned in previous studies (Kim, 2006b; Kim, 2006a; Watts et al., 1992), with additional in two new components. Thus, Table 2 shows the KMO and Bartlett’s Test result of CCC, and Table 3 shows the rotated component matrix for CCC (please see the appendix).
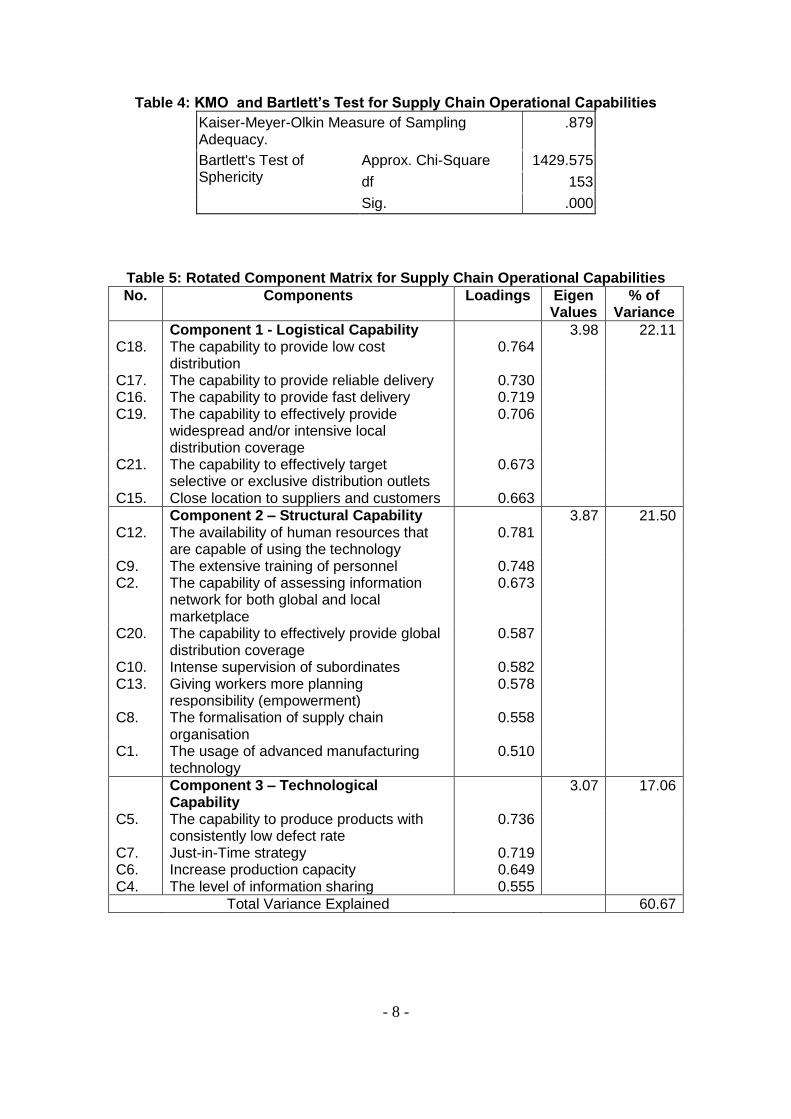
3.2 EFA for Supply Chain Operational Capabilities (SCOC)
A principal component analysis (PCA) was also conducted on 21 variables to measure the supply chain operational capabilities (SCOC). Then, these variables were reduced to 18 that reflect to three components. The components are consistent with the previous studies (Tan et al., 2007; Narasimhan et al., 2005), which are: logistical capability, structural capability, and technological capability. Table 4 depicts
- 3 -
the KMO and Bartlett’s Test result, and Table 5 depicts the rotated component matrix of SCOC (please see the appendix).
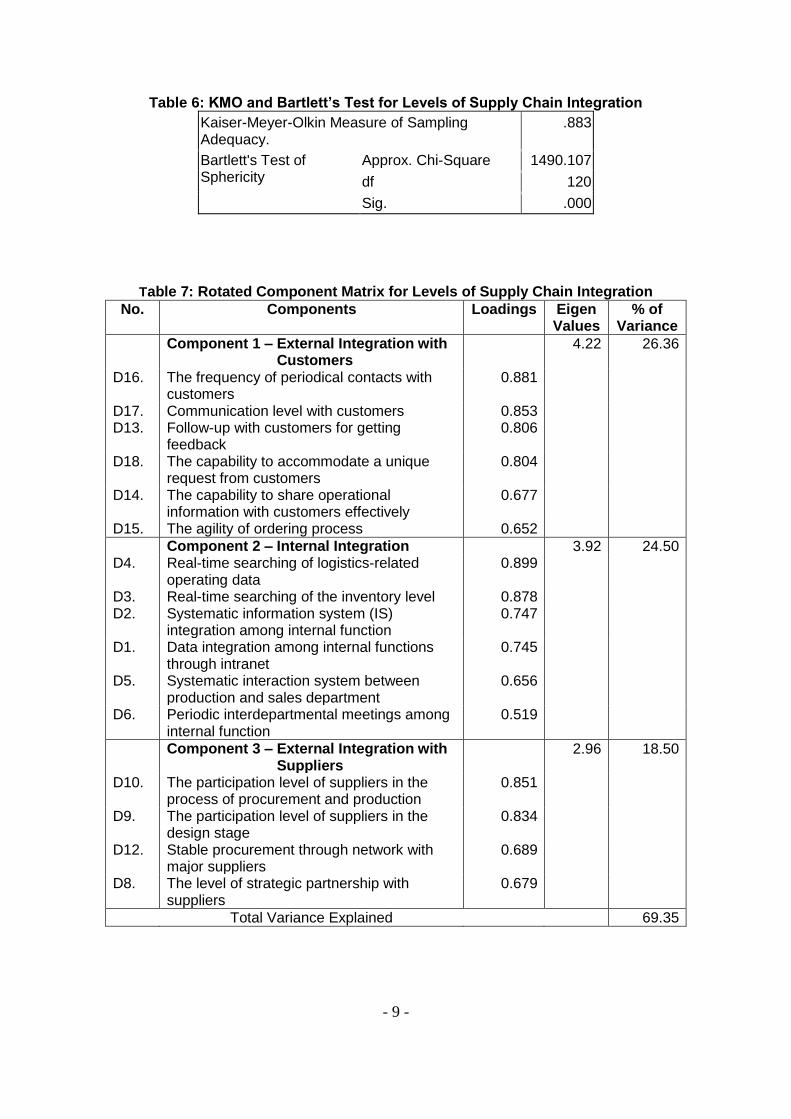
3.3 EFA for Levels of Supply Chain Integration
A principal component analysis (PCA) was conducted on 19 variables to measure levels of supply chain integration. After the analysis, these variables were reduced to 16 explanatory variables that reflect to three components, which are: (i) external integration with customer, (ii) internal integration, and (iii) external integration with suppliers. These components are consistent with the previous studies (Kim, 2006a; Narasimhan and Kim, 2002). Thus, Table 6 shows the KMO and Bartlett’s Test result, and Table 7 shows the rotated component matrix for levels of supply chain integration (please see the appendix).
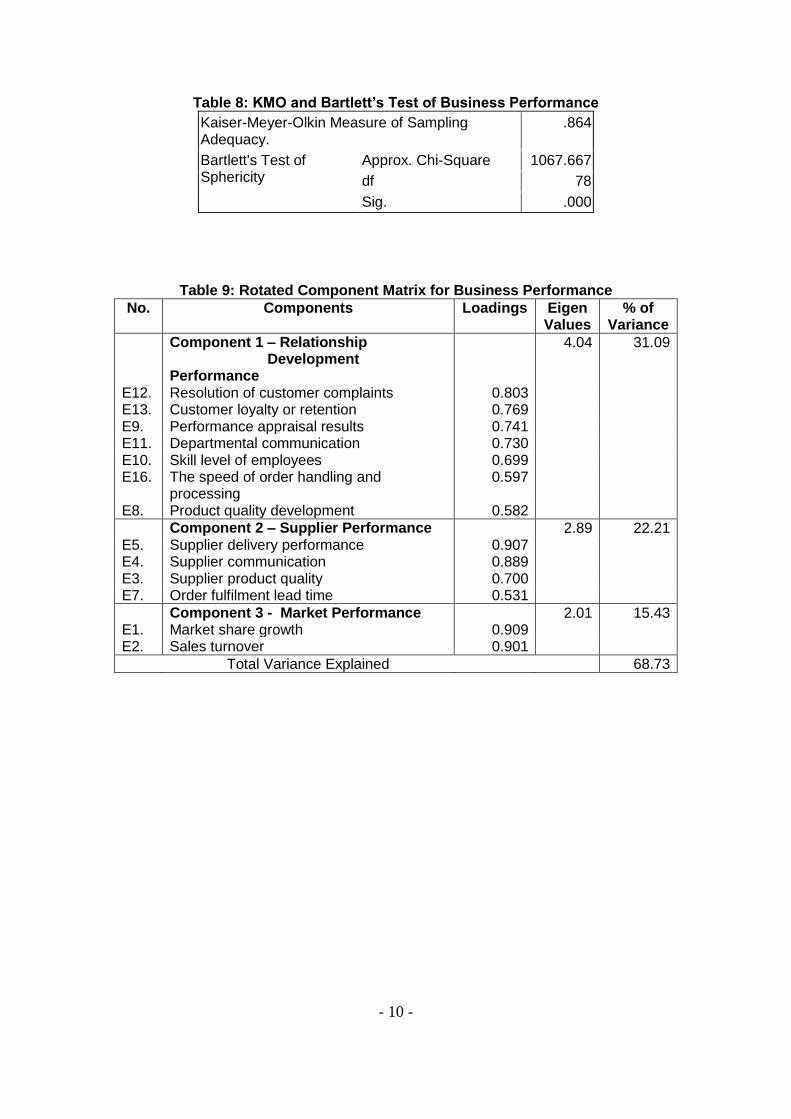
3.4 EFA for Business Performance
A principal component analysis (PCA) was conducted on 16 variables to measure the business performance for Malaysian SMEs. Then, these variables were reduced to 13 and reflect to three components. The components are: (i) relationship development performance, (ii) supplier performance, and (iii) market performance. Thus, Table 8 shows the KMO and Bartlett’s Test result, and Table 9 shows the rotated component matrix for business performance (please see the appendix).
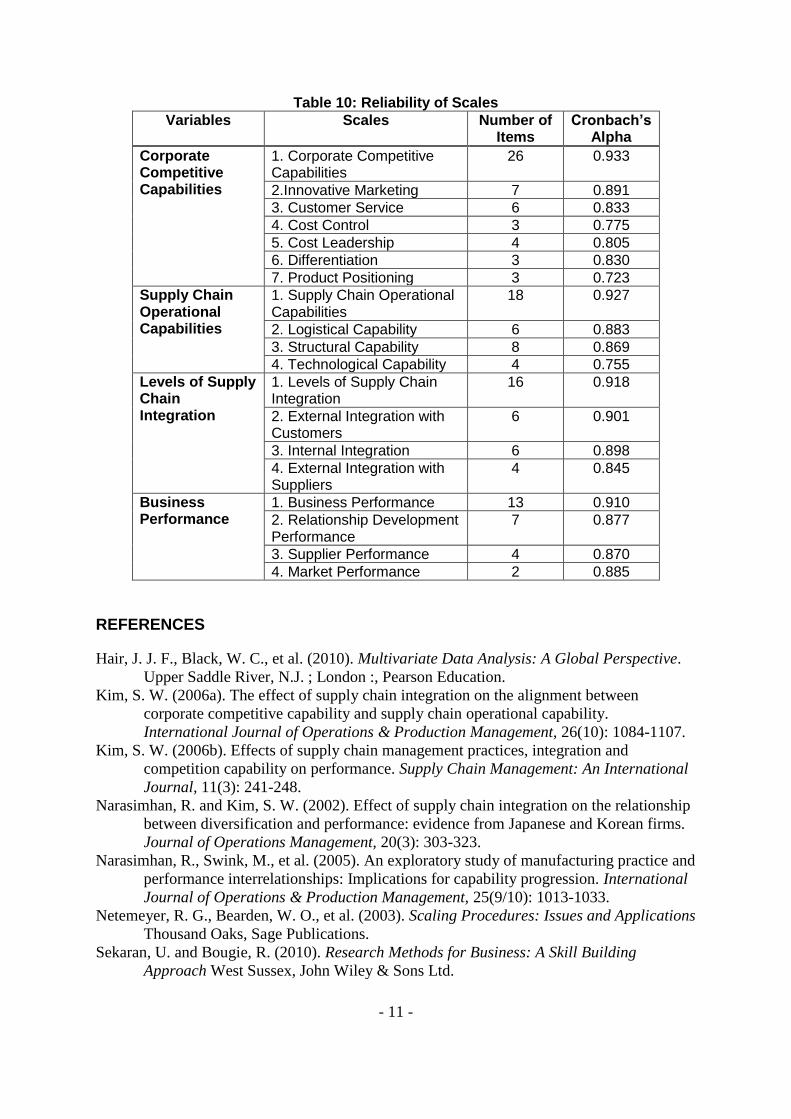
4. RELIABILITY
The purpose of reliability test is to measure the stability and consistency of the variables (Sekaran and Bougie, 2010). This study analyses reliability through a cronbach’s coefficient alpha on four constructs; (i) corporate competitive capabilities, (ii) supply chain operational capabilities, (iii) levels of supply chain integration, and (iv) business performance.
The reliability of most constructs fall within the acceptable ranges (0.70 to 0.90). However, most of the construct are quite high given that the variables were collected from previous studies and were tested for several times. Indeed, the research obtains high reliability as it might be affected by a large number of variables, and regardless the value of its inter-item correlation (Netemeyer et al., 2003). Besides, the reliability is high as each construct was formerly analysed through EFA.
Table 10 depicts the reliability test result of the study as in the appendix.
5. DISCUSSION
The analysis began with the test of descriptive data. According to the descriptive analysis, it reveals that the major contributor for this study is Medium Enterprises. Also, it reveals that majority of the SMEs under study is owned by Malaysian. Thus, it proves that Malaysians are capable to involve in the manufacturing industry, and then, to develop a firm and stable company.
- 4 -
Furthermore, the result of exploratory factor analysis (EFA) contributes a new knowledge for the study particularly for CCC and business performance. According to CCC, two new components are introduced which are: cost control and product positioning. Meanwhile, there are three major components that describe business performance, which are: (i) relationship development performance, (ii) supplier performance, and (iii) market performance.
Then, the Kaiser-Meyer-Olkin (KMO) result for all the constructs are more than 0.80 which indicates that variables are good and appropriate to be analysed under EFA. Indeed, the p-value for all the constructs are 0.000 (p=0.000), which are highly significant and indicates the correlation between items are sufficiently large for principal component analysis (PCA).
Finally, all constructs show a good reliability result which falls within the acceptable ranges (0.70 to 0.90). According to the data, product positioning shows the lowest cronbach’s alpha value (0.723) and external integration with customers shows the highest cronbach’s alpha value (0.901). There are several factors contribute to the reliability value, such as; the number of variables for each construct, variables are obtained from previous studies, and variables have been tested for several times.
6. FURTHER RECOMMENDATION AND CONCLUSION
This study proposed the further analysis through a structural equation modelling (SEM) to answer the primary research question, “To what extent attributes of corporate competitive capabilities and supply chain operational capabilities (including levels of supply chain integration) influence SMEs business performance in the Malaysian manufacturing industry?” Besides, the further analysis is proposed to test all six major hypotheses of the study.
An SEM will be analysing using Analysis of Moment Structures (AMOS) software version 17. At first, an SEM will be used to test a confirmatory factor analysis (CFA) to measure the variables before proceed with a full structural model of SEM analysis. The full structural model of SEM analysis is conducted to test the significance effects for all the hypotheses under study.
Moreover, the future study is recommended to cover other SMEs sector in Malaysia such as service sector, in order to improve the entire SMEs development in Malaysia. Also, it should be acknowledged that this study is subject to some limitations. In this issue, the most critical limitation of this study is the narrow focus on the manufacturing sector of Malaysian SMEs. Thus, the lack of the generalisation of findings to other sectors (e.g., service industry) and to any developing countries may inhibit to the richness of the findings.
In conclusion, this study is significance to Malaysian SMEs as it will contribute to the development of new approach and at the same time, it will improve the efficiency of SMEs in Malaysia.
- 5 -
APPENDIXES
Table 1: Descriptive Statistics
Descriptive Data Frequency Percent Total Percent
Position CEO/Managing Director 37 27.4
Production/Operations Manager 16 11.9
Owner 14 10.4
Supply Chain Manager 9 6.7
Marketing Manager 7 5.2
Logistics Manager 5 3.7
Others 46 34.1 100.0
Year Establish
Less than 5 years 9 6.7
5-10 years ago 18 13.3
11-15 years ago 30 22.2
16-20 years ago 21 15.6
More than 20 years ago 57 42.2 100.0
Legal Structure
Partnership 15 11.1
Sole Proprietorship 6 4.4
Private Limited 114 84.4 100.0
Major Shareholder
Malaysian 110 81.5
Non-Malaysian 25 18.5 100.0
Sub-sector Electrical and electronics 17 12.6
Chemicals including petroleum 14 10.4
Food, beverage, and tobacco 21 15.6
Fabricated metal 15 11.1
Machinery 9 6.7
Plastics 10 7.4
Transport 5 3.7
Paper, printing, and publishing 5 3.7
Basic metal 2 1.5
Non-metallic mineral 9 6.7
Rubber 6 4.4
Textiles, wearing apparel, and leather
7 5.2
Manufacture of furniture 3 2.2
Medical, precision, and optical instrument
5 3.7
Wood, wood products including furniture
4 3.0
Others 4 2.2 100.0
Full-Time Employees
5-50 57 42.2
51-150 78 57.8 100.0
Location Johor 10 7.4
Kedah 4 3.0
Melaka 4 3.0
Negeri Sembilan 3 2.2
Pahang 2 1.5
Perak 15 11.1
Pulau Pinang 15 11.1
- 6 -
Sabah 1 0.7
Sarawak 3 2.2
Selangor 61 45.2
Terengganu 3 2.2
Federal Territory 12 8.9 98.5
Quality Assurance
Yes 108 80.0
No 26 19.3 99.3
Export Yes 108 80.0
No 27 20.0 100.0
Years of Exporting
Less than 3 years 7 6.5
3-6 years 20 18.5
7-10 years 21 19.4
More than 10 years 60 55.6 100.0
No. of Export Countries
Less than 3 countries 18 16.7
3-6 countries 40 37.0
7-10 countries 18 16.7
More than 10 countries 32 29.6 100.0
Suppliers Less than 5 suppliers 5 3.7
5-10 suppliers 15 11.1
10-15 suppliers 17 12.6
More than 15 suppliers 95 70.4 97.8
Third Party Logistics (3PL)
Yes 90 66.7
No 45 33.3 100.0
No. of 3PL 1-3 companies 56 62.2
4-6 companies 24 26.7
7-9 companies 6 6.7
10 companies or more 4 4.4 100.0
Table 2: KMO and Bartlett’s Test for Corporate Competitive Capabilities
Kaiser-Meyer-Olkin Measure of Sampling Adequacy.
.881
Bartlett's Test of Sphericity
Approx. Chi-Square 2100.611
df 325
Sig. .000
- 7 -
Table 3: Rotated Component Matrix for Corporate Competitive Capabilities
No. Components Loadings Eigen Values
% of Variance
Component 1 – Innovative Marketing 4.38 16.83 B16. Use innovative marketing
technique/methods, such as for advertising and promoting products
0.827
B19. Distribute the product broadly 0.810 B20. Control sales or distribution network 0.771 B15. Develop distinctive brand or brand
identification 0.695
B17. Create new market 0.688 B18. Obtain new patent successfully 0.656 B21. Respond to target markets requirement 0.543
Component 2 – Customer Service 3.26 12.53 B26. The capability of my organisation to provide
after-sale service 0.746
B27. The capability to promptly handling customer complaints
0.710
B25. Volume flexibility capability 0.627 B22. Providing outstanding customer service 0.624 B24. The capability of my organisation to deliver
products quickly 0.616
B23. The capability of my organisation to supply high-quality product
0.514
Component 3 – Cost Control 2.94 11.30 B7. Tight control of overhead cost 0.820 B5. The capability to offer lower priced products
than competitors 0.690
B6. Vigorous pursuit of cost reductions 0.652
Component 4 – Cost Leadership 2.87 11.05 B3. Major expenditure on technology based
delivery systems to lower cost 0.730
B2. Economies of scale enabling the company to achieve a cost advantage
0.694
B1. Efficient internal operating systems contributing to reduce the cost of products
0.632
B8. The capability to achieve a cost leadership position in the industry
0.558
Component 5 - Differentiation 2.52 9.71 B11. The capability to provide specialty products 0.804 B9. The capability to develop new and unique
products 0.687
B10. The capability to refine the existing products 0.673
Component 6 – Product Positioning 1.94 7.44 B13. The capability to deliver a broad product line 0.712 B12. Design flexibility depending on customer
demand 0.613
B14. Producing products for high price market segments
0.539
Total Variance Explained 68.86
- 8 -
Table 4: KMO and Bartlett’s Test for Supply Chain Operational Capabilities
Kaiser-Meyer-Olkin Measure of Sampling Adequacy.
.879
Bartlett's Test of Sphericity
Approx. Chi-Square 1429.575
df 153
Sig. .000
Table 5: Rotated Component Matrix for Supply Chain Operational Capabilities
No. Components Loadings Eigen Values
% of Variance
Component 1 - Logistical Capability 3.98 22.11 C18. The capability to provide low cost
distribution 0.764
C17. The capability to provide reliable delivery 0.730 C16. The capability to provide fast delivery 0.719 C19. The capability to effectively provide
widespread and/or intensive local distribution coverage
0.706
C21. The capability to effectively target selective or exclusive distribution outlets
0.673
C15. Close location to suppliers and customers 0.663
Component 2 – Structural Capability 3.87 21.50 C12. The availability of human resources that
are capable of using the technology 0.781
C9. The extensive training of personnel 0.748 C2. The capability of assessing information
network for both global and local marketplace
0.673
C20. The capability to effectively provide global distribution coverage
0.587
C10. Intense supervision of subordinates 0.582 C13. Giving workers more planning
responsibility (empowerment) 0.578
C8. The formalisation of supply chain organisation
0.558
C1. The usage of advanced manufacturing technology
0.510
Component 3 – Technological Capability
3.07 17.06
C5. The capability to produce products with consistently low defect rate
0.736
C7. Just-in-Time strategy 0.719 C6. Increase production capacity 0.649 C4. The level of information sharing 0.555
Total Variance Explained 60.67
- 9 -
Table 6: KMO and Bartlett’s Test for Levels of Supply Chain Integration
Kaiser-Meyer-Olkin Measure of Sampling Adequacy.
.883
Bartlett's Test of Sphericity
Approx. Chi-Square 1490.107
df 120
Sig. .000
Table 7: Rotated Component Matrix for Levels of Supply Chain Integration
No. Components Loadings Eigen Values
% of Variance
Component 1 – External Integration with Customers
4.22 26.36
D16. The frequency of periodical contacts with customers
0.881
D17. Communication level with customers 0.853 D13. Follow-up with customers for getting
feedback 0.806
D18. The capability to accommodate a unique request from customers
0.804
D14. The capability to share operational information with customers effectively
0.677
D15. The agility of ordering process 0.652
Component 2 – Internal Integration 3.92 24.50 D4. Real-time searching of logistics-related
operating data 0.899
D3. Real-time searching of the inventory level 0.878 D2. Systematic information system (IS)
integration among internal function 0.747
D1. Data integration among internal functions through intranet
0.745
D5. Systematic interaction system between production and sales department
0.656
D6. Periodic interdepartmental meetings among internal function
0.519
Component 3 – External Integration with Suppliers
2.96 18.50
D10. The participation level of suppliers in the process of procurement and production
0.851
D9. The participation level of suppliers in the design stage
0.834
D12. Stable procurement through network with major suppliers
0.689
D8. The level of strategic partnership with suppliers
0.679
Total Variance Explained 69.35
- 10 -
Table 8: KMO and Bartlett’s Test of Business Performance
Kaiser-Meyer-Olkin Measure of Sampling Adequacy.
.864
Bartlett's Test of Sphericity
Approx. Chi-Square 1067.667
df 78
Sig. .000
Table 9: Rotated Component Matrix for Business Performance
No. Components Loadings Eigen Values
% of Variance
Component 1 – Relationship Development Performance
4.04 31.09
E12. Resolution of customer complaints 0.803 E13. Customer loyalty or retention 0.769 E9. Performance appraisal results 0.741 E11. Departmental communication 0.730 E10. Skill level of employees 0.699 E16. The speed of order handling and
processing 0.597
E8. Product quality development 0.582
Component 2 – Supplier Performance 2.89 22.21 E5. Supplier delivery performance 0.907 E4. Supplier communication 0.889 E3. Supplier product quality 0.700 E7. Order fulfilment lead time 0.531
Component 3 - Market Performance 2.01 15.43 E1. Market share growth 0.909 E2. Sales turnover 0.901
Total Variance Explained 68.73
- 11 -
Table 10: Reliability of Scales
Variables Scales Number of Items
Cronbach’s Alpha
Corporate Competitive Capabilities
1. Corporate Competitive Capabilities
26 0.933
2.Innovative Marketing 7 0.891
3. Customer Service 6 0.833
4. Cost Control 3 0.775
5. Cost Leadership 4 0.805
6. Differentiation 3 0.830
7. Product Positioning 3 0.723
Supply Chain Operational Capabilities
1. Supply Chain Operational Capabilities
18 0.927
2. Logistical Capability 6 0.883
3. Structural Capability 8 0.869
4. Technological Capability 4 0.755
Levels of Supply Chain Integration
1. Levels of Supply Chain Integration
16 0.918
2. External Integration with Customers
6 0.901
3. Internal Integration 6 0.898
4. External Integration with Suppliers
4 0.845
Business Performance
1. Business Performance 13 0.910
2. Relationship Development Performance
7 0.877
3. Supplier Performance 4 0.870
4. Market Performance 2 0.885
REFERENCES
Hair, J. J. F., Black, W. C., et al. (2010). Multivariate Data Analysis: A Global Perspective.
Upper Saddle River, N.J. ; London :, Pearson Education.
Kim, S. W. (2006a). The effect of supply chain integration on the alignment between
corporate competitive capability and supply chain operational capability.
International Journal of Operations & Production Management, 26(10): 1084-1107.
Kim, S. W. (2006b). Effects of supply chain management practices, integration and
competition capability on performance. Supply Chain Management: An International
Journal, 11(3): 241-248.
Narasimhan, R. and Kim, S. W. (2002). Effect of supply chain integration on the relationship
between diversification and performance: evidence from Japanese and Korean firms.
Journal of Operations Management, 20(3): 303-323.
Narasimhan, R., Swink, M., et al. (2005). An exploratory study of manufacturing practice and
performance interrelationships: Implications for capability progression. International
Journal of Operations & Production Management, 25(9/10): 1013-1033.
Netemeyer, R. G., Bearden, W. O., et al. (2003). Scaling Procedures: Issues and Applications
Thousand Oaks, Sage Publications.
Sekaran, U. and Bougie, R. (2010). Research Methods for Business: A Skill Building
Approach West Sussex, John Wiley & Sons Ltd.
- 12 -
Tan, K. C., Kannan, V. R., et al. (2007). The impact of operations capability on firm
performance. International Journal of Production Research, 45(21): 5135.
Watts, C. A., Kee Young, K., et al. (1992). Linking purchasing to corporate competitive
strategy. International Journal of Purchasing and Materials Management, 28(4): 2-8.