2014 interim results presentation - 中國光大環境(集團)有限公司
TRANSCRIPT
CHINA EVERBRIGHT INTERNATIONAL LIMITED 中國光大國際有限公司
2014 Interim Results Presentation
August 2014
2
This presentation may contain forward-looking statements. Any such forward-looking statements are based on a number of assumptions about the operations of China Everbright International Limited (the “Company”) and factors beyond the Company's control and are subject to significant risks and uncertainties, and accordingly, actual results may differ materially from these forward-looking statements. The Company undertakes no obligation to update these forward-looking statements for events or circumstances that occur subsequent to such dates.
The information in this presentation should be considered in the context of the circumstances prevailing at the time of its presentation and has not been, and will not be, updated to reflect material developments which may occur after the date of this presentation. The slides forming part of this presentation have been prepared solely as a support for oral discussion about background information about the Company. No representation or warranty, express or implied, is made as to, and no reliance should be placed on, the fairness, accuracy, completeness or correctness of any information or opinion contained herein. It should not be regarded by recipients as a substitute for the exercise of their own judgment. Information and opinion contained in this presentation may be based on or derived from the judgment and opinion of the management of the Company. Such information is not always capable of verification or validation. None of the Company or financial adviser of the Company, or any of their respective directors, officers, employees, agents or advisers shall be in any way responsible for the contents hereof, or shall be liable for any loss arising from use of the information contained in this presentation or otherwise arising in connection therewith. This presentation does not take into consideration the investment objectives, financial situation or particular needs of any particular investor. It shall not to be construed as a solicitation or an offer or invitation to buy or sell any securities or related financial instruments. No part of it shall form the basis of or be relied upon in connection with any contract or commitment whatsoever. This presentation may not be copied or otherwise reproduced.
Forward-looking statements
3 3
Results Highlights Financial Review Energy Conservation and Emission Reduction Business Review
Business Overview Corporate Positioning
Q & A Appendix – Project Summary
Agenda
4 4
Results Highlights
5
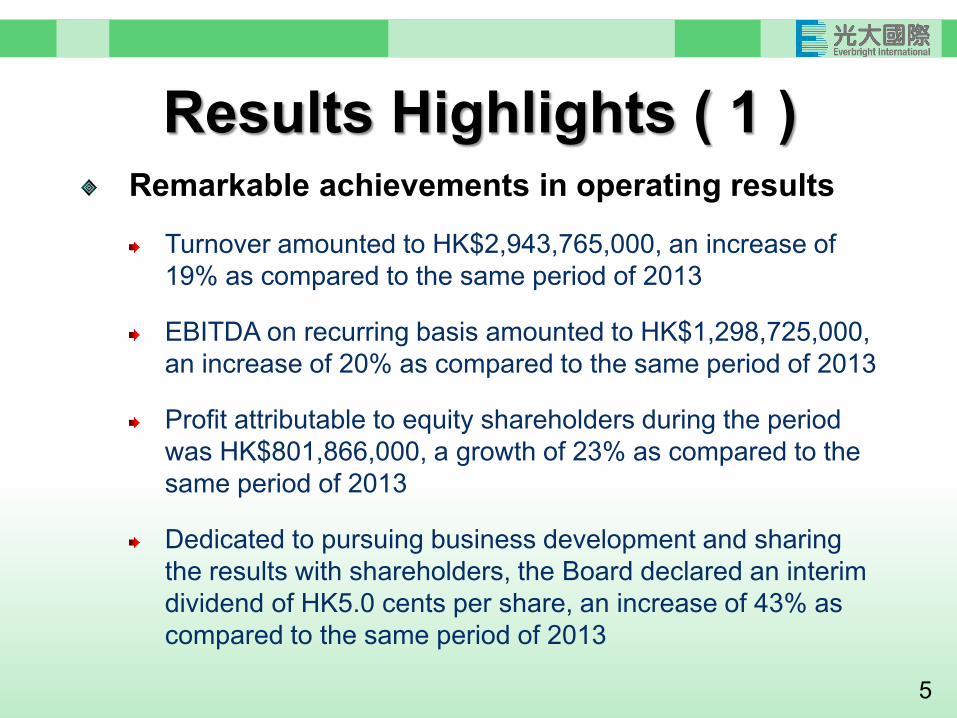
Results Highlights ( 1 ) Remarkable achievements in operating results
Turnover amounted to HK$2,943,765,000, an increase of 19% as compared to the same period of 2013
EBITDA on recurring basis amounted to HK$1,298,725,000, an increase of 20% as compared to the same period of 2013
Profit attributable to equity shareholders during the period was HK$801,866,000, a growth of 23% as compared to the same period of 2013
Dedicated to pursuing business development and sharing the results with shareholders, the Board declared an interim dividend of HK5.0 cents per share, an increase of 43% as compared to the same period of 2013
6
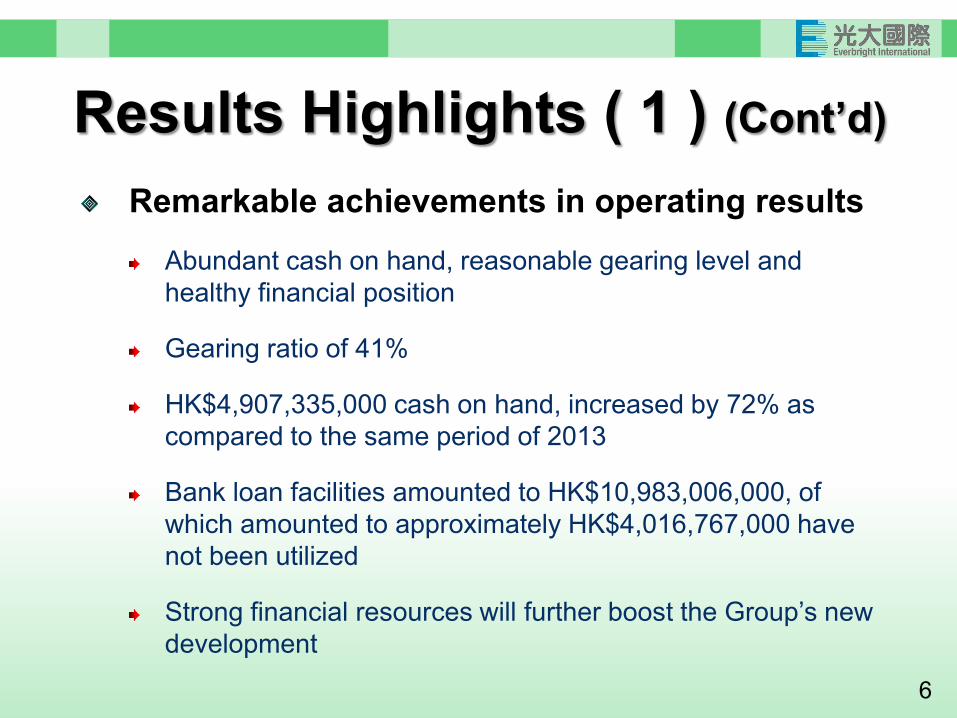
Results Highlights ( 1 ) (Cont’d)
Remarkable achievements in operating results Abundant cash on hand, reasonable gearing level and healthy financial position
Gearing ratio of 41%
HK$4,907,335,000 cash on hand, increased by 72% as compared to the same period of 2013
Bank loan facilities amounted to HK$10,983,006,000, of which amounted to approximately HK$4,016,767,000 have not been utilized
Strong financial resources will further boost the Group’s new development
7
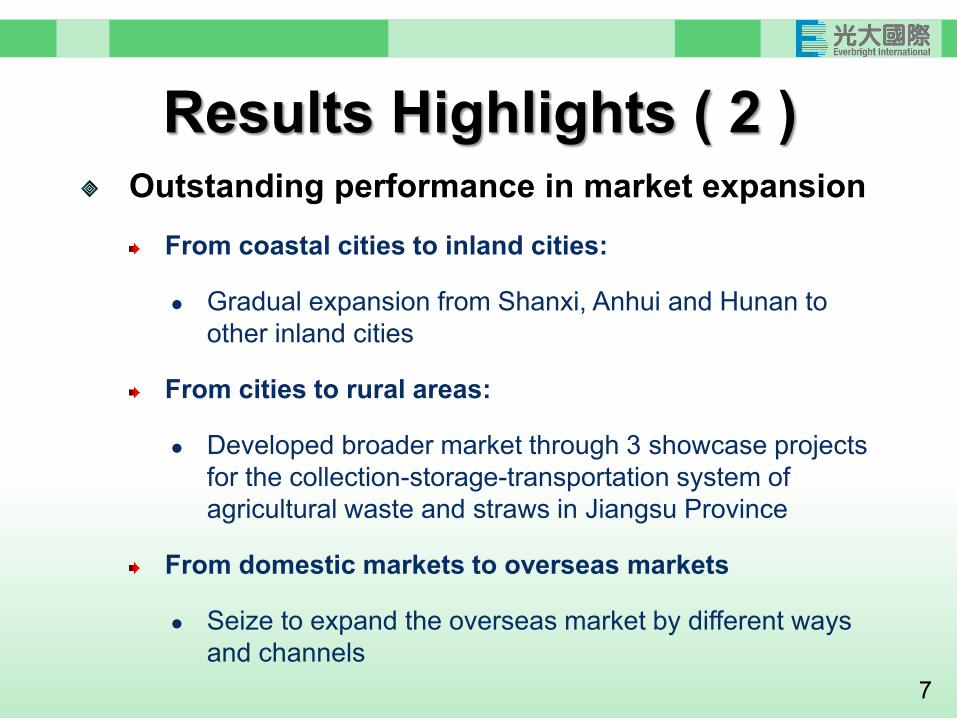
Results Highlights ( 2 ) Outstanding performance in market expansion
From coastal cities to inland cities:
Gradual expansion from Shanxi, Anhui and Hunan to other inland cities
From cities to rural areas:
Developed broader market through 3 showcase projects for the collection-storage-transportation system of agricultural waste and straws in Jiangsu Province
From domestic markets to overseas markets
Seize to expand the overseas market by different ways and channels
8
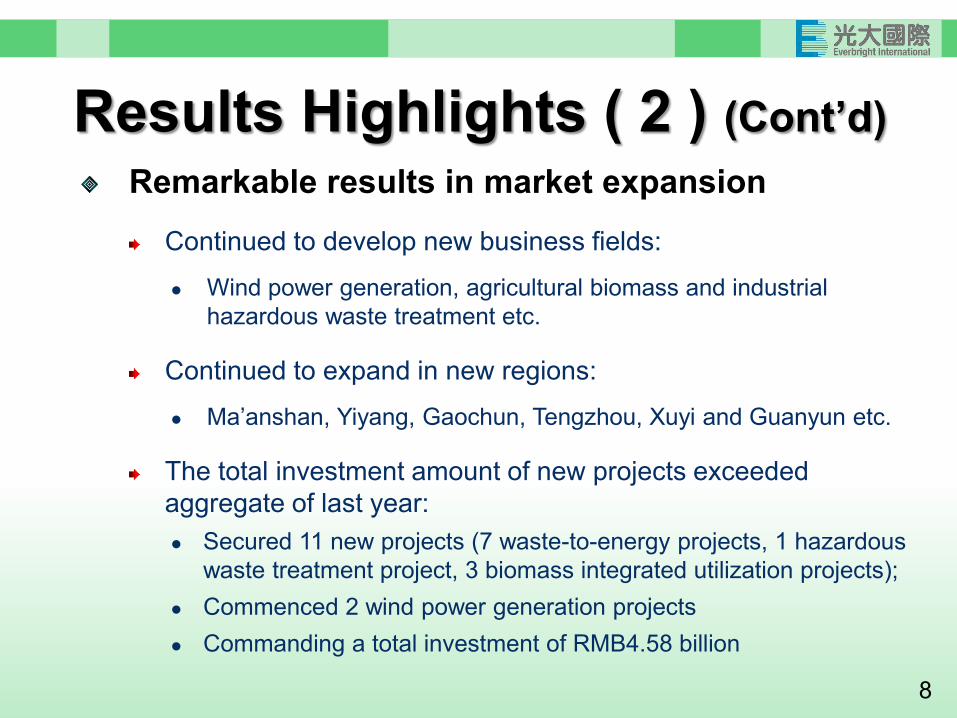
Remarkable results in market expansion
Continued to develop new business fields: Wind power generation, agricultural biomass and industrial
hazardous waste treatment etc.
Continued to expand in new regions: Ma’anshan, Yiyang, Gaochun, Tengzhou, Xuyi and Guanyun etc.
The total investment amount of new projects exceeded aggregate of last year: Secured 11 new projects (7 waste-to-energy projects, 1 hazardous
waste treatment project, 3 biomass integrated utilization projects); Commenced 2 wind power generation projects Commanding a total investment of RMB4.58 billion
Results Highlights ( 2 ) (Cont’d)
9
Enhancing operating management Operating profits increased, driven by revenue increase, expenditure reduction, energy conservation and consumption reduction
Electricity generated per tonne of waste hit record high, up 12% as compared to the same period of 2013
Power consumption reduced significantly in waste-to-energy plants and waste water treatment plants, down 3% and 9% respectively as compared to the same period of 2013
Power generation efficiency of biomass power generation project soared 45% as compared to the same period of 2013
Completed price adjustments of Jiangyin, Yixing and Changzhou waste-to-energy projects
Sanya, Nanjing, Pizhou and Ningbo waste-to-energy projects obtained subsidies of RMB100 million from National Development and Reform Commission
Results Highlights ( 3 )
10
Project construction advances steadily Both the number of projects and contracts hit record high: 35 projects under construction or in preparatory stage
Commanding a total investment of RMB11.035 billion
Projects completed construction and commenced operation: Ningbo Waste-to-energy Project Phase I
Nanjing Waste-to-energy Project Phase I
Dezhou Ling County Waste Water Treatment Project (Plant 1)
upgrade works
Zhangqiu Waste Water Treatment Project
Results Highlights ( 4 )
11
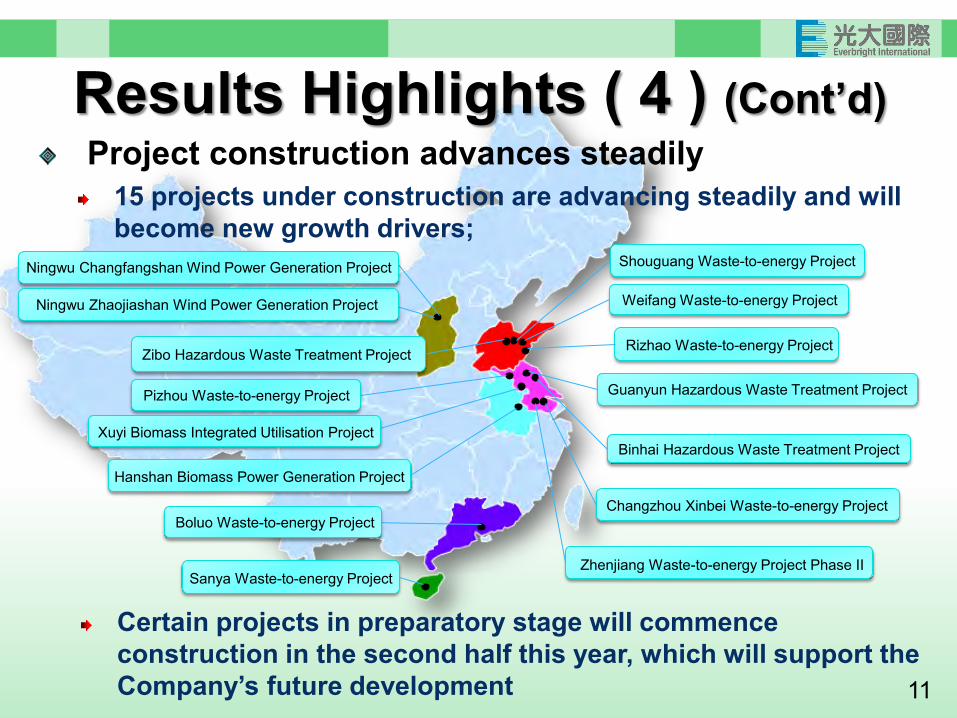
Binhai Hazardous Waste Treatment Project
Guanyun Hazardous Waste Treatment Project
Weifang Waste-to-energy Project
Sanya Waste-to-energy Project
Shouguang Waste-to-energy Project
Zhenjiang Waste-to-energy Project Phase II
Zibo Hazardous Waste Treatment Project
Pizhou Waste-to-energy Project
Ningwu Changfangshan Wind Power Generation Project
Hanshan Biomass Power Generation Project
Ningwu Zhaojiashan Wind Power Generation Project
Changzhou Xinbei Waste-to-energy Project
Xuyi Biomass Integrated Utilisation Project
Rizhao Waste-to-energy Project
Boluo Waste-to-energy Project
Results Highlights ( 4 ) (Cont’d) Project construction advances steadily
15 projects under construction are advancing steadily and will become new growth drivers;
Certain projects in preparatory stage will commence construction in the second half this year, which will support the Company’s future development
12
Remarkable improvement in technological
capability Developing technologies: Development of large-scale waste incineration grate furnace
Leachate treatment system
Gas emission purification system
Rural biomass collection-storage-transportation system
Results Highlights ( 5 )
13
Remarkable improvement in technological capability
Introduced MARTIN GmbH technology for re-modeling:
Further enhance various parameters of waste-to-energy and system operating
Markable technical advantage
World’s leading grate furnace technology
Granted 7 new patents
Cooperated with national ministries and participated in the formulation of standards and regulations relating to environmental protection technology
Results Highlights ( 5 ) (Cont’d)
14
Equipment manufacturing advancing in full gear Successful registration of Everbright Environmental Protection trademark
Expansion of Changzhou Environmental Protection Equipment Manufacturing Project Phase II
Kept up with the progress of projects under construction: Completed the unit assembly commissioning of 4 incinerators and 1 set of 750-
tonne/day prototypes
Completed the supply of 3 sets of gas purification systems and a complete set of leachate equipment
Completed the major overhaul for 6 incinerators and B-Level maintenance of 2 incinerators
Successfully opened the external market of leachate treatment systems
Results Highlights ( 6 )
15
In-depth enhancement of HR strategy and internal management
People oriented and systematic management: Completed company-wide competitive selection of middle management
Built up a talent pipeline to ensure employees’ development being in line with the Group’s new round of growth
Launched the fourth Tsinghua University CEO class (28 people) and the third Master Program of Engineering (27 people)
More than 200 people participated in execution training
Implemented on-site management to enhance execution
Optimized and strengthened supervisory mechanism
Results Highlights ( 7 )
16
Continuous enhancement of social benefits
Established “Everbright International Environmental Protection Charitable Foundation”: Supported “Earth Hour 2014”, a major environmental protection event
organized by WWF-Hong Kong
Became a Double Diamond member of WWF-Hong Kong to support the promotion of environmental conservation and education and the reduction of Hong Kong’s ecological footprint
Established strategic cooperation with China Ecological Civilization Research and Promotion Association and Chinese Society for Environmental Sciences to strengthen the promotion and education of environmental protection in China
Results Highlights ( 8 )
17
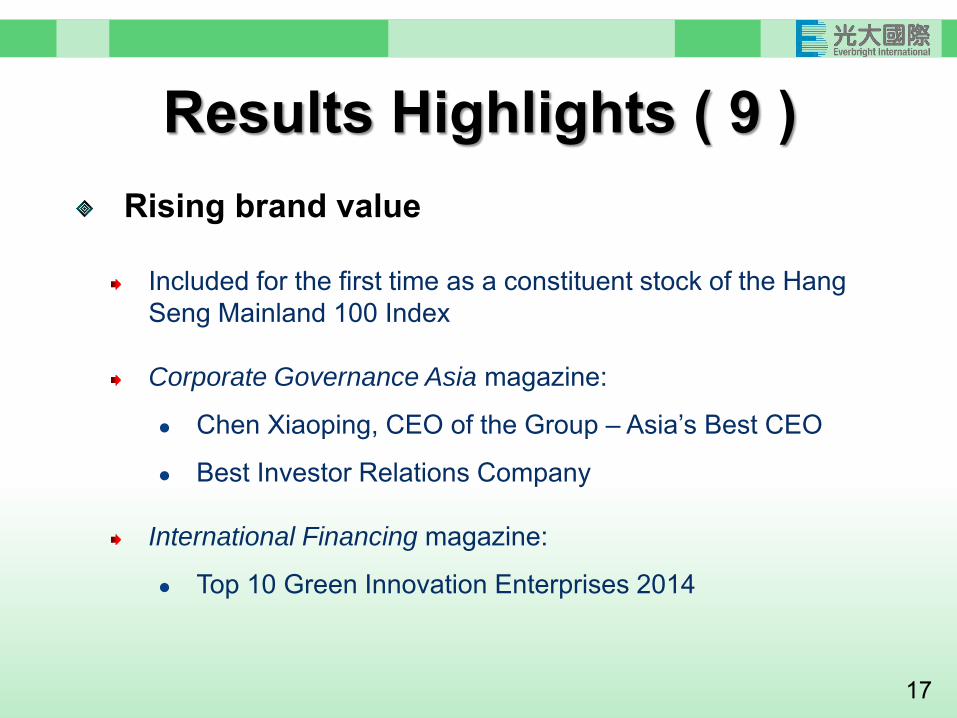
Rising brand value
Included for the first time as a constituent stock of the Hang Seng Mainland 100 Index
Corporate Governance Asia magazine:
Chen Xiaoping, CEO of the Group – Asia’s Best CEO
Best Investor Relations Company
International Financing magazine:
Top 10 Green Innovation Enterprises 2014
Results Highlights ( 9 )
18
Evolving from a traditional company to a high-tech company, and transferring from an environmental protection company to a low-carbon industry player
Establish the leading position in the PRC environmental industry by mature technology and advance management
Results Highlights ( 10 )
19
Financial Review
20
Financial Review
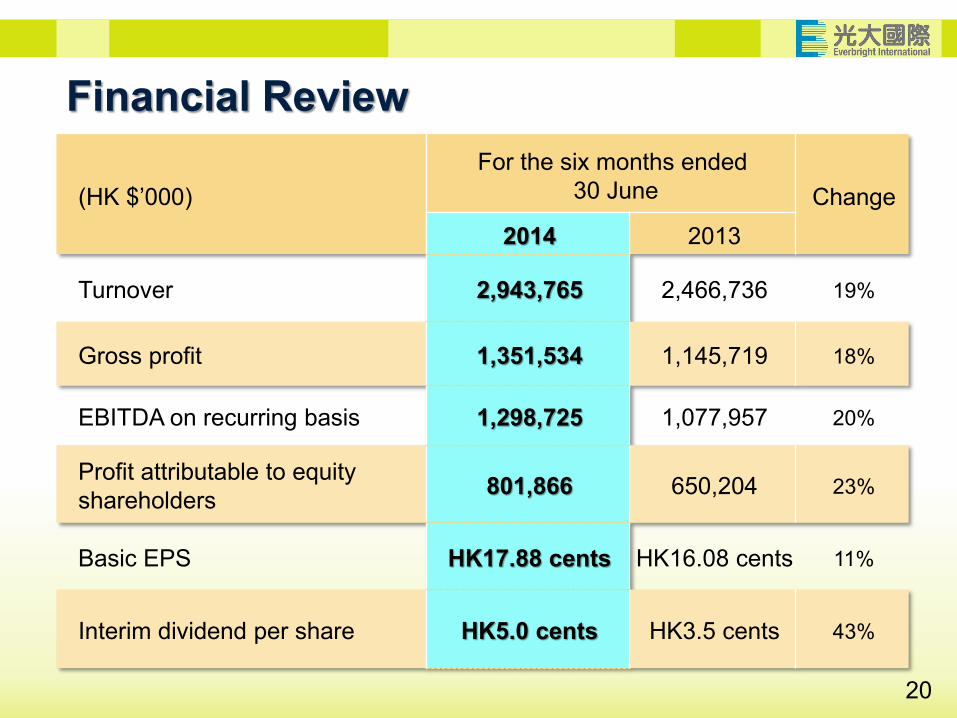
(HK $’000) For the six months ended
30 June Change 2014 2013
Turnover 2,943,765 2,466,736 19%
Gross profit 1,351,534 1,145,719 18%
EBITDA on recurring basis 1,298,725 1,077,957 20%
Profit attributable to equity shareholders 801,866 650,204 23%
Basic EPS HK17.88 cents HK16.08 cents 11%
Interim dividend per share HK5.0 cents HK3.5 cents 43%
21
0
200,000
400,000
600,000
800,000
1,000,000
1,200,000
1,400,000
1,600,000
1,800,000
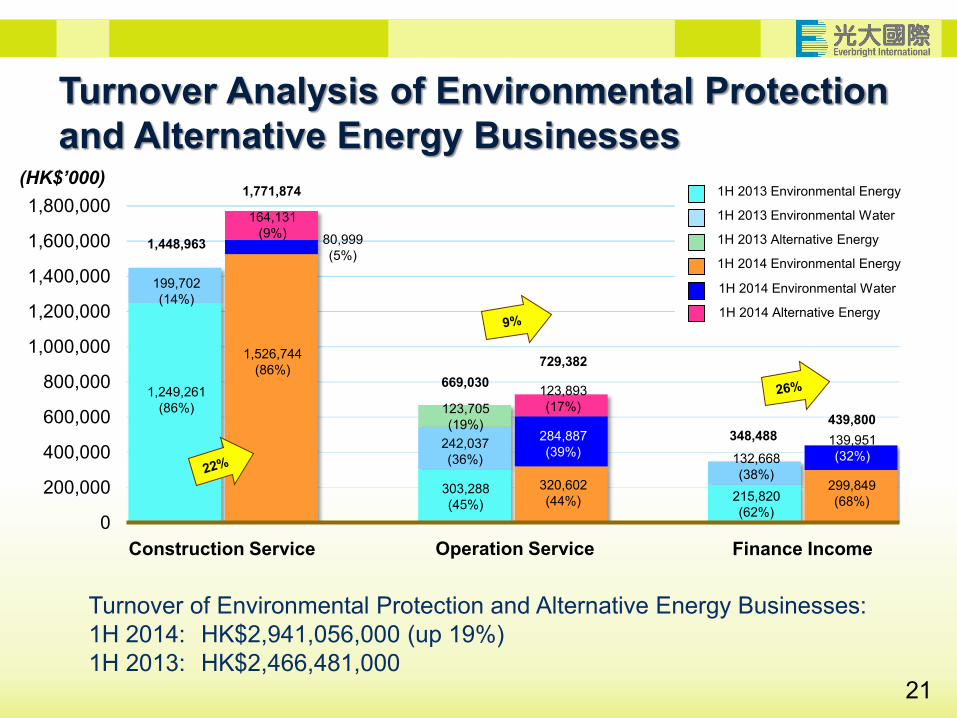
Turnover Analysis of Environmental Protection and Alternative Energy Businesses
(HK$’000)
Construction Service Operation Service Finance Income
242,037 (36%) 132,668
(38%)
199,702 (14%)
303,288 (45%) 215,820
(62%)
669,030
348,488
1,448,963
1,249,261 (86%) 123,705
(19%)
Turnover of Environmental Protection and Alternative Energy Businesses: 1H 2014: HK$2,941,056,000 (up 19%) 1H 2013: HK$2,466,481,000
1,526,744 (86%)
80,999 (5%)
164,131 (9%)
320,602 (44%)
284,887 (39%)
123,893 (17%)
299,849 (68%)
139,951 (32%)
1,771,874
729,382
439,800
1H 2014 Environmental Energy
1H 2013 Environmental Energy
1H 2013 Environmental Water
1H 2013 Alternative Energy
1H 2014 Environmental Water
1H 2014 Alternative Energy
22
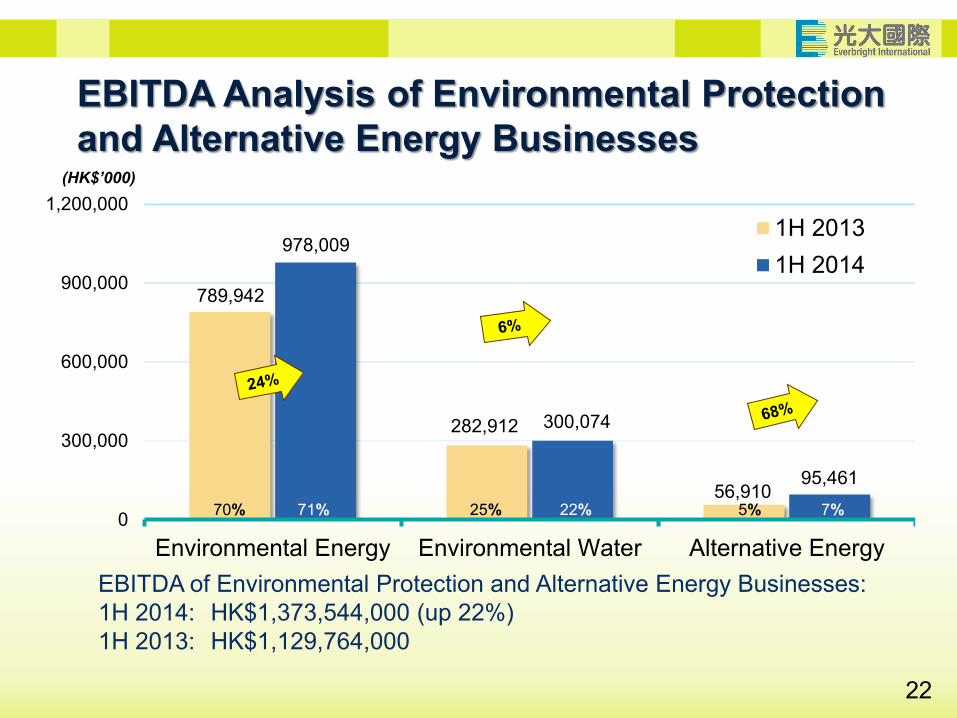
EBITDA Analysis of Environmental Protection and Alternative Energy Businesses
EBITDA of Environmental Protection and Alternative Energy Businesses: 1H 2014: HK$1,373,544,000 (up 22%) 1H 2013: HK$1,129,764,000
789,942
282,912
56,910
978,009
300,074
95,461
0
300,000
600,000
900,000
1,200,000
Environmental Energy Environmental Water Alternative Energy
1H 20131H 2014
(HK$’000)
70% 5% 25% 71% 22% 7%
23
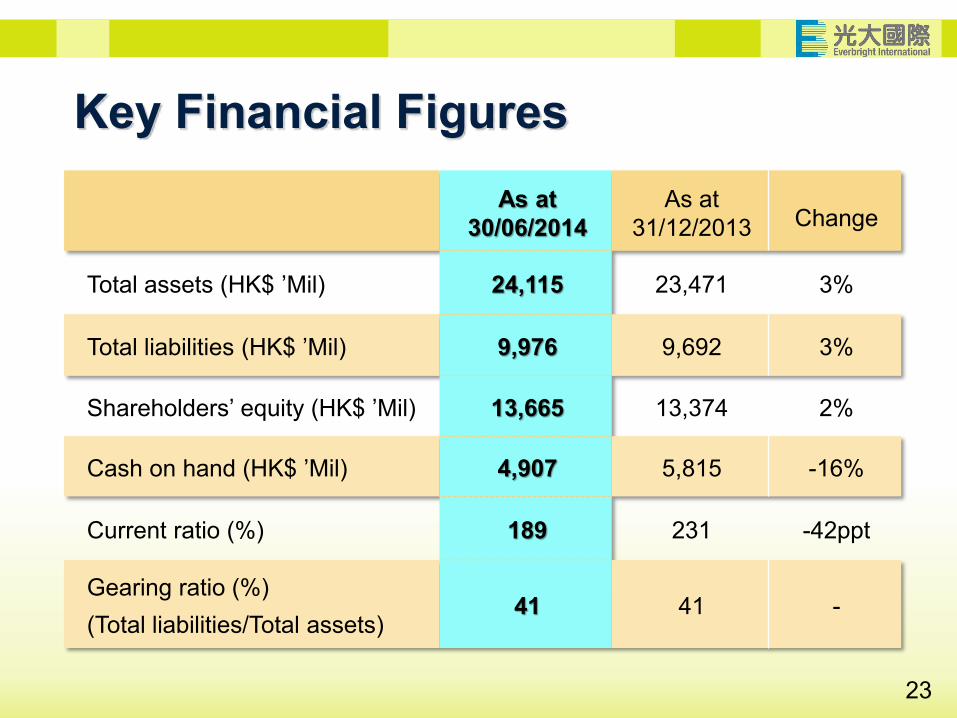
As at 30/06/2014
As at 31/12/2013
Change
Total assets (HK$ ’Mil) 24,115 23,471 3%
Total liabilities (HK$ ’Mil) 9,976 9,692 3%
Shareholders’ equity (HK$ ’Mil) 13,665 13,374 2%
Cash on hand (HK$ ’Mil) 4,907 5,815 -16%
Current ratio (%) 189 231 -42ppt
Gearing ratio (%) (Total liabilities/Total assets)
41 41 -
Key Financial Figures
24
Energy Conservation and Emission Reduction
25
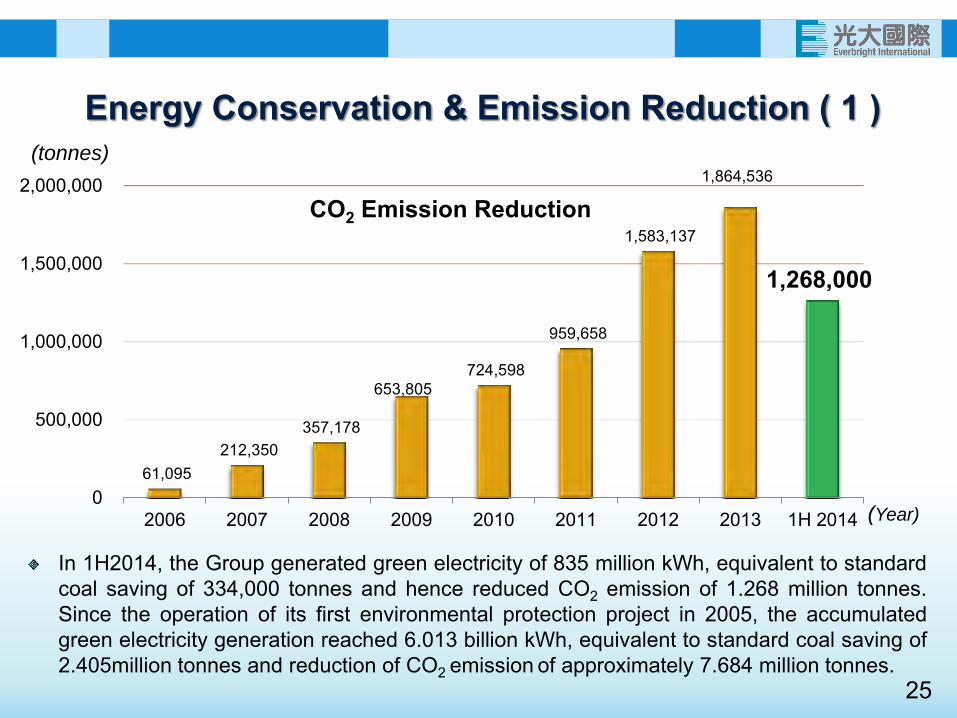
In 1H2014, the Group generated green electricity of 835 million kWh, equivalent to standard coal saving of 334,000 tonnes and hence reduced CO2 emission of 1.268 million tonnes. Since the operation of its first environmental protection project in 2005, the accumulated green electricity generation reached 6.013 billion kWh, equivalent to standard coal saving of 2.405million tonnes and reduction of CO2 emission of approximately 7.684 million tonnes.
(Year)
Energy Conservation & Emission Reduction ( 1 ) (tonnes)
61,095 212,350
357,178
653,805 724,598
959,658
1,583,137
1,864,536
1,268,000
0
500,000
1,000,000
1,500,000
2,000,000
2006 2007 2008 2009 2010 2011 2012 2013 1H 2014
CO2 Emission Reduction
26
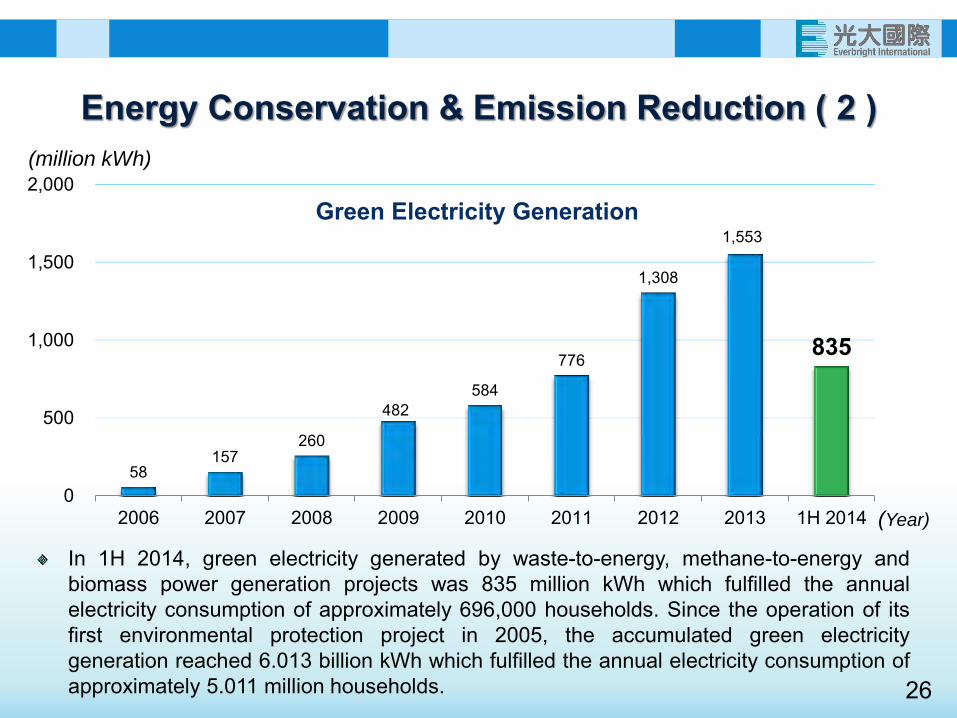
Energy Conservation & Emission Reduction ( 2 )
In 1H 2014, green electricity generated by waste-to-energy, methane-to-energy and biomass power generation projects was 835 million kWh which fulfilled the annual electricity consumption of approximately 696,000 households. Since the operation of its first environmental protection project in 2005, the accumulated green electricity generation reached 6.013 billion kWh which fulfilled the annual electricity consumption of approximately 5.011 million households.
(Year)
(million kWh)
Green Electricity Generation
58 157
260
482 584
776
1,308
1,553
835
0
500
1,000
1,500
2,000
2006 2007 2008 2009 2010 2011 2012 2013 1H 2014
27
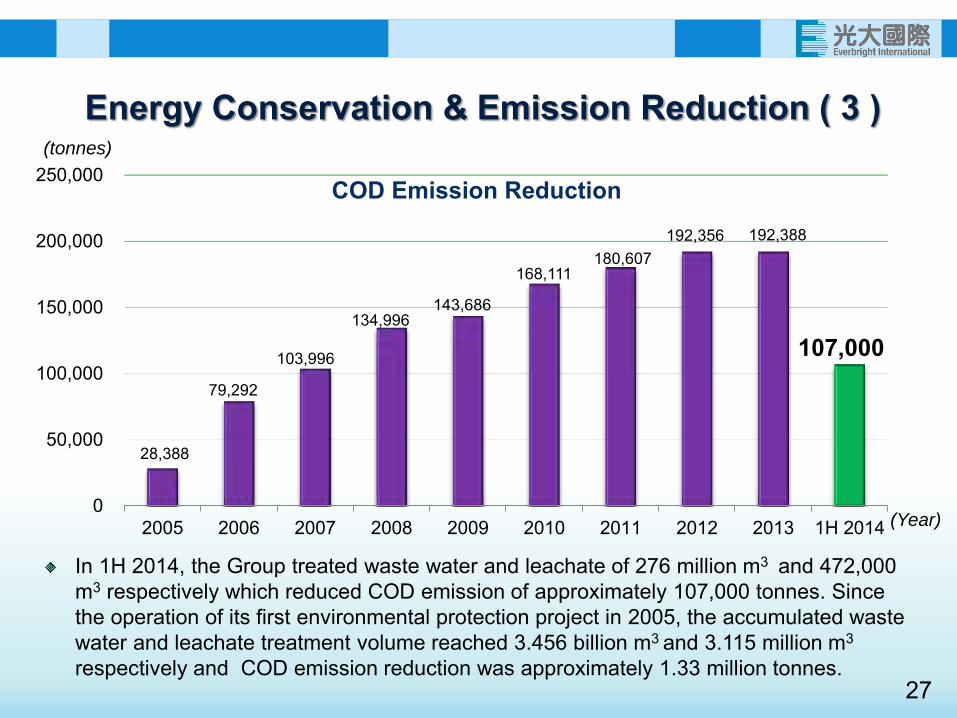
Energy Conservation & Emission Reduction ( 3 )
In 1H 2014, the Group treated waste water and leachate of 276 million m3 and 472,000 m3 respectively which reduced COD emission of approximately 107,000 tonnes. Since the operation of its first environmental protection project in 2005, the accumulated waste water and leachate treatment volume reached 3.456 billion m3 and 3.115 million m3 respectively and COD emission reduction was approximately 1.33 million tonnes.
(Year)
(tonnes)
COD Emission Reduction
28,388
79,292
103,996
134,996 143,686
168,111 180,607
192,356 192,388
107,000
0
50,000
100,000
150,000
200,000
250,000
2005 2006 2007 2008 2009 2010 2011 2012 2013 1H 2014
28
Environmental Energy
Environmental Water
Alternative Energy
Environmental Protection Industrial Park
Environmental Protection Equipment Manufacturing
Environmental Protection Engineering
Environmental Protection Technology
Business Overview
29
Environmental Energy ( 1 )
12 waste-to-energy projects, 3 industrial and hazardous solid waste treatment projects and 2 methane-to-energy projects are in operation
19 waste-to-energy projects and 6 hazardous waste treatment projects are under construction or in preparatory stage
Commanding a total investment of RMB15.354 billion
30
Environmental Energy ( 2 ) Designed capacity :
annual household waste processing capacity of 9.80 million tonnes (11.70 million tonnes including phase II projects that have not been activated)
annual on-grid electricity generation capacity of 2.951 billion kWh
annual hazardous solid waste incineration processing capacity of 58,500 tonnes, physico-chemical processing capacity of 50,000 tonnes
annual industrial and hazardous solid waste landfill capacity of 131,650 tonnes
31
Environmental Water ( 1 ) 20 waste water treatment projects, 3 reusable water projects and 2 waste water source heat pump projects are in operation
1 waste water BT project and 1 surface water BT project have been completed and transferred
1 waste water treatment project and 1 reusable water project are under construction or in preparatory stage
Commanding a total investment of RMB3.812 billion
32
Designed capacity:
Annual waste water treatment capacity of 668 million m3
Annual reusable water supply of 22.33 million m3
Provide heating and cooling services for an area of 312,000 m2
Environmental Water ( 2 )
33
Alternative Energy ( 1 ) 8 photovoltaic energy projects and 1 biomass power generation project are in operation
1 biomass power generation under construction and 4 biomass power generation projects have been secured
3 biomass integrated utilization projects and 2 wind power generation projects under construction or in preparatory stage
19 projects commanding a total investment of RMB4.033 billion
34
Designed capacity:
annual agricultural waste treatment capacity of 2.064 million tonnes
annual electricity generation of 1.358 billion kWh
Annual heat volume of 1.652 million tonnes
Alternative Energy ( 2 )
35
Environmental Protection Industrial Park
9 Environmental Protection Industrial Parks
Commanding a total investment of RMB20 billion
36
Environmental Equipment Manufacturing
Equipment Manufacturing Centre proceeded vigorously
manufacture of grate furnaces, sludge treatment equipment and emission purification equipment etc
with large number of orders and reach full production capacity
activated expansion to meet future needs
37
Environmental Protection Engineering National High Tech Enterprise
Possess the "Main Contractor for Municipal Public Works" License
Obtained numerous national and provincial golden or silver awards for quality
35 projects are under construction or in preparatory stage, commanding a total investment of RMB11.035 billion
38
Environmental Protection Technology National High Tech Enterprise
Obtained numerous invention and application patents
Possess numerous significant R&D results
Continue to strengthen the R&D development
Continue to introduce advanced environmental protection technology
39
Corporate Positioning High Starting Point Wider Horizon Stronger Cohesiveness Full Effort Steady Development Advanced Technology Excellent Quality Better Efficiency
40
Becoming an investment holding group engaging in environmental protection, integrating construction, operation, R&D and equipment manufacturing in the system
Becoming the world leading player in the green environmental protection and alternative energy industries
Corporate Positioning
41
Q&A
42
Thank You
43
Appendix Project Summary
44
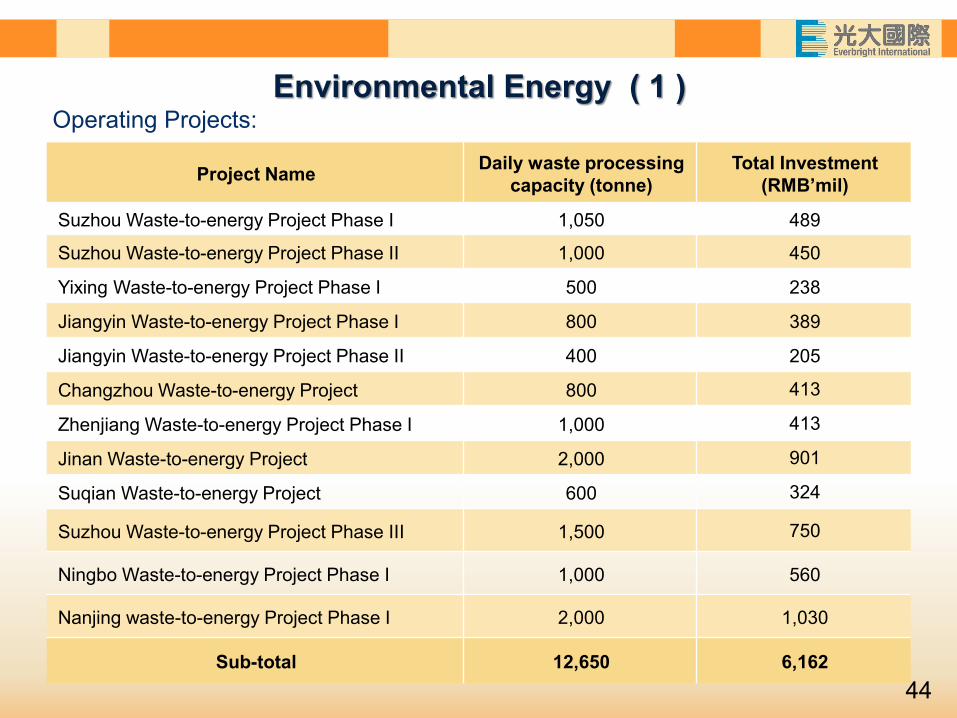
Project Name Daily waste processing capacity (tonne)
Total Investment (RMB’mil)
Suzhou Waste-to-energy Project Phase I 1,050 489
Suzhou Waste-to-energy Project Phase II 1,000 450
Yixing Waste-to-energy Project Phase I 500 238
Jiangyin Waste-to-energy Project Phase I 800 389
Jiangyin Waste-to-energy Project Phase II 400 205
Changzhou Waste-to-energy Project 800 413
Zhenjiang Waste-to-energy Project Phase I 1,000 413
Jinan Waste-to-energy Project 2,000 901
Suqian Waste-to-energy Project 600 324
Suzhou Waste-to-energy Project Phase III 1,500 750
Ningbo Waste-to-energy Project Phase I 1,000 560
Nanjing waste-to-energy Project Phase I 2,000 1,030
Sub-total 12,650 6,162
Operating Projects: Environmental Energy ( 1 )
45
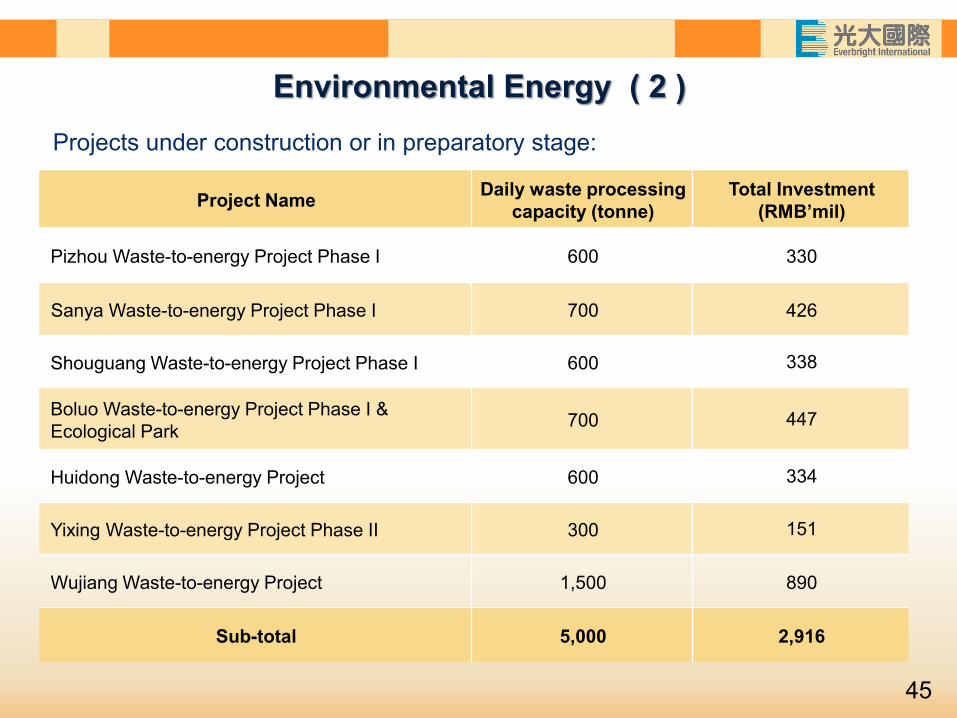
Project Name Daily waste processing capacity (tonne)
Total Investment (RMB’mil)
Pizhou Waste-to-energy Project Phase I 600 330
Sanya Waste-to-energy Project Phase I 700 426
Shouguang Waste-to-energy Project Phase I 600 338
Boluo Waste-to-energy Project Phase I & Ecological Park 700 447
Huidong Waste-to-energy Project 600 334
Yixing Waste-to-energy Project Phase II 300 151
Wujiang Waste-to-energy Project 1,500 890
Sub-total 5,000 2,916
Projects under construction or in preparatory stage:
Environmental Energy ( 2 )
46
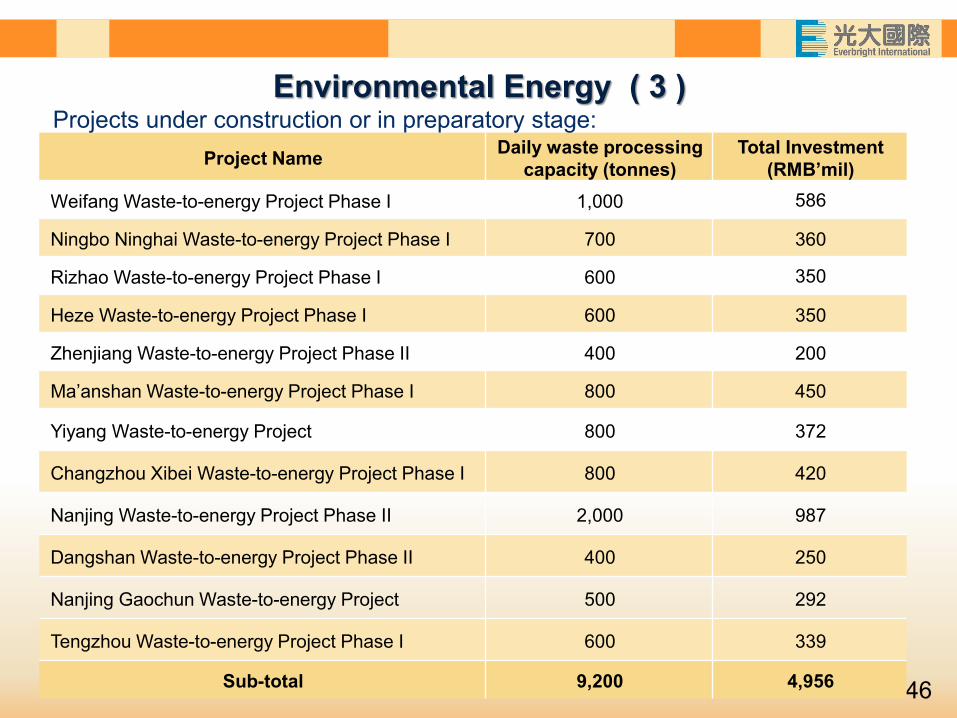
Project Name Daily waste processing capacity (tonnes)
Total Investment (RMB’mil)
Weifang Waste-to-energy Project Phase I 1,000 586
Ningbo Ninghai Waste-to-energy Project Phase I 700 360
Rizhao Waste-to-energy Project Phase I 600 350
Heze Waste-to-energy Project Phase I 600 350
Zhenjiang Waste-to-energy Project Phase II 400 200
Ma’anshan Waste-to-energy Project Phase I 800 450
Yiyang Waste-to-energy Project 800 372
Changzhou Xibei Waste-to-energy Project Phase I 800 420
Nanjing Waste-to-energy Project Phase II 2,000 987
Dangshan Waste-to-energy Project Phase II 400 250
Nanjing Gaochun Waste-to-energy Project 500 292
Tengzhou Waste-to-energy Project Phase I 600 339
Sub-total 9,200 4,956
Projects under construction or in preparatory stage: Environmental Energy ( 3 )
47
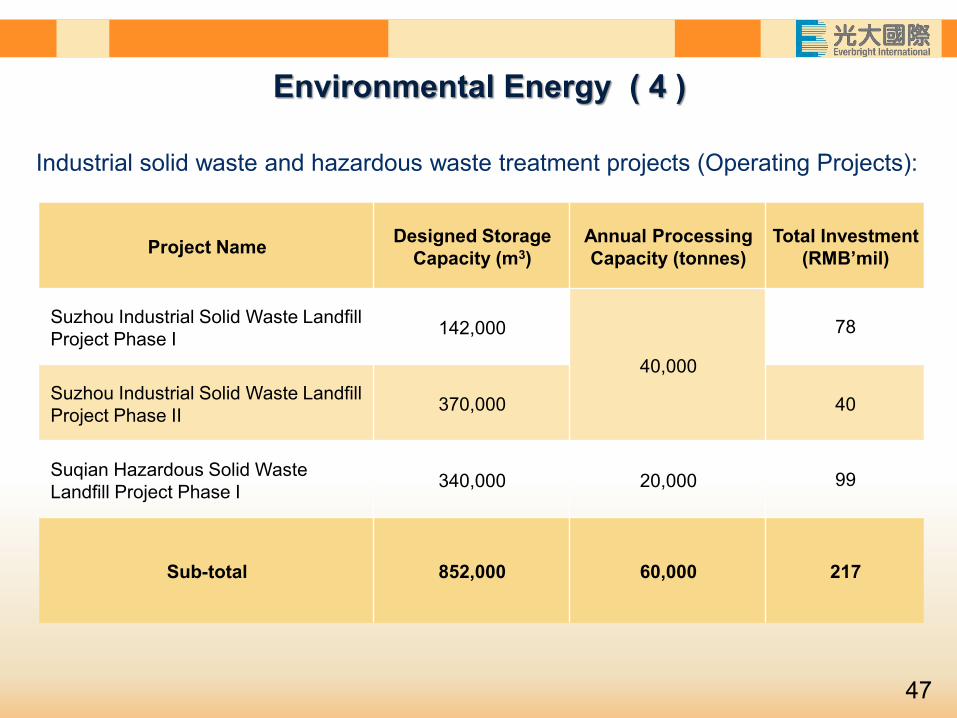
Project Name Designed Storage Capacity (m3)
Annual Processing Capacity (tonnes)
Total Investment (RMB’mil)
Suzhou Industrial Solid Waste Landfill Project Phase I 142,000
40,000
78
Suzhou Industrial Solid Waste Landfill Project Phase II 370,000 40
Suqian Hazardous Solid Waste Landfill Project Phase I 340,000 20,000 99
Sub-total 852,000 60,000 217
Industrial solid waste and hazardous waste treatment projects (Operating Projects):
Environmental Energy ( 4 )
48
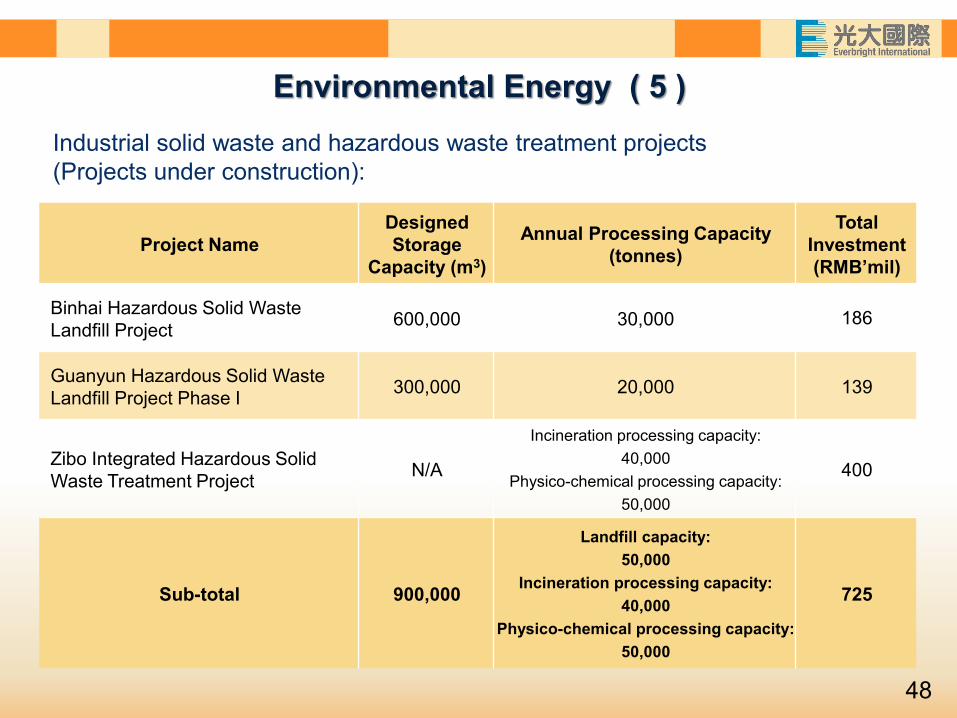
Project Name Designed Storage
Capacity (m3)
Annual Processing Capacity (tonnes)
Total Investment (RMB’mil)
Binhai Hazardous Solid Waste Landfill Project 600,000 30,000 186
Guanyun Hazardous Solid Waste Landfill Project Phase I 300,000 20,000 139
Zibo Integrated Hazardous Solid Waste Treatment Project N/A
Incineration processing capacity: 40,000
Physico-chemical processing capacity: 50,000
400
Sub-total 900,000
Landfill capacity: 50,000
Incineration processing capacity: 40,000
Physico-chemical processing capacity: 50,000
725
Industrial solid waste and hazardous waste treatment projects (Projects under construction):
Environmental Energy ( 5 )
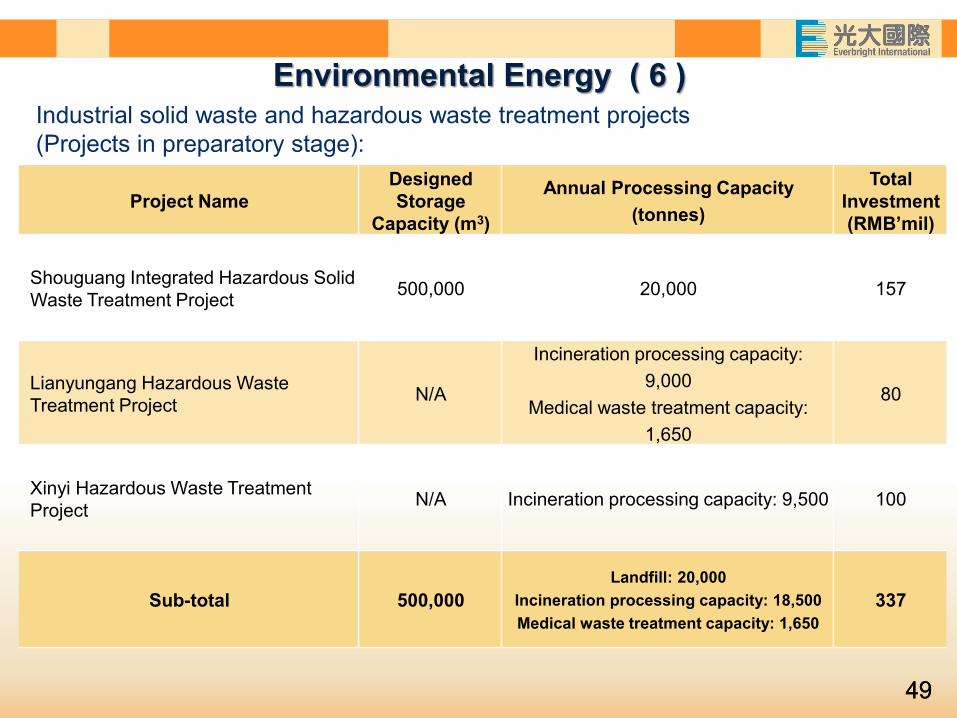
49
Project Name Designed Storage
Capacity (m3)
Annual Processing Capacity (tonnes)
Total Investment (RMB’mil)
Shouguang Integrated Hazardous Solid Waste Treatment Project 500,000 20,000 157
Lianyungang Hazardous Waste Treatment Project N/A
Incineration processing capacity: 9,000
Medical waste treatment capacity: 1,650
80
Xinyi Hazardous Waste Treatment Project N/A Incineration processing capacity: 9,500 100
Sub-total 500,000 Landfill: 20,000
Incineration processing capacity: 18,500 Medical waste treatment capacity: 1,650
337
Industrial solid waste and hazardous waste treatment projects (Projects in preparatory stage):
Environmental Energy ( 6 )
49
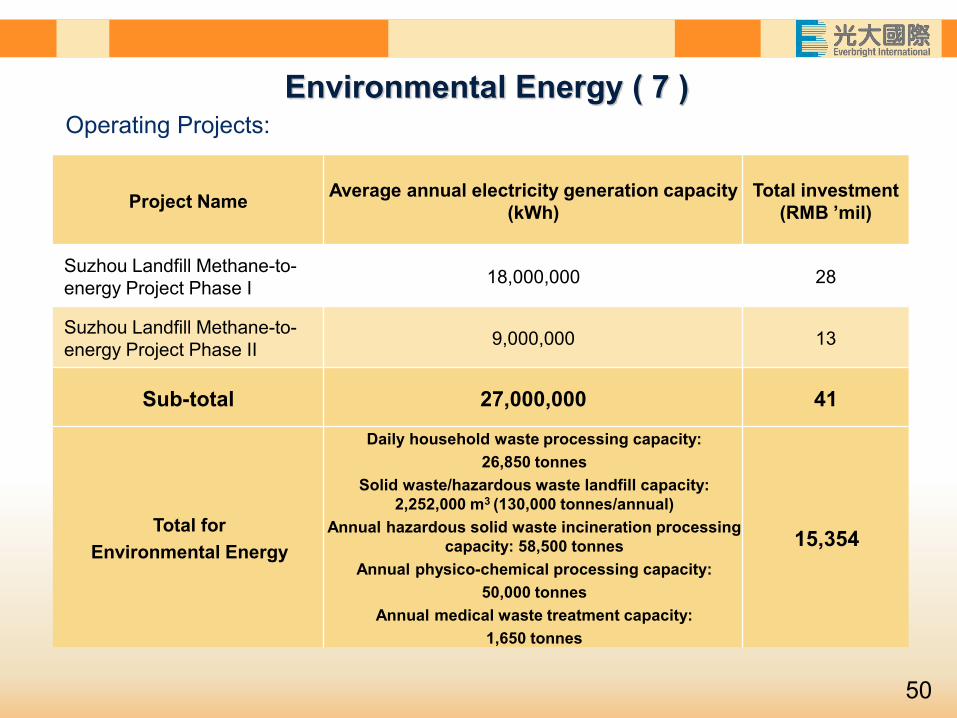
50
Project Name Average annual electricity generation capacity (kWh)
Total investment (RMB ’mil)
Suzhou Landfill Methane-to-energy Project Phase I 18,000,000 28
Suzhou Landfill Methane-to-energy Project Phase II 9,000,000 13
Sub-total 27,000,000 41
Total for Environmental Energy
Daily household waste processing capacity: 26,850 tonnes
Solid waste/hazardous waste landfill capacity: 2,252,000 m3 (130,000 tonnes/annual)
Annual hazardous solid waste incineration processing capacity: 58,500 tonnes
Annual physico-chemical processing capacity: 50,000 tonnes
Annual medical waste treatment capacity: 1,650 tonnes
15,354
Environmental Energy ( 7 ) Operating Projects:
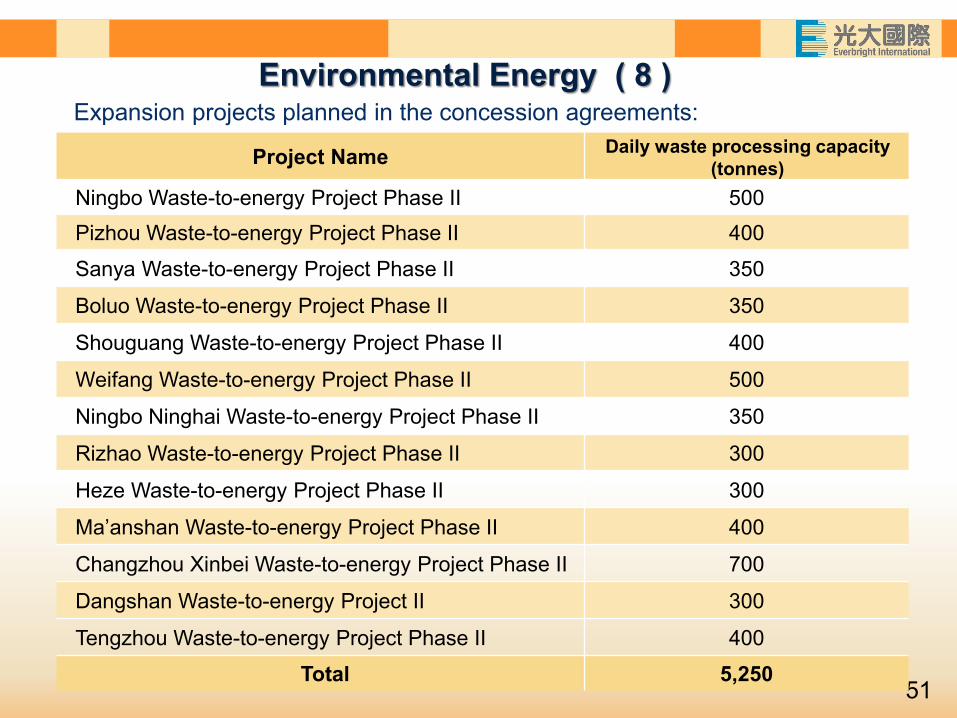
51
Project Name Daily waste processing capacity (tonnes)
Ningbo Waste-to-energy Project Phase II 500 Pizhou Waste-to-energy Project Phase II 400 Sanya Waste-to-energy Project Phase II 350
Boluo Waste-to-energy Project Phase II 350
Shouguang Waste-to-energy Project Phase II 400
Weifang Waste-to-energy Project Phase II 500
Ningbo Ninghai Waste-to-energy Project Phase II 350
Rizhao Waste-to-energy Project Phase II 300
Heze Waste-to-energy Project Phase II 300
Ma’anshan Waste-to-energy Project Phase II 400
Changzhou Xinbei Waste-to-energy Project Phase II 700
Dangshan Waste-to-energy Project II 300
Tengzhou Waste-to-energy Project Phase II 400 Total 5,250
Environmental Energy ( 8 ) Expansion projects planned in the concession agreements:
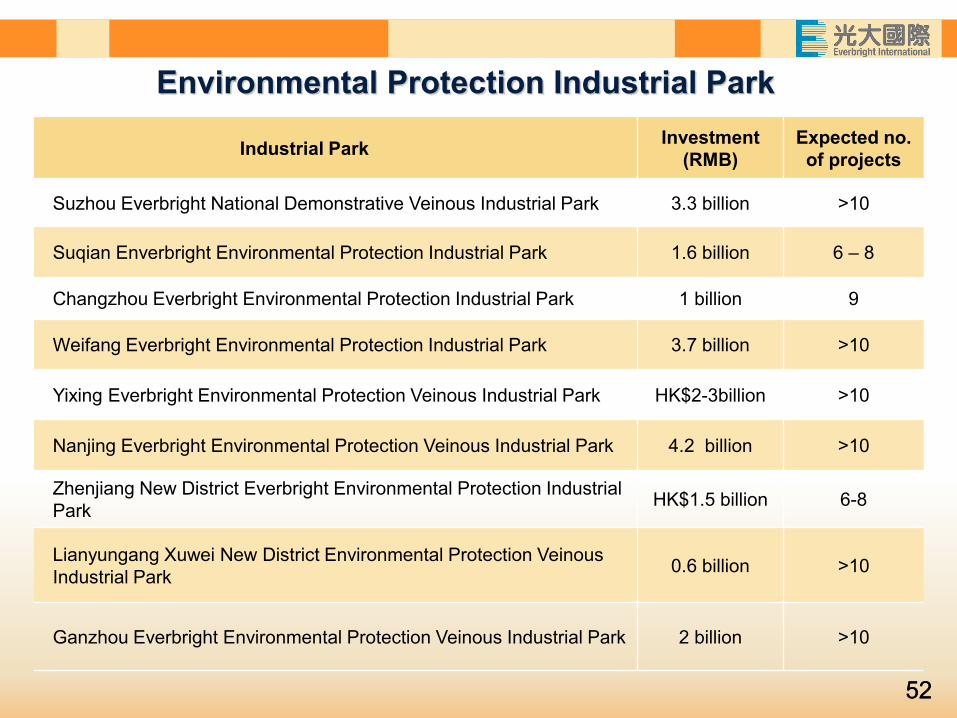
52
Industrial Park Investment (RMB)
Expected no. of projects
Suzhou Everbright National Demonstrative Veinous Industrial Park 3.3 billion >10
Suqian Enverbright Environmental Protection Industrial Park 1.6 billion 6 – 8
Changzhou Everbright Environmental Protection Industrial Park 1 billion 9
Weifang Everbright Environmental Protection Industrial Park 3.7 billion >10
Yixing Everbright Environmental Protection Veinous Industrial Park HK$2-3billion >10
Nanjing Everbright Environmental Protection Veinous Industrial Park 4.2 billion >10
Zhenjiang New District Everbright Environmental Protection Industrial Park HK$1.5 billion 6-8
Lianyungang Xuwei New District Environmental Protection Veinous Industrial Park 0.6 billion >10
Ganzhou Everbright Environmental Protection Veinous Industrial Park 2 billion >10
Environmental Protection Industrial Park
52
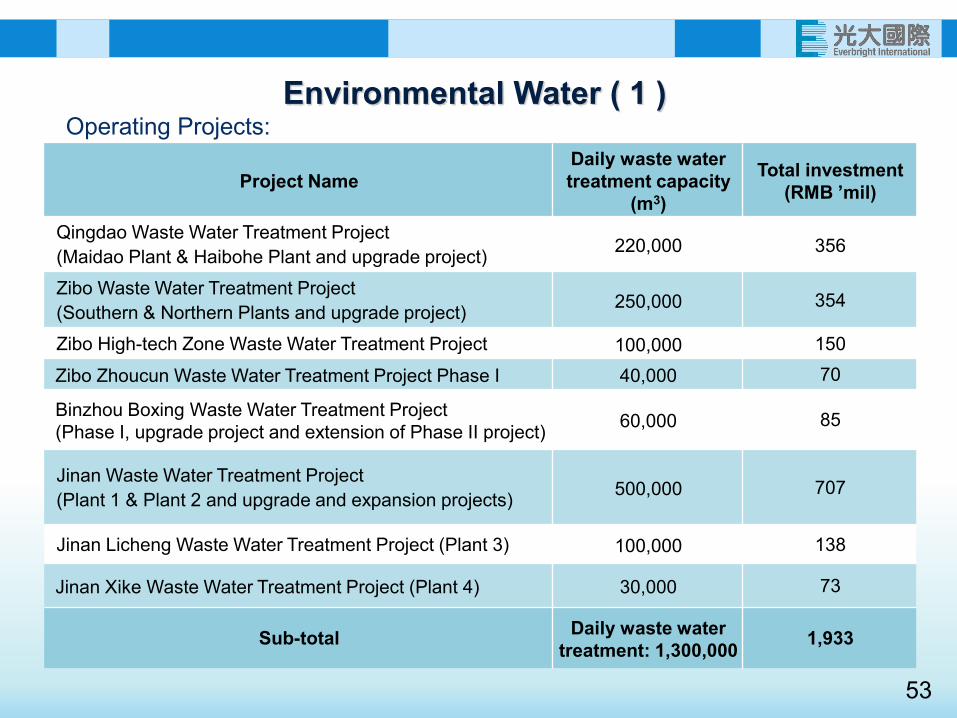
53
Project Name Daily waste water treatment capacity
(m3)
Total investment (RMB ’mil)
Qingdao Waste Water Treatment Project (Maidao Plant & Haibohe Plant and upgrade project) 220,000 356
Zibo Waste Water Treatment Project (Southern & Northern Plants and upgrade project) 250,000 354
Zibo High-tech Zone Waste Water Treatment Project 100,000 150 Zibo Zhoucun Waste Water Treatment Project Phase I 40,000 70
Binzhou Boxing Waste Water Treatment Project (Phase I, upgrade project and extension of Phase II project) 60,000 85
Jinan Waste Water Treatment Project (Plant 1 & Plant 2 and upgrade and expansion projects) 500,000 707
Jinan Licheng Waste Water Treatment Project (Plant 3) 100,000 138
Jinan Xike Waste Water Treatment Project (Plant 4) 30,000 73
Sub-total Daily waste water treatment: 1,300,000 1,933
Environmental Water ( 1 ) Operating Projects:
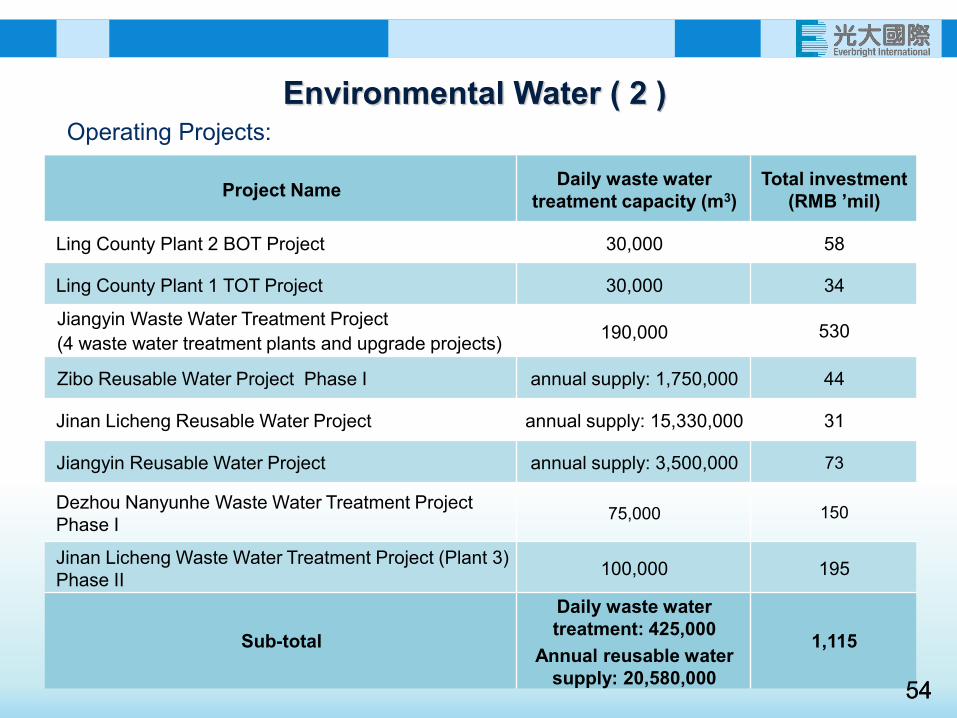
54
Project Name Daily waste water treatment capacity (m3)
Total investment (RMB ’mil)
Ling County Plant 2 BOT Project 30,000 58
Ling County Plant 1 TOT Project 30,000 34
Jiangyin Waste Water Treatment Project (4 waste water treatment plants and upgrade projects) 190,000 530
Zibo Reusable Water Project Phase I annual supply: 1,750,000 44
Jinan Licheng Reusable Water Project annual supply: 15,330,000 31
Jiangyin Reusable Water Project annual supply: 3,500,000 73
Dezhou Nanyunhe Waste Water Treatment Project Phase I 75,000 150
Jinan Licheng Waste Water Treatment Project (Plant 3) Phase II 100,000 195
Sub-total
Daily waste water treatment: 425,000
Annual reusable water supply: 20,580,000
1,115
Operating Projects: Environmental Water ( 2 )
54
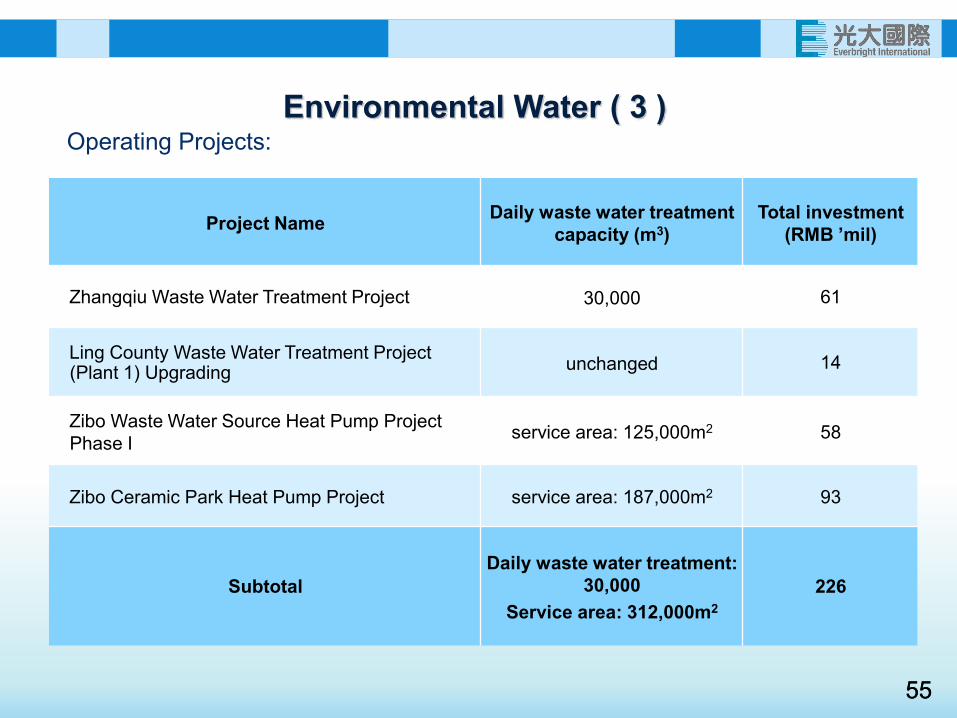
55
Project Name Daily waste water treatment capacity (m3)
Total investment (RMB ’mil)
Zhangqiu Waste Water Treatment Project 30,000 61
Ling County Waste Water Treatment Project (Plant 1) Upgrading unchanged 14
Zibo Waste Water Source Heat Pump Project Phase I service area: 125,000m2 58
Zibo Ceramic Park Heat Pump Project service area: 187,000m2 93
Subtotal Daily waste water treatment:
30,000 Service area: 312,000m2
226
55
Environmental Water ( 3 ) Operating Projects:
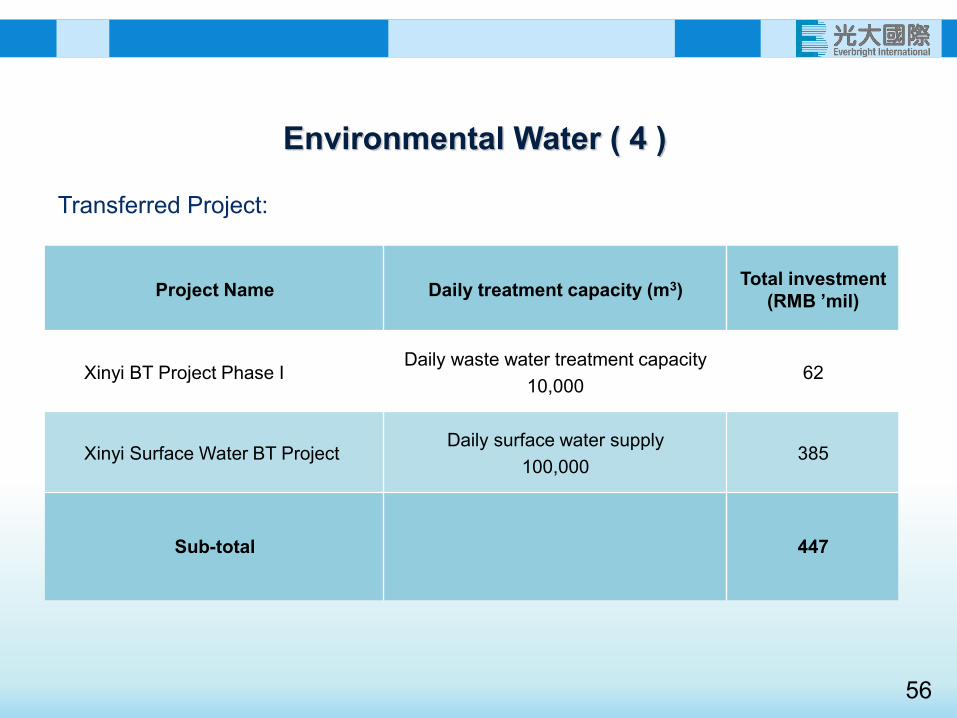
56
Project Name Daily treatment capacity (m3) Total investment (RMB ’mil)
Xinyi BT Project Phase I Daily waste water treatment capacity
10,000 62
Xinyi Surface Water BT Project Daily surface water supply
100,000 385
Sub-total 447
Transferred Project:
Environmental Water ( 4 )
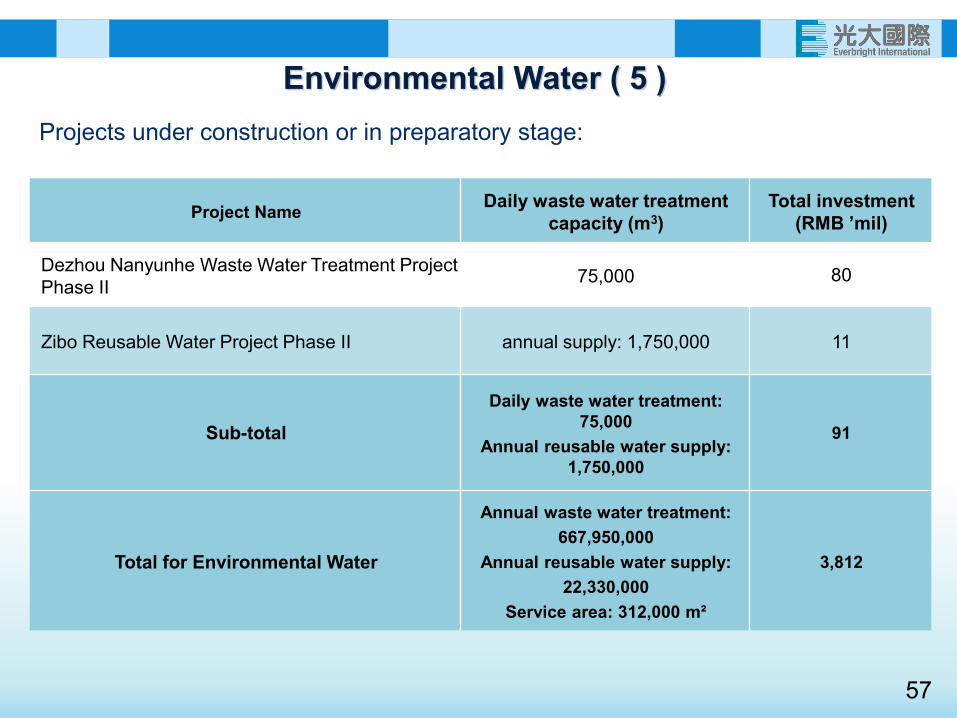
57
Project Name Daily waste water treatment capacity (m3)
Total investment (RMB ’mil)
Dezhou Nanyunhe Waste Water Treatment Project Phase II 75,000 80
Zibo Reusable Water Project Phase II annual supply: 1,750,000 11
Sub-total Daily waste water treatment:
75,000 Annual reusable water supply:
1,750,000
91
Total for Environmental Water
Annual waste water treatment: 667,950,000
Annual reusable water supply: 22,330,000
Service area: 312,000 m²
3,812
Projects under construction or in preparatory stage:
Environmental Water ( 5 )
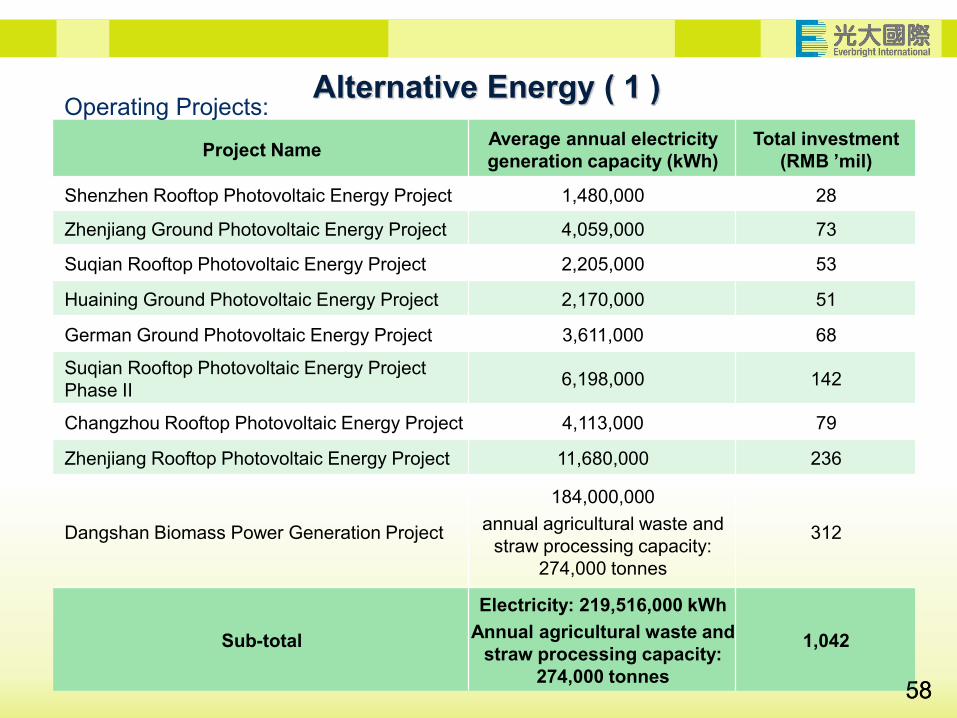
58
Project Name Average annual electricity generation capacity (kWh)
Total investment (RMB ’mil)
Shenzhen Rooftop Photovoltaic Energy Project 1,480,000 28
Zhenjiang Ground Photovoltaic Energy Project 4,059,000 73
Suqian Rooftop Photovoltaic Energy Project 2,205,000 53
Huaining Ground Photovoltaic Energy Project 2,170,000 51
German Ground Photovoltaic Energy Project 3,611,000 68
Suqian Rooftop Photovoltaic Energy Project Phase II 6,198,000 142
Changzhou Rooftop Photovoltaic Energy Project 4,113,000 79
Zhenjiang Rooftop Photovoltaic Energy Project 11,680,000 236
Dangshan Biomass Power Generation Project
184,000,000 annual agricultural waste and
straw processing capacity: 274,000 tonnes
312
Sub-total
Electricity: 219,516,000 kWh Annual agricultural waste and
straw processing capacity: 274,000 tonnes
1,042
Operating Projects: Alternative Energy ( 1 )
58
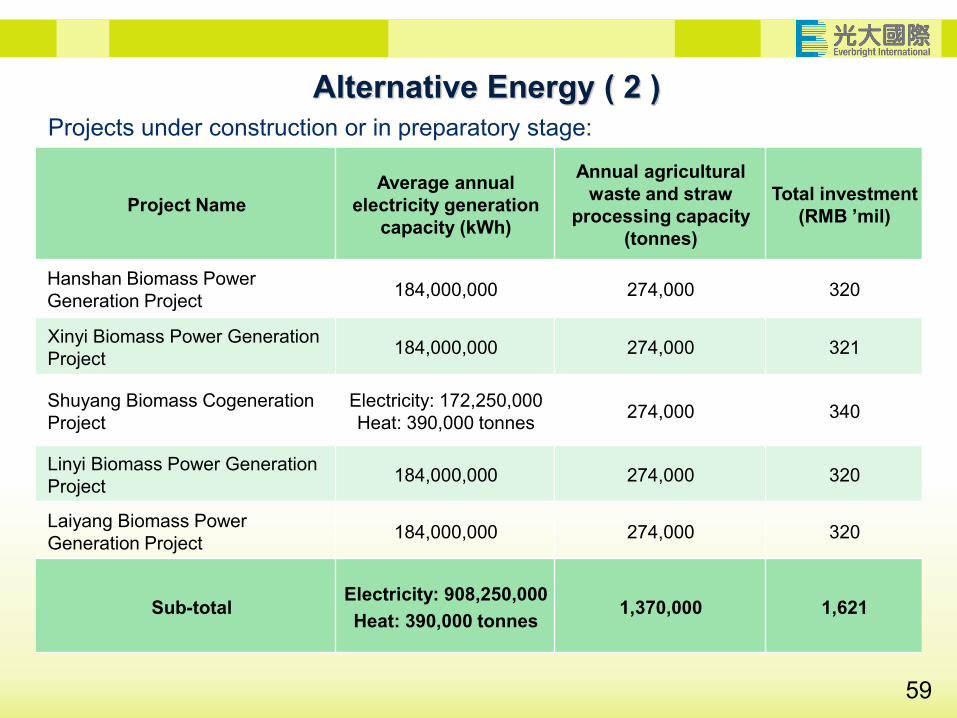
59
Project Name Average annual
electricity generation capacity (kWh)
Annual agricultural waste and straw
processing capacity (tonnes)
Total investment (RMB ’mil)
Hanshan Biomass Power Generation Project 184,000,000 274,000 320
Xinyi Biomass Power Generation Project 184,000,000 274,000 321
Shuyang Biomass Cogeneration Project
Electricity: 172,250,000 Heat: 390,000 tonnes 274,000 340
Linyi Biomass Power Generation Project 184,000,000 274,000 320
Laiyang Biomass Power Generation Project 184,000,000 274,000 320
Sub-total Electricity: 908,250,000 Heat: 390,000 tonnes 1,370,000 1,621
Projects under construction or in preparatory stage: Alternative Energy ( 2 )
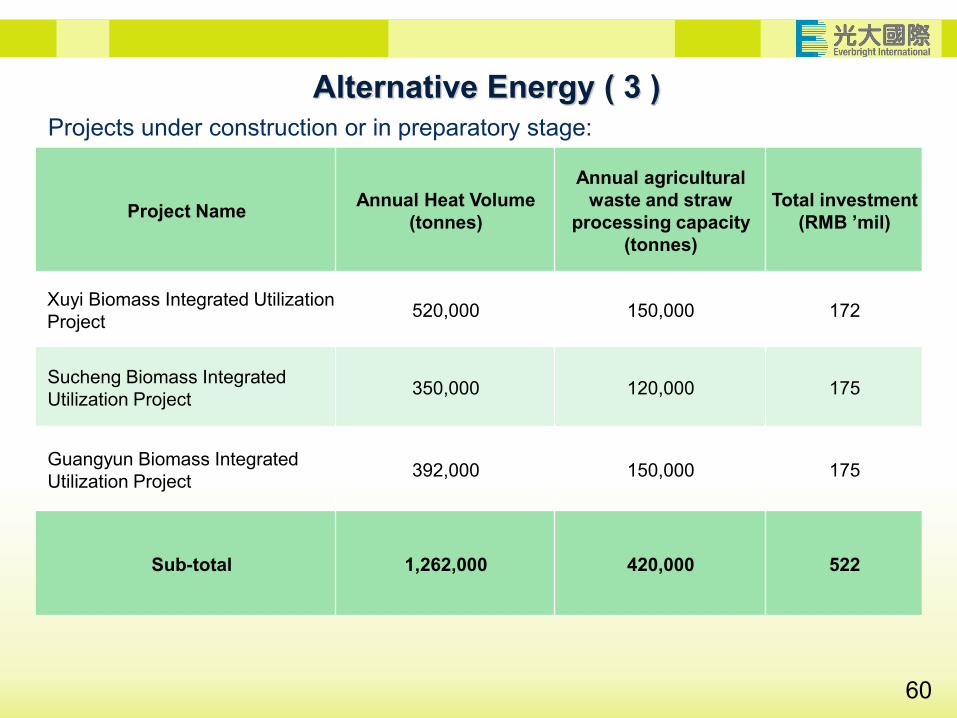
60
Project Name Annual Heat Volume (tonnes)
Annual agricultural waste and straw
processing capacity (tonnes)
Total investment (RMB ’mil)
Xuyi Biomass Integrated Utilization Project 520,000 150,000 172
Sucheng Biomass Integrated Utilization Project 350,000 120,000 175
Guangyun Biomass Integrated Utilization Project 392,000 150,000 175
Sub-total 1,262,000 420,000 522
Projects under construction or in preparatory stage: Alternative Energy ( 3 )
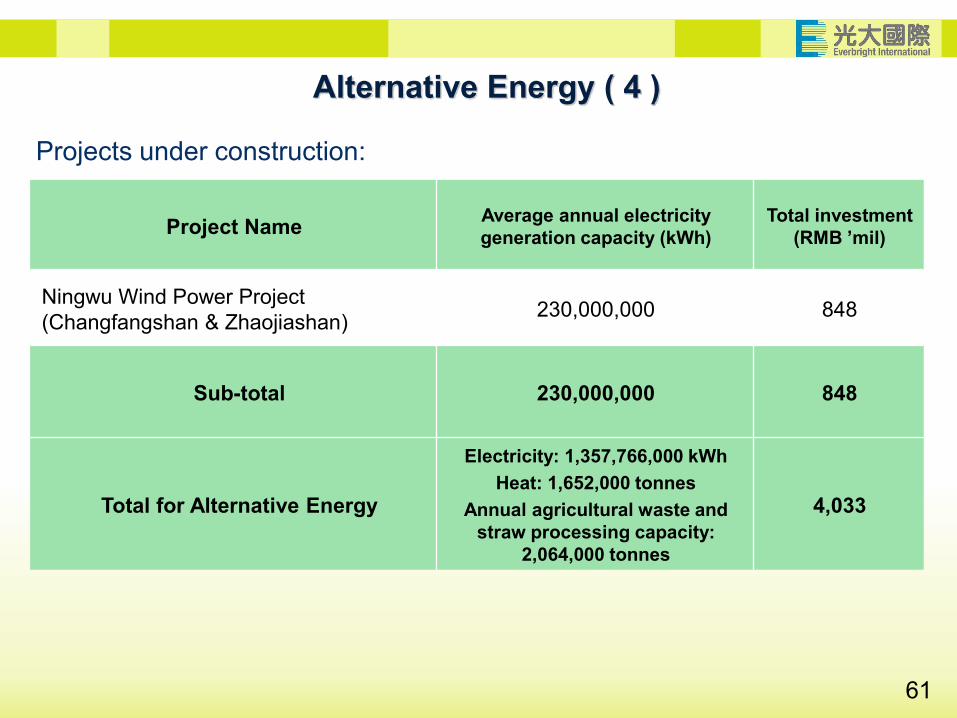
61
Project Name Average annual electricity generation capacity (kWh)
Total investment (RMB ’mil)
Ningwu Wind Power Project (Changfangshan & Zhaojiashan) 230,000,000 848
Sub-total 230,000,000 848
Total for Alternative Energy
Electricity: 1,357,766,000 kWh Heat: 1,652,000 tonnes
Annual agricultural waste and straw processing capacity:
2,064,000 tonnes
4,033
Projects under construction:
Alternative Energy ( 4 )
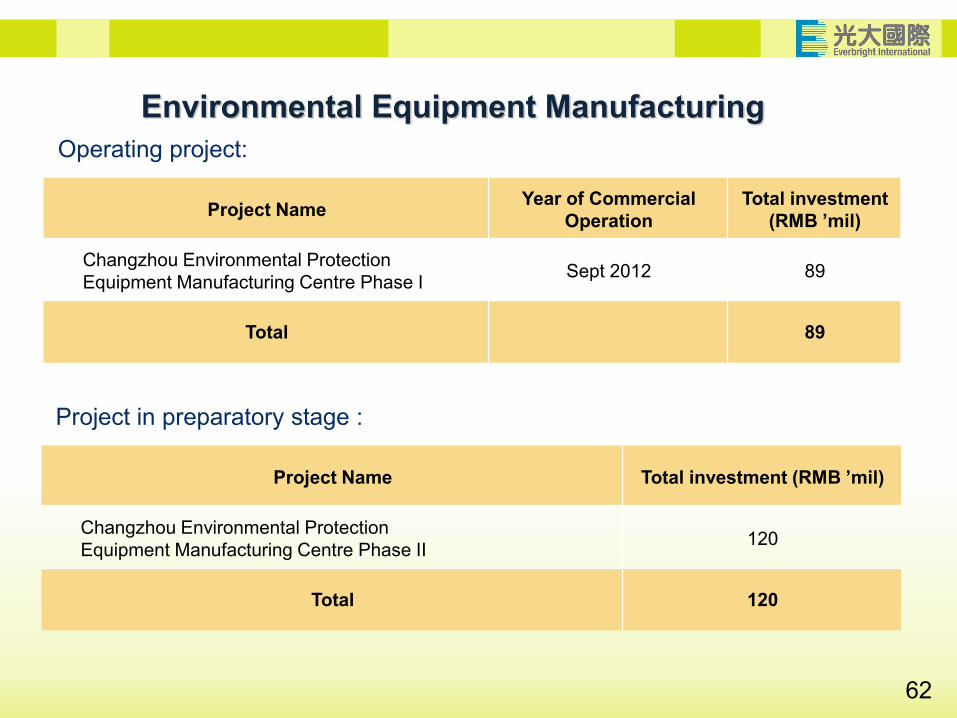
62
Project Name Year of Commercial Operation
Total investment (RMB ’mil)
Changzhou Environmental Protection Equipment Manufacturing Centre Phase I Sept 2012 89
Total 89
Environmental Equipment Manufacturing Operating project:
Project Name Total investment (RMB ’mil)
Changzhou Environmental Protection Equipment Manufacturing Centre Phase II 120
Total 120
Project in preparatory stage :