do women shy away from competition do men compete...
TRANSCRIPT

DO WOMEN SHY AWAY FROM COMPETITION? DO MEN COMPETE TOO MUCH?
Muriel Niederle and Lise Vesterlund
February 21, 2006
Abstract
We explore whether women and men differ in their selection into competitive environments. Participants perform a real task under a non-competitive piece rate and a competitive tournament scheme, and subsequently select which of the two they want to apply to future performances. Although there are no gender differences in performance, twice as many men as women choose the tournament over the piece rate. Performance cannot explain this tournament-entry gap. Instead it is explained by men being relatively more overconfident, and by gender differences in preferences for performing in a competition. Risk and feedback aversion play negligible roles.
Muriel Niederle: Department of Economics, Stanford University and NBER, http://www.stanford.edu/~niederle, and Lise Vesterlund: Department of Economics, University of Pittsburgh, http://www.pitt.edu/~vester. We thank Scott Kinross, who conducted all the experiments reported in this paper, for his excellent research assistance. We also thank Liran Einav, Jean Francois Richard, Al Roth and Carmit Segal for comments, and we are grateful to the NSF for generous support.

1
I. INTRODUCTION A series of psychology studies suggest that males are more competitive than females.
While boys spend most of their time at competitive games, girls select activities where there is
no winner and no clear end point. This difference increases through puberty, and by adulthood
more men than women describe themselves as competitive (see Campbell, 2002, for a review
of the literature).
If gender differences in competitive attitudes cause men and women to select different
jobs then it may have substantial impacts on labor market outcomes. The objective of this
paper is to investigate if, when holding other job characteristics constant, men and women
differ in the type of compensation they prefer to receive for their work. Specifically we
examine if more women than men prefer to work under a non-competitive piece rate than
under a competitive tournament compensation. A natural explanation for potential gender
differences in compensation choices may be ability differences. If men perform better in
competitive environments than women, then we would expect them to make different choices.1
Thus from an economic perspective the question of interest is not simply whether
compensation choices differ by gender, but whether they differ for equally able men and
women.
Finding that compensation choices differ conditional on performance may help explain
why so few women hold competitive high profile jobs. Bertrand and Hallock (2001) find that
only 2.5 percent of the five highest paid executives in a large data set of U.S. firms are women.
Ability differences can only account for part of this occupational difference and common
explanations for the remaining difference include preferences and discrimination. Women may
not select into top level jobs because they do not enjoy the responsibilities associated with a
managerial position. Or they may avoid these jobs because they tend to have long work hours,
which may conflict with the desire or necessity for child rearing. Second, discrimination or
anticipated discrimination may cause women and men with equal abilities to hold different
occupations.2
Our study helps determine if gender differences in competitive attitudes may be yet
another explanation for the absence of women in top level positions. Using experimental
1 Gneezy, Niederle and Rustichini [2003] examine gender differences in competitive behaviors and find that when solving mazes there is no gender difference in performance under the piece rate, but men outperform women in winner-take-all competitions. See also Gneezy and Rustichini [2004] and Larson [2005]. 2 See Black and Strahan [2001], Goldin and Rouse [2000], Altonji and Blank [1999] and references therein.

2
methods we examine individual choices between competitive and non-competitive
compensations in a non-discriminatory environment, where we can control for ability
differences and secure that the workload is the same under both compensations. Thus we
investigate whether men and women on a level playing field are equally likely to enter a
competitive tournament. If women are less likely to compete, this not only reduces the number
of women who enter tournaments, but also those who win tournaments. Hence it decreases the
chances of women succeeding in competition for promotions and more lucrative jobs.
To determine whether there is a gender difference in compensation choices we have
groups of 2 women and 2 men perform a real task, namely adding up sets of five two-digit
numbers for five minutes.3 Participants first perform the task under a piece-rate compensation
and then under a tournament. While they are informed of their absolute performance after each
task, they do not receive any feedback on their relative performance. Having experienced both
compensations, participants then choose which of the two they want to apply to their
performance of the next task, either a piece rate or a tournament.
Despite there being no gender difference in performance under either compensation we
find that twice as many men as women select the tournament. While 73% of men prefer the
tournament this choice is only made by 35% of the women. Performance cannot explain this
gender difference and is generally a poor predictor of the participant’s tournament-entry
decision. Thus, men and women with equal performance differ in their compensation choices.
While low ability men enter the tournament too much, high ability women do not enter it
enough.
We consider a number of possible explanations to understand what may give rise to
such gender differences in tournament entry. One explanation is simply that preferences for
performing in a competitive environment differ across genders. Other more general
explanations are that women may be more reluctant to enter the tournament if they are less
confident in their relative ability, more averse to risk, or if they are more reluctant to be in
environment where they receive feedback on their relative performance. We determine the
extent to which these potential differences can explain the gender gap in tournament entry.
3 To determine the cause of possible gender differences in compensation choice (between a competitive and a non-competitive payment scheme) we opt for a task where we expect no gender differences in performance under either of the two schemes. Gneezy, Niederle and Rustichini (2003) demonstrate that this will not be the case for all tasks.

3
In investigating the role played by beliefs about relative performance we find that men
are significantly more overconfident than women. However, although relative-performance
beliefs help predict entry decisions, gender differences in believed ranking only account for a
small share of the gap in tournament entry.
We also determine if absent the thrill or fear of performing in a competition, general
factors such as overconfidence, risk and feedback aversion can cause a gender gap in
compensation choices. We find that combined such factors do cause men and women of equal
performance to select different compensations, however it appears that this difference is
explained by gender differences in overconfidence, while risk and feedback aversion play a
negligible role.
Finally controlling for gender differences in general factors such as overconfidence,
risk and feedback aversion, we estimate the size of the residual gender difference in the
tournament-entry decision. Including these controls gender differences are still significant and
large. Hence we conclude that a sizeable part of the gender difference in tournament entry is
explained by men and women having different preferences for performing in a competitive
environment.
We first present a brief discussion of the factors that may cause women and men to
make different compensation choices. We then present our experimental design. The empirical
results are presented in sections IV and V. In Section IV we determine if conditional on
performance the compensation choices of women and men differ, then in Section V we
consider alternative explanations for such differences. We report only the most important of
our results and refer the interested reader to Niederle and Vesterlund (2005) for a more
extensive analysis of the data. Finally, Section VI concludes and discusses the results in
connection to the existing literature. II. THEORY
Based on previous gender studies on competitive attitudes we suspect that fewer
women than men will select a competitive over a non-competitive environment. If
compensation choices differ when we control for performance differences, then we have to
examine what the cause of such differences may be. We consider four different explanations.
Explanation 1: Men enter the tournament more than women because they like to
compete. Women may be more reluctant to enter a competitive environment, simply because

4
they dislike performing when they are competing against others. While the prospect of
engaging in future competition may cause women to anticipate a psychic cost and deter them
from tournaments, men may anticipate a psychic benefit and instead be drawn to them.4
A number of factors can be used to explain why women, in contrast to men, may dislike
performing in a competition. First, preferences may reflect the way girls and boys are raised.
While aggressive behavior by boys frequently is accepted, girls are often encouraged to be nice
and share. Second, the cause may be more one of nature than nurture. Evolutionary psychology
provides two explanations for why men may have evolved to engage in competition. Both are
tied to the reproductive strategies of the two sexes. One argues that since the potential gain in
reproductive success from winning a competition is much greater for men, they have evolved
to be more competitive than women [Daly and Wilson, 1983]. The other explanation focuses
on one gender being responsible for parental care. While a man’s death does not influence his
current reproductive success, a woman’s death may cause the loss of her current offspring
[Campbell, 2002]. Thus potential losses rather than potential gains from competition may
explain why men are more competitive.
While these explanations shed light on why women may not like to compete, they are
also used to explain why men often are more confident in their relative performance, less risk
averse and less averse to receiving feedback on relative performance. Such gender differences
may also influence tournament-entry decisions.
Explanation 2: Men enter the tournament more than women because they are more
overconfident. Psychologists typically find that while both men and women are overconfident
about their relative performance, men tend to be more overconfident than women [ e.g.,
Lichtenstein, Fischhoff and Phillips, 1982, Beyer, 1990, and Beyer and Bowden, 1997]. If in
our experiment men are more optimistic about their relative performance then the probability
of selecting the competition is expected to be larger for a man than a woman with the same
performance.
Note however that gender differences in overconfidence are task dependent and are
primarily found in masculine tasks. For example, Lundeberg et al. [1994] argue that the reason
why Lichtenstein and Fishhoff [1981] do not find gender differences in confidence on general
4 While “psychic” costs and benefits of a tournament may affect entry, it need not affect tournament performance.

5
knowledge is because it is not in the masculine domain. Thus depending on the perception of
our addition task our study may or may not reveal a gender difference in confidence.
Explanation 3: Men enter the tournament more than women because they are less risk
averse. As tournaments involve uncertain payoffs, potential gender differences in risk attitudes
are likely to also affect the compensation choice. As argued by Wilson and Daly [1985] the
greater variance in male reproductive success caused men to evolve as the less risk averse of
the two genders.5 Since evidence of risk-seeking behavior in any domain can serve to
intimidate potential competitors it is argued that the male taste for risk extends beyond direct
competitions over mating opportunities. Indeed past studies examining gender differences in
risk attitudes over monetary gambles find either that women are more risk averse than men or
that there is no gender difference.6
Explanation 4: Men enter the tournament more than women because they are less averse
to feedback. Women tend to be more sensitive to performance feedback than men. While men
selectively accept positive feedback and reject negative feedback, women respond to both [e.g.,
Roberts and Nolen-Hoeksema, 1989]. If women, in contrast to men, view a loss in a
competition as reflecting low ability, then they may be less likely to enter environments where
such performance feedback is provided.
Our experiment is designed to shed light on the role played by these alternative
explanations. Of particular interest is whether potential gender differences in tournament entry
is explained by general factors such as overconfidence, risk and feedback aversion
(Explanations 2-4), or if part of such a difference also is accounted for by preference
differences for performing in a competition (Explanation 1). What distinguishes Explanation 1
from the three general explanations is that it relies critically on the tournament-entry decision
resulting in performance in a competition. To distinguish between these two types of
explanations we therefore examine compensation choices when they do not involve a future 5 While the record for largest number of children is 69 for a woman it is 888 for a man. Note that the risk of loosing one’s current off-spring cause similar gender differences in risk attitudes. Campbell [2002] argues men’s willingness to take risk is not caused by sensation seeking, but rather by an absence of fear for risk. 6 Eckel and Grossman [2002a] find gender differences in choice of lotteries, and Eckel and Grossman [2002b] summarize the literature on gender differences in risk taking. The psychology literature is summarized in Byrnes, Miller and Shafer [1999]. They provide a meta-analysis of 150 risk experiments and find that women are significantly more averse to risk.
6
performance and instead are made for a past performance. This allows us to determine first
whether the three general explanations by themselves cause gender differences in
compensation choices, and second using compensation choices for past performances as a
control for the three general explanations in the tournament-entry decision, we can assess the
validity of Explanation 1. Thus, we determine if it is the subsequent performance in a
competitive environment that drives women away from and draw men to the competition.
Finally, to determine the potential role played by gender differences in overconfidence we also
elicit the participants’ beliefs on relative performance.
III. EXPERIMENTAL DESIGN We conduct an experiment in which participants solve a real task, first under a non-
competitive piece-rate compensation and then a competitive tournament compensation.
Participants are then asked to select which of these two compensations they want to apply to
their next performance. This provides participants with experience of both compensation
forms, and it enables us to determine if equally able men and women make similar
compensation choices.
The task of our experiment is to add up sets of five 2-digit numbers. Participants are not
allowed to use a calculator, but may write numbers down on scratch paper. The numbers are
randomly drawn and each problem is presented in the following way:
21 35 48 29 83
Once the participant submits an answer on the computer, a new problem appears jointly with
information on whether the former answer was correct.7 A record of the number of correct and
wrong answers is kept on the screen. Participants have 5 minutes in which they may solve as
many problems as they can. We selected this 5-minute addition task because it requires both
skill and effort, and because research suggests that there are no gender differences in ability on
easy math tests.8 It is attractive to study a task for which men and women have similar
7 The program was written using the software zTree [Fischbacher 1999]. 8 While males often score better on abstract math problems there is no gender difference in arithmetic or algebra performance, women tend to score better than men on computational problems (see Hyde, Fennema, and Lamon, 1990, for a metaanalysis of 100 studies on gender differences in math performance).
7
performances because it enables us to better rule out ability differences as an explanation for
gender differences in tournament entry.
The experiment was conducted at the University of Pittsburgh, using the PEEL subject
pool and standard recruiting procedures. Two or three groups of 4 participants, two women and
two men, participated in each session. Participants were seated in rows and informed that they
were grouped with the other people in their row. Thus, although gender was not discussed at
any time, they could see the other people in their group and determine their gender. A total of
20 groups participated in the experiment (80 participants).
Each participant received a $5 show-up fee, and an additional $7 for completing the
experiment. Participants were told that they would be asked to complete four tasks, and that
one of these tasks randomly would be chosen for payment at the end of the experiment. By
paying only for one task, we diminish the chance that decisions in a given task may be used to
hedge against outcomes in other tasks. Participants were informed of the nature of the tasks
only immediately before performing the task. While participants know their absolute
performance on a task, i.e., how many problems they solve correctly, they are not informed of
their relative performance until the end of the experiment and do not know if they performed
better or worse than the other participants in their group. The specific compensations and order
of tasks were as follows.
Task 1 – Piece Rate: Participants are given the 5-minute addition task. If task 1 is randomly
selected for payment, they receive 50 cents per correct answer.
Task 2 – Tournament: Participants are given the 5-minute addition task. If task 2 is randomly
selected for payment, the participant who solves the largest number of correct problems in the
group receives $2 per correct answer, while the other participants receive no payment (in case
of ties the winner is chosen randomly among the high scorers).
The tournament is designed so that for a given performance a participant with a 25%
chance of winning the tournament receives the same expected payoff from the tournament as
from the piece rate.9 In the third task participants once again are asked to perform the five-
9 By paying the tournament winner per correct problem we avoid the problem of choosing a high enough fixed prize to ensure that even high-performing participants benefit from entering the tournament.

8
minute addition task, but this time select which of the two compensations they want to apply to
their future performance.
Task 3 – Choice: Before performing the 5-minute addition task, participants select whether
they want to be paid according to a piece rate, i.e., 50 cents for each correct answer, or a
tournament. When the participant chooses tournament she receives $2 per correct answer if her
score in task 3 exceeds that of the other group members in task 2, otherwise she receives no
payment (in case of ties the winner is chosen randomly).
Winners of the task-3 tournament are determined based on the comparison relative to
the other group members’ task-2 rather than task-3 performance. One can think of this as
competing against other participants who already performed.10 This has several advantages;
first, the performance of a player who enters the tournament is evaluated against the
performance of participants who also performed under tournament compensation. Second,
while beliefs regarding relative performance in a tournament may affect the decision to enter
the tournament, beliefs regarding the choices of others will not. Thus we avoid a potential
source of error through biased beliefs about other participants’ choices.11 Finally, an advantage
of this design is that a participant’s choice does not affect the payment of any other
participant.12 Hence there are no externalities associated with tournament entry, and we can
rule out that women may shy away from competition because by winning the tournament they
impose a negative externality on others.13 Effectively in task 3 participants face an individual
decision problem which depends only on their ability to beat the task-2 performance of others
and their preference for performing in a tournament.
We present participants with one last task to determine if a potential gender gap in
tournament entry is caused by gender differences in preferences for performing in a
competitive environment, or if it is accounted for by general factors such as differences in
overconfidence, risk or feedback aversion. In the last task participants are subjected to a choice 10 Many sports competitions are not performed simultaneously, e.g., downhill skiing. 11 For example the odds of winning the competition would be greatly changed if men believed that women would not enter the tournament, causing them to face only one rather than three competitors. 12 Our design allows for the possibility that there is no winner among participants who choose the tournament (if none of those entering the tournament beat the high score of their opponents). Conversely, all participants can win the tournament, if everyone increases their performance beyond the highest task-2 performance in that group. 13 For a discussion on possible gender differences in altruism see e.g., Andreoni and Vesterlund [2001]. See Ledyard [1995] for gender differences in social dilemma and public good games, as well as Eckel and Grossman [2002c] and Croson and Gneezy [2005] for a review of gender differences in experimental settings.
9
which is similar to that of task 3, but without using a tournament performance, and without
having participants subsequently perform in a tournament.
Task 4 – Submit Piece Rate: Participants do not have to perform in this task. Rather if this
task is randomly selected for payment their compensation depends on the number of correct
answers they provided in the task-1 piece rate. Participants choose which compensation they
want to apply to their past piece-rate performance: a 50 cent piece rate or a tournament. They
win the tournament and receive $2 per correct answer if their task-1 piece-rate performance is
the highest of the participants in their group, otherwise they receive no payment (in case of ties
the winner is chosen randomly). Before making their choice, participants are reminded of their
task-1 piece-rate performance.
To remove any positive or negative associations from performing in a competition we
pay participants according to the task-1 piece rate, as opposed the task-2 tournament. As in the
task-3 choice a participant’s decision does not affect the earnings of any other participant, nor
does it depend on the entry decisions of others. Thus task 4 is also an individual-decision task.
This final task allows us to see whether gender differences in compensation choice
appear even when no future tournament performance is involved. That is, we can determine
whether general factors such as overconfidence, risk and feedback aversion (Explanations 2-4)
by themselves cause a gap in tournament entry. While these are all effects that are present in
the task-3 choice (and the task-4 choice), they are not unique to performing in a competition.
With this last decision as a control for such general factors we estimate whether there is an
additional gender difference when it comes to performing in a competition. That is, we test the
validity of Explanation 1.
Finally we elicit the participants’ beliefs on their relative performance to determine
how it influences compensation choices. We elicit these beliefs both for performances in task 1
and task 2, as these will help us determine not only whether gender differences in
overconfidence about tournament performance affect the decision to enter a tournament, but
also what role beliefs on relative performance in general may have on the task-4 decision.
These beliefs help us assess the role played by Explanation 2 relative to that of 3 and 4.
10
Belief-Assessment Questions: At the end of the experiment participants are asked to guess
their rank in the task-1 piece rate and the task-2 tournament. Each participant picks a rank
between 1 and 4, and is paid $1 for each correct guess.14
At the end of the experiment, a number from 1 to 4 is drawn to determine which of the four
tasks is selected for earnings. The experiment lasted about 45 minutes, and participants earned
on average $19.80.
IV. BASIC EXPERIMENTAL RESULTS The objective of this section is to examine whether, conditional on performamce,
women and men differ in their preference for performing under a piece-rate versus a
tournament scheme. To eliminate ability differences as an explanation for potential gender
differences in tournament entry, we selected a task for which we anticipated that women and
men would have similar performances under the two compensations. We start by determining
whether we succeeded in selecting such a task. We then examine the participants’
compensation choices, and determine if they differ conditional on performance.
A. Performance Differences
As expected we find no gender difference in performance under the piece rate or under
the tournament. In the piece rate the average number of problems solved is 10.15 for women
and 10.68 for men. Using a two-sided t-test this difference is not significant (p=0.459). The
gender difference in performance is also insignificant in the tournament where on average
women correctly solve 11.8 problems, and men 12.1 (two-sided p=0.643). Throughout the
paper the reported test statistics refer to two-sided t-test, unless otherwise noted. There are no
cases in which the conclusions of the reported t-test differ from those of a Mann-Whitney test.
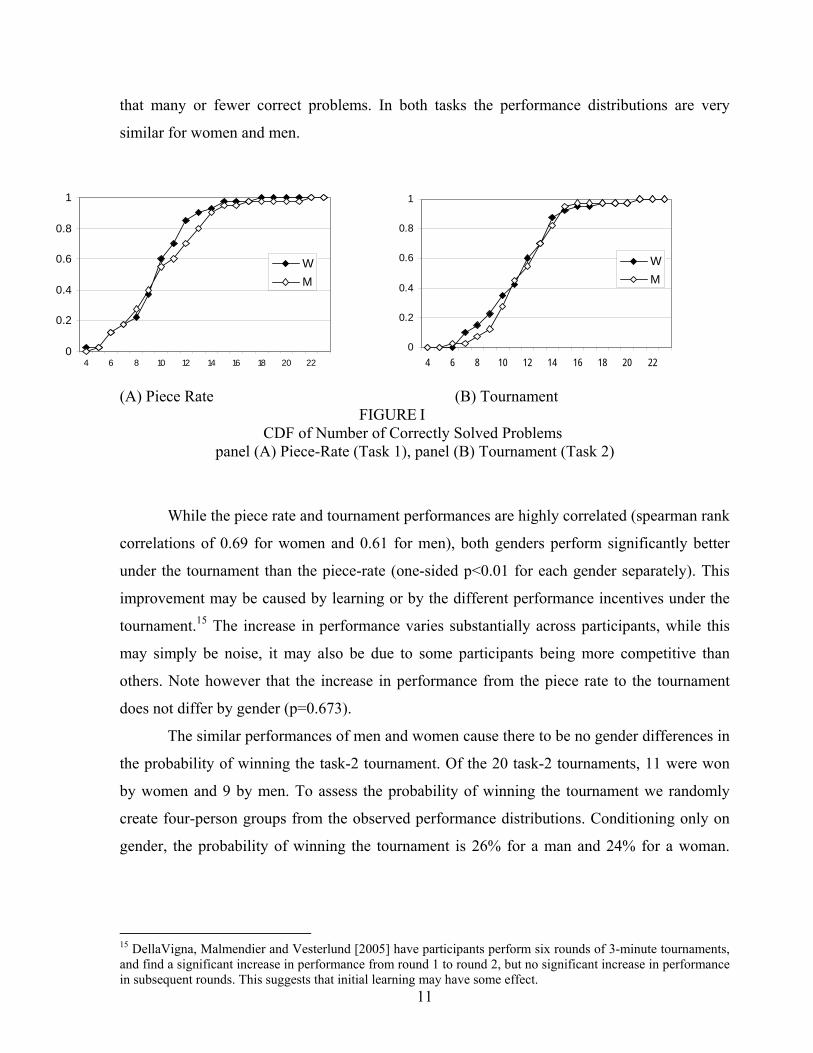
The cumulative distributions for the number of correct answers in the piece-rate (task
1) and the tournament (task 2) are shown in panel (A) and (B) of Figure I, respectively. For
every performance level the distributions show the proportion of women and men who solved
14 In case of ties in the actual ranks, we counted every answer that could be correct as correct. For example, if the performance in the group was 10, 10, 11, 11, then an answer of last and third was correct for a score of 10, and an answer of best and second was correct for a score of 11.
11
that many or fewer correct problems. In both tasks the performance distributions are very
similar for women and men.
0
0.2
0.4
0.6
0.8
1
4 6 8 10 12 14 16 18 20 22
WM
0
0.2
0.4
0.6
0.8
1
4 6 8 10 12 14 16 18 20 22
WM
(A) Piece Rate (B) Tournament
FIGURE I CDF of Number of Correctly Solved Problems
panel (A) Piece-Rate (Task 1), panel (B) Tournament (Task 2)
While the piece rate and tournament performances are highly correlated (spearman rank
correlations of 0.69 for women and 0.61 for men), both genders perform significantly better
under the tournament than the piece-rate (one-sided p<0.01 for each gender separately). This
improvement may be caused by learning or by the different performance incentives under the
tournament.15 The increase in performance varies substantially across participants, while this
may simply be noise, it may also be due to some participants being more competitive than
others. Note however that the increase in performance from the piece rate to the tournament
does not differ by gender (p=0.673).
The similar performances of men and women cause there to be no gender differences in
the probability of winning the task-2 tournament. Of the 20 task-2 tournaments, 11 were won
by women and 9 by men. To assess the probability of winning the tournament we randomly
create four-person groups from the observed performance distributions. Conditioning only on
gender, the probability of winning the tournament is 26% for a man and 24% for a woman.
15 DellaVigna, Malmendier and Vesterlund [2005] have participants perform six rounds of 3-minute tournaments, and find a significant increase in performance from round 1 to round 2, but no significant increase in performance in subsequent rounds. This suggests that initial learning may have some effect.
12
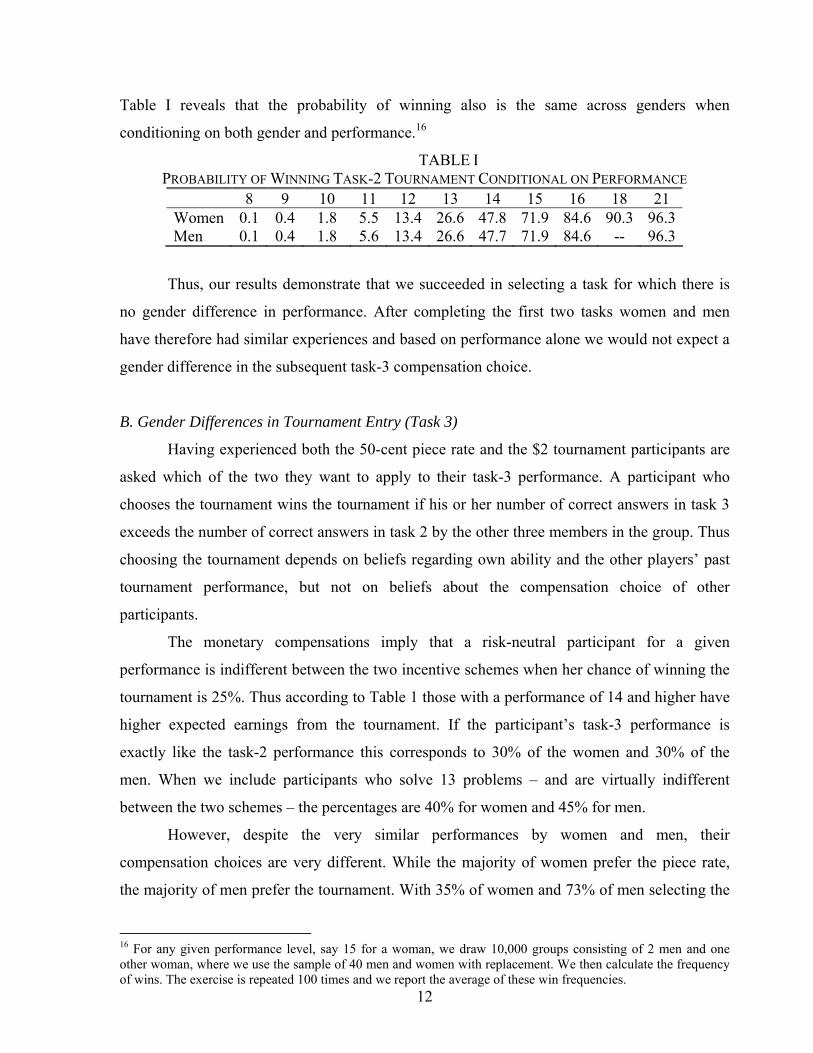
Table I reveals that the probability of winning also is the same across genders when
conditioning on both gender and performance.16
TABLE I PROBABILITY OF WINNING TASK-2 TOURNAMENT CONDITIONAL ON PERFORMANCE
8 9 10 11 12 13 14 15 16 18 21 Women 0.1 0.4 1.8 5.5 13.4 26.6 47.8 71.9 84.6 90.3 96.3Men 0.1 0.4 1.8 5.6 13.4 26.6 47.7 71.9 84.6 -- 96.3
Thus, our results demonstrate that we succeeded in selecting a task for which there is
no gender difference in performance. After completing the first two tasks women and men
have therefore had similar experiences and based on performance alone we would not expect a
gender difference in the subsequent task-3 compensation choice.
B. Gender Differences in Tournament Entry (Task 3)
Having experienced both the 50-cent piece rate and the $2 tournament participants are
asked which of the two they want to apply to their task-3 performance. A participant who
chooses the tournament wins the tournament if his or her number of correct answers in task 3
exceeds the number of correct answers in task 2 by the other three members in the group. Thus
choosing the tournament depends on beliefs regarding own ability and the other players’ past
tournament performance, but not on beliefs about the compensation choice of other
participants.
The monetary compensations imply that a risk-neutral participant for a given
performance is indifferent between the two incentive schemes when her chance of winning the
tournament is 25%. Thus according to Table 1 those with a performance of 14 and higher have
higher expected earnings from the tournament. If the participant’s task-3 performance is
exactly like the task-2 performance this corresponds to 30% of the women and 30% of the
men. When we include participants who solve 13 problems – and are virtually indifferent
between the two schemes – the percentages are 40% for women and 45% for men.
However, despite the very similar performances by women and men, their
compensation choices are very different. While the majority of women prefer the piece rate,
the majority of men prefer the tournament. With 35% of women and 73% of men selecting the
16 For any given performance level, say 15 for a woman, we draw 10,000 groups consisting of 2 men and one other woman, where we use the sample of 40 men and women with replacement. We then calculate the frequency of wins. The exercise is repeated 100 times and we report the average of these win frequencies.
13
tournament, we find a significant and substantial gender gap in tournament entry (a Fisher’s
exact test yields p=0.002). Next we examine whether similar differences are found when we
condition on the participant’s performance.
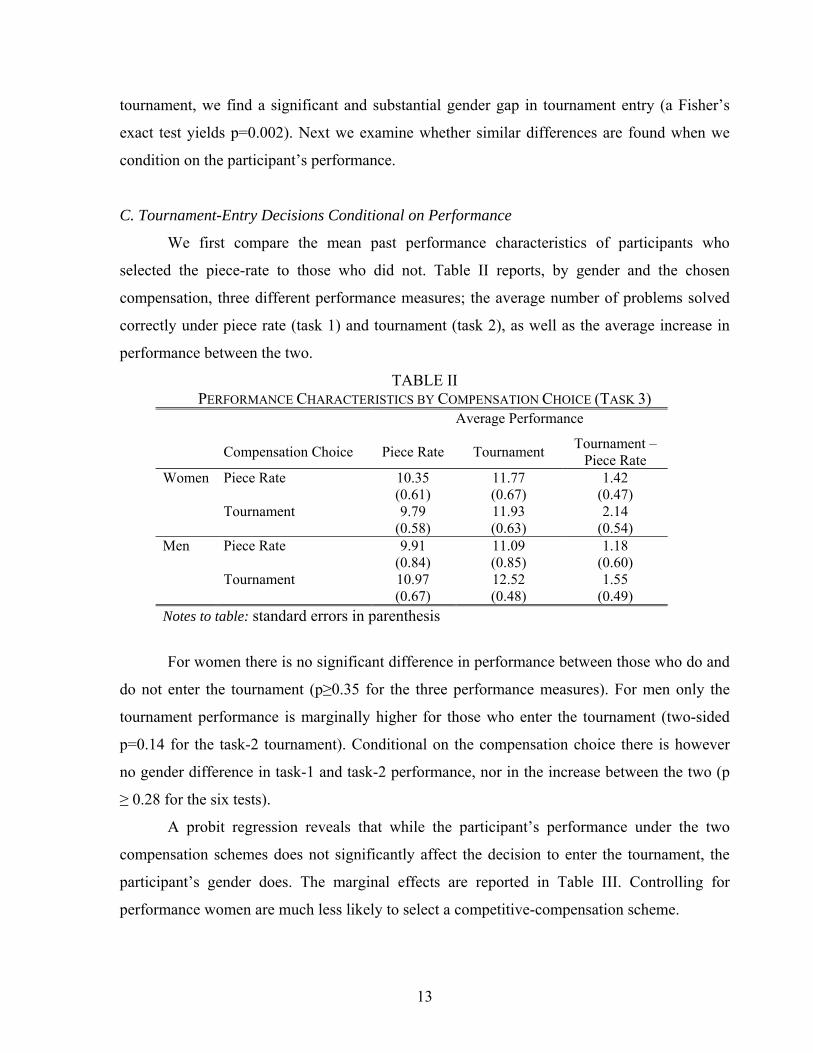
C. Tournament-Entry Decisions Conditional on Performance
We first compare the mean past performance characteristics of participants who
selected the piece-rate to those who did not. Table II reports, by gender and the chosen
compensation, three different performance measures; the average number of problems solved
correctly under piece rate (task 1) and tournament (task 2), as well as the average increase in
performance between the two.
TABLE II PERFORMANCE CHARACTERISTICS BY COMPENSATION CHOICE (TASK 3)
Average Performance
Compensation Choice Piece Rate Tournament Tournament – Piece Rate
Women Piece Rate 10.35 (0.61)
11.77 (0.67)
1.42 (0.47)
Tournament 9.79 (0.58)
11.93 (0.63)
2.14 (0.54)
Men Piece Rate 9.91 (0.84)
11.09 (0.85)
1.18 (0.60)
Tournament 10.97 (0.67)
12.52 (0.48)
1.55 (0.49)
Notes to table: standard errors in parenthesis
For women there is no significant difference in performance between those who do and
do not enter the tournament (p≥0.35 for the three performance measures). For men only the
tournament performance is marginally higher for those who enter the tournament (two-sided
p=0.14 for the task-2 tournament). Conditional on the compensation choice there is however
no gender difference in task-1 and task-2 performance, nor in the increase between the two (p
≥ 0.28 for the six tests).
A probit regression reveals that while the participant’s performance under the two
compensation schemes does not significantly affect the decision to enter the tournament, the
participant’s gender does. The marginal effects are reported in Table III. Controlling for
performance women are much less likely to select a competitive-compensation scheme.

14
TABLE III PROBIT OF TOURNAMENT CHOICE
Female Tournament Tournament – piece rate Coefficicent -0.380 0.015 0.015 p-value (0.01) (0.41) (0.50) Notes to table: Dependent variable: task-3 compensation choice (1-tournament and 0-piece rate). Tournament refers to task-2 performance, Tournament – Piece Rate to the change in performance between task-2 and task-1. The table presents marginal effects evaluated at a man with 13 correct answers in the tournament and 12 in the piece rate.17
A possible explanation for the observed gender difference in compensation choice may
be that there is a gender difference in performance following the choice – and that our
participants correctly anticipate such a difference. However we find that the results from task-3
performance parallel those of performance before the compensation choice. Conditional on
gender the performance in task-3 does not differ between those who do and do not enter the
tournament (p ≥ 0.288). Similarly, the participants who enter the tournament do not have a
significantly different increase in performance in the choice task (task 3) relative to the former
(task 2) tournament (p ≥ 0.88). Thus, not only is it not true that only participants with a high
past performance enter the tournament, it is also not true that those who entered the tournament
performed better than those who did not. As for performance before the tournament-entry
decision we find that performance in task-3 cannot explain the gender gap in tournament
entry.18
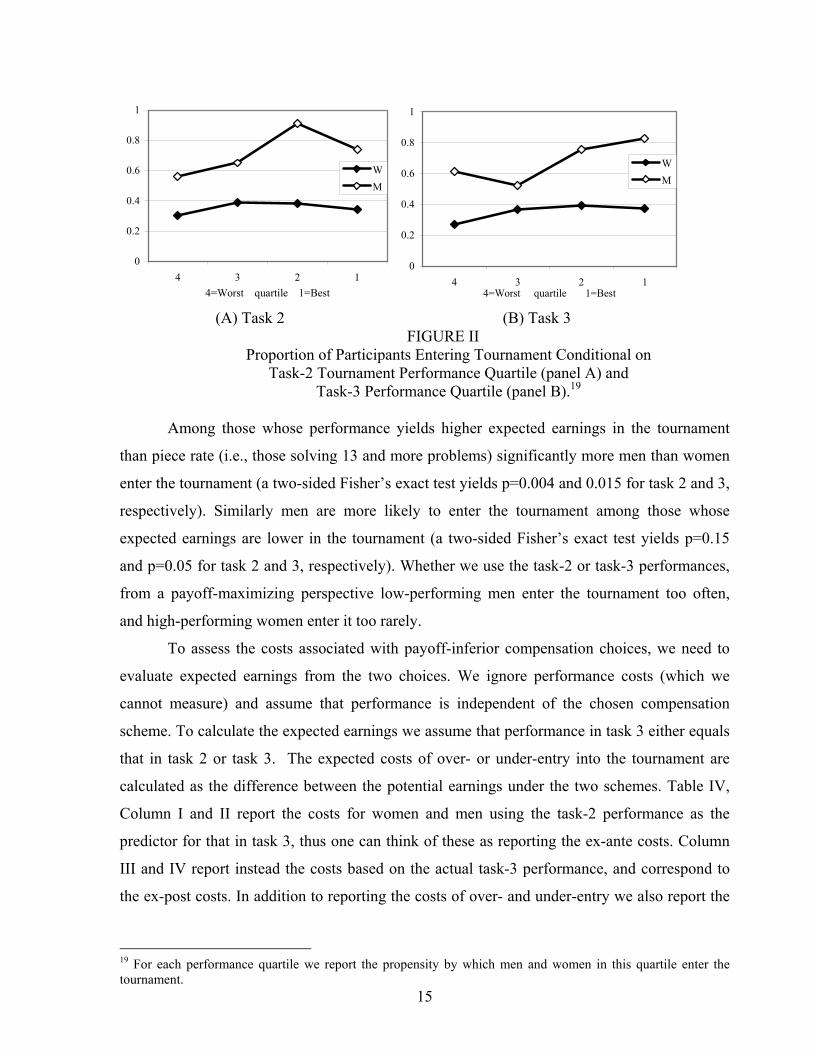
Figure II shows the proportion of women and men who enter the tournament
conditional on their performance quartile in task 2 and task 3, panel A and B, respectively. In
both cases performance has only a small, if any, effect on tournament entry, and for every
performance level men are more likely to enter the tournament. Independent of the task we see
that even women in the highest performance quartile have a lower propensity to enter the
tournament than men in the lowest performance quartile.
17 This evaluation point is selected because a risk-neutral individual solving 13 problems in the tournament is indifferent towards entering the tournament. The average piece-rate performance for this group was 12. 18 A probit analysis of the tournament-entry decision yields marginal effects -0.357 on female (s.e. 0.106, p=0.00) and 0.015 on task-3 performance (s.e. 0.014, p=0.31) evaluated at a man with 13 correct answers in task 3.
15
0
0.2
0.4
0.6
0.8
1
4 3 2 14=Worst quartile 1=Best
WM
0
0.2
0.4
0.6
0.8
1
4 3 2 14=Worst quartile 1=Best
WM
(A) Task 2 (B) Task 3
FIGURE II Proportion of Participants Entering Tournament Conditional on
Task-2 Tournament Performance Quartile (panel A) and Task-3 Performance Quartile (panel B).19
Among those whose performance yields higher expected earnings in the tournament
than piece rate (i.e., those solving 13 and more problems) significantly more men than women
enter the tournament (a two-sided Fisher’s exact test yields p=0.004 and 0.015 for task 2 and 3,
respectively). Similarly men are more likely to enter the tournament among those whose
expected earnings are lower in the tournament (a two-sided Fisher’s exact test yields p=0.15
and p=0.05 for task 2 and 3, respectively). Whether we use the task-2 or task-3 performances,
from a payoff-maximizing perspective low-performing men enter the tournament too often,
and high-performing women enter it too rarely.
To assess the costs associated with payoff-inferior compensation choices, we need to
evaluate expected earnings from the two choices. We ignore performance costs (which we
cannot measure) and assume that performance is independent of the chosen compensation
scheme. To calculate the expected earnings we assume that performance in task 3 either equals
that in task 2 or task 3. The expected costs of over- or under-entry into the tournament are
calculated as the difference between the potential earnings under the two schemes. Table IV,
Column I and II report the costs for women and men using the task-2 performance as the
predictor for that in task 3, thus one can think of these as reporting the ex-ante costs. Column
III and IV report instead the costs based on the actual task-3 performance, and correspond to
the ex-post costs. In addition to reporting the costs of over- and under-entry we also report the
19 For each performance quartile we report the propensity by which men and women in this quartile enter the tournament.
16
number of people who, in expectation, for a given performance would have been better off
making a different choice.
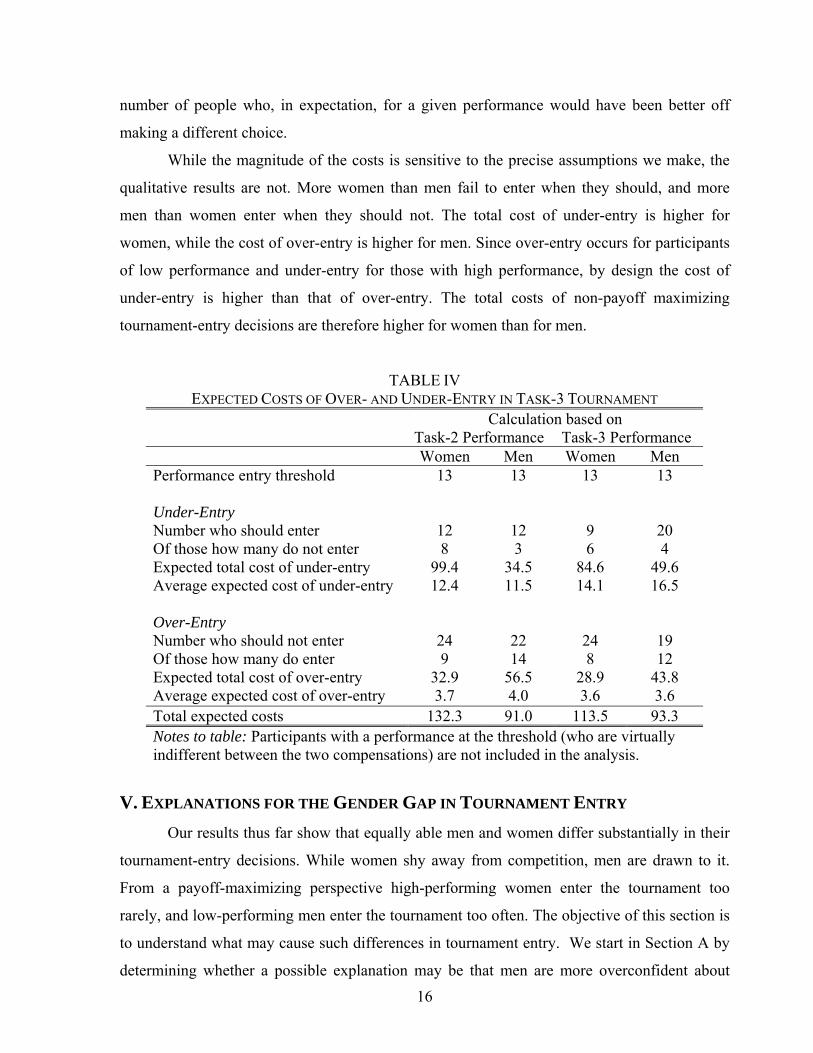
While the magnitude of the costs is sensitive to the precise assumptions we make, the
qualitative results are not. More women than men fail to enter when they should, and more
men than women enter when they should not. The total cost of under-entry is higher for
women, while the cost of over-entry is higher for men. Since over-entry occurs for participants
of low performance and under-entry for those with high performance, by design the cost of
under-entry is higher than that of over-entry. The total costs of non-payoff maximizing
tournament-entry decisions are therefore higher for women than for men.
TABLE IV EXPECTED COSTS OF OVER- AND UNDER-ENTRY IN TASK-3 TOURNAMENT
Calculation based on Task-2 Performance Task-3 Performance Women Men Women Men Performance entry threshold 13 13 13 13 Under-Entry Number who should enter 12 12 9 20 Of those how many do not enter 8 3 6 4 Expected total cost of under-entry 99.4 34.5 84.6 49.6 Average expected cost of under-entry 12.4 11.5 14.1 16.5 Over-Entry Number who should not enter 24 22 24 19 Of those how many do enter 9 14 8 12 Expected total cost of over-entry 32.9 56.5 28.9 43.8 Average expected cost of over-entry 3.7 4.0 3.6 3.6 Total expected costs 132.3 91.0 113.5 93.3 Notes to table: Participants with a performance at the threshold (who are virtually indifferent between the two compensations) are not included in the analysis.
V. EXPLANATIONS FOR THE GENDER GAP IN TOURNAMENT ENTRY Our results thus far show that equally able men and women differ substantially in their
tournament-entry decisions. While women shy away from competition, men are drawn to it.
From a payoff-maximizing perspective high-performing women enter the tournament too
rarely, and low-performing men enter the tournament too often. The objective of this section is
to understand what may cause such differences in tournament entry. We start in Section A by
determining whether a possible explanation may be that men are more overconfident about
17
their relative tournament performance. We then examine the broader set of explanations from
Section II. Specifically we aim to distinguish between the role played by gender differences in
preferences for performing in a competition, and the more general explanations such as gender
differences in overconfidence, risk and feedback aversion. While the first is unique to
performing in a competition, the latter three are not. Exploiting this difference task 4 helps
distinguish between these two types of explanations. Specifically, it asks participants to choose
between a competitive and a non-competitive compensation for their past piece-rate
performance. While this choice is very close to that of task 3, it eliminates the prospect of
having to subsequently perform in a competition. Thus compensation choices in task 4 cannot
be influenced by preference differences for performing in a competition.
Task 4 decisions can therefore be used to simultaneously assess whether gender
differences in general factors such as overconfidence, risk and feedback aversion by
themselves cause differences in compensation choices. We report on these in Section B. Then
in Section C we use task 4 as a control in the task-3 decision to determine if the act of
performing in a competition creates a gap in tournament entry that cannot be explained by
these general factors. That is, we examine if an explanation for the tournament-entry gap may
be that women, relative to men, do not like the pressure of performing in a competitive
environment.
A. Does Male Optimism about Relative Performance Explain the Tournament-Entry Gap?
Participants’ beliefs on relative tournament performance were elicited at the end of the
experiment by asking them to guess how their performance in task 2 ranked relative to the
other members of their group. Participants received $1 if their guess was correct, and in the
event of a tie they were compensated for any guess that could be deemed correct.20
We start by examining whether men and women of equal ability differ in their
assessment of their relative performance. We then ask whether these potential confidence
differences can account for the gender difference in tournament entry. That is, conditional on
beliefs about relative performance, are men and women equally likely to select the tournament.
A.1. Are Men More Optimistic About Their Relative Performance? 20 While the payment for the guessed rank is not very high, it still offers participants the opportunity of using their guess as a method of hedging against their tournament-entry decision. The strong positive correlation between elicited ranks and tournament entry (Figure III) suggests that hedging was not a dominant motive.
18
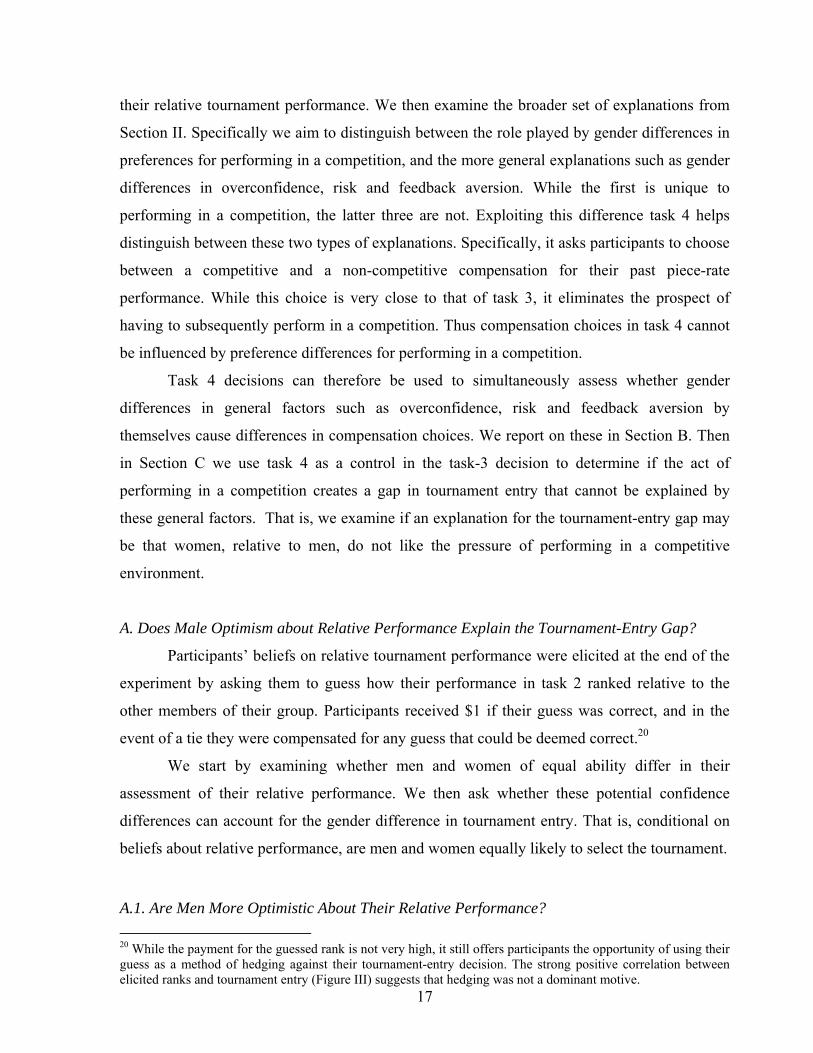
Participants who know the performance distributions of men and women will maximize
their payoffs by guessing that they ranked second or third.21 The elicited beliefs on relative
performance are substantially more optimistic. Table V shows the participants’ believed rank
distributions and the number of incorrect guesses.
TABLE V
DISTRIBUTION OF GUESSED TOURNAMENT RANK Men Women Guessed Rank Incorrect Guess Guessed Rank Incorrect Guess 1: Best 30 22 17 9 2 5 3 15 10 3 4 2 6 5 4: Worst 1 1 2 1 Total 40 28 40 25 Notes to table: Guessed rank out of four.
Relative to their actual rank both men and women appear overconfident. A Chi-square test of
independence between the distribution of guessed rank and actual rank yields p=0.0001 for
men and p=0.057 for women. However, men are more optimistic about their relative
performance: 75% of the men think they are best in their group of 4, compared to 43% of the
women. The guesses of women and men differ significantly from one another as do the
distributions of incorrect guesses, with men being more likely to incorrectly guess that they are
ranked first. A Chi-square test of independence of the distributions for men and women
delivers p=0.025 for guessed ranks and p=0.015 for incorrect guesses.
To determine whether women and men form different beliefs conditional on
performance, we use an ordered probit to estimate the guessed rank as a function of tournament
performance, the increase in performance and a female dummy. The results in Table VI reveal
that participants with a high tournament performance think they have higher relative
performance (and hence a lower rank), and that women are significantly less optimistic about
their relative ranking than men.22
21 Based on 10,000 artificially generated groups the likelihood of a woman being ranked first is 0.223, second 0.261, third 0.262, and last 0.255, the corresponding probabilities for a man for first is 0.243, second 0.288, third 0.278, and last 0.199. 22 The marginal effects evaluated at a guess of 1, for a man with a tournament performance of 13 and a piece-rate performance of 12, yields -0.26 on female (s.e. 0.1, p=0.01), 0.05 on tournament performance (s.e. 0.02, p=0.002) and 0.02 on tournament-piece rate (s.e. 0.02, p=0.30).

19
TABLE VI ORDERED PROBIT OF GUESSED TOURNAMENT RANK
Coefficient Standard Error p-value Female 0.75 0.30 0.01 Tournament -0.19 0.06 0.00 Tournament – Piece Rate -0.08 0.07 0.27 Notes to table: Ordered probit of guessed rank for guesses of ranks 1, 2, and 3.23 A.2. Does the Greater Male Overconfidence Explain the Tournament-Entry Gap?
Next we examine if the greater overconfidence by men can explain why conditional on
performance they enter the tournament more frequently than women. Figure III shows for each
guessed rank the proportion of women and men that enter the tournament.24 While tournament
entry-decisions are positively correlated with the participants’ beliefs on relative performance,
we see vastly different tournament-entry decisions across genders. Among the men and women
who think they are first or second best there is a gap in tournament entry of about 30
percentage points.
0
0.2
0.4
0.6
0.8
1
4 3 2 14=Worst Rank 1=Best Rank
W
M
FIGURE III
Proportion Entering the Tournament Conditional on Guessed Rank
23 We eliminate guessed ranks of 4, as we have only one man and two women with such guesses. The results are similar when we code guesses of 3 and 4 as guesses of rank 3. 24 Note that a participant with a point prediction of a guessed rank of 2 may still optimally choose to enter the tournament if, for example, the participant believes that she has a 40% chance of being best, and a 60% chance of being second.
20
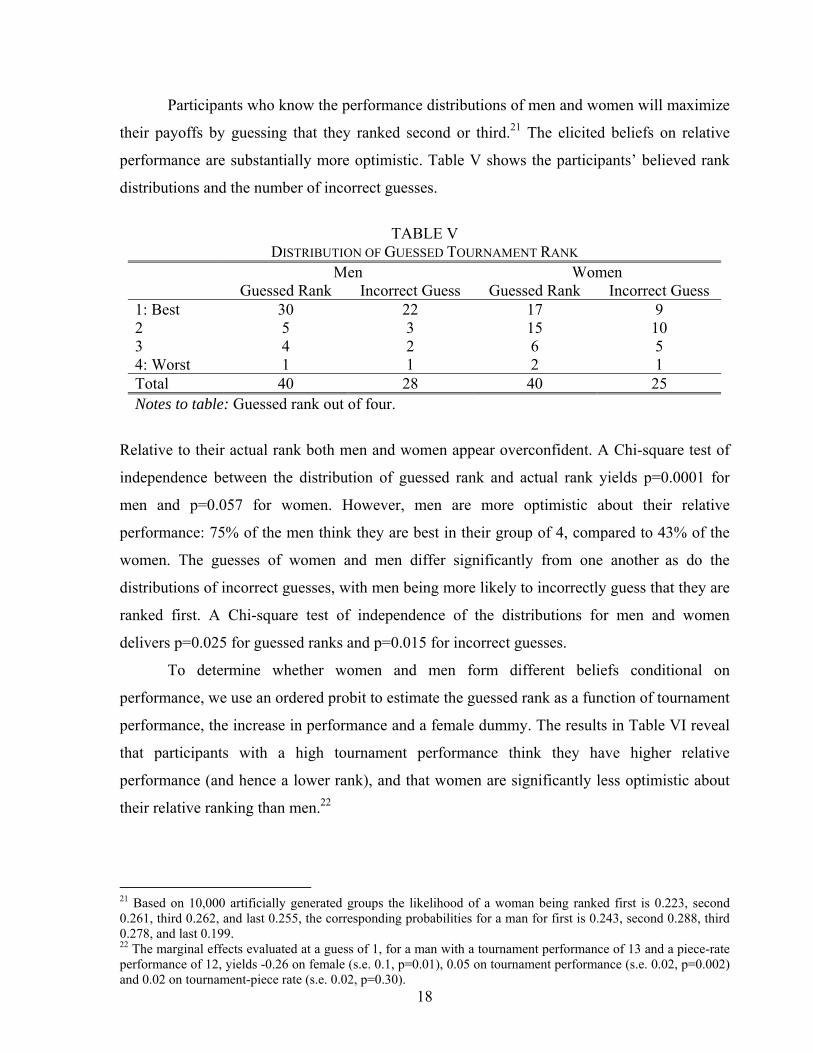
The probit regression in column B of Table VII confirms that conditional on performance those
who are more optimistic about their tournament performance are more likely to enter the
tournament. However it also shows that women remain significantly less likely to enter the
tournament when controlling for both absolute and believed relative performance.
TABLE VII PROBIT OF TOURNAMENT-ENTRY DECISION (TASK 3) 25
Coefficients A B Female -0.379
(0.01) -0.278 (0.01)
Tournament 0.015 (0.39)
-0.002 (0.90)
Tournament – Piece Rate 0.008 (0.72)
-0.001 (0.94)
Guessed Tournament Rank -0.181 (0.01)
Notes to table: Dependent variable: task-3 compensation choice (1-tournament and 0-piece rate). The table presents marginal effects evaluated at a man who thinks he is ranked first, and who has 13 correct answers in the tournament and 12 in the piece rate. p-value in parenthesis. Guesses of 4 are eliminated resulting in a sample of 38 women and 39 men.
The question is how important gender differences in overconfidence are in explaining
the gender gap in tournament entry. Controlling only for performance column A demonstrates
an overall gender effect of 38% on tournament entry, that is, a man with a performance of 13 in
the tournament (and 12 in the piece rate) would have a 38% lower probability of entering the
tournament if he were a woman. Column B shows that including the control for guessed
tournament rank the gender effect reduces to 28%. That is, 27% of the gender gap in
tournament entry can be attributed to men being more overconfident than women. However,
the remaining 73% of the overall gender effect is unaccounted for.
B. Do General Factors cause Gender Differences in Compensation?
The results of Table VII show that although male overconfidence helps explain why
equally able women and men select different compensations the majority of the gender gap 25 The two performance measures are included in the regression because we are interested in examining gender differences in tournament entry conditional on performance. The results in Column A correspond to those of Table III with the exception that guesses of 4 are not included.

21
remains. Thus we need to consider our other explanations to understand why women and men
with the same performance and beliefs about relative performance choose different
compensations. We first examine behavior in task 4 to determine if gender differences in
general factors such as overconfidence, risk and feedback aversion by themselves may cause a
gender gap in compensation choices. This helps us determine whether it is plausible that the
tournament-entry gap can be accounted for by gender differences in such general factors.
Before proceeding with our analysis it is however worth considering the magnitude of
the tournament-entry gap we are trying to explain. In particular, it is unlikely that a potential
gender gap in risk aversion would be large enough to explain the difference. Consider that
participants, who have 14 or more correct answers, have a 47% or higher chance of winning
the tournament. Presuming that one can maintain the performance in task 3 and ignoring any
performance costs, the decision to enter the tournament becomes a gamble of receiving, per
correct answer, either $2 with a probability of 47% (or more), or receiving 50 cents for sure.
For participants who have 14 correct answers that means a gamble of a 47% chance of $28
(i.e., an expected value of $13), versus a sure gain of $7. Of the participants who solve 14
problems or more, 8/12 of the women and 3/12 of the men do not take this or a better gamble.
This difference is marginally significant with a two-sided Fisher’s exact test (p=0.100).
Similarly, for participants who have 11 or fewer correct answers the chance of winning the
tournament is 5.6% or less. Thus entering the tournament means receiving $2 per correct
answer with a probability of 5.6% (or less) versus receiving 50 cents for sure. For participants
who solve 11 correct answers this is a choice between a 5.6% chance of winning $22 (i.e., an
expected value of $1.23) compared to receiving $5.5 for sure. Of the participants, who solve 11
problems or less, 11/18 of the men and only 5/17 of the women take this or a worse gamble.
This difference is marginally significant with a two-sided Fisher’s exact test (p=0.092). To
explain these choices women would have to be exceptionally risk averse and men
exceptionally risk seeking. We are not aware of any studies that find such extreme gender
differences in risk attitudes.
Rather than separately measuring gender differences in overconfidence, risk and
feedback aversion and determining the role played by each in the compensation choice, we opt
for a different strategy. Instead we use task-4 decisions to simultaneously assess the impact
such general effects have on the compensation choice. As these decisions do not involve the

22
prospect of performing in a competition, they rule out the possibility that decisions are driven
by preferences for performing in the competition.
Participants in the fourth task select one of two compensations for their past piece-rate
performance (task 1), either the 50-cent piece rate or the $2 tournament. If the tournament is
chosen, the piece-rate performance is submitted to a competition against the piece-rate
performances of the other participants in the group (independent of their compensation choice).
A tournament is won if an individual’s performance exceeds that of the other three players.
B.I. Is the Gender Gap in Compensation Choices due to General Factors?
Before examining the participants’ choices, we use the task-1 performance to determine
who should submit the piece rate to a tournament scheme. In the piece rate men and women
have similar, but not exactly the same probability of being the highest performer in a randomly
drawn group of 2 men and 2 women. Overall the chance of having the highest piece-rate
performance is 29% for a man and 21% for a woman.26 In our 20 groups 11 women and 11
men were the highest performers in their group (incl. two cases of ties). Table VIII reports the
probability of winning the tournament conditional on gender and performance.27
TABLE VIII
PROBABILITY OF WINNING PIECE-RATE TOURNAMENT CONDITIONAL ON PERFORMANCE 8 9 10 11 12 13 14 15 17 18 22 Women 1 3.6 11.4 21.6 33 49.4 66 81.4 -- 93.9 -- Men 0.9 3.2 11.8 24.4 39.3 57.4 70.7 83.5 91.5 -- 98.7
The per problem compensation under the two schemes imply that for a given
performance individuals who solved 12 or more problems have higher expected earnings from
submitting to a tournament. This corresponds to 30% of the women and 40% of the men.
Including participants who solve 11 problems – and are virtually indifferent between the two
schemes – the percentages are 40% for the women and 45% for the men.
The actual difference in compensation choices is substantially larger. With 25% of the
women and 55% of the men submitting their piece-rate performance to the tournament, we find
26 This difference is not significant in a sample of 40 men and 40 women. 27 For any given performance level, say 15 for a woman, we draw 10,000 groups consisting of 2 men and one other woman, where we use the sample of 40 men and women with replacement. We then calculate the frequency of wins. The exercise is repeated 100 times and we report the average of these win frequencies.

23
a significant gender gap in the task-4 choice (p-value=0.012 by Fisher’s exact test).28 Thus
there is a gender difference in compensation decisions when decisions do not involve the
prospect of having to perform in a competition. Next we examine if this difference is the same
when we condition on performance, and we determine the extent to which it can be accounted
for by differences in beliefs about relative piece-rate performance. That is, of these general
factors how much of the compensation gap may be accounted for by gender differences in
overconfidence.
B.2. Gender Gap in Task-4 Compensation Choices Conditional on Performance and Beliefs
Consider first the average piece-rate performance conditional on the task-4 choice.
With a p-value of 0.48 there is no significant performance difference between the women who
submit to the tournament (10.7 problems) and those who do not (9.97 problems). In contrast,
the men who submit to the tournament solved significantly more problems in the tournament
(12.05) than those who did not submit to the tournament (9) (p=0.004).
Figure IV panel A shows the propensity of women and men who submit to the
tournament for each piece-rate performance quartile. The gender gap in compensation
decisions is largest among those in the top performance quartile. Of the participants who have
about equal or higher expected earnings from submitting to the tournament (11 or more correct
answers), significantly more men (14/16) than women (3/12) select the tournament (Fisher’s
exact test p=0.001). Of the participants who have lower expected earnings from the tournament
(less than 11 correct answers) there is no significant difference in the proportion of men and
women who submit to the tournament (8/22 and 5/22 respectively) (Fisher’s exact test p=0.33).
A probit regression confirms that those with higher performance are more likely to
submit to the tournament and that conditional on piece-rate performance men are more likely
to do so than women.29 The significant gender difference in compensation choices seems
28 Note that participants are more reluctant to submit the piece rate result to a tournament than they were to enter a tournament and then competing. This difference is not significant either for women (a Fisher’s exact test yields p=0.465) or for men (a Fisher’s exact test yields p=0.162). One possible explanation for the albeit insignificant change is that in task 4, there can only be one winner in each group of four, while in task 3 all participants can win the tournament, provided they improve their performance by a lot. Another possibility is that participants who increased their performance after the piece-rate scheme may not realize that this personal experience is common for all participants. From psychology we know that people attribute changes more to themselves than the environment: the fundamental attribution error [e.g., Ross, L., 1977]. A failure to incorporate that others have experienced similar increases may lead to under estimation of one’s ability and hence to a lower tendency to submit to a tournament (see also Moore and Small, 2004). 29 A probit regression of decision to submit the piece rate to a tournament yields marginal effects of -0.31 on female (s.e. 0.11, p=0.01), and 0.06 on piece-rate performance (s.e. 0.02, p=0.01), evaluated at a man with 11

24
driven by high-performing participants with 12 or more correct answers. While the female
dummy is significant in a probit regression on this subsample of participants, it is insignificant
in the subsample of participants with a performance of 10 or less.30 Absent future competition
we see that for those with high performance, gender differences in general factors such as
overconfidence, risk and feedback aversion cause a compensation gap.
As we elicited the participant’s beliefs on relative performance in the piece rate we are
able to determine the extent to which difference in compensation choices may be explained by
differences in beliefs, relative to other factors such as risk and feedback aversion.
0
0.2
0.4
0.6
0.8
1
4 3 2 14 = Worst quartile 1 = Best
W
M0
0.2
0.4
0.6
0.8
1
4 3 2 1
4 = Worst Rank 1 = Best Rank
WM
(A) (B)
FIGURE IV Proportion of Participants who Submit to a Tournament Conditional on Task-1
Performance Quartile (panel A) and Guessed Piece-Rate Rank (panel B)
The characteristics of the elicited beliefs on relative performance in the task-1 piece
rate are very similar to what we found for the task-2 tournament. Both, women and men are
overconfident and their believed rank distributions differ significantly from the actual rank
distributions (a Chi-square test of independence yields p=0.06 for men and 0.008 for women).
As for the tournament performance men are significantly more optimistic about their relative
performance than women (a Chi-square test yields p=0.029). An ordered probit of guessed
piece-rate rank as a function of the piece-rate performance and a female dummy confirm that
correct answers in task-1 (this is the performance at which the expected payoff is the same from the piece rate as from the tournament). 30 A probit regression of the decision to submit to a tournament on the piece-rate performance and a female dummy yields, for participants who solve 10 or less in the piece rate, a coefficient on the piece rate of 0.03 (s.e. 0.05, p=0.6), and on the female dummy of -0.17 (s.e. 0.14, p=0.23) evaluating the marginal effects at a man who solves 10 problems. For participants who solve 12 or more, the coefficient on the piece-rate performance is 0.03 (s.e. 0.05, p=0.42) and on the female dummy -0.63 (s.e. 0.15, p=0.002) evaluated at a man who solves 12.

25
women are significantly less optimistic than men, and that participants with higher absolute
performance think they have higher relative performance.31
While the elicited beliefs for task 1 are quite similar to those of task 2, their effect on
compensation choices is remarkably different. Panel B of Figure IV shows, for each guessed
piece-rate rank, the proportion of women and men that submit their piece-rate performance to a
tournament. In sharp contrast to our task-3 compensation choices the gender gap in task-4
decisions practically vanishes when we condition on the participant’s believed ranking.
Independent of gender more confident participants are more likely to submit to the tournament.
Women and men are both about 60 percentage points more likely to submit to a tournament
when they think they are the highest performer in their group, rather than the second highest.
Controlling for guessed rank Panel B shows only a small gender gap in task-4 choice,
this is confirmed by the probit analysis in Table IX. Controlling only for piece-rate
performance and gender reveals a substantial and significant coefficient on female (column A).
While this difference in compensations may be caused by a series of general gender
differences, such as overconfidence, risk and feedback aversion, column B shows that gender
differences in beliefs on relative performance can account for the gender difference in
compensation choices. That is, absent a competitive performance the relative overconfidence
of men can explain the gender difference in compensation choice. Thus conditional on beliefs
general factors such as risk and feedback aversion have a negligible effect on the task-4
compensation choice.
TABLE IX PROBIT OF DECISION TO SUBMIT THE PIECE RATE TO A TOURNAMENT (TASK 4)
Coefficient (A) (B) Female -0.327
(0.01) -0.13 (0.21)
Piece Rate 0.05 (0.02)
0.00 (0.80)
Guessed Piece Rate Rank -0.32 (0.00)
Notes to table: Dependent variable: task-4 compensation choice (1-tournament, 0-piece rate). The table presents marginal effects evaluated at a man with a guess of first and 11 correct answers in task 1. p-values reported in parenthesis. Excluding guesses of 4 the sample is 39 women and 38 men.
31 An ordered probit of guessed piece-rate rank yields coefficients of 0.77 on female (s.e. 0.27, p=0.01) and -0.19 on piece-rate performance (s.e. 0.05, p=0.00). Guesses of 4 are eliminated leaving 39 women and 38 men.
26
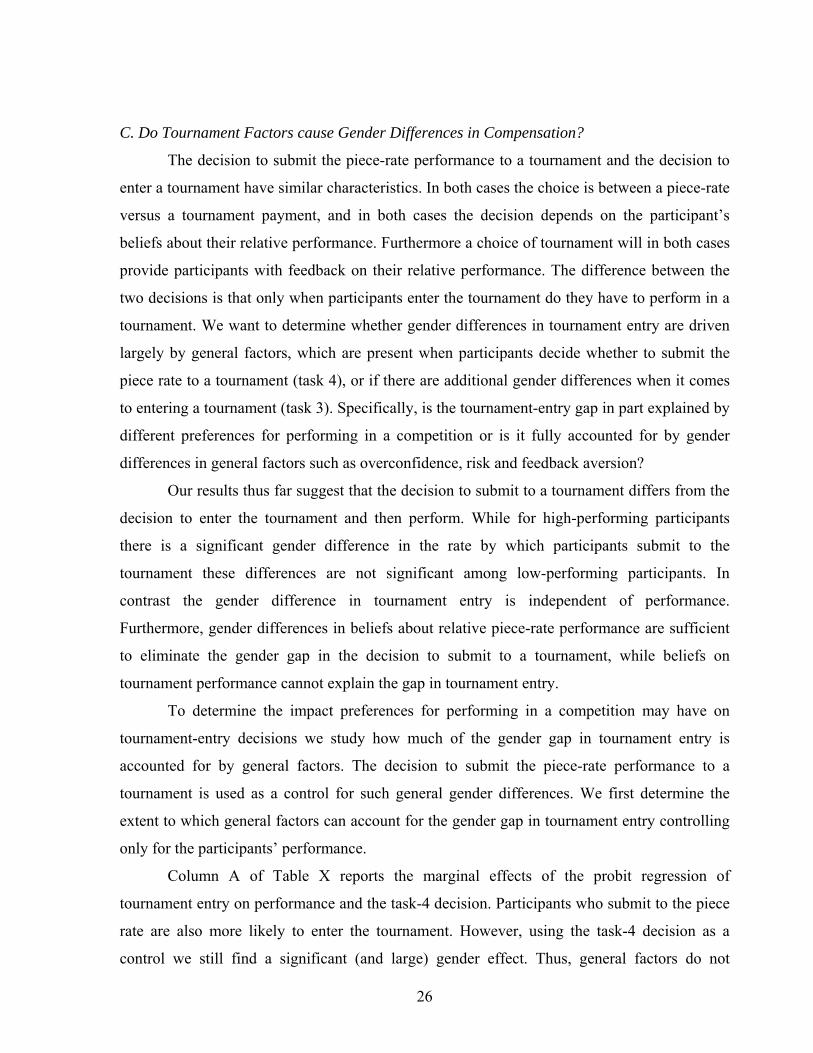
C. Do Tournament Factors cause Gender Differences in Compensation?
The decision to submit the piece-rate performance to a tournament and the decision to
enter a tournament have similar characteristics. In both cases the choice is between a piece-rate
versus a tournament payment, and in both cases the decision depends on the participant’s
beliefs about their relative performance. Furthermore a choice of tournament will in both cases
provide participants with feedback on their relative performance. The difference between the
two decisions is that only when participants enter the tournament do they have to perform in a
tournament. We want to determine whether gender differences in tournament entry are driven
largely by general factors, which are present when participants decide whether to submit the
piece rate to a tournament (task 4), or if there are additional gender differences when it comes
to entering a tournament (task 3). Specifically, is the tournament-entry gap in part explained by
different preferences for performing in a competition or is it fully accounted for by gender
differences in general factors such as overconfidence, risk and feedback aversion?
Our results thus far suggest that the decision to submit to a tournament differs from the
decision to enter the tournament and then perform. While for high-performing participants
there is a significant gender difference in the rate by which participants submit to the
tournament these differences are not significant among low-performing participants. In
contrast the gender difference in tournament entry is independent of performance.
Furthermore, gender differences in beliefs about relative piece-rate performance are sufficient
to eliminate the gender gap in the decision to submit to a tournament, while beliefs on
tournament performance cannot explain the gap in tournament entry.
To determine the impact preferences for performing in a competition may have on
tournament-entry decisions we study how much of the gender gap in tournament entry is
accounted for by general factors. The decision to submit the piece-rate performance to a
tournament is used as a control for such general gender differences. We first determine the
extent to which general factors can account for the gender gap in tournament entry controlling
only for the participants’ performance.
Column A of Table X reports the marginal effects of the probit regression of
tournament entry on performance and the task-4 decision. Participants who submit to the piece
rate are also more likely to enter the tournament. However, using the task-4 decision as a
control we still find a significant (and large) gender effect. Thus, general factors do not

27
eliminate the gap in tournament entry. Basing the assessment on performance alone we
previously found a gender gap in tournament entry of 38% (see Table III). Controlling for the
decision to submit the piece rate, the gender effect reduces to 25%. Thus only about 34% of the
initial gender gap can be explained by general factors, and the residual “competitive”
component appears to be 66%.
TABLE X PROBIT OF TOURNAMENT-ENTRY DECISION (TASK 3)
Coefficient (A) (B)32 Female -0.25
(0.01) -0.162 (0.05)
Tournament -0.00 (0.98)
-0.009 (0.42)
Tournament – Piece Rate 0.02 (0.16)
0.011 (0.44)
Submitting the Piece Rate 0.34 (0.00)
0.258 (0.012)
Guessed Tournament Rank -0.120 (0.01)
Notes to table: Dependent variable: task-3 compensation choice (1-tournament and 0-piece rate). The table presents marginal effects evaluated at a man with 13 correct answers in the tournament and 12 in the piece rate, who submits to the tournament, and for column (B) believes he is ranked first in the task-2 tournament. p-values reported in parenthesis.
While preference differences for performing in a competition appear to play a role in
the tournament-entry decision, it is possible that this “competitive” component can be
accounted for by the participants’ beliefs about their tournament ranking. Although the task-4
choice reflects a general degree of gender differences in overconfidence, such differences may
be even larger in a competitive environment. In particular women may be even less confident
in competitive environments. This could be because of a stereotype that women are not so
competitive, or that women may be more stressed during the tournament [Steele 1997].33
Indeed, although beliefs on relative performance are correlated in the piece rate and
tournament, beliefs in the piece rate cannot fully explain those in the tournament. While men
32 We omit the 3 participants who guessed a rank of 4 in the tournament leaving 39 men and 38 women. 33 Stereotype threat theory suggests that stereotyped individuals (e.g., women who are supposed to be poor competitors) who find themselves in a situation where they run the risk of confirming the stereotype (i.e., in a tournament where they may lose) may feel additional performance anxiety for fear of confirming the stereotype. This additional threat may harm female performance as they may “choke” under the pressure.

28
are more overconfident than women about their piece-rate performance, the difference in
overconfidence is even greater when it comes to tournament performance.34 To account for this
difference we include the guessed tournament rank in the analysis, the results of which are
shown in Column B of Table X. While those who are confident and who submit to a
tournament (task 4) are significantly more likely to enter a tournament (task 3), we still find a
significant (and large) gender gap in tournament entry. Not including the task-4 control men
are 27.8% more likely to enter the tournament (see Table IIV). Controlling for the decision to
submit the piece rate, the gender effect is reduced to 16.2%, hence about 42% of the remaining
gender effect can be explained by general factors and the residual “competitive” component is
58%.
The gender gap in compensation choice is exacerbated when individuals subsequently
have to perform under the selected compensation. Controlling for the task-4 decision as well as
believed tournament rank, the marginal effect of gender on the decision to enter the tournament
is still 16%. It appears that the gender gap in tournament entry to a large extent is driven by
men and women differing in their preference for performing in a competitive environment.
VI. CONCLUSION AND DISCUSSION We conducted experiments to examine whether gender differences in preferences for
competitive environments may cause men and women to hold different jobs, even when the
playing field is level. Specifically, we investigated whether women shy away from competition
while men are drawn to it. In our study women and men first perform under a piece rate and a
competitive tournament scheme. They then decide which compensation scheme they want to
apply to their next performance. Despite there being modest gender differences in initial
performances, twice as many men as women enter the tournament. Men are much more likely
to enter the tournament than equally able women. While high-performing women enter the
tournament too little, low-performing men enter too much. Since the costs of under-entry are
larger than those of over-entry, women have lower earnings than men.
Examining beliefs in relative performance we find that men are substantially more
overconfident than women, and while this difference helps explain the gender gap in
34 The result of an ordered probit of relative tournament rank generates the following coefficients 0.74 on female (s.e. 0.33 p=0.03), -0.07 on tournament (s.e.0.09, p=0.35), -0.25 on tournament-piece rate (s.e. 0.09, p=0.00), 0.82 on guessed piece rate rank (s.e. 0.28, p=0.00). The 6 participants who guessed a rank of 4 in either the tournament or the piece rate are omitted leaving 37 men and 37 women.
29
tournament entry it only explains a small share of the gap. To explain the remaining gender
gap in tournament entry, we consider two different types of explanations. One is that men and
women may differ in their preferences for performing in a competition, and the other is that
there may be gender differences in general factors such as overconfidence, risk and feedback
aversion. We use a last task to distinguish between these two types of explanations.
Specifically, participants decide whether to submit their past piece-rate performance to a
tournament or a piece-rate scheme. As no subsequent competitive performance is involved,
compensation choices in this task only capture gender differences in general factors, but not in
preferences for performing in a competition.
Excluding a subsequent competitive performance we still find that men are more likely
to choose a competitive scheme, and this gender difference cannot be explained by
performance. Thus gender differences in general factors by themselves cause a gap in
compensation choices. However in contrast to the tournament-entry decision we find that the
substantial male overconfidence explains the gender difference in submitting to the
tournament. Thus, general factors such as risk and feedback aversion have a negligible effect
on the compensation choice.
Finally, in examining the tournament-entry decision we use the participant’s decision to
submit the piece rate as a control for gender differences in general factors (e.g., general
differences in overconfidence, risk and feedback aversion). While this decision has explanatory
power it does not account for the majority of the gender gap in tournament entry. Thus we find
that the gender gap in tournament entry in part can be explained by gender differences in
general factors as well as by a greater degree of male overconfidence in a competitive
environment. However these factors do not explain the entire difference in tournament entry
and it appears that the remaining gap may be attributed to women and men having different
preferences for performing in a competition.
Our interpretation of the results warrants a few words of caution. First, while we use
task 4 to asses the role played by gender differences in general factors, such as overconfidence,
risk and feedback aversion, these factors may play an even larger role when it comes to
performing in a competition. In eliciting beliefs on relative performance in both the piece rate
and tournament we can control for such differences in the case of overconfidence, however we
are not able to do so for gender differences in any of the other general cases. In particular if
the gender difference in feedback aversion is larger in the competition, such differences will

30
not be fully accounted for by our task-4 compensation choice, and any effect it may have on
tournament entry will instead be attributed to gender differences in preferences for performing
in a competitive environment.
Second, we have tried to limit the explanations we examine to those that we find most
likely; however other gender differences may cause a similar gender gap in compensations. For
example, compensation choices in task 3 and 4 may differ across gender if women are more
uncertain in their beliefs about relative performance. That is, in addition to being less
optimistic about their relative ranking, women may also be less certain about how correct their
believed ranking is. If women are more uncertain about the precision of their beliefs, then they
will be more reluctant to enter the tournament for a given belief. Similarly another factor that
may affect choices in task 3 but not task 4 is if beliefs about the task-3 performance differ
between men and women. In particular, women may act differently than men for a given point
prediction of the believed task-2 ranking, if they think that their past tournament performance
is a poor predictor for future tournament performance. Women have been found to be more
prone to attribute past successes to luck than to inner attributes (and past failures less to bad
luck), while men do the opposite.35 If this is the case then women and men will act differently
conditional on their believed ranking in the task-2 tournament. Another reason why men and
women may hold different beliefs about their task-3 performance is that men may overestimate
how well they will do in future tournaments. With participants having a higher performance in
the tournament than in the piece rate, men may be more prone to believe that they will continue
to increase their performance. Note however that if this were the case we would expect the
tournament-entry decision to be correlated with the increase in performance participants
experience between the piece rate and the tournament. However, as seen in Table III, the
increase in performance is not correlated with tournament entry. Furthermore, with 75% of
men thinking they are best in task 2 this proportion will only increase marginally if men
believe their performance will continue to improve. To the extent that there nonetheless are
gender differences in beliefs about the task-3 performance, and these influence tournament
entry the effect will be attributed to men and women having different preferences for
performing in a competition.
Our paper is part of a research program that tries to understand why women are
underrepresented in many high-profile jobs and across whole professions. Standard
35 Beyer [1990] and Felder et al. [1994].

31
explanations include gender differences in preferences and ability or discrimination. We
studied an additional explanation, namely that women may be less “competitive,” less prone to
select into competitions, but not because of differences in preferences over time invested in
jobs, differences in ability or discrimination.
Gneezy, Niederle and Rustichini (2003) explored an environment in which there was
no gender gap in performance in a piece-rate scheme. However a mixed tournament created
large gender differences in performance. While a few women performed extremely well, a
large number had a low performance and the bottom performance quintile was almost entirely
comprised of women. Similar gender differences in competitive behavior have also been found
by Larson (2005). While inferior performance of women may make them more reluctant to
select into a competitive environment, in this paper we explore whether such differences arise
even when there are no gender differences in performance.
Since we focus on the decision to enter a tournament, we looked for a task in which,
even in tournaments, men and women would perform equally well. We chose to have
participants add up five two digit numbers for five minutes, instead of solving Yahoo mazes
for 15 minutes (the task of Gneezy, Niederle and Rustichini, 2003). That is, we picked a short
task, where we did not expect men to do better than women, a task that is in no way exciting,
but rather requires participants to be very careful not to make simple mistakes. We show that
even when women perform as well as men in a competitive environment, women opt out of
tournaments, while men opt in.
The research on gender and competition so far suggests that there are two reasons why
women may not be well represented in competitive environments. First, there are
circumstances where women, in competition against men, perform worse than their male
counterparts. Second, even when women and men are equally successful in the competitive
environment, if given a choice high-performing women will not enter the competition.
Babcock and Laschever (2003) explore the possibility that gender differences in labor
market outcomes may arise because women are poor negotiators and generally dislike the
process of negotiating. To the extent that a negotiation can be seen as a two-person competition
their results appear consistent with those on competition. Once again there are two effects, of
women first avoiding the competitive scheme all together, and second, failing to compete when
forced to do so.
32
There is evidence to suggest that ability differences are not primarily the reason why
women quit sciences and engineering. For example, a report entitled “Women’s Experiences in
College Engineering” writes that “Many young women leave […] for reasons other than
academic ability. These reasons can include their negatively interpreting grades that may
actually be quite good, diminished selfconfidence, or reluctance to spend all of their waking
hours ‘doing engineering.’” [Goodman, Cunningham and Lachapelle 2002]. The report
mentions that many women who left mentioned negative aspects of their schools’ climate such
as competition, lack of support and discouraging faculty and peers. Similar effects have been
found by Felder et al. [1994].
It seems therefore that decisions of women to remain in male-dominated fields are not
only driven by actual ability. In natural settings issues such as the amount of time devoted to
the profession, and the desire of women to raise children may provide some explanations for
the choices of women. However, in this paper we examined an environment where women and
men perform equally well, and where issues of discrimination, or time spent on the job do not
have any explanatory power. Nonetheless we find large gender differences in the propensity to
choose competitive environments. We feel that the effects we discover in the lab are
sufficiently strong to call for a greater attention of standard economics to explanations of
gender differences that so far have mostly been left in the hands of psychologists and
sociologists.

33
References:
Altonji, Joseph G., and Rebecca Blank "Race and Gender in the Labor Market" in O.
Ashenfelter and D. Card, (eds), Handbook of Labor Economics Volume 3c Elsevier Science B.V. (1999): 3144-3259.
Andreoni, James, and Lise Vesterlund, “Which is the Fair Sex: Gender Differences in Altruism,” Quarterly Journal of Economics, CXVI, (2001), 293 – 312.
Babcock, Linda and Sara Laschever, Women Don’t Ask: Negotiation and the Gender Divide by (Princeton University Press, 240 pp., September 2003)
Blau, Francine D., and Lawrence M. Kahn, 2004, “The US Gender Pay Gap in the 1990s: Slowing Convergence,” NBER working paper 10853.
Bertrand, Marianne and Kevin F. Hallock, "The gender gap in top corporate jobs," Industrial and Labor Relations Review, LV (2001), 3-21.
Beyer, Sylvia, “Gender Differences in the Accuracy of Self-Evaluations of Performance,” Journal of Personality and Social Psychology, LIX (1990), 960 – 970.
Beyer, Sylvia, and Edward M. Bowden, “Gender Differences in Self-Perceptions: Convergent Evidence From Three Measures of Accuracy and Bias,” Personality and Social Psychology Bulletin, XXIII (1997), 157 - 172.
Byrnes, James P., David C. Miller, and William D. Schafer, “Gender Differences in Risk Taking: A Meta-Analysis,” Psychological Bulletin, LXXV (1999), 367-383.
Costa-Gomes, Miguel, and Georg Weizsäcker, “Stated Beliefs and Play in Normal Form Games,” working paper London School of Economics.
DellaVigna, Stefano, Ulrike Malmendier, and Lise Vesterlund, “How robust is overconfidence: The effect of noisy and non-noisy signals,” in preparation.
Eckel, Catherine C. and and Philip J. Grossman, 2002a, “Sex differences and statistical stereotyping in attitudes towards financial risk,” Evolution and Human Behavior 23:281-295.
Eckel, Catherine C. and Philip J. Grossman, 2002b, “Sex and Risk: Experimental Evidence”, forthcoming, Handbook of Experimental Economics Results, Amsterdam, Elsevier Science, North-Holland.
Eckel, Catherine, and Philip J. Grossman, 2002c, “Differences in the Economic Decisions of Men and Women: Experimental Evidence.” Forthcoming in Handbook of Experimental Results, edited by C. Plott and V. Smith. New York, Elsevier.
Felder, Richard M., Gary N. Felder, Meredith Mauney, Charles E. Hamrin and E. Jacquelin Dietz, (1994), “A Longitudinal Study of Engineering Student Performance and Retention,” Report NCSU-94A.
Fischbacher, U. (1999), z-Tree - Zurich Toolbox for Readymade Economic Experiments - Experimenter's Manual, mimeo
Ginther, Donna “Women in Economics: Moving Up or Falling Off the Academic Career Ladder?” Journal of Economic Perspectives (Summer 2004) 18:3, 193-214.
Gneezy, Uri, Muriel Niederle, and Aldo Rustichini, “Performance in Competitive Environments: Gender Differences,” Quarterly Journal of Economics, August 2003, p. 1049-1074.
Hewitt, N. M, and E. Seymour, “Factors Contribution to High Attrition Rates Among Science and Engineering Undergraduate Majors” Report to the Alfred P. Sloan Foundation (1991).
Hyde, Janet Shibley, Elizabeth Fennema, and Susan J. Lamon, “Gender Differences in

34
Mathematics Performance: A Meta-Analysis,” Psychological Bulletin (1990), 107:2, 139-155.
Jan, Tracy; “A new gender divide: Coed school experiments with gender gap Coed Catholic school will try separating boys, girls in class,” Boston Globe, April 9, 2005.
Jones, E. E. and Harris, V. A. (1967). The attribution of attitudes. Journal of Experimental Social Psychology, 3, 1-24
Krupka, Erin and Roberto Weber, 2004, “The Influence of Social Norms in Dictator Allocation Decisions,” working paper.
Larson, Lia Christine, 2005, “When Girls Stop Competing Against Boys: An Experimental Analysis of the Competitive Behavior of Young Children”, Harvard Honors Thesis.
Lichtenstein, Sarah, Baruch Fischhoff, and Lawrence Phillips, “Calibration and Probabilities: The State of the Art to 1980”, in Judgment Under Uncertainty: Heuristics and Biases, Daniel Kahneman, Paul Slovic and Amos Tversky, eds., (Cambridge University Press: 1982)
Ledyard, John O., “Public Goods: A Survey of Experimental Research”, in Handbook of Experimental Economics, John H. Kagel and Alvin E. Roth, eds. (Princeton, NJ: Princeton University Press, 1995)
Moore, D. A., & Small, D. A. (2004), “Error and bias in comparative social judgment: On being both better and worse than we think we are,” Tepper Working Paper 2004-E1, Pittsburgh, PA.
National Science Foundation, Division of Science Resources Statistics, Gender Differences in the Careers of Academic Scientists and Engineers, NSF 04-323, Project Officer, Alan I. Rapoport (Arlington, VA, 2004).
Polachek, Solomon W., “Occupational Self-Selection: A Human Capital Approach to Sex Differences in Occupational Structure”, Review of Economics and Statistics, LXIII (1981), 60-69.
Rosen, S. (1986) “The theory of equalizing differences”, in O. Ashenfelter and R. Layard, eds., Handbook of Labor Economics, Amsterdam, Elsevier Science, North-Holland.
Ross, L. (1977) The intuitive psychologist and his shortcomings: Distortions in the attribution process. In L. Berkowitz (ed.), Advances in experimental social psychology (Volume 10, pp. 173-240), Orlando, FL: Academic Press.
Steele, Claude M., “A Threat in the Air: How Stereotypes Shape Intellectual Identity and Performance,” American Psychologist, LII (1997), 613 – 629.
Vesterlund, Lise, “The Effects of Risk Aversion on Job Matching: Can Differences in Risk Aversion Explain the Wage Gap?” Wisconsin Ph.D. dissertation.
35
Appendix: Instructions
WELCOME In the experiment today you will be asked to complete four different tasks. None of these will take more than 5 minutes. At the end of the experiment you will receive $7 for having completed the four tasks, in addition we will randomly select one of the tasks and pay you based on your performance in that task. Once you have completed the four tasks we determine which task counts for payment by drawing a number between 1 and 4. The method we use to determine your earnings varies across tasks. Before each task we will describe in detail how your payment is determined. Your total earnings from the experiment are the sum of your payment for the randomly selected task, your $7-payment for completing the tasks, and a $5 show up fee. At the end of the experiment you will be asked to come to the side room where you will be paid in private.
Task 1 – Piece Rate For Task 1 you will be asked to calculate the sum of five randomly chosen two-digit numbers. You will be given 5 minutes to calculate the correct sum of a series of these problems. You cannot use a calculator to determine this sum, however you are welcome to write the numbers down and make use of the provided scratch paper. You submit an answer by clicking the submit button with your mouse. When you enter an answer the computer will immediately tell you whether your answer is correct or not. Your answers to the problems are anonymous. If Task 1 is the one randomly selected for payment, then you get 50 cents per problem you solve correctly in the 5 minutes. Your payment does not decrease if you provide an incorrect answer to a problem. We refer to this payment as the piece rate payment. Please do not talk with one another for the duration of the experiment. If you have any questions, please raise your hand. ARE THERE ANY QUESTIONS BEFORE WE BEGIN?
Task 2 - Tournament As in Task 1 you will be given 5 minutes to calculate the correct sum of a series of five 2-digit numbers. However for this task your payment depends on your performance relative to that of a group of other participants. Each group consists of four people, the three other members of your group are located in the same row as you. The people immediately in front of you and behind you are in your group. If Task 2 is the one randomly selected for payment, then your earnings depend on the number of problems you solve compared to the three other people in your group. The individual who correctly solves the largest number of problems will receive $2 per correct problem, while the other participants receive no payment. We refer to this as the tournament payment. You will not be informed of how you did in the tournament until all four tasks have been completed. If there are ties the winner will be randomly determined. Please do not talk with one another. If you have any questions, please raise your hand.

36
ARE THERE ANY QUESTIONS BEFORE WE BEGIN?
Task 3 - Choice As in the previous two tasks you will be given 5 minutes to calculate the correct sum of a series of five 2-digit numbers. However you will now get to choose which of the two previous payment schemes you prefer to apply to your performance on the third task. If Task 3 is the one randomly selected for payment, then your earnings for this task are determined as follows. If you choose the piece rate you receive 50 cents per problem you solve correctly. If you choose the tournament your performance will be evaluated relative to the performance of the other three participants of your group in the Task 2 -tournament. The Task 2-tournament is the one you just completed. If you correctly solve more problems than they did in Task 2, then you receive four times the payment from the piece rate, which is $2 per correct problem. You will receive no earnings for this task if you choose the tournament and do not solve more problems correctly now, than the others in your group did in the Task-2 tournament. You will not be informed of how you did in the tournament until all four tasks have been completed. If there are ties the winner will be randomly determined. The next computer screen will ask you to choose whether you want the piece rate or the tournament applied to your performance. You will then be given 5 minutes to calculate the correct sum of a series of five randomly chosen two-digit numbers. Please do not talk with one another. If you have any questions, please raise your hand. ARE THERE ANY QUESTIONS BEFORE WE BEGIN?
Task 4 – Submit Piece Rate
You do not have to add any numbers for the fourth and final task of the experiment. Instead you may be paid one more time for the number of problems you solved in the Task 1 – Piece Rate. However, you now have to choose which payment scheme you want applied to the number of problems you solved. You can either choose to be paid according to the piece rate, or according to the tournament. If the fourth task is the one selected for payment, then your earnings for this task are determined as follows. If you choose the piece rate you receive 50 cents per problem you solved in Task 1. If you choose the tournament your performance will be evaluated relative to the performance of the other three participants of your group in the Task 1-piece rate. If you correctly solved more problems in Task 1 than they did then you receive four times the earnings of the piece rate, which is equivalent to $2 per correct problem. You will receive no earnings for this task if you choose the tournament and did not solve more problems correctly in Task 1 than the other members of your group.

37
The next computer screen will tell you how many problems you correctly solved in Task 1, and will ask you to choose whether you want the piece rate or the tournament applied to your performance. Please do not talk with one another. If you have any questions, please raise your hand.
ARE THERE ANY QUESTIONS BEFORE WE BEGIN