do women shy away from competition? do men compete …environments. if women shy away from...
TRANSCRIPT

Do Women Shy Away from Competition? Do Men Compete too Much?
Muriel Niederle and Lise Vesterlund
June 29, 2005
Abstract
Competitive high ranking positions are largely occupied by men, and women remain scarce in engineering and sciences. Explanations for these occupational differences focus on discrimination and preferences for work hours and field of study. We examine if absent these factors gender differences in occupations may still occur. Specifically we explore whether women and men, on a leveled playing field, differ in their selection into competitive environments. Men and women in a laboratory experiment perform a real task under a non-competitive piece rate and a competitive tournament scheme. Although there are no gender differences in performance under either compensation, there is a substantial gender difference when participants subsequently choose the scheme they want to apply to their next performance. Twice as many men as women choose the tournament over the piece rate. This gender gap in tournament entry is not explained by performance either before or after the entry decision. Furthermore, while men are more optimistic about their relative performance, differences in beliefs only explain a small share of the gap in tournament entry. In a final task we assess the impact of non-tournament-specific factors, such as risk and feedback aversion, on the gender difference in compensation choice. We conclude that even controlling for these general factors, there is a large residual gender gap in tournament entry.
Muriel Niederle: Department of Economics, Stanford University and NBER, http://www.stanford.edu/~niederle, and Lise Vesterlund: Department of Economics, University of Pittsburgh, http://www.pitt.edu/~vester. We thank Scott Kinross, who conducted all the experiments reported in this paper, for his excellent research assistance. We also thank Liran Einav, Jean Francois Richard, Al Roth and Carmit Segal for comments, and we are grateful to the NSF for generous support.
1
1. Introduction
Gender differences in the representation among high profile jobs are substantial. For example,
Bertrand and Hallock (2001) find that only 2.5 percent of the five highest paid executives in a
large data set of U.S. firms are women.1 In academia, women are not well represented in math,
science and engineering, and the difference increases with increases in academic rank. There
also appears to be a leakage of women at the career ladder in economics.2 These gender
differences and their causes continue to be the subject of sometimes very heated debates.
Standard economic explanations for such occupational differences include preferences,
ability and discrimination. Women may not select into competitive high profile jobs or more
technical fields because they do not enjoy the responsibilities associated with a managerial
position, or because they dislike working in math, science or engineering. They may also avoid
these jobs because they tend to have long work hours. Due to intrinsic preferences or intra-
household bargaining women may choose to spend more time raising children. Secondly it has
been suggested that the absence of women in some professions and among higher ranking
positions may be due to them having lower abilities or being less represented in the right tail of
the ability distribution.3 Finally, a common explanation is discrimination or anticipated
discrimination. Differential treatment of women and men with equal abilities may cause
women to end up in occupations that differ from those of men.4
This paper examines whether absent these factors women and men will hold the same
jobs. That is will occupational differences prevail on a leveled playing field where there is no
discrimination or differences in work loads and ability. We explore the possibility that
differences will arise because women and men differ in their preference for competitive
environments. If women shy away from competition and men compete too much, this not only
reduces the number of women who enter tournaments, but also those who win tournaments.
Hence it decreases the chances of women succeeding in competition for promotions and more
lucrative jobs. This explanation for occupational separation resembles explanations that rely on
1 For a recent review on the gender differences in wages in the 1990’s see Blau and Kahn (2004). 2 See e.g., National Science Foundation (2004) and Ginther (2004). The absence of women in more technical fields extends far beyond academia, e.g., Hewitt and Seymour (1991) find that women only hold 10% of all jobs in physical sciences, engineering and math. 3 While ability differences may account for the lack of women in certain professions and ranks, there is no consensus on the extent to which such differences translate into an occupational gender gap. For a discussion on self-selection see Polachek (1981) and Rosen (1986). 4 See Black and Strahan (2001), Goldin and Rouse (2000), Altonji and Blank (1999) and references therein.
2
pure preference differences between men and women. However it differs in that “perceived”
preferences for competitive environments may be malleable, as they may depend on biased
beliefs on ability, confidence, or feelings of competence.5 The psychology literature suggests
that a lack of perceived competence and a fear of receiving negative signals about one’s ability
and performance may be an issue especially in areas where there exists a stereotype that
questions one’s ability in that domain.6 This would be the case for women who enter male-
dominated domains, such as managerial positions and fields such as math, science and
engineering.
To examine whether men and women differ in their preferences for competitive vs.
noncompetitive compensations we study their choices between the two in an environment
where all the former possibilities for gender differences are eliminated. We use controlled
experiments to create such an environment. These enable us to exclude any discrimination or
expectation of discrimination on the part of participants, and to measure performance and
account for any ability differences. Furthermore time commitments are the same under both the
competitive and non-competitive environment. Thus we can determine if gender separation
across occupations is likely to occur when the playing field is leveled as much as possible.
We have groups of 2 women and 2 men perform a real task, namely adding up sets of
five two-digit numbers for five minutes. To determine the cause of possible gender differences
in compensation choice (between a competitive and a non-competitive payment scheme) we
opt for a task where we expect no gender differences in performance under either of the two
schemes.7 Participants first perform the task under piece-rate compensation and then under a
tournament. While participants are informed of their absolute performance after each task, they
do not receive any feedback on their relative performance. Having experienced both
compensation forms, participants then choose which of the two they want to apply to their
performance of the next task, either a piece rate or a tournament. The tournament is designed in
a way that reduces the participant’s problem to an individual decision problem. Specifically the
tournament-entry decision does not affect the payoffs of others, nor does it depend on the
compensation choices others are expected to make. 5 Thus our research aligns well with the objective stated by the presidents of MIT, Princeton, and Stanford: “The question we must ask as a society is not ‘Can women excel in math, science, and engineering?’ -- Marie Curie exploded that myth a century ago -- but ‘How can we encourage more women with exceptional abilities to pursue careers in these fields?’” 6 For the literature on stereotype threat theory and its implications see Steele (1997). 7 Gneezy, Niederle and Rustichini (2003) show that this may not be straightforward. We will tie our results to the past literature in the conclusion.
3
Despite there being no gender difference in performance under either compensation we
find that twice as many men as women select the tournament. Past performance cannot explain
this gender difference and is generally a poor predictor of the participant’s entry decision. The
same holds for the participant’s performance after the entry decision, performance is only
weakly correlated with the entry decision and fails to account for the gender gap in tournament
entry. We also investigate if entry decisions may be driven by the participants' beliefs about
their relative performance. We find that men are significantly more overconfident about their
relative ranking. Although beliefs on relative rank help predict entry decisions, differences in
believed ranking only account for a small share of the gender gap in tournament entry.
In addition to performance and beliefs about relative performance, there are several
potential explanations for the different compensation choices by women and men. While some
are specific to tournaments and performing under this compensation, others are not. Examples
of non-tournament-specific explanations include that women may be more risk averse than
men; in general may be more averse to receiving feedback on relative performance;
consistently may hold less optimistic beliefs than men; or that they may be less confident in the
point predictions of their beliefs. We present the participants with one last task to determine
whether these explanations by themselves generate a gender gap in entry decisions, or if
tournament-specific explanations and future performance under this compensation are needed.
We also use this task to assess how much of the gender gap in tournament entry can be
accounted for by explanations that are not specific to tournaments, and how much is due to
tournament-specific factors, i.e., to what extent is it the pressure of subsequently performing in
a competitive environment that drives women away. Tournament-specific explanations
include, for example, that women may have psychic costs of participating in a tournament (or
of course, men could receive psychic benefits), or that women and men differ in their
preference for or aversion to receiving feedback on performances that occurred in a tournament
setting. It could also be that women are especially underconfident and uncertain in their
tournament performance, or that women are more likely to feel that a good past performance is
a poor predictor for a good future performance (see e.g., Beyer (1990) and Felder et al. (1994)).
In this last task, participants are compensated once again for their past non-competitive
piece-rate performance, but now they select the compensation scheme they want applied to
their performance. Participants can either be paid according to the piece rate, or they can
submit the past piece-rate performance to a tournament (i.e., a performance that can no longer
4
be influenced by whatever compensation scheme is chosen). They win the tournament, if their
past piece-rate performance is the highest in their original group of 4 people. As before women
are significantly less likely to select the tournament compensation, and this difference cannot
be explained by the piece-rate performance. We also find that while both men and women are
overconfident about their relative performance, men are more optimistic than women.
However, in contrast to the initial tournament-entry decision gender differences in beliefs can
account for the gender gap in submitting the piece rate to the tournament. Controlling for
individual beliefs there is only a limited role for non-tournament-specific factors, we cannot
reject that men and women are equally likely to submit the past piece-rate performance to a
tournament. Thus gender differences in beliefs on relative rank explain why men are more
likely to submit their past performance to the tournament.
We use behavior in this final task as a control for gender differences that may result
from non-tournament-specific explanations, and we estimate the size of the residual gender
difference in the decision to enter a tournament and subsequently perform. Including this
control gender differences are still significant and large. That is, a sizable portion of the gender
gap in tournament entry is driven by gender differences that are specific to the fact that after
the compensation choice participants must perform under the selected compensation.
2. Experimental Design
We conduct an experiment in which participants solve a real task, first in a non-competitive
piece-rate compensation scheme and then in a competitive tournament compensation scheme.
Participants are then asked to select which of these two schemes they want to apply to their
next performance. This provides participants with experience of both compensation forms, and
it enables us to determine the extent to which compensation choices are driven by ability or
other factors.
The task of our experiment is to add up sets of five 2-digit numbers. Participants are not
allowed to use a calculator, but may write numbers down on scratch paper. The numbers are
randomly drawn and each problem is presented in the following way:
21 35 48 29 83
5
Once the participant submits an answer on the computer, a new problem appears jointly with
information on whether the former answer was correct.8 A record of the number of correct and
wrong answers is kept on the screen. Participants have 5 minutes in which they may solve as
many problems as they can. We selected this 5-minute addition task because it requires both
skill and effort, and because research suggests that there are no gender differences in ability on
easy math tests.9 A similar performance of women and men is attractive as it enables us to
better rule out ability differences as an explanation for gender differences in tournament entry.
The experiment was conducted at the University of Pittsburgh, using the PEEL subject
pool and standard recruiting procedures. Two or three groups of 4 participants, two women and
two men, participated in each session. Although gender was not discussed at any time,
participants could see each other in the lab, and determine the gender of the participants in their
group. A total of 20 groups participated in the experiment (80 participants).
Each participant received a $5 show-up fee, and an additional $7 for completing the
experiment. Participants were told that they would be asked to complete four tasks, and that
one of these tasks randomly would be chosen for payment at the end of the experiment. By
paying only for one task, we diminish the chance that decisions in a given task may be used to
hedge against outcomes in other tasks. Participants were informed of the nature of the tasks
only immediately before performing the task. While participants know their absolute
performance on a task, i.e., how many problems they solve correctly, they are not informed of
their relative performance until the end of the experiment and do not know if they performed
better or worse than the other participants in their group. The specific compensations of the
tasks were as follows.
Task 1 – Piece Rate:
Participants are given the 5-minute addition task. If task 1 is selected for payment, they receive
50 cents per correct answer.
8 The program was written using the software zTree (Fischbacher 1999). 9 While males often score better on abstract math problems there is no gender difference in arithmetic or algebra performance, on computational problems women tend to score better than men (see Hyde, Fennema, and Lamon (1990) for a metaanalysis of 100 studies on gender differences in math performance).
6
Task 2 – Tournament:
Participants are given the 5-minute addition task. If task 2 is selected for payment, the
participant who solves the largest number of correct problems in the group receives $2 per
correct answer, while the other participants receive no payment (in case of ties the winner is
chosen randomly among the high scorers).
The tournament is designed so that a participant with a 25% of winning the tournament
receives the same expected payoff from the tournament as from the piece rate.10 In the third
task participants once again are asked to perform the five-minute addition task, but this time
select which of the two compensations they want to apply to their future performance.
Task 3 – Choice:
Before performing the 5-minute addition task, participants select whether they want to be paid
according to a piece rate, i.e., 50 cents for each correct answer, or a tournament. When the
participant chooses tournament she receives $2 per correct answer if her score in task 3
exceeds that of the other group members in task 2, otherwise she receives no payment (in case
of ties the winner is chosen randomly).
Winners of the task-3 tournament are determined based on the comparison relative to
the other group members’ task-2 rather than task-3 performance. One can think of this as
competing against other participants who already performed.11 This has several advantages;
first, the performance of a player who enters the tournament is evaluated against the
performance of participants who also performed under tournament compensation. Second,
while beliefs regarding relative performance in a tournament may affect the decision to enter
the tournament, beliefs regarding the choices of others will not. Thus we avoid a potential
source of error through biased beliefs about other participants’ choices.12 Finally, an advantage
of this design is that a participant’s choice does not affect the payment of any other participant,
10 Furthermore, the winner of a tournament is paid per correct problem, thus we avoid the problem of choosing a high enough fixed prize to ensure that even high-performing participants benefit from entering the tournament. 11 Many sports competitions are not performed simultaneously, e.g., downhill skiing. 12 For example, it could be that men believe that women will not enter the tournament, meaning that they face only one other competitor, greatly changing the odds of winning the competition.
7
thus there are no externalities associated with tournament entry.13 Thus we can rule out that
women may shy away from competition because by winning the tournament they impose a
negative externality on others.14 Effectively in task 3 participants face an individual decision
problem which depends only on their ability to beat the task-2 performance of others and their
preference for performing in a tournament.
There are many potential reasons why women and men may differ in their tournament
entry decisions. It may be a simple gender difference in the preference for performing in
environments with uncertain payments, or in competitive environments that provide feedback
on relative performance. It could also be that women are less confident in their performance, or
less confident in being able to judge their performance. While some of these explanations are
specific to the competitive tournament environment, others are not. We use a last task to
determine whether gender differences in compensation remain when we eliminate all aspects
of the tournament choice that relate specifically to future performances in a competitive
environment, while keeping all others. In the last task participants are subjected to a choice
which is similar to that of task 3, but without using a tournament performance, and without
having participants subsequently perform in a tournament.
Task 4 – Submit Piece Rate:
Participants do not have to perform in this task. Rather if this task is selected for payment their
compensation depends on the number of correct answers they provided in the task-1 piece rate.
Participants choose which compensation they want to apply to their past piece-rate
performance: a 50 cent piece rate or a tournament. They win the tournament and receive $2 per
correct answer if their task-1 piece-rate performance is the highest of the participants in their
group, otherwise they receive no payment (in case of ties the winner is chosen randomly).
Before making their choice, participants are reminded of their task-1 piece-rate performance.
In task 4 we pay participants according to the task-1 piece rate, as opposed the task-2
tournament, to eliminate all aspects of performing in a tournament. As in the task-3 choice a
13 Our design allows for the possibility that there is no winner among participants who choose the tournament (if none of those entering the tournament beat the high score of their opponents). Conversely, all participants can win the tournament, if everyone increases their performance beyond the highest task-2 performance in that group. 14 For a discussion on possible gender differences in altruism see e.g., Andreoni and Vesterlund (2001). See Ledyard (1995) for gender differences in social dilemma and public good games, as well as Eckel and Grossman (2005) for a review of gender differences in experimental settings.
8
participant’s decision does not affect the earnings of any other participant, nor does it depend
on the entry decisions of others. Thus task 4 is also an individual decision task.
This final task allows us to see whether gender differences in compensation choice
appear even when no future tournament performance is involved. Furthermore, we can use this
task-4 decision as a control for the effect of uncertain payment, gender differences in assessing
and acting upon one’s beliefs in relative performance, and so on. These are all effects that are
present in the task-3 choice (and the task-4 choice), but are not unique to tournaments. With
this last decision as a control we estimate whether there is an additional gender difference
when it comes to entering a competitive environment.
The participants’ compensation decisions (task 3 and 4) may be driven by absolute
performance; however payments depend on relative performance. Since participants receive no
feedback on relative performance during the experiment, entry decisions are likely affected by
their beliefs about relative performance. To evaluate the effects of beliefs, and how participants
form beliefs we elicit beliefs on relative performance.
Belief-Assessment Questions:
At the end of the experiment participants are asked to guess their rank in the task-1 piece rate
and the task-2 tournament. Each participant picks a rank between 1 and 4, and is paid $1 for
each correct guess.15
At the end of the experiment, a number from 1 to 4 is drawn to determine which of the four
tasks is selected for earnings. The experiment lasted about 45 minutes, and participants earned
on average $19.80.
3. No Gender Differences in Performance
The objective of this study is to examine whether, conditional on ability, women and men
differ in their preference for performing under a piece-rate versus a tournament scheme. To
eliminate ability differences as an explanation for potential gender differences in tournament
15 In case of ties in the actual ranks, we counted every answer that could be correct as correct. For example, if the performance in the group was 10, 10, 11, 11, then an answer of last and third was correct for a score of 10, and an answer of best and second was correct for a score of 11.
9
entry, we want a task where women and men have similar performances under the two
compensations. We first confirm that we found such a task.
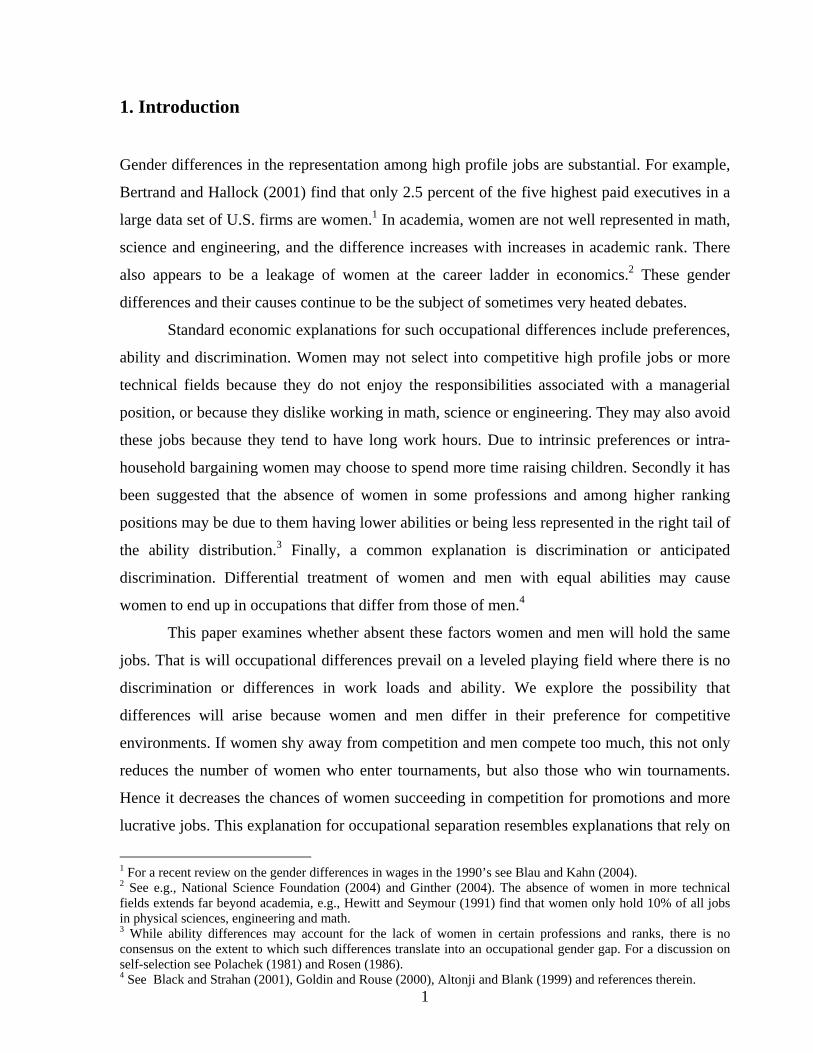
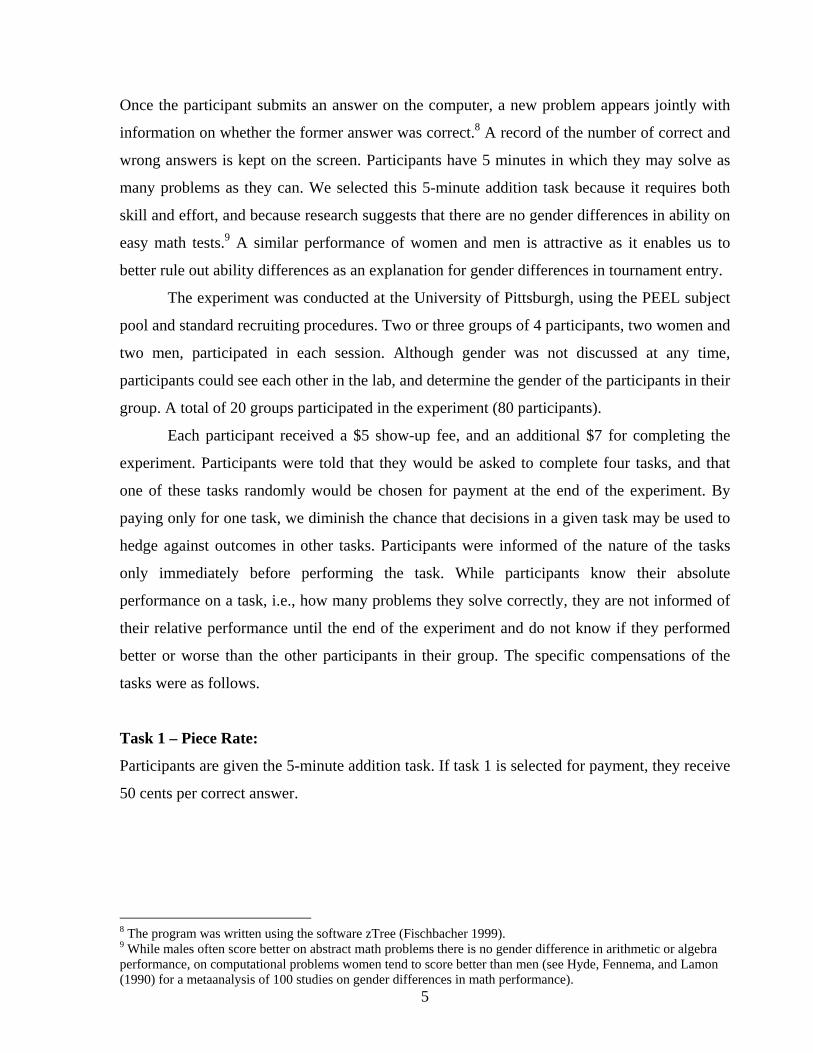
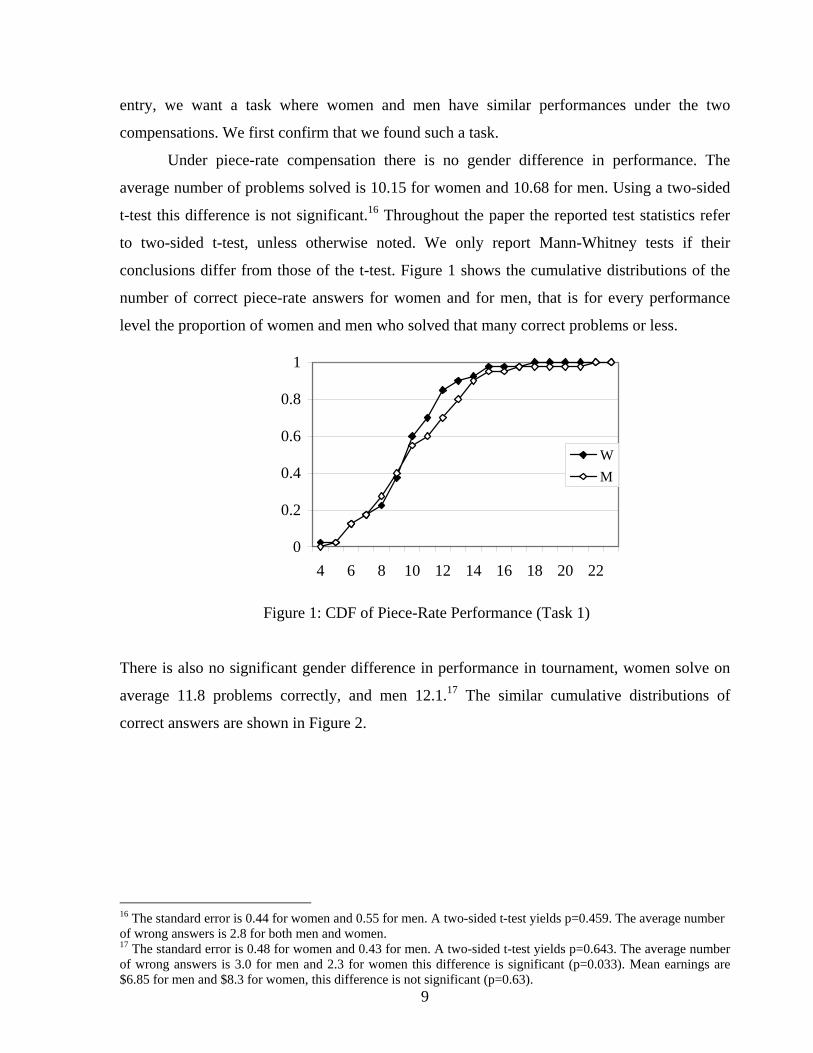
Under piece-rate compensation there is no gender difference in performance. The
average number of problems solved is 10.15 for women and 10.68 for men. Using a two-sided
t-test this difference is not significant.16 Throughout the paper the reported test statistics refer
to two-sided t-test, unless otherwise noted. We only report Mann-Whitney tests if their
conclusions differ from those of the t-test. Figure 1 shows the cumulative distributions of the
number of correct piece-rate answers for women and for men, that is for every performance
level the proportion of women and men who solved that many correct problems or less.
0
0.2
0.4
0.6
0.8
1
4 6 8 10 12 14 16 18 20 22
WM
Figure 1: CDF of Piece-Rate Performance (Task 1)
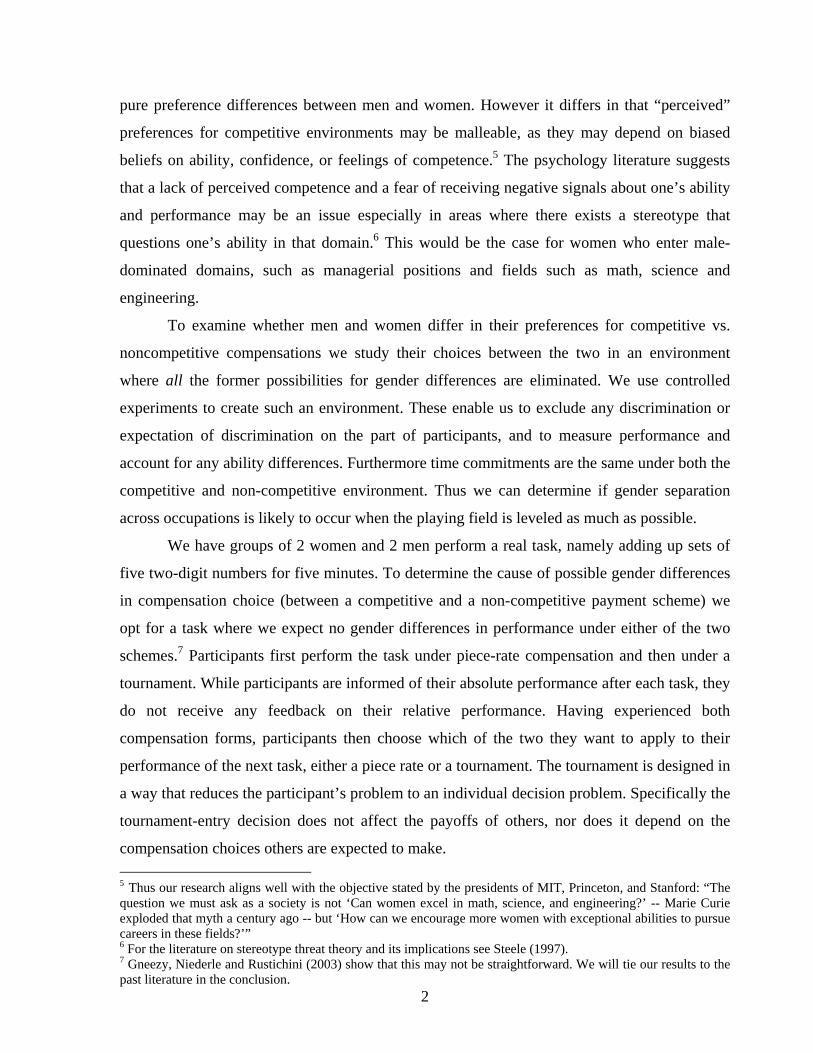
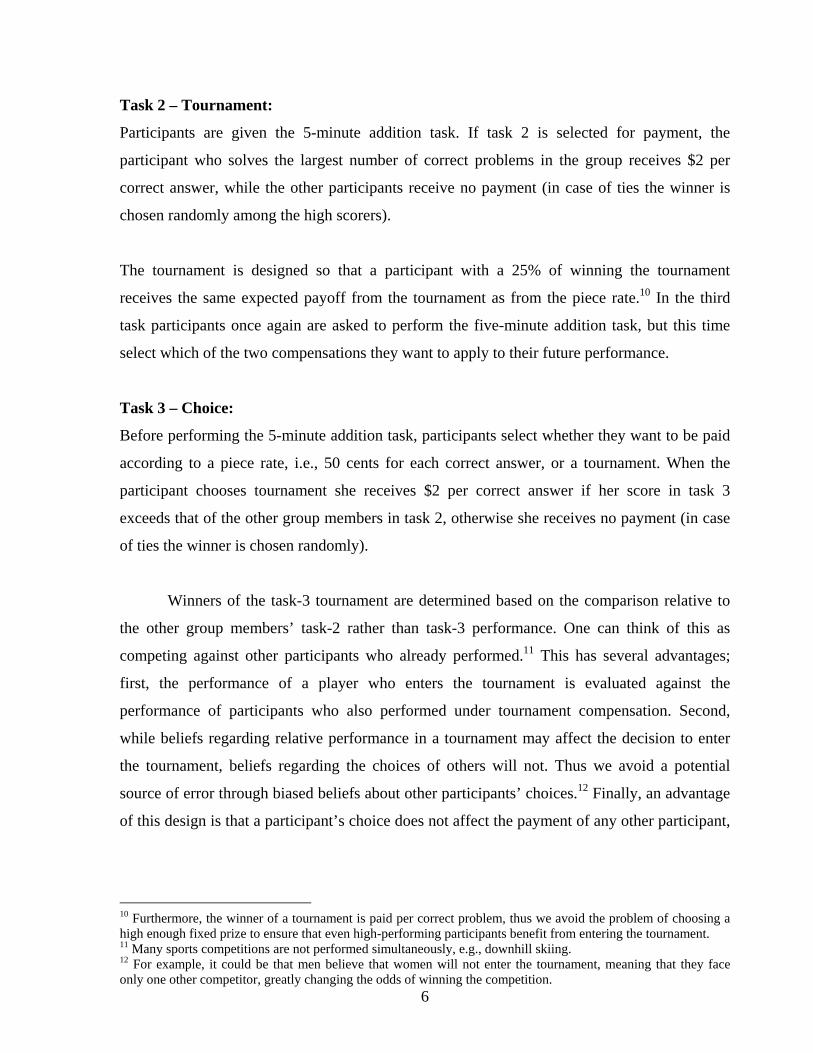
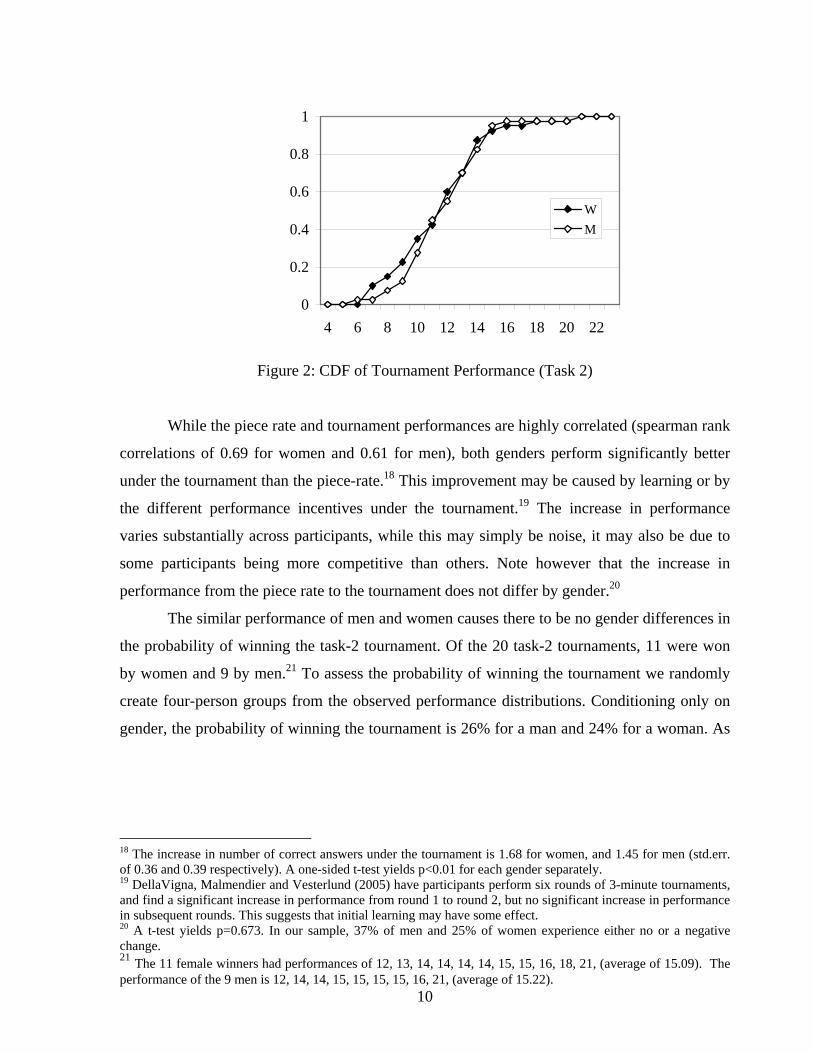
There is also no significant gender difference in performance in tournament, women solve on
average 11.8 problems correctly, and men 12.1.17 The similar cumulative distributions of
correct answers are shown in Figure 2.
16 The standard error is 0.44 for women and 0.55 for men. A two-sided t-test yields p=0.459. The average number of wrong answers is 2.8 for both men and women. 17 The standard error is 0.48 for women and 0.43 for men. A two-sided t-test yields p=0.643. The average number of wrong answers is 3.0 for men and 2.3 for women this difference is significant (p=0.033). Mean earnings are $6.85 for men and $8.3 for women, this difference is not significant (p=0.63).
10
0
0.2
0.4
0.6
0.8
1
4 6 8 10 12 14 16 18 20 22
WM
Figure 2: CDF of Tournament Performance (Task 2)
While the piece rate and tournament performances are highly correlated (spearman rank
correlations of 0.69 for women and 0.61 for men), both genders perform significantly better
under the tournament than the piece-rate.18 This improvement may be caused by learning or by
the different performance incentives under the tournament.19 The increase in performance
varies substantially across participants, while this may simply be noise, it may also be due to
some participants being more competitive than others. Note however that the increase in
performance from the piece rate to the tournament does not differ by gender.20
The similar performance of men and women causes there to be no gender differences in
the probability of winning the task-2 tournament. Of the 20 task-2 tournaments, 11 were won
by women and 9 by men.21 To assess the probability of winning the tournament we randomly
create four-person groups from the observed performance distributions. Conditioning only on
gender, the probability of winning the tournament is 26% for a man and 24% for a woman. As
18 The increase in number of correct answers under the tournament is 1.68 for women, and 1.45 for men (std.err. of 0.36 and 0.39 respectively). A one-sided t-test yields p<0.01 for each gender separately. 19 DellaVigna, Malmendier and Vesterlund (2005) have participants perform six rounds of 3-minute tournaments, and find a significant increase in performance from round 1 to round 2, but no significant increase in performance in subsequent rounds. This suggests that initial learning may have some effect. 20 A t-test yields p=0.673. In our sample, 37% of men and 25% of women experience either no or a negative change. 21 The 11 female winners had performances of 12, 13, 14, 14, 14, 14, 15, 15, 16, 18, 21, (average of 15.09). The performance of the 9 men is 12, 14, 14, 15, 15, 15, 15, 16, 21, (average of 15.22).
11
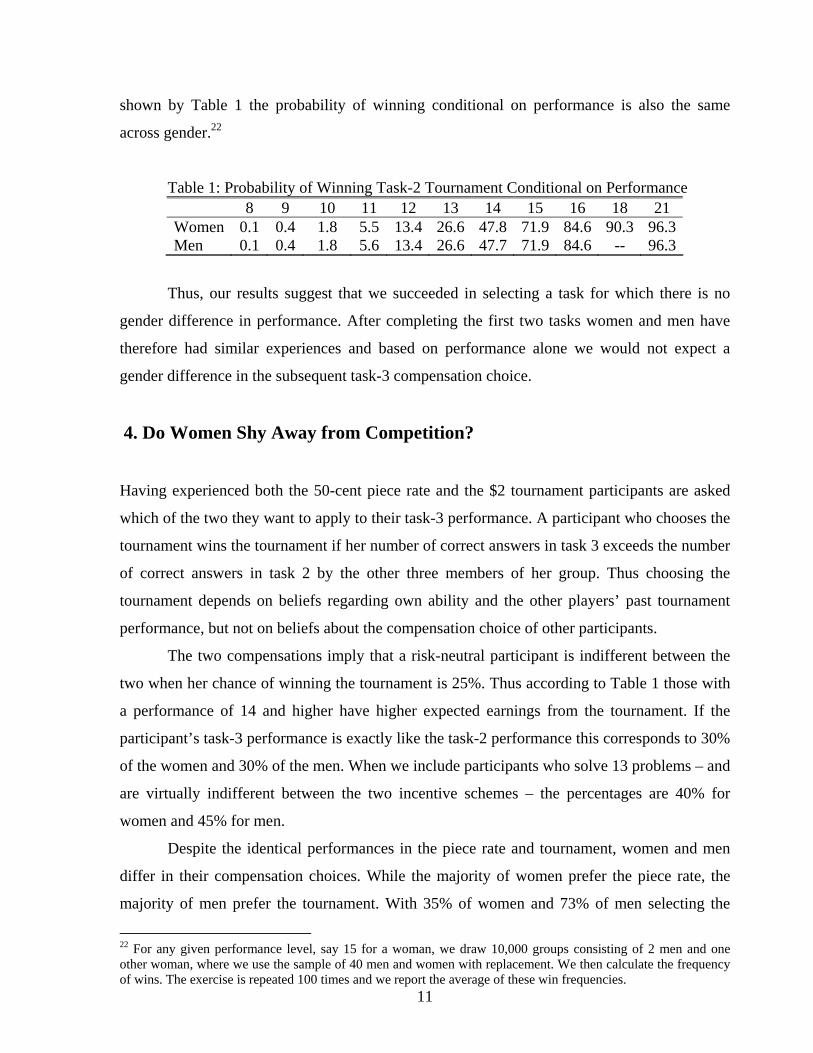
shown by Table 1 the probability of winning conditional on performance is also the same
across gender.22
Table 1: Probability of Winning Task-2 Tournament Conditional on Performance 8 9 10 11 12 13 14 15 16 18 21 Women 0.1 0.4 1.8 5.5 13.4 26.6 47.8 71.9 84.6 90.3 96.3Men 0.1 0.4 1.8 5.6 13.4 26.6 47.7 71.9 84.6 -- 96.3
Thus, our results suggest that we succeeded in selecting a task for which there is no
gender difference in performance. After completing the first two tasks women and men have
therefore had similar experiences and based on performance alone we would not expect a
gender difference in the subsequent task-3 compensation choice.
4. Do Women Shy Away from Competition?
Having experienced both the 50-cent piece rate and the $2 tournament participants are asked
which of the two they want to apply to their task-3 performance. A participant who chooses the
tournament wins the tournament if her number of correct answers in task 3 exceeds the number
of correct answers in task 2 by the other three members of her group. Thus choosing the
tournament depends on beliefs regarding own ability and the other players’ past tournament
performance, but not on beliefs about the compensation choice of other participants.
The two compensations imply that a risk-neutral participant is indifferent between the
two when her chance of winning the tournament is 25%. Thus according to Table 1 those with
a performance of 14 and higher have higher expected earnings from the tournament. If the
participant’s task-3 performance is exactly like the task-2 performance this corresponds to 30%
of the women and 30% of the men. When we include participants who solve 13 problems – and
are virtually indifferent between the two incentive schemes – the percentages are 40% for
women and 45% for men.
Despite the identical performances in the piece rate and tournament, women and men
differ in their compensation choices. While the majority of women prefer the piece rate, the
majority of men prefer the tournament. With 35% of women and 73% of men selecting the
22 For any given performance level, say 15 for a woman, we draw 10,000 groups consisting of 2 men and one other woman, where we use the sample of 40 men and women with replacement. We then calculate the frequency of wins. The exercise is repeated 100 times and we report the average of these win frequencies.

12
tournament, we find a significant and substantial gender gap in tournament entry.23 The
remainder of the paper focuses on examining possible explanations for this gender difference.
5. Does Performance Predict the Compensation Choice?
We start our investigation of the gender difference in compensation choice by examining
whether it can be explained by past and future performance, that is, absolute performance
before and after the compensation choice in task 3. We then determine whether beliefs about
relative performance can explain the difference.
5.1. Does Past Performance Predict Tournament Entry?
We first compare the mean past performance characteristics of participants who chose piece-
rate to those who did not. Table 2 reports, by gender and the chosen compensation, the average
number of problems solved correctly under piece rate (task 1) and tournament (task 2), as well
as the average increase in performance between the two.
Table 2: Performance Characteristics by Compensation Choice
Average Performance
Compensation Choice Piece Rate Tournament Tournament – Piece Rate
Women Piece Rate 10.35 (0.61)
11.77 (0.67)
1.42 (0.47)
Tournament 9.79 (0.58)
11.93 (0.63)
2.14 (0.54)
Men Piece Rate 9.91 (0.84)
11.09 (0.85)
1.18 (0.60)
Tournament 10.97 (0.67)
12.52 (0.48)
1.55 (0.49)
Notes to table: standard errors in parenthesis
For women there is no significant difference in performance between those who do and
do not enter the tournament.24 A probit regression of tournament entry on past performance
23 A Chi-square test yields a p-value of 0.001, and a Fisher’s exact test gives a p-value of 0.002. 24 Using a t-test to compare the performance of the women who do and do not select the tournament generates the following test statistics: p=0.55 for task-1 piece rate, p=0.88 for task-2 tournament, and p=0.35 for the difference in performance between task 2 and task 1.
13
reveals that neither tournament performance nor the increase in performance from the piece
rate to the tournament have a significant effect.25 For men only the tournament performance is
marginally higher for those who enter the tournament.26 A probit regression of tournament
entry on past tournament performance and the increase in performance from the piece rate
shows a marginal effect of the task-2 tournament performance of 0.04 (s.e. 0.02, p=0.15).27
That is, for men tournament performance has a very small and marginally significant effect on
the entry decision. Conditional on choice there is however no gender difference in task-1 and
task-2 performance.28
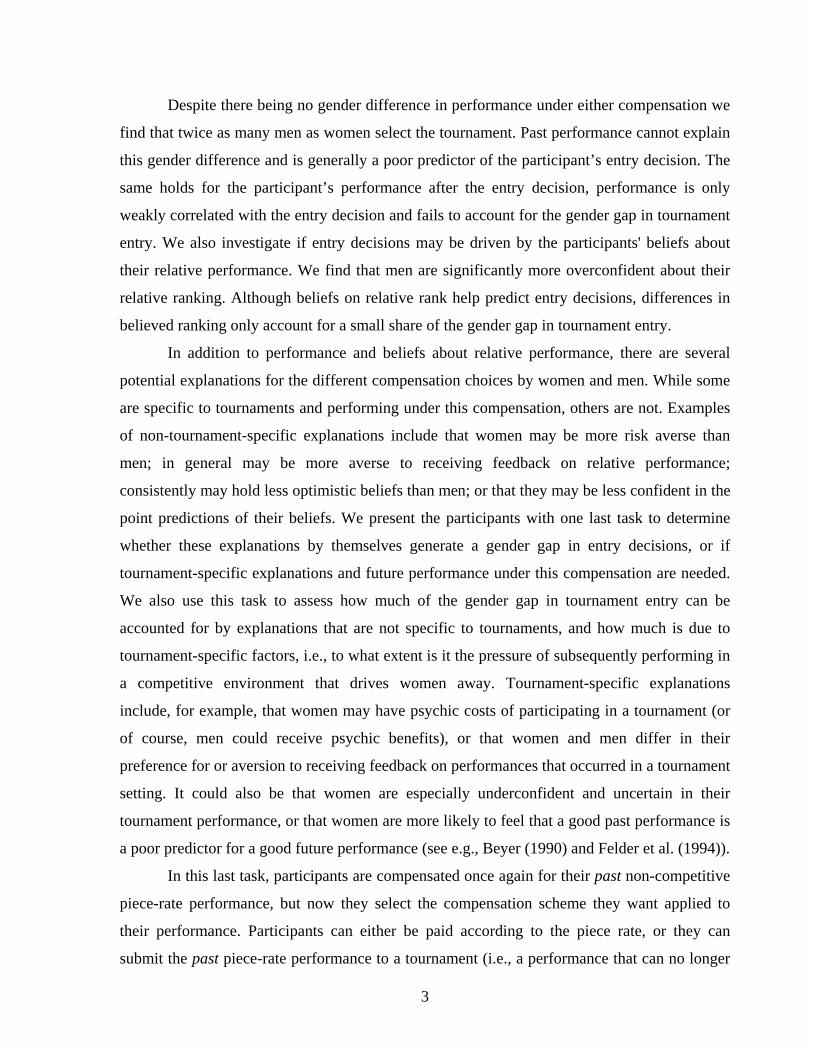
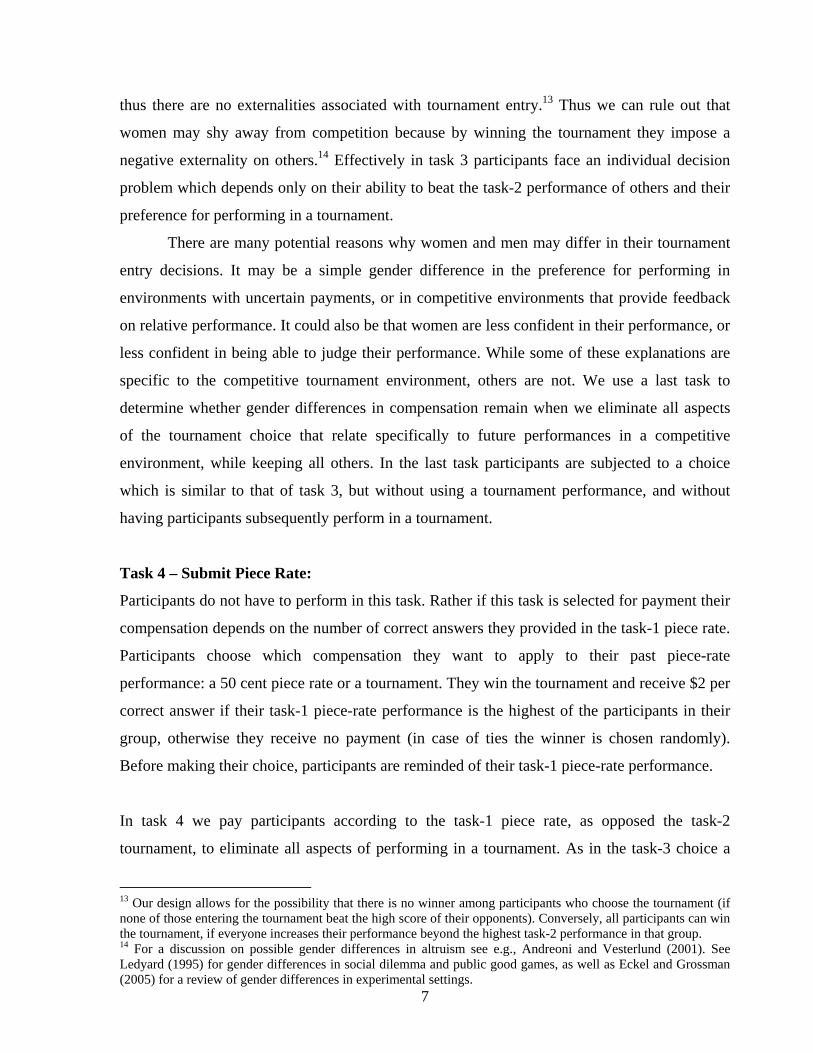
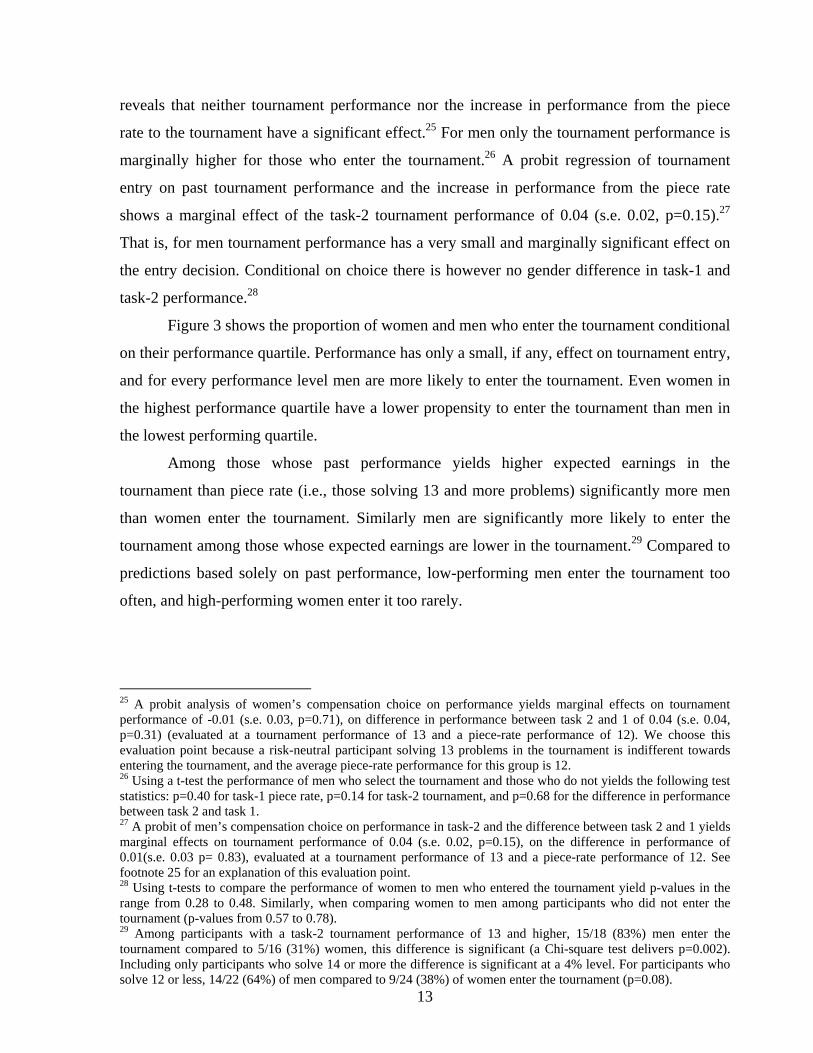
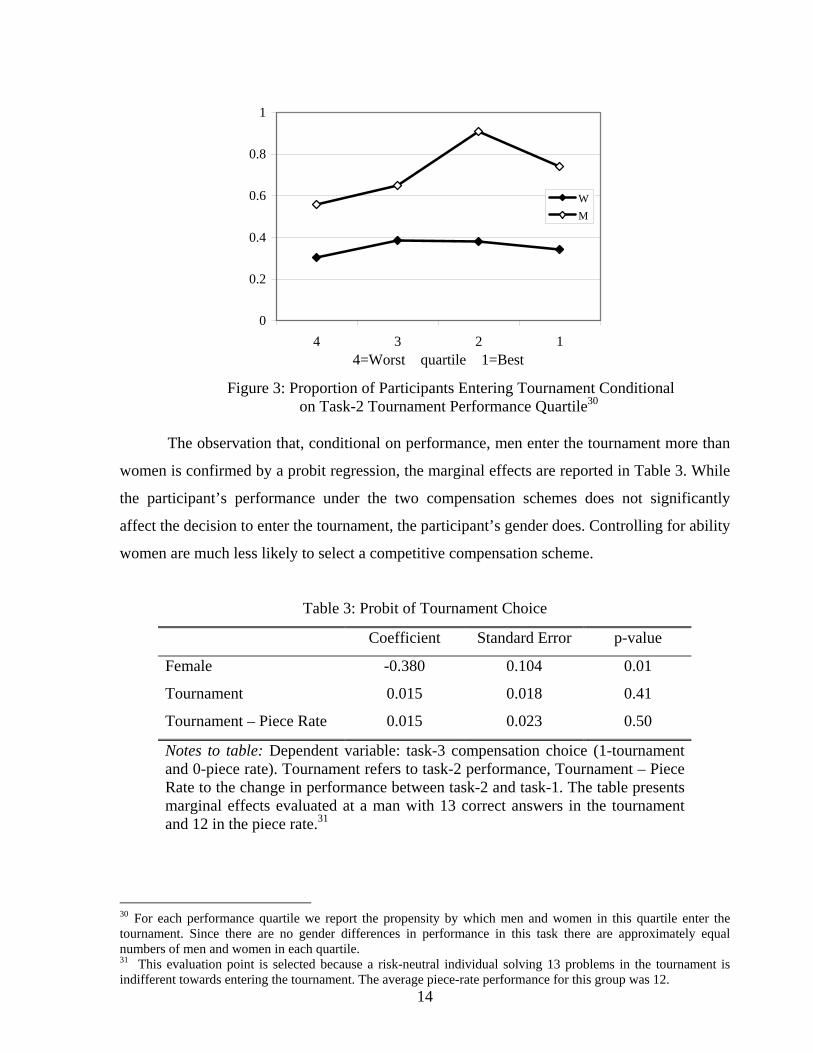
Figure 3 shows the proportion of women and men who enter the tournament conditional
on their performance quartile. Performance has only a small, if any, effect on tournament entry,
and for every performance level men are more likely to enter the tournament. Even women in
the highest performance quartile have a lower propensity to enter the tournament than men in
the lowest performing quartile.
Among those whose past performance yields higher expected earnings in the
tournament than piece rate (i.e., those solving 13 and more problems) significantly more men
than women enter the tournament. Similarly men are significantly more likely to enter the
tournament among those whose expected earnings are lower in the tournament.29 Compared to
predictions based solely on past performance, low-performing men enter the tournament too
often, and high-performing women enter it too rarely.
25 A probit analysis of women’s compensation choice on performance yields marginal effects on tournament performance of -0.01 (s.e. 0.03, p=0.71), on difference in performance between task 2 and 1 of 0.04 (s.e. 0.04, p=0.31) (evaluated at a tournament performance of 13 and a piece-rate performance of 12). We choose this evaluation point because a risk-neutral participant solving 13 problems in the tournament is indifferent towards entering the tournament, and the average piece-rate performance for this group is 12. 26 Using a t-test the performance of men who select the tournament and those who do not yields the following test statistics: p=0.40 for task-1 piece rate, p=0.14 for task-2 tournament, and p=0.68 for the difference in performance between task 2 and task 1. 27 A probit of men’s compensation choice on performance in task-2 and the difference between task 2 and 1 yields marginal effects on tournament performance of 0.04 (s.e. 0.02, p=0.15), on the difference in performance of 0.01(s.e. 0.03 p= 0.83), evaluated at a tournament performance of 13 and a piece-rate performance of 12. See footnote 25 for an explanation of this evaluation point. 28 Using t-tests to compare the performance of women to men who entered the tournament yield p-values in the range from 0.28 to 0.48. Similarly, when comparing women to men among participants who did not enter the tournament (p-values from 0.57 to 0.78). 29 Among participants with a task-2 tournament performance of 13 and higher, 15/18 (83%) men enter the tournament compared to 5/16 (31%) women, this difference is significant (a Chi-square test delivers p=0.002). Including only participants who solve 14 or more the difference is significant at a 4% level. For participants who solve 12 or less, 14/22 (64%) of men compared to 9/24 (38%) of women enter the tournament (p=0.08).
14
0
0.2
0.4
0.6
0.8
1
4 3 2 14=Worst quartile 1=Best
WM
Figure 3: Proportion of Participants Entering Tournament Conditional
on Task-2 Tournament Performance Quartile30 The observation that, conditional on performance, men enter the tournament more than
women is confirmed by a probit regression, the marginal effects are reported in Table 3. While
the participant’s performance under the two compensation schemes does not significantly
affect the decision to enter the tournament, the participant’s gender does. Controlling for ability
women are much less likely to select a competitive compensation scheme.
Table 3: Probit of Tournament Choice
Coefficient Standard Error p-value
Female -0.380 0.104 0.01
Tournament 0.015 0.018 0.41
Tournament – Piece Rate 0.015 0.023 0.50
Notes to table: Dependent variable: task-3 compensation choice (1-tournament and 0-piece rate). Tournament refers to task-2 performance, Tournament – Piece Rate to the change in performance between task-2 and task-1. The table presents marginal effects evaluated at a man with 13 correct answers in the tournament and 12 in the piece rate.31
30 For each performance quartile we report the propensity by which men and women in this quartile enter the tournament. Since there are no gender differences in performance in this task there are approximately equal numbers of men and women in each quartile. 31 This evaluation point is selected because a risk-neutral individual solving 13 problems in the tournament is indifferent towards entering the tournament. The average piece-rate performance for this group was 12.

15
A possible explanation for the observed gender difference in compensation choice may
be that there is a gender difference in performance following the choice – and that our
participants correctly anticipate such a difference.
5.2. Does Future Performance Predict Tournament Entry?
To assess if task-3 performance can account for the decision to enter the tournament, for each
gender we compare the task-3 performance conditional on the participant’s compensation
choice.
Table 4: Choice Performance Conditional on Compensation Choice Average Performance
Compensation Choice Choice (task 3) Choice-Tournament
Women Piece Rate 11.62 (0.62)
-0.15 (0.44)
Tournament 11.79 (0.64)
-0.14 (0.50)
Men Piece Rate 11.91 (0.91)
0.82 (0.44)
Tournament 13.48 (0.83)
0.97 (0.55)
Notes to table: standard errors in parenthesis.
Conditional on gender Table 4 shows that the task-3 performance does not differ between those
who do and do not enter the tournament.32 Similarly, the participants who enter the tournament
do not have a significantly different increase in performance in the choice task (task 3) relative
to the former (task 2) tournament.33 That is, not only is it not true that only participants with a
high past performance enter the tournament, it is also not true that those who entered the
tournament performed better than those who did not.34
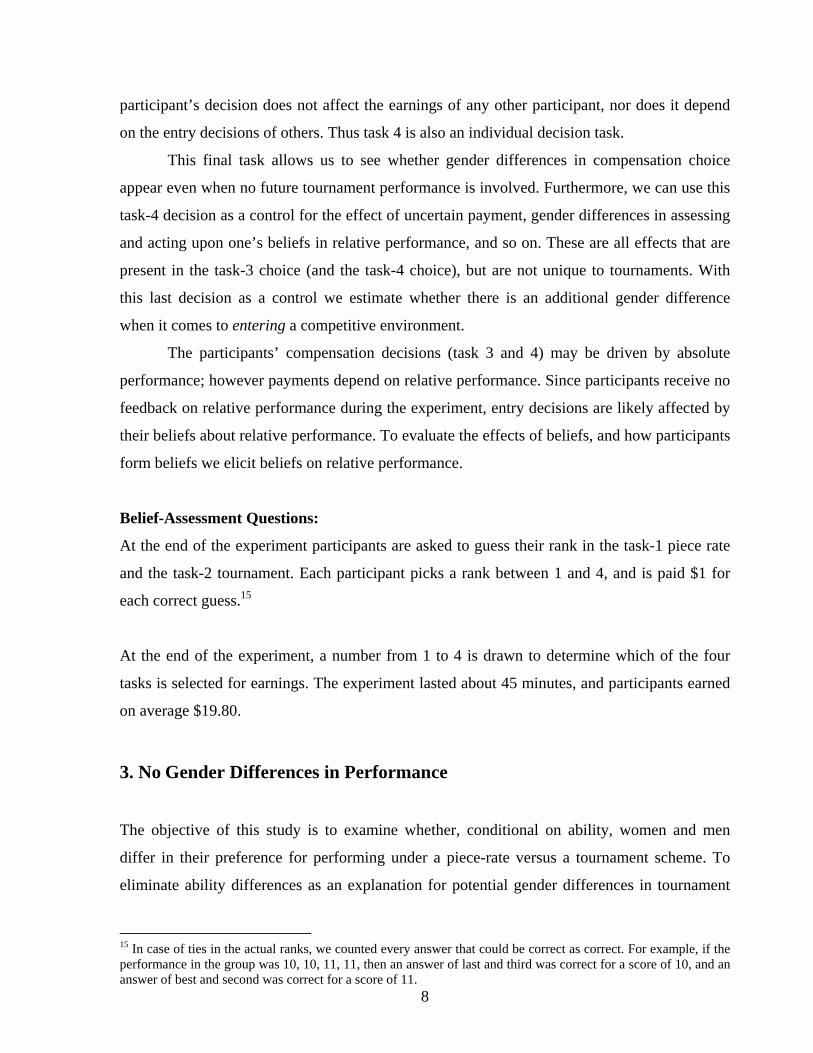
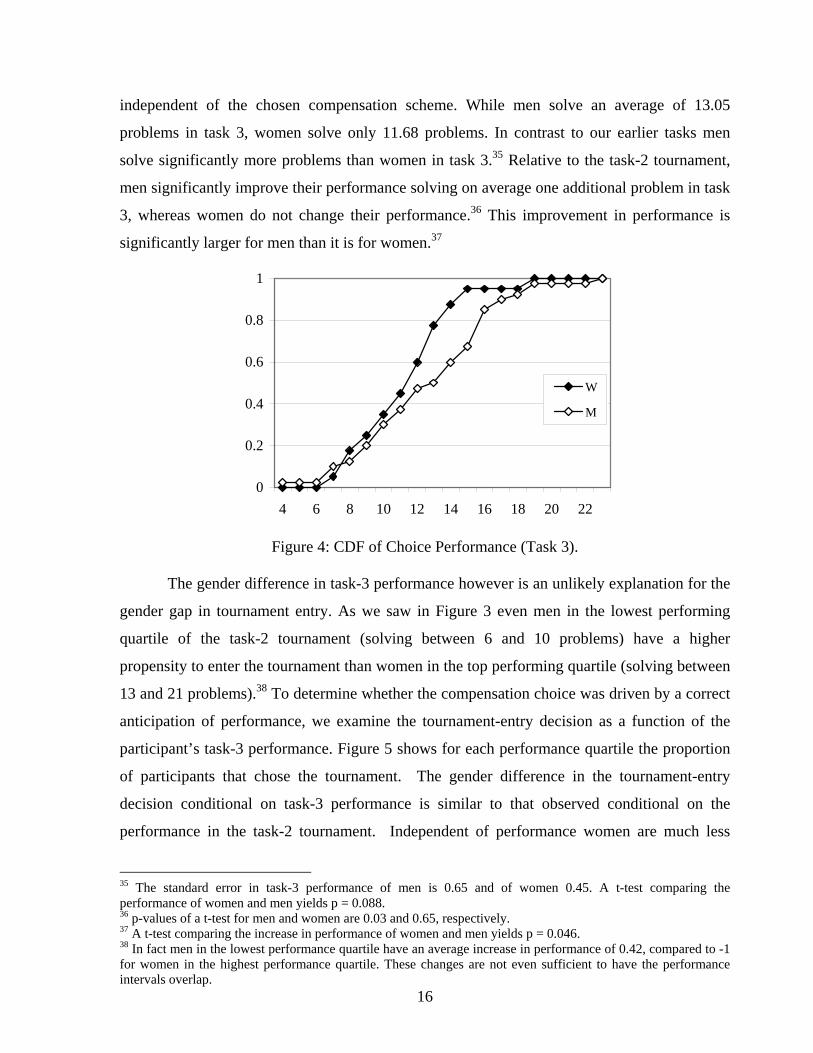
Although for a given gender, the task-3 performance does not predict which
participants enter the tournament, it may help explain the gender gap in tournament entry.
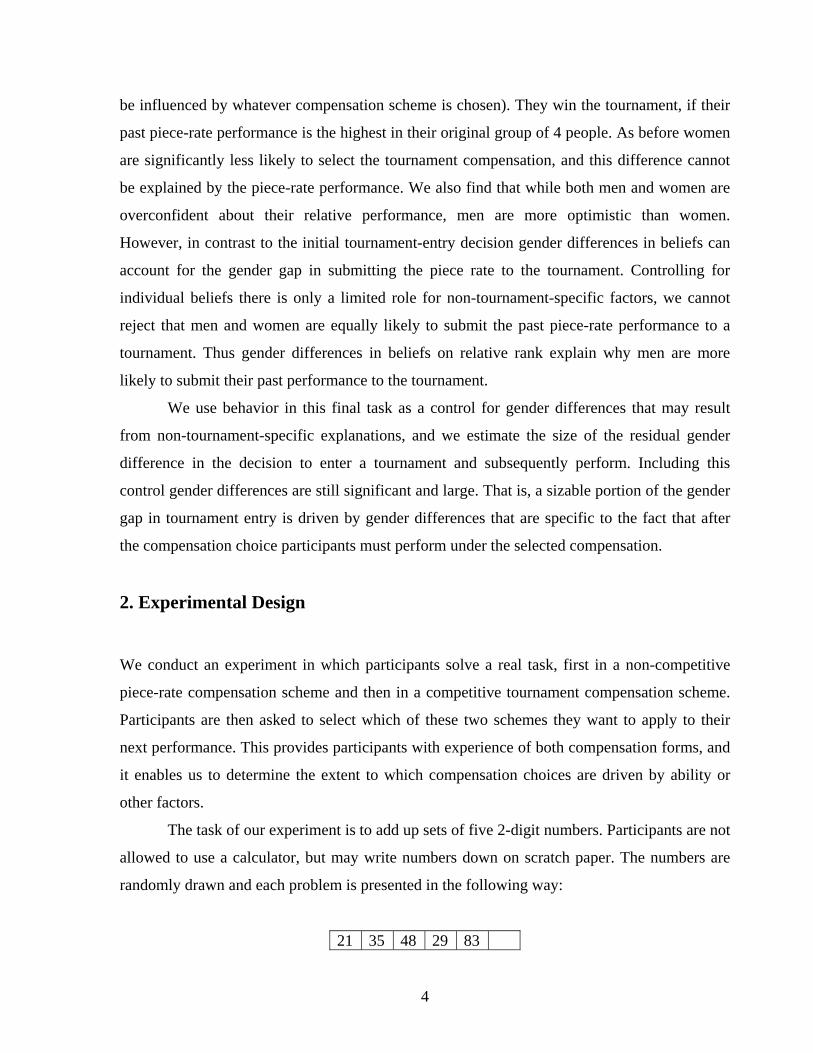
Figure 4 shows the cumulative distribution of the performance of women and men in task 3, 32 A t-test yields p=0.86 for women and p=0.288 for men. 33 A t-test yields p=0.99 for women and p=0.88 for men. 34 A probit analysis of the decision to enter as a function of the task-3 performance yields marginal effects of a participant that solves 13 in task 3 of 0.02 (s.e. 0.02, p=0.265) for men and 0.005 (s.e. 0.03, p=0.85) for women. That is, there is no significant effect of the performance on the decision to enter the tournament.
16
independent of the chosen compensation scheme. While men solve an average of 13.05
problems in task 3, women solve only 11.68 problems. In contrast to our earlier tasks men
solve significantly more problems than women in task 3.35 Relative to the task-2 tournament,
men significantly improve their performance solving on average one additional problem in task
3, whereas women do not change their performance.36 This improvement in performance is
significantly larger for men than it is for women.37
0
0.2
0.4
0.6
0.8
1
4 6 8 10 12 14 16 18 20 22
W
M
Figure 4: CDF of Choice Performance (Task 3).
The gender difference in task-3 performance however is an unlikely explanation for the
gender gap in tournament entry. As we saw in Figure 3 even men in the lowest performing
quartile of the task-2 tournament (solving between 6 and 10 problems) have a higher
propensity to enter the tournament than women in the top performing quartile (solving between
13 and 21 problems).38 To determine whether the compensation choice was driven by a correct
anticipation of performance, we examine the tournament-entry decision as a function of the
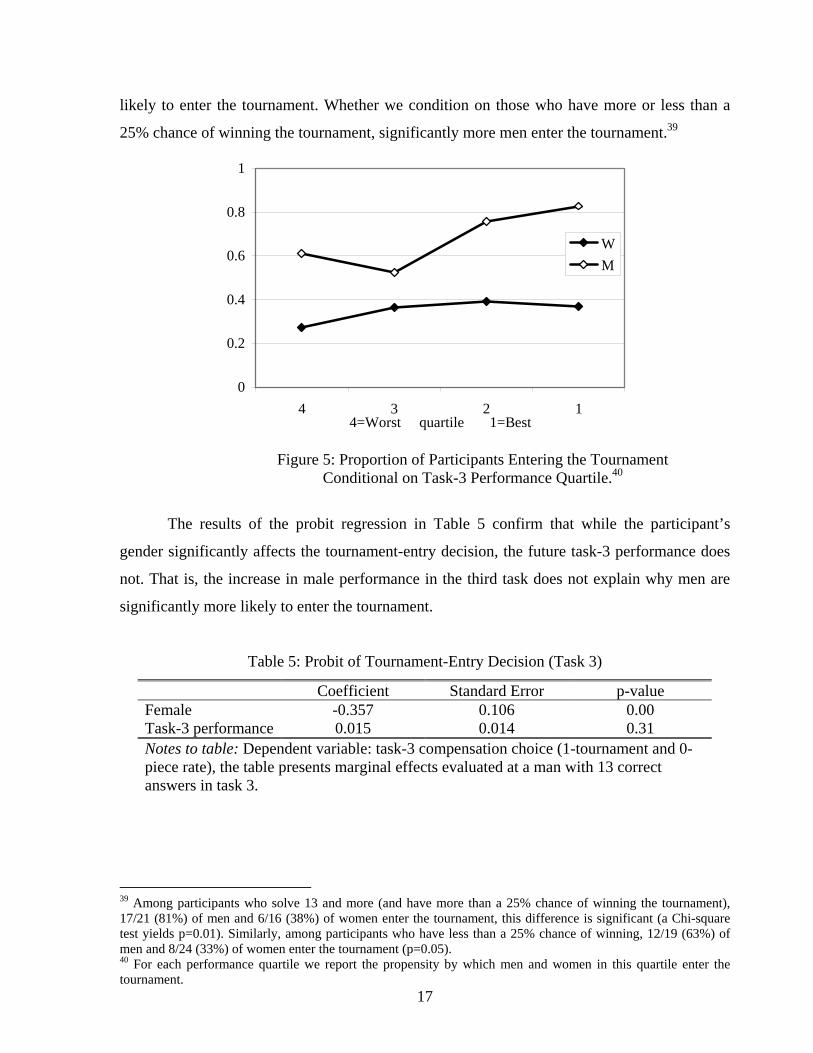
participant’s task-3 performance. Figure 5 shows for each performance quartile the proportion
of participants that chose the tournament. The gender difference in the tournament-entry
decision conditional on task-3 performance is similar to that observed conditional on the
performance in the task-2 tournament. Independent of performance women are much less
35 The standard error in task-3 performance of men is 0.65 and of women 0.45. A t-test comparing the performance of women and men yields p = 0.088. 36 p-values of a t-test for men and women are 0.03 and 0.65, respectively. 37 A t-test comparing the increase in performance of women and men yields p = 0.046. 38 In fact men in the lowest performance quartile have an average increase in performance of 0.42, compared to -1 for women in the highest performance quartile. These changes are not even sufficient to have the performance intervals overlap.
17
likely to enter the tournament. Whether we condition on those who have more or less than a
25% chance of winning the tournament, significantly more men enter the tournament.39
0
0.2
0.4
0.6
0.8
1
4 3 2 14=Worst quartile 1=Best
WM
Figure 5: Proportion of Participants Entering the Tournament
Conditional on Task-3 Performance Quartile.40
The results of the probit regression in Table 5 confirm that while the participant’s
gender significantly affects the tournament-entry decision, the future task-3 performance does
not. That is, the increase in male performance in the third task does not explain why men are
significantly more likely to enter the tournament.
Table 5: Probit of Tournament-Entry Decision (Task 3)
Coefficient Standard Error p-value Female -0.357 0.106 0.00 Task-3 performance 0.015 0.014 0.31 Notes to table: Dependent variable: task-3 compensation choice (1-tournament and 0-piece rate), the table presents marginal effects evaluated at a man with 13 correct answers in task 3.
39 Among participants who solve 13 and more (and have more than a 25% chance of winning the tournament), 17/21 (81%) of men and 6/16 (38%) of women enter the tournament, this difference is significant (a Chi-square test yields p=0.01). Similarly, among participants who have less than a 25% chance of winning, 12/19 (63%) of men and 8/24 (33%) of women enter the tournament (p=0.05). 40 For each performance quartile we report the propensity by which men and women in this quartile enter the tournament.
18
5.3. Is the Entry Decision Determined by Beliefs on Relative Performance?
Actual performance cannot explain the gender gap in compensation choice. This may be
because tournament entry depends not on an individual’s absolute ability, but on how ability
ranks relative to the other group members. While participants are aware of their absolute
performance, they do not know their relative ranking. Hence the compensation choice may
depend on beliefs on relative performance. We elicited the participants’ beliefs at the end of
the experiment by asking them to guess how their performance in task-2 ranked relative to the
other members of their group. Participants received $1 if their guess was correct, and in the
event of a tie they were compensated for any guess that could be deemed correct.41
We start by examining whether men and women of equal ability differ in their
assessment of their relative performance. We then ask whether these potential confidence
differences can account for the gender difference in tournament entry. That is conditional on
beliefs about relative performance, are men and women equally likely to select the tournament.
5.3.1. Do Women and Men Form the Same Beliefs?
First we determine the distribution of guessed ranks we expect if participants are perfectly
calibrated and payoff maximizing. Due to the tie-breaking rule, participants who only know
their gender and the performance distributions of men and women have an incentive to guess
that they are ranked second or third.42 Assuming that participants also know their own
performance we can determine the distribution of optimal guessed ranks, these are reported in
Table 6 along with the actual distribution of ranks. Given the similar performances of women
and men, optimal guesses are dependent on performance, but not on gender.43
41 For example, in the event of a two-way tie for first rank, a guess of either first or second rank pays $1. While the payment for the guessed rank is not very high, it may still offer participants the opportunity to use a guess as a potential source of hedging. The elicited beliefs indicate that this was not a motive for the majority of participants. 42 Based on 10,000 artificially generated groups the likelihood of a woman being ranked first is 0.223, second 0.261, third 0.262, and last 0.255, the corresponding probabilities for a man for first is 0.243, second 0.288, third 0.278, and last 0.199. 43 Optimal guesses are 1 for a performance of 14 and higher, 2 for a performance of 12 and 13, and 3 for a performance of 10 and 11. The distributions in Table 6 are based on the results of 10.000 randomly generated groups for each performance level of men and women. Neither the actual rankings, nor the optimal guesses differ significantly by gender (the p-values of Chi-square tests are 0.54 and 0.50 respectively).
19
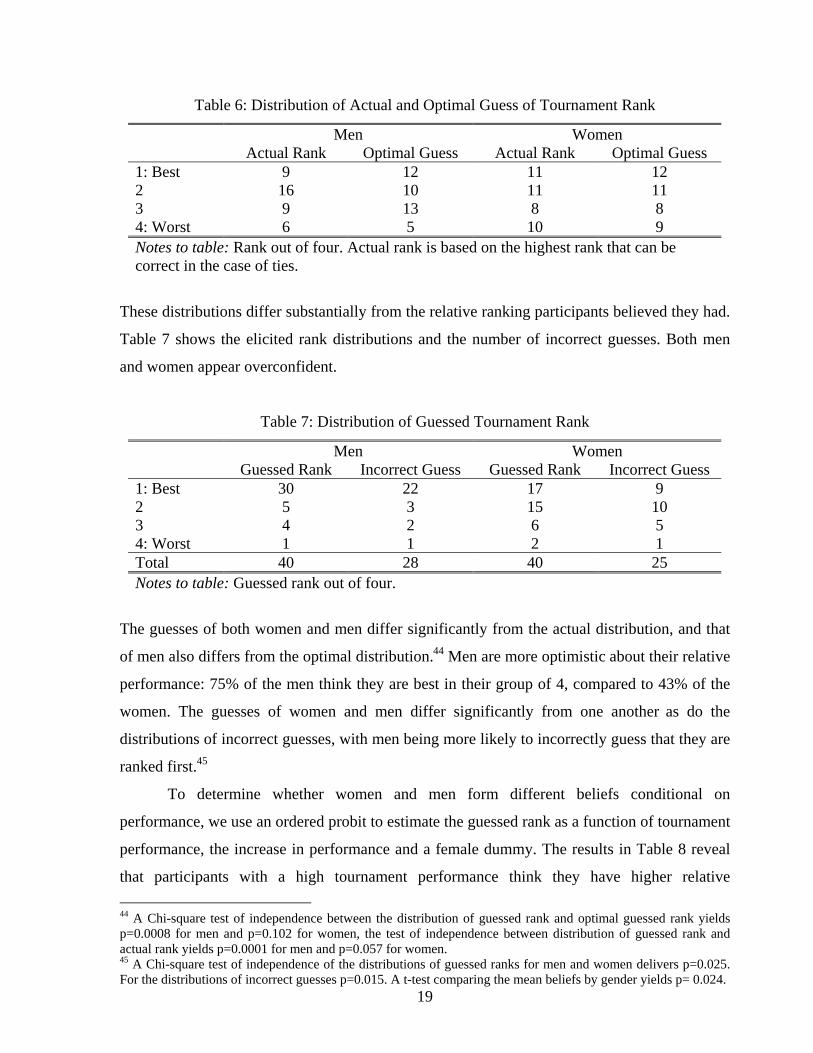
Table 6: Distribution of Actual and Optimal Guess of Tournament Rank
Men Women Actual Rank Optimal Guess Actual Rank Optimal Guess 1: Best 9 12 11 12 2 16 10 11 11 3 9 13 8 8 4: Worst 6 5 10 9 Notes to table: Rank out of four. Actual rank is based on the highest rank that can be correct in the case of ties.
These distributions differ substantially from the relative ranking participants believed they had.
Table 7 shows the elicited rank distributions and the number of incorrect guesses. Both men
and women appear overconfident.
Table 7: Distribution of Guessed Tournament Rank
Men Women Guessed Rank Incorrect Guess Guessed Rank Incorrect Guess 1: Best 30 22 17 9 2 5 3 15 10 3 4 2 6 5 4: Worst 1 1 2 1 Total 40 28 40 25 Notes to table: Guessed rank out of four.
The guesses of both women and men differ significantly from the actual distribution, and that
of men also differs from the optimal distribution.44 Men are more optimistic about their relative
performance: 75% of the men think they are best in their group of 4, compared to 43% of the
women. The guesses of women and men differ significantly from one another as do the
distributions of incorrect guesses, with men being more likely to incorrectly guess that they are
ranked first.45
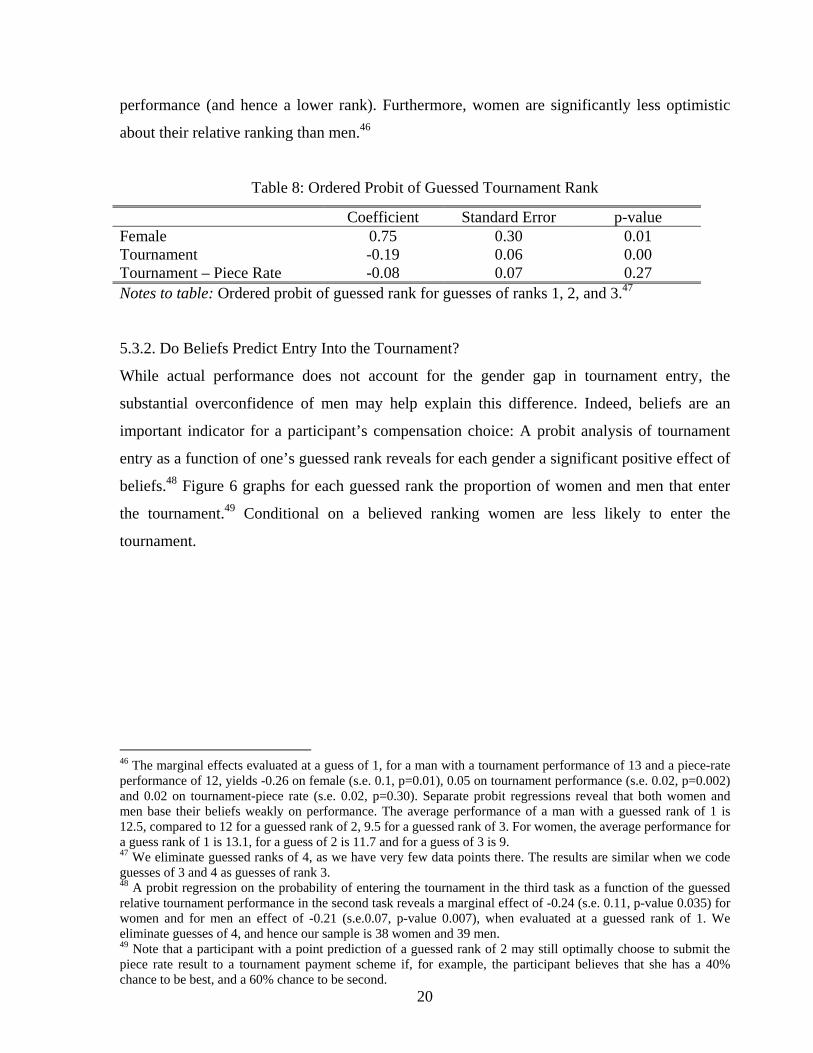
To determine whether women and men form different beliefs conditional on
performance, we use an ordered probit to estimate the guessed rank as a function of tournament
performance, the increase in performance and a female dummy. The results in Table 8 reveal
that participants with a high tournament performance think they have higher relative 44 A Chi-square test of independence between the distribution of guessed rank and optimal guessed rank yields p=0.0008 for men and p=0.102 for women, the test of independence between distribution of guessed rank and actual rank yields p=0.0001 for men and p=0.057 for women. 45 A Chi-square test of independence of the distributions of guessed ranks for men and women delivers p=0.025. For the distributions of incorrect guesses p=0.015. A t-test comparing the mean beliefs by gender yields p= 0.024.
20
performance (and hence a lower rank). Furthermore, women are significantly less optimistic
about their relative ranking than men.46
Table 8: Ordered Probit of Guessed Tournament Rank
Coefficient Standard Error p-value Female 0.75 0.30 0.01 Tournament -0.19 0.06 0.00 Tournament – Piece Rate -0.08 0.07 0.27 Notes to table: Ordered probit of guessed rank for guesses of ranks 1, 2, and 3.47 5.3.2. Do Beliefs Predict Entry Into the Tournament?
While actual performance does not account for the gender gap in tournament entry, the
substantial overconfidence of men may help explain this difference. Indeed, beliefs are an
important indicator for a participant’s compensation choice: A probit analysis of tournament
entry as a function of one’s guessed rank reveals for each gender a significant positive effect of
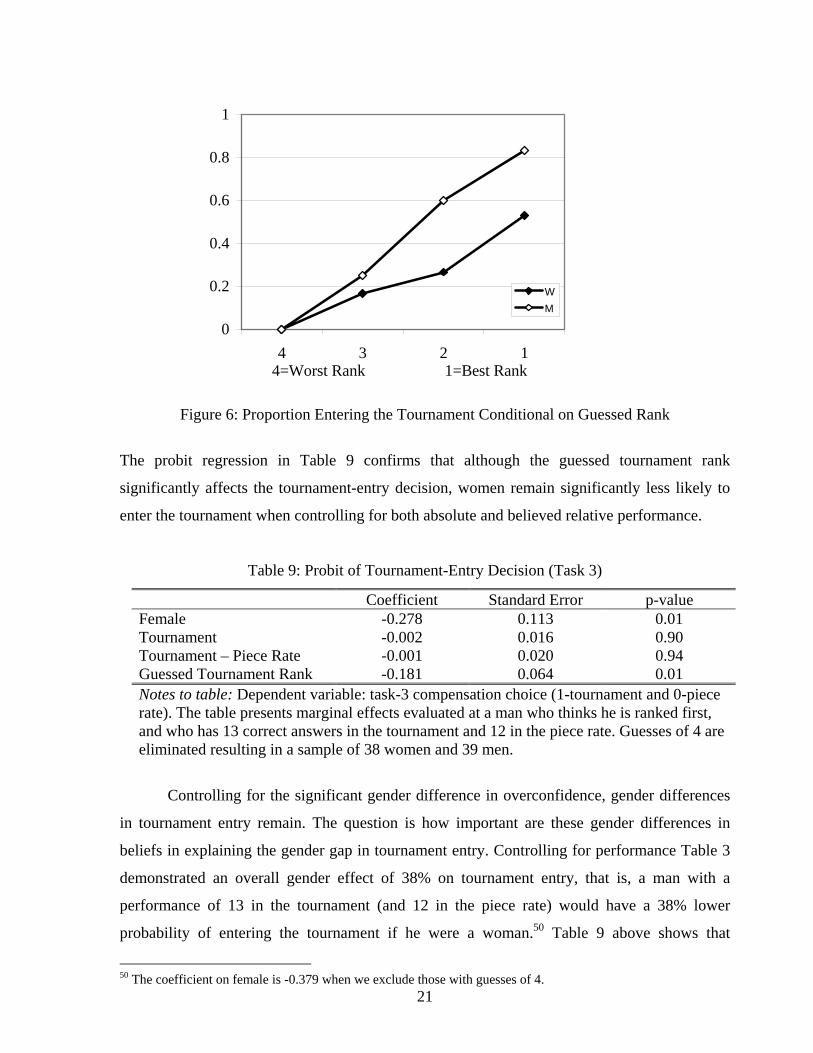
beliefs.48 Figure 6 graphs for each guessed rank the proportion of women and men that enter
the tournament.49 Conditional on a believed ranking women are less likely to enter the
tournament.
46 The marginal effects evaluated at a guess of 1, for a man with a tournament performance of 13 and a piece-rate performance of 12, yields -0.26 on female (s.e. 0.1, p=0.01), 0.05 on tournament performance (s.e. 0.02, p=0.002) and 0.02 on tournament-piece rate (s.e. 0.02, p=0.30). Separate probit regressions reveal that both women and men base their beliefs weakly on performance. The average performance of a man with a guessed rank of 1 is 12.5, compared to 12 for a guessed rank of 2, 9.5 for a guessed rank of 3. For women, the average performance for a guess rank of 1 is 13.1, for a guess of 2 is 11.7 and for a guess of 3 is 9. 47 We eliminate guessed ranks of 4, as we have very few data points there. The results are similar when we code guesses of 3 and 4 as guesses of rank 3. 48 A probit regression on the probability of entering the tournament in the third task as a function of the guessed relative tournament performance in the second task reveals a marginal effect of -0.24 (s.e. 0.11, p-value 0.035) for women and for men an effect of -0.21 (s.e.0.07, p-value 0.007), when evaluated at a guessed rank of 1. We eliminate guesses of 4, and hence our sample is 38 women and 39 men. 49 Note that a participant with a point prediction of a guessed rank of 2 may still optimally choose to submit the piece rate result to a tournament payment scheme if, for example, the participant believes that she has a 40% chance to be best, and a 60% chance to be second.
21
0
0.2
0.4
0.6
0.8
1
4 3 2 14=Worst Rank 1=Best Rank
WM
Figure 6: Proportion Entering the Tournament Conditional on Guessed Rank
The probit regression in Table 9 confirms that although the guessed tournament rank
significantly affects the tournament-entry decision, women remain significantly less likely to
enter the tournament when controlling for both absolute and believed relative performance.
Table 9: Probit of Tournament-Entry Decision (Task 3)
Coefficient Standard Error p-value Female -0.278 0.113 0.01 Tournament -0.002 0.016 0.90 Tournament – Piece Rate -0.001 0.020 0.94 Guessed Tournament Rank -0.181 0.064 0.01 Notes to table: Dependent variable: task-3 compensation choice (1-tournament and 0-piece rate). The table presents marginal effects evaluated at a man who thinks he is ranked first, and who has 13 correct answers in the tournament and 12 in the piece rate. Guesses of 4 are eliminated resulting in a sample of 38 women and 39 men.
Controlling for the significant gender difference in overconfidence, gender differences
in tournament entry remain. The question is how important are these gender differences in
beliefs in explaining the gender gap in tournament entry. Controlling for performance Table 3
demonstrated an overall gender effect of 38% on tournament entry, that is, a man with a
performance of 13 in the tournament (and 12 in the piece rate) would have a 38% lower
probability of entering the tournament if he were a woman.50 Table 9 above shows that
50 The coefficient on female is -0.379 when we exclude those with guesses of 4.
22
including the control for guessed tournament rank the gender effect is 28%. That is, 27% of the
overall gender gap can be attributed to women and men forming different beliefs. The
remaining 73% of the overall gender effect is unaccounted for.
Our results thus far show that neither performance before nor after the entry decision
can explain the substantial gap in tournament entry. We also find that the substantial
overconfidence of men only explains a small share of the difference. From a payoff-
maximizing perspective high-performing women enter the tournament too rarely, and low-
performing men enter the tournament too often, that is women seem to shy away from
competition, as much as men are drawn to it.
6. Alternative Explanations for the Gender Gap in Tournament Entry.
In this section we consider a number of possible explanations for why women shy away from
competition, while men compete too much. We distinguish between reasons that are and are
not unique to the tournament compensation. For example, a non-tournament-specific
explanation may be that women inherently dislike (and men like) uncertain payment schemes,
while a tournament-specific explanation may be that women do not like the pressure of
performing in a competitive environment while men are drawn to it. We consider in turn
explanations that are related to preferences, confidence in ability and precision of beliefs.
Preferences
Gender differences in taste for competition (tournament specific): Women may shy away from
competition, simply because they dislike being in an environment where they have to compete.
The pressure of future competition may impose a psychic cost and deter women from
tournaments. Of course the reverse argument is that men may get a psychic benefit from
performing in competitive environments and therefore be drawn to them. The discomfort or
comfort of competition need not be correlated with the ability to perform in a competitive
environment.51 This explanation is unique to tournament compensation.
Risk aversion (general): As tournaments involve uncertain payoffs, risk attitudes in itself are
another aspect of preferences which may affect the compensation choice. If women are more
51 While “psychic” costs and benefits of a tournament may deter entry, it need not affect tournament performance.
23
risk-averse than men, then a man and a woman with the same ability, performance and beliefs
about relative performance may prefer different compensations.52
In considering this explanation it is important to note that the gender difference in risk
aversion would have to be very large to explain the observed gap in tournament entry. For
example, for participants who have 14 or more correct answers the chance of winning the
tournament is 47% and higher. Presuming that one can maintain the performance in task 3 and
ignoring the potential costs of performing in the tournament, the decision to enter the
tournament becomes a gamble of receiving, per correct answer, either $2 with a probability of
47% (or more), or receiving 50 cents for sure. For participants who have 14 correct answers
that means a gamble of a 47% chance of $28 (i.e., an expected value of $13), versus a sure gain
of $7. Of the participants who solve 14 problems or more, 8/12 of the women and 3/12 of the
men do not take this gamble.53 Similarly, for participants who have 11 or fewer correct
answers the chance of winning the tournament is 5.6% or less. Thus entering the tournament
means receiving $2 per correct answer with a probability of 5.6% (or less) versus receiving 50
cents for sure. For participants who solve 11 correct answers this is a choice between a 5.6%
chance of winning $22 (i.e., an expected value of $1.23) compared to receiving $5.5 for sure.
Of the men who solve 11 problems or less 11/18 take this gamble while only 5/17 women do.54
We are not aware of any studies that find such extreme gender differences in risk aversion.
Furthermore if risk aversion is the main explanation for the gender gap in tournament
entry then we would not expect men to enter the tournament with a higher probability than
women for all performance levels, but rather that the female-entry decision was shifted to the
right of the male-entry decision.
Preferences for feedback about one’s relative performance (general and tournament specific):
Another possible explanation for why women shy away from competition while men are drawn
to it, may be a gender difference in the preference for receiving feedback about their relative
performance. While information on relative performance is not unique to the tournament, it
52 While there is some debate on whether there is a gender difference in risk attitudes, most studies find either no gender difference or that women are more averse to risk than men. Eckel and Grossman (2005) summarize the literature on gender differences in risk taking, and Eckel and Grossman (2002) find gender differences in choice of lotteries. The psychology literature is summarized in Byrnes, Miller and Shafer (1999). See Vesterlund (1997) for an examination of the effect gender differences in risk aversion may have on labor market outcomes of women and men. 53 This difference is marginally significant with a two-sided Fisher’s exact test (p= 0.100). 54 This difference is marginally significant with a two-sided Fisher’s exact test (p= 0.092).
24
may be that the participants are more averse or attracted to receiving feedback on relative
performance in a competitive setting. Thus some component of preferences for receiving
feedback may be unique to tournaments.
Point predictions of beliefs
Differences in optimism about relative performance (general and tournament specific): Our
results show that compared to men women are less optimistic about their relative tournament
performance, and that this difference can account for some portion of the gender gap in
tournament entry. However lower female confidence need not be unique to a competitive
environment, and may be present independent of the incentive scheme (see e.g., Lichtenstein,
Fischhoff and Phillips (1982), Beyer (1990) and Beyer and Bowden (1997)).55 On the other
hand it is possible that women are even less confident in competitive environments, such as the
task-2 tournament. This could be because of a stereotype that women are not so competitive, or
that women may be more stressed during the tournament (Steele 1997).56 Thus some
component of lower female confidence could be specific to the tournament.
Certainty in and acting upon one’s beliefs
Uncertainty in beliefs about relative performance (general and tournament specific): In
addition to being less optimistic about their relative ranking, it may be that women are also less
certain about how correct their believed ranking is. That is, independent of the environment
women may be more hesitant in responding to their beliefs because they perceive these as
being imprecise. While uncertainty about an individual’s beliefs does not only affect
tournament entry, such uncertainty may be more severe in a competitive setting where women
are perceived to do poorly. Thus there may be a tournament-specific component to uncertainty
in beliefs.
Biased beliefs about future performance (tournament specific): Another reason why women
may act differently than men for a given point prediction of the believed task-2 ranking, is that
55 It seems, however, that women are better calibrated than men in their beliefs about their relative tournament performance, hence the more appropriate question may be why men think so highly of themselves. 56 Stereotype threat theory suggests that stereotyped individuals (e.g., women who are supposed to be poor competitors) who find themselves in a situation where they run the risk of confirming the stereotype (i.e., in a tournament where they may lose) may feel additional performance anxiety for fear of confirming the stereotype. This additional threat may harm female performance as they may “choke” under the pressure.
25
women may think that their past tournament performance is a poor predictor for future
tournament performance. A rather extensive literature asserts that women are more prone to
attribute past successes to luck than to inner attributes (and past failures less to bad luck), while
men do the opposite.57 If this is the case then women and men will act differently conditional
on their believed ranking in the task-2 tournament.
As a test of the basis of this belief we determine whether the performance of women is
more variable than that of men. We examine the increase in performance between the piece
rate and the tournament, as that is the only variance participants observe before choosing their
compensation. The average increase in performance is 1.45 for men (s.e. of 0.39) and 1.68 for
women (s.e. of 0.36). The increase in performance does not differ across gender and an F-test
on the equality of variance delivers p=0.64. Thus there is no evidence that women receive more
volatile performance information prior to their choice. Furthermore, the change in performance
from the tournament to the choice task has a similar pattern. The average increase in
performance is 0.93 for men (with a s.e. of 0.42) and -0.15 for women (with a s.e. of 0.33).
Men improve their performance significantly more than women, and an F-test on the equality
of variance delivers p=0.15. If anything, male performance is more variable.
Another reason for biased beliefs about future performance in the tournament may be
that men overestimate how well they will do in future tournaments. With participants having a
higher performance in the tournament than in the piece rate, men may be more prone to believe
that they will continue to increase their performance. Note however that if this were the case
we would expect the tournament-entry decision to be correlated with the increase in
performance participants experience between the piece rate and the tournament. However, as
seen in Table 3 (and footnotes 25 and 27), the increase in performance is not correlated with
tournament entry. Furthermore, with 75% of men thinking they are best in task 2 this
proportion will only increase marginally if men believe their performance will continue to
improve.
There are a variety of possible explanations for why women and men differ in the propensity
by which they enter a tournament. Some of these are specific to tournaments, and some are not.
One possible way to determine the extent to which the tournament environment alone
generates gender differences in compensation choice is to separately estimate the effect of each
57 Beyer (1990) and Felder et al. (1994).

26
of the general explanations, and then use our estimates as additional controls when we study
the gender difference in tournament entry. However, it is well known that, for example risk
attitudes are sensitive to the environment in which they are elicited.58 And even if we had good
measures of risk aversion and of the other effects, we would not know how they interact. For
example it may be that women are more risk averse than men when choosing between lotteries,
but that they appear even more risk averse when making decisions that rely on their beliefs.
Instead of measuring each effect separately and making assumptions on how these
interact we opt for a different strategy. We try to simultaneously assess all the general effects,
by having participants make a choice that is as close as possible to the choice in task 3, but
which eliminates all tournament-specific explanations. We first examine whether general
factors by themselves are sufficient to generate a gender gap in compensation choice. This
analysis is reported in Section 7. Then in Section 8 we try to determine how much of the
gender gap in tournament entry can be accounted for by the participants’ decisions in this
competition-free environment. That is, does a gender difference in tournament entry remain
once we control for decisions made in environments where only the general explanations can
affect behavior?
7. Do General Factors cause Gender Differences in Compensation?
The fourth task is designed to examine the effect general factors have on compensation
decisions, while eliminating all tournament aspects and tournament-specific factors. In the
fourth task participants select one of two compensations for their past piece-rate performance
(task 1), either the 50-cent piece rate or the $2 tournament. If the tournament is chosen, the
piece-rate performance is submitted to a competition against the piece-rate performances of the
other participants in the group (independent of their compensation choice). A tournament is
won if an individual’s performance exceeds that of the other three players.
7.1. Gender Gap in Compensation Choice due to Non-Tournament-specific factors.
Before examining the participants’ choices, we use the task-1 performance to determine who
should submit the piece rate to a tournament scheme. In the piece rate men and women have 58 See for example Harbaugh, Krause and Vesterlund (2003).
27
similar, but not exactly the same probability of being the highest performer in a randomly
drawn group of 2 men and 2 women. Overall the chance of having the highest piece-rate
performance is 29% for a man and 21% for a woman.59 In our 20 groups 11 women and 11
men were the highest performers in their group (incl. two cases of ties). Table 10 reports the
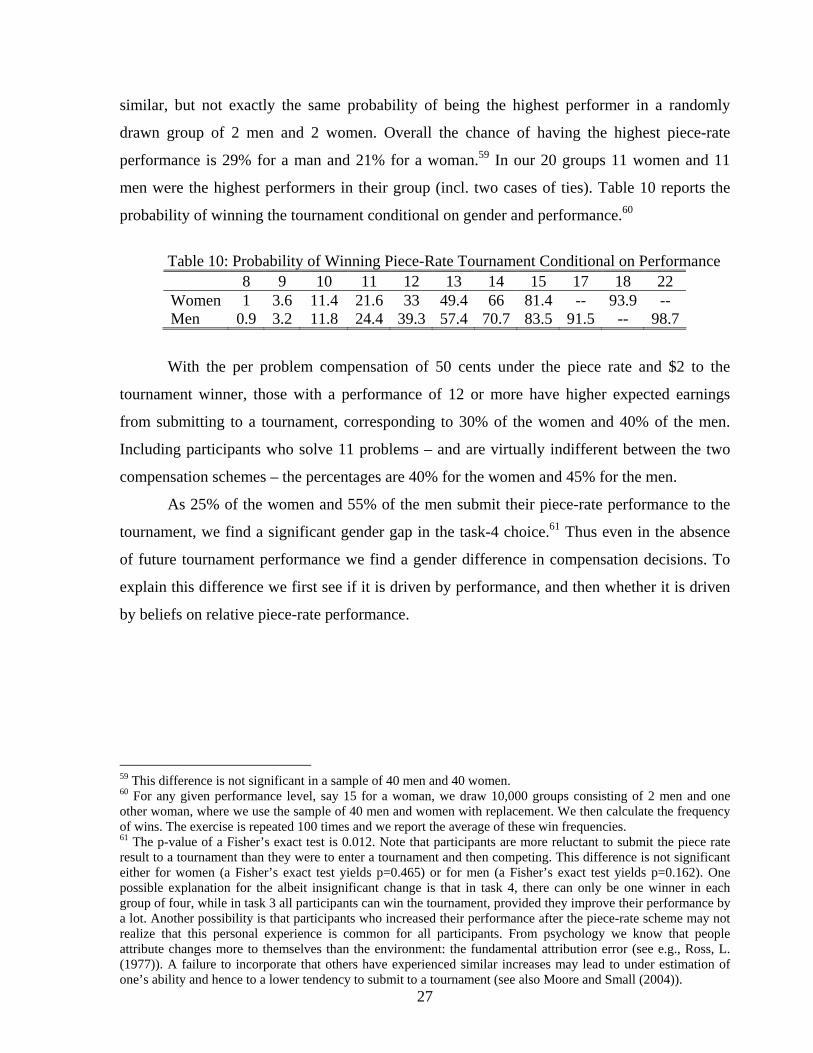
probability of winning the tournament conditional on gender and performance.60
Table 10: Probability of Winning Piece-Rate Tournament Conditional on Performance 8 9 10 11 12 13 14 15 17 18 22 Women 1 3.6 11.4 21.6 33 49.4 66 81.4 -- 93.9 -- Men 0.9 3.2 11.8 24.4 39.3 57.4 70.7 83.5 91.5 -- 98.7
With the per problem compensation of 50 cents under the piece rate and $2 to the
tournament winner, those with a performance of 12 or more have higher expected earnings
from submitting to a tournament, corresponding to 30% of the women and 40% of the men.
Including participants who solve 11 problems – and are virtually indifferent between the two
compensation schemes – the percentages are 40% for the women and 45% for the men.
As 25% of the women and 55% of the men submit their piece-rate performance to the
tournament, we find a significant gender gap in the task-4 choice.61 Thus even in the absence
of future tournament performance we find a gender difference in compensation decisions. To
explain this difference we first see if it is driven by performance, and then whether it is driven
by beliefs on relative piece-rate performance.
59 This difference is not significant in a sample of 40 men and 40 women. 60 For any given performance level, say 15 for a woman, we draw 10,000 groups consisting of 2 men and one other woman, where we use the sample of 40 men and women with replacement. We then calculate the frequency of wins. The exercise is repeated 100 times and we report the average of these win frequencies. 61 The p-value of a Fisher’s exact test is 0.012. Note that participants are more reluctant to submit the piece rate result to a tournament than they were to enter a tournament and then competing. This difference is not significant either for women (a Fisher’s exact test yields p=0.465) or for men (a Fisher’s exact test yields p=0.162). One possible explanation for the albeit insignificant change is that in task 4, there can only be one winner in each group of four, while in task 3 all participants can win the tournament, provided they improve their performance by a lot. Another possibility is that participants who increased their performance after the piece-rate scheme may not realize that this personal experience is common for all participants. From psychology we know that people attribute changes more to themselves than the environment: the fundamental attribution error (see e.g., Ross, L. (1977)). A failure to incorporate that others have experienced similar increases may lead to under estimation of one’s ability and hence to a lower tendency to submit to a tournament (see also Moore and Small (2004)).
28
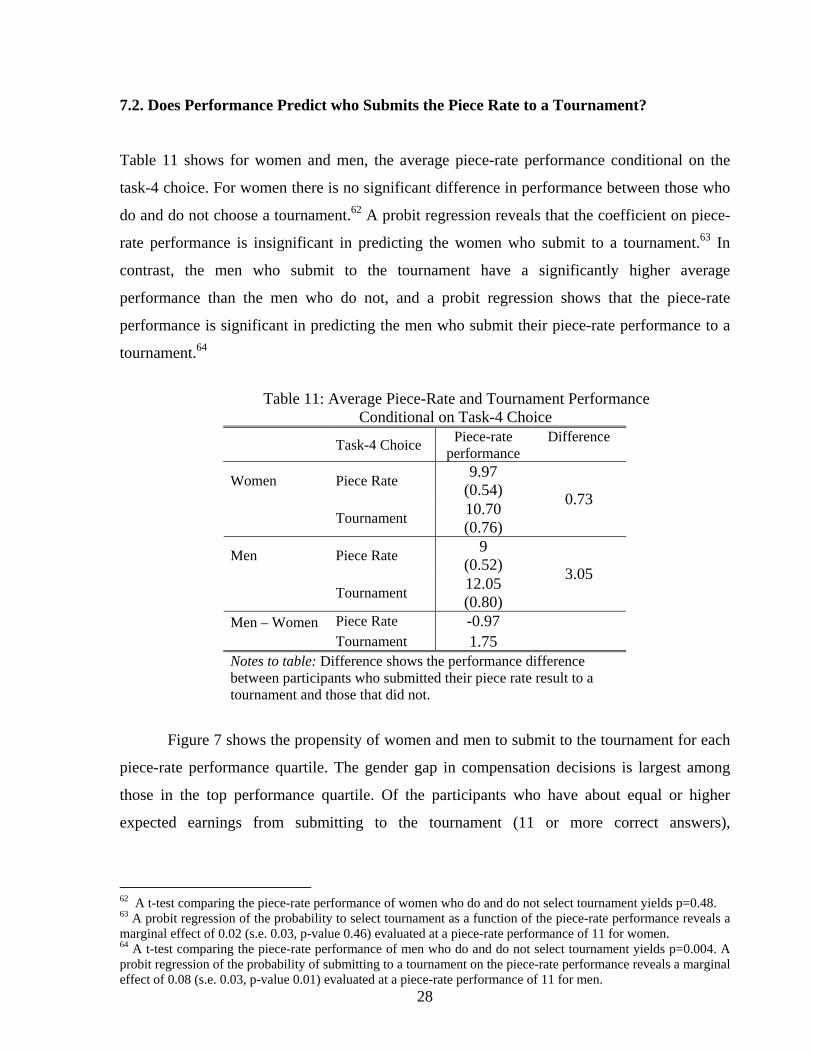
7.2. Does Performance Predict who Submits the Piece Rate to a Tournament?
Table 11 shows for women and men, the average piece-rate performance conditional on the
task-4 choice. For women there is no significant difference in performance between those who
do and do not choose a tournament.62 A probit regression reveals that the coefficient on piece-
rate performance is insignificant in predicting the women who submit to a tournament.63 In
contrast, the men who submit to the tournament have a significantly higher average
performance than the men who do not, and a probit regression shows that the piece-rate
performance is significant in predicting the men who submit their piece-rate performance to a
tournament.64
Table 11: Average Piece-Rate and Tournament Performance
Conditional on Task-4 Choice
Task-4 Choice Piece-rate performance
Difference
Women Piece Rate 9.97 (0.54)
Tournament 10.70 (0.76)
0.73
Men Piece Rate 9 (0.52)
Tournament 12.05 (0.80)
3.05
Piece Rate -0.97 Men – Women Tournament 1.75
Notes to table: Difference shows the performance difference between participants who submitted their piece rate result to a tournament and those that did not.
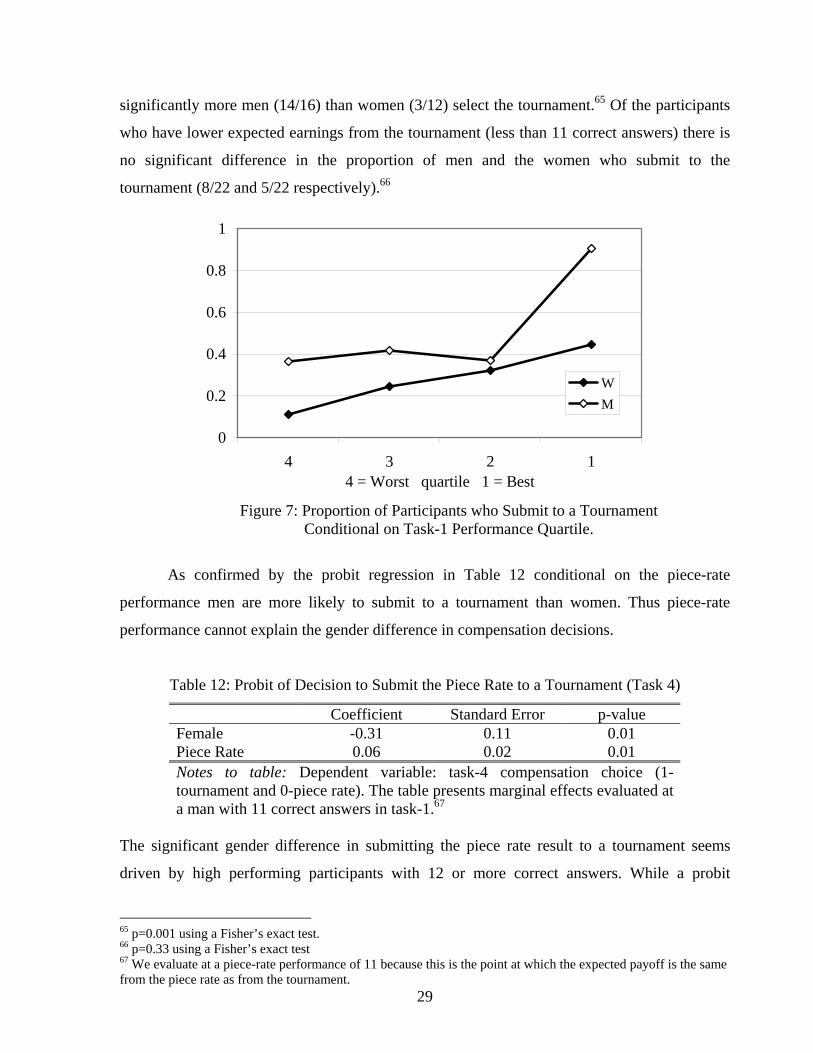
Figure 7 shows the propensity of women and men to submit to the tournament for each
piece-rate performance quartile. The gender gap in compensation decisions is largest among
those in the top performance quartile. Of the participants who have about equal or higher
expected earnings from submitting to the tournament (11 or more correct answers),
62 A t-test comparing the piece-rate performance of women who do and do not select tournament yields p=0.48. 63 A probit regression of the probability to select tournament as a function of the piece-rate performance reveals a marginal effect of 0.02 (s.e. 0.03, p-value 0.46) evaluated at a piece-rate performance of 11 for women. 64 A t-test comparing the piece-rate performance of men who do and do not select tournament yields p=0.004. A probit regression of the probability of submitting to a tournament on the piece-rate performance reveals a marginal effect of 0.08 (s.e. 0.03, p-value 0.01) evaluated at a piece-rate performance of 11 for men.
29
significantly more men (14/16) than women (3/12) select the tournament.65 Of the participants
who have lower expected earnings from the tournament (less than 11 correct answers) there is
no significant difference in the proportion of men and the women who submit to the
tournament (8/22 and 5/22 respectively).66
0
0.2
0.4
0.6
0.8
1
4 3 2 14 = Worst quartile 1 = Best
WM
Figure 7: Proportion of Participants who Submit to a Tournament
Conditional on Task-1 Performance Quartile.
As confirmed by the probit regression in Table 12 conditional on the piece-rate
performance men are more likely to submit to a tournament than women. Thus piece-rate
performance cannot explain the gender difference in compensation decisions.
Table 12: Probit of Decision to Submit the Piece Rate to a Tournament (Task 4)
Coefficient Standard Error p-value Female -0.31 0.11 0.01 Piece Rate 0.06 0.02 0.01 Notes to table: Dependent variable: task-4 compensation choice (1-tournament and 0-piece rate). The table presents marginal effects evaluated at a man with 11 correct answers in task-1.67
The significant gender difference in submitting the piece rate result to a tournament seems
driven by high performing participants with 12 or more correct answers. While a probit
65 p=0.001 using a Fisher’s exact test. 66 p=0.33 using a Fisher’s exact test 67 We evaluate at a piece-rate performance of 11 because this is the point at which the expected payoff is the same from the piece rate as from the tournament.
30
regression on this subsample of participants yields a significant female dummy, it is
insignificant on the subsample of participants with a performance of 10 or less.68
7.3. Do Beliefs on Relative Performance Influence Compensation Choice?
Since participants are only aware of their absolute performance, we elicit their beliefs about
their relative ranking in the piece rate. We first examine how participants form beliefs. We then
examine whether these beliefs affect the decision to submit to a tournament, and the extent to
which this can explain the gender gap in compensation choice.
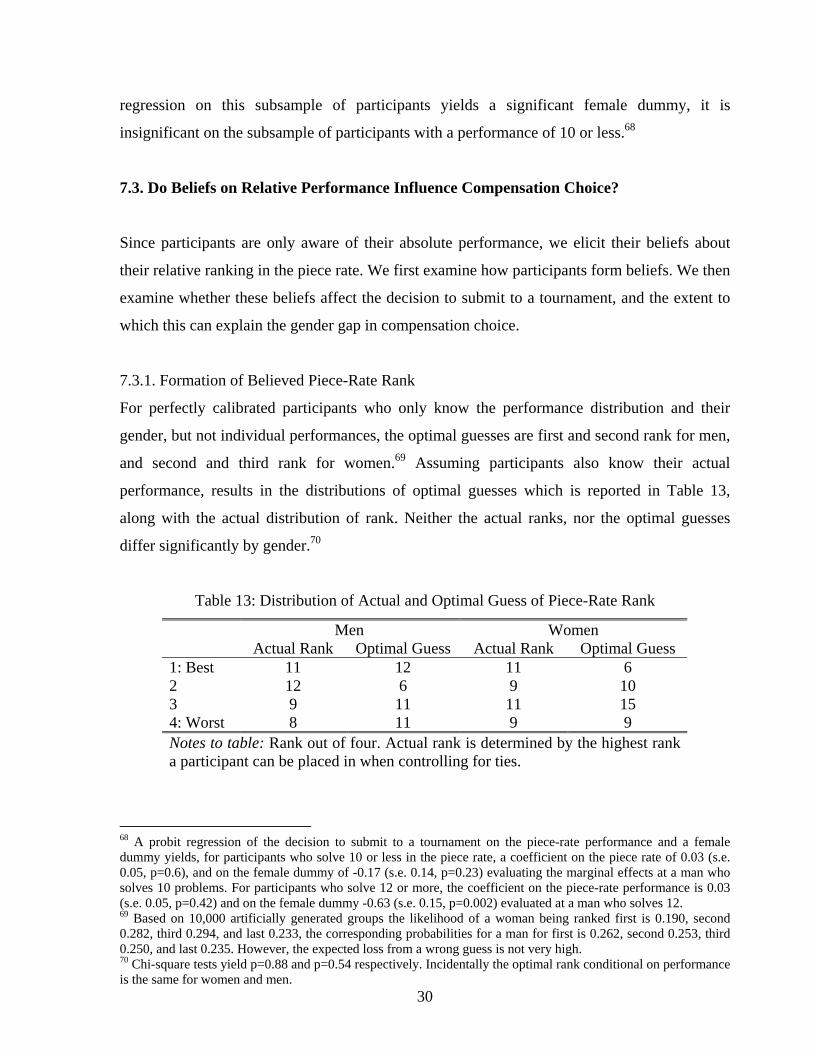
7.3.1. Formation of Believed Piece-Rate Rank
For perfectly calibrated participants who only know the performance distribution and their
gender, but not individual performances, the optimal guesses are first and second rank for men,
and second and third rank for women.69 Assuming participants also know their actual
performance, results in the distributions of optimal guesses which is reported in Table 13,
along with the actual distribution of rank. Neither the actual ranks, nor the optimal guesses
differ significantly by gender.70
Table 13: Distribution of Actual and Optimal Guess of Piece-Rate Rank
Men Women Actual Rank Optimal Guess Actual Rank Optimal Guess 1: Best 11 12 11 6 2 12 6 9 10 3 9 11 11 15 4: Worst 8 11 9 9 Notes to table: Rank out of four. Actual rank is determined by the highest rank a participant can be placed in when controlling for ties.
68 A probit regression of the decision to submit to a tournament on the piece-rate performance and a female dummy yields, for participants who solve 10 or less in the piece rate, a coefficient on the piece rate of 0.03 (s.e. 0.05, p=0.6), and on the female dummy of -0.17 (s.e. 0.14, p=0.23) evaluating the marginal effects at a man who solves 10 problems. For participants who solve 12 or more, the coefficient on the piece-rate performance is 0.03 (s.e. 0.05, p=0.42) and on the female dummy -0.63 (s.e. 0.15, p=0.002) evaluated at a man who solves 12. 69 Based on 10,000 artificially generated groups the likelihood of a woman being ranked first is 0.190, second 0.282, third 0.294, and last 0.233, the corresponding probabilities for a man for first is 0.262, second 0.253, third 0.250, and last 0.235. However, the expected loss from a wrong guess is not very high. 70 Chi-square tests yield p=0.88 and p=0.54 respectively. Incidentally the optimal rank conditional on performance is the same for women and men.
31
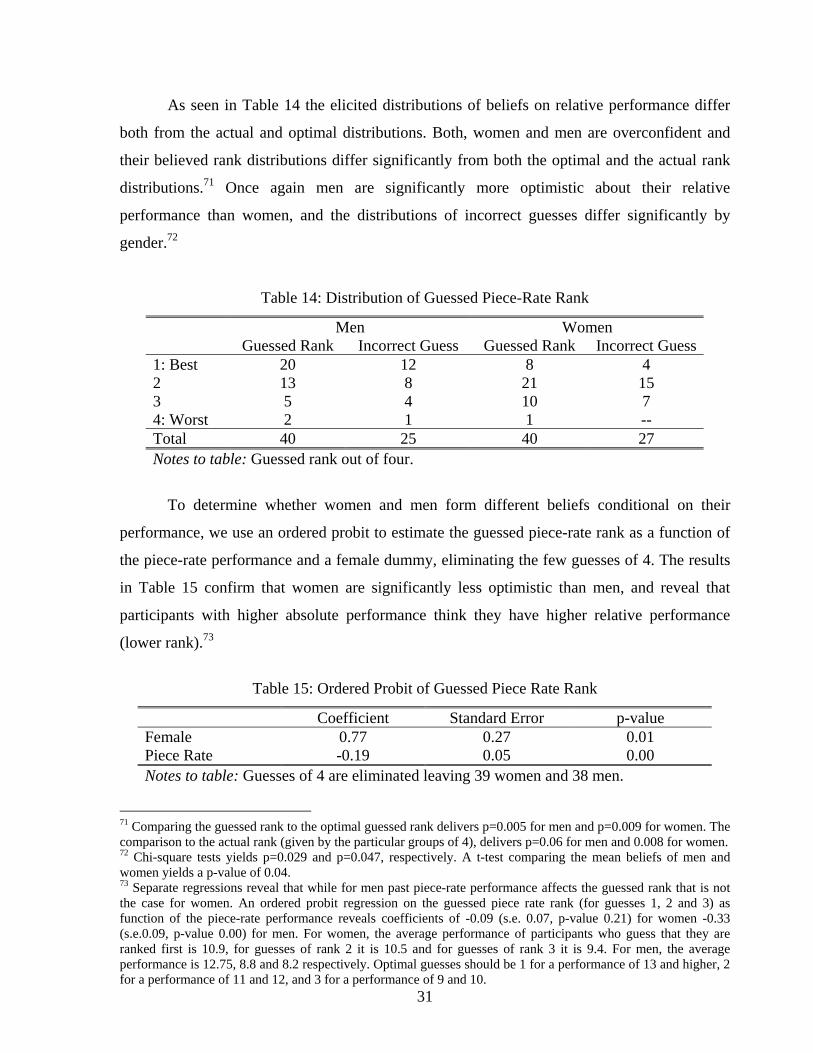
As seen in Table 14 the elicited distributions of beliefs on relative performance differ
both from the actual and optimal distributions. Both, women and men are overconfident and
their believed rank distributions differ significantly from both the optimal and the actual rank
distributions.71 Once again men are significantly more optimistic about their relative
performance than women, and the distributions of incorrect guesses differ significantly by
gender.72
Table 14: Distribution of Guessed Piece-Rate Rank
Men Women Guessed Rank Incorrect Guess Guessed Rank Incorrect Guess1: Best 20 12 8 4 2 13 8 21 15 3 5 4 10 7 4: Worst 2 1 1 -- Total 40 25 40 27 Notes to table: Guessed rank out of four.
To determine whether women and men form different beliefs conditional on their
performance, we use an ordered probit to estimate the guessed piece-rate rank as a function of
the piece-rate performance and a female dummy, eliminating the few guesses of 4. The results
in Table 15 confirm that women are significantly less optimistic than men, and reveal that
participants with higher absolute performance think they have higher relative performance
(lower rank).73
Table 15: Ordered Probit of Guessed Piece Rate Rank
Coefficient Standard Error p-value Female 0.77 0.27 0.01 Piece Rate -0.19 0.05 0.00 Notes to table: Guesses of 4 are eliminated leaving 39 women and 38 men.
71 Comparing the guessed rank to the optimal guessed rank delivers p=0.005 for men and p=0.009 for women. The comparison to the actual rank (given by the particular groups of 4), delivers p=0.06 for men and 0.008 for women. 72 Chi-square tests yields p=0.029 and p=0.047, respectively. A t-test comparing the mean beliefs of men and women yields a p-value of 0.04. 73 Separate regressions reveal that while for men past piece-rate performance affects the guessed rank that is not the case for women. An ordered probit regression on the guessed piece rate rank (for guesses 1, 2 and 3) as function of the piece-rate performance reveals coefficients of -0.09 (s.e. 0.07, p-value 0.21) for women -0.33 (s.e.0.09, p-value 0.00) for men. For women, the average performance of participants who guess that they are ranked first is 10.9, for guesses of rank 2 it is 10.5 and for guesses of rank 3 it is 9.4. For men, the average performance is 12.75, 8.8 and 8.2 respectively. Optimal guesses should be 1 for a performance of 13 and higher, 2 for a performance of 11 and 12, and 3 for a performance of 9 and 10.
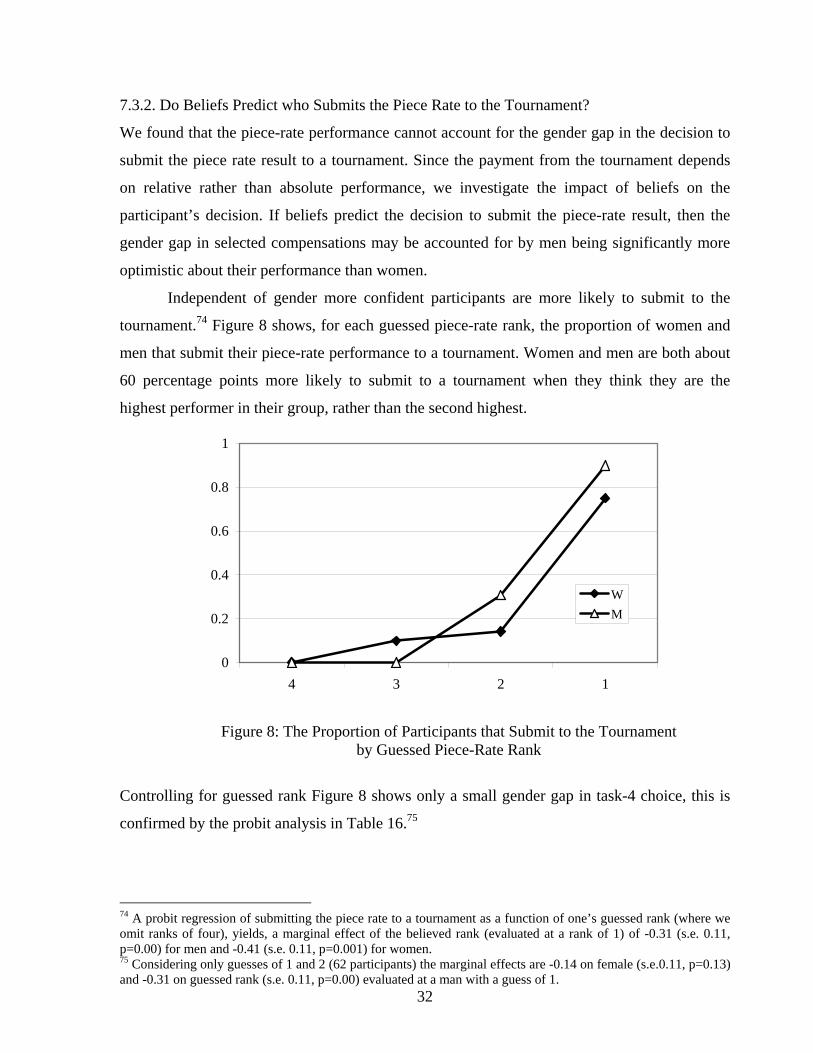
32
7.3.2. Do Beliefs Predict who Submits the Piece Rate to the Tournament?
We found that the piece-rate performance cannot account for the gender gap in the decision to
submit the piece rate result to a tournament. Since the payment from the tournament depends
on relative rather than absolute performance, we investigate the impact of beliefs on the
participant’s decision. If beliefs predict the decision to submit the piece-rate result, then the
gender gap in selected compensations may be accounted for by men being significantly more
optimistic about their performance than women.
Independent of gender more confident participants are more likely to submit to the
tournament.74 Figure 8 shows, for each guessed piece-rate rank, the proportion of women and
men that submit their piece-rate performance to a tournament. Women and men are both about
60 percentage points more likely to submit to a tournament when they think they are the
highest performer in their group, rather than the second highest.
0
0.2
0.4
0.6
0.8
1
4 3 2 1
WM
Figure 8: The Proportion of Participants that Submit to the Tournament
by Guessed Piece-Rate Rank
Controlling for guessed rank Figure 8 shows only a small gender gap in task-4 choice, this is
confirmed by the probit analysis in Table 16.75
74 A probit regression of submitting the piece rate to a tournament as a function of one’s guessed rank (where we omit ranks of four), yields, a marginal effect of the believed rank (evaluated at a rank of 1) of -0.31 (s.e. 0.11, p=0.00) for men and -0.41 (s.e. 0.11, p=0.001) for women. 75 Considering only guesses of 1 and 2 (62 participants) the marginal effects are -0.14 on female (s.e.0.11, p=0.13) and -0.31 on guessed rank (s.e. 0.11, p=0.00) evaluated at a man with a guess of 1.
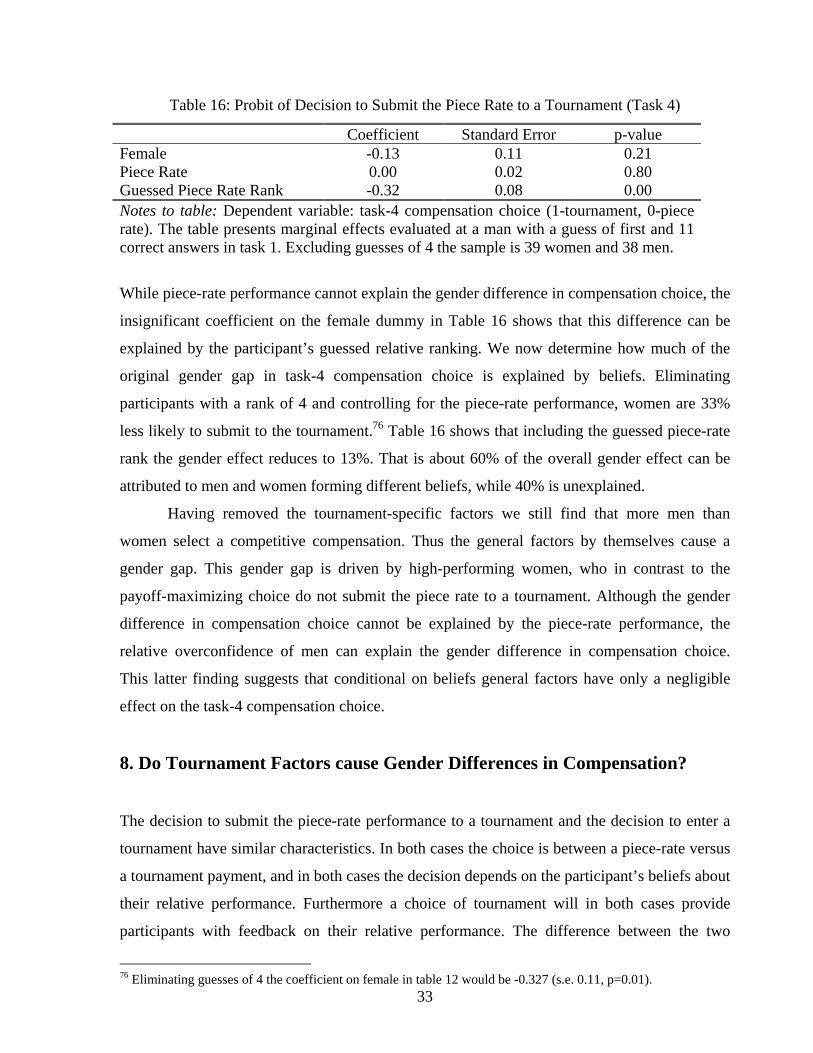
33
Table 16: Probit of Decision to Submit the Piece Rate to a Tournament (Task 4)
Coefficient Standard Error p-value Female -0.13 0.11 0.21 Piece Rate 0.00 0.02 0.80 Guessed Piece Rate Rank -0.32 0.08 0.00 Notes to table: Dependent variable: task-4 compensation choice (1-tournament, 0-piece rate). The table presents marginal effects evaluated at a man with a guess of first and 11 correct answers in task 1. Excluding guesses of 4 the sample is 39 women and 38 men.
While piece-rate performance cannot explain the gender difference in compensation choice, the
insignificant coefficient on the female dummy in Table 16 shows that this difference can be
explained by the participant’s guessed relative ranking. We now determine how much of the
original gender gap in task-4 compensation choice is explained by beliefs. Eliminating
participants with a rank of 4 and controlling for the piece-rate performance, women are 33%
less likely to submit to the tournament.76 Table 16 shows that including the guessed piece-rate
rank the gender effect reduces to 13%. That is about 60% of the overall gender effect can be
attributed to men and women forming different beliefs, while 40% is unexplained.
Having removed the tournament-specific factors we still find that more men than
women select a competitive compensation. Thus the general factors by themselves cause a
gender gap. This gender gap is driven by high-performing women, who in contrast to the
payoff-maximizing choice do not submit the piece rate to a tournament. Although the gender
difference in compensation choice cannot be explained by the piece-rate performance, the
relative overconfidence of men can explain the gender difference in compensation choice.
This latter finding suggests that conditional on beliefs general factors have only a negligible
effect on the task-4 compensation choice.
8. Do Tournament Factors cause Gender Differences in Compensation?
The decision to submit the piece-rate performance to a tournament and the decision to enter a
tournament have similar characteristics. In both cases the choice is between a piece-rate versus
a tournament payment, and in both cases the decision depends on the participant’s beliefs about
their relative performance. Furthermore a choice of tournament will in both cases provide
participants with feedback on their relative performance. The difference between the two
76 Eliminating guesses of 4 the coefficient on female in table 12 would be -0.327 (s.e. 0.11, p=0.01).
34
decisions is that only when participants enter the tournament do they have to perform in a
tournament, and only then do they have to assess and act upon their beliefs about their ranking
in a tournament. We want to determine whether gender differences in tournament entry are
driven largely by general factors, which are present when participants decide whether to submit
the piece rate to a tournament (task 4), or if there are additional gender differences when it
comes to entering a tournament (task 3).
Our results thus far suggest that the decision to submit to a tournament differs from the
decision to enter the tournament and then perform. While for high-performing participants
there is a significant gender difference in the rate by which participants submit to the
tournament these differences are not significant among low-performing participants. In contrast
the gender difference in tournament entry is independent of performance. Furthermore, gender
differences in beliefs about relative performance are sufficient to eliminate the gender gap in
the decision to submit to a tournament, while it cannot explain the gap in tournament entry.
To determine the impact of tournament-specific factors on participants’ behavior we
start by studying their effect on beliefs. Specifically we ask if the gender difference in
overconfidence in the piece rate can account for the gender differences in tournament beliefs or
if the difference is more pronounced when beliefs are about a relative tournament performance.
We then examine how much of the gender gap in tournament entry is accounted for by
general factors. We use the decision to submit the piece-rate performance to a tournament as a
control for aspects of the choice that are not tournament specific (general risk attitude,
feedback aversion, etc.). We first determine the extent to which general factors can account for
the gender gap in tournament entry controlling only for the participants’ behavior, that is, their
actual performance. We find that based solely on behavior, general factors cannot explain the
gender gap in tournament entry. To examine if the remaining gender gap may be explained by
gender differences in beliefs we include beliefs on relative tournament performance as an
additional control. That is, we assess whether a gender difference in tournament entry prevails
when we account for the participant’s performance, general factors (i.e., the task-4
compensation choice) and the participant’s belief about relative performance.
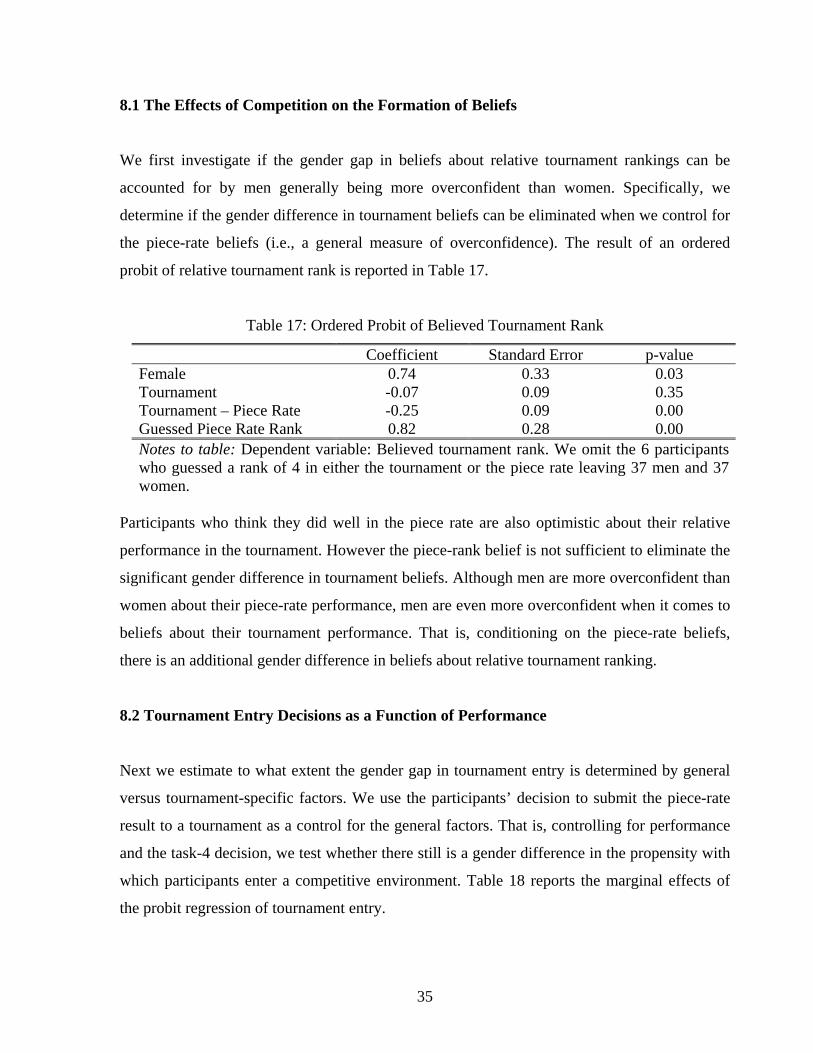
35
8.1 The Effects of Competition on the Formation of Beliefs
We first investigate if the gender gap in beliefs about relative tournament rankings can be
accounted for by men generally being more overconfident than women. Specifically, we
determine if the gender difference in tournament beliefs can be eliminated when we control for
the piece-rate beliefs (i.e., a general measure of overconfidence). The result of an ordered
probit of relative tournament rank is reported in Table 17.
Table 17: Ordered Probit of Believed Tournament Rank
Coefficient Standard Error p-value Female 0.74 0.33 0.03 Tournament -0.07 0.09 0.35 Tournament – Piece Rate -0.25 0.09 0.00 Guessed Piece Rate Rank 0.82 0.28 0.00 Notes to table: Dependent variable: Believed tournament rank. We omit the 6 participants who guessed a rank of 4 in either the tournament or the piece rate leaving 37 men and 37 women.
Participants who think they did well in the piece rate are also optimistic about their relative
performance in the tournament. However the piece-rank belief is not sufficient to eliminate the
significant gender difference in tournament beliefs. Although men are more overconfident than
women about their piece-rate performance, men are even more overconfident when it comes to
beliefs about their tournament performance. That is, conditioning on the piece-rate beliefs,
there is an additional gender difference in beliefs about relative tournament ranking.
8.2 Tournament Entry Decisions as a Function of Performance
Next we estimate to what extent the gender gap in tournament entry is determined by general
versus tournament-specific factors. We use the participants’ decision to submit the piece-rate
result to a tournament as a control for the general factors. That is, controlling for performance
and the task-4 decision, we test whether there still is a gender difference in the propensity with
which participants enter a competitive environment. Table 18 reports the marginal effects of
the probit regression of tournament entry.
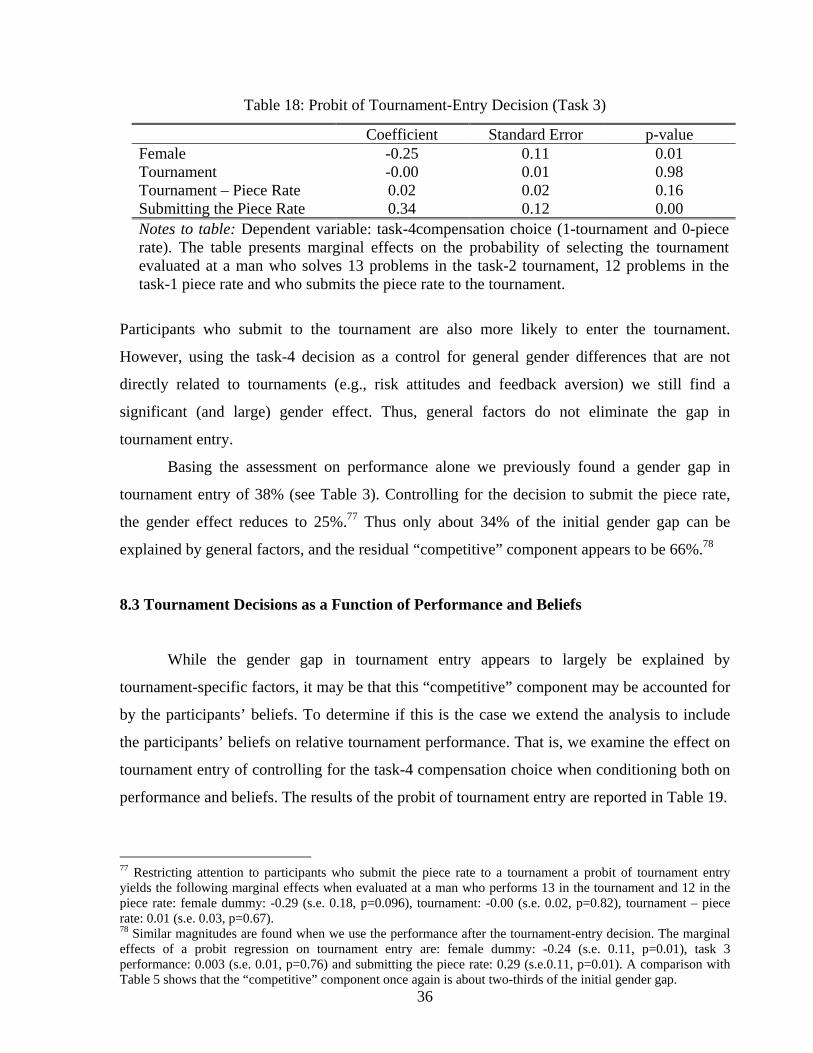
36
Table 18: Probit of Tournament-Entry Decision (Task 3)
Coefficient Standard Error p-value Female -0.25 0.11 0.01 Tournament -0.00 0.01 0.98 Tournament – Piece Rate 0.02 0.02 0.16 Submitting the Piece Rate 0.34 0.12 0.00 Notes to table: Dependent variable: task-4compensation choice (1-tournament and 0-piece rate). The table presents marginal effects on the probability of selecting the tournament evaluated at a man who solves 13 problems in the task-2 tournament, 12 problems in the task-1 piece rate and who submits the piece rate to the tournament.
Participants who submit to the tournament are also more likely to enter the tournament.
However, using the task-4 decision as a control for general gender differences that are not
directly related to tournaments (e.g., risk attitudes and feedback aversion) we still find a
significant (and large) gender effect. Thus, general factors do not eliminate the gap in
tournament entry.
Basing the assessment on performance alone we previously found a gender gap in
tournament entry of 38% (see Table 3). Controlling for the decision to submit the piece rate,
the gender effect reduces to 25%.77 Thus only about 34% of the initial gender gap can be
explained by general factors, and the residual “competitive” component appears to be 66%.78
8.3 Tournament Decisions as a Function of Performance and Beliefs
While the gender gap in tournament entry appears to largely be explained by
tournament-specific factors, it may be that this “competitive” component may be accounted for
by the participants’ beliefs. To determine if this is the case we extend the analysis to include
the participants’ beliefs on relative tournament performance. That is, we examine the effect on
tournament entry of controlling for the task-4 compensation choice when conditioning both on
performance and beliefs. The results of the probit of tournament entry are reported in Table 19.
77 Restricting attention to participants who submit the piece rate to a tournament a probit of tournament entry yields the following marginal effects when evaluated at a man who performs 13 in the tournament and 12 in the piece rate: female dummy: -0.29 (s.e. 0.18, p=0.096), tournament: -0.00 (s.e. 0.02, p=0.82), tournament – piece rate: 0.01 (s.e. 0.03, p=0.67). 78 Similar magnitudes are found when we use the performance after the tournament-entry decision. The marginal effects of a probit regression on tournament entry are: female dummy: -0.24 (s.e. 0.11, p=0.01), task 3 performance: 0.003 (s.e. 0.01, p=0.76) and submitting the piece rate: 0.29 (s.e.0.11, p=0.01). A comparison with Table 5 shows that the “competitive” component once again is about two-thirds of the initial gender gap.
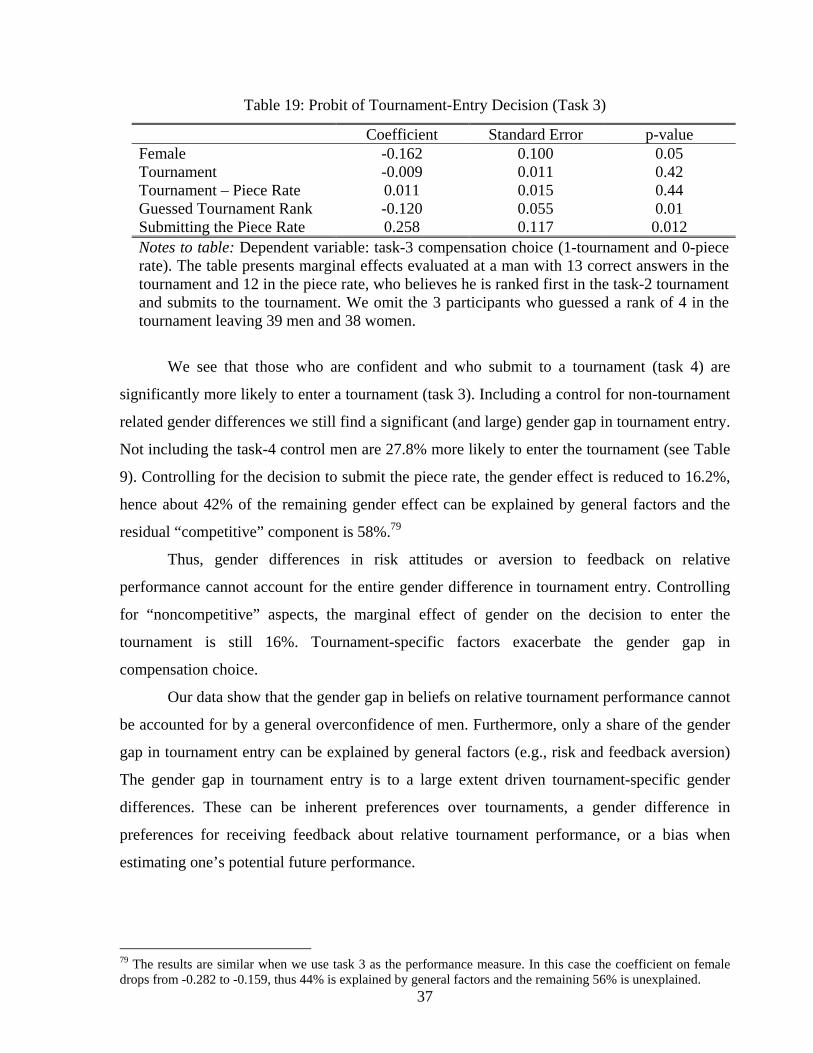
37
Table 19: Probit of Tournament-Entry Decision (Task 3)
Coefficient Standard Error p-value Female -0.162 0.100 0.05 Tournament -0.009 0.011 0.42 Tournament – Piece Rate 0.011 0.015 0.44 Guessed Tournament Rank -0.120 0.055 0.01 Submitting the Piece Rate 0.258 0.117 0.012 Notes to table: Dependent variable: task-3 compensation choice (1-tournament and 0-piece rate). The table presents marginal effects evaluated at a man with 13 correct answers in the tournament and 12 in the piece rate, who believes he is ranked first in the task-2 tournament and submits to the tournament. We omit the 3 participants who guessed a rank of 4 in the tournament leaving 39 men and 38 women.
We see that those who are confident and who submit to a tournament (task 4) are
significantly more likely to enter a tournament (task 3). Including a control for non-tournament
related gender differences we still find a significant (and large) gender gap in tournament entry.
Not including the task-4 control men are 27.8% more likely to enter the tournament (see Table
9). Controlling for the decision to submit the piece rate, the gender effect is reduced to 16.2%,
hence about 42% of the remaining gender effect can be explained by general factors and the
residual “competitive” component is 58%.79
Thus, gender differences in risk attitudes or aversion to feedback on relative
performance cannot account for the entire gender difference in tournament entry. Controlling
for “noncompetitive” aspects, the marginal effect of gender on the decision to enter the
tournament is still 16%. Tournament-specific factors exacerbate the gender gap in
compensation choice.
Our data show that the gender gap in beliefs on relative tournament performance cannot
be accounted for by a general overconfidence of men. Furthermore, only a share of the gender
gap in tournament entry can be explained by general factors (e.g., risk and feedback aversion)
The gender gap in tournament entry is to a large extent driven tournament-specific gender
differences. These can be inherent preferences over tournaments, a gender difference in
preferences for receiving feedback about relative tournament performance, or a bias when
estimating one’s potential future performance.
79 The results are similar when we use task 3 as the performance measure. In this case the coefficient on female drops from -0.282 to -0.159, thus 44% is explained by general factors and the remaining 56% is unexplained.

38
9. Economic Consequences
Our study shows significant gender differences in tournament entry. Relative to the payoff-
maximizing choices low-performing men enter the tournament too much, while high-
performing women do not enter enough. To estimate the costs associated with these decisions,
we need to evaluate expected earnings from the task-3 compensation choice. We will ignore
performance costs (which we cannot measure) and assume that the performance is independent
of the chosen compensation scheme. We consider two extreme ways of assessing the expected
costs of payoff-inferior compensation choices.
In one case we use the information participants have prior to the task-3 choice, that is
we use the task-2 tournament performance as a predictor of that in task 3. Thus, the task-2
performance determines the participant’s expected payment of each compensation choice in
task 3. In the cases where an “inferior” choice was made we calculate the associated costs.
These costs are reported for men and women in columns 1 and 2 in Table 20, along with
information on the number of people who made such “mistakes.” One can think of columns 1
and 2 as reporting the ex-ante costs of over- and under-entry. In columns 3 and 4 we report
instead the ex-post costs of over- and under-entry, that is, we use the participant’s task-3
performance to determine which compensation would have maximized their expected payoff.
Once again we report the number of people who, in expectation, would have been better off
making a different choice, as well as their associated costs.
While the magnitude of the costs is sensitive to the precise assumptions we make, the
qualitative results are the same. The total cost of under-entry is higher for women, while the
cost of over-entry is higher for men. Since over-entry occurs for participants of low
performance and under-entry for those with high performance, by design the cost of under-
entry is higher than that of over-entry. As a result the total costs of non-payoff maximizing
tournament entry decisions are higher for women than for men.

39
Table 20: Expected Costs of Over- and Under-Entry in task-2 Tournament
Calculation based on Task-2 Performance Task 3 Performance Women Men Women Men Performance entry threshold 13 13 13 13 Under-Entry Number who should enter 12 12 9 20 Of those how many do not enter 8 3 6 4 Expected total cost of under entry 99.4 34.5 84.6 49.6 Average expected cost of under entry 12.4 11.5 14.1 16.5 Over-Entry Number who should not enter 24 22 24 19 Of those how many do enter 9 14 8 12 Expected total cost of over entry 32.9 56.5 28.9 43.8 Average expected cost of over entry 3.7 4.0 3.6 3.6 Total expected costs 132.3 91.0 113.5 93.3 Notes to table: Participants with a performance at the threshold (who are virtually indifferent between the two compensations) are not included in the analysis.
10. Conclusion and Discussion We conducted experiments to examine whether gender differences in preferences for
competitive environments may cause men and women to hold different jobs, even when the
playing field is leveled. Specifically, we investigated whether women shy away from
competition while men are drawn to it. In our study women and men first perform under a
piece rate and a competitive tournament scheme. They then decide which compensation
scheme they want to apply to their next performance. Despite there being no gender differences
in initial performances, twice as many men as women enter the tournament. Neither
performance before nor after the tournament-entry decision can explain this difference. While
men are more optimistic about their relative performance this can only account for a small
share of the gender gap in tournament entry.
Some of the possible explanations for the different compensation choices are neither
tournament specific, nor are they related to the fact that participants subsequently perform
under tournament compensation. For example, women may avoid competition more than men
because they are more risk averse, dislike receiving information on relative performance, and
generally are less optimistic about their relative performance and the precision of such beliefs.
Other explanations for the gender differences in entry decisions, however, are tournament

40
specific and rely on future performance in the tournament. For example, men may like
performing in a tournament, may be more optimistic and precise in their beliefs on tournament
performance, or they may expect to have a high future performance.
In a last task we subject participants to a compensation choice that excludes all
explanations that relate to a future tournament performance, but retains all other characteristics.
Specifically, participants decide whether to submit their past piece-rate performance to a
tournament or a piece-rate scheme. Excluding tournament-specific factors men are still more
likely to choose a competitive scheme and this gender difference in compensation cannot be
explained by the piece-rate performance. However in contrast to the tournament-entry decision
we find that the substantial male overconfidence explains the gender difference in submitting
to the tournament. Thus, conditioning on beliefs non-tournament-specific factors have a
negligible effect on the decision to submit the piece rate performance to the tournament.
Finally, in examining the tournament-entry decision we use the participant’s decision to
submit the piece rate as a control for gender differences in non-tournament related factors (e.g.,
general feedback and risk aversion etc.). While this decision has explanatory power it does not
account for the majority of the gender gap in tournament entry. That is, the finding that women
shy away from competition and men compete too much is not simply caused by the
tournament-payment scheme being uncertain, nor by an attempt to avoid feedback on relative
performance. Tournament-specific factors cause high-performing women to enter the
tournament too little, and low-performing men to enter too much. Since the costs of under-
entry are larger than those of over-entry, women have lower earnings than men.
The present paper is part of a research program that tries to understand why women are
underrepresented in many high-profile jobs and across whole professions. Standard
explanations include gender differences in preferences and ability or discrimination. We
studied an additional explanation, namely that women may be less “competitive,” less prone to
select into competitions, but not because of differences in preferences over time invested in
jobs, differences in ability or discrimination.
Gneezy, Niederle and Rustichini (2003) explored an environment in which there was no
gender gap in performance in a piece-rate scheme. However a mixed tournament created large
gender differences in performance. While a few women performed extremely well, a large
number had a low performance and the bottom performance quintile was almost entirely
comprised of women. Similar gender differences in competitive behavior have also been found
41
by Larson (2005). While inferior performance of women may make them more reluctant to
select into a competitive environment, in this paper we explore whether such differences may
arise even when there are no gender differences in performance.
Since we focus on the decision to enter a tournament, we looked for a task in which,
even in tournaments, men and women would perform equally well. We chose to have
participants add up five two digit numbers for five minutes, instead of solving Yahoo mazes
for 15 minutes (the task of Gneezy, Niederle and Rustichini, 2003). That is, we picked a short
task, where we did not expect men to do better than women, a task that is in no way exciting,
but rather requires participants to be very careful not to make simple mistakes. As such,
women and men may feel that the task is not one where excellence boosts their ego. We show
that even when women perform as well as men in a competitive environment, women opt out
of tournaments, while men opt in.
The research on gender and competition so far suggests that there are two reasons why
women may be disadvantaged in a competitive environment. First, there are circumstances
where women, in competition against men, perform worse than their male counterparts.
Second, even when women and men are equally successful in the competitive environment, if
given a choice high-performing women will not enter the competition.
Babcock and Laschever (2003) explore the possibility that gender differences in labor
market outcomes may arise because women are poor negotiators and generally dislike the
process of negotiating. To the extent that a negotiation can be seen as a two-person competition
these results appear consistent with those on competition. Once again there are two effects, of
women first avoiding the competitive scheme all together, and second, failing to compete when
forced to do so.
There is evidence to suggest that ability differences are not primarily the reason why
women quit sciences and engineering. For example, a report entitled “Women’s Experiences in
College Engineering” writes that “Many young women leave […] for reasons other than
academic ability. These reasons can include their negatively interpreting grades that may
actually be quite good, diminished selfconfidence, or reluctance to spend all of their waking
hours ‘doing engineering.’” (Goodman, Cunningham and Lachapelle 2002). The report
mentions that many women who left mentioned negative aspects of their schools’ climate such
as competition, lack of support and discouraging faculty and peers. Similar effects have been
found by Felder et al. (1994).
42
It seems therefore that decisions of women to remain in male-dominated fields are not
only driven by actual ability. In natural settings issues such as the amount of time devoted to
the profession, and the desire of women to raise children may provide some explanations for
the choices of women. However, in this paper we examined an environment where women and
men perform equally well, and where issues of discrimination, or time spent on the job do not
have any explanatory power. Nonetheless we find large gender differences in the propensity to
choose competitive environments. We feel that the effects we discover in the lab are
sufficiently strong to call for a greater attention of standard economics to explanations of
gender differences that so far have mostly been left in the hands of psychologists and
sociologists.
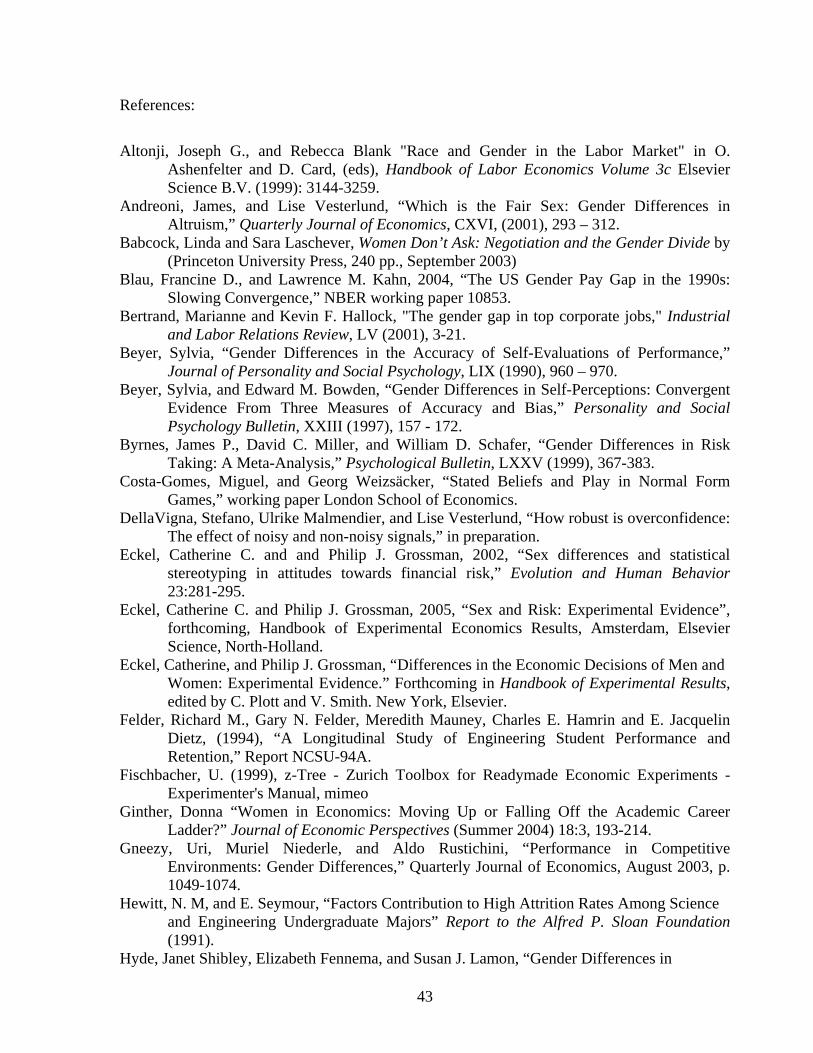
43
References:
Altonji, Joseph G., and Rebecca Blank "Race and Gender in the Labor Market" in O.
Ashenfelter and D. Card, (eds), Handbook of Labor Economics Volume 3c Elsevier Science B.V. (1999): 3144-3259.
Andreoni, James, and Lise Vesterlund, “Which is the Fair Sex: Gender Differences in Altruism,” Quarterly Journal of Economics, CXVI, (2001), 293 – 312.
Babcock, Linda and Sara Laschever, Women Don’t Ask: Negotiation and the Gender Divide by (Princeton University Press, 240 pp., September 2003)
Blau, Francine D., and Lawrence M. Kahn, 2004, “The US Gender Pay Gap in the 1990s: Slowing Convergence,” NBER working paper 10853.
Bertrand, Marianne and Kevin F. Hallock, "The gender gap in top corporate jobs," Industrial and Labor Relations Review, LV (2001), 3-21.
Beyer, Sylvia, “Gender Differences in the Accuracy of Self-Evaluations of Performance,” Journal of Personality and Social Psychology, LIX (1990), 960 – 970.
Beyer, Sylvia, and Edward M. Bowden, “Gender Differences in Self-Perceptions: Convergent Evidence From Three Measures of Accuracy and Bias,” Personality and Social Psychology Bulletin, XXIII (1997), 157 - 172.
Byrnes, James P., David C. Miller, and William D. Schafer, “Gender Differences in Risk Taking: A Meta-Analysis,” Psychological Bulletin, LXXV (1999), 367-383.
Costa-Gomes, Miguel, and Georg Weizsäcker, “Stated Beliefs and Play in Normal Form Games,” working paper London School of Economics.
DellaVigna, Stefano, Ulrike Malmendier, and Lise Vesterlund, “How robust is overconfidence: The effect of noisy and non-noisy signals,” in preparation.
Eckel, Catherine C. and and Philip J. Grossman, 2002, “Sex differences and statistical stereotyping in attitudes towards financial risk,” Evolution and Human Behavior 23:281-295.
Eckel, Catherine C. and Philip J. Grossman, 2005, “Sex and Risk: Experimental Evidence”, forthcoming, Handbook of Experimental Economics Results, Amsterdam, Elsevier Science, North-Holland.
Eckel, Catherine, and Philip J. Grossman, “Differences in the Economic Decisions of Men and Women: Experimental Evidence.” Forthcoming in Handbook of Experimental Results, edited by C. Plott and V. Smith. New York, Elsevier.
Felder, Richard M., Gary N. Felder, Meredith Mauney, Charles E. Hamrin and E. Jacquelin Dietz, (1994), “A Longitudinal Study of Engineering Student Performance and Retention,” Report NCSU-94A.
Fischbacher, U. (1999), z-Tree - Zurich Toolbox for Readymade Economic Experiments - Experimenter's Manual, mimeo
Ginther, Donna “Women in Economics: Moving Up or Falling Off the Academic Career Ladder?” Journal of Economic Perspectives (Summer 2004) 18:3, 193-214.
Gneezy, Uri, Muriel Niederle, and Aldo Rustichini, “Performance in Competitive Environments: Gender Differences,” Quarterly Journal of Economics, August 2003, p. 1049-1074.
Hewitt, N. M, and E. Seymour, “Factors Contribution to High Attrition Rates Among Science and Engineering Undergraduate Majors” Report to the Alfred P. Sloan Foundation (1991).
Hyde, Janet Shibley, Elizabeth Fennema, and Susan J. Lamon, “Gender Differences in
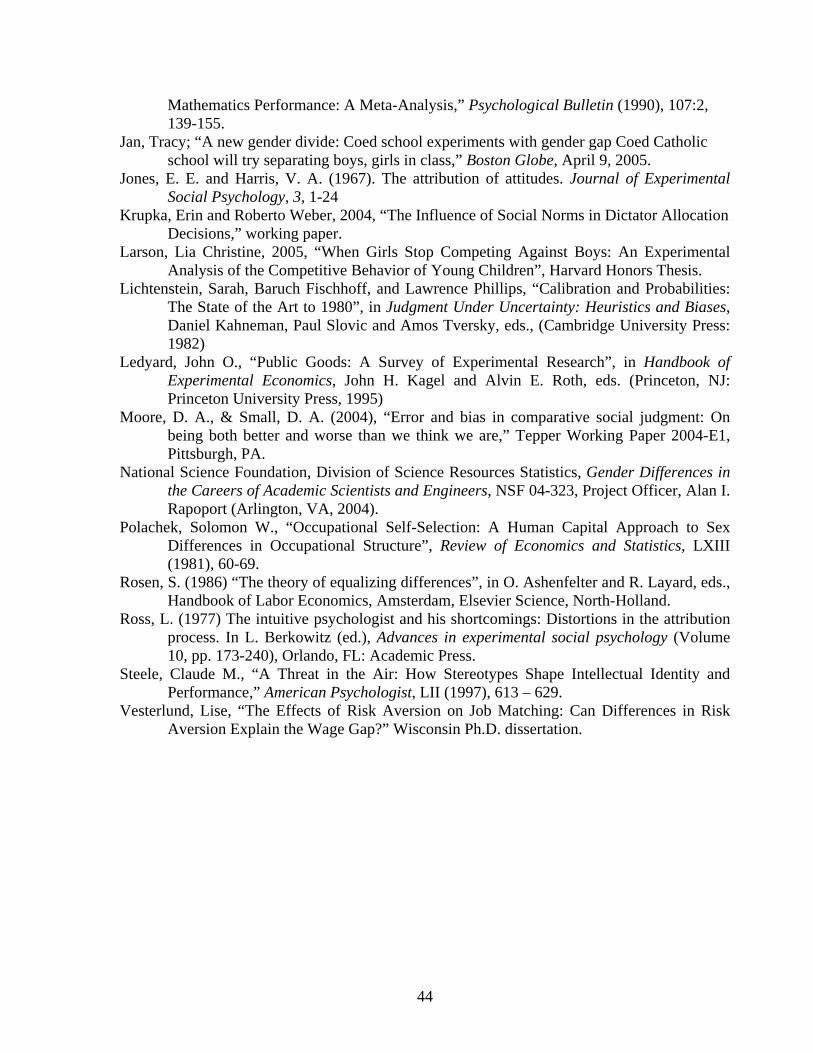
44
Mathematics Performance: A Meta-Analysis,” Psychological Bulletin (1990), 107:2, 139-155.
Jan, Tracy; “A new gender divide: Coed school experiments with gender gap Coed Catholic school will try separating boys, girls in class,” Boston Globe, April 9, 2005.
Jones, E. E. and Harris, V. A. (1967). The attribution of attitudes. Journal of Experimental Social Psychology, 3, 1-24
Krupka, Erin and Roberto Weber, 2004, “The Influence of Social Norms in Dictator Allocation Decisions,” working paper.
Larson, Lia Christine, 2005, “When Girls Stop Competing Against Boys: An Experimental Analysis of the Competitive Behavior of Young Children”, Harvard Honors Thesis.
Lichtenstein, Sarah, Baruch Fischhoff, and Lawrence Phillips, “Calibration and Probabilities: The State of the Art to 1980”, in Judgment Under Uncertainty: Heuristics and Biases, Daniel Kahneman, Paul Slovic and Amos Tversky, eds., (Cambridge University Press: 1982)
Ledyard, John O., “Public Goods: A Survey of Experimental Research”, in Handbook of Experimental Economics, John H. Kagel and Alvin E. Roth, eds. (Princeton, NJ: Princeton University Press, 1995)
Moore, D. A., & Small, D. A. (2004), “Error and bias in comparative social judgment: On being both better and worse than we think we are,” Tepper Working Paper 2004-E1, Pittsburgh, PA.
National Science Foundation, Division of Science Resources Statistics, Gender Differences in the Careers of Academic Scientists and Engineers, NSF 04-323, Project Officer, Alan I. Rapoport (Arlington, VA, 2004).
Polachek, Solomon W., “Occupational Self-Selection: A Human Capital Approach to Sex Differences in Occupational Structure”, Review of Economics and Statistics, LXIII (1981), 60-69.
Rosen, S. (1986) “The theory of equalizing differences”, in O. Ashenfelter and R. Layard, eds., Handbook of Labor Economics, Amsterdam, Elsevier Science, North-Holland.
Ross, L. (1977) The intuitive psychologist and his shortcomings: Distortions in the attribution process. In L. Berkowitz (ed.), Advances in experimental social psychology (Volume 10, pp. 173-240), Orlando, FL: Academic Press.
Steele, Claude M., “A Threat in the Air: How Stereotypes Shape Intellectual Identity and Performance,” American Psychologist, LII (1997), 613 – 629.
Vesterlund, Lise, “The Effects of Risk Aversion on Job Matching: Can Differences in Risk Aversion Explain the Wage Gap?” Wisconsin Ph.D. dissertation.
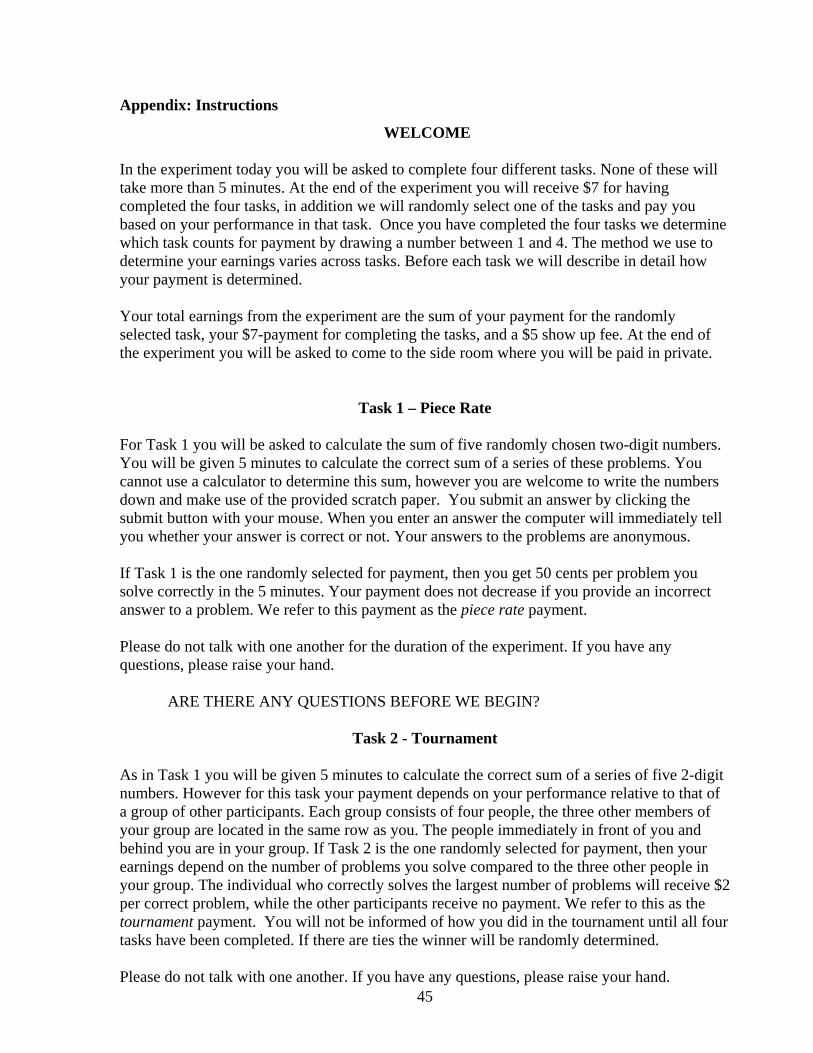
45
Appendix: Instructions
WELCOME In the experiment today you will be asked to complete four different tasks. None of these will take more than 5 minutes. At the end of the experiment you will receive $7 for having completed the four tasks, in addition we will randomly select one of the tasks and pay you based on your performance in that task. Once you have completed the four tasks we determine which task counts for payment by drawing a number between 1 and 4. The method we use to determine your earnings varies across tasks. Before each task we will describe in detail how your payment is determined. Your total earnings from the experiment are the sum of your payment for the randomly selected task, your $7-payment for completing the tasks, and a $5 show up fee. At the end of the experiment you will be asked to come to the side room where you will be paid in private.
Task 1 – Piece Rate For Task 1 you will be asked to calculate the sum of five randomly chosen two-digit numbers. You will be given 5 minutes to calculate the correct sum of a series of these problems. You cannot use a calculator to determine this sum, however you are welcome to write the numbers down and make use of the provided scratch paper. You submit an answer by clicking the submit button with your mouse. When you enter an answer the computer will immediately tell you whether your answer is correct or not. Your answers to the problems are anonymous. If Task 1 is the one randomly selected for payment, then you get 50 cents per problem you solve correctly in the 5 minutes. Your payment does not decrease if you provide an incorrect answer to a problem. We refer to this payment as the piece rate payment. Please do not talk with one another for the duration of the experiment. If you have any questions, please raise your hand. ARE THERE ANY QUESTIONS BEFORE WE BEGIN?
Task 2 - Tournament As in Task 1 you will be given 5 minutes to calculate the correct sum of a series of five 2-digit numbers. However for this task your payment depends on your performance relative to that of a group of other participants. Each group consists of four people, the three other members of your group are located in the same row as you. The people immediately in front of you and behind you are in your group. If Task 2 is the one randomly selected for payment, then your earnings depend on the number of problems you solve compared to the three other people in your group. The individual who correctly solves the largest number of problems will receive $2 per correct problem, while the other participants receive no payment. We refer to this as the tournament payment. You will not be informed of how you did in the tournament until all four tasks have been completed. If there are ties the winner will be randomly determined. Please do not talk with one another. If you have any questions, please raise your hand.
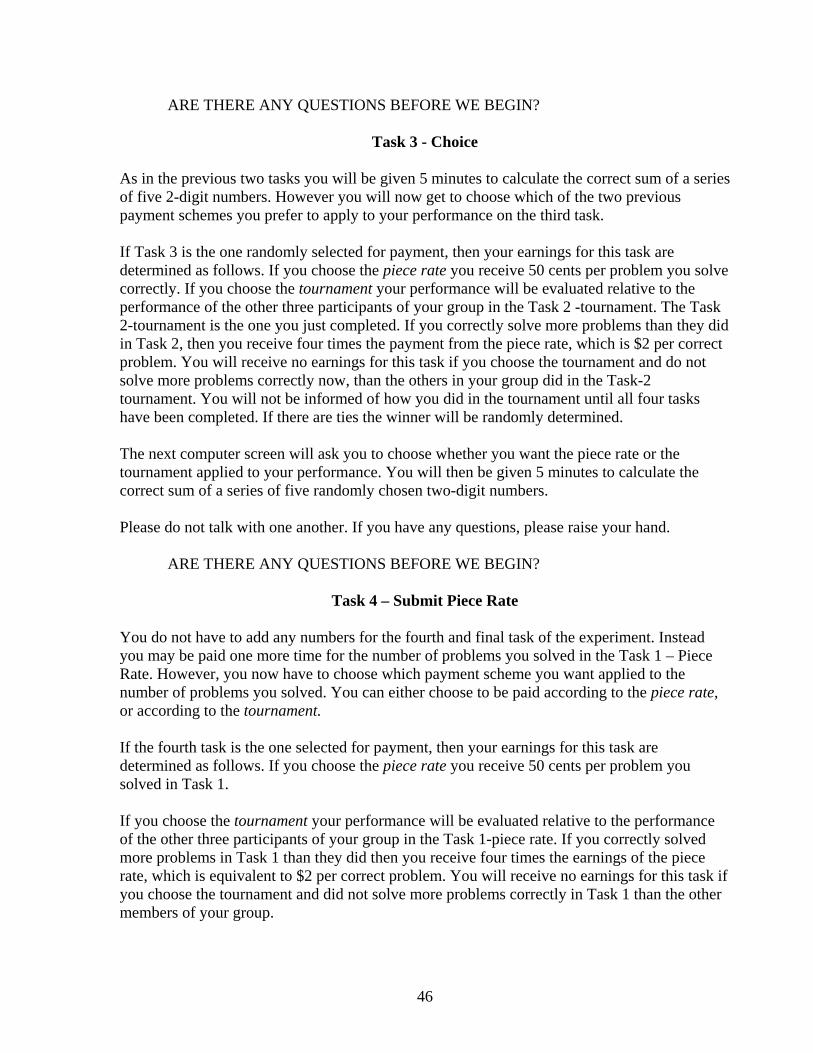
46
ARE THERE ANY QUESTIONS BEFORE WE BEGIN?
Task 3 - Choice As in the previous two tasks you will be given 5 minutes to calculate the correct sum of a series of five 2-digit numbers. However you will now get to choose which of the two previous payment schemes you prefer to apply to your performance on the third task. If Task 3 is the one randomly selected for payment, then your earnings for this task are determined as follows. If you choose the piece rate you receive 50 cents per problem you solve correctly. If you choose the tournament your performance will be evaluated relative to the performance of the other three participants of your group in the Task 2 -tournament. The Task 2-tournament is the one you just completed. If you correctly solve more problems than they did in Task 2, then you receive four times the payment from the piece rate, which is $2 per correct problem. You will receive no earnings for this task if you choose the tournament and do not solve more problems correctly now, than the others in your group did in the Task-2 tournament. You will not be informed of how you did in the tournament until all four tasks have been completed. If there are ties the winner will be randomly determined. The next computer screen will ask you to choose whether you want the piece rate or the tournament applied to your performance. You will then be given 5 minutes to calculate the correct sum of a series of five randomly chosen two-digit numbers. Please do not talk with one another. If you have any questions, please raise your hand. ARE THERE ANY QUESTIONS BEFORE WE BEGIN?
Task 4 – Submit Piece Rate
You do not have to add any numbers for the fourth and final task of the experiment. Instead you may be paid one more time for the number of problems you solved in the Task 1 – Piece Rate. However, you now have to choose which payment scheme you want applied to the number of problems you solved. You can either choose to be paid according to the piece rate, or according to the tournament. If the fourth task is the one selected for payment, then your earnings for this task are determined as follows. If you choose the piece rate you receive 50 cents per problem you solved in Task 1. If you choose the tournament your performance will be evaluated relative to the performance of the other three participants of your group in the Task 1-piece rate. If you correctly solved more problems in Task 1 than they did then you receive four times the earnings of the piece rate, which is equivalent to $2 per correct problem. You will receive no earnings for this task if you choose the tournament and did not solve more problems correctly in Task 1 than the other members of your group.
47
The next computer screen will tell you how many problems you correctly solved in Task 1, and will ask you to choose whether you want the piece rate or the tournament applied to your performance. Please do not talk with one another. If you have any questions, please raise your hand.
ARE THERE ANY QUESTIONS BEFORE WE BEGIN