do ifrs adoption, financial analysts and …usir.salford.ac.uk/41316/1/mohammad almaharmeh...
TRANSCRIPT

I
DO IFRS ADOPTION, FINANCIAL ANALYSTS AND EARNINGS QUALITY AFFECT
THE INFORMATIVENESS OF STOCK PRICE?
EVIDENCE FROM THE UK
BY
MOHAMMAD ALMAHARMEH
Bachelor of Accounting (University of Jordan)
M.Sc. in Accounting (University of Jordan)
A thesis Submitted to the University of Salford, UK
For the Degree of Doctor of Philosophy
Salford University Business School
2017
II
Abstract
This thesis consists of two studies. The first study examines whether the mandatory adoption of
International Financial Reporting Standards (IFRS) affects stock price informativeness, as
measured by the extent to which firm-specific information is capitalized into the stock price.
Using a sample of 6,367 firm-year observations from 970 publicly listed UK firms during the
period from 1990 to 2013, the results show that the mandatory adoption of IFRS does make the
stock price more informative. In particular, the results suggest a significant negative relationship
between IFRS adoption and the stock price synchronicity. This indicates that the increased
transparency following the mandatory adoption of IFRS facilitates the incorporation of firm-
specific information into the stock price, leading to more informative stock prices. In this study,
the effect of financial analysts’ activities on the relationship between IFRS adoption and stock
price informativeness is also considered. The regressions results show that, within the IFRS
adopters, the firms followed by a higher number of financial analysts have a higher stock price
synchronicity than those followed by a lower number of financial analysts, suggesting that the
IFRS adoption increases financial analysts’ ability to incorporate market-wide and industry-wide
information into the stock price. Furthermore, these results indicate that the financial analysts’
activities attenuate the synchronicity-reducing effect of mandatory IFRS adoption.
The second study, examines the effect of earnings quality on the informativeness of the stock
price, using a sample of 5,214 firm-year observations, collected from 880 UK firms for the
period from 1994 to 2013. The findings suggest that higher earnings quality encourages the
investors to collect and process more firm-specific information, which in turn facilitates the
incorporation of this information into the stock price, leading to less synchronous and more
informative stock price. In addition, the effect of mandatory IFRS adoption on the relationship
between earnings quality and stock price informativeness is examined. Contrary to expectations,
the results suggest that the mandatory adoption of IFRS does not have a significant impact on the
relationship between earnings quality and stock price informativeness.

III
لَ ) ًالِي ْي َّيلِ لع ْي ْينع ِ ع ْع ِت ْتمُِي ْاو (مايم عظ هللا ال صدق
Declaration
I hereby declare that the materials contained in this thesis have not been previously submitted for
a degree at this or any other university. I further declare that this thesis is solely based on my
own research.
Mohammad Almaharmeh
Statement of Copyright
The copyright of this thesis rests with the author. No quotation from it may be published without
prior written consent, and information derived from it should be acknowledged.
Mohammad Almaharmeh

IV
Dedication
This thesis is dedicated to the greatest two persons in this word, my
father Issa Almaharmeh, and my mother Maysoon Almaharmeh.

V
Acknowledgments
I am grateful to God Almighty for giving me the opportunity, ability, courage and strength to
complete this thesis.
I would like to express my sincere thanks to a number of individuals who have provided me with
support and encouragement throughout the period of my studies. I would first like to pay tribute,
and thanks to my supervisors Dr. Eileen Roddy and Dr. Jia Liu to whom I owe a massive debt of
gratitude for their priceless guidance and support in helping me during my PhD journey. They
constantly encouraged me to expand the confines of my thinking and helped me to further
explore and discover my abilities as a researcher.
I am also thankful to my dad and my mother for their prayer, support and, courage throughout
my life.
With deep love, I am thankful to my wife, Ala, my sons, Hashem and Yamen, and my daughter,
Sarah, for their unending support, unconditional love and understanding over the shortened
weekends, truncated evenings and busy hours.
Last but not least, I am grateful to my father in law, Prof. Mahmoud Abu-Zaid, for his support
and invaluable help.

VI
Table of Contents
Chapter one: Introduction ............................................................................................................... 1
1.1 Introduction ...................................................................................................................... 1
1.2 Research Aims and Objectives .............................................................................................. 4
1.3 Research Questions ............................................................................................................... 4
1.4 Research Methodology .......................................................................................................... 5
1.5 Rationale for the Research and Expected Contribution to knowledge .................................. 6
1.6 Structure of the Study ............................................................................................................ 9
Chapter two: Literature Review .................................................................................................... 11
2.1 Introduction .................................................................................................................... 11
2.2 Stock price informativeness ........................................................................................... 12
2.2.1 The conceptual argument of using stock price synchronicity as a measure of stock
price informativeness ............................................................................................................. 12
2.2.2 Empirical links between stock price non-synchronicity and stock price
informativeness. ..................................................................................................................... 15
2.2.3 Stock price synchronicity as an indication of an uninformed trading .................... 27
2.3 Accounting transparency ................................................................................................ 28
2.3.1 Introduction .................................................................................................................. 28
2.3.2 The importance of accounting transparency ........................................................... 29
2.3.3 The history of International Financial Reporting Standards (IFRS) and its
objectives ............................................................................................................................... 33
2.3.4 The UK accounting regulatory system ................................................................... 36
2.3.5 Anticipated benefits of IFRS adoption ................................................................... 36
2.3.6 Empirical evidence of the consequences of IFRS adoption ......................................... 37
2.3.6 Summary .......................................................................................................................... 50
Summary of stock price synchronicity literature ................................................................... 50

VII
Summary of IFRS literature .................................................................................................. 52
2.4 Earnings Quality ............................................................................................................. 54
2.4.1 The definition of Earnings Quality ............................................................................... 54
2.4.2 Different measures of earning quality .......................................................................... 57
2.4.3 Accruals Quality as a universal measure of earnings quality ....................................... 58
2.4.4 Earnings quality and stock price informativeness ........................................................ 62
Chapter three: Theoretical framework and hypotheses development ........................................... 70
3.1 Introduction ......................................................................................................................... 70
3.2 The Effect of Accounting Transparency on Stock Price Informativeness. ......................... 70
3.2.1 Does Accounting Transparency Affect Stock Price Informativeness? ........................ 70
3.2.2 Do financial analysts’ activities matter? ....................................................................... 73
3.3 The Effect of Earnings Quality on Stock Price Informativeness ........................................ 75
3.3.1 Does Earnings Quality Affect Stock Price Informativeness ........................................ 75
3.3.2 Does IFRS Adoption Matter? ....................................................................................... 80
Chapter Four: Research Methodology .......................................................................................... 82
4.1 Introduction ......................................................................................................................... 82
4.2 Research philosophy ........................................................................................................... 82
4.3 Research approach............................................................................................................... 86
4.4 Research strategy................................................................................................................. 87
4.5 Sample selection and data sources. ..................................................................................... 88
4.5.1 Sample selection ........................................................................................................... 88
4.5.2 Data type and source ..................................................................................................... 90
4.6 Methods of analysis and investigation. ............................................................................... 91
4.6.1 Univariate analysis ....................................................................................................... 91
4.6.2 Bivariate analysis .......................................................................................................... 91
VIII
4.6.4 Multivariate analysis..................................................................................................... 92
4.7 Variables measurement ....................................................................................................... 99
4.7.1 Dependent variable (Stock price informativeness measure) ........................................ 99
4.7.2 Independent variables ................................................................................................. 101
4.7.3 Control Variables ........................................................................................................ 107
4.8 Empirical models for hypothesis testing ........................................................................... 112
4.8.1 First Study Empirical Models ..................................................................................... 113
4.8.2 Second Study Empirical Models .................................................................................... 116
Chapter Five: First Study Empirical results (Accounting transparency and stock price
informativeness.) ......................................................................................................................... 121
5.1 Descriptive Statistics ......................................................................................................... 121
5.1.1 Sample Description..................................................................................................... 121
5.1.2 IFRS Adoption ............................................................................................................ 123
5.1.3 Yearly summary of stock price synchronicity ............................................................ 124
5.1.4 Descriptive statistics and Univariate comparisons ..................................................... 128
5.1.5 Correlation Analysis ................................................................................................... 133
5.2 Bivariate analysis .............................................................................................................. 137
5.3 Multivariate analysis: IFRS adoption and stock price informativeness ............................ 142
5.3.1 The results of testing H1 ............................................................................................. 142
5.3.2 Robustness test for H1 using different measure of stock price synchronicity............ 147
5.3.3 The results of testing H2 ............................................................................................. 149
5.3.4 Robustness test for H2 using different measure of stock price synchronicity............ 155
5.3.5 The results of testing H3 ............................................................................................. 161
5.3.6 Robustness test for H3 using a different measure of stock price synchronicity ......... 163
5.3.7 Additional robustness tests with control of potential endogeneity ............................. 165

IX
5.3.8 Additional robustness tests using Difference in Difference analysis ......................... 169
Chapter Six: Second study Empirical Results (Earnings quality and stock price informativeness)
..................................................................................................................................................... 173
6.1 Sample description ............................................................................................................ 173
6.2 Descriptive Statistics ......................................................................................................... 174
6.3 Correlation Analysis .......................................................................................................... 176
6.4 Bivariate Analysis ............................................................................................................. 181
6.5 Multivariate Analysis ........................................................................................................ 185
6.5.1 Do earnings quality affect stock price informativeness? ............................................ 185
6.5.2 Does IFRS adoption affect the relationship between earnings quality and stock price
informativeness? .................................................................................................................. 190
6.6 Robustness tests................................................................................................................. 193
6.6.1 Robustness test using different measure of stock price synchronicity ....................... 193
6.4.2 Robustness tests using different measure of earnings quality .................................... 197
6.3.3 Endogeneity Issues ..................................................................................................... 200
Chapter 7: Conclusion................................................................................................................. 205
7.1 Introduction ....................................................................................................................... 205
7.2 Empirical results conclusions ............................................................................................ 205
7.2.1 Mandatory IFRS adoption and stock price synchronicity .......................................... 206
7.2.2 Earnings quality and stock price synchronicity .......................................................... 209
7.3 The contributions of the study .............................................................................................. 211
7.4 Implications of the study ....................................................................................................... 212
7.5 The limitations of the study and suggestions for future research ......................................... 212
References ................................................................................................................................... 215

X
Abbreviations
IAS International Accounting Standards
IFRS International financial reporting standards
EU European union
L.S.E London stock exchange
UK The united kingdom
USA United states of America
IASC International Accounting Standards Committee
IASB International Accounting Standards Board
GAAP Generally Accepted Accounting Standards
OLS Ordinary least square
GLS Generalised least square
WLS Weighted least square
DW Durbin-Watson test
2SLS Two stage least square
RET Weekly firm return
MKERT Value-weighted market return
INDRET Value-weighted industry return
SYNCH1 Stock price synchronicity computed using EQ.1
SYNCH2 Stock price synchronicity computed using EQ.3
NIBEX Net income before extraordinary items

XI
CFO Cash flow from operations
TA Total accruals
NDACC Non-discretionary accruals
LTA Lagged total assets
REV Total revenues
REC Total receivables
PPE Property, plant and equipment
AAC Abnormal accruals
SIZE Firm size
M/B Growth opportunity
LEV Financial leverage
ROA Firm performance
FOLL Analyst following
HERF_INDX Industry concentration
IND-NUM Number of firms in the industry
IND-SIZE Industry size
VAR_IND_RET Variance of industry return
CRISIS The financial crisis
J_Model Jones Model
MJ-Model Modified Jones Model
LAMDA Inverse mills ratio

XII
ADO_AGE Adoption age
VIF Variance inflation factor
XIII
List of tables
Table 2-1 Summary of stock price synchronicity literature. ........................................................ 67
Table 4-1 Summary of regression results assumptions................................................................. 98
Table 4-2 Worldscope description of Accounting followed (Field 07536) ............................... 103
Table 3-3 Summary of Research Variable and Their Measurement. .......................................... 119
Table 5-1 Yearly Distribution for First Study Sample................................................................ 121
Table 5.2 Summary of Pre-IFRS Sample and Post-IFRS Sample. ............................................. 123
Table 5.3 Descriptive Statistic for Stock Price Synchronicity .................................................... 127
Table 5.4 Descriptive Statistics for the Variable Used in the First study ................................... 131
Table 5.5 T-test and Mann-Whitney test .................................................................................... 132
Table 5-6 Correlation Matrix ...................................................................................................... 136
Table 5-7 variance Inflation Factor test ...................................................................................... 137
Table 5-8 Bivariate Regression Results ...................................................................................... 138
Table 5-9 Regression Results for Testing H1 ............................................................................. 146
Table 5-10 Robustness Test for H1 using different measure of stock price synchronicity ........ 148
Table 5-11 Regression Results for Testing H2 ........................................................................... 154
Table 5-12 Robustness Test for H2 using different measure of stock price synchronicity ........ 155
Table 5-13 Robustness Test for H2 using adoption age variable ............................................... 159
Table 5-14 Robustness Test for H2 using different measure of stock price synchronicity and
adoption age variable .................................................................................................................. 160
Table 5-15 Regression Results for Testing H3 ........................................................................... 162
Table 5-16 Robustness Test for H3 Using Different Measure of Stock Price Synchronicity .... 164
Table 5-17 First Stage Regression Results ................................................................................. 166
Table 5-18 Second Stage regression results................................................................................ 167
Table 5-19 Second stage regression results using different measure of stock price synchronicity
..................................................................................................................................................... 168
Table 5-20 Difference in Difference analysis ............................................................................. 170
Table 6-1 Second study Sample Yearly Distribution ................................................................. 174
Table 6-2 Descriptive Statistics for the Second study Sample ................................................... 176
Table 6-3 Pearson and Spearman Correlation Matrix................................................................. 180
Table 6-4 Bivariate Analysis ...................................................................................................... 184

XIV
Table 6-5 Regression Results for Testing the Effect of Earnings Quality on Stock Price
Synchronicity (H4)...................................................................................................................... 189
Table 6-6 Regression Results for Testing the Effect of IFRS Adoption on the Relationship
between Earnings Quality and Stock Price Synchronicity (H5 and H6) .................................... 192
Table 6-7 Robustness Test for H4 Using Different Measure of Stock Price Synchronicity. .... 194
Table 6-8 Robustness Test for H5 and H6 using different measure of stock price synchronicity
..................................................................................................................................................... 195
Table 6-9 Additional Robustness Test for H4 using Different Measure of Earnings Quality .... 197
Table 6-10 Additional Robustness Rest Test for H5 and H6 using Different Measure of Earnings
Quality......................................................................................................................................... 199
Table 6-11 First Stage Regression Using M-Jones Model ......................................................... 201
Table 6-12 Second Stage Regression Results Using M_Jones Model ....................................... 202
Table 6-13 First Stage Regression Using Jones Model .............................................................. 203
Table 6-14 Second Stage Regression Results Using Jones Model ............................................. 204

1
Chapter one: Introduction
1.1 Introduction
This thesis consists of two main empirical studies. The first study, investigates the effect of
accounting transparency, as measured by the mandatory adoption of International Financial
Reporting Standards (IFRS hereafter), on the informativeness of stock price, as measured by the
extent to which stock price incorporate firm-specific information in an accurate and timely
manner. This study also examines the effect of financial analysts’ activities on the relationship
between IFRS adoption and stock price informativeness. This is a fundamental issue since the
previous research, undertaken by Wurgler (2000), Durnev, Morck, Yeung, and Zarowin (2003)
and Durnev, Morck, and Yeung (2004), suggest that efficient resource allocation depends
critically on the informativeness of the stock price. For these reasons, understanding the factors
that improve the informativeness of the stock price is important from an efficient resource
allocation perspective.
Previous research suggests that the financial reporting environment has an important effect on
the informativeness of the stock price. Morck, Yeung, and Yu (2000) find that the countries with
better accounting information exhibit more informative stock prices than other countries. In
addition, Hutton, Marcus, and Tehranian (2009), Jin and Myers (2006), and Veldkamp (2006a)
argue that improved transparency facilitates the incorporation of firm-specific information into
stock prices leading to more informative stock prices.
The adoption of IFRS is considered an important commitment toward more transparent financial
disclosure. The creation of the IFRS was designed primarily to provide more transparent,
accurate, comprehensive and timely financial statements information, relative to national
accounting standards, including the European countries local standards (Ball, 2006).
In order to improve the transparency of financial reporting and to improve the functioning of the
capital market, the European Union asked the listed companies to prepare their financial
2
statements in accordance with the IFRS starting from the 1st of January 2005 (European
Parliament, 2008)1.
There is a growing body of literature that examines the consequences of mandatory IFRS
adoption. However, most of the studies on the consequences of mandatory IFRS adoption
provide evidence from cross-country studies which make it difficult to disentangle the effect of
IFRS from other synchronous changes that may affect the financial reporting content. For this
reason, many of prior research calls for future research on the consequences of IFRS adoption
that concentrate in a single country instead of multi countries studies, e.g (Brüggemann, Hitz, &
Sellhorn, 2013; Schipper, 2005; Weetman, 2006). Focusing on one country facilitates controlling
for institutional factors, such as stock listing requirements, accounting disclosure requirements,
market microstructures, and regulatory environments, that may confound the results, which are
difficult to control for in cross countries study, thereby strengthening the reliability of the
findings (Paananen & Lin, 2009; Ruland, Shon, & Zhou, 2007)
In addition, according to Brüggemann et al. (2013) most of the papers that examined the
consequences of mandatory IFRS adoption provide transitory evidence with a low level of
statistical power, because of the short history of IFRS adoption. For this reason, Brüggemann et
al. (2013), and Kvaal and Nobes (2012) ask for future research that re-examines the potential
IFRS effects, using longer time periods.
The first study of this thesis is a respond to these calls and aims to investigate the effect of
mandatory adoption of IFRS on the informativeness of stock price, by analysing a sample of
6,367 firm-year observations collected from 970 UK listed companies for the period between
1990 and 2013.
The second study, examines the effect of higher earnings quality, as measured by accruals
quality, on the flow of firm-specific information into the market, particularly the ability of stock
price to incorporate firm-specific information in an accurate and timely manner relative to
market-wide and industry-wide information. In addition, this study examines the effect of
mandatory IFRS adoption on the relationship between earnings quality and stock price
informativeness.
1 See Regulation (EC) 1606/2002 for further information.
3
This study is motivated by the debate in the literature about the net effect of higher earnings
quality on stock price synchronicity. Whereas one view suggests that, higher earnings quality
encourage investors to collect and process more firm-specific information, while the other view
argues that higher earnings quality may reduce investors incentive to collect firm-specific
information.
In particular, Kim and Verrecchia (1991) suggest that the disclosure of high quality public
financial information supports the investor’s incentives to collect and process costly firm-
specific private information. Based on this argument one can expect more firm-specific return
variation with higher quality financial disclosure. The previous literature provides empirical
evidence to support this view, whereas Durnev et al. (2004) find that higher earnings quality
reduces information processing costs, so it encourages the investors to collect and process more
firm-specific information, leading to higher firm-specific return variation. Morck et al. (2000)
also provide international evidence of higher firm-specific return variation in countries with
better disclosure of accounting information.
However, Kim and Verrecchia (2001) have the view that the availability of better and high-
quality accounting numbers may reduce the investor's incentives to collect and process firm-
specific private information. For this reason, one could observe less firm-specific stock price
volatility for firms with higher earnings quality. Rajgopal and Venkatachalam (2011) support
this view by providing evidence that higher firm-specific return volatility is associated with
lower earnings quality.
To contribute to this debate in the literature, a sample of 5,214 firm-year observations were
collected and analysed from 880 UK listed companies for the period from 1994 to 2013.
Understanding the factors that affect the informativeness of stock price is particularly important
since the previous research suggests that more informative stock price, as measured by higher
firm-specific return variation, is significantly associated with more efficient resource allocation
(Ben-Nasr & Alshwer, 2016; Durnev et al., 2004; Wurgler, 2000). Improving the efficient
resource allocation by understanding the factors that affect the informativeness of stock prices
will, in turn, affect economic development and social welfare.

4
1.2 Research Aims and Objectives
This study aims to examine the effects of accounting transparency and high-quality accounting
numbers on the informativeness of the stock price. In particular, it investigates the effect of
improved accounting transparency and higher earnings quality on the incorporation of firm-
specific information into the stock price. To fulfil the previously mentioned aims the study has
identified the following research objectives:
To review the existing literature on stock price informativeness, accounting transparency,
IFRS, and earnings quality, in order to identify research gaps and to formulate a better
understanding of the effect of accounting transparency, and earnings quality on the
informativeness of stock price.
To propose an empirical model and formulate corresponding hypotheses for investigating the
effect of mandatory IFRS adoption and earnings quality on stock price informativeness.
To empirically examine whether and how the increased in accounting transparency after
the mandatory IFRS adoption affects the informativeness of stock prices.
To empirically examine the effect of financial analysts’ activities on the relationship
between accounting transparency and stock price informativeness.
To empirically examine whether higher accruals quality had an impact on the
informativeness of stock prices.
To empirically investigate the effect of mandatory IFRS adoption on the relationship
between earnings quality and stock price informativeness.
1.3 Research Questions
In order to achieve the research aims and objectives, this study will try to answer the following
research questions:
Is there a relationship between mandatory IFRS adoption and stock price
informativeness?

5
What is the relationship between mandatory IFRS adoption and stock price
informativeness?
Do financial analysts’ activities affect the relationship between mandatory IFRS adoption
and stock price informativeness?
Is there a relationship between earnings quality and stock price informativeness?
What is the relationship between earnings quality and stock price informativeness?
Does mandatory adoption of IFRS affect the relationship between earnings quality and
stock price informativeness?
1.4 Research Methodology
The effect of accounting transparency and earning quality on the informativeness of stock price
were tested using econometric techniques, which are the standard research approaches in
accounting and finance literature. In particular, two panel regression models were constructed
and a set of hypothesis were formulated.
In the first model, the effect of improved transparency on the informativeness of stock price was
examined by employing a sample of 6,367 firm-year observations from the UK listed firms for
the period between 1990 and 2013. Stock price informativeness is measured by the magnitude of
firm-specific return variation as a fraction of market return and industry return, and accounting
transparency is gauged by the mandatory adoption of IFRS.
In addition, this research examines whether the effect of IFRS adoption on stock price
synchronicity differs systematically between firms with high analysts’ activities and those with
low activities, and follow Kim and Shi (2012a) by adding the interaction term of IFRS*FOLL to
the regression model. The interaction term explains how the effect of one predictor variable
(IFRS) on the response variable (SYNCH) is different at different values of the other predictor
variable (FOLL).
As robustness tests for the findings of this model, the regression is repeated using different
specification models and different econometrics tests.

6
With respect to the second model, it investigates the effect of higher earnings quality on the
informativeness of the stock price by employing a sample of 5,214 firm-year observations from
the UK listed firms for the period between 1994 and 2013. Earnings quality is measured using
the magnitude of discretionary accruals as estimated by the Jones model, as modified by
Dechow, Sloan, and Sweeney (1995), and as estimated by the Jones (1991) model. Both of the
previous models try to measure the quality of earnings through measuring the quality of accruals
by identifying the nondiscretionary (i.e. normal accruals) accruals and deducting these accruals
from the total accruals. Whereas the high value of discretionary accruals (the difference between
total accruals and nondiscretionary accruals) is considered to be an indication of low earnings
quality.
Furthermore, to examine the net effect of IFRS adoption on the relationship between earnings
quality and stock price synchronicity, a separate two regressions were estimated, one for the
period before the mandatory adoption of IFRS, and other for the period after the mandatory
adoption of IFRS. After that, a comparison was made of the coefficients of earning quality for
the pre-adoption period with that for the post-adoption period in order to test whether the
mandatory IFRS adoption affects the relationships between earnings quality and the
informativeness of stock price
The applied empirical models contain a number of control variables that may have an effect on
stock price synchronicity such as the firm’s size, financial leverage, growth opportunity, firm’s
performance, analyst’s activities, the number of firms in the industry, the industry size, the
industry concentration, the variance of weekly industry return, and the financial crisis.
1.5 Rationale for the Research and Expected Contribution to knowledge
The prior literature that examines the effect of accounting transparency in general and mandatory
IFRS adoption specifically, on stock price informativeness, contains a great debate. One stream
of research leaded by early work of Jin and Myers (2006), Veldkamp (2006a), and Haggard,
Martin, and Pereira (2008) suggest that, the high level of transparency with extended disclosure
facilitates the incorporation of firm-specific information into the stock prices, leading to a less
synchronous and more informative stock price.

7
Whilst another stream of research guided by Dasgupta, Gan, and Gao (2010) argue that the
increase in transparency, at first, is likely to increase the flow of firm-specific information to the
market, and hence increase the amount of firm-specific information that is incorporated into the
stock price. However, as more firm-specific information becomes publicly available, the firm’s
investors improve their predictions about the occurrence of future events; this will reduce the
surprise effect of future information release, making the stock price more synchronous.
There is also a debate in the literature about the relationship between IFRS adoption and stock
price synchronicity, where Kim and Shi (2012a) and Loureiro and Taboada (2012) find that
stock price synchronicity is reduced significantly following IFRS adoption. While Beuselinck,
Joos, Khurana, and Van der Meulen (2010), and Bissessur and Hodgson (2012) document an
initial increase in firm-specific return variation in the year of IFRS adoption, followed by a
significant decrease in the subsequent periods.
Since there is no consensus in the previous literature on which of these views is more dominant,
this study will take it as an empirical issue and examined the effect of improved transparency,
following the mandatory adoption of IFRS, on the informativeness of stock prices for the United
Kingdom (U.K.) listed firms. By doing so, this study extends the literature that examines the
consequences of the mandatory adoption of IFRS, by providing new evidence using long term
data and from one country, and contributes to the debate as to the effect of improved
transparencies on stock price informativeness.
To the best of the researcher knowledge, this study is amongst the first studies to examine the
effect of mandatory IFRS adoption, on the stock price informativeness of the UK listed firms.
So, this study adds to the literature that examines the consequences of mandatory IFRS adoption
in the UK.
A recent study by Brüggemann et al. (2013) provides a review and discussion of the mandatory
IFRS adoption literature and concludes that most the papers that empirically examine IFRS
adoption provide a transitory effect of the first-time adoption, with low statistical power because
of the short history of mandatory IFRS adoption.2 For this reason, they call for future research
2 On average, the papers reviewed by Brüggemann et al. (2013) examine two to three years following mandatory
adoption of IFRS.
8
that re-examines the current research using a longer time series. Additionally, Brüggemann et al.
(2013) ask the future research, that intend to examine the effect of IFRS on capital markets, to
develop research strategies that disentangle the potential effect of IFRS from other synchronous
changes that may have an effect on financial reporting. Because of the difficulty of identifying
and controlling the effect of these concurrent forces in cross-countries studies, they suggest that
future research should focus on a single country or trading segment instead of multiple countries,
which helps in better controlling for non-IFRS factors and thereby increasing the internal validity
of the results.
This study considers the recommendation of Brüggemann et al. (2013) and examines the effect
of mandatory IFRS adoption on UK firms (single country) for the period between 1990-2014, a
long time period of 24 years, fifteen years before and nine years after, so the effect of IFRS on
the capitalization of firm-specific information into the firm’s stock price can be better measured.
Equally important, this study adds to the literature that examines the effect of earnings quality on
stock price informativeness. Since there are few papers that investigate the effect of earnings
quality on the informativeness of stock prices. Even the scarce papers that examine the expected
effect of earning quality on the informativeness of stock price provide different explanations and
conclusions. Whereas Durnev et al. (2004) suggest a positive relationship between earnings
quality and firm-specific return variation, in that high-quality earnings reduce information cost,
which facilitates the incorporation of firm-specific information into the stock price, resulting in a
more firm-specific return variation. In contrast, Rajgopal and Venkatachalam (2011) suggest a
negative relationship between earnings quality and firm-specific return variation. They found
that the deterioration in the earnings quality of the United States (U.S.) firms is positively related
to the upward trend in firm-specific return variation for U.S. firms. More interesting results were
documented by Gul, Srinidhi, and Ng (2011) who find that there was no relationship between
earnings quality and stock price informativeness, as measured by stock price synchronicity.
Since the relationship between earnings quality and stock price synchronicity is ambiguous. This
research will shed more light on this issue in an attempt to reach a greater understanding of the
relationship, if it exists, between earnings quality and stock price informativeness. In addition, by
examining the effect of mandatory IFRS adoption on the relationships between earnings quality
and stock price informativeness this study will become one of the forefront studies that examine
9
this dimension. By doing so, this study is able to form original contributions to both mandatory
IFRS and earnings quality literature.
To the best of the researcher’s knowledge, this study is one of the first papers that investigate
the relationship between earnings quality and stock price informativeness for the UK listed firms.
To the extent that more informative stock price leads to more efficient resource allocation,
understanding the factors that affect the informativeness of stock price helps in efficient resource
allocation which in turn improve the social welfare.3
1.6 Structure of the Study
This thesis consists of seven chapters in total.
Chapter one: provides an overview of the thesis as well as a summary of the remaining six
chapters.
Chapter two: critically reviews the literature with regard to stock price informativeness,
accounting transparency, IFRS adoption, and earnings quality. To begin with, it introduces an
overview of the main studies that discussed stock price informativeness and provide theoretical
and empirical justification for using stock price synchronicity as a measure of stock price
informativeness. Then, the chapter provides an overview of the definition of accounting
transparency and provides a review of the history of IFRS and the anticipated benefits of
adopting IFRS. A significant part of this chapter is devoted to a comprehensive discussion of the
papers that provide empirical evidence about the consequences of IFRS adoption. Finally, the
chapter discusses the definitions of the earnings quality in the literature, the measures of earnings
quality, and provides a justification for using accruals quality as a measure of earnings quality.
Chapter three: presents the conceptual framework and the hypothesis development for the
current study. This chapter draws on the literature review, to provide theoretical and empirical
justifications for the proposed research’s hypotheses. Three hypotheses have been developed to
provide answers to the expected effect of mandatory IFRS adoption on the informativeness of the
3 Wurgler (2000) and Durnev et al. (2004) provides evidence that more informative stock price, as measured by
stock price synchronicity, leads to more efficient resource allocation.

10
stock price, and as to whether this effect differs systematically based on the financial analysts’
activities. Four hypotheses have been developed to provide answers to the expected effect of
higher earnings quality on the informativeness of the stock price, and as to whether the
mandatory adoption of IFRS affects the strength of the effect of earnings quality on the
informativeness of the stock prices.
Chapter four: discuss the methodological issues. The research philosophy, research approaches,
and research strategy are discussed comprehensively in this chapter. This chapter also contains a
full discussion of the data source and analysis methodologies, along with the regression model
assumptions, and the consequences of violating one of these assumptions. This is followed by a
discussion of the variables, their measurement and the justification of the measures used. Finally,
the empirical models that are used to test the hypotheses are presented in this chapter.
Chapter five and six: present and discuss the empirical results of the statistical analysis.
Chapter five provide the results relating to the effect of mandatory IFRS adoption on the
informativeness of the stock price, and the effect of the financial analysts’ activities on the
relationship between IFRS adoption and stock price synchronicity. Whilst chapter six presents
the results of testing the effect of earnings quality on the informativeness of stock price, and the
effect of mandatory IFRS adoption on the relationship between earnings quality and stock price
informativeness. This chapter also includes the results of endogeneity related tests and the results
of the sensitivity tests.
Chapter seven: conclude this study. This chapter contains brief descriptions of the chapters of
this study, followed by a summary of the main empirical results. In addition, it presents the
contributions to the research area and the implications of this study. Finally, this chapter
highlights the study’s limitations and provides suggestions to consider in future research.
11
Chapter two: Literature Review
2.1 Introduction
As discussed in Chapter One regarding the current study’s aim and objectives (Section 1.2), this
chapter is devoted to comprehensively and critically reviewing the literature relating to stock
price informativeness, accounting transparency, and earnings quality issues. Analysing and
discussing the literature provides the theoretical framework for the relationship between
accounting transparency, earnings quality, and stock price informativeness. From this theoretical
framework, the research hypotheses will be formalised and then tested.
The motivation for this study is the debate in the literature about the relationship between
transparency, earnings quality, and stock price synchronicity, where the previous literature
contains much debate about the relationship, if it exists, between transparency, earnings quality
and stock price synchronicity.
After 2005, all the publicly traded companies in the European Union (EU) are required to
prepare their financial statements in accordance with IFRS, in order to improve the functionality
of the financial markets and to enhance the transparency and the comparability of financial
disclosure. Some studies try to examine the effect of IFRS adoption on the informativeness of the
stock price, especially after the mandatory adoption of IFRS in Europe in 2005. However, most
of these papers collect data from different countries for a short time period, two to three years
after the mandatory adoption, which does not provide sufficiently robust results about the IFRS
effect (Brüggemann et al., 2013).
In addition, although the accounting numbers are considered as one of the most important
sources of firm-specific information, and as one of the most reviewed reported numbers among
all firms’ financial disclosure, there are few papers that examined the link between earnings
quality and the informativeness of stock price. Moreover, these few papers provide conflicting
results. For these reasons this study tries to provide new evidence on the effect of earnings
quality on the informativeness of stock price, as measured by stock price non- synchronicity.

12
The rest of the chapter is organised as follows: Section 2.2 discusses the stock price
informativeness and stock price synchronicity as a measure of stock price informativeness.
Section 2.3 explains the accounting transparency and the relationship between transparency and
the flow of firm-specific information into the market. Section 2.3 also contains a discussion of
the IFRS literature. Section 2.4 discusses the definitions of earnings quality, measures of earning
quality, and the expected effect of earning quality on stock price informativeness.
2.2 Stock price informativeness
The literature is rich in papers that examine the relationship between firm’s characteristics and
stock price synchronicity. This section will discuss some of these papers. Discussing these
papers will provide theoretical and empirical justification for using stock price synchronicity as
an inverse measure of stock price informativeness.
This section discusses stock price synchronicity and the justification of using firm-specific return
variation as a measure of the amount of firm-specific information that is capitalized into the
stock price, and thus as a measure of stock price informativeness. This section consists of four
subsections. The first subsection discusses the literature that provides a conceptual level
justification of using firm-specific return variation as a measure of stock price informativeness.
The second subsection discusses the literature that provides empirical links between firm-
specific return variation and stock price informativeness. The third subsection contains a
discussion of the papers that linked firm-specific return variation to the uninformed trading
instead of informed trading. The final subsection provides a summary of the stock price
informativeness literature.
2.2.1 The conceptual argument of using stock price synchronicity as a measure of stock price
informativeness
According to the efficient market hypothesis developed by Fama (1970), in an efficient market,
the individual firm’s stock price reflects all the available relevant information. This information
consists of market-wide and/or industry-wide and firm-specific information. Morten Helbaek,
Snorre Lindset, and McLellan (2010) noticed that, in the strong form efficient market, the stock
price reflects all the available information, either private or public information. The industry
13
level and market level information are related to systematic risk factors, thus affecting all the
stocks in the market, whilst firm-specific information affects the firm itself. Based on this theory,
the movement of the stock price is caused by the introduction of one of these two types of
information. Because the market wide and industry-wide information affects all the stocks in the
market and/ or industry and firm-specific information affect the firm itself, one may consider the
amount of firm-specific return variation, in relation to market return and industry return, as a
measure of the amount of firm-specific information that is incorporated into the stock price.
The firm’s stock return variation could be caused by investors trading with firm-specific private
information. According to Grossman and Stiglitz (1980), a lower cost of obtaining firm’s private
information will increase the intensity of informed trading and hence create a more informative
stock price. Based on this prediction, Durnev et al. (2004) suggest that all else being equal,
higher firm stock price idiosyncratic volatility is a result of more informed trading ( due to lower
information cost), and so higher firm-specific return variation indicates a more informative stock
price.
Roll (1988) provides one of the first papers that notes how the firm-specific return variation
could result from the capitalization of firm-specific information into the stock price. Roll notes
the weak association between the firm’s stock price return and market and industry return; he
finds that the market wide and industry-wide information can explain only a small part, 20% -
30%, of the total movement of firm’s stock return in the U.S. market. He mentions clearly that
the extent to which stock prices commove together depends on the relative amount of market
level and industry level information that is incorporated into the stock prices and that the firms
with high firm-specific return variation could have a more informative stock price. Roll (1988, p.
56) suggests that the firm’s stock price synchronicity or R2
of market and industry model
‘‘seems to imply the existence of either private information or else occasional frenzy unrelated to
concrete information,”
Building on Roll's arguments, Durnev et al. (2004) suggest an explanation regarding the
movement of the stock price. They suggest that in the stock market the cost of obtaining
information about some firm’s fundamental values might be low, whilst the cost of information
about the fundamental values of other firms might be high. The high cost of obtaining
information enforces firms’ investors to collect and process more firm private information about

14
the former and less about the latter; as a result, the stock price from the former is more
informative than the later. Consequently, they suggest that greater firm-specific return variation
indicates more intensive informed trading and thus a more informative stock price about firm’s
fundamental value.
Jin and Myers (2006) also provide other explanations of firm-specific return variation. The key
to their explanation is the effect of opaqueness on the division of risk bearing between inside
managers and outside investors. They argue that opaqueness is both good news and bad news for
insiders. The good news is that more opaqueness allows insiders to capture more cash flow when
the firm is doing well. The bad news is that insiders have to hold a residual calm and absorb
downside risk. Managers can abandon the residual calm and reveal downside news to outside
investors, but this abandonment option is costly and not frequently exercised. Exercising this
option may cause a crash, that is, a large negative residual return. Increased management capture,
therefore, reduces the amount of firm-specific information that is available for outsiders. Lack of
transparency, combined with capture by insiders, leads to lower firm-specific risk for investors
and to higher stock price co-movement.
Veldkamp (2006a) suggests that when a piece of information can be used to predict the value of
many different stocks and this information is simultaneously processed by many investors, prices
and returns for the stocks can commove with each other, even if the fundamentals of the firms’
that these stocks relate are uncorrelated. They argue that many investors observe and process the
same information signals because the common signals are supplied at a relatively lower price. In
other words, the availability of firm-specific information reduces the comovement of stocks
prices. Where, when this information is not readily available investors rely on common,
inexpensive, information signals which “predict many assets’ values ’’ in their investment
decisions. When the investors use such common signals in their investment decisions this will
lead to greater stock price comovement and lower stock price informativeness.
The next section will discuss the papers that provide an empirical link between firm-specific
return variation and stock price informativeness.

15
2.2.2 Empirical links between stock price non-synchronicity and stock price informativeness.
In the previous section, the discussions reviewed the literature that provides the conceptual and
theoretical links between firm-specific return variation and stock price informativeness. In this
section, a discussion in the literature will consider the empirical link between stock price
synchronicity and stock price informativeness.
After Roll’s (1988) comments on the possible link between high firm-specific return variation
and the amount firm’s private information that is incorporated into the stock price, a growing
body of finance and accounting literature provides empirical evidence that is consistent with
information based interpretation of stock price synchronicity or firm-specific return variation.
Whereas Morck et al. (2000) examined worldwide stock price synchronicity at a country level,
and find that the stock prices in developing economies, such as Poland, China, Malaysia, and
Turkey, tend to commove more than those in developed countries such as the United Kingdom,
Canada, Ireland, and the United States. Morck et al. (2000) document that this co-movement in
developing countries is not caused by the correlation of fundamental performance of these
economies but is as a result of the lack of investor’s protection rights which affect the amount
and the type of information that is capitalized into the stock prices. They suggest that the strong
property rights in developed countries facilitate and promote informed trading, which leads to
more firm-specific information to be used in the investment decision and incorporated into the
stock price. In contrast, in the developing countries the poor protection of public investors from
firm’s insiders, make firm-specific information less useful to risk arbitragers, and therefore
impedes the capitalization of firm- specific information into stock prices, leading to low firm-
specific price variation and high stock return synchronicity.
Wurgler (2000) examined whether the countries with a more informative stock price, as
measured by stock price synchronicity, allocate recourses more efficiently. His results show that
the capital moves faster to its highest value uses in countries with lower stock price
synchronicity. This result suggests that a more informative stock price leads to more efficient
allocation of capital across sectors. Similar evidence is also provided by Durnev et al. (2004),
where they provide industry level evidence from the US market that, low stock price
synchronicity is associated with the efficient allocation of capital.

16
Other streams of the research try to find a direct link between the firm-specific return variation
and stock price informativeness. One of the first examples of direct empirical evidence of the
link between firm-specific return variation and stock price informativeness is provided by
Durnev et al. (2003). After defining the stock price informativeness as the relationship between
the current stock price and future earnings, they suggest that, if firm-specific return variation
reflects a more informative stock price, then the stock price for firms with higher idiosyncratic
volatility should have a higher relation to future earnings. Their results suggest a significant
positive relationship, through both simple correlation and regression analysis, between firm-
specific return variation and their measures of stock price informativeness. In particular, they
found that the firms and industries with lower stock price synchronicity, experience a higher
correlation between their stock price and future earnings. They conclude that firm-specific return
variation represents the amount of firm-specific information that is incorporated into the stock
price, and thus it measures the informativeness of stock price.
Bae, Kim, and Ni (2013) use the firm’s geographic proximity to investors as a proxy for private
information. They argue that if the firm-specific return variation is indicative of a more (less)
informative stock price, then one should find a positive (negative) relationship between
geographic proximity and firm-specific return variation. After examining the US market for the
period from 2001 to 2009, they found that the stocks of firms with headquarter in metropolitan
areas realized significantly higher firm-specific return variations than those with headquarter in
non-metropolitan areas. These results provide strong evidence that firm-specific return variation
is a useful measure of the relative amount of firm-specific private information reflected in stock
prices, and that higher firm-specific return variation is indicative of more informative stock
prices.
Other evidence from the Chinese market shows that higher firm-specific return variation is
associated with more informative stock price. Lin, Karim, and Carter (2014) Investigated the
relationship between firm-specific return variation and three measures of firm-specific
information flow into the stock price, namely, Earnings Response Coefficient (ERC), future
ERC, and event-study price reaction around earnings announcements. They suggest that if stock
price idiosyncratic volatility reflects more firm-specific information, then these three measures of
informativeness should have a significant positive effect on their measure of firm-specific return
17
variation. They find that firm-specific return variation is positively related to their measures of
stock price informativeness. This results support the view that higher firm-specific return
variation means a more informative stock price.
In an attempt to provide evidence about the link between stock price synchronicity and stock
price informativeness L. T. W. Cheng, Leung, and Yu (2014), examine the relation between
changes in R2 and the new information released. They suggest that if firm-specific return
variation captures firm-level information, then there will be an increase in stock price
idiosyncratic volatility following major earnings announcements. Their results support the
informative interpretation of low stock price synchronicity, where the results show a significant
increase in firm-specific return variation upon the disclosure of firm-specific information,
suggesting that more firm-specific information has been incorporated into the stock price.
Recently, Kang and Nam (2015) empirically examined the relation between the probability of
informed trading and firm-specific return variation. They suggest that if informed trading
facilitates the incorporation of firm-specific information into the stock price, then it is expected
to have a positive effect on stock price synchronicity. After examining a sample of 93,008 firms/
quarter observation from U.S for the period from 1993 to 2007, their results suggest a significant
positive relationship between probability of informed trading and firm-specific return variation.
These results support the view that high firm-specific return variation reflects more informed
trading than uninformed trading so it indicates a more informative stock price.
Other researchers also provide empirical evidence that links firm-specific return variations with
the higher transparent information environment. For example, Jin and Myers (2006) took a
sample from 40 stock markets for the period from 1990 to 2001, to explain why the stock market
synchronicity is higher in countries with less developed financial systems and poor corporate
governance. The key to their explanation is the effect of opaqueness (lackof transparency) on the
division of risk bearing between inside managers and outside investors. They argue that
opaqueness is both good news and bad news for insiders. The good news is that more
opaqueness allows insiders to capture more cash flows when the firm is doing well. The bad
news is that insiders have to hold a residual calm and absorb downside risk. They can abandon
the residual calm and reveal downside news to outside investors, but this abandonment option is
costly and not frequently exercised. Exercising this option may cause a crash, that is, a large

18
negative residual return. Increased management capture, therefore, reduces the amount of firm-
specific information that is available for outsiders. Lack of transparency, combined with capture
by insiders, leads to lower firm-specific risk for investors and to higher stock price comovement.
In addition, Haggard et al. (2008) empirically examine whether disclosure leads to reduce stock
price comovement or not. By Refereeing to the Jin and Myers (2006) and Veldkamp (2006a)
models they expected that the voluntary disclosure will increase the availability of firm-specific
information which will facilitate the incorporation of this information into stock price. After
taking a sample of 2,084 firm-year observations covering the years between 1982 and 1995, their
results show that expanded voluntary disclosure policy effectively reduces the comovement of
the firm’s stock prices and hence increases the proportion of firm-specific information that
incorporated into the stock price.
The positive relation between transparency and higher firm-specific return variation is also
documented by Hutton et al. (2009). They investigate the relationship between financial
information opacity, as measured by earnings management, and firm-specific return variation.
Based on their prediction the stock returns for firms with more opaque financial statements will
have higher comovement with market returns, because there is less firm-specific information
available to affect firm’s stock price. After taking a large sample of 40,882 U.S firm-year
observations for the period between 1991 and 2005, they find that the higher opaqueness as
measured by higher earnings management is associated with higher comovements of the stock
price.
Dewally and Shao (2013) examine the effect of bank opacity, as measured by the using of
financial derivatives, on the extent to which firm-specific information is incorporated into bank
stock price. They suggest that the financial derivatives increase firm’s opacity, so the firms with
higher use of financial derivatives will have less firm-specific information available in the
market, hence these banks will have high synchronous less informative stock price. Their results
show that the financial derivatives do diminish the transparency of banks financial statements
and reduce the amount of firm-specific information that is available to the investors, as a result
this leads to a less informative, high synchronise stock price.

19
Another piece of empirical evidence of the relationship between transparency and synchronicity
is also provided by Wang and Yu (2013) and Ben-Nasr and Cosset (2014) where they examine
the effect of government ownership on synchronicity. Wang and Yu (2013) investigate the
relationship between stock price synchronicity and the state-owned bank loans in the Chinese
market. They suggest that state ownership may weaken both the corporate governance and
minority shareholders rights, which may increase information asymmetry and thus the
synchronicity of stock price. They find a significant positive relationship between state loan
ownership and the co-movement of stock price, which suggests that state ownership may reduce
firm’s transparency and the flow of firm-specific information into the stock price, which may
enforce firm’s investors to rely on market and industry sources of information in their investment
decisions.
In contrast Ben-Nasr and Cosset (2014) examine the effect of a change in firm’s transparency
environment on stock price informativeness, as measured by stock price synchronicity. They
analyse the impact of privatisation of previously government-owned firms on the
informativeness of stock prices for these firms. They suggest that the improved transparency
after the privatization of these firms will lead to a more informative stock price, as the residual
government ownership is normally associated with a more opaque disclosure environment. The
less transparent environment make obtaining firm-specific information more costly, and
according to Jin and Myers (2006), the higher cost of obtaining firm-specific information
encourages the investor to use other, market level and industry level, cheaper sources of
information, leading to less firm-specific information to be incorporated into the stock price.
After taking an international sample from 41 different countries around the world they find
significant and robust evidence that lower transparency with state ownership, impeded firm-
specific information to be capitalized into stock price leading to lower stock price
informativeness.
In an attempt to investigate the effect of firms less transparent operations on synchronicity, Kim
and Li (2014) examine the impact of offshore operations on the flow of firm-specific information
to the market. They argue that the investor of firms that are engaged in offshore operations face a
more complex task in understanding and evaluating the consequences of firm’s offshore
activities. In addition, the managers and owners of offshore companies have a greater
20
opportunity to extract a private benefit compared with non-offshore firms. These arguments
suggest that the offshore operations create a more opaque information environment, for these
reasons it is expected that the amount of firm-specific information that is incorporated into the
stock price is lower for offshore firms in comparison with the corresponding amount for non-
offshore firms. In another word, they expect lower stock price synchronicity for non-offshore
firms in comparison with offshore companies. The research results are consistent with their
prediction, where the results suggest that the stock price synchronicity is significantly lower for
non-offshore firms than that for offshore firms. These results agree with the view that higher
transparency improves the flow of firm-specific information to the market, leading to higher
firm-specific return variation.
Kim, Zhang, Li, and Tian (2014) provide international evidence of the relation between
transparency and stock price synchronicity by examining the effect of externally generated
transparency on firm’s stock price synchronicity. They suggest that when a firm’s external
environment is considered as a more transparent, as measured by press freedom; the firm’s stock
price should reflect more firm-specific information. They argue that the transparency has two
effects on the stock price, information effect that is higher transparency makes the firms more
informative about fundamental values and thus higher transparency enables the firm’s stock price
to capitalize more firm-specific information. The other effect is the investor protection effect is
that transparency enhances investor protection, which encourages the existed and potential
investors to search for and collect more private firm-specific information and use this
information in their investment decision. Using this firm-specific information in investor’s
decisions will lead to higher incorporation of firm-specific information into a firm’s stock price,
thus improving the informativeness of the stock price. This explanation of the potential
relationships between transparency and the informativeness of stock price is consistent with
Morck et al (2000) as they find the countries with the strong investor protection regime have less
synchronous more informative stock prices. Using stock price synchronicity as an inverse
measure of stock price informativeness, and taking a large sample of firms from fifty different
countries, they find significant results that the countries with lower stock price synchronicity
have higher quality transparent information environment.
21
Yu, Li, Tian, and Zhang (2013) examine the effect of aggressive reporting and an investor
protection regime on the incorporation of firm-specific information into stock price. After
applying three different proxies of stock price informativeness, their results show that stock price
informativeness is reduced significantly with aggressive reporting. But in regions with strong
institutional development, this reducing effect of aggressive reporting on stock price
informativeness is clearly mitigated. This means that with weak investor protection firm-level
transparency is reduced; therefore, investors are less willing to gather firm- specific information
before they trade. Thus, stock prices are less able to incorporate and reflect firm-specific
information and are less able to inform the true value of underlying stocks.
Recent evidence from emerging markets supports the view that firms with low stock price
synchronicity operate in more transparent environments is provided by Song (2015). After
examininga sample from 13 different emerging markets, Song (2015) find that the firms with
lower stock price synchronicity have superior disclosure accounting policies, and have less crash
risk. These results suggest that more transparent disclosure policies reduce the investors’ cost of
collecting and processing firm-specific information, which facilitates the incorporation of this
information into the stock price, thus resulting in higher firm-specific return variation.
Another stream of research empirically examines the effect of the firm’s ownership structure on
stock price synchronicity. For example, Kim and Yi (2015) use a large sample of 4,508 firm-
year observations from the firms listed in Korean Stock Exchange for the period from 1998 to
2007 to investigate the effect of institutional investors, either foreign or domestic, on stock price
synchronicity. They suggest that to the extent that institutional investors actively trade, process,
and use firm-specific information in their investment decisions, the institutional investors trading
activities will facilitate the capitalization of firm-specific information into stock prices, thereby
increase the informativeness of stock prices and reduce synchronicity. Their results suggest that
the institutional investors, foreign and domestic, play a significant role in facilitating the
incorporation of firm-specific information into stock prices. These results are more pronounce
for foreign institutional investors than domestic ones. In addition, they find that within the
domestic institutional investors the short-term institutional investors play a more important role
in incorporating firm-specific information into the stock price than long-term investors. This
22
suggests that short-term institutional investors are more effective in accelerating the flow of
firm-specific information to the market.
Other evidence from the developed market about the relation between ownership structure and
stock price synchronicity is provided by Boubaker, Mansali, and Rjiba (2014). After taking a
sample of 654 French listed firms for the period from 1998 to 2007, they examine the effect of
ownership concentration on stock price synchronicity. Their study provides evidence that the
separation of control and cash flow rights increase stock price synchronicity. This result is
consistent with the prediction that the controlling shareholders have incentives to reduce the flow
of firm-specific information to the market to keep any opportunistic behaviour outside the glare
of external scrutiny. However, this result holds if the controlling shareholder owns a large share
of cash flow rights, suggesting that concentrated ownership improves the capitalisation of firm-
specific information into stock price.
Similarly, Jiang, Kim, and Pang (2014) examine a sample of 12,736 firm-years from 20 different
countries. They suggest that controlling shareholders have the incentives to extract private
control benefits, which motivates the controlling shareholders to withhold value relevant, firm-
specific information. So, they expect a negative relation between controlling ownership and the
flow of firm-specific information to the market, and thus higher stock price synchronicity.
Consistent with their prediction the results suggest a significant positive relationship between
control ownership wedge and stock price synchronicity.
Gul, Kim, and Qiu (2010) examine the effect of ownership structure, foreign investment, and
audit quality on the stock price informativeness of Chinese firms, as measured by stock price
synchronicity. They finf that there is a concave relation between the amount of firm-specific
information that is incorporated into the stock price and ownership concentration. Their results
suggest an increase in synchronicity at a decreasing rate when the ownership concentration
increases; however, after reaching a particular level of ownership the synchronicity begins to
decrease. In addition, they find that when the largest shareholder is government related the
synchronicity is higher. With regard to the effect of foreign shareholders on stock price
informativeness, they find that the synchronicity is lower for firms that have foreign investors,
which suggest that the foreign investors could improve the informativeness of stock price
through their informed trading and by improving the corporate governance and disclosure quality

23
of their investment firms. In terms of audit quality, their results suggest a negative relation
between audit quality and stock price synchronicity, which indicate that high audit quality
reduces information asymmetry between firm’s insiders and outsiders by lending credibility to
financial statements. In addition higher audit quality facilitates the dissemination of firm-specific
information to the market through their professional competence and familiarity with client
operations, leading to a more informative stock price.
Using a sample from Chines firms for the period from 1998 to 2007 Hasan, Song, and Wachtel
(2014) find a significant relationship between political and legal institutional development and
the informativeness of stock price. They suggest that the better developed institutional
environment will lead to greater availability of reliable firm-specific information. While in poor
legal-institutional environment, the cost of obtaining the information will be high; the high cost
of obtaining the information reduces the investor's incentives to collect firm private information
as suggested by Veldkamp (2006a). When there is more reliable firm-specific information
available in the market, the stock price will contain a higher portion of this information in
relation to industry or market-wide information leading to less stock price synchronicity.
Gul, Srinidhi, et al. (2011) investigate the effect of female existence in the board of directors on
the stock price informativeness. They argue that with gender diversified board of directors there
will be more control on the management decisions, which will enforce them to disclose better
quality information. Also, the female board members will affect the nature of discussions in the
board’s meetings, which make the members of the board paying more concern for the outcomes
of their decisions. They suggest that these improvements in board governance will lead to a more
informative stock price. Consistent with their prediction the results suggest a positive relation
between stock price informativeness and board gender diversity.
Referring to Jin and Myers (2006) argument about management capture of firms private
information and its effect on stock price synchronicity, An and Zhang (2013) suggest that, the
existence of long-term ‘’dedicated’’ institutional investors, who have better ability to monitor the
management and attenuate their capture of firm-specific information, will increase the
availability of firm-specific information in the market which facilitates the incorporation of this
information into the stock price leading to lower stock price synchronicity. Based on a sample of
79,932 firm-year observation of U.S firms for the period from 1987 to 2010 their results show a
24
strong association between ‘’dedicated’’ institutional investors and low stock price
synchronicity.
He, Li, Shen, and Zhang (2013) investigate whether large foreign investors affect the extent to
which stock prices incorporate value relevance firm-specific information, as measured by stock
price synchronicity and probability of informed trading. After using a cross section of 3,189
firms in 40 markets in 2002, they finnd that large foreign ownership (LFO) is positively related
to both proxies of stock price informativeness. In addition, they investigate whether the
association between LFO and price informativeness varies systematically with country-level
corporate governance and information infrastructure. They finnd that the association between
LFO and price informativeness is stronger in markets with stronger investors’ protection and
better information disclosure, and so supporting the view of complementarity between market
level and firm level governance forces.
Other evidence of the effect of ownership structure on stock price synchronicity is provided by
Ding, Hou, Kuo, and Lee (2013). They examine the effect of mutual fund ownership on stock
price synchronicity. They suggest that mutual funds are more sophisticated and have more power
than individual investors to monitor firms, and thus serve as an external governance mechanism
that improves corporate transparency, for this reason, they expect a negative relation between
mutual fund ownership and stock price synchronicity. Consistent with their prediction, the results
suggest a significant positive effect of mutual funds on the Chinese stock price informativeness.
However, this effect is weakened by state ownership.
Using an unbalanced panel of 68,277 firm-year observations from 7,268 specific U.S firm for the
period from 1981 to 2001 Q. Chen, Goldstein, and Jiang (2007) show that the firms with higher
firm-specific return variation have a strong positive effect on the sensitivity of corporate
investment to the stock price. This result suggests that firm’s managers learn from the private
information that reflected in stock price about the firms’ fundamentals and use this information
in their corporate investment decisions.
Marhfor, M'Zali, Cosset, and Charest (2013) examine the effect of analysts' coverage on the
informativeness of the firm’s stock price. In addition, they investigate the effect of country
institutional development and analysts’ industry specialization on that relationship. They find

25
that financial analysts do not improve the incorporation of firm-specific information into stock
price. This result is in line with other research such as Chan and Hameed (2006) and Piotroski
and Roulstone (2004) who support the argument that financial analysts tend to provide more
industry-wide information than firm-specific information. However, they find that financial
analysts may provide more firm-specific information if they are specialized in firm’s industry.
In a different context Eun, Wang, and Xiao (2015) examine the effect of cultural differences on
the co-movements of stock prices. They suggest that in the “cultural tight countries’’ the
individuals’ behaviour tend to be homogenous with a lower degree of variation. The
homogeneous behaviour of individuals who live in such cultural environments may improve the
co-movement of the stock price.4 On the other hand, they expect a lower co-movement on the
stock return in more individualistic cultures. In such cultures, the individual tries to differentiate
his or her behaviour from others, and the individual is more confident in his or her ability to
acquire and analyse information with less concern about others’ opinions. After taking a sample
of 47 countries for a 20 years period, they find economically significant results that support their
prediction. They find that the countries that are characterised by less individualism have higher
stock price synchronicity than the countries with high individualist culture. In addition, they find
that countries with lower transparency and higher information opaqueness have a higher co-
movement of the stock price. So, their results provide robust evidence that the higher stock price
synchronicity and lower firm-specific return variation could be a result of a high market wide
variation in relation to firm-specific variation and shed the light on new omitted variable, cultural
differences, which may have an effect on the co-movement of stock prices.
Gul et al. (2010) document a significant relationship between audit quality and lower stock price
synchronicity, which corroborates the view that high audit quality facilitates the incorporation of
reliable firm-specific information into the stock price. The high audit quality reduces information
asymmetry between firm’s insiders and outsiders by lending credibility to the financial
statements. They also facilitate the dissemination of firm-specific information to the market by
their professional competence and familiarity with client operations, which leads to a more
informative stock price.
4 They use the country values of culture tightness from Gelfand et al. (2011), and the values of culture ‘s
individualisms from Hofstede (2001) .
26
Serenjianeh and Takhtaei (2013) investigate the relationship between abnormal audit fees and the
amount of firm-specific information that is incorporated into stock price as measured by stock
price synchronicity. They expect a negative relationship between stock price synchronicity and
abnormal audit fees. They justify their prediction by claiming that, the higher abnormal audit
fees mean that the auditor undertakes an extra effort in auditing the firm’s financial statements
which result in higher audit quality. The investor may consider these financial statements as
high-quality statements and use the information provided by these statements in their investment
decisions. This leads to more incorporation of firm-specific information into the stock price, and
thus lowers the stock price synchronicity. Consistent with their prediction the results show a
significant positive relationship between abnormal audit fees and the firm-specific return
variation.
Wang and Yu (2015) investigate the impact of accounting standards and legal environment on
the information content of stock prices. After taking a comprehensive sample from 44 countries
for a long period from 1995-2004 to produce more representative conclusions, they find that the
adoption of high-quality accounting standards, IFRS or US GAAP, has a significant positive
relationship with stock price informativeness, as measured by stock price synchronicity.
However, these results are robust only in countries with strong legal environment and better
investor protection regime. Their results are consistent with the argument that providing high-
quality accounting disclosure, by adopting higher quality accounting standards, per se does not
necessarily lead to a more informative stock price.
Francis, Hasan, Song, and Yeung (2015) show that the banks with higher firm-specific return
variation are operated in countries with more stringent capital regulations, more supervision with
an emphasis on private monitoring, and less government bank ownership. These results, which
are based on data from 36 different countries, suggest that the lower stock price synchronicity is
associated with a higher transparent and more informative information environment.
De Cesari and Huang-Meier (2015) examine the effect of stock price informativeness on the
relationship between abnormal returns and dividend changes. They argue that previous abnormal
stock returns may be considered by firm’s managers when taking dividend decisions. In the case
when the stock price is more informative and contains a high proportion of firm-specific
information, as measured by firm-specific return variation, they expect this relation between past
27
abnormal stock return and dividend changes to be strong for firms with low stock price
synchronicity and vice versa. Consistent with their prediction, they find that the degree of stock
prices informativeness strengthens the relationship between previous abnormal stock returns and
dividend changes.
Recent research that supports the informative interpretation of higher firm-specific return
variation is conducted by Ben-Nasr and Alshwer (2016). They examine whether managers use
information capitalised in stock prices when taking human investment decisions. In particular,
they examine whether more informative stock prices, as measured by firm-specific return
variation, are associated with more efficient labour investment. They suggest that the stock price
informativeness may affect the efficiency of labour investment in different ways. Where the
stock price contains information, which may affect managers’ labour investment decisions, the
managers do not have, such as information about expected investments opportunities, and future
demand for firm’s products and services. In addition higher transparency, that is associated with
a more informative stock price, mitigates the agency problem and hence improves the quality of
management decisions. Finally, they suggest that as there is some research connects a more
informative stock price with a lower cost of equity, then this makes it easier for firms to hire
employees. Based on the above arguments, they expect that the firm with a more informative
stock price to have more efficient labour investments. After examining a large sample of 21,551
U.S firms for the period from 1994 to 2010 and consistent with their predictions, their results
suggest that the more informative stock price does lead to more efficient investment in labour.
In conclusion, this section contains a discussion of the literature that provides theoretical and
empirical evidence of the links between firm-specific return variation and the amount of firm-
specific information that capitalised into the stock price. However, there is another view of the
high stock price synchronicity, where this view connects high synchronicity with uninformed
trading instead of informed trading. The next section contains a discussion of the literature that
adopts the noise as an interpretation of synchronicity.
2.2.3 Stock price synchronicity as an indication of an uninformed trading
Admittedly, the argument that firm-specific return variation is a good indicator of stock price
informativeness is not without its critics. Chang and Luo (2010) argue that low stock price
28
synchronicity is associated with poor information quality and greater exposure to uninformed
trading or noise trading. They finnd that the firms with low stock price synchronicity are more
difficult to value, tend to be affected by investor’s feelings and emotions, attract uninformed
investors, and are avoided by institutional investors.
Lee and Liu (2011) stat that the relation between price informativeness and idiosyncratic return
volatility is either U-shaped or negative. These results suggest that the relation between price
informativeness and firm-specific volatility is a function of the firm information environment
and so firm-specific return variation can reflect both noise trading and private information.
Skaife, Gassen, and LaFond (2006) suggest that the higher firm-specific return variation does not
mean that more firm-specific information has been incorporated into the stock price; they find a
low association between a stock with more specific return variation and firm’s future earnings. In
addition Teoh, Yang, and Zhang (2009) finnd that the firms with low stock price synchronicity is
less informative about firm’s future performance and have low-quality information environment
and more volatile earnings. These results contradict with the findings of Durnev et al. (2003).
2.3 Accounting transparency
2.3.1 Introduction
Corporate transparency is defined by Bushman and Smith (2003) as the widespread availability
of relevant and reliable information about the firms’ periodic performance, financial position,
investment opportunities, governance, value, and risk. Bushman, Piotroski, and Smith (2004)
also defined corporate transparency as the availability of firm-specific information to interested
parties those outside publicly traded firms. Bennis, Goleman, and O'Toole (2008, p. 3) point out
that “when we speak of transparency and creating a culture of candor, we are really talking about
the free flow of information within an organization and between the organizations and its many
stakeholders, including the public.”
Bushman et al. (2004) define financial transparency as the intensity and timeliness of financial
disclosure, and the interpretation and dissemination of this financial data by analysts and the
media.

29
Based on the previous definitions of transparency one can define transparency as the availability
of firm-specific information to the interested parties, whether they are investors, creditors,
regulators or the general public, and this information to be transparent have to be reliable and
precise and to be disclosed in a timely manner.
This section will provide an overview of the accounting transparency concept and the economic
benefits and consequences that associated with improved transparency. In addition, this section
will discuss the benefits of adopting IFRS and its roles in improving the transparency of firm’s
disclosure.
2.3.2 The importance of accounting transparency
A number of studies examine the effect of accounting disclosure policy and information
environment in the flow of relevant and reliable information into the market. The general view is
that with more transparent firm disclosure and with more transparent information environment,
more valuable information will be available to the decision makers, in a timely manner, so they
can use this information in their decision making. Using valuable, relevant information in their
investment decisions will lead to more efficient utilization and allocation of scarce resources,
leading to economic development and growth. In the other hand, the opacity of firm’s
information and the difficulty of obtaining the relevant information in a timely manner will
increase the cost of obtaining the information, leading to less efficient use of the resource.
Levine (1997, p. 695) suggest that “high information cost may keep capital from flowing to its
highest value use”. In addition, Bushman et al. (2004) argue that the availability of information
tends to be a key determinant of the efficiency of the resource allocation decision and growth in
an economy.
Bushman, Piotroski, and Smith (2011, pp. 1-2) argue that “financial disclosure and related
institutions designed to promote credible disclosure between managers and investors play a key
role in facilitating efficient capital allocation. In particular, credible financial accounting
information forms the foundation of the firm-specific information set available to investors,
regulators, and other stakeholders in an economy.” This means that the more transparent and
high-quality financial disclosure leads to more efficient allocation of capital. Efficient allocation
of scarce resources will lead to more developments in the economy and higher growth rate. The
30
new investments will create new job opportunities, lower unemployment rates, and as a result,
increase social welfare.
This subsection will discuss some of the research that highlights the importance of transparent
disclosure for facilitating the flow of information to the market and its role in efficient resource
allocation. Jere Francis, Huang, Khurana, and Pereira (2009) define corporate transparency as the
availability of firm-specific information to those who are outside publicly traded firms and
examined the role of corporate transparency in allocating the resources efficiently. They collect
their data from 37 different countries and find that a more transparent information environment
facilitates the timely reallocation of resources from industries that experience negative growth
opportunities to industries that experience positive growth opportunities. These results ensure the
role of more transparent disclosure on efficient resource allocation.
Hermalin and Weisbach (2012, p. 195) highlight the importance of company disclosures in
reducing the information asymmetry and as a result reducing the company’s cost of capital as
they mention that “Indeed, there are good reasons why disclosure can increase the value of a
firm. For instance, reducing the asymmetry of information between those inside the firm and
those outside can facilitate a firm’s ability to issue securities and consequently lower its cost of
capital. Fear of trading against those with privileged information could reduce willingness to
trade the firm’s securities, thereby reducing liquidity and raising the firm’s cost of capital. Better
disclosure presumably also reduces the incidence of outright fraud and theft by insiders.”
Cheng, Dhaliwal, and Zhang (2013) provide a direct evidence on the causal relationship between
the quality of financial reporting and firm’s investment efficiency. They consider the new
Sarbanes-Oxley Act requirements, enacted in 2002, of disclosing internal control weaknesses as
a signal of high-quality financial reporting, and examine its effect on the firm’s investment
efficiency. Their results show that the firm’s investment efficiency has significantly improved
after adoption of the disclosure requirements.
In addition, some researchers have documented that improved transparency and high-quality
disclosure reduce the cost of capital. For example, Lambert, Leuz, and Verrecchia (2012)
document that the lack of transparency and the increase in information asymmetry increase the
firm’s cost of capital, however, this is conditional upon when the markets are imperfectly
31
competitive. In addition, they find that the degree of information asymmetry in the market
influences the amount of liquidity, which also raises the cost of capital.
Barth, Landsman, and Lang (2008), Kim, Shi, and Zhou (2014), Daske, Hail, Leuz, and Verdi
(2013), Palea (2009), Wang and Yu (2015), Houqe, van Zijl, Dunstan, and Karim (2012),
Landsman, Maydew, and Thornock (2012), and Ismail, Kamarudin, Van Zijl, and Dunstan
(2013) concludes that the more transparent accounting standards lead to lower cos of capital,
higher earnings quality, and a more informative stock price.
Daske (2006) argues that the information asymmetries among different groups of investors
introduce adverse selection into stock transactions and hence reduce market liquidity. They
suggest that more transparent disclosure reduces information asymmetry among market
participants, increases liquidity, and hence reduces the cost of capital. Francis, Nanda, and
Olsson (2008) also document that the voluntary disclosure is significantly associated with
lowering firm’s cost of capital; however, this relationship is conditional upon good earnings
quality.
Extensive studies have also suggested that more transparency improves the informativeness of
firm’s stock price. Jin and Myers (2006), for example, show that more transparent firms with an
expanded disclosure policy and more publicly available firm-specific information, result in a
more informative stock price and have less probability of facing ‘’crash risk’’, which is
experiencing large negative return. As they argue that the lack of transparency allows insiders to
capture more cash flow in good news periods, however during bad news periods firm’s insiders
have to hold a residual calm and absorb downside risk. They can abandon the residual calm and
reveal downside news to outside investors, but this abandonment option is costly and not
frequently exercised, because exercising this option cause a crash, resulting in a large negative
residual return.
Gelb and Zarowin (2002) suggest that, since the main purpose of firm’s disclosure is to provide
useful information to the decision maker about the amount, timing, and uncertainty of future cash
flow, then firms with improved disclosure policy should have a stronger relationship between
stock price changes and future earnings changes, than firms with less improved disclosure
policy. After taking a sample of firms from the same industry, to isolate the effect of disclosure

32
on stock price informativeness, they find that the firms with enhanced disclosure have a more
informative stock price about future earnings than other firms, which is consistent with their
suggestion.
Veldkamp (2006a) also finds that the availability of firm-specific information increases the stock
price informativeness, whereas when this information is not readily available investors rely on
common high demanded (inexpensive) information signals, as a result, the stock price will
contain more common information and less firm-specific information.
Dewally and Shao (2013) examine the implication of bank opacity, as measured by using
financial derivatives for bank information environment and the extent to which firm-specific
information is incorporated into the bank stock price. They suggest that the financial derivative
increase firm’s opacity, so the banks that use financial derivatives frequently will have less firm-
specific information available in the market, hence these banks will have high synchronous and
less informative stock price. Their results show that the financial derivatives do diminish the
transparency of banks financial statements and reduce the amount of firm-specific information
that is available to the investors, as a result this leads to less informative high synchronise stock
price.
Other streams of research indicate that there is a significant relationship between transparency
and higher earnings quality. Bhattacharya, Ecker, Olsson, and Schipper (2012) apply path
analysis to a sample of value line firms from 1993-2005 to test if there is evidence of a direct
link between earnings quality, as a proxy of information risk, and the cost of equity. Also, they
try to find evidence of whether there is an indirect link between earnings quality and the cost of
equity, in which information asymmetry is a mediator variable that is influenced by earnings
quality and, in turn, influences the cost of equity. They build on three streams of research to
consider the relationship between earnings quality and cost of equity. The first stream,
investigate the links between earnings quality and information asymmetry. The second stream
contains analytical models that specify how either the earnings quality and information
asymmetry related to the cost of equity. The third stream provides evidence on the associations
between earnings quality and the cost of equity, and, separately, between measures of
information asymmetry and the cost of equity. For all three measures of earnings quality, they
find statistically reliable evidence of both a direct path and indirect path, mediated by
33
information asymmetry and Beta, between earnings quality and the cost of equity. They also find
that the direct path is empirically more important than the indirect paths.
Yeh, Chen, and Wu (2014) anticipate a positive relationship between information transparency
and earnings quality. Consistent with their prediction they find a significant improvement in their
measures of earnings quality after the implementation of more transparent disclosure
requirements. In particular, they document that the most transparent firms have more persistent
earning, smoother earnings, more predictive value earnings, and have lower abnormal accruals.
In addition, Ernstberger, Stich, and Vogler (2011) find evidence of a decrease in earning
management, and an increase in stock liquidity among German firms that fall under new more
transparent enforcement regime. Christensen, Hail, and Leuz (2011) also find that the improved
transparency directives that required by the EU lead to an increase in the market liquidity.
Moreover, they find that liquidity-improving effects are larger in countries that implement and
enforce the directives more strictly. In addition, they find that the effects are also stronger in
countries with traditionally stricter securities regulation and with a better track record of
implementing regulation and government policies in general.
2.3.3 The history of International Financial Reporting Standards (IFRS) and its
objectives
The previous subsections discuss accounting transparency, its definitions, and the importance of
transparency for the firms itself and for the economy as a whole. However, a question arises here
how can the firms improve the transparency of their disclosure, and what are the tools the firm
can use to improve its transparency and disclosure? Many researchers consider the adoption of
International Financial Reporting Standards as an important way to improve the transparency of
financial disclosure. These international high-quality standards contain more disclosure
requirements than any other standards. About 120 countries and unions around the world
mandatorily ask from the listed companies to prepare their financial statements in accordance
with IFRS to improve the transparency of financial disclosure5. This section will provide an
overview of the history of IFRS formation, who issues IFRS and the main objectives of
introducing IFRS.
5 For example, the European Union, starting from 2005, ask from all the listed companies to prepare their financial
statement according to IFRS.
34
Ball (2006, p. 6) provide a brief definition of IFRS when he mentions that “IFRS are accounting
rules (‘standards’) issued by the International Accounting Standards Board (IASB), an
independent organisation based in London, UK. They purport to be a set of rules that ideally
would apply equally to financial reporting by public companies worldwide”. In 1973, the
International Accounting Standards Committee (IASC) was formed through an agreement made
by professional accountancy bodies from Australia, Canada, France, Germany, Japan, Mexico,
the Netherlands, the United Kingdom, Ireland, and the United States of America. IASC members
operated on a part-time, voluntary basis (Delloitte, 2015). IASC continue for the period between
1973 and 2000, and IASC’s rules were named as ‘International Accounting Standards’ (IAS).
Since April 2001, this rule-making function has been taken over from IASC by a newly-
reconstituted International Accounting Standards Board (IASB). The IASB choose a new name
for the rules they issue and call it ‘International Financial Reporting Standards’ (IFRS), though it
continues to recognise the prior rules (IAS) issued by the old standard-setter (IASC). The IASB
is better-funded, better-staffed and more independent than its predecessor, the IASC (Ball, 2006).
IASB specify its main objective as to “To develop a single set of high-quality, understandable,
enforceable and globally accepted financial reporting standards based upon clearly articulated
principles.” (IFRS.ORG, 2015). So IASB aims to achieve three main objectives including
developing high quality, understandable and enforceable international accounting standards, that
provide high quality, transparent and comparable information, to help the financial statements
users in making their decisions; promote the use and rigorous implementation of these standards
around the world; and promote convergence and harmonisation in accounting practices around
the world (Ball, 2006).
In 19/07/2002 the European Union EU parliament issue regulation number 1606/2002, which
requires all the firms listed in the EU market to prepare financial statements in accordance with
IFRS. The main goal of regulation number 1606/2002 is “to contribute to a better functioning of
the internal market, publicly traded companies must be required to apply a single set of high-
quality international accounting rules for the preparation of their consolidated financial
statements. Such measure will also ensure high-level transparency and comparability of financial
reporting by all publicly traded EU companies as a necessary condition for building an integrated

35
capital market which plays its role effectively, smoothly and efficiently.” (European Parliament,
2008).
The new proposed standards are expected to improve transparency and comparability of
financial markets, which in turn lead to lower information asymmetry and better functioning
capital markets (Moscariello, Skerratt, & Pizzo, 2014).
IFRS are also considered to be more transparent standards since they contain a greater number of
disclosure requirements than any national standards (Ernst & Young, 2006). The current IFRS
book issued by IFRS ORG contains about 4,500 pages of texts in comparison with some 2,300
pages in 2006 (IFRS.ORG, 2015). In 2006 the IFRS contains some 2,000 disclosure
requirements. These requirements represent approximately twice the number of standards that
were required under UK GAAP and under Australian GAAP prior to IFRS, and four times those
had been required under French GAAP (Ernst & Young 2006). These high numbers of disclosure
requirements are reflected in the firms’ annual reports length, where Ernst and Young (2006)
document an increase of up to 30 per cent in the length of post-IFRS adoption annual reports for
a sample of EU firms with an average of 65 pages.
Barth et al. (2008) suggest that to achieve the goal of the IASC and the IASB, of providing a set
of globally accepted high-quality accounting standards, the IASC and the IASB have issued
principles-based standards, and have made efforts to remove acceptable accounting alternatives
and to require accounting measurements that better reflect a firm’s economic position and
performance.
After providing a brief introduction to the IFRS adoption and its related objectives, the next
sections will contain a detailed discussion about the justification of using IFRS as a measure of
higher transparency disclosure tool and some empirical evidence of the benefits and economic
consequences of adopting IFRS.

36
2.3.4 The UK accounting regulatory system
The UK firms published annual reports is based on three sources of regulations: company low,
accounting standards, and stock exchange requirements (Finningham, 2010). The first set of
mandatory accounting requirement in the UK published by the Accounting Standards Steering
Committee (ASSC). The Institute of Chartered Accountants in England and Wales (ICAEW)
established this committee in 1970. In 1976 the name of Accounting Standards Steering
Committee is changed to Accounting Standards Committee (ASC) which was jointly owned by
its members. The main role of ASC was to to publish the Statements of Standards Accounting
practice (SSAP) which aims to standardise the accounting practice.
A considerable reform of the legislative demands governing UK public companies account is
taken place after the implementation of the European community (EU) fourth directive via
Companies Act 1981. The 1981 Company Act was followed by the Companies Act 1985. The
1985 Act is focused in implementing legal standards with respect to the disclosure of financial
statements in order to facilitate intercompany comparisons.
In order to formulate better-funded body of accounting regulation, in 1990 the UK has
established an independent entity called the Financial Reporting Council (FRC); the main role of
this council is to develop financial reporting standards (FRS). Before issuing FRS, the ASB
published a Financial Reporting Exposure Draft (FRED) (Finningham, 2010). The ASB has the
authority to issue new accounting standards without a need to have approval from any other
professional body, which facilitate the issuance of new standards.
The UK firms that listed on London Stock Exchange (LSE) are required to comply with the
regulations issued by the UK Listing Authority (UKLA) along with the Company Law. The
listing rules contain additional disclosure requirements that are not yet in the statue or standards;
like the disclosure requirements about the company board of directors and corporate governance.
2.3.5 Anticipated benefits of IFRS adoption
As discussed in the previous section the IFRS and its predecessor IAS was formed to provide
high quality transparent and comparable financial disclosure. In an attempt to get the benefits of
37
IFRS adoption in 2002 the European Union (EU) issue the regulation (1606/2002); this
regulation requires publicly listed firms in the EU to prepare their consolidated financial
statements according to IFRS for the year beginning 2005 and thereafter, to help ensure a high
degree of transparency and comparability of financial statements, and to improve the efficiency
of capital markets.
Ball (2006) suggests that one of the indirect advantages of IFRS adoption is the reduction in the
firm’s cost of capital, where the high information quality reduces the investment risk which will
lead theoretically to a reduction in the firm's cost of equity capital. The reduction of cost of
capital will increase the firm’s stock price and make a new investment by firms more attractive.
Accounting standards are important, if not crucial, in a complex financial market because these
standards explain how capital is invested and performance is monitored and rewarded (Brown,
2011).
Brown (2011, p. 272) summarizes the anticipated benefits of IFRS adoption as follow “the
benefits typically sought by adopting IFRS are to eliminate barriers to cross-border investing; to
increase the reliability, transparency, and comparability of financial reports; to increase market
efficiency; and to decrease the cost of capital. A typical un-stated benefit is to share the costs of
standard-setting and securing compliance with accounting standards.”
In conclusion, the IFRS adoption aims to provide high quality and more transparent accounting
disclosure, and to harmonise the accounting practice around the world, which helps in removing
the barriers to international investing. The next section will discuss the literature that provides
empirical evidence regarding the consequences of IFRS adoption.
2.3.6 Empirical evidence of the consequences of IFRS adoption
As mentioned in the previous section the main objective of IFRS is to provide a high quality and
more transparent financial reporting standards. Whereas the adoption of these standards is
expected to improve the transparency and the comparability of financial data, leading to
improvements in the market efficiency and decrease in the cost of capital. The fundamental
question is whether the anticipated benefits of IFRS adoption have been achieved in the countries
that choose to use IFRS as a base for financial reporting, or not? Following the requirement that
38
all the companies listed in the EU should prepare their financial statements in accordance with
IFRS starting from first of January 2005, a growing number of studies have examined the
consequences of mandatory IFRS adoption. This section contains a discussion of the papers that
provide empirical results of the consequences of IFRS adoption. After discussing these papers,
the research gap in the literature is thereby identified.
Daske and Gebhardt (2006) conduct an experiment to provide evidence about the expected link
between higher quality international accounting standards (IFRS, US GAAP) and higher quality
accounting reports. That possible link should lead to higher liquidity in the capital markets and
lower cost of capital. They use disclosure quality scores, which are undertaken by accounting
experts, to assess the quality of financial statement of firms that adopted IFRS or U.S GAAP in
three European countries: namely, Austria, Germany, and Switzerland which annual reports
rating by independent accounting experts are available over a long period.6 Their result shows
that the disclosure quality for firms that adopted IFRS or U.S. GAAP has increased significantly
after the adoption. This result is consistent with the view that IFRS adoption leads to higher
quality accounting reports.
Barth et al. (2008) investigate the relationship between the adoption of IAS and accounting
quality by examining 1,896 firm-year observations from 21 countries for the period from 1994 to
2003. In particular, they examine whether the accounting numbers of firms that adopt IAS
experience less earnings management; higher value relevance of accounting numbers; and more
timely loss recognition than those for firms adopt local standards. They suggest that the main
goal of the International Accounting Standard Committee (IASC) and its successor International
Accounting Standards Board (IASB), is to develop and issue a set of high quality international
accounting standards that remove previously acceptable accounting alternatives and imply
accounting measurements that better reflect a firm’s economic position and performance. For
these reasons, they argue that the firms that adopt this set of high-quality standards may then
experience a high quality in their accounting numbers. Their results come consistent with their
predictions and show that the firms that adopt IAS record significant lower earnings
management, more timely loss recognition, and more value relevant accounting numbers than
6 They employ measures of the information quality of annual reports from the annual competitions for the best
annual reports in the business journals Capital and Focus Money (Germany 1996–2003), Bilanz (Switzerland 2001–
04) and Trend (Austria 1997–2004).

39
non-adopters. Moreover, they find that the accounting numbers for the firms that adopt IAS are
of higher quality in the post-adoption period in comparison with the pre-adaptation period.
In an attempt to provide evidence of the benefits of IFRS adoption from emerging market Ismail
et al. (2013) examine the effect of mandatory IFRS adoption on the quality of accounting
numbers of Malaysian companies. In particular, they examine whether the Malaysian firms
exhibit lower earnings management, as measured by the absolute value of discretionary accruals;
and higher value relevance accounting numbers, as measured by the relation between earnings
and stock prices, and the relation between earnings and stock return, following the mandatory
adoption of IFRS. After examining a sample of 4,010 firm-year observations, from three years
before and three years after the adoption, their results show a lower earnings management and
higher value relevant of earnings numbers following the mandatory adoption of IFRS.
Other international evidence of the positive impact of IFRS adoption on earnings quality were
provided by Houqe et al. (2012). They examine a large sample of 104,348 firm-year observations
from 46 countries for the period between 1998 and 2007. Their results suggest an increase in the
earnings quality for the mandatory adopters; however, these results are conditional upon the
countries’ investor protection regime. Whereas the results revealed that, the firms that are located
in countries with poor investor protection regime, do not experience any improvement in the
quality of their earnings. These findings are in line with the argument that cross-country
differences in accounting quality are more likely to remain after mandatory IFRS adoption,
where there is poor investor protection regime.
Ahmed, Neel, and Wang (2013) investigate the effect of mandatory adoption of IFRS on three
groups of accounting quality measures, namely: income smoothing, aggressive reporting, and
earnings management toward the target. Their sample consists of firms from countries that
choose to adopt IFRS, in comparison with a matched sample of firms from countries that did not
adopt IFRS. In order to best measure the effect of IFRS on earnings quality, they try to find a
matched sample of non-IFRS adopters that matched on the strength of legal enforcement,
industry, size, book-to-market, and accounting performance. Their final sample contains 16,310
firm-year observations from 20 countries, covering the period from 2002 to 2007. Their results
suggest an increase in income smoothing for IFRS adopters in comparison with match non-
adopter sample. In terms of reporting aggressiveness, their results show an increase in aggressive
40
reporting for IFRS adopters relative to benchmark sample. However, they did not find any
evidence suggest managing earnings toward targets for IFRS adopters. In general, their results do
not document any improvements in earnings quality following IFRS adoption; furthermore, the
results suggest a decrease in earnings quality for IFRS adopters in contrast of non-IFRS adopters.
Doukakis (2010) examines the effect of mandatory IFRS adoption on the persistent of earnings
and earnings components for Greek firms. After examining 956 firm-year observations for two
years before and two years after the IFRS adoption their results suggest that IFRS adoption does
not seem to improve persistence of earnings and earnings components for future profitability.
Moreover, the evidence suggests the lower persistence of operating income and non-operating
income after IFRS adoption.
Other evidence from emerging market is provided by Aksu and Espahbodi (2012), where they
examine the effect of IFRS adoption on the disclosure quality of Turkish firms, their results show
that the firms that choose to voluntary adopt IFRS have significantly higher transparency and
disclosure scores than non-adopter. However, they find that the overall disclosure and
transparency score, record no significant difference between voluntary adopters and mandatory
adopters.
Li and Yang (2016) examine the effect of mandatory IFRS adoption on firm’s voluntary
disclosure. They suggest that IFRS adoption could affect firms’ disclosure incentives to meet the
capital market demand of higher quantity and quality disclosure. To investigate the effect of
mandatory IFRS adoption on voluntary disclosure they examine the changes in management’s
earnings forecast for the pre-adoption period and post-adoption period. Their research results
show a significant increase in the likelihood and the frequency of issuing future earnings forecast
following the mandatory adoption of IFRS. In addition, the results suggest that this increase in
issuing earnings forecasts is more pronounced in countries where local standards differ the most
from IFRS. In addition, the results suggest that improved earnings quality, increased shareholder
demand, and increased analysts demand are three channels through which IFRS adoption leads to
more voluntary disclosure in earnings forecasts.
Ballas, Skoutela, and Tzovas (2010) performed a survey on the financial managers of the top 100
Greek firms and ask them about the relevant of IFRS adoption in Greece. The survey results
41
show that the financial managers believe that the adoption of IFRS improve the quality of
financial reporting, where the reliability, transparency, and comparability of financial statements
have been increased after the introduction of IFRS in Greece.
Landsman et al. (2012) investigate whether the mandatory adoption of IFRS will improve
earnings information content, as measured by abnormal trading volatility and abnormal trading
volume, by examining 21,703 firm-year observation from 16 countries for the period from 2002
to 2007. Their results which generated from country level and firm-level estimation indicate that
firms in IFRS-adopting countries experienced a greater increase in abnormal return volatility and
abnormal trading volume than firms from non-IFRS adopting countries. In addition, they find
that firms from countries with strong enforcement regimes experienced a greater change in
information content than firms from countries with weaker enforcement. This result highlights
the central role that the underlying legal institutions play on the actual effects of changes in
accounting standards. Finally, they find there are indirect paths through which IFRS adoption
increase the information content of earnings. These indirect effects arising through reducing the
reporting lag, increasing analysts-following and increasing foreign portfolio investments.
Wang and Yu (2015) investigate the impact of accounting standards and legal environment on
the information content of stock prices. After taking a comprehensive sample from 44 countries
for a long period between 1995-2004 to produce more representative conclusions, they find that
the adoption of high-quality accounting standards, IFRS or US GAAP, have a significant
negative relationship with stock price informativeness, as measured by stock price synchronicity.
These results are robust only in countries with weak legal environment, whereas in countries
with strong legal environment and better investor protection regime, they find a significant
positive relationship between the quality of accounting standards and the firm-specific return
variation. Their results are consistent with the argument that higher quality accounting disclosure
caused by adopting higher quality accounting standards per se, does not necessarily lead to more
informative stock price.
Byard, Li, and Yu (2011) examine the effect of mandatory IFRS adoption on analysts’ forecast
accuracy and forecast dispersion. They argue that the net effect of mandatory IFRS adoption on
information environments is not clear. Where the increased transparency, comparability, and
higher quality disclosure resulted from IFRS adoption may improve analysts’ information
42
environment. However, if IFRS are of lower quality relative to firms’ domestic accounting
standards in reflecting firm’s performance, IFRS adoption may provide less informative financial
reports, for this reason, IFRS may reduce the quality of analysts’ information. Their results
suggest that mandatory adopters do not experience any significant change in analysts’ forecast
errors, forecast dispersion, or analysts-following, relative to the control group. In addition, they
partition mandatory IFRS adopters sample into subgroups based on the strength of countries
enforcement regime and differences between local GAAP and IFRS; they find that the firms
located in strong enforcement countries and from countries that have different local GAAP from
IFRS, experience lower forecast errors and dispersions.
Kim and Shi (2012b) examine the effect of IFRS adoption on financial analysts’ decisions to
follow the firms and on the financial analysts’ forecast accuracy. After examining large sample
consisting of 17,227 firm-year observations from 29 countries over the period from 1998 to 2004
their results show that IFRS adopters attracted more financial analysts than non-adopters,
suggesting that improved transparency and comparability, that are associated with IFRS
adoption, enforce the financial analysts to follow the firms. In addition, the results record
improvements in analysts’ forecast accuracy for IFRS adopters.
Horton, Serafeim, and Serafeim (2013) examine a sample of 8,124 firms for the period from
2001 to 2007 and find that the information environment, as measured by analysts’ earnings
forecast accuracy, has improved significantly after mandatory IFRS adoption. They try to explain
the causes of these increases in earnings forecast accuracy and whether it can be attributed to
higher-quality information and ⁄ or greater comparability in financial information after IFRS
adoption, or simply that IFRS gives managers greater opportunities to manipulate their earnings
and hence meet analysts’ forecasts. They control for any information effect of IFRS adoption and
find that the increased in analysts’ earnings forecast accuracy can be partly explained by
improved comparability benefits. In addition, they hold constant any comparability effect from
IFRS adoption and find that the increased in forecast accuracy is partly driven by improved
information benefits. In addition, their results revealed that the differences between local GAAP
and IFRS play an important role in the benefits of IFRS adoption, where they find that the
earnings forecast accuracy is improved more for the firms with accounting treatment that differ
the most from IFRS. This increases the shared belief that the improved in analysts’ earnings
43
forecast accuracy is driven by the adoption of IFRS itself, rather than any other omitted
variables. Finally, they did not find any evidence consistent with the claim that, opportunistic
earning management drives the improvements of earnings forecast accuracy.
Houqe, Easton, and van Zijl (2014) examine the effect of mandatory IFRS adoption on the
information quality, as measured by financial analysts forecast accuracy and forecast dispersion,
in countries characterised by a having low investors’ protection regime, namely France,
Germany, and Sweden. After analysing data from 578 firm-year observations, for the period
from 2003 to 2011, their results suggest a significant improvement in both measures of
information quality following the mandatory adoption of IFRS. Moreover, they find that the
strength of this improvement is negatively related to the strength of country’s investor’s
protection regime.
Other streams of research provide evidence of the link between IFRS adoption and the flow of
firm-specific information to the market. Kim and Shi (2012a) for example, examine the effect
voluntary adoption of IFRS on the extent to which firm-specific information is incorporated into
the stock price, as measured by stock price synchronicity. In addition, they examine the effect of
institutional investors and intensity of financial analysts who follow the firms in this relation.
After examining data from 15,382 firm-year observation from 34 countries for the period
between 1998 and 2004, they find that the firms that choose to voluntary adopt IFRS in
preparing their financial statements have a significantly lower stock price synchronicity,
suggesting that there is more firm-specific information incorporated into the firm’s stock price.
These results are in line with the argument that the improved transparency after IFRS adoption
facilitates the incorporation of firm-specific information into the stock price. In addition, their
results show that the high analysts-following reduce the IFRS synchronicity-reducing effect,
which indicates that the analysts provide an industry-wide and market-wide information rather
than firm-specific information. More interesting results show that the IFRS synchronicity
reducing effect is at its highest level for firms in countries with poor institutional infrastructure,
which suggest that firm-level disclosure strategies such as voluntary adoption of IFRS and
country-level institutional development factors act as substitutes for each other.
Beuselinck et al. (2010), also examine the effect of mandatory IFRS adoption in the EU on the
incorporation of firm-specific information into the stock price, as measured by stock price
44
synchronicity. They notice a decline in stock price synchronicity in the year of IFRS adoption,
however in the following periods, the synchronicity is increased significantly. This result
suggests that in the period of IFRS adoption, the IFRS improves the incorporation of firm-
specific information into the stock price, but in the later periods, it reduced the potential surprise
associated with future events. In addition, they find that the adoption of IFRS helps financial
analysts in producing market-wide information, which will increase stock price synchronicity for
firms followed by a higher number of financial analysts. Finally, their results suggest that the
IFRS adoption did not have any effect on the institutional investors’ ability in collecting firm’s
private information. Whereas they did not find evidence that higher level of institutional
investors affects stock return synchronicity in the year of mandatory IFRS adoption or in the
post-IFRS adoption years, which suggests that the mandatory adoption of IFRS did not alter the
private information advantage enjoyed by institutional investors.
Similar results are suggested by Bissessur and Hodgson (2012) where they document decrease in
synchronicity in the IFRS adoption period followed by a significant increase in the later periods,
after examining the effect of mandatory IFRS adoption on the informativeness of stock price for
Australian firms. This result may be justified by the increase in comparability of financial
information after the adoption of IFRS, or that the IFRS is more subjective with lower reliability,
which enforces investors to rely on common information. In addition, they examine analysts
forecast error before and after the adoption and find that the analysts forecast error is
significantly lower in the later periods of IFRS adoption, suggesting that the increase in the
synchronicity levels in the later years of IFRS adoption had a positive information effect. This is
consistent with the view that IFRS helps financial analysts in disseminating more accurate
forecast about firm’s performance and earnings.
Loureiro and Taboada (2012) examine the effect of voluntary and mandatory adoption of IFRS
on the stock price synchronicity of 3,994 firms from different 30 countries. They hypothesise
that if IFRS adoption leads to more transparency and reduces the information cost, and then the
stock price informativeness will be improved. They consider the voluntary adopters as more
serious adopters than mandatory ones, so they expect that the benefits of IFRS will be more
pronounce for voluntary adopters than mandatory ones. They document a decrease in stock price
synchronicity for voluntary IFRS adopter relative to mandatory ones. This result is obvious for

45
voluntary adopters in EU member’s countries. In addition, they find that within the mandatory
adopters, the firms that located in better enforcement countries experience more increase in stock
price informativeness than weaker enforcement countries.
Other research examines the effect of IFRS adoption on the value relevance of financial data for
the firms that adopt IFRS. For example, Devalle, Onali, and Magarini (2010) examine the effect
of IFRS adoption on the value relevance of accounting data of five European countries, namely,
France, UK, Italy, Germany, and Spain. They measure the value relevance of accounting data by
the extent to which two accounting measures, earnings and book value of equity, are reflected in
the share price and cum-dividend returns. In general, they find that the adoption of IFRS has
increased the value relevance of earnings numbers while reducing the value relevance of book
value of equity. The results for the individual countries are mixed, where they document an
increase in both measures of value relevance in the UK and Spain. However, there is an increase
in the value relevance of earnings and decrease in the value relevance of book value of equity in
Germany and France, while Italy faced a decrease in both measures of value relevance after
IFRS adoption.
Clarkson, Hanna, Richardson, and Thompson (2011) examine the effect of mandatory IFRS
adoption in the value relevance of accounting numbers, as measured by the ability of earnings
and book value to explain the stock price. They collect their data from 14 EU countries and
Australia for the period from 2004 to 2005. Using ordinary least require regression (OLS) their
results suggest a decrease in the value relevance for the companies of common Low Countries,
while record an increase in the value relevance of accounting numbers for code Low Countries.
DeFond, Hu, Hung, and Li (2011) examine the effect of mandatory IFRS adoption on foreign
mutual fund ownership. They suggest that if the IFRS adoption will harmonize the firms’
financial disclosure then IFRS will make the financial statements more comparable, and hence
reduce the information processing cost for foreign investors, and will results will in an increase
in foreign investments. However, they suggest that the adoption of IFRS per se will not achieve
the goal of improved comparability unless there are credible implementations of IFRSs, and an
increase in uniformity following IFRS adoption. To test their hypothesis they collect data
consisting of 5,460 firm-year observations from 14 EU countries for the period from 2003 to
2007. Consistent with their prediction they find that mandatory IFRS adoption leads to a greater
46
increase in foreign investment among companies located in countries with strong implementation
credibility that experience relatively large increases in uniformity.
Shima and Gordon (2011) examine whether mandatory IFRS adoption leads to increase the US
foreign investments. They suggest that the aim of IFRS is to improve transparency and reduce
information asymmetries for international investors, so they expect an increase in the US foreign
investments in the countries that choose to adopt IFRS. Using a sample of 152 observations from
44 countries for the period from 2003 to 2006 they fail to record a general increase in the US
investments following the adoption of IFRS, and the increase of the US investment is only
significant in countries with strong enforcement regimes. These results suggest that IFRS
adoption per se will not lead to more US investments unless it is associated with strong
enforcement regime.
Gordon, Loeb, and Zhu (2012) assess the impact of IFRS adoption on the overall country foreign
direct investment inflows, in addition, they examine if this impact varies based on whether a
country is classified as having a developed or developing economy. They suggest that to the
extent that IFRS adoption leads to an increase in the transparency of financial reports, so IFRS
adoption should encourage businesses and individuals from other countries to invest in the
countries that choose to adopt IFRS. After examining about 1,300 observation from 124
countries for the period from 1996 to 2008 the results show that the overall foreign direct
investment inflows are positively associated with a countries decision to a adopt IFRS. This
result is more pronounce in developing economic, revealing that IFRS adoption does lead to
more transparent financial disclosure in developing countries, which encourages the foreign
investors to invest in these countries.
Brochet, Jagolinzer, and Riedl (2013) examine whether the mandatory IFRS adoption leads to
capital market benefits for firms, through an improved comparability. They collect data from
2003 to 2006 from the UK firms. They use the UK to investigate whether IFRS adoption leads to
capital market benefits even in countries that have accounting standards that are similar to IFRS.
They use changes in abnormal return following insider trading to measure the comparability.
They suggest that as a result of improved comparability and transparency of IFRS adoption,
there will be lower abnormal return following insider trading. Consistent with their prediction,
the results show that the IFRS adoption period records statistically and economically lower
47
abnormal returns following insider trading of firms’ shares, in comparison with those prior the
adoption. Overall, their results are in line with the view that mandatory IFRS adoption leads to
capital market benefits, by reducing insider trading return, because of improved comparability.
In one of the first large-scale studies of economic consequences of IFRS adoption, Daske, Hail,
Leuz, and Verdi (2008) investigate a large sample, consisting of about 35,000 firm-year
observations from 26 different countries, to examine the effect of mandatory IFRS adoption on
firms’ liquidity, cost of capital and firms’ value. Their results conclude that there is an
improvement in market liquidity following mandatory IFRS adoption. With respect to the cost of
capital and equity valuation the results suggest a decrease in cost of capital and an increase in
equity valuation following the mandatory adoption of IFRS, however, these results are
significant only when they account for the possibility that the effects occur prior to the official
adoption date. In addition, when they partition the sample based on the strength of legal
enforcement, they find that these capital market benefits are pronounced only in more transparent
countries that have strong legal enforcement. Palea (2009) provides consistent empirical
evidence that the adoption of IFRS in the European Union (EU) has led significantly to lower the
cost of capital for EU firms.
Li (2010) investigates whether the mandatory adoption of IFRS leads to a reduction in the cost of
equity capital. He mentions that, as soon as IFRS adoption occurs then this will lead to higher
transparency and facilitate information comparability, so it is expected for IFRS adoption to
reduce the cost of capital. Using a sample from 18 EU countries consisting of 6,456 firm- year
observations, for the period between 1995 and 2006 he records a significant reduction in the cost
of equity following the mandatory adoption of IFRS. However, the results suggest that these
reductions in the cost of equity are limited only for the firms located in countries characterised
with strong legal enforcement.
Daske et al. (2013) conduct research to examine the effect of voluntary and mandatory IAS/IFRS
adoption on the firm’s liquidity and cost of capital, in the light of the role of firm level reporting
incentives. They suggest that adopting IAS or IFRS will not lead to improvements in firm’s
liquidity and reductions in the cost of capital unless it is associated with management incentives
to provide more transparent disclosure. To test their hypothesis, they collect large sample
consists of 69,528 firm-year observations from 30 countries, covering the period from 1990 to
48
2005. Their results suggest a significant reduction in the cost of capital and increase in market
liquidity for IAS/IFRS adopters in comparison with non-adopters. However, these capital market
benefits are recorded just for the IFRS adopters how have incentives to provide disclosure that is
more transparent.7 Their results highlight the importance of management reporting intentions and
incentives, including the motivation of accounting changes, on achieving the desired benefits
from IFRS. Because there are some firms adopt IFRS “label” with no serious intention to
improve the quality and the quantity of financial disclosure, so these firms have no change in
their cost of capital or liquidity after the adoption.
After using the voluntary adoption of IFRS as a measure of high quality and more transparent
firm disclosure, and constructing a large sample of 21,608 firm-years observations from 34
countries, for the period from 1998 to 2004 Kim, Shi, et al. (2014) provide evidence suggesting a
negative relationship between IFRS and firms’ cost of capital. The results revealed that the firms
that adopt IFRS experience a significantly lower cost of capital that non-adopters. In addition,
they provide evidence that the reduction in the cost of capital for IFRS adopters is more
pronounced in firms located in countries with weak institutional infrastructure than when they
are from countries with strong infrastructure, which suggest that IFRS adoption and institutional
infrastructure substitute each other.
Moscariello et al. (2014) examine the effect of mandatory IFRS adoption in the cost of debt for
UK and Italy. They select the UK and Italy because these two countries have a different
institutional setting, where the UK is a common law country that characterised by strong
investor’s protection and very similar GAAP with IFRS, while Italy is a codified law country
with lower investor protection and a more different GAAP from IFRS. Their results suggest the
mandatory adoption of IFRS has no effect in reducing the cost of debt in the UK, and this could
be because there are few differences between UK local GAAP and IFRS. In Italy, despite there
is no reduction in the cost of debt after IFRS adoption; however, the reliance on accounting
numbers is increased after the adoption. In addition, they document a reduction in earnings
management in Italy while they fail to record any improvements in earnings quality for UK firm
7 To measure the reporting inventive, they apply factor analysis to the firm size, financial leverage, profitability,
growth opportunities, ownership concentration, and internationalization. Economic theory suggests that larger, more
profitable firms with greater financing needs and growth opportunities, more international operations, and dispersed
ownership have stronger incentives to provide disclosure that is more transparent.
49
following the adoption. These results suggest that the IFRS benefits tend to be more pronounced
in countries with local accounting standards that are more different from IFRS.
DeFond, Hung, Li, and Li (2015) examine the effect of mandatory IFRS adoption on firms’ crash
risk, measured as the frequency of extreme negative stock returns. After examining global data
consisting of 10,220 firm-year observations, for the years 2003 to 2006 (two years before and
two years after the adoption) they report that the mandatory adoption of IFRS leads to a
significant reduction in crash risk for non-financial sector firms, however this effect is more
pronounced among firms in poor information environment and in countries with big difference
between IFRS and their local GAAP. In contrast, for the financial firms they fail to document a
general reduction in crash risk, and the results suggest a decrease in crash risk among firms that
less affected by IFRS’s fair value provisions, and record increases in crash risk between banks in
countries characterised with weak banking regulations.
Although the previous research provides evidence of the benefits that resulted from the IFRS
adoption, there are some papers failed to document improvements in disclosure quality following
IFRS adoption. For example, evidence of the absent of the relation between IFRS adoption and
earnings quality is provided by Watrin and Ullmann (2012). They investigate the effect of IFRS
adoption on earnings quality for German firms. After taking a sample of 4,008 firm-year
observation for the period between 1994 and 2005 and compare these firms’ data before and
after the adoption, they fail to document any significant increase in the earnings quality.
Moreover, the results suggest a slight decrease in earnings quality after the adoption of IFRS.
Paananen and Lin (2009) investigate the effect of IFRS adoption on the quality of accounting
numbers, as measured by earnings smoothing, timely loss recognition, and the value relevance of
earnings. To do so they collect data from German firms from IAS period (2000 to 2002),
voluntary IFRS period (2003-2004), and mandatory IFRS period (2005-2006). In contrast to their
predictions, they find that the mandatory adoption of IFRS did not lead to any improvements in
the quality of accounting numbers. Moreover, their results suggest a decrease in the quality of
accounting numbers following the adoption of IFRS. They record a lower value-relevance of
earnings and book value of earnings, more income smoothing, and less timely loss recognition,
following the mandatory adoption of IFRS. A similar study conducted on Swedish firms by
50
Paananen (2008) document a decrease in accounting quality for Swedish firm after the
mandatory adoption of IFRS.
Doukakis (2014) examine the effect of mandatory IFRS adoption on earnings management. After
collecting a sample of 15,206 observations from voluntary and mandatory IFRS adopters,
collected from 22 different EU countries for the period from 2000 to 2010, they apply the
difference in difference analysis to control for the confounding concurrent event that may affect
earnings management other than IFRS adoption. Their results suggest that IFRS adoption does
not have a significant impact on reducing earnings management. While the results show that it is
the reporting incentives which affect the quality of firms reporting .
In addition, Liu and Sun (2015) failed to document improvements in earnings quality after
mandatory adoption of IFRS. They use five proxies to measure earnings quality, namely:
discretionary accruals, performance-matched discretionary accruals, small positive earnings,
earnings persistence, and the earnings response coefficient. Even though they document an
increase in the earnings persistent for the post-adoption period, they find no significant
difference in discretionary accruals, performance-matched discretionary accruals, the likelihood
of small positive earnings, and the earnings response coefficient between the pre- and post-IFRS
periods. These mixed results suggest that the mandatory adoption of IFRS does not have a
significant impact on the earnings quality of Canadian firms.
Tsalavoutas, André, and Evans (2012) also examine the effect of mandatory IFRS adoption on
the value relevance of equity and net income for Greek companies. Their sample consists of
1,861 firm-year observations covering the period from 2001 to 2003. Contrary to the
expectations the results do not find any change in value relevance of accounting numbers
following mandatory IFRS adoption.
2.3.6 Summary
Summary of stock price synchronicity literature
The previous sections contain a discussion and review of the literature that examined stock price
synchronicity. After reviewing the literature, one can conclude that Roll (1988) is among the first
51
who comments about the suggested link between firm-specific return variation and the amount of
firm private information that is incorporated into the stock price. After Roll’s comments a
significant growing amount of theoretical and empirical studies, leaded by the early research of
Morck et al. (2000), Wurgler (2000) Durnev et al. (2003), Veldkamp (2006a) and Jin and Myers
(2006) provide evidence that the firm-specific return variation reflects the amount of firm-
specific information that is incorporated into stock price, and hence measure the informativeness
of the stock price.
Where these papers provide evidence that the firms with higher firm-specific return variation are
normally located in more highly developed economies; enjoying a higher transparent information
environment; have higher investor protection regime; associated with strong legal and
institutional development, and are located in more transparent cultures.
The previous literature also suggests that less synchronise firms are associated with efficient
investments decisions and efficient resource allocation; have a strong relationship between its
stock price and future return; adopt high-quality accounting standards; provide less aggressive
financial reporting; have higher quality accounting numbers; do not engage in complex less
transparent transaction; do not engaged in offshore operations; have less stock crash risk; have
high relationship with stock price informativeness and informed trading; have less government
ownership All these findings support the information interpretation of higher firm-specific return
variation.
More informative firms also documented to be audited by high-quality auditing firms; have high
portion of institutional investor, have high proportion of foreign investors; have a gender
diversified board of directors; have improved corporate governance
Admittedly, there is another view that suggests a different interpretation of low stock price
synchronicity and argues that the idiosyncratic stock price movement is an indication of the
“noise trading” instead of informed trading. However, after examining the literature around these
two positions one can argue that the research that adopts an informative interpretation of firm-
specific return variation is well established and more mature than that for noise interpretation.
The majority of stock price synchronicity literature supports the informative interpretation by
providing conceptual and empirical results from a culture level (Eun et al., 2015), country level
52
(Morck et al., 2000), provinces level (Hasan et al., 2014), industry level (Durnev et al., 2003),
and firms level (Durnev et al., 2003) that links lower stock price synchronicity with more
informative stock price.
In addition, evidence from developed markets (Gul, Srinidhi, et al., 2011) and from emerging
market (Hasan et al., 2014); and from financial firm (Francis et al., 2015) and non-financial firms
(Ben-Nasr & Alshwer, 2016) provide a theoretical and empirical justification for using firm-
specific return variation as a measure of stock price informativeness.
In addition, the other view is limited to some research that provides firm levels results that
suggest a “noise trading” interpretation of low stock price synchronicity. Because the
information interpretation of the firm-specific return variation is more prevalent and well
established than the noise interpretation, this thesis will adopt firm-specific return variation as
measured by stock price synchronicity to gauge the amount of firm-specific information that is
reflected in the stock price in comparison with market wide and/or industry-wide information,
thus measure the informativeness of the stock price. Table 2.1 (at the end of the chapter) provide
a summary of the papers that examine the informativeness of stock prices and the measures they
used to gauge the stock price informativeness
Summary of IFRS literature
The previous section provides discussion about the empirical literature that examines the
consequences of IFRS adoption. Past research provides mixed evidence about the consequences
of IFRS adoption. Where one stream of research suggests numerous benefits associated with
IFRS adoption such as increasing the value relevance of accounting numbers following IFRS
adoption (Barth et al., 2008; Devalle et al., 2010; Ismail et al., 2013; Tsalavoutas et al., 2012),
higher accounting quality (Ballas et al., 2010; Barth et al., 2008; Ismail et al., 2013), higher
disclosure quality (Aksu & Espahbodi, 2012; Daske & Gebhardt, 2006).
IFRS adoption is also documented to increase the number of financial analysts who follow the
firm, either local or international (Kim & Shi, 2012b; Landsman et al., 2012; Tan, Wang, &
Welker, 2011), improve information environment, analysts’ forecast accuracy and reducing
analysts’ forecast dispersion (Horton et al., 2013; Houqe et al., 2014), increase earnings
53
information content (Landsman et al., 2012), improve comparability, thus reduce investors
information processing cost (Armstrong, Barth, Jagolinzer, & Riedl, 2010; Daske et al., 2008;
DeFond et al., 2011), increase the informativeness of stock prices (Beuselinck et al., 2010;
Bissessur & Hodgson, 2012; Loureiro & Taboada, 2012; Kim & Shi, 2012a).
The previous literature that examine IFRS adoption also suggest that the IFRS adoption reduce
earnings management (Barth et al., 2008; Ismail et al., 2013), increase timely loss recognition
(Barth et al., 2008), provide higher quality earnings numbers (Houqe et al., 2012), increase
foreign mutual fund ownership (DeFond et al., 2011), increase the US foreign investments in the
countries that adopt IFRS (Shima & Gordon, 2011), increase countries foreign direct investment
(Gordon et al., 2012; Landsman et al., 2012), reduce reporting lag (Landsman et al., 2012),
increase earnings persistent (Doukakis, 2010), provide crash risk, (DeFond et al., 2015), lower
firms’ cost of equity capital (Daske et al., 2008; Kim, Shi, et al., 2014; Li, 2010; Palea, 2009),
provide more transparent and comparable financial disclosure (Brochet et al., 2013), improve
market liquidity (Daske et al., 2008), and increase equity valuation (Daske et al., 2008).
However, some research suggests that these benefits of IFRS adoption are not equal for all the
countries and firms that choose to adopt the IFRS. Whereas some research suggests that these
benefits of IFRS adoption are limited for countries with strong legal enforcement and strong
investors protection regime (Daske et al., 2008; Houqe et al., 2014; Landsman et al., 2012;
Shima & Gordon, 2011), and for countries with big differences between local GAAP and IFRS
(DeFond et al., 2015; Horton et al., 2013; Moscariello et al., 2014). In addition, DeFond et al.
(2011) argue that the benefits from IFRS adoption will not be achieved unless the IFRS adoption
is combined with credible implementation by firm’s management. Daske et al. (2013) also
highlight the importance of firm’s management reporting incentives in achieving the benefits of
IFRS adoption. Clarkson et al. (2011) find that the increase in the value relevance of accounting
numbers is limited for Code Low Countries in comparison with Common Low Countries. While
Kim, Shi, et al. (2014) suggest that the reduction in the cost of capital is more pronounce in
countries with weak institutional infrastructure.
Other papers fail to document any benefits associated with the adoption of IFRS. For example,
Liu and Sun (2015) and Doukakis (2014) find that the mandatory adoption of IFRS does not

54
have any impact on the earnings quality for their sample firms.8 Moreover, Paananen and Lin
(2009) and Watrin and Ullmann (2012) document a reduction in earnings quality for German
firms following the mandatory adoption of IFRS. Similar results from Swedish firms provided by
Paananen (2008) who document a reduction in the earnings quality for Swedish firms following
the IFRS adoption. In addition, Clarkson et al. (2011) find that the mandatory adoption of IFRS
leads to lower value relevance of accounting numbers for EU common Low Countries.
Moscariello et al. (2014) also document that IFRS adoption has no effect in reducing the cost of
debt in the UK.
Collectively, the results of the literature that examine the consequences of IFRS adoption are mix
and contradict each other at some point. For this reason, this research will shed more light on the
consequences of mandatory IFRS adoption by providing new evidence about the effect of
mandatory IFRS adoption on the informativeness of stock prices for the UK firms.
2.4 Earnings Quality
This section contains a discussion of earnings quality concept. Subsection 2.4.1 discusses the
prior literature that provides different definitions of higher quality earnings. Subsection 2.4.2
discusses the literature of earning quality measurement to conclude which earnings quality proxy
provide the most precise estimate of earnings quality. Subsection 2.4.3 discusses the literature
around accruals quality as the most commonly used measure of earnings quality, and provides a
comparison of the current commonly used model to estimate accruals quality, also it provides
justification from the literature as to why this research use Jones 1991 and Modified Jones 1995
models to estimate accruals quality.
2.4.1 The definition of Earnings Quality
Research on earnings quality has grown dramatically over the past two decades. According to
DeFond (2010) The Security and Exchange Commission (SEC) announcements during 1990
about the wide-spread of earnings management among the US public companies, the adoption of
IFRS as a high quality accounting standards, the developments in electronic database systems,
8 Liu and Sun (2015) perform their analysis using a sample of Canadian firms, while Doukakis (2014) use a sample
from 22 EU countries.
55
and the adoption of the Jones model (1991) and the Modified Jones (1995) model as a generally
accepted proxy for earnings quality, considered the principal factors that help the growth of
earning quality research during the last two decade.
Even though the previous literature on earnings quality identifies different attributes that are
associated with or reflective of earnings quality, however, these papers did not provide a clear
definition of earnings quality, and the concept of earnings quality is still elusive and unclear. In
order to gain more understanding of earnings quality concept, a discussion of definitions as taken
from the previous literature is required.
Ball and Shivakumar (2005) define reporting quality in general, as the extent to which
accounting data is useful to investors, creditors, managers and all other parties contracting with
the firm. Penman and Zhang (2002) define high-quality earnings as the earnings before
extraordinary items if it is a good indicator of future earnings. This means that high-quality
earnings equate to sustainable earnings.
Richardson, Sloan, Soliman, and Tuna (2005) suggest that highly reliable accruals lead to higher
earnings persistence and hence higher earnings quality. They suggest that accruals could be
considered as high, medium or low in reliability, based on the reliability of the measurement of
these accruals and the possibility of existing measurement errors. Dechow and Schrand (2004)
and Demerjian, Lev, Lewis, and McVay (2012) define high-quality earnings, as the earnings that
reflect the firm’s fundamental performance and the earnings that can be used as a signal for
future operating performance.
Dechow and Dichev (2002) define the earnings quality from a different perspective as they
suggest that the strength of the relationship between current accruals and cash flows is the main
determinant of earnings quality. They assume that the main role of accounting accruals is to
adjust the recognition of cash flows over time so that the disclosed accounting earnings numbers
better reflect the firm’s performance. However, the accruals require assumptions and
management judgments to be made, to estimates the expected future cash flows. When these
accruals are matched with cash flows this means that there were no or few errors in the estimated
accruals, hence the reported earnings are considered to be of higher quality.
56
Dechow and Schrand (2004) suggest that high-quality earnings are predictable and repeatable
earnings. However, they suggest that repeatable earnings are of high quality only if it reflects
firm’s performance, it a good indicator of future performance, and it provides a good indication
of the firm's intrinsic value.
Dechow, Ge, and Schrand (2010) suggest that “Higher quality earnings provide more
information about the features of a firm’s financial performance that are relevant to a specific
decision made by a specific decision-maker.” This means that the quality of earnings depends on
its relevance to the decision maker.
A recent paper that tried to provide an appropriate definition of earnings quality was undertaken
by Dichev, Graham, Harvey, and Rajgopal (2013) where they examined the chief financial
officer’s (CFO) opinions about the proper definition of high earnings quality. Based on their
findings, the CFO’s believe that high-quality earnings are sustainable and repeatable earnings. In
particular, the earnings that are generated through consistent accounting reporting choices, which
are matches by actual cash flows, and the absence of long-term estimates, are considered as high-
quality earnings. They use CFOs because they are considered as the direct producers of earnings
quality; have a formal background in accounting, which provide them with keen insight into the
determinants of earnings quality; have a working knowledge of how to evaluate earnings quality
from an outsiders perspective, as they are the key decision makers in company acquisitions; and
have access to much tacit knowledge about earnings quality through their networks of financial
executives in their industry and geographical neighbourhood.
In summary, one can conclude that there is no single measure for earnings quality that captures
all earnings attributes and that can be used for all decision models. Consistent with this
conclusion Nelson and Skinner (2013) suggest that because of the inherently context-specific
nature of earnings quality, it is not surprising that earnings quality is not defined or measured in a
uniform way in the literature.
However, previous literature emphasis on the importance of sustainability and reliability of
accruals as the main determinant of earnings quality. The next section will discuss the most
commonly used measures of earnings quality, which will help in choosing the appropriate
measure of earnings quality for the research in question.
57
2.4.2 Different measures of earning quality
As discussed in the previous section there is no generally accepted definition of earnings quality.
Previous studies used different proxies to measure earnings quality, such as earnings persistence
(Li, 2008; Dechow & Schrand, 2004; Penman & Zhang, 2002), earnings smoothness ( Francis,
LaFond, Olsson, & Schipper, 2004; Mohammady, 2011; Tucker & Zarowin, 2006), and accruals
quality (Dechow & Dichev, 2002; Emamgholipour, Bagheri, Mansourinia, & Arabi, 2013;
Francis & Wang, 2008; Givoly, Hayn, & Katz, 2010; Gul, Fung, & Jaggi, 2009; Jiang, Lee, &
Anandarajan, 2008; Dechow & Schrand, 2004). Some papers consider the earnings that result
from more conservative accounting system with a timely loss recognition, as high-quality
earnings (Ball, Kothari, & Robin, 2000; Ball & Shivakumar, 2005; Bhattacharya, Daouk, &
Welker, 2003; Watts, 2003).
Mohammady (2011) suggest that among the various earnings quality measures, the accruals
quality has attracted researchers’ attention as a significant indicator of earnings quality. Francis
et al. (2004) for example, examine the effect of seven earnings quality measures on the cost of
equity. In particular, they examine the effect of accruals quality, earning persistence, earnings
smoothness, earnings predictability; value relevance of earnings, timeliness, and conservatism on
the firm's cost equity. Their results suggest that among the seven earnings quality measures that
they used, the accruals quality measures have the largest impact on lowering the cost of equity.
In an attempt to understand the earnings quality Dechow et al. (2010) accomplished a
comprehensive and exhaustive study to identify the best attribute of earnings and the optimal
proxy to measure the quality of earnings. After reviewing more than 300 articles on the
characteristics of earnings they find that among all the proxies that they have examined there was
no measure of earnings quality that is ideal for all decision models, and the suitability of earnings
quality proxy depend on its relevance to the decisions. However, Dechow et al. (2010) claim that
among the 300 or more papers that they reviewed on earnings quality determinants and
consequences, accruals quality measures was the most popular measure of earnings quality. In
addition, Mouselli, Jaafar, and Goddard (2013) argue that the quality of firm’s accruals is an
important determinant of financial reporting quality.
58
Following the majority of opinion in the literature in the area of earnings quality, this research
will use the accruals quality as a measure of earnings quality. The following section will discuss
the accruals quality as the most common measure of earnings quality and also will discuss the
most common accruals quality models
2.4.3 Accruals Quality as a universal measure of earnings quality
The previous section discusses the measures of earnings quality that have been used in the
literature and conclude that accruals quality is the most commonly used proxy for earnings
quality. There are different models in the literature that examined the quality of accruals and
tried to distinguish between normal and abnormal accruals. In this section, the most commonly
used model to estimate accruals quality will be discussed and then provide justification for using
the modified Jones (1995) and the Jones (1991) models to estimate earnings quality.
Under current accounting practice, the firm’s earnings contain two components: the cash flow
component, and the accruals component. The accruals component requires management
judgment to perform the adjustments and estimations, such as the estimation of account
receivable and allowance for doubtful accounts. However, the accruals estimation process may
contain errors or mistakes, which affect the quality of the accruals and as a result the quality of
disclosed earnings. For these reasons many papers examine the quality of firm’s accruals, and
considered the high-quality accruals as an ideal measure of the quality of reported earnings.
Dechow et al. (1995) and Kothari, Leone, and Wasley (2005) suggest that as the accruals need
management estimation and judgments, the firm's managers may opportunistically use accruals
to manage earnings. Managing the earnings leads to lower quality earnings.
In addition, Dechow and Dichev (2002) and Dechow and Schrand (2004) have the view that
when the earnings contain a high portion of accruals then it may seem to be of low quality.
Whereas they argue that, the accruals require management estimation and judgment which
increase the possibility of estimation errors existence. These estimation errors once discovered
have to be revised and adjusted in the future, which will affect the persistent of earnings and
hence lower the earnings quality.

59
Lobo, Song, and Stanford (2012), also suggest that accrual-basis accounting requires managers
to estimate the future economic consequences of current transactions, provide an estimation of
future cash flows, and use their judgment in allocating cash collections to current and future
periods. For these reasons the errors in the accruals’ estimation process may lead to lower
earnings quality.
However, the accruals are a main component of earnings and one cannot consider firm earnings
of low quality just because these earnings contain a high percentage of accruals. This creates the
need to differentiate between normal accruals and abnormal accruals. Dechow et al. (2010)
identify normal accruals and abnormal accruals as follows: ‘‘the normal accruals are meant to
capture adjustments that reflect fundamental performance, while the abnormal accruals are meant
to capture distortions induced by application of the accounting rules or earnings management”
(Dechow et al, 2010 pp. 358) based on this definition, the normal accruals are the accruals that
result from the application of accounting standards and which aims to provide better
measurement of firm performance, while abnormal accruals are the accruals that result from
improper application of accounting standards or intentional manipulation of earnings by the
firm’s management.
In the prior literature, there are many models that have been developed in an attempt to
distinguish between abnormal accruals and normal accruals component of a firm’s earnings. One
important thing that should be considered when reviewing the results of these models is that, all
these models consider the firms with high accruals levels as having high abnormal accruals
levels which lower the earnings quality (Dechow et al., 2010; Schipper & Vincent, 2003). This
because of the high accruals percentage of total earnings, increase the possibility of estimation
errors existence, hence lower the quality of earnings. The next paragraphs will discuss the most
commonly used earnings quality estimation models. These models depend on accruals quality
measurement to evaluate the quality of earnings and all of these models try to distinguish
between normal and abnormal accruals.
Jones (1991) develops the Jones model (1991). This model considers the sales revenue growth
and firm investments on fixed assets i.e. property, plant and equipment (PPE) as the main
determinants of the firm’s total accruals. McNichols (2002) suggest that the Jones (1991) model
tries to separate discretionary (i.e., “abnormal’’) accruals from nondiscretionary (i.e., ‘‘normal’’)
60
accruals. However, Dechow et al. (2010) suggest that the main criticism on the Jones (1991)
model is its low explanatory power, where it explains only about 10% of the variation in the
accruals, in addition this model subject to Type II errors of misclassifying accruals as normal
accruals when they are abnormal.
In an attempt to reduce the Jones (1991) model Type II errors Dechow et al. (1995) modify the
Jones model by adjusting the growth in credit sales through deducting change in account
receivables from changes in sales revenue. They hypothesize that credit sales are frequently
manipulated; thus this modification in the Jones (1991) model will increase the power of the
model to yield residuals that reflect the revenue manipulation.
Kothari et al. (2005) develop a performance match model where the discretionary accruals in
their model form the Jones (1991) or the modified Jones (1995) models. Dechow et al. (2010)
comment on Kothari et al. (2005) performance match model that “in their model they identify a
firm from the same industry with closest level of ROA to that of the sample firm and deduct the
control firm’s discretionary accruals (residuals) from those of the sample firm to generate
performance matched residuals” ( Dechow et al, 2010 pp. 359). However, Deshow et al (2012)
criticise Kothari et al (2005) in that it leads to substantial reductions in the power of the test and
this model is only effective when the matching procedure employs the relevant omitted variable.
All the previous models try to measure the quality of earnings through measuring the quality of
accruals. To measure the accruals quality, they try to identify the nondiscretionary accruals and
deduct these accruals from the total accruals, the high value of discretionary accruals means that
the firm’s earnings are of lower quality. These models suggest that the management normally
uses accruals to manipulate earnings and the extreme accruals in firm’s earnings lower the
earnings quality.
A different view is suggested by Dechow and Dichev (2002). They have the view that accruals
quality depends on the matching function of accruals to cash flows. For this purpose, they
consider the strength of the relationship between current working capital accruals and previous
year, this year, and next year cash flow from operation as the main determinant of earnings
quality. Their proxy for earnings quality is the standard deviation of the residuals from the
model, as the model considers the firms with lower standard deviation as having higher earnings
61
quality. DeFond (2010) suggest that the model of Dechow and Dichev (2002) attempts to
improve the Jones (1991) model by more directly mapping cash flow into the accruals generating
process. This model has been used by Dechow and Dichev (2002) and finds that the firms with
larger standard deviations in current accruals have less persistent earnings, larger accruals, more
volatile cash flows, accruals, and earnings; and are more likely to report a loss. Dechow et al.
(2010) and Francis, LaFond, Olsson, and Schipper (2005) notice that one of the limitations of
Dechow and Dichev (2002) model is that it limited to current accruals and it cannot be used to
identify the quality of long-term accruals such as the impairments of PPE and goodwill, which
could reflect earnings management or accounting distortion that is essential for evaluating the
quality of earnings.
Francis et al. (2005) make some adjustments on the Dechow and Dichev (2002) model. They
attempt to reflect firm’s performance in their model by adding the growth in revenue to the
model; also they include the depreciation accruals into their model. In addition, they divide the
standard deviation of the residual accrual “abnormal accruals” into firm-level measures of innate
accounting system estimation errors and management discretion estimation errors (DeFond,
2010). The higher standard deviation represents lower earnings quality.
According to Dechow et al. (2010) The Jones (1991) model and the modified Jones (1995)
model are the most popular earnings quality measures used in the literature. In addition, the
priorities of the Jones (1991) model and the modified Jones (1995) model have been documented
across other earnings quality measurement models and have been recommended by many
research papers. For example, (Dechow et al., 1995; Peasnell, Pope, & Young, 2000; Young,
1999) review the modified Jones (1995) model performance across different samples and suggest
that the modified Jones model (1995) is the most appropriate model to estimate earnings quality.
In addition, Guy, Kothari, and Watts (1996) suggest that among the extant models only the Jones
(1991) model and the Modified Jones (1995) model are considered as reliable models to estimate
the firms’ discretionary accruals. Moreover, DeFond (2010) claim that the majority of new
earnings quality models that compete with the Jones (1991) model and the Modified Jones
(1995) model did not survive.
Dechow et al. (1995) argue that the Modified Jones (1995) model is more powerful in detecting
earnings management than the Jones (1991) model. Furthermore, Dechow et al. (1995) claim that

62
where the credit sales are frequently manipulated, the modification on the Jones (1995) model by
adding the growth in credit sales will increase the power of the model.
To this end, given that the Modified Jones (1995) model is more credible than the Jones (1991)
model in measuring earnings quality, the Modified Jones (1995) model will be used to measure
the earnings quality in this study. As a robustness test, the Jones (1991) model will be used as
another measure of earnings quality.
2.4.4 Earnings quality and stock price informativeness
Accounting information is a central component of information flow to the market (Ferreira &
Laux, 2007). The accounting earnings are considered as one of the most important figures of
firm’s financial disclosure, and this assumption is supported by many empirical research.
Biddle, Seow, and Siegel (1995), Francis, Schipper, and Vincent (2003), and Liu, Nissim, and
Thomas (2002) for example document that investors depend on earnings numbers in their
decisions more than any other measure of performance. Francis et al. (2004) assert that earnings
numbers are an importante source of firm-specific information. Gul, Srinidhi, et al. (2011) also
suggest that higher quality earnings are more reliable and publicly available firm-specific
information. High-quality earnings are associated with better availability of precise information
for the decision makers so it may have an effect on private information collection by the
investors, as it may encourage the informed investor to collect and process firm-specific
information which leads to a more informative stock price.
Many researches have documented that higher quality earnings reduce information asymmetry,
hence information risk, between firm’s insiders (i.e. management and controlling shareholder)
and outsiders (for example investor, creditor, and regulators); (Bhattacharya, Desai, &
Venkataraman, 2013; Bhattacharya et al., 2012; Biddle & Hilary, 2006; Biddle, Hilary, & Verdi,
2009; Francis et al., 2004).
Francis et al. (2004) find that higher earnings quality reduces information asymmetry, which
leads to lower cost of equity, and the largest reduction in the cost of equity was recorded for
firms with higher accruals quality.
63
Bhattacharya et al. (2013) examine the effect of earnings quality on information asymmetry.
They estimate earnings quality, using accruals quality measures, for a large number of U.S. firms
for the period from 1998-2007 and find that the firms with lower earnings quality are
significantly associated with higher information asymmetry. Bhattacharya et al. (2012) also find
that the higher earnings quality leads to lower information asymmetry, which in turn lead to
lower cost of capital.
The link between earnings quality and information asymmetry is also documented by Biddle and
Hilary (2006) when they investigate the effect of firms accounting quality on the efficiency of
firms capital investment. They suggest that higher earnings quality reduce information
asymmetry between firms insiders and outsiders, for this reason they expect a positive relation
between earnings quality and firm’s investments efficiency. To test their hypothesis, they collect
data from 34 countries and find that the firms with higher earnings quality, across countries and
within the country, have more efficient investments, as proxied by lower investment-cash flow
sensitivity, than the firms with lower earnings quality.
Biddle, Hilary, & Verdi, (2009) also suggest that higher earnings quality leads to lower
information asymmetry. Where higher earnings quality allows firms to attract more capital by
making firm’s profitable projects more visible to investors and by reducing adverse selection in
the issuance of securities. In addition, they argue that higher earnings quality could mitigate
managerial incentives to engage in activities that may reduce the value of the firm, this argument
is consistent with Jin and Myers (2006) theoretical prediction about transparency and insider
information posestion.
The reduction in information asymmetry caused by higher quality earnings encourages some
researchers to describe higher quality earnings as part of the movement to improving
transparency, for example, Bhattacharya et al. (2003) and Ball et al. (2000). A similar view is
expressed by Ferreira and Laux (2007) who suggest that higher accruals quality, which is the
most common measure of earnings quality, is considered as a good indicator of accounting
transparency. That is when the firm’s accruals are larger than expected in comparison to the
given firm's activities this can be considered as an inverse indicator of accounting transparency.
64
The previous research concludes that higher earnings quality leads to more informative
information environment, by reducing information asymmetry between firm’s insiders and
outsiders. Kim and Verrecchia (1991) suggest that the disclosure of public financial information
support investor’s incentives to collect costly firm-specific private information. Based on this
argument one can expect more firm-specific return variation with higher quality financial
disclosure.
The possible link between earnings quality and stock price synchronicity has been documented
by prior literature. Morck et al. (2000) find the stock prices in developed countries with higher
quality accounting information exhibit higher firm-specific stock return variation and more
informative stock price than those for developing countries.
Wurgler (2000) results show that the capital moves faster to its highest value uses in countries
with better accounting disclosure. This result suggests that more informative stock price leads to
more efficient allocation of capital across sectors.
Durnev et al. (2004) suggest that high-quality earnings numbers reduce the cost of collecting the
information, which encourages the investors to obtain firm-specific information and to rely on
this information in their investment decisions. Consequently, more firm-specific information will
be incorporated into the stock price, resulting in a more informative stock price.
The link between earning quality and stock price informativeness is also suggested by Jin and
Myers (2006) where they provide evidence that more transparent firms with higher earnings
quality have a more informative stock price. They suggest that in the case of firms with less
transparency, firm’s managers can capture more of firm’s cash flow and effectively managing
the portion of firm-specific risk they hold. The managers most likely to manage firm-specific
risk by managing disclosed earnings, leading to lower earnings quality. This opacity in firm-
specific information forces the outside investors to rely largely on market common information
which leads to less informative stock price. So one can conclude that based on Jin and Myers
(2006) prediction higher opacity leads to lower earnings quality which will lead to more
synchronous stock price.
Ferreira and Laux (2007) find that the level of firm-specific return volatility is greater in the
case of higher earnings quality, as measured by accruals quality. This result is indicative of more
65
information flowing to market via informed trading when accounting numbers are of higher
quality. While lower quality accounting numbers apparently discourage investor’s efforts to
collect and process more firm-specific information. This result is in line with theoretical
suggestions that high-quality accounting numbers could encourage the collection and processing
of firm-specific information, leading to more incorporation of firm-specific information, hence
less synchronous and more informative stock price.
Gul, Cheng, and Leung (2011) suggest that higher earnings quality should lead to more
informative stock price. Whereas they argue that financial statements are prepared to provide
information about firm’s financial position (balance sheet), performance (income statement), and
liquidity (cash flow statement), and the disclosed earnings or income are one of the most
important items in the financial statement. High informativeness of earnings reflects high
financial reporting quality and low information asymmetry.
In addition, Gul, Srinidhi, et al. (2011) note that, if higher quality earnings numbers encourage
the firms investors to collect and process more firm-specific private information, then the effect
of higher earnings quality on firm-specific information, available from public and private
sources, will be additive leading to more capitalisation of this information into stock price. This
in turn increases firm-specific return variation and the informativeness of stock price.
Chen, Gul, and Zhou (2013) suggest and find that in an information environment where the
information risk and cost are low, measured by high-quality earnings, analysts can be
encouraged to collect and process firm-specific information, which will increase the amount of
firm-specific information that incorporated into the stock price, and hence reduce stock price
synchronicity, accordingly leading to more informative stock price.
The previous papers support the ‘’encouragement effect’’ interpretation of the relationship
between earnings quality and stock price synchronicity. Where the high-quality earnings
encourage the investors to collect and process firm private information, which will lead to a more
informative stock price. However, Gul, Srinidhi, et al. (2011) suggest that there is ‘’crowding out
effect’’ view in the effect of earnings quality on stock price informativeness. Based on this view
as more information is channelled into public reporting, it crowds out private information. The
disclosure of accounting earnings is periodic and less frequent than daily return disclosure, so

66
reducing the stock price idiosyncratic volatility. Thus under this view, high-quality earnings
increase the value of public information but decrease private information.
In addition, Kim and Verrecchia (2001) have the view that the availability of better and high-
quality accounting numbers may reduce the investor's incentives to collect and process firm-
specific private information. For this reason, one could observe less volatility for high-
transparency stocks, since more information flows via lower-frequency accounting releases.
A different view of the relation between earnings quality and stock return idiosyncratic volatility
is suggested by Rajgopal and Venkatachalam (2011) who find that the deteriorating earnings
quality in the U.S. is positively related to the upward trend in idiosyncratic volatility over forty
years period 1962-2001 . This result is inconsistent with the findings of Morck et al. (2000) that
the stock price synchronicity is lower for more developed and high-quality accounting number
countries, and Ferreira and Laux (2007) findings that the stock price synchronicity is positively
related to higher earnings quality.
To this end, based on the above contradicting arguments and findings, the net effect of earnings
quality on stock price synchronicity is ambiguous. This research will shed more light on this
issue and will try to find new evidence to help in more understanding of the relationship between
earnings informativeness and stock price informativeness.

67
Table 2-1 Summary of stock price synchronicity literature.
Authors Title journal Country of study Sample
years
Informativeness measures Model used
Yu et al. 2013 Aggressive reporting, investor protection,
and stock price informativeness: Evidence
from Chinese firms
Journal of International
Accounting, Auditing,
and Taxation
China 2000-2009 Stock price synchronicity,
and probability of
informed trader
Regress market return and world market return
without lagged value using daily data
Gul et al. 2011 Does board gender diversity improve the
informativeness of stock prices?
Journal of Accounting
and Economics
USA 2001-2007 Stock price synchronicity Regress market return with firms daily return, as a
robustness test they add industry to return to the
model(same results), and Future earnings
incremental explanatory power
Bae, 2013 Is Firm-specific Return Variation a
A measure of Information Efficiency?
International Review of
Finance
USA 2001-2009 Stock price synchronicity They use daily data without lagged value for market
and industry return. Additionally, they use the
probability of informed trading (PIN)
He et al (2013) Large foreign ownership and stock price
informativeness around the world
Journal of International
Money
and Finance
40 COUNTRIES 2002 Synchronicity and PIN Market weekly data without industry return and
without lagged value.
Gul et al (2010) Ownership concentration, foreign
shareholding, audit quality, and stock
price synchronicity: Evidence from China
Journal of Financial
Economics
CHINA 1996-2003 Stock price synchronicity They use to market and industry returns with lagged
value using weekly data. As a robustness test, they
use daily data.
An & Zhang
2013
Stock price synchronicity, crash risk, and
institutional investors
Journal of Corporate
Finance
USA 1987-2010 Stock price synchronicity Market and industry return with weekly data
Busilink et al. (
2010)
Mandatory IFRS Reporting and Stock
Price Informativeness
SSRN 14 EU COUNTRIES 2003-2007 Stock price synchronicity Weekly data ,Market return with lagged value, as a
robustness they use weekly market and industry
return with lagged value. And Fama and French
model
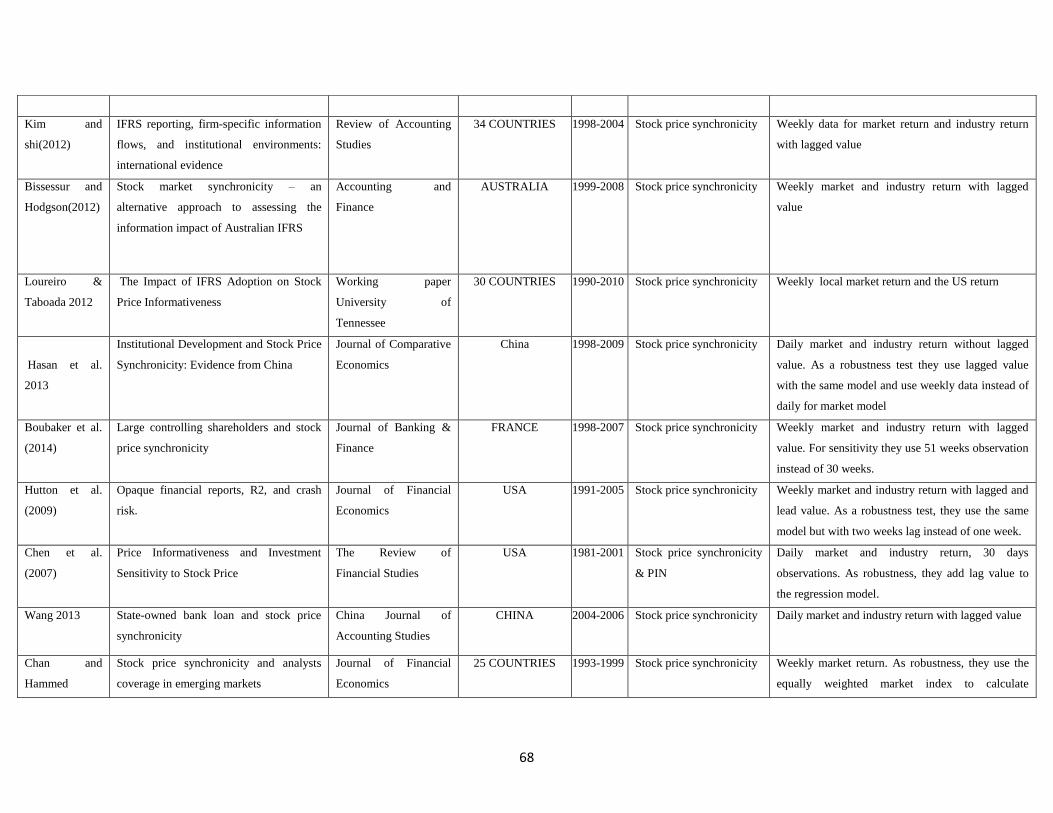
68
Kim and
shi(2012)
IFRS reporting, firm-specific information
flows, and institutional environments:
international evidence
Review of Accounting
Studies
34 COUNTRIES 1998-2004 Stock price synchronicity Weekly data for market return and industry return
with lagged value
Bissessur and
Hodgson(2012)
Stock market synchronicity – an
alternative approach to assessing the
information impact of Australian IFRS
Accounting and
Finance
AUSTRALIA 1999-2008 Stock price synchronicity Weekly market and industry return with lagged
value
Loureiro &
Taboada 2012
The Impact of IFRS Adoption on Stock
Price Informativeness
Working paper
University of
Tennessee
30 COUNTRIES 1990-2010 Stock price synchronicity Weekly local market return and the US return
Hasan et al.
2013
Institutional Development and Stock Price
Synchronicity: Evidence from China
Journal of Comparative
Economics
China 1998-2009 Stock price synchronicity Daily market and industry return without lagged
value. As a robustness test they use lagged value
with the same model and use weekly data instead of
daily for market model
Boubaker et al.
(2014)
Large controlling shareholders and stock
price synchronicity
Journal of Banking &
Finance
FRANCE 1998-2007 Stock price synchronicity Weekly market and industry return with lagged
value. For sensitivity they use 51 weeks observation
instead of 30 weeks.
Hutton et al.
(2009)
Opaque financial reports, R2, and crash
risk.
Journal of Financial
Economics
USA 1991-2005 Stock price synchronicity Weekly market and industry return with lagged and
lead value. As a robustness test, they use the same
model but with two weeks lag instead of one week.
Chen et al.
(2007)
Price Informativeness and Investment
Sensitivity to Stock Price
The Review of
Financial Studies
USA 1981-2001 Stock price synchronicity
& PIN
Daily market and industry return, 30 days
observations. As robustness, they add lag value to
the regression model.
Wang 2013
State-owned bank loan and stock price
synchronicity
China Journal of
Accounting Studies
CHINA 2004-2006 Stock price synchronicity Daily market and industry return with lagged value
Chan and
Hammed
Stock price synchronicity and analysts
coverage in emerging markets
Journal of Financial
Economics
25 COUNTRIES 1993-1999 Stock price synchronicity Weekly market return. As robustness, they use the
equally weighted market index to calculate

69
(2006)
synchronicity. Additionally using lead and lagged
weekly return
Piotroski &
Roulstone
(2004)
The Influence of Analysts, Institutional
Investors, and Insiders on the
Incorporation of Market, Industry, and
Firm-Specific Information
into Stock Prices
THE ACCOUNTING
REVIEW
USA 1984-2000 Stock price synchronicity Weekly market & industry return with lagged value.
As robustness, they use three digits SIC code
instead of two. And Fama & French industry
classification. Finally, they use equally weighted
market and industry return.
Eun et al.
(2015)
Culture and R2 Journal of Financial
Economics
47 COUNTRIES 1990-2010 Stock price synchronicity They use weekly market return and US return with
lead and lagged values. They repeat analysis using
the variance-weighted R2.
R. Morck et al.
2000
The information content of stock markets:
why do emerging markets have
synchronous stock price movements?
Journal of Financial
Economics
40 COUNTRIES 1993-1995 Stock price synchronicity They use two weeks market return and US market
return.
DURNEV et al
2003
Does Greater Firm-Specific Return
Variation Mean More or Less Informed
Stock Pricing?
Journal of Accounting
Research
USA 1983-1995 Stock price synchronicity Weekly market & industry return without lagged
Haggard et al.
2008
Does voluntary disclosure improve stock
price informativeness
Jornal of Financial
Management
USA 1982-1995 Stock price synchronicity Weekly market &industry return
Jin & Myers
2006
R2 around the world: New theory and new
tests
Journal of Financial
Economics
40 countries 1990-2001 Stock price synchronicity Weekly market returns with lagged and lead value
Durnev et al.
2004
Value-Enhancing Capital Budgeting and
Firm-specific Stock Return Variation
THE JOURNAL OF
FINANCE
USA 1990-1992 Stock price synchronicity Weekly and daily data
Note: this table provides a summary of the literature that examines the stock price informativeness, the first column presents the authors names and the year of publication
year, the second column shows the paper title, the third column shows the name of the journal in which the paper was published, the fifth, sixth, and the seventh column
present the research’s country of the study, years of the study, and the measure of stock price informativeness that used in the study, respectively. The last column present
the model used to measure stock price informativeness.

70
Chapter three: Theoretical framework and hypotheses development
3.1 Introduction
This chapter draws on the literature review, both theoretical and empirical, to develop research
questions and hypothesis to examine the relationships between accounting transparency, earnings
quality, and stock price informativeness. To achieve the aims of this study, five questions and six
hypotheses were developed. Testing the research hypotheses provide insight and potential
answers to the research questions about the effect of IFRS adoption, and earnings quality on
stock price informativeness.
The rest of this chapter is organised as follows: Section 3.2 discusses the theoretical framework
and the hypotheses development for the first study, which examines the relationship between
IFRS adoption and stock price synchronicity, and if the financial analysts’ activities affect the
relationship between the IFRS adoption and stock price synchronicity. Section 3.3 contains the
theoretical framework and the hypothesis development for the second study, which examines the
effect of earnings quality on stock price synchronicity, and if the IFRS adoption affects the
relationship between earnings quality and stock price informativeness.
3.2 The Effect of Accounting Transparency on Stock Price Informativeness.
3.2.1 Does Accounting Transparency Affect Stock Price Informativeness?
Stock prices for listed companies reflect all the available relevant information, whether firm-
specific or common information. The movements of stock prices are resulted from the induction
of new information whether market-wide or firm-specific information. Roll (1988) provided one
of the first works that note how the firm-specific return variation could result from the
capitalization of firm-specific information into the stock price and finds that the common market
and industry information is responsible only for a small portion of the total movement of stock

71
prices.1 He mentions clearly that the higher firm-specific return variation could be an indication
of the amount of firm-specific information that is incorporated into the stock price.
Since Roll’s (1988) comments on the possible link between high firm-specific return variation
and the amount of firm-specific information that is incorporated into the stock price, a growing
number of pieces of literature provide empirical results that support this link between firm-
specific return variation and the informativeness of stock price.
Morck et al. (2000) find that the stock prices in developing economies tend to commove more
than those in developed countries, and provide evidence that the lack of investors’ protection
rights in emerging market impeded the informed trading and increase the reliance on the
common information. Durnev et al. (2003) also provide evidence from the US stock market
suggesting that a less synchronise stock price contains more information about firm’s
fundamental performance and future earnings. Wurgler (2000) records that the countries with
lower stock price synchronicity allocate capital more efficiently than the countries with high
stock price synchronicity. In addition, Durnev et al. (2004) use industry level data and show that
the industries with lower stock price synchronicity are associated with more efficient allocation
of capital. Recently, Eun et al. (2015) also find that countries with individualistic cultures that
characterized by higher information transparency have lower stock price comovement than
collectivistic culture countries. Most recently, Ben-Nasr and Alshwer (2016) report that higher
firm-specific return variation is associated with more efficient labour’s investment.
The following papers have documented a positive relation between improved transparency and
firm-specific return variation. Jin and Myers (2006) suggest that lack of transparency affect the
risk bearing between firm’s managers and outsiders. Where in the case of higher opacity firm’s
managers can withhold firm-specific information for their own benefits, this enforces investors
to rely more on common information in their investment decisions leading to a higher
comovement in stock price. Veldkamp (2006a) also suggests that if the cost of obtaining
information about specific firms is high (because of low transparency), then investors will collect
and process low-cost common market wide and industry-wide information, which will lead to
1
Roll (1988) find that common market wide and industry wide information explain only small part, 20-
30%, of total movement of firm’s stock return in the US market.

72
higher comovement in stocks return even if the fundamentals that these stocks relate to are
uncorrelated. Building on the same theory, Hutton et al. (2009) find that the higher opaqueness
that results from opportunistic earnings management leads to lower firm-specific return
variation.
The proponents of IFRS adoption argue that IFRS improve transparency by increasing the
quantity and quality of financial disclosure. Ernst and Young (2006) in a report reveal that IFRS
are considered as more transparent standards because they contain a greater number of disclosure
requirements than any nationally based standards. Ernst and Young (2006) also record that this
higher number of disclosure requirement leads to increases of up to 30 per cent in the length of
post-IFRS adoption annual reports for a sample of EU firms. Moreover, Ball (2006) suggest that
IFRS provides more accurate and timely financial statement information than any national
standards, including the local standards of EU countries.
Consistent with the assertion that IFRS adoption improves the quality of financial disclosure,
previous research finds that IFRS adoption has favourable capital market consequences including
: increasing the value relevance of accounting numbers (Barth et al., 2008; Devalle et al., 2010;
Ismail et al., 2013; Tsalavoutas et al., 2012); providing high quality accounting numbers (Ballas
et al., 2010; Barth et al., 2008; Doukakis, 2010; Houqe et al., 2012; Ismail et al., 2013);
improving disclosure quality (Aksu & Espahbodi, 2012; Daske & Gebhardt, 2006), improving
analysts’ forecast accuracy and reducing analysts’ forecast dispersion (Horton et al., 2013;
Houqe et al., 2014); increasing earnings information content (Landsman et al., 2012); reducing
information processing cost (Armstrong et al., 2010; Daske et al., 2008; DeFond et al., 2011);
increasing the informativeness of stock prices (Beuselinck et al., 2010; Bissessur & Hodgson,
2012; Loureiro & Taboada, 2012; Kim & Shi, 2012a); reducing crash risk, (DeFond et al.,
2015); lowering firms’ cost of equity capital (Daske et al., 2008; Kim, Shi, et al., 2014; Li, 2010;
Palea, 2009); and providing more transparent and comparable financial disclosure (Brochet et al.,
2013).
To the extent that IFRS adoption affects firm’s financial disclosure, the IFRS adoption is
expected to increase the quantity and quality of firm-specific information. Higher transparency
and improved comparability that is associated with IFRS adoption are also expected to reduce
information processing cost (Armstrong et al., 2010; Daske et al., 2008; DeFond et al., 2011).

73
According to Jin and Myers (2006) and Veldkamp (2006a) higher transparency and low
information cost could facilitate the incorporation of firm-specific information into the stock
price, and thus increase firm-specific return variation. Based on this view, the improved quantity
and quality of firm-specific information that may result from the mandatory adoption of IFRS
should facilitate the incorporation of firm-specific information into the stock price, leading to an
increase in firm-specific return variation and as a result more informative stock prices. Thus, the
first hypothesis is as follow:
H1: IFRS adoption will lead to lower stock price synchronicity.
However, Dasgupta et al. (2010) have a different explanation for the relationship between higher
transparency and stock price synchronicity. They provide a theoretical prediction, supported by
empirical results, that the increase in transparency at first is likely to increase the firm-specific
information flow to the market, and hence increase the amount of firm private information that
incorporated into the stock price. However as more firm-specific information becomes publicly
available, firm’s investors improve their predictions about the occurrence of future events. This
will then reduce the surprise effect of future information release, making the stock price more
synchronous. Referring to Dasgupta et al. (2010) argument the second hypothesis is as follow:
H2: Following IFRS adoptions there will be an initial decrease in stock price synchronicity
(compared with a pre-adoption period) followed by a subsequent increase in later periods.
3.2.2 Do financial analysts’ activities matter?
Financial analysts are considered to be an important provider of information about firms’
operations and performance. Prior research suggests that financial analysts are interested in
providing common market wide and industry-wide information over expensive firm-specific
information. Piotroski and Roulstone (2004) find that the firms with high analysts-following
have a high stock price synchronicity. They suggest that the financial analysts act as a path
through which industry level and market level information is transferred into the stock prices.
They examine the effect of financial analysts on the stock price synchronicity of the U.S firms.
They argue that financial analysts are firm’s outsiders with limited access to the firm-specific
information, unlike management and institutional investors, and for this reason, they suggest that
74
financial analysts try to obtain and process market wide and industry-wide information and map
it to stock prices. Consistent with their expectation they document a significant positive effect of
analysts’ activities on stock price synchronicity.
Chan and Hameed (2006) examine the effect of analysts-following on stock price synchronicity
for emerging markets. In line with the findings of Piotroski and Roulstone (2004), they document
a significant positive relation between analysts-following and stock price synchronicity,
suggesting that financial analysts help in generating and disseminating industry and market level
information instead of firm-level information, and improving intra-industry information transfer.
In addition, Veldkamp (2006a) suggest that financial analysts are providing the type of
information that leads to more comovement of stock prices. They suggest that there are two
reasons that encourage analysts to acquire and disseminate common information rather than
firm-specific information. Firstly, in the information market, there is a higher demand for
common information rather than firm-specific information. Secondly, the cost of producing one
unit of common information is much smaller than that of firm-specific information, given the
high fixed cost of information production.
Moreover, Cheng, Gul, and Srinidhi (2012) suggest that because financial analysts are outsiders
with less access to firm-specific information than firms’ management, analysts focus their
activities primarily to collect and process industry-wide and market-wide information and
mapping this information into the firms’ stock prices, leading to higher stock price synchronicity.
Also, Ramnath (2002) find that financial analysts revise their firm’s earnings forecasts in
response to the earnings announcements of other firms in the same industry. Clearly, these
results suggest that financial analysts participate mainly in providing market wide and industry-
wide information, which facilitates intra-industry information transfer.
Improved transparency after mandatory adoption of IFRS is expected to increase the amount of
firm-specific information that incorporated into the stock price, leading to higher idiosyncratic
return variation. This synchronicity-reducing effect of mandatory IFRS adoption could be
attenuated for firms with higher analysts’ activities, particularly if IFRS adoption tends to attract
more financial analysts as documented by Kim and Shi (2012b). In addition, the harmonization
of financial disclosure after IFRS adoption is expected to reduce information-processing costs for

75
financial analysts, hence increasing the quality of the analysts’ activities. This effect is
documented by Byard et al. (2011), Horton et al. (2013), and Houqe et al. (2014) who find that
the analysts’ forecast errors are decreased significantly after the mandatory adoption of IFRS.
So, in the information market, the firm-specific information generated by IFRS disclosure
compete with cheap market wide and industry-wide information generated by financial analysts,
all else being equal, (Kim & Shi, 2012a). Because financial analysts participate mainly in
collecting and processing common market wide and industry-wide information, and
disseminating this information to the market at relatively low cost, investors are expected to rely
more on this low-cost common information than expensive firm-specific information, in their
investment decisions. For this reason, one can expect that the synchronicity-reducing effect of
mandatory IFRS adoption may be higher for firms with lower analysts-following and vice versa.
Given the fact that there is a lack of evidence on the above issue, this research aims to provide
empirical evidence about how the synchronicity-reducing effect of improved transparency after
mandatory IFRS adoption is conditioned upon the intensity of analysts’ activities. To do so the
effect of analysts’ activities on firm’s stock price synchronicity is reviewed and examines
whether the relation between mandatory IFRS adoption and stock price synchronicity differ
systematically between IFRS adopters with high analysts-following and IFRS adopters with low
analysts-following. Based on the previous argument the third hypothesis is as follow:
H3: The effect of mandatory IFRS adoptions on reducing stock price synchronicity will
be lower for firms that followed by a higher number of financial analysts than those
followed by a lower number of financial analysts.
3.3 The Effect of Earnings Quality on Stock Price Informativeness
3.3.1 Does Earnings Quality Affect Stock Price Informativeness
Accounting information is a central component of information flow to the market (Ferreira &
Laux, 2007). A number of empirical studies support the assumption that accounting earnings are
one of the most important figures of firm’s financial disclosure. Biddle et al. (1995), Francis et
al. (2003), and Liu et al. (2002), for example, document that investors depend on earnings
numbers in their decisions more than any other measures of performance. Francis et al. (2004)
76
assert that earnings numbers are an importance source of firm-specific information. Gul,
Srinidhi, et al. (2011) also suggest that higher quality earnings are more reliable publicly
available firm-specific information. High-quality earnings are associated with better availability
of precise information for the decision makers, so it may have an effect on private information
collection by the investors, as it may encourage the informed investors to collect and process
firm-specific information, which leads to a more informative stock price.
Many researches have documented that higher quality earnings reduce information asymmetry,
hence information risk, between firm’s insiders (i.e. management and controlling shareholder)
and outsiders (for example investor, creditor, and regulators); (Bhattacharya et al., 2013;
Bhattacharya et al., 2012; Biddle & Hilary, 2006; Biddle et al., 2009; Francis et al., 2004).
Francis et al. (2004) find that higher earnings quality reduces information asymmetry, which
leads to lower cost of equity, and they document that among seven different earning quality
measures the largest reduction in the cost of equity was recorded for firms with higher accruals
quality.
Bhattacharya et al. (2013) examine the effect of earnings quality on information asymmetry.
They estimate earnings quality, using accruals quality measures, for a large number of U.S. firms
for the period from 1998-2007 and find that the firms with lower earnings quality are
significantly associated with higher information asymmetry. Bhattacharya et al. (2012) also find
that the higher earnings quality leads to lower information asymmetry, which in turn lead to
lower cost of capital.
The link between earnings quality and information asymmetry is also documented by Biddle and
Hilary (2006) when they investigate the effect of firms accounting quality on the efficiency of
firms capital investment. They suggest that higher earnings quality reduces information
asymmetry between firms insiders and outsiders, for this reason, they expect a positive
relationship between earnings quality and firm’s investments efficiency. To test their hypothesis,
they collect data from 34 countries and find that the firms with higher earnings quality, across
countries and within the country, have more efficient investments, as proxied by lower
investment-cash flow sensitivity, than the firms with lower earnings quality.
77
Biddle, Hilary, & Verdi, (2009) also suggest that higher earnings quality leads to lower
information asymmetry. They argue that higher earnings quality allows firms to attract more
capital by making firm’s profitable projects more visible to investors and by reducing adverse
selection in the issuance of securities. In addition, they argue that higher earnings quality could
mitigate managerial incentives to engage in activities that may reduce the value of the firm, this
argument is consistent with Jin and Myers (2006) theoretical prediction about transparency and
insiders information possession.
Biddle and Hilary (2006) also argue that, if higher quality accounting permitted perfect
monitoring, then no agency problem would arise, and there is no obvious reason could commit
managers to revealing all of their private information. Based on this argument then it is expected
that higher earnings quality will lead to more informative stock price
The reduction in information asymmetry caused by higher quality earnings encourages
Bhattacharya et al. (2003) and Ball et al. (2000) to describe higher quality earnings as part of the
movement to improving transparency. A similar view is expressed by Ferreira and Laux (2007)
who suggest that higher accruals quality, which is the most common measure of earnings quality,
is considered as a good indicator of accounting transparency. That is when the firm’s accruals are
larger than expected in comparison to the given firm’s activities this can be considered as an
inverse indicator of accounting transparency.
In conclusion, the previously discussed papers have the view that higher earnings quality leads to
more informative information environment, by reducing information asymmetry between firm’s
insiders and outsiders. Kim and Verrecchia (1991) suggest that the disclosure of high quality
public financial information increase the investor’s incentives to collect costly firm-specific
private information. Based on this argument one can expect more firm-specific return variation
with higher quality financial disclosure.
The possible link between earnings quality and stock price synchronicity has also been
documented in the literature. Morck et al. (2000) find that the stock prices in developed
countries, with higher quality accounting information, exhibit higher firm-specific stock return
variation and more informative stock price than those for developing countries.
78
Wurgler (2000) show that the capital moves faster to its highest value uses in countries with
better accounting disclosure. This result suggests that more informative stock price leads to more
efficient allocation of capital across sectors.
Durnev et al. (2004) suggest that high-quality earnings reduce the cost of collecting the
information, which encourages the investors to obtain firm-specific information and to rely on
this information in their investment decisions. Consequently, more firm-specific information will
be incorporated into the stock price, resulting in a more informative stock price.
The link between earning quality and stock price informativeness is also suggested by Jin and
Myers (2006) where they provide evidence that more transparent firms with higher earnings
quality have a more informative stock price. They suggest that in the case of firms with a lack of
transparency, firm’s managers can capture more of firm’s cash flow and effectively manage the
portion of firm-specific risk they hold. The managers are most likely to manage firm-specific
risk by managing disclosed earnings, which lead to lower earnings quality. This opacity in firm-
specific information enforces the outside investors to rely largely on market common
information, which leads to a less informative stock price. So one can conclude that based on Jin
and Myers (2006) prediction, higher opacity leads to lower earnings quality which will lead to a
more synchronous stock price.
Ferreira and Laux (2007) find that the level of firm-specific return volatility is greater in the
case of higher earnings quality, as measured by accruals quality. This result is indicative of more
information flowing to market via informed trading when accounting numbers are of higher
quality. While lower quality accounting numbers apparently discourage investor’s efforts to
collect and process more firm-specific information. These results are in line with Kim and
Verrecchia (1991) theoretical suggestions that high-quality accounting numbers could encourage
the investors to collect and process more firm-specific information, leading to more
incorporation of firm-specific information, hence less synchronous and more informative stock
prices.
Gul, Cheng, et al. (2011) suggest that higher earnings quality should lead to more informative
stock price. Whereas they mention that financial statements are prepared to provide information
about firm’s financial position (balance sheet), performance (income statement), and liquidity

79
(cash flow statement), and the disclosed earnings or income are one of the most important items
in the financial statement. High informativeness of earnings reflects high financial reporting
quality and low information asymmetry.
In addition, Gul, Srinidhi, et al. (2011) suggest that if higher quality earnings numbers encourage
the firm’s investors to collect and process more firm-specific private information, then the higher
earnings quality effect on firm-specific information, available from public and private sources,
will be an additive. This will lead to more capitalisation of this information into the stock price,
which in turn, increases firm-specific return variation and the informativeness of stock price.
Chen et al. (2013) suggest and find that in an information environment where the information
risk and cost are low, as measured by high quality earnings, analysts can be encouraged to collect
and process firm-specific information, which will increase the amount of firm-specific
information that incorporated into the stock price, and hence reduce stock price synchronicity,
accordingly leading to more informative stock price.
The previous papers support the “encouragement effect’’ interpretation of the relationship
between earnings quality and stock price synchronicity. Based on the encouragement effect view,
the high-quality earnings encourage the investors to collect and process firm-specific
information, which will lead to a more informative stock price. However, Gul, Srinidhi, et al.
(2011) suggest that there is “crowding out effect’’ view in the effect of earnings quality on stock
price informativeness. Based on this view as more information is channelled into public
reporting, it crowds out private information. The disclosure of accounting earnings is periodic
and less frequent than daily return disclosure, so reducing the stock price idiosyncratic volatility.
Thus under this view, high-quality earnings increase the value of public information but decrease
private information.
In addition, Kim and Verrecchia (2001) have the view that the availability of better and high-
quality accounting numbers may reduce the investor's incentives to collect and process firm-
specific private information. For this reason, one could observe less firm-specific stock price
volatility for the firms with higher earnings quality, because of more information flows via
lower-frequency accounting releases.

80
A different view of the relation between earnings quality and stock return idiosyncratic volatility
is suggested by Rajgopal and Venkatachalam (2011) who find that the deteriorating earnings
quality in the U.S. is positively related to the upward trend in idiosyncratic volatility over forty
years period (from 1962 to 2001). This result is contradicting with the findings of Morck et al.
(2000) and Jin and Myers (2006) who document that the stock price synchronicity is lower for
more developed countries and for firms with higher earnings quality. Rajgopal and
Venkatachalam (2011) results contradict also with the findings of Ferreira and Laux (2007) that
the stock price idiosyncratic volatility is positively related to higher earnings quality.
Gul, Srinidhi, et al. (2011) control for the potential effect of earnings quality, as measured by
accrual quality, on firm-specific return variation, when they examine the effect of board gender
diversity on stock price informativeness. However, they fail to document any relationship
between earnings quality and firm-specific return variation.
Based on the above argument the fourth hypothesis will be as follow:
𝑯𝟒: There is a positive relationship between earnings quality and stock price
informativeness.
To this end, based on the above contradicting arguments and findings, and given the lack of
evidence on whether the encouragement effect or the crowding out effect is dominating, the net
effect of earnings quality on stock price synchronicity is ambiguous. One of this research
objectives is to shed more light on this issue and to test and provide new evidence as to whether
higher earnings quality influences the incorporation of firm-specific information into stock price.
By doing so, this research helps in understanding the relationship between earnings
informativeness and stock price informativeness, by testing the previous hypotheses.
3.3.2 Does IFRS Adoption Matter?
Prior research suggests that mandatory adoption of IFRS adoption leads to high-quality
accounting numbers. The proponents of IFRS adoption argue that it improves the quality of
financial disclosure. This assertion is supported by empirical evidence that suggests IFRS
adoption leads to high-quality earnings. Houqe et al. (2012), and Barth et al. (2008) provide
international evidence that IFRS adoption leads to higher quality accounting numbers. Consistent

81
results from emerging market were provided by Ismail et al. (2013), where they find that IFRS
adoption leads to higher earnings quality for Malaysian firms.
In addition, other research documents an increase in the value relevance of accounting numbers
following the adoption of IFRS. For example, Devalle et al. (2010) find that the adoption of
IFRS increases the value relevance of some adopting countries. Clarkson et al. (2011) record an
increase in the value relevance of accounting numbers for Code Low Countries, following the
mandatory adoption of IFRS.
Because IFRS adoption is expected to increase earnings quality and increase the value relevance
of accounting numbers, then the mandatory adoption of IFRS would also increase the power of
earnings quality in predicting stock price synchronicity. Thus, the fifth hypothesis is as follow:
H5: The effect of earnings quality on stock price synchronicity is stronger in post-IFRS
adoption period than that for the pre-IFRS period.
However, other research fails to document an improvement in earning quality following
mandatory adoption of IFRS. For example, Liu and Sun (2015) , Doukakis (2014), and Paananen
and Lin (2009) find that IFRS adoption does not have a significant impact on improving earnings
quality. Also Tsalavoutas et al. (2012) and Paananen and Lin (2009) find that IFRS has no
impact on the value relevance of accounting numbers.
To this end, as the net effect of IFRS on earnings quality is not significant, so the effect of IFRS
adoption on the relation between earnings quality and stock piece synchronicity is unclear. Thus,
the sixth hypothesis is as follow:
H6: IFRS adoption will not affect the relation between earnings quality and stock price
synchronicity.

82
Chapter Four: Research Methodology
4.1 Introduction
After presenting the theoretical framework and the hypotheses development in chapter three, this
chapter introduces the methodology adopted in this research and research design issues. In
particular, this chapter is structured as follows; Section 4.2 explains the research philosophy;
section 4.3 present the research approaches; section 4.4 explains the research strategy; section
4.5 explains sample selection procedures and data sources; section 4.6 presents methods of
analysis and investigations; section 4.7 explains variable measurement; and section 4.8 presents
the empirical models used to examine the effect of IFRS adoption and earnings quality on the
informativeness of stock price.
4.2 Research philosophy
Saunders., Philip Lewis, and Thornhill (2012) define research philosophy as systematic beliefs
and assumptions about the development of the knowledge. Easterby-Smith, Thorpe, and Jackson
(2012) present three arguments on the importance of research philosophy: firstly, clear research
philosophy assists the researcher in refining and identifying research methods that suitable for
the researched phenomena. Secondly, understanding the research philosophy helps the
researcher to evaluate the differences between research methodologies and thus avoid using
unsuitable methods in the early stages of the research. Thirdly, understanding research
philosophy allows the researcher to acquire new knowledge by adopting a new methodology of
which he/she has no previous experience.
According to Saunders., Philip Lewis, and Thornhill (2015) the research philosophy has
epistemological, ontological, and axiological assumptions. The epistemological assumptions are
concerned with knowledge and the possible ways that are followed by researchers to obtain and
organise knowledge (Bhattacherjee, 2012; Blaikie, 2007). Based on this assumption, the
knowledge in business research can range from numerical data (such as the data in the firm’s
financial statements) to textual data (such as the notes and explanations that included in the
firms’ annual report).

83
The ontological assumption refers to the nature of reality, so ontology “is concerned with what
exists, what it looks like, what unit makes it up, and how these units interact with each other”
(Blaikie, 2007, p. 3). Flahive, Taniar, Rahayu, and Apduhan (2011, p. 618) provide another
definition of the anthological assumption where they defined it as “the specification of
conceptualization, used to help programs and humans share knowledge”. So the researcher’s
ontological assumption determines how she/he observes the world of business and, therefore,
determines her/his choice of what to research for their research project (Saunders et al., 2015).
The last philosophical assumption is the axiological assumption. This assumption refers to the
role of values and ethics during the research process; it answers the questions about how the
researchers deal with both their own values and beliefs; and those for research participants
(Saunders et al., 2015). According to Heron (1996), human values are the guiding justification
for all human actions, so the researcher's axiological beliefs provide the basis for making
judgments about the type of research that they will conduct and how will they perform the
research.
These philosophical assumptions are related to two major opposing extremes, namely
objectivism and subjectivism (Niglas, 2010). According to Saunders et al. (2015, p. 128)
“objectivism incorporates the assumptions of the social sciences, by arguing that the social
reality that we research is external to us and others”. Based on this extreme, the ontological
assumption of the objectivism reflects realism, which considers the social entities to be like
physical entities of the natural world and independent of the researchers. Epistemologically,
extreme objectivists tend to discover the truth through examining observable, measurable facts,
so the results will be a law-like generalisation (Saunders et al., 2015). Based on the axiological
assumption, the objectivist researchers seek to keep the research free from their beliefs and
values, which may otherwise influence their findings.
The subjectivism extremes “incorporates assumptions of the arts and humanities, asserting that
social reality made from the perceptions and consequent actions of social actors” (Saunders et
al., 2015, p. 130). Based on this extreme, the ontological assumption of subjectivism embraces
nominalism, which considers that the order and the structures of the social events that are
examined by the researcher are generated by the researchers and by other social factors like
language and perceptions (Saunders et al., 2015). Burell and Morgan (1979) suggest that, for

84
nominalist researchers, there is no underlying reality to the social world beyond what the
researcher can perceive, and because each person has different experience and perception of
reality, so there are multiple realities rather than one single reality that is same for everyone.
Consequently, the subjective researcher is interested in different opinions and narratives that can
help to account for different realities (Saunders et al., 2015).
Within business and management research, Saunders et al. (2015) define five kinds of
philosophies which researchers can choose, to undertake a piece of research, namely positivism,
realism (direct and critical typologies), interpretivism, postmodernism, and pragmatism.
Importantly, an understanding of these philosophies and their concepts helps a researcher to
identify the suitable research method to properly examine the targeted phenomena, and helps
researchers to be fully conscious about which kind of data is required, and also how to obtain
and how to analyse such data (Bhattacherjee, 2012).
In term of the positivism philosophy, Gill and Johnson (2010) suggest that in the research
paradigm, the researcher collects data about an observable reality, and then searches for
regularities and causal relationships between research variables, by using highly structured
methodology. Therefore, the product of such research will be law-like generalizations, such as
those produced by natural scientists. Bhattacherjee (2012) and Saunders et al. (2012) suggest
that positivist researcher use existing theory to verify and develop hypotheses that enhance the
predictive understanding about the given occurrences. Then these hypotheses will be tested,
generally quantitatively, to be confirmed or rejected leading to further development of theory,
which may be tested by further researchers. According to Bhattacherjee (2012) and Saunders et
al. (2015) positivist researchers require a higher degree of objectivity when conducting a
particular piece of research regardless of the kind of phenomenon examined, and should not
influence nor be influenced by the research subject. This means that positivist researchers
undertake research in a value-free way.
Critical realist philosophy “focuses on explaining what we see and experience, in terms of the
underlying structures of reality that shapes the observable events” (Saunders et al., 2015, p.
139).

85
Critical realist researchers consider the reality as the most important philosophical
consideration (Fleetwood, 2005), and they claim that the sensation and events we experience;
and the mental processing after the experience, are the two steps toward understanding the
world. Epistemologically, critical realist researchers recognise that knowledge is historically
situated, and that social facts are social constructions agreed upon by people, rather than existing
independently, whilst the axiologically critical realist researcher considers that knowledge is a
result of social conditions and cannot be understood independently of the social involvement of
the actors (Saunders. et al., 2015).
With regard to the interpretivist, Saunders et al. (2015, p. 140) suggest that “interpretivism
argues that human beings and their social worlds cannot be studied in the same way as physical
phenomena and therefore social sciences research needs to be different from natural sciences
research rather than trying to emulate the latter”.
The interpretivist researchers criticise the positivists’ general law-like reality because an
interpretivist believes that different people from different cultures face different circumstances
at different times, and so they make different meanings. The interpretivist researchers’
interpretations of the research materials and data, and researcher’s values and believes, play a
crucial role in the research process. The interpretivist philosophy is fundamentally applied in
research cases, which seek for theory building; it starts by collecting data from the targeted
population (normally uses qualitative data that is usually collected from a small number of
respondents) and then attempts to build theory (Bhattacherjee, 2012).
In terms of pragmatism philosophy, Kelemen and Rumens (2008) suggest that this philosophy
asserts that concepts are only relevant where they support action. Based on this philosophy the
reality is considered as the practical effects of ideas, and knowledge is valued for enabling
actions to be carried out successfully (Saunders et al., 2015).
The ontological assumption for the positive research approach considers the social entities to be
like physical entities of the natural world and independent of the researchers. While the
ontological assumption for social constructionism approach (interpretivism) argues that human
beings and their social worlds cannot be studied in the same way as physical phenomena,
because it socially constructed, subjective and may change, therefore social sciences research

86
needs to be different from natural sciences research(Saunders et al., 2012). For this reason the
interpretivist researchers criticise the positivists’ general law-like reality because an
interpretivist believes that different people from different cultures face different circumstances
at different times, and so they make different meanings.
Epistemologically, positivist researchers tend to discover the truth through examining
observable phenomena, with measurable facts, so the results will be a law-like generalisation.
While the interpretive researcher have the view that of the acceptable knowlegde is subjective
and the researcher’s values and believes, play a crucial role in the research process.
This research is in toward the positive research philosophy, where it reviews the literature that
examined stock price informativeness, accounting transparency, and earnings qualities issues
and uses the existing theory to develop research hypotheses about the expected effect of IFRS
adoption and earnings quality on stock price informativeness. After testing the research
hypotheses, the results can be generalised to all the firms with similar characteristics.
4.3 Research approach
A crucial step in conducting social science research is choosing and justifying a suitable research
approach to be used by the researcher. This, in turn, helps the researcher in understanding the
phenomena that she/he is investigating and in determining the most suitable research tools.
The two most popular research approaches in social research philosophy are the deductive and
the inductive research approaches. Saunders et al. (2012) provides definitions for deductive and
inductive research approach, defining the deductive research approach as the research approach
that tries to test existing theory, whilst the inductive research approaches is a research approach
that tries to build a new theory.
Robson (2002) suggests that the research that uses the deductive research approach, at first
develops hypothesis(es) in an operational term. These hypotheses represent the relationship
between variables and indicate exactly how the variables will be measured. Then the research
will test the hypothesis by designing a rigorous research strategy, and the final stage is when the
researcher examines the results of the test, which will either, lead to acceptance or modification
87
of the theory. The conclusions of the deductive research approach are derived logically from a
set of premises; if all the premises are true then the deductive approach conclusions are true
(Ketokivi & Mantere, 2010). According to Saunders et al. (2012) the results of such approach is
the generation of a law-like conclusion which is used as a base for an explanation.
Saunders et al. (2012) suggest that the main characteristics of the deductive research approach
the use of control variables to ensure that any changes in the dependent variable are related to
changes in the independent variables, rather than anything else. In addition, they mention that
deductive researchers use a highly structured methodology to facilitate replication of the
research, implement a quantitative measurement of the facts, and finally collect a sufficient
sample size, so that they will be able to generalize statistically about the relationship between the
dependent and independent variables. This study will examine the relationship between,
accounting transparency, earnings quality, and stock price informativeness; therefore, the
deductive research approach will be the ideal approach to follow.
4.4 Research strategy
The experimental research strategy is followed in this research. According to Hakim (2000), an
experimental research strategy is a form of research that tries to examine causal links between
variables. Saunders et al. (2012) state that in an experiment strategy, the researcher tries to
remove the possible effect of alternative explanations to the planned intervention, so reducing
the internal validity problem, and they notice that this kind of research is often conducted in a
laboratory rather than in the field. However, the main problem for experimental research designs
is that the small samples lead to an external validity problem.
In an attempt to overcome these problems with experimental research, an extensive review of
the literature, that examines stock price synchronicity, has been conducted to control for the
variables that previously documented to have an impact on stock price synchronicity.
Additionally, to reduce the effect of the external validity problem this research collects a large
sample which contains all the firms listed on the London Stock Exchange for the period from
1990 to 2013 with available data in DataStream database.
88
4.5 Sample selection and data sources.
This section contains a detailed explanation of the procedures followed in the sample selection
process, the type of the data used in the study, and the data source. Subscription 4.5.1 outlines
the sample selection procedures, while subscription 4.5.2 describes the type and the source of
the data used.
4.5.1 Sample selection
The initial research sample consists of all the firms listed on London Stock Exchange that have
available data in DataStream, Worldscope, and IBES international databases for the period
between 1th
January 1990 and 31st
December 20132.
One of the research objectives is to examine the effect of accounting transparency, as measured
by IFRS adoption, on the informativeness of the stock price. The UK-listed firms have to prepare
their consolidated financial statements in accordance with IFRS, starting from the 1st
of January
2005, for this reason, the sample period was chosen to cover the periods before the adoption and
after the adoption, thus the effect of IFRS adoption on the informativeness of stock price can be
examined.
Taking a sample of firms for a long period before (15 years) and long period after (9 years) the
adoption has many statistical benefits. First, choosing a long period before and after IFRS
adoption could result in a better measure of the effect of IFRS adoption on stock price
synchronicity. Since taking a long period before the adoption provides a better measure of the
average synchronicity levels before the mandatory adoption of IFRS. Secondly, taking a long
period after the mandatory adoption of IFRS helps in examining the nature of the IFRS effect, if
it exists, on the informativeness of stock prices, and whether this effect is a permanent or a
transitory one. Finally, Wang and Yu (2015) suggest that one of the advantages of taking a large
sample for a longer time period is that the results and conclusions, drawn from this sample, are
more representative. The sample period ends in 2013 because it is the last period with available
data at the time of the data collection process.
2 The three databases are combined in one software called Datastream published by Thomson Reuter.
89
The investigation is undertaken in one country, the UK, to hold constant certain institutional
factors such as stock listing requirements, accounting disclosure requirements, market
microstructures and regulatory environments that may confound the results, thereby
strengthening the reliability of our findings, as suggested by Ruland et al. (2007) and Paananen
and Lin (2009). In addition, Schipper (2005) suggest that choosing one country instead of multi
countries helps in minimising heterogeneity and cross-countries differences that may have an
effect on the dependent variable.
The United Kingdom data was chosen because of the uniqueness of the UK data as a comparison
to other countries data. Firstly, according to Haxhi, van Ees, and Sorge (2013) the UK financial
reporting environment is to be considered a very shareholder oriented, which is ideal for a better
assessment of the impact of IFRS adoption on stock price informativeness. Moreover, the IFRS
disclosure is oriented mainly to provide useful information to the companies’ shareholders, and
to support the shareholders’ decisions to invest in a specific firm’s share and have a greater
impact on the movement of the stock price, the main determinant of stock price synchronicity. In
addition, the fact that there was no early IFRS adoption in the UK prior to 2005 also makes it an
ideal research setting to examine the effects of mandatory IFRS adoption on stock price
synchronicity. Finally, choosing one country instead of multi countries helps in minimise
heterogeneity and cross- countries differences effects, that results from the differences in capital
structure, ownership structure, size, and the degree of accounting sophistication in the countries
that adopted IFRS (Schipper, 2005).
Only firms listed in the L.S.E, active and dead, with available data on DataStream, Worldscope,
and IBES database, for the period from 1990 to 2013 were included in the sample. Following the
prior research (Hutton et al., 2009; Kim & Shi, 2012a) the firms in financial, banking, and
insurance industries, with SIC code 6000-6999 were excluded from the sample. These industries
were excluded from the sample because these industries have special regulations and financial
accounting standards and the inclusion of these industries in the sample may distort the research
results. Any firms with unavailable data to calculate the explanatory variables, and the dependent
variable were excluded from the sample also.
90
4.5.2 Data type and source
When conducting a research, the researcher needs to obtain data to answer the research
questions. Saunders. et al. (2015) suggest that the researchers has the option to use previously
collected data (secondary) and undertake a further analysis on these data, or collect new data
specifically for their research (primary data).
Because all the required data to calculate the dependent and independent variables is available on
a reliable database (DataStream), this research will collect and use this secondary data to
measure the research variables.
Saunders et al. (2012) divide the secondary data into three subgroups: documentary, survey, and
multiple sources secondary data. They defined documentary secondary data as the data that
include written materials such as the data that is collected from company’s’ reports, books, and
magazines; and non-written materials, such as voice and video recording, pictures, and
organisational databases. Since all the data used in this study can be accessed by the company
annual report and some commercial databases like DataStream, these data can be considered as a
documentary secondary data.
There are different databases that provide a comprehensive coverage of accounting and financial
data for firms in different countries. Lara, Osma, and Noguer (2006) argue that the choice of
database has an effect on the results of empirical studies due to the differences in classification
and measurement methods of samples from different databases, as they conclude that database
choice matters, because it leads to different results when the same research design is used. So it
is important to collect the data from reliable database. Following prior research, all the required
data is collected from DataStream, Worldscope, and IBES databases. These databases are
considered to be reliable providers of a wide range of financial information and financial ratios
for many firms in different countries around the world.

91
4.6 Methods of analysis and investigation.
4.6.1 Univariate analysis
As the research results do not speak for themselves, the researcher needs to use tools to make the
results understandable (Healey, 2014); Brooks (2014) suggest that when analysing series which
contain many observations, it is useful to be able to describe the most important characteristics of
the series using descriptive statistics summary measures. By providing the descriptive statistic
for each variable, univariate analysis can be used to organise, simplify and clarify the data so the
data interpretations can be understood by the readers. In addition, Healey (2014) suggest that
univariate analysis is considered as a helpful tool for organising and analysing the results and
communicating the conclusions. According to Bryman and Bell (2011), descriptive analysis
forms the basis for the quantitative statistical analysis of the data; Saunders et al. (2012) argue
that descriptive analysis can be used as guidance for the researchers with regard to incorporating
further analysis techniques.
Descriptive statistics are used in this research to describe the main features of the data. The most
common methods for univariate analysis are highest and lowest values, mean, median, and
standard deviation. These descriptive statistics tools are very helpful in determining the central
tendency of the values to mean, and the distribution of the data. For these reasons univariate
analysis is used as part of the diagnostic tests to identify the outlier observations. Whereas if the
maximum and the minimum values were deviates from the mean then the data was screened for
outliers.
4.6.2 Bivariate analysis
Bivariate analysis refers to examining the relationships between two variables. To examine the
bivariate relationships between the variables, at first, a correlation analysis was conducted using
a Spearman and Pearson correlation analysis. Bivariate regression analysis is also used to
examine the effect of one independent variable on the dependent variable.
The bivariate regression analysis refers to developing a regression model with only one
explanatory dependent variable. So the change in the dependent variable is explained by

92
reference to one independent variable (Brooks, 2014). The correlation between the two variables,
explanatory and explained variables, can also be used to measure the degree of the relationship
between them.
The bivariate analysis, as performed by Pearson and Spearman correlations analysis, is used in
this study to examine the degree of the relationship between the variables. The simple linear
regression model is used to examine the relationship between the variables. The simple
regression model for bivariate analysis is as follows:
𝑆𝑌𝑁𝐶𝐻𝑖 = 𝛼0 + 𝛽1𝑋𝑖 + 𝑒𝑖
Where:
𝑆𝑌𝑁𝐶𝐻𝑖 represent the stock price synchronicity for the firm 𝑖,
𝛼0 presents the intercept coefficient estimate, and is interpreted as the value that would be taken
by the dependent variable 𝑆𝑌𝑁𝐶𝐻 when the value of the explanatory independent variable 𝑋 is
zero;
𝛽1 is the estimated coefficient which represent the net estimated change in the explained
variable as a result of one unit change in the explanatory variables.
The sign of the 𝛽1 decides the type of the effect of the independent variables on the dependent
variable, either positive or negative, and 𝑒𝑖 error term represents the residual, which is the
difference between the actual value of the dependent variable and the fitted predicted value of it
by the model.
4.6.4 Multivariate analysis
Multivariate analysis refers to using a regression model with more than one explanatory variable.
Saunders et al. (2012) define multiple regression analysis as the regression model that uses two
or more independent (explanatory) variables to explain the change in one dependent variable.
Multiple regression models measure the average change in the dependent explained variable per
unit change in a given independent explanatory variable, holding all other independent variables
constant at their average values (Brooks, 2014). In particular, the multiple regression models
93
attempt to explain the movement in the dependent variable by reference to movements in two or
more explanatory variables.
The most common method of regression analysis is known as an ordinary least square regression
model (OLS). OLS tries to draw a line that best measures the relationship between variables.
However, OLS has a number of assumptions that must be met before relying on its statistical
results. These assumptions are as follows:
1- The average value of the errors is zero. Brooks (2014) suggests that if the constant term
(α) is included in the regression then this assumption will never be violated.
2- The variance of the errors is constant. This means that the dependent and independent
variables have equal variance; this assumption is known as the assumption of
homoscedasticity. If the variables do not have an equal variance, then the
heteroscedasticity exist. There are many methods to detect the heteroscedasticity like
Goldfeild - Quandt test and one of the most popular tests is White’s test and Breush-
Pagan test.
Lagged value could be used to reduce heteroscedasticity. If the heteroscedasticity is
detected then the OLS estimators will still give an unbiased coefficient estimate, but they
are no longer the best linear unbiased estimator, as a result, the standard errors could be
wrong and hence any inferences made from the OLS regression model could be
misleading. For these reasons alternative estimation methods which can take
heteroscedasticity into account can be used. Generalised least square (GLS), also known
as weighted least squares (WLS) could be used; in this study, Breush-Pagan test is used
for heteroscedasticity. The problem of heteroscedasticity is corrected in this study by
reporting heteroscedasticity-robust standard errors inbuilted in the Stata statistical
software.
3- The covariance between the error terms overtime or cross-sectionally is zero. This means
that the value of the independent variable at time 𝑡 is not related to its value at time 𝑡 −
1, if there is a relation then the autocorrelation or serial correlation exist. One of the
simplest tests to detect if the autocorrelation exist is the Durbin-Watson test where its
result is interpreted as this DW= 2 then this means there is no autocorrelation, DW= 0
94
means there is a perfect positive autocorrelation, and DW= 4 means there is a perfect
negative autocorrelation. Using the lagged value (past period value) when calculating
stock price synchronicity is recommended by Kim and Shi (2012a) and Piotroski and
Roulstone (2004), to correct any potential autocorrelation problem.
The consequences of the autocorrelation being present but ignored are the same
consequences as those of ignoring heteroscedasticity. The coefficient estimates derived
from OLS regression are still unbiased, but they are inefficient. Increase in the
probability of type 1 error, the tendency to reject the null hypothesis when it is correct; R2
is likely to be inflated relative to its corrected value.
If the problem of autocorrelation is specified then it would be possible to use the general
least squares mode, or using the Cochrane-Orcutt procedure (Brooks, 2014). These
methods develop statistical models that contain lagged values for the variables, the
lagged value effect is likely to reduce and possibly remove serial correlation
(autocorrelation) which may be present in the regression model residuals.
In this empirical model, the robust standard error, as calculated using instruments inbuilt
in the Stata statistical software, will be used to deal with heteroscedasticity and
autocorrelation problems.
4- The explanatory dependent variables are fixed in repeated samples or are non-stochastic.
It assumes that the explanatory variables are exogenous, that is their values are
determined outside the regression equation. Also, the model assumes that the causality in
the regression model runs from 𝑥 𝑡𝑜 𝑦 and not vice versa, which mean that changes in the
value of the explanatory variables cause changes in the explained dependent variables,
but that changes in the dependent variable values will not impact the values of
explanatory variables. Leamer (1985) defines the independent variable as exogenous
variable if the value of the dependent variable does not change after modifications of the
process of generating the independent variable. If this is not the case, then the problem of
endogeneity exists. Endogeneity can be defined also as the correlation between the
independent variables and the error term in a regression (Roberts & Whited, 2012). If one
or more of the explanatory variables is contemporaneously correlated with the error, the
OLS estimator will not be consistent Brooks (2014). Whereas the regression model with
95
endogenous explanatory dependent variables will assign an explanatory power to the
independent variables to explain the changes in the dependent variable, whereas in reality
it is arising from the correlation between the error term and the dependent variable. The
Hausman test can be conducted to test for exogeneity of the variables.
There are many methods that can be used to tackle the endogeneity issue. One of the
most common methods is using two-stage least square method. Brooks (2014) explains
the two stage least square method which is done in two stages. In stage one, the
researcher obtains and estimates the reduced form equations by using OLS and then saves
the fitted values for the explained dependent variable. In stage two the researcher
estimates the structural equations using OLS, but at the same time, the researcher
replaces any right-hand side endogenous variables with their stage one fitted values.
Many previous researches suggest using the 2SLS methods to solve the endogenous
variable problem; for example, Chen, Hope, Li, and Wang (2011), Olivero, Li, and Jeon
(2011) and Kim and Shi (2012a). To deal with any endogeneity issues, this research will
follow the previous research and perform a two-stage least square regression model as
suggested by Heckman (1979).
5- The disturbances are normally distributed (Normality). The observations that do not fit
in with the pattern of the remainder of the data are known as outliers. One way to
improve the chance of having a normally distributed error is to winsorize or removes the
outlier observation, and using the log transformation of the variables. One of the most
commonly applied normality tests is the Bera-Jarque test.
To avoid violating this assumption and to have more normally distributed data the log
transformation for continues variables with outlier observations were used. For the
earning quality variable, this variable was winsorized at 3rd
and 97th
percentile levels.
6- One of the implicit assumptions that Hair, Black, Babin, Anderson, and Tatham (2010)
suggest when using regression estimation methods, is that the explanatory variables are
not correlated with each other. If there is no relationship between the explanatory
variables, they would be said to be orthogonal to one another (Brooks, 2014). If the
explanatory variables are orthogonal to one another, adding or removing a variable from
a regression model would not cause the values of the coefficients on the other variables
96
change. However, in practice, the correlation between explanatory variables will be non-
zero, where a small degree of correlation between explanatory variables will almost
always occur but will not cause any significant loss of the precision of the regression
results (Brooks, 2014). The problem occurs when the explanatory variables are very
highly correlated with each other; this problem is known as multicollinearity.
According to Brooks (2014) there are two type of multicollinearity, perfect
multicollinearity which occurs when there is an exact relationship between two or more
explanatory variables, and near multicollinearity, which is much more likely to occur in
practice, and would arise when there is a non-negligible but not perfect relationship
between two or more of the explanatory variables.
Testing the multicollinearity is not difficult and the simplest method for examining it
involves looking at the matrix of correlations between the individual variables. Hair et al.
(2010) and Gujarati and Porter (2009) suggest that if the correlation coefficient between
two explanatory variables is more than 0.80, this indicates a serious multicollinearity
problem. Another way to test for multicollinearity is using a test called variance inflation
factor (VIF). Hair et al. (2010) suggest that if the variance inflation factor is more than 10
this could be an indication that a serious multicollinearity is present.
According to Brooks (2014) the problems that may be presented if near multicollinearity
exists between two or more variables, but are ignored by the researcher are that, the
individual coefficients will have high standard errors, so that the regression looks good as
a whole, but the individual variables are not significant; the regression becomes very
sensitive to small changes in the specification, so adding or removing an explanatory
variables leads to large changes in the coefficient values or significances of the other
variables. Multicollinearity will thus make confidence intervals for the parameters very
wide, and significance testing might, therefore, give inappropriate conclusions (Brooks,
2014).
Many econometric researchers argue that multicollinearity is a problem with the data
rather than with the model or estimation method (Brooks, 2014). Some of the methods for
dealing with multicollinearity, as suggested by Brooks (2014), are as follows: first, ignore

97
it if the model is otherwise adequate and robust, whereas the presence of multicollinearity
does not affect the best linear unbiased estimator properties of ordinary least square
regression; second, the researcher can drop one of the collinear variables so that the
problem disappears; third, transform the highly correlated variables into a ratio and
include the calculated ratio instead of the individual variables in the regression model;
finally increase the sample size by using a pooled sample data with both cross-section
and time series dimension. Data that include both time series and cross-section
dimensions is known as a panel data. In this model, the panel data analysis technique is
used so that it can increase the sample size.
Having discussed the main issues involved in analysing the data and the diagnostic tests that
have to be made to improve the confidence of regression results and reduce the error term,
this research will seek to adopt all the available analysis techniques to ensure that the
research results are robust and valid. Table 4.1 summarizes the main assumptions of
regression analysis that one has to consider when analysing the regression results, the
consequences on the regression coefficients in the case of violating one of these assumptions,
the diagnostic tests that have to be made to check if one of these assumptions was violated,
and finally the available solutions to avoid any assumption violation.
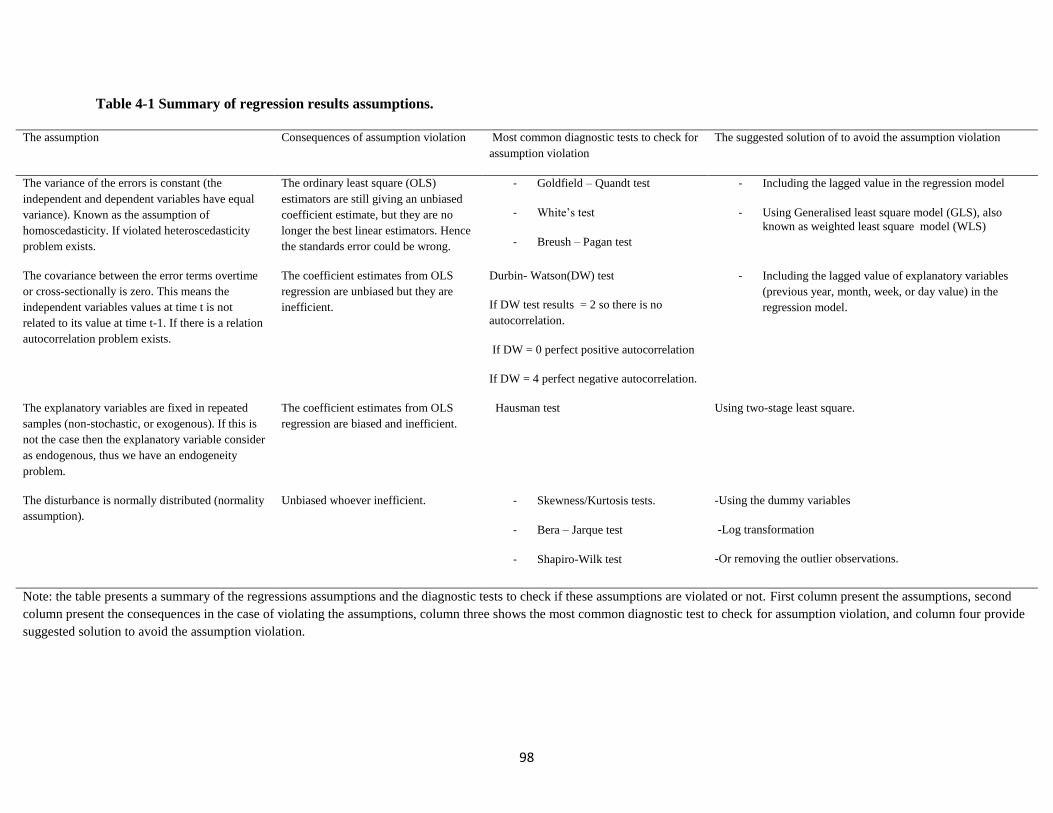
98
Table 4-1 Summary of regression results assumptions.
The assumption Consequences of assumption violation Most common diagnostic tests to check for
assumption violation
The suggested solution of to avoid the assumption violation
The variance of the errors is constant (the
independent and dependent variables have equal
variance). Known as the assumption of
homoscedasticity. If violated heteroscedasticity
problem exists.
The ordinary least square (OLS)
estimators are still giving an unbiased
coefficient estimate, but they are no
longer the best linear estimators. Hence
the standards error could be wrong.
- Goldfield – Quandt test
- White’s test
- Breush – Pagan test
- Including the lagged value in the regression model
- Using Generalised least square model (GLS), also
known as weighted least square model (WLS)
The covariance between the error terms overtime
or cross-sectionally is zero. This means the
independent variables values at time t is not
related to its value at time t-1. If there is a relation
autocorrelation problem exists.
The coefficient estimates from OLS
regression are unbiased but they are
inefficient.
Durbin- Watson(DW) test
If DW test results = 2 so there is no
autocorrelation.
If DW = 0 perfect positive autocorrelation
If DW = 4 perfect negative autocorrelation.
- Including the lagged value of explanatory variables
(previous year, month, week, or day value) in the
regression model.
The explanatory variables are fixed in repeated
samples (non-stochastic, or exogenous). If this is
not the case then the explanatory variable consider
as endogenous, thus we have an endogeneity
problem.
The coefficient estimates from OLS
regression are biased and inefficient.
Hausman test Using two-stage least square.
The disturbance is normally distributed (normality
assumption).
Unbiased whoever inefficient. - Skewness/Kurtosis tests.
- Bera – Jarque test
- Shapiro-Wilk test
-Using the dummy variables
-Log transformation
-Or removing the outlier observations.
Note: the table presents a summary of the regressions assumptions and the diagnostic tests to check if these assumptions are violated or not. First column present the assumptions, second
column present the consequences in the case of violating the assumptions, column three shows the most common diagnostic test to check for assumption violation, and column four provide
suggested solution to avoid the assumption violation.

99
4.7 Variables measurement
4.7.1 Dependent variable (Stock price informativeness measure)
Our measure of stock price informativeness is based on stock price synchronicity. In particular,
this research considers the amount of firm-specific stock return variation as an indicator of the
amount of firm-specific information that is incorporated into the stock price, thus as an indicator
of the informativeness of the stock price. A higher firm-specific stock return variation reflects
lower correlation between stock returns and the market as well as industry returns, suggesting
that stock prices are more likely to reflect firm-specific information (French & Roll, 1986; Roll,
1988), hence stock prices are less synchronous with market return and industry return.
Each calendar year, the research estimate firm-specific measure of stock return synchronicity by
using the methodology outlined in the following papers (An & Zhang, 2013; Boubaker et al.,
2014; Gul et al., 2010; Kim & Shi, 2012a; Piotroski & Roulstone, 2004). Specifically, for each
firm’s yearly observation, the model regresses the firm 𝑖‘s weekly returns on the current week’s
and prior week value weighted average market return and the current week’s and prior week
value weighted average two digit SIC code industry return:
𝑅𝐸𝑇𝑖,𝑤 = 𝛼 + 𝛽1𝑀𝐾𝑅𝐸𝑇𝑊1 + 𝛽2𝑀𝐾𝑅𝐸𝑇𝑊−1 + 𝛽3𝐼𝑁𝐷𝑅𝐸𝑇𝑖,𝑤1 + 𝛽4𝐼𝑁𝐷𝑅𝐸𝑇𝑖,𝑤−1 + 𝜀𝑖, 𝑤 (1)
Where,
RETi,w = the weekly return for firm i in week 1.
MKRETW = the value- weighted market return for week 1.
MKRETW−1 = the value- weighted market returns for week -1.
INDRETi,w = the industry value-weighted return excluding firm i’s weekly return for w1.
INDRETi,w−1 = the industry value-weighted return excluding firm i’s weekly return for week -1.
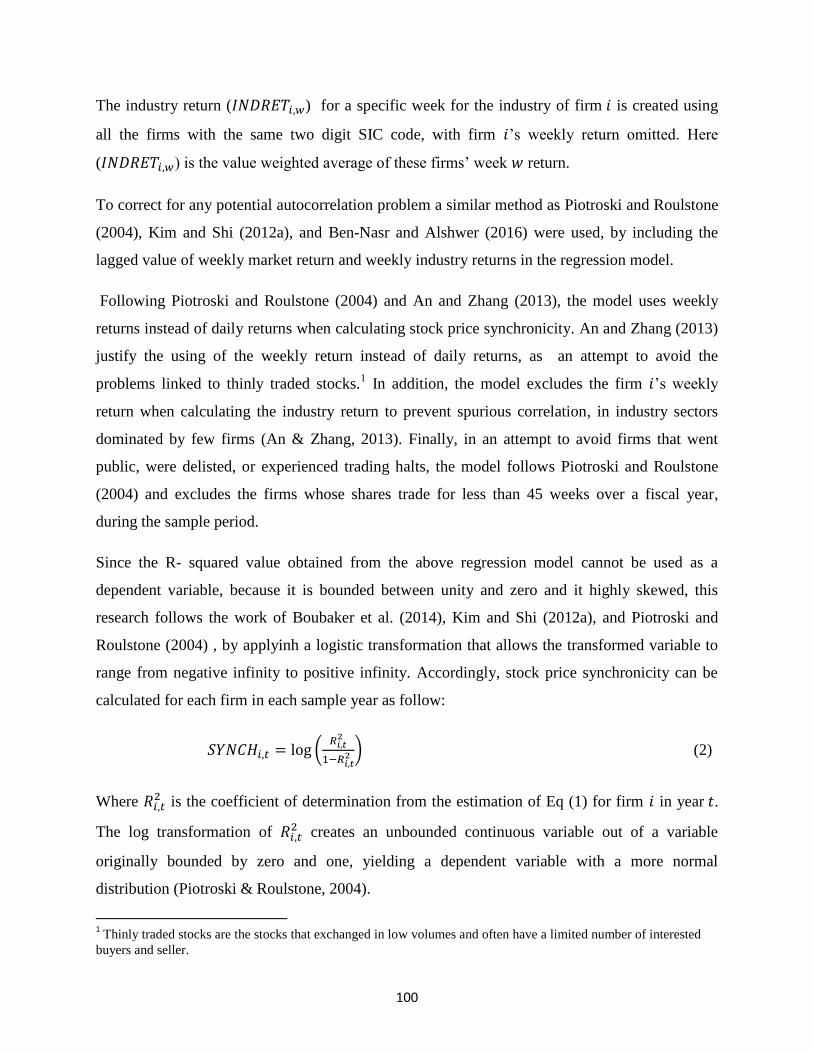
100
The industry return (𝐼𝑁𝐷𝑅𝐸𝑇𝑖,𝑤) for a specific week for the industry of firm 𝑖 is created using
all the firms with the same two digit SIC code, with firm 𝑖’s weekly return omitted. Here
(𝐼𝑁𝐷𝑅𝐸𝑇𝑖,𝑤) is the value weighted average of these firms’ week 𝑤 return.
To correct for any potential autocorrelation problem a similar method as Piotroski and Roulstone
(2004), Kim and Shi (2012a), and Ben-Nasr and Alshwer (2016) were used, by including the
lagged value of weekly market return and weekly industry returns in the regression model.
Following Piotroski and Roulstone (2004) and An and Zhang (2013), the model uses weekly
returns instead of daily returns when calculating stock price synchronicity. An and Zhang (2013)
justify the using of the weekly return instead of daily returns, as an attempt to avoid the
problems linked to thinly traded stocks.1 In addition, the model excludes the firm 𝑖’s weekly
return when calculating the industry return to prevent spurious correlation, in industry sectors
dominated by few firms (An & Zhang, 2013). Finally, in an attempt to avoid firms that went
public, were delisted, or experienced trading halts, the model follows Piotroski and Roulstone
(2004) and excludes the firms whose shares trade for less than 45 weeks over a fiscal year,
during the sample period.
Since the R- squared value obtained from the above regression model cannot be used as a
dependent variable, because it is bounded between unity and zero and it highly skewed, this
research follows the work of Boubaker et al. (2014), Kim and Shi (2012a), and Piotroski and
Roulstone (2004) , by applyinh a logistic transformation that allows the transformed variable to
range from negative infinity to positive infinity. Accordingly, stock price synchronicity can be
calculated for each firm in each sample year as follow:
𝑆𝑌𝑁𝐶𝐻𝑖,𝑡 = log (𝑅𝑖,𝑡
2
1−𝑅𝑖,𝑡2 ) (2)
Where 𝑅𝑖,𝑡2 is the coefficient of determination from the estimation of Eq (1) for firm 𝑖 in year 𝑡.
The log transformation of 𝑅𝑖,𝑡2 creates an unbounded continuous variable out of a variable
originally bounded by zero and one, yielding a dependent variable with a more normal
distribution (Piotroski & Roulstone, 2004).
1 Thinly traded stocks are the stocks that exchanged in low volumes and often have a limited number of interested
buyers and seller.
101
𝑆𝑌𝑁𝐶𝐻 is measured for each firm during each year in the sample. By construction, the high
value of 𝑆𝑌𝑁𝐶𝐻 indicates that individual firm’s stock returns tend to co-move more closely
with the market and/or the industry return, and thus firm-specific return variation is small.
So the higher value of 𝑆𝑌𝑁𝐶𝐻 indicates that the firm stock price movement can by largely
explained by the market and industry return, which mean that the stock price reflects less firm-
specific information relative to market and/or industry common information, hence the stock
price is considered to be less informative about the firms fundamental value.
As a robustness test, the synchronicity is calculated by regressing the firm 𝑖‘s weekly returns on
the current week’s value weighted average market return and the current week’s value weighted
average two digit SIC code industry return
𝑅𝐸𝑇𝑖,𝑤 = 𝛼 + 𝛽1𝑀𝐾𝑅𝐸𝑇𝑊 + 𝛽2𝐼𝑁𝐷𝑅𝐸𝑇𝑖,𝑤 + 𝜀𝑖, 𝑤. (3)
For the purpose of this thesis, an inverse relationship between stock price synchronicity and
IFRS adoption can be viewed as an indication that the improved transparency, after IFRS
adoption, facilitates the flow of firm-specific information into the market and its’ incorporation
into the stock price. A positive relationship between stock price synchronicity and the inverse
measure of earnings quality, can be viewed as an indication that higher earnings quality
encourages the firm’s investors to collect and process firm-specific information, leading to more
capitalisation of this information into the stock price, and hence a more informative stock price.
4.7.2 Independent variables
4.7.2.1 First study independent variable (IFRS adoption)
Bushman and Smith (2003) describe transparency as the promotion of corporate disclosure and
protection of the rights of minority shareholders in the information environment. Bushman et al.
(2004) also define corporate transparency as the availability of firm-specific information to those
who are outside publicly traded firms. Transparency is also described by Boatright (2008) as a
tool to limit information asymmetries between insiders and outsiders.
The International Financial Reporting Standards (IFRS) are normally associated with more
transparent and higher quality accounting disclosures. The relationship between IFRS adoption
102
and transparency was documented by many researchers, Ball (2006) suggest that the investors
benefit from IFRS adoption because IFRS provides comprehensive, more accurate and timely
financial information relative to the national standards reporting methods, including the
European countries standards; in addition one of the main goals of IFRS is to harmonise
accounting disclosure, which facilitate the comparability of financial data leading to a reduction
in the cost of processing the financial information.
Moreover, in an attempt to ensure a high level of transparency and comparability of financial
statements for listed firms, the EU issued the regulation (1606/2002) which requires from all
listed firms in the EU to prepare their consolidated financial statements in accordance with IFRS
for the year beginning 2005 and after (European Parliament, 2008).
In addition, there is a growing census in the prior literature that the reductions in information
processing costs and the reductions in asymmetric information after the IFRS adoption result
from the increased transparency of IFRS disclosure (Humphrey, Loft, & Woods, 2009; Shima &
Gordon, 2011). Gordon et al. (2012) also have found that the improvement in transparency of
financial statements after IFRS adoption, encourage foreign investors to invest in the countries
that adopted IFRS. The prior literature that has analysed the effect of IFRS adoption also points
out additional benefits that have been achieved after IFRS adoption, including improvements in
transparency and voluntary disclosure, higher disclosure quality, higher earnings quality, higher
firm liquidity, more value relevant accounting numbers, an increase in the information content of
earnings, increase analysts-following, and a significant reduction in the cost of capital (Aksu &
Espahbodi, 2012; Barth et al., 2008; Daske & Gebhardt, 2006; Devalle et al., 2010; Iatridis,
2012; Ismail et al., 2013; Landsman et al., 2012; Li, 2010; Yang, Karthik, & Xi, 2013)
Overall, the previous studies suggest that IFRS adoption leads to higher quality accounting
numbers and less asymmetric, more transparent financial disclosure. For these reasons, this study
considers the adoption of IFRS as a proxy of the improved transparency. For each firm-year
observation, the IFRS variable is equal to one, if the firm prepares its financial statements in
accordance with the IFRS, and zero, otherwise.
The information about the accounting standards that used to prepare the firm’s financial
statements was obtained from DataStream database. The DataStream code (WC07536) provides

103
information about the accounting standards followed in preparing the financial statements for a
specific firm. Table 4.2 provides a detailed description of the Worldscope code (WC07536)
classification of the accounting standards followed by each firm. DataStream identifies 23
different accounting standards that are used by firms to prepare the financial statements. This
identification ranges from local accounting standards (07536 = 1), International Accounting
Standards (IAS) pronounced by International Accounting Standards Committee IASC ( 07536 =
2), U.S. standards (07536 =3), accounting standards that adopt local standards with other
gridlines (07536 = 08, 10, 17) , or other hybrid type accounting standards that adopt local
standards along with international accounting standards (07536 = 18,19).2 This thesis follows
Kim and Shi (2012a), by identifying the firm as an IFRS adopter, if it adopts a full set of IFRS or
IAS (07536 = 02 or 23), and marked as a non-adopter if it adopts any other accounting standards.
In particular, if the firm adopts IAS or IFRS with another set of accounting standards, then this
firm is considered as a non-adopter.
Table 4-2 Worldscope description of Accounting followed (Field 07536)
Worldscope fields 07536 Worldscope description
1 Local standards
2 International standards
3 U.S. standards (GAAP)
4 Commonwealth countries standards
5 EU standards
6 International standards and some EU guidelines
7 Specific standards set by the group
8 Local standards with EU and IASC guidelines
9 Not disclosed
10 Local standards with some EU guidelines
11 Local standards – inconsistency problems
12 International standards – inconsistency problems
13 US standards – inconsistency problems
14 Commonwealth standards – inconsistency problems
15 EEC standards – inconsistency problems
16 International standards and some EU guidelines – inconsistency
problems
17 Local standards with some OECD guidelines
18 Local standards with some IASC guidelines
2 The information about Worldscope accounting standards classifications is retrieved from Thomson Reuters (2012)
website.

104
19 Local standards with OECD and IASC guidelines
20 US GAAP reclassified from local standards
21 Local standards with a certain reclassification for foreign companies
22 Other
23 IFRS
4.7.2.2 Second study independent variable (Earnings Quality)
Given the fact that, the accruals quality models have been shown to be the most popular model in
measuring earnings quality (Dechow et al., 2010), the measurement of earnings quality related to
accruals quality is used in this study. The previous earnings quality literature provides different
models to estimate the accruals quality. However, Dechow et al. (2010) reviewed more than 300
papers on earnings management determinants and consequences, and claims that the Jones
(1991) Model, and the Modified Jones (1995) Model, are the top two in the list of the most
commonly used measures of earnings quality.
For this reason, this research considers the discretionary accruals estimated by the Jones model
as modified by Dechow et al. (1995) as the main measure of earnings quality, while the
discretionary accruals estimated by the Jones (1991) model will be used in the sensitivity
analysis tests.
This approach is consistent with previous research in this area, including Rajgopal and
Venkatachalam (2011), Mouselli, Jaafar, and Hussainey (2012), Ismail et al. (2013), and
Doukakis (2014), by using the magnitude of discretionary accruals model, as modified by
Dechow et al. (1995), to measure the quality of earnings.
To estimate the firm’s discretionary accruals, first there is a need to calculate the firm’s total
accruals; the firm’s total accruals can be calculated either by using a cash flow approach or
balance sheet (statement of financial position) approach.
Hribar and Collins (2002) noted that calculating total accruals using the cash flow approach is
superior to the balance sheet approach because the balance sheet approach suffers from serious
measurement errors. They present evidence that the estimation error arising from the balance
sheet approach has been transmitted to the estimated discretionary accruals. Therefore, this

105
mechanical effect would lead to the wrong findings and conclusions, whereby the acceptance or
rejection of the hypothesis might be significantly influenced by the measurement error that is
caused by the employment of the balance sheet approach (Hribar & Collins, 2002). For these
reasons, this present study employs the cash-flow approach in calculating the firm's total
accruals, rather than a balance-sheet approach.
Following Jo and Kim (2007), and Doukakis (2014) the total accruals, based on the cash flow
approach, is calculated as follows:
Total Acculas (TA) = NIBEX – CFO (3)
Where:
NIBEX = Net income before extraordinary items.
CFO= cash flow from operating activities.
The data for the firm’s net income before extraordinary items and the data for firm’s cash flow
from operation obtained from DataStream database.
Following Kothari et al. (2005), the equation for nondiscretionary accruals for the Modified
Jones Model (1995) is expressed as follows:
𝑁𝐷𝐴𝐶𝐶𝑖,𝑡 = 𝛼𝑖,𝑡1/𝐿𝑇𝐴 + 𝛼1(∆𝑅𝐸𝑉𝑖,𝑡 − ∆𝑅𝐸𝐶𝑖,𝑡/𝐿𝑇𝐴𝑖,𝑡) + 𝛼2𝑃𝑃𝐸𝑖,𝑡/𝐿𝑇𝐴𝑖,𝑡 (4)
Where
𝑁𝐷𝐴𝐶𝐶𝑖,𝑡 = non-discretionary accruals for firm 𝑖 in year 𝑡.
𝐿𝑇𝐴𝑖,𝑡= lagged total assets for firm 𝑖 in year 𝑡.3
∆𝑅𝐸𝑉𝑖,𝑡 = change in revenues for firm 𝑖 in year 𝑡.
∆𝑅𝐸𝐶𝑖,𝑡 = change in account receivable for firm 𝑖 in year 𝑡.
3 All the variables are divided by lagged total assets to reduce heteroscedasticity (Jones, 1991).

106
𝑃𝑃𝐸𝑖,𝑡 = property, plant and equipment for firm 𝑖 in year 𝑡.
To calculate the nondiscretionary accruals using the Modified Jones Model (1995), it is
necessary to estimate the coefficients𝜶𝒊,𝒕, 𝜶𝟏, and 𝜶𝟐, for the above model. The ordinary least
squares (OLS) linear regression was used to estimate the coefficients parameters for each
industry for each year. Running the regression for each industry in each year partially controls
for industry level changes in economic conditions, that affect total accruals and allows the
coefficients to vary across time (Doukakis, 2014)
Consistent with the approach used by Athanasakou, Strong, and Walker (2009), industries with
less than six observations in each year were removed from the sample, because of the lack of
quorum in calculating the coefficient. The industry classification was based on the two digits SIC
code classification.
In order to obtain the coefficients for the model in e.q (4) the author estimates the following
cross-sectional regression model using the firms in each two digit SIC code for each year
between 1990 and 2013:
𝑇𝐴𝑖,𝑡
𝐿𝑇𝐴𝑖,𝑡= 𝛼 (
1
𝐿𝑇𝐴𝑖,𝑡) + 𝛼1
(∆𝑅𝐸𝑉𝑖,𝑡)
𝐿𝑇𝐴𝑖,𝑡+ 𝑎2 (
𝑃𝑃𝐸𝑖,𝑡
𝐿𝑇𝐴𝑖,𝑡) + 𝜀𝑖,𝑡 (5)
Where:
𝑇𝐴𝑖,𝑡 = total accrual for firm 𝑖 in year 𝑡.
𝐿𝑇𝐴𝑖,𝑡 = lagged total asset for firm 𝑖 in year 𝑡.
∆𝑅𝐸𝑉𝑖,𝑡 = change in revenues for firm 𝑖 in year 𝑡.
𝑃𝑃𝐸𝑖,𝑡 = property, plant and equipment for firm 𝑖 in year 𝑡.
The coefficient from this regression model is used to calculate the nondiscretionary accruals
(NDACC) based on the Modified Jones (1995) Model and the Jones (1991) model. Finally, the
discretionary (abnormal) accruals represent the difference between total accruals and the fitted
normal accruals as follows:
𝐴𝐴𝐶𝑖,𝑡 = (𝑇𝐴𝑖,𝑡/𝐿𝑇𝐴) − 𝑁𝐷𝐴𝐶𝐶𝑖,𝑡 (6)
107
Where:
𝐴𝐴𝐶𝑖,𝑡 = abnormal accruals for firm 𝑖 in year 𝑡.
𝑇𝐴𝑖,𝑡 = total accrual for firm 𝑖 in year 𝑡.
𝐿𝑇𝐴𝑖,𝑡 = lagged total asset for firm 𝑖 in year 𝑡.
𝑁𝐷𝐴𝐶𝐶𝑖,𝑡 = non-discretionary accruals for firm 𝑖 in year 𝑡.
The earnings quality for each firm is estimated through the absolute value of the abnormal
accruals(|𝐴𝐴𝐶𝑖,𝑡|). The large quantity of absolute value of abnormal accruals indicates low
earnings quality and vice versa. Using the absolute value of abnormal accruals as a proxy for
earnings quality is in line with numerous prior studies, including Watrin and Ullmann (2012),
Mouselli et al. (2012), Hutton et al. (2009) and Kothari et al. (2005).
4.7.3 Control Variables
This section presents the control variables that are included in the regression model. These
variables have been chosen precisely after a careful examination of the stock price synchronicity
literature. The previous literature finds or suggests a relationship between these variables and
stock price synchronicity. For this reason, this research will include these variables in the
regression model to control for the potential effect of these variables on stock price
synchronicity. Including these variables in the regression model helps to better measure the
effect of mandatory IFRS adoption and earnings quality on stock price synchronicity, as a proxy
for stock price informativeness.
4.7.3.1 Firm size
Firm size, whether measured by firm’s total asset (Paananen & Lin, 2009) , or firm’s total market
value of equity (Barth et al., 2008; Boubaker et al., 2014; Brochet et al., 2013; Chan & Hameed,
2006; Devalle et al., 2010; Kim & Shi, 2012a; Lee & Liu, 2011; Oswald & Zarowin, 2007) has
been proved by prior literature to has a positive relation with stock price synchronicity.
108
Piotroski and Roulstone (2004) argue that including firm size on the regression model helps in
controlling for omitted firm-specific factors. Where they mention that firm size is positively
associated with various aspects of the firm's information environment, including media coverage
and overall levels of investor interest. Differences in firms' information environments could
influence stock return synchronicity. In addition, they argue that small firms consider large firms
to be market leaders, which results in a higher stock price synchronicity for large firms.
Moreover Bhushan (1989) argues that the firm size will affect the analysts’ activity, where the
large firms tend to attract more financial analysts. Many researchers have found that the firms
with more analysts-following, experience high stock price synchronicity because the financial
analysts tend to provide market-wide information rather than firm-specific information (Chan &
Hameed, 2006; Piotroski & Roulstone, 2004); for this reason the firm size is expected to have
positive effect on stock price synchronicity. This research uses firm’s total asset at the end of
fiscal year as a proxy for firm size.
4.7.3.2 Growth opportunity
The firms with high growth opportunities are expected to have lower stock price synchronicity.
Beuselinck et al. (2010) suggest that firms with high growth opportunity are likely to have higher
firm-specific return variation because of their intrinsic risk factors. In addition Chun, Kim,
Morck, and Yeung (2008) argue that high growth opportunity may be related to high firm-
specific return variation, because the firms with high growth opportunities also have high
intrinsic risk factors. Moreover, Hutton et al. (2009) suggest that the market-to-book ratio places
firms along with growth-versus-value spectrum and thus could be systematically related to firm-
specific return variation.
Following the outcomes of An and Zhang (2013), Bae et al. (2013), Hasan et al. (2014), He et al.
(2013), Gul et al. (2010), and Hutton et al. (2009) the ratio of market value of equity to book
value of equity will be used as one of the regression model control variables. The data for market
to book value will be obtained from the DataStream database.

109
4.7.3.3 Financial leverage
Chun et al. (2008) suggest that the firm’s leverage and capital structure may affect firm stock
price synchronicity, where they find that the firms with higher leverage have a more volatile
stock return. The firm’s financial leverage is expected to have an effect on synchronicity through
its impact on the sensitivity of firms’ return to macroeconomic conditions and because it affects
the division of risk bearing between equity shareholders and debtors (Hutton et al., 2009).
Beuselinck et al. (2010) expect a positive relationship between firm-specific return variation and
a firm’s financial leverage ratio, as they suggest that the firms with high financial leverage have
higher intrinsic risk factors which may enforce the investors to collect more firm-specific
information.
To control for the potential effect of firm leverage levels on stock price synchronicity, many
researchers include the leverage ratio in their regression model (Gul et al., 2010; Gul, Srinidhi, et
al., 2011; Kim & Shi, 2012a). Following on from the prior literature the firm’s financial leverage
ratio, as measured by the firm’s total debts to total assets, will be included in the regression
model to control for the effect of firm’s financial leverage on stock price synchronicity. The data
needed to measure the firms’ financial leverage will be obtained from the DataStream database.
4.7.3.4 Firm performance (ROA)
Firm’s performance and profitability, as measured by the ratio of net income to total assets is
believed to have a relationship with stock price synchronicity. Ben-Nasr and Cosset (2014), and
Gul, Srinidhi, et al. (2011) expect a positive relationship between return on assets and stock price
synchronicity, indicating that more profitable firms tend to have a less informative stock price.
4.7.3.5 Financial analysts-following
Financial analysts are considered as an important provider of information about the firm’s
operation and performance. Piotroski and Roulstone (2004) finnd that the firms with high
analysts-following have a high stock price synchronicity. They suggest that the financial analysts
act as a tunnel through which industry level and market level information are transferred into the
stock price. Chan and Hameed (2006) also finnd a positive relation between analysts-following

110
and stock price synchronicity, suggesting that financial analysts help in generating and
disseminating industry and market level information, instead of firm-level information, which
interprets the positive relationship between analysts-following and stock price synchronicity.
Because the previous research documented a significant relationship between analysts-following
and stock price synchronicity, the analysts-following will be one of this thesis’s control
variables. Consistent with the previous research the intensity of financial analysts’ activity will
be measured using the number of analysts who issued one-year earnings per share forecast for a
firm, during a given calendar year. The data for the number of analysts who issue earning per
share forecast are to be obtained from I/B/E/S international, which can be accessed through the
DataStream, using the code number (EPS1NE) in the database.
4.7.3.6 Industry concentration
Industry structure may affect the movement of stock prices for firms inside this industry;
Piotroski and Roulstone (2004) suggest that when the industry is more concentrated the
possibility that the performance of firms in this industry is interdependent upon each other is
high, and the induction of news related to any firm, is considered as value relevant for all other
firms in that industry. They measure the amount of industry concentration based on the two-digit
SIC code industry’s Herfindahl index for the year. Where the higher Herfindahl index means the
industry share is concentrated in the hand of few large firms. Hence, Piotroski and Roulstone
(2004) expect a positive relation between industry concentration and stock price synchronicity.
Many other researchers control for the potential effect of industry concentration on stock price
synchronicity (Beuselinck et al., 2010; Bissessur & Hodgson, 2012; Fernandes & Ferreira, 2008;
Loureiro & Taboada, 2012). In the current study the industry concentration is calculated by
Herfindahl index according to (Fernandes & Ferreira, 2008; Piotroski & Roulstone, 2004) that is,
is the sum of the square of each firm’s market share within each industry sector based on its
revenue, relative to the total revenues of the industry firm sector.

111
4.7.3.7 Number of firms in the industry
The number of firms in the industry to which the company belongs has been used by many
researchers as one of the control variables of stock price synchronicity. Durnev et al. (2003)
suggest that including the number of firms in the industry in the regression model helps in
controlling for differences in synchronicity, that result from differences in sample sizes. Kim and
Shi (2012a) include the number of firms in the industry in their regression model and find a
negative relation between a number of firms in the industry and firm-specific return variation.
Following Hasan et al. (2014), Yu et al. (2013), Kim and Shi (2012a), Gul et al. (2010), and
Durnev et al. (2003), the number of firms in the industry is included in the regression model as
one of the control variables when examining the relationship between accounting transparency
and earnings quality and stock price informativeness.
4.8.3.8 Industry size
Industry sector size is used in many research papers as a control variable to control for the
potential effect of industry characteristics on stock price synchronicity. Gul et al. (2010) measure
the industry size as the log of year-end total assets of all sample firms in the industry to which a
firm belongs, and include it as one of their control variables. Their results show a negative
relation between industry sector size and stock price synchronicity, which suggest that the stock
prices for firms in large industry sectors tend to commove more closely with the market and
industry than the stock prices of firms in small industries. Consistent with prior research of
Hasan et al. (2014), Yu et al. (2013), and Gul et al. (2010) the industry sector size, as measured
by industry total assets, is used in this study to control for the potential effect of industry sector
size on stock price synchronicity. The data required to calculate industry size will be collected
from the DataStream database.
4.7.3.9 Variance of industry return
The changes in stock prices are caused by the introduction of either firm-specific information
and/or industry or market-wide information. The market-wide information is related to the
systematic risk factors and affects all the firms in the industry or the market and the induction of

112
this kind of information increase the comovement of stock price, hence the stock price
synchronicity. Hutton et al. (2009) try to control for the effect systematic risk on stock price
synchronicity; they include the variance of the weekly industry index in their regression model,
because higher industry variance increases systematic risk, and hence stock price synchronicity.
As expected, Hutton et al. (2009) find a significant positive relationship between industry return
variance and stock price synchronicity. Following Hutton et al. (2009) the industry variance
calculated as the industry weekly return variance during the firm’s fiscal year, the required data
to calculate industry weekly variance are obtained from the DataStream database.
4.7.3.10 the Financial Crisis
The financial crisis was one of systematic risk factors that affected all the stocks in the market, is
expected to have a positive impact on the firm’s stock price synchronicity. Reinhart and Rogoff
(2009) note that during The Financial Crisis, the UK equity stock prices collapsed by about fifty
per cent on average, meaning that all the UK firms’ stock prices fell during this period. Hutton et
al. (2009) suggest that systematic risk leads to a higher comovement of stock prices. For these
reasons it is expected that the financial crises will have a positive effect on synchronicity because
the financial crisis affects all stocks in the market leading to high comovement of stock prices,
hence higher stock price synchronicity. The financial crisis period is identified to be from 2008
till 2012, so to construct this variable the years from 2008 to 2012 will have the value of one and
all other years will have the value of zero.
4.8 Empirical models for hypothesis testing
The previous chapter contains the development of the research hypotheses of the expected
effect of accounting transparency and earnings quality on the informativeness of the stock
price. To execute the testing process of these hypotheses effectively, the study performs
univariate, bivariate, and multivariate analysis. Univariate analysis is employed because it
helps in increasing the understanding of the properties of individual variables, before
proceeding to the estimation of the regression models (Koop, 2006).

113
In line with the univariate analysis, the study employs bivariate analysis to observe whether
the variables are associated with each other directly, by viewing the value, the direction, and
the significant level of the correlation coefficients.
The research hypotheses are mainly tested by referring to the results of multivariate
regression analysis, because the multivariate analysis provides an estimation of the effect of
the independent variables on the dependent variable, after rolling out the effects of control
variables.4
The reason for undertaking both types of analysis is to ensure that not only the relationships
between a particular dependent variable and each of the independent variables are known, but
also that the relationship between a particular independent variable with both the dependent
and other independent variables is established (Norusis, 2011).
4.8.1 First Study Empirical Models
4.8.1.1 Empirical Model for Testing the Effect of IFRS Adoption on the Stock Price Synchronicity
(H1).
The first hypothesis is concerned with examining whether mandatory IFRS adoption leads to a
more informative stock price, as measured by the firm-specific return variation.
To examine the relationship between the mandatory adoption of International Financial
Reporting Standards (IFRS) and stock price informativeness, this research will estimate the
following pooled cross-sectional time series model:
𝑆𝑌𝑁𝐶𝐻1𝑖,𝑡 = 𝛼0 + 𝛽1𝐼𝐹𝑅𝑆𝑖,𝑡 + 𝛽2𝑆𝐼𝑍𝐸𝑖,𝑡 + 𝛽3𝐺𝑅𝑂𝑃𝑃𝑖,𝑡 + 𝛽4𝐿𝐸𝑉𝑖,𝑡 + 𝛽5𝑅𝑂𝐴𝑖,𝑡 + 𝛽6𝐴𝑁𝐴𝐿𝑌𝑆𝑇𝑖.𝑡 + 𝛽7𝐼𝑁𝐷 −
𝑁𝑈𝑀𝑖,𝑡 + 𝛽8𝐼IND − SIZE𝑖,𝑡 + 𝛽9𝐻𝐸𝑅𝐹_𝐼𝑁𝐷𝑋𝑖,𝑡 + 𝛽10IND − VAR𝑖,𝑡 + 𝛽11𝐶𝑅𝐼𝑆𝑖𝑆𝑖,𝑡 + 𝐼𝑁𝐷𝑈𝑆𝑇𝑅𝑌 + 𝜀𝑖,𝑡
(7)
Where, 𝑆𝑌𝑁𝐶𝐻1 is stock price synchronicity for firm i in year t as calculated by e.q. (1). IFRS is
an indicator variable that takes the value of 1 if the firm use IFRS and the value of 0 otherwise.
Note that IFRS is not strictly a time-indicator variable: it varies on the firm’s mandatory
adoption of IFRS, which can occur effective 2005, 2006, 2007, and 2008. Table 4.3 provides full
description for the variables.
4 Section 4.7 provides full discussion of the method of analysis employed in this study.
114
The variable of interest in this model is the IFRS. If mandatory IFRS adoption facilitates the
incorporation of firm-specific information into the stock price, then we predict that SYNCH1 is
negatively related with IFRS variable. That is, improved transparency after mandatory adoption
of IFRS; facilitates the incorporation of firm-specific information into the stock price, leading to
more firm-specific return variation (i.e. lower stock price synchronicity), and thus increase the
informativeness of the stock price. This will lead to acceptance of the first hypothesis. Using a
single dummy variable to examine the effect of IFRS adoption is consistent with the
methodology used by Bissessur and Hodgson (2012), Brochet et al. (2013), and Moscariello et
al. (2014).
As a sensitivity test, re-examination of the above model is undertaken using a different measure
of stock price synchronicity; where the stock piece synchronicity, as measured by regressing
firm’s weekly return with weekly market return and weekly industry return, is used in the
regression model instead of using stock price synchronicity as measured by equation number (1).
4.8.2 Empirical Model for Testing the Effect of IFRS Adoption on the Stock Price Synchronicity (H2).
The second hypothesis H2 is concerned with examining whether if there is an initial decrease in
synchronicity at the time of IFRS adoption, followed by a subsequent increase in the latter
periods. To test this effect Houqe et al. (2014), and Li (2010) research is followed, by excluding
the transition period from the analysis. More specifically, the data for the years from 2005 to
2007 was excluded, because these are years of transition to IFRS with different adoption dates.
In addition, the data for the year 2008 is excluded to avoid the effect of lack of IFRS history and
knowledge on which investor can make their decisions, as suggested by Ball (2006).
In addition, the methodology of Bissessur and Hodgson (2012) and Landsman et al. (2012) is
adopted, by adding year dummies on the IFRS period from 2009 until 2013. Whereas these
dummy variables take the value of 1 if the observations occur in 2009,2010,2011,2012, and
2013, respectively and zero otherwise. It’s worth mentioning that, the estimated coefficient for
the constant term 𝛼0represents the base level of stock price synchronicity for the pre IFRS
adoption period, and each of the coefficients on the IFRS years’ dummies present the
incremental change relative to the baseline level of synchronicity after the adoption.
115
Therefore, the model to test the second hypothesis will be as follow:
𝑆𝑌𝑁𝐶𝐻1𝑖,𝑡 = 𝛼0 + 𝛽1𝐷_2009 + 𝛽2𝐷_2010 +𝛽3𝐷_2011 + 𝛽4𝐷_2012 + 𝛽5𝐷_2013 + 𝛽6𝑆𝐼𝑍𝐸𝑖,𝑡 +
𝛽7𝐺𝑅𝑂𝑃𝑃𝑖,𝑡 + 𝛽8𝐿𝐸𝑉𝑖,𝑡 + 𝛽9𝑅𝑂𝐴𝑖,𝑡 + 𝛽10𝐴𝑁𝐴𝐿𝑌𝑆𝑇𝑖.𝑡 + 𝛽11𝐼𝑁𝐷 − 𝑁𝑈𝑀𝑖,𝑡 + 𝛽12𝐼IND − SIZE𝑖,𝑡 +
𝛽13𝐻𝐸𝑅𝐹_𝐼𝑁𝐷𝑋𝑖,𝑡 + 𝛽14IND − VAR𝑖,𝑡 + 𝛽15𝐶𝑅𝐼𝑆𝑖𝑆𝑖,𝑡 + 𝐼𝑁𝐷𝑈𝑆𝑇𝑅𝑌 + 𝜀𝑖,𝑡 (8)
The variable of interest in this model is the coefficients for the year dummies. If the coefficients
for the early years of the adoption are negative and significant and the coefficients for the later
years of the adoption is positive and significant, then this provide a suggestion that higher
transparency that caused by mandatory IFRS adoption lead to initial decrease in stock price
synchronicity (compared with the pre-IFRS adoption period), then it leads to a subsequent
increase in stock price synchronicity during the later periods.
As a sensitivity test, the above model is re-examined using a different measure of stock price
synchronicity; where the stock piece synchronicity as measured by regressing firms weekly
return with the weekly market return and weekly industry return is used in the regression model
instead of using stock price synchronicity as measured by equation number (1).
As an additional robustness test, the researcher generates a dynamic variable to capture if
mandatory IFRS adoption leads to an initial decrease in synchronicity, followed by a subsequent
increase in the latter period. To do so, a new variable is generated called adoption age
(ADO_AGE) which represents the number of years since the firm adopt IFRS. Therefore, the
robustness test for hypothesis number (2) is as follows:
𝑆𝑌𝑁𝐶𝐻1𝑖,𝑡 = 𝛼0 + 𝛽1𝐴𝐷𝑂_𝐴𝐺𝐸𝑖,𝑡 + 𝛽2𝑆𝐼𝑍𝐸𝑖,𝑡 + 𝛽3𝐺𝑅𝑂𝑃𝑃𝑖,𝑡 + 𝛽4𝐿𝐸𝑉𝑖,𝑡 + 𝛽5𝑅𝑂𝐴𝑖,𝑡 + 𝛽6𝐴𝑁𝐴𝐿𝑌𝑆𝑇𝑖.𝑡 +
𝛽7𝐼𝑁𝐷 − 𝑁𝑈𝑀𝑖,𝑡 + 𝛽8𝐼IND − SIZE𝑖,𝑡 + 𝛽9𝐻𝐸𝑅𝐹_𝐼𝑁𝐷𝑋𝑖,𝑡 + 𝛽10IND − VAR𝑖,𝑡 + 𝛽11𝐶𝑅𝐼𝑆𝑖𝑆𝑖,𝑡 +
𝐼𝑁𝐷𝑈𝑆𝑇𝑅𝑌 𝐹𝐼𝑋𝐸𝐷 𝐸𝐹𝐹𝐸𝐶𝑇 + 𝜀𝑖,𝑡 (9)
If higher transparency, which associated with mandatory IFRS adoption, leads to an initial
reduction in stock price synchronicity followed by a subsequent increase in stock price
synchronicity during the latter periods, then one could expect a positive relation between
adoption age variable and stock price synchronicity. However, if the higher transparency
associated with mandatory IFRS adoption leads to a consistent reduction in stock price
synchronicity, then one could expect a negative relation between adoption age and stock price
synchronicity.
116
4.8.3 Empirical Model for Testing the Effect of Financial Analysts on the Relationship Between IFRS
Adoption and Stock Price Synchronicity (H 3)
To examine whether the effect of IFRS adoption on stock price synchronicity differs
systematically between firms with high analysts’ activities and those with low activities, the
researcher follows the methodology of Kim and Shi (2012a), by adding interaction term of
IFRS*ANALYST to the model number (7). The interaction term explains how the effect of one
predictor variable (IFRS) on the response variable (SYNCH1) is different at different values of
the other predictor variable (ANALYST), (Fitzmaurice, 2000). Therefore, the resulting empirical
model to test hypothesis number 3 is as follows:
𝑆𝑌𝑁𝐶𝐻1𝑖,𝑡 = 𝛼0 + 𝛽1𝐼𝐹𝑅𝑆𝑖,𝑡 + 𝛽2𝑆𝐼𝑍𝐸𝑖,𝑡 + 𝛽3𝐺𝑅𝑂𝑃𝑃𝑖,𝑡 + 𝛽4𝐿𝐸𝑉𝑖,𝑡 + 𝛽5𝑅𝑂𝐴𝑖,𝑡 + 𝛽6𝐴𝑁𝐴𝐿𝑌𝑆𝑇𝑖.𝑡 + 𝛽7𝐼𝑁𝐷 −
𝑁𝑈𝑀𝑖,𝑡 + 𝛽8𝐼IND − SIZE𝑖,𝑡 + 𝛽9𝐻𝐸𝑅𝐹_𝐼𝑁𝐷𝑋𝑖,𝑡 + 𝛽10IND − VAR𝑖,𝑡 + 𝛽11𝐶𝑅𝐼𝑆𝑖𝑆𝑖,𝑡+𝛽12 𝐼𝐹𝑅𝑆 ∗ 𝐹𝑂𝐿𝐿 +
𝐼𝑁𝐷𝑈𝑆𝑇𝑅𝑌 𝐹𝐼𝑋𝐸𝐷 𝐸𝐹𝐹𝐸𝐶𝑇 + 𝜀𝑖,𝑡 (10)
The variable of interest in this model is the interaction term between IFRS and ANALYST. The
significant positive coefficient for the interaction term variable, 𝐼𝐹𝑅𝑆 ∗ 𝐹𝑂𝐿𝐿, means that within
the mandatory IFRS adopters, the firms that are followed by a higher number of financial
analysts have higher stock price synchronicity, than those followed by lower number of financial
analysts.
As a sensitivity test the above model (10) is re-examined using a different measure of stock price
synchronicity; where the stock piece synchronicity as measured by regressing firms weekly
return with weekly market return and weekly industry return is used in the regression model
instead of using stock price synchronicity as measured by equation number (1).
4.8.2 Second Study Empirical Models
4.8.2.1 Empirical Model for Testing the Effect of Earning Quality on Stock Price Synchronicity (H4)
The fourth hypothesis is concerned with the impact of earning quality, as measured by accruals
quality, on the ability of stock price to incorporate firm-specific information, as measured by
stock price synchronicity. To test H4 the author estimated the following pooled cross-sectional
time series regression model:

117
𝑆𝑌𝑁𝐶𝐻1𝑖,𝑡 = 𝛼0 + 𝛽1𝑀𝐽_𝑀𝑂𝐷𝐸𝐿𝑖,𝑡 + 𝛽2𝑆𝐼𝑍𝐸𝑖,𝑡 + 𝛽3𝐺𝑅𝑂𝑃𝑃𝑖,𝑡 + 𝛽4𝐿𝐸𝑉𝑖,𝑡 + 𝛽5𝑅𝑂𝐴𝑖,𝑡 + 𝛽6𝐴𝑁𝐴𝐿𝑌𝑆𝑇𝑖.𝑡 +
𝛽7𝐼𝑁𝐷 − 𝑁𝑈𝑀𝑖,𝑡 + 𝛽8𝐼𝐼𝑁𝐷 − 𝑆𝐼𝑍𝐸𝑖,𝑡 + 𝛽9𝐻𝐸𝑅𝐹_𝐼𝑁𝐷𝑋𝑖,𝑡 + 𝛽10𝐼𝑁𝐷 − 𝑉𝐴𝑅𝑖,𝑡 + 𝛽11𝐶𝑅𝐼𝑆𝑖𝑆𝑖,𝑡 +
𝐼𝑁𝐷𝑈𝑆𝑇𝑅𝑌 𝐹𝐼𝑋𝐸𝐷 𝐸𝐹𝐹𝐸𝐶𝑇 + 𝑌𝐸𝐴𝑅 𝐹𝐼𝑋𝐸𝐷 𝐸𝐹𝐹𝐸𝐶𝑇 (11)
In this model the dependent variable (SEYNCH1), refers to stock price synchronicity, which
represents the part of stock return that can be explained by market return and industry return. The
high value of stock price synchronicity indicates that the stock price tends to commove with the
market return and the industry return, meaning lower firm-specific information is reflected into
the stock price, thus a less informative stock price.
The variable of interest is the coefficient of the MJ_Model variable, which captures the
incremental change in stock price synchronicity for UK firms, referring to one-unit increase in
discretionary accruals. A positive coefficient on 𝛽1 is consistent with the encouragement effect
of earnings quality on stock price synchronicity, that the higher earnings quality reduce the
information cost, which encourage investors to collect and process more firm-specific
information, leading to more capitalisation of firm-specific information into the stock price, thus
creating a more informative stock price, and this results in lower stock price synchronicity.
As a sensitivity test the above model (11) was re-examined using a different measure of stock
price synchronicity; where the stock price synchronicity as measured by regressing firms weekly
return with weekly market return and weekly industry return is used in the regression model
instead of using stock price synchronicity as measured by equation number (1).
In addition, the researcher re-examines the above model (model number 11) using a different
measure of earnings quality; where earnings quality as estimated by the Jones (1991) model is
used in the regression model instead of the Modified Jones model (1995).
4.8.2.2 Empirical Model for Testing the Effect of IFRS Adoption on the Relationship between
Earning Quality and Stock Price Informativeness (H5+H6)
The fifth and sixth hypotheses are concerned with the effect of mandatory adoption of IFRS in
the relationship between earning quality and stock price synchronicity. To test these hypotheses,
the model (11) was run for post-IFRS adoption sample and for pre-IFRS adoption sample
separately, to see if the coefficient of earnings quality variable differs between the two samples.
118
After that, the author examined if the differences between earning quality coefficient for post-
IFRS sample and pre-IFRS sample were significant or not.
To do this analysis, a dummy variable was created, called IFRS that coded 1 for post-IFRS
sample and 0 for pre-IFRS sample and, and generate a new variable called IFRS_MJM that is the
product of the interaction between IFRS and MJ_model variables. The author then used IFRS
and IFRS_MJM variables as predictors in the regression equation. Therefore, the following
regression model is used to test the sixth and seventh hypotheses:
𝑆𝑌𝑁𝐶𝐻1𝑖,𝑡 = 𝛼0 + 𝛽1𝑀𝐽_𝑀𝑂𝐷𝐸𝐿𝑖,𝑡 + 𝛽2𝑆𝐼𝑍𝐸𝑖,𝑡 + 𝛽3𝐺𝑅𝑂𝑃𝑃𝑖,𝑡 + 𝛽4𝐿𝐸𝑉𝑖,𝑡 + 𝛽5𝑅𝑂𝐴𝑖,𝑡 +
𝛽6𝐴𝑁𝐴𝐿𝑌𝑆𝑇𝑖.𝑡 + 𝛽7𝐼𝑁𝐷 − 𝑁𝑈𝑀𝑖,𝑡 + 𝛽8𝐼𝐼𝑁𝐷 − 𝑆𝐼𝑍𝐸𝑖,𝑡 + 𝛽9𝐻𝐸𝑅𝐹_𝐼𝑁𝐷𝑋𝑖,𝑡 + 𝛽10𝐼𝑁𝐷 − 𝑉𝐴𝑅𝑖,𝑡 +
𝛽11𝐶𝑅𝐼𝑆𝑖𝑆𝑖,𝑡 + 𝛽12𝐼𝐹𝑅𝑆 + 𝛽13𝐼𝐹𝑅𝑆 ∗ 𝑀𝐽𝑀𝑂𝐷𝐸𝐿 𝑖,𝑡+ 𝐼𝑁𝐷𝑈𝑆𝑇𝑅𝑌 𝐹𝐼𝑋𝐸𝐷 𝐸𝐹𝐹𝐸𝐶𝑇 +
𝑌𝐸𝐴𝑅 𝐹𝐼𝑋𝐸𝐷 𝐸𝐹𝐹𝐸𝐶𝑇 + 𝜀𝑖,𝑡 (12)
The variable of interest is the coefficient on the interaction term variable (𝐼𝐹𝑅𝑆 ∗ 𝑀𝐽 − 𝑀𝑂𝐷𝐸𝐿)
variable, which tests if the coefficient for earnings quality variable for post IFRS sample is
significantly different from that for pre IFRS sample captures. The significant positive
coefficient for the interaction term variable ( 𝐼𝐹𝑅𝑆 ∗ 𝑀𝐽 − 𝑀𝑂𝐷𝐸𝐿) suggests that, the mandatory
IFRS adoption significantly improves the relationship between earnings quality and stock price
synchronicity (the ability of earnings quality to predict stock price synchronicity).
As a sensitivity test the above model was re-examined (model number 12) using a different
measure of stock price synchronicity; where the stock piece synchronicity as measured by
regressing firms weekly return with weekly market return and weekly industry return is used in
the regression model instead of using synchronicity as measured by equation number (1).
In addition, the above model (model number 12) is re-examined using a different measure of
earnings quality; where earnings quality as estimated by the Jones (1991) model is used in the
regression model instead of the Modified Jones model (1995).

119
Table 3-3 Summary of Research Variable and Their Measurement.
Variable Name Variable Description
Panel A dependent variable
Stock price Synchronicity1
(SYNCH1)
stock price synchronicity as calculated by the following model 𝑅𝐸𝑇𝑖,𝑤 = 𝛼 + 𝛽1𝑀𝐾𝑅𝐸𝑇𝑊1 +
𝛽2𝑀𝐾𝑅𝐸𝑇𝑊−1 + 𝛽3𝐼𝑁𝐷𝑅𝐸𝑇𝑖,𝑤1 + 𝛽4𝐼𝑁𝐷𝑅𝐸𝑇𝑖,𝑤−1 + 𝜀𝑖, 𝑤
Stock price Synchronicity2
(SYNCH2)
stock price synchronicity as calculated by the following model 𝑅𝐸𝑇𝑖,𝑤 = 𝛼 + 𝛽1𝑀𝐾𝑅𝐸𝑇𝑊1 +
𝛽3𝐼𝑁𝐷𝑅𝐸𝑇𝑖,𝑤1 + 𝜀𝑖, 𝑤
Panel B independent variables
Modefied Jones model
(MJ_Model)
Absolute value of discretionary accruals as estimated by using the Modified Jones (1995) model
Jones Model (J_Model) Absolute value of discretionary accruals as estimated by using the Jones (1991) model
Panel C control variables
Firm size (SIZE) Firm’s total asset at the end of fiscal year.
Growth opportunity (M/B) The ratio of market value of equity to the book value of equity.
Return on asset (ROA Firm return on asset as calculated by dividing net income by total assets.
Financial leverage (LEV) The firm’s total debt divided by the firm’s total assets.
Financial analysts-following
(FOLL)
Natural log of one plus number of analysts providing one year earnings per share (EPS)
forecast for a firm.
Industry concentration
(HERF_INDX)
Revenue-based Herfindahl index of industry-level concentration.
Industry size (IND_SIZE) Log of year-end total assets of all sample firms in the industry to which a firm belong. And the
number of firms in each industry.
Industry number
(IND_NUMB)
A total number of firms in the industry to which a firm belong.
Variance of industry return Variance of Industry weekly returns during the firm’s fiscal year.

120
(VAR_IND_RET)
The financial crisis
(CRISES)
Dummy variable, take the value of one for The Financial Crisis period for the years
2008,2009,2010,2011,2012 and zero otherwise
Adoption Age (ADO_AGE) The number of years since the firm adopts IFRS.
LAMDA The invers mills ratio obtained from first stage regression model
121
Chapter Five: First Study Empirical results (Accounting transparency and
stock price informativeness.)
This chapter presents the empirical-analytical tests that were performed to examine the effect of
accounting transparency, as measured by the mandatory adoption of IFRS, on stock price
informativeness, as inversely measured by stock price synchronicity. The empirical analysis
contains several types of tests including descriptive statistics for variables of interest, correlation
analysis, bivariate regression, and multivariate regression. In addition, this study conducts some
additional robustness tests to chick the validity of results, after reasonable changes in
methodology.
5.1 Descriptive Statistics
This section discloses the descriptive statistics for the research sample firms. The aim of
descriptive statistics is to provide an overview of the research results and describe the main
features of the sample.
5.1.1 Sample Description
The initial sample consists of all the firms listed on the London Stock Exchange (LSE) with
available data on DataStream, Worldscope, and Institutional Brokers Estimate System (I/B/E/S)
databases for the period between 1990 and 2013, the initial sample consist of (25,240) firm-year
observations. Following prior research banking, insurance, and other financial sector firms with
SIC code 6000-6999 were excluded from the sample. These industries were excluded from the
sample because these industries have special regulations and financial accounting standards and
the inclusion of these industries in the sample may distort the research results. Other exclusions
are the firms with no available data to calculate the independent variable, stock price
synchronicity, and any of the independents or control variables. After applying the previous
procedures, the final sample consists of 6,367 firm-year observation collected from 970 UK
firms.
Table 5-1 Yearly Distribution for First Study Sample.
Year Number of firms Percent Cum.
1990 61 0.99 0.99
1991 67 1.05 2.04
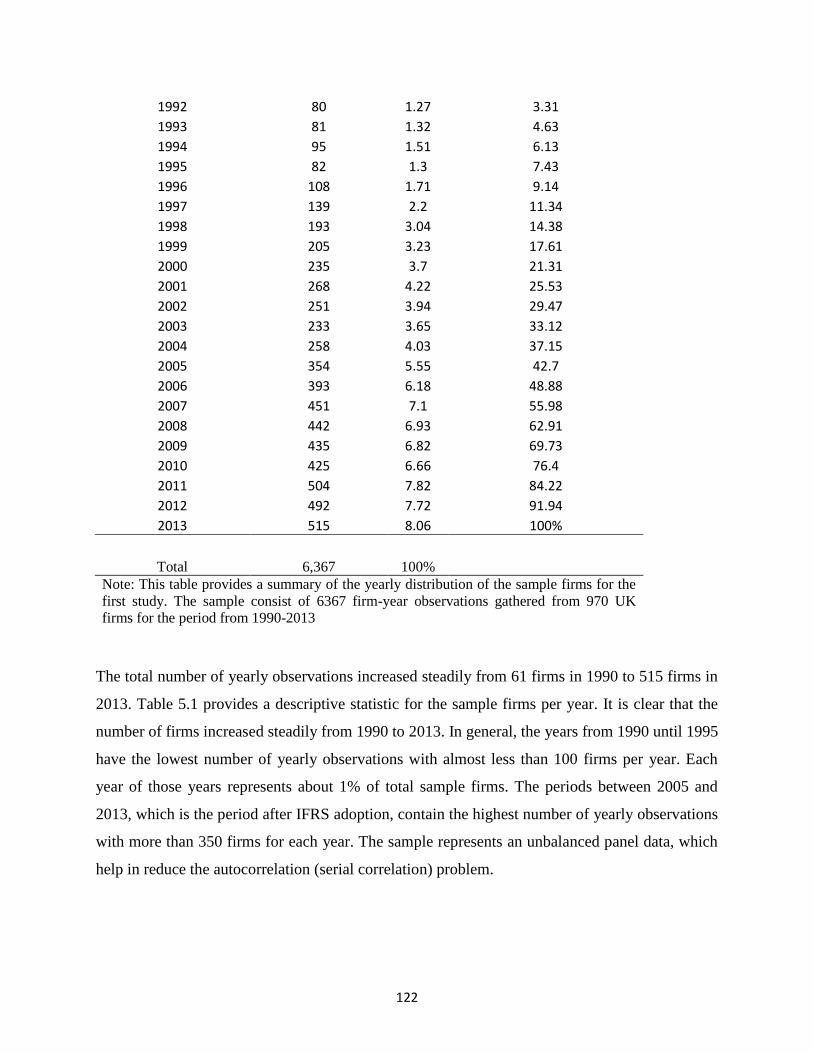
122
1992 80 1.27 3.31
1993 81 1.32 4.63
1994 95 1.51 6.13
1995 82 1.3 7.43
1996 108 1.71 9.14
1997 139 2.2 11.34
1998 193 3.04 14.38
1999 205 3.23 17.61
2000 235 3.7 21.31
2001 268 4.22 25.53
2002 251 3.94 29.47
2003 233 3.65 33.12
2004 258 4.03 37.15
2005 354 5.55 42.7
2006 393 6.18 48.88
2007 451 7.1 55.98
2008 442 6.93 62.91
2009 435 6.82 69.73
2010 425 6.66 76.4
2011 504 7.82 84.22
2012 492 7.72 91.94
2013 515 8.06 100%
Total 6,367 100%
Note: This table provides a summary of the yearly distribution of the sample firms for the
first study. The sample consist of 6367 firm-year observations gathered from 970 UK
firms for the period from 1990-2013
The total number of yearly observations increased steadily from 61 firms in 1990 to 515 firms in
2013. Table 5.1 provides a descriptive statistic for the sample firms per year. It is clear that the
number of firms increased steadily from 1990 to 2013. In general, the years from 1990 until 1995
have the lowest number of yearly observations with almost less than 100 firms per year. Each
year of those years represents about 1% of total sample firms. The periods between 2005 and
2013, which is the period after IFRS adoption, contain the highest number of yearly observations
with more than 350 firms for each year. The sample represents an unbalanced panel data, which
help in reduce the autocorrelation (serial correlation) problem.
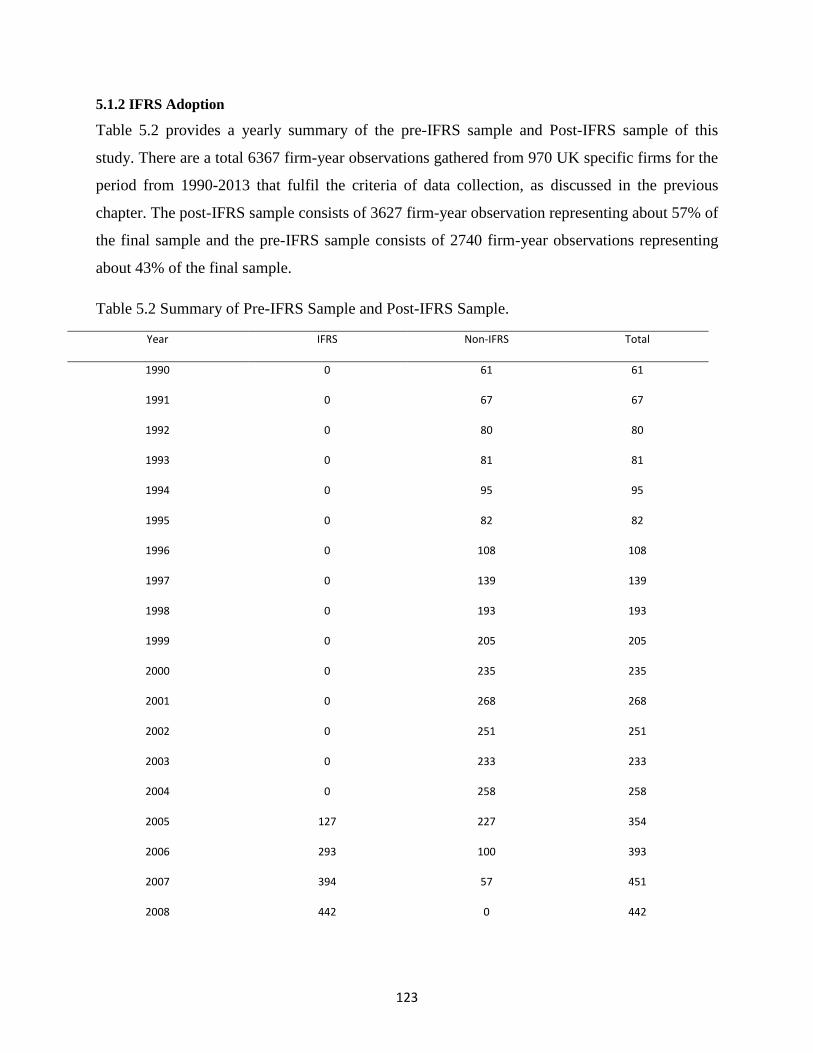
123
5.1.2 IFRS Adoption
Table 5.2 provides a yearly summary of the pre-IFRS sample and Post-IFRS sample of this
study. There are a total 6367 firm-year observations gathered from 970 UK specific firms for the
period from 1990-2013 that fulfil the criteria of data collection, as discussed in the previous
chapter. The post-IFRS sample consists of 3627 firm-year observation representing about 57% of
the final sample and the pre-IFRS sample consists of 2740 firm-year observations representing
about 43% of the final sample.
Table 5.2 Summary of Pre-IFRS Sample and Post-IFRS Sample.
Year IFRS Non-IFRS Total
1990 0 61 61
1991 0 67 67
1992 0 80 80
1993 0 81 81
1994 0 95 95
1995 0 82 82
1996 0 108 108
1997 0 139 139
1998 0 193 193
1999 0 205 205
2000 0 235 235
2001 0 268 268
2002 0 251 251
2003 0 233 233
2004 0 258 258
2005 127 227 354
2006 293 100 393
2007 394 57 451
2008 442 0 442
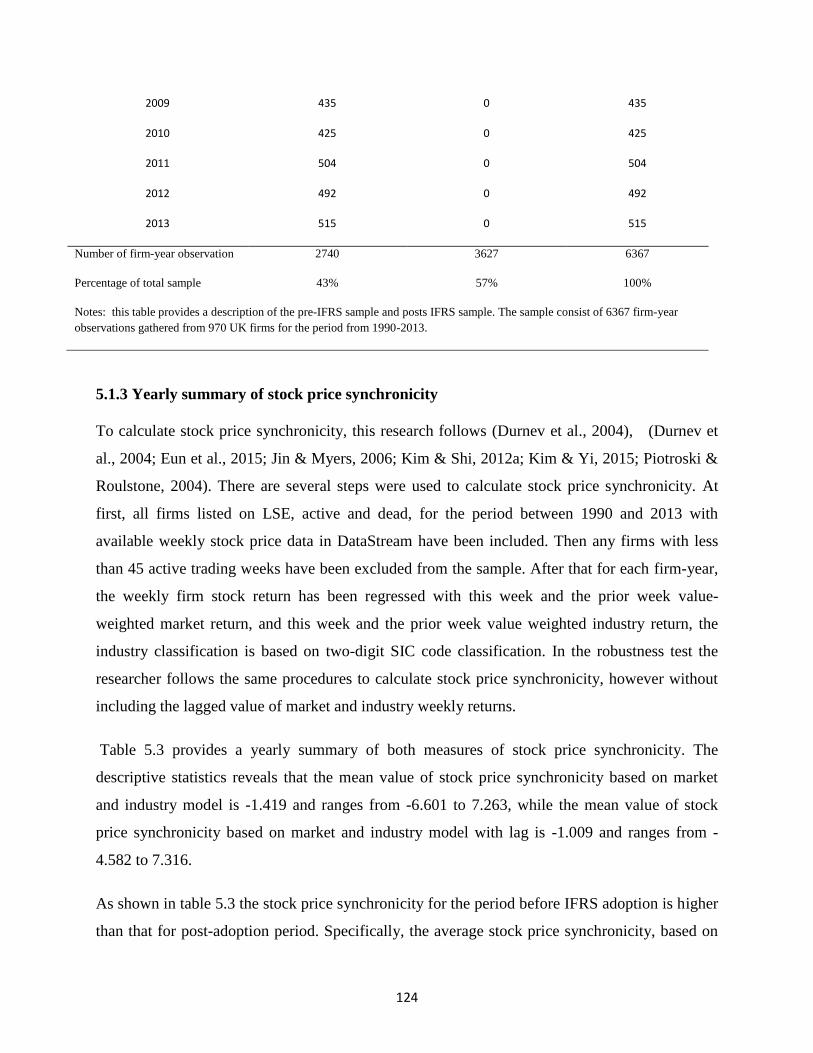
124
2009 435 0 435
2010 425 0 425
2011 504 0 504
2012 492 0 492
2013 515 0 515
Number of firm-year observation 2740 3627 6367
Percentage of total sample 43% 57% 100%
Notes: this table provides a description of the pre-IFRS sample and posts IFRS sample. The sample consist of 6367 firm-year
observations gathered from 970 UK firms for the period from 1990-2013.
5.1.3 Yearly summary of stock price synchronicity
To calculate stock price synchronicity, this research follows (Durnev et al., 2004), (Durnev et
al., 2004; Eun et al., 2015; Jin & Myers, 2006; Kim & Shi, 2012a; Kim & Yi, 2015; Piotroski &
Roulstone, 2004). There are several steps were used to calculate stock price synchronicity. At
first, all firms listed on LSE, active and dead, for the period between 1990 and 2013 with
available weekly stock price data in DataStream have been included. Then any firms with less
than 45 active trading weeks have been excluded from the sample. After that for each firm-year,
the weekly firm stock return has been regressed with this week and the prior week value-
weighted market return, and this week and the prior week value weighted industry return, the
industry classification is based on two-digit SIC code classification. In the robustness test the
researcher follows the same procedures to calculate stock price synchronicity, however without
including the lagged value of market and industry weekly returns.
Table 5.3 provides a yearly summary of both measures of stock price synchronicity. The
descriptive statistics reveals that the mean value of stock price synchronicity based on market
and industry model is -1.419 and ranges from -6.601 to 7.263, while the mean value of stock
price synchronicity based on market and industry model with lag is -1.009 and ranges from -
4.582 to 7.316.
As shown in table 5.3 the stock price synchronicity for the period before IFRS adoption is higher
than that for post-adoption period. Specifically, the average stock price synchronicity, based on
125
market and industry model, has been decreased by 46% after the mandatory adoption of IFRS in
2005, where the stock price synchronicity decreased from -1.250 for the period 1990 to 2004 to -
1.699 for the post-adoption period 2005-2013. Similarly, the average stock price synchronicity
based on market and industry model with lagged value records a decrease by 44% after
mandatory IFRS adoption. These results provide an initial indication that there are improvements
in the informativeness of stock price after mandatory adoption of IFRS.
The comparison of both measures of stock price synchronicity reveals that synchronicity based
on market and industry model with lagged value is clearly higher than that based on market and
industry model without lagged value. This result suggests that the part of firm’s weekly return
that cannot be explained by this week and last week market return and industry return is lower
than the part of firm’s weekly return that cannot be explained by the weekly market and industry
return without the lag.
It is clear from table 5.3 that there is a significant increase in the average value of stock price
synchronicity for the periods between 2007 and 2011. This increase in synchronicity levels may
be caused by the effect of The Financial Crises during this period. The Financial Crises
considered as one of systematic risk factors that affect all the stocks in the market leading to
higher co-movement of the stocks in the market and as a result higher stock price synchronicity.
However, even with the increase in stock price synchronicity during this period, the average
synchronicity for the post-adoption period is still lower than that for pre-adoption period. These
results provide some initial evidence that the improved transparency after IFRS adoption could
lead to more capitalization of firm-specific information into the stock price, hence high firm-
specific return variation (low stock price synchronicity), and as a result more informative stock
prices.
According to these findings, the mean value of stock price synchronicity, based on the market
and industry model with the lag for the pre-adoption period from 1990 to 2004, in this study is -

126
0.844. This value is comparable to that of Kim and Shi (2012a) and Fernandes and Ferreira
(2008) 5 .
Overall, the univariate analysis of stock price synchronicity over the sample period provides an
initial indication that the improved transparency after mandatory IFRS adoption facilitates the
incorporation of firm-specific information into stock price, which in turn, leads to more firm-
specific return variation, or low stock price synchronicity, and as a result more informative stock
price.
5 Kim and Shi (2012a) cross countries study record an average stock price synchronicity -0.857 for UK firms, for the
period from 1998 to 2004. In addition, Fernandes and Ferreira (2008) cross countries study have and average
UK’s stock price synchronicity about -0.814, for the period from 1980 to 2003.
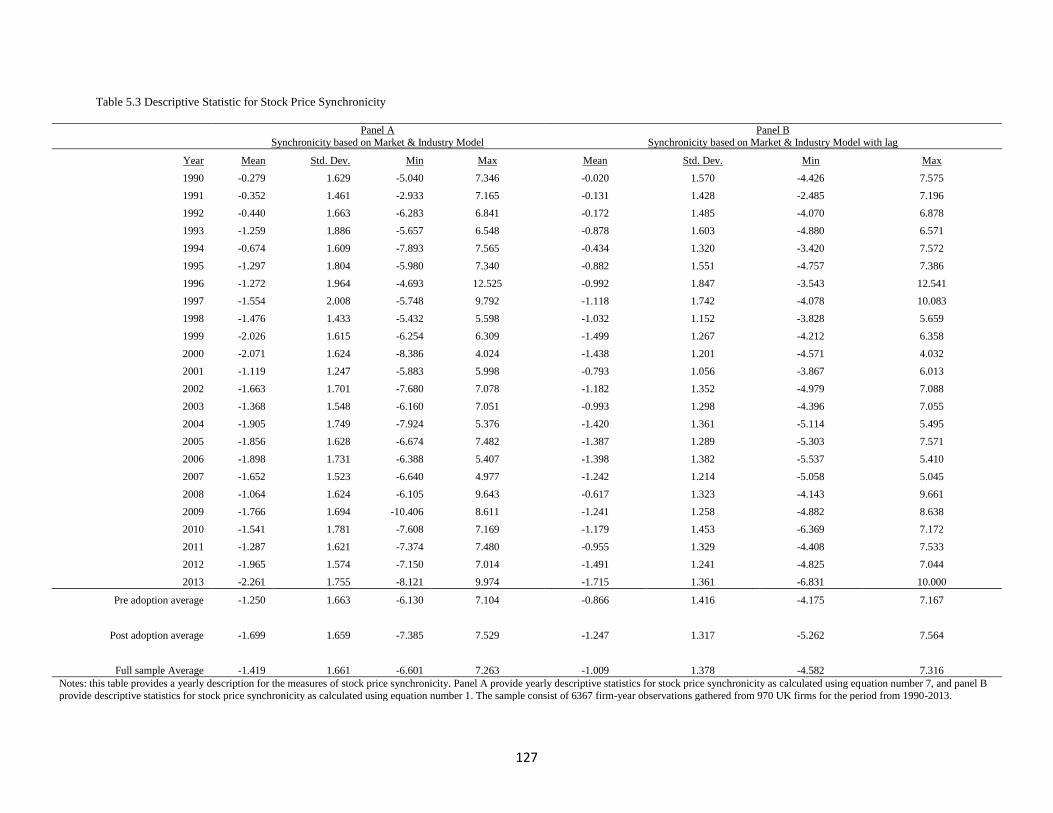
127
Table 5.3 Descriptive Statistic for Stock Price Synchronicity
Panel A
Synchronicity based on Market & Industry Model
Panel B
Synchronicity based on Market & Industry Model with lag
Year Mean Std. Dev. Min Max Mean Std. Dev. Min Max
1990 -0.279 1.629 -5.040 7.346 -0.020 1.570 -4.426 7.575
1991 -0.352 1.461 -2.933 7.165 -0.131 1.428 -2.485 7.196
1992 -0.440 1.663 -6.283 6.841 -0.172 1.485 -4.070 6.878
1993 -1.259 1.886 -5.657 6.548 -0.878 1.603 -4.880 6.571
1994 -0.674 1.609 -7.893 7.565 -0.434 1.320 -3.420 7.572
1995 -1.297 1.804 -5.980 7.340 -0.882 1.551 -4.757 7.386
1996 -1.272 1.964 -4.693 12.525 -0.992 1.847 -3.543 12.541
1997 -1.554 2.008 -5.748 9.792 -1.118 1.742 -4.078 10.083
1998 -1.476 1.433 -5.432 5.598 -1.032 1.152 -3.828 5.659
1999 -2.026 1.615 -6.254 6.309 -1.499 1.267 -4.212 6.358
2000 -2.071 1.624 -8.386 4.024 -1.438 1.201 -4.571 4.032
2001 -1.119 1.247 -5.883 5.998 -0.793 1.056 -3.867 6.013
2002 -1.663 1.701 -7.680 7.078 -1.182 1.352 -4.979 7.088
2003 -1.368 1.548 -6.160 7.051 -0.993 1.298 -4.396 7.055
2004 -1.905 1.749 -7.924 5.376 -1.420 1.361 -5.114 5.495
2005 -1.856 1.628 -6.674 7.482 -1.387 1.289 -5.303 7.571
2006 -1.898 1.731 -6.388 5.407 -1.398 1.382 -5.537 5.410
2007 -1.652 1.523 -6.640 4.977 -1.242 1.214 -5.058 5.045
2008 -1.064 1.624 -6.105 9.643 -0.617 1.323 -4.143 9.661
2009 -1.766 1.694 -10.406 8.611 -1.241 1.258 -4.882 8.638
2010 -1.541 1.781 -7.608 7.169 -1.179 1.453 -6.369 7.172
2011 -1.287 1.621 -7.374 7.480 -0.955 1.329 -4.408 7.533
2012 -1.965 1.574 -7.150 7.014 -1.491 1.241 -4.825 7.044
2013 -2.261 1.755 -8.121 9.974 -1.715 1.361 -6.831 10.000
Pre adoption average -1.250 1.663 -6.130 7.104 -0.866 1.416 -4.175 7.167
Post adoption average -1.699 1.659 -7.385 7.529 -1.247 1.317 -5.262 7.564
Full sample Average -1.419 1.661 -6.601 7.263 -1.009 1.378 -4.582 7.316
Notes: this table provides a yearly description for the measures of stock price synchronicity. Panel A provide yearly descriptive statistics for stock price synchronicity as calculated using equation number 7, and panel B
provide descriptive statistics for stock price synchronicity as calculated using equation number 1. The sample consist of 6367 firm-year observations gathered from 970 UK firms for the period from 1990-2013.

128
5.1.4 Descriptive statistics and Univariate comparisons
Table 5.4 reports the descriptive statistics for the full sample of variables that were used in the
empirical model. On average, the firms in the sample are followed by about 6 financial analysts.
With the highest and lowest number of analysts EPS forecast 40 and 1 respectively. The mean
value of firm size based on market value of equity is 864 million. The sample firms on average
have about 18.8% financial leverage ratio as measured by firm’s total debt to total asset ratio.
The average stock price synchronicity as calculated based on market and industry model with lag
is higher than that based on market and industry model industry model by 38%, with
synchronicity mean -1.608 and -1.168 respectively. This is expected because the part of stock
return that can be explained by this week and prior week market return and this week and prior
week industry return is higher than that part explained by weekly market return and industry
return without lag. The mean value of the variance of weekly industry return is 0.047 meaning
that volatility of weekly industry return is quite low.
Table 5.4 also shows a considerable difference between industries in terms of the number of
firms in the industry and industry size. The number of firms in the industry variable show that
the largest industry sector contains 301 firms, while the smallest industry contains only two
firms. The measure of industry size, the total assets of all firms in the same industry, shows a
difference of in industry size of the sample. Using the fixed effect model with controlling for
industry fixed effect used to side step these differences between industries. There is a
considerable difference between industries in term of industry concentration as calculated by
revenue based Herfindahl index. The highest Herfindahl index of 1.0 is for the industry with SIC
code 76 and the lowest index is .048 is for the industry with SIC code 12.
As shown in Table 5.4 the analysts-following, market to book value, firm’s total asset, the
number of firms in the industry, industry total assets, and industry concentration are highly
skewed. Therefore, this study follows Li (2010) and uses the log transformation of these
variables in the analysis. Using the log transformation to have more normally distributed
variables is also suggested by Brooks (2014).
Panel A of Table 5.5 provides descriptive statistics for pre-adoption sample (N=2740), while
panel B provides descriptive statistics for post-IFRS sample (N=3627). The results of t-test and
129
Wilcoxon-Mann-Whitney test are presented in section C. T-test and Wilcoxon-Mann-Whitney
tests statistically examine the mean and median differences between the variables of the pre-
adoption sample and post adoption sample
The results of t-test and Wilcoxon -Mann-Whitney test suggests that the mean and median value
of both measures of stock price synchronicity for post-IFRS adoption sample is significantly
lower than that for pre-IFRS adoption sample. This result provides an initial indication that the
improved transparency after mandatory IFRS adoption facilitates the incorporation of firm-
specific information into the stock price, leading to more informative stock price.
The mean and median of financial analysts-following, measured by the natural log of the number
of analysts who issue one year EPS forecast (FOLL), are 2.717 and 2.946 for pre-adoption
sample and 2.680 and 2.792 for post adoption sample. The standard deviations for (FOLL) of
both samples are quite similar with a value of 0.99. The results of t-test suggest a non-significant
difference in the mean value of (FOLL) between the pre-adoption sample and post adoption
sample, while the results of Wilcoxon-Mann-Whitney suggest a significant difference in the
median value of (FOLL) between the pre-adoption sample and post adoption sample.
The mean and median of financial leverage (LEV) for pre-adoption sample are 0.192 and 0.169,
respectively. The mean and median of financial leverage (LEV) for post adoption sample are 2.68
and 2.792, respectively. T-test results suggest a non-significant mean difference in (LEV)
between the pre-adoption and post-adoption sample, while Wilcoxon-Mann-Whitney results
suggest a significant (at p-value <0.01) median differences between pre-adoption and post-
adoption sample.
Both of Growth opportunity (M/B) and ROA for the pre-adoption sample are higher than that for
post adoption sample. This different is significant as suggested by the results of t-test and
Wilcoxon-Mann-Whitney test. However, there are no significant differences between the mean
and median value of firm’s size, measured by the natural log of firm’s total asset (SIZE) for pre-
adoption sample and post adoption one.
With respect to the descriptive statistics on the industry level variables, Table 5.5 indicate that,
on average the post-adoption sample has a larger industry size (IND_SIZE), as measured by

130
natural log of industry total asset, higher number of firms in each industry (IND_NUM), lower
industry concentration, measured by revenue based Herfindahl index (HERF_INDX), and higher
variance of weekly industry return (VAR_IND_RET) than pre-adoption sample. The statistical
analysis of mean and median values of pre-adoption sample and post adoption sample reveals
significant differences (at p-vale <0.01), as suggested by the results of t-test and Wilcoxon-
Mann-Whitney test.

131
Table 5.4 Descriptive Statistics for the Variable Used in the First study
Variable name P25 Mean Median P75 Std. Dev. Min Max
Stock price synchronicity With lag (SYNCH1) -2.027 -1.168 -1.239 -0.0432 1.379 -6.831 12.541
Stock price synchronicity Without lag (SYNCH2) -2.618 -1.608 -1.577 -0.592 1.704 -10.406 12.525
IFRS 0 0.569 1 1 0.5 0 1
Analysts-following(FOLL) 2 8.28 6 13 6.846 1 40
Financial leverage(LEV) 0.031 0.188 0.163 0.284 0.185 0 3.007
Growth Opportunity (M/B) 1.3 3.174 2.23 3.77 4.024 -18.63 34.73
Firm size (total asset)(SIZE) 105185 3498141 377800 1464300 15000000 1039 270000000
ROA 2.56 4.342 6.81 11.05 17.797 -394.33 134.1
Number of firms in the industry (SIZE) 11 59.593 27 83 73.212 2 301
Industry size ( total asset)(IND_SIZE) 6666631 68600000 21400000 77400000 104000000 39407 469000000
Industry concentration (HERF_INDEX) 0.148 0.327 0.267 0.408 0.238 0.0481 1
Variance_weekly industry return(IND_VAR) 0.003 0.047 0.007 0.01 0.654 0 20.177
The Financial Crisis(CRISES) 0 0.431 0 1 0.495 0 1
Notes: this table provides descriptive statistics for the full sample variables of interest. The sample consist of 6367 firm-year observations gathered from 970 UK firms for the period
from 1990-2013. Table 4.3 contains full definition of variables.
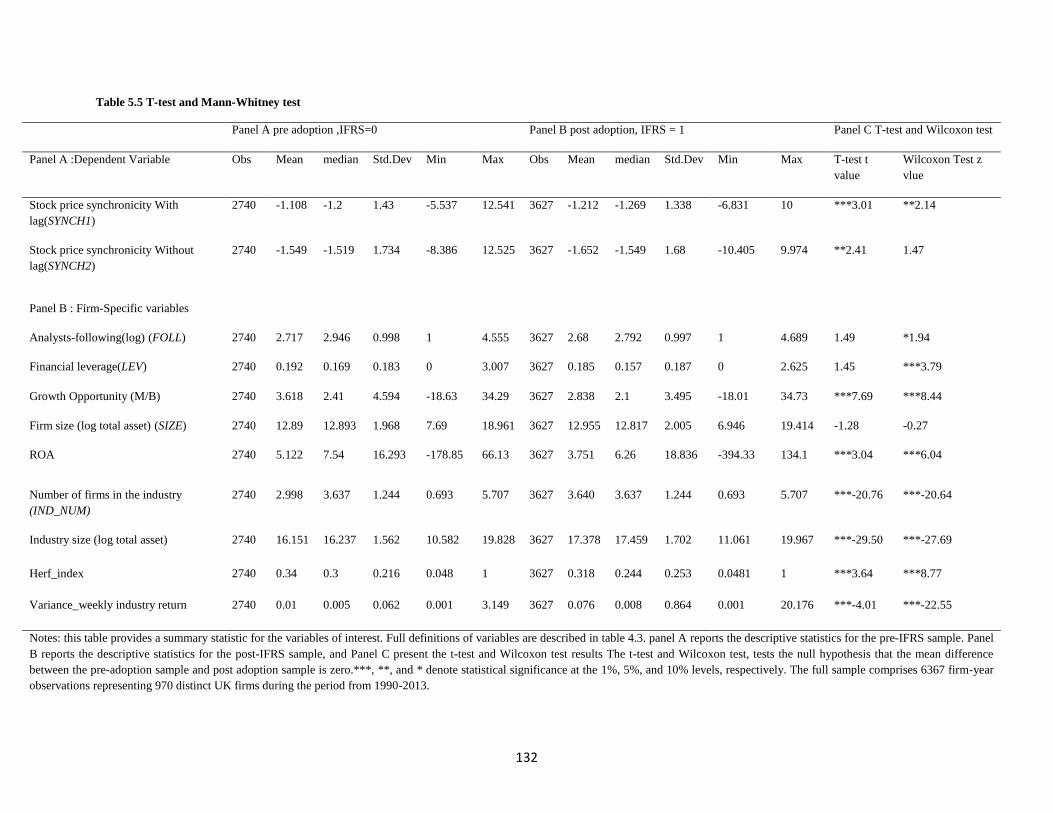
132
Table 5.5 T-test and Mann-Whitney test
Panel A pre adoption ,IFRS=0 Panel B post adoption, IFRS = 1 Panel C T-test and Wilcoxon test
Panel A :Dependent Variable Obs Mean median Std.Dev Min Max Obs Mean median Std.Dev Min Max T-test t
value
Wilcoxon Test z
vlue
Stock price synchronicity With
lag(SYNCH1)
2740 -1.108 -1.2 1.43 -5.537 12.541 3627 -1.212 -1.269 1.338 -6.831 10 ***3.01 **2.14
Stock price synchronicity Without
lag(SYNCH2)
2740
-1.549 -1.519 1.734 -8.386 12.525 3627 -1.652 -1.549 1.68 -10.405 9.974 **2.41 1.47
Panel B : Firm-Specific variables
Analysts-following(log) (FOLL) 2740 2.717 2.946 0.998 1 4.555 3627 2.68 2.792 0.997 1 4.689 1.49 *1.94
Financial leverage(LEV) 2740 0.192 0.169 0.183 0 3.007 3627 0.185 0.157 0.187 0 2.625 1.45 ***3.79
Growth Opportunity (M/B) 2740 3.618 2.41 4.594 -18.63 34.29 3627 2.838 2.1 3.495 -18.01 34.73 ***7.69 ***8.44
Firm size (log total asset) (SIZE) 2740 12.89 12.893 1.968 7.69 18.961 3627 12.955 12.817 2.005 6.946 19.414 -1.28 -0.27
ROA 2740 5.122 7.54 16.293 -178.85 66.13 3627 3.751 6.26 18.836 -394.33 134.1 ***3.04 ***6.04
Number of firms in the industry
(IND_NUM)
2740 2.998 3.637 1.244 0.693 5.707 3627 3.640 3.637 1.244 0.693 5.707 ***-20.76 ***-20.64
Industry size (log total asset) 2740 16.151 16.237 1.562 10.582 19.828 3627 17.378 17.459 1.702 11.061 19.967 ***-29.50 ***-27.69
Herf_index 2740 0.34 0.3 0.216 0.048 1 3627 0.318 0.244 0.253 0.0481 1 ***3.64 ***8.77
Variance_weekly industry return 2740 0.01 0.005 0.062 0.001 3.149 3627 0.076 0.008 0.864 0.001 20.176 ***-4.01 ***-22.55
Notes: this table provides a summary statistic for the variables of interest. Full definitions of variables are described in table 4.3. panel A reports the descriptive statistics for the pre-IFRS sample. Panel
B reports the descriptive statistics for the post-IFRS sample, and Panel C present the t-test and Wilcoxon test results The t-test and Wilcoxon test, tests the null hypothesis that the mean difference
between the pre-adoption sample and post adoption sample is zero.***, **, and * denote statistical significance at the 1%, 5%, and 10% levels, respectively. The full sample comprises 6367 firm-year
observations representing 970 distinct UK firms during the period from 1990-2013.
133
5.1.5 Correlation Analysis
Table 5.6 presents Pearson and Spearman correlation matrix for the dependent (stock price
synchronicity), independent (IFRS adoption) and all the control variables used in the regression
analysis. The Pearson correlation coefficient is a measure of the strength of the linear
relationship between two variables. The Spearman correlation estimates the monotonic
relationship between two variables. In a monotonic relationship, the variables tend to change
together, but not necessarily at a constant rate. The Spearman correlation coefficient is based on
the ranked values for each variable rather than the raw data. The values of Pearson and Spearman
coefficients range from +1 to -1, the closer value to 0 denoting low association between the
variables.
The correlation coefficients for all the variables in the correlation analysis matrix are below 80%.
Hair et al. (2010) and Gujarati and Porter (2009) suggest that there will be multicollinearity
problem if the correlation coefficient between two variables is more than 80%. The maximum
correlation coefficient found between firm size (SIZE) and analysts-following (FOLL). As a
result, it can be concluded that the multicollinearity issue will not affect the multivariate
regression analysis.
With respect to the correlation relationships between variables, several key relationships are
apparent. First, consistent with the findings of Kim and Shi (2012a), synchronicity is negatively
correlated with IFRS adoption, Spearman coefficient is not significant. This negative correlation
between synchronicity and IFRS adoption provides an initial indication that the improved
transparency after mandatory IFRS adoption leads to more informative stock price, by
facilitating the incorporation of firm-specific information into stock price.
Not surprisingly, stock price synchronicity has a significant positive correlation with analysts-
following (Pearson and Spearman correlation coefficient two-tailed p < 0.001). This result is
consistent with the findings of Kim and Shi (2012a), Chan and Hameed (2006) and Piotroski and
Roulstone (2004), who document a significant positive correlation between and stock price
synchronicity analysts-following. The positive relation between analysts and stock price
synchronicity is also in line with the arguments of Ferreira and Laux (2007) , Chan and Hameed
(2006) and Piotroski and Roulstone (2004) that financial analysts are involved primarily in
134
generating and disseminating common industry and market level information rather than the
acquisition of costly private firm-specific information.
Firm size (SIZE) has a significant positive correlation with synchronicity (SYNCH1), Pearson
and Spearman correlation coefficient two-tailed p < 0.001, this result is in line with findings of
Boubaker et al. (2014) , and An and Zhang (2013). Piotroski and Roulstone (2004) explain this
relation could result from the fact that small firms tend to follow large firms, where large firms
can act as leading market indicators for small firms by revealing or signalling macroeconomic
events, which results in higher stock price synchronicity for large firms. In addition, the large
firms attract more financial analysts who tend to provide more industry level and market level
information instead of firm-specific information. This will facilitate the incorporation of this
information into the stock price (the highest correlation among variables is between firm size and
analysts-following).
Firm’s financial leverage (LEV), firm’s growth opportunity (M/B), and firms performance
(ROA), display a significant positive correlation with stock price synchronicity, Pearson and
Spearman correlation coefficient two-tailed p < 0.05. These findings corroborate the research by
Kim and Shi (2012a), who document a positive correlation between stock price synchronicity
(SYNCH1) and financial leverage (LEV) and growth opportunity (M/B).
In terms of industry characteristics, the correlation test results suggest that number of firms in the
industry (IND_NUM), industry size (IND_SIZE), and variance of weekly industry return
(VAR_IND_RET) have a significant negative correlation with stock price synchronicity
(SYNCH1). This negative correlation between stock price synchronicity (SYNCH1) and number
of firms in the industry is also documented by Kim and Shi (2012a) and Gul et al. (2010). The
negative correlation between industry size (IND_SIZE) and stock price synchronicity (SYNCH1)
is also documented by Gul et al. (2010).
The correlation analysis of industry concentration (HERF_INDX), and stock price synchronicity
shows that the industry concentration (HERF_INDX) have a significant positive correlation with
stock price synchronicity (SYNCH1). This positive relation between industry concentrations
(HERF_INDX) and stock price synchronicity is in line with the findings of Fernandes and
Ferreira (2008).
135
As expected, stock price synchronicity (SYNCH1) and The Financial Crises have significant
positive correlation, Pearson and Spearman correlation coefficient two-tailed p < 0.05. The
Financial Crisis as one of systematic risk factors that affect all the stock in the market is expected
to have a highly significant positive impact on the stock price synchronicity.
In terms of the correlation between independent variables it worth noting that, analysts-following
(FOLL) has a significant positive correlation with firm size (SIZE), Pearson and Spearman
correlation coefficient two-tailed p < 0.001. This significant positive correlation between
analysts-following (FOLL) and firm size (SIZE) is in line with the argument of Bhushan (1989)
that large firms tend to attract more financial analysts than small firms. In addition, many
previous studies document that the firm size is the most important determinant of analyst-
following (Barth, Kasznik, & McNichols, 2001; Lehavy, Li, & Merkley, 2011; Lobo et al.,
2012). These studies find that larger firms have greater analysts-following and suggest that large
firms have better information environments, potentially more complex operations, and greater
demand for investment advice. C. Y. Chan, Lo, and Yang (2016), Kim and Shi (2012a), and
Piotroski and Roulstone (2004) document a positive correlation between firm size (SIZE) and
analysts-following (FOLL). The other firm-specific and industry specific control variables do not
record a high correlation between each other.
Overall, the results of Spearman and Pearson correlation analysis for the entire sample show that
certain relationships exist between stock price synchronicity and the explanatory variables, and
these relationships generally consistent with what is suggested by the prior literature. The most
important one is the negative correlation between stock price synchronicity (SYNCH1) and the
mandatory adoption of IFRS, which suggest that the improved transparency after mandatory
IFRS adoption facilitates the incorporation of firm-specific information into the stock price,
leading to a less synchronous more informative stock price.
Variance inflation factor (VIF) test has been performed as another test for multicollinearity. The
results show that the VIF for all the variables is less than 3.0 indicating there is no serious
multicollinearity problem. Hair et al. (2010) suggest that if the variance inflation factor is more
than 10 this could be an indication that there is a serious multicollinearity present.
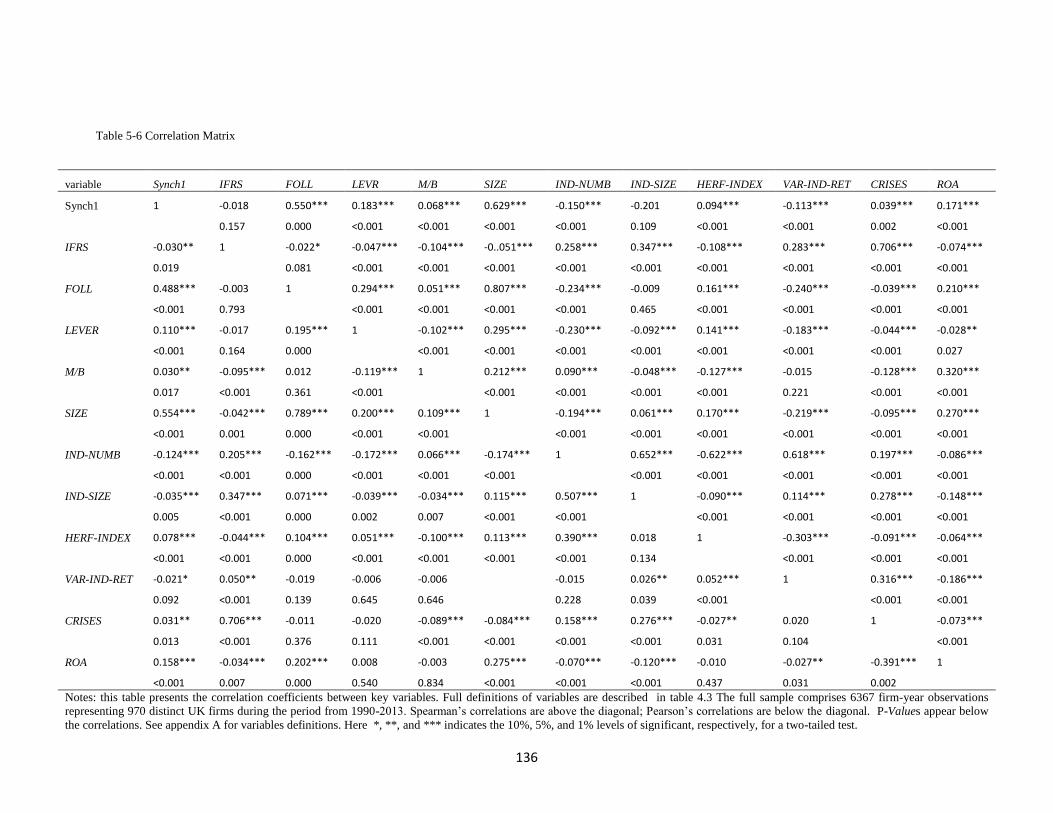
136
Table 5-6 Correlation Matrix
variable Synch1 IFRS FOLL LEVR M/B SIZE IND-NUMB IND-SIZE HERF-INDEX VAR-IND-RET CRISES ROA
Synch1 1 -0.018 0.550*** 0.183*** 0.068*** 0.629*** -0.150*** -0.201 0.094*** -0.113*** 0.039*** 0.171***
0.157 0.000 <0.001 <0.001 <0.001 <0.001 0.109 <0.001 <0.001 0.002 <0.001
IFRS -0.030** 1 -0.022* -0.047*** -0.104*** -0..051*** 0.258*** 0.347*** -0.108*** 0.283*** 0.706*** -0.074***
0.019 0.081 <0.001 <0.001 <0.001 <0.001 <0.001 <0.001 <0.001 <0.001 <0.001
FOLL 0.488*** -0.003 1 0.294*** 0.051*** 0.807*** -0.234*** -0.009 0.161*** -0.240*** -0.039*** 0.210***
<0.001 0.793 <0.001 <0.001 <0.001 <0.001 0.465 <0.001 <0.001 <0.001 <0.001
LEVER 0.110*** -0.017 0.195*** 1 -0.102*** 0.295*** -0.230*** -0.092*** 0.141*** -0.183*** -0.044*** -0.028**
<0.001 0.164 0.000 <0.001 <0.001 <0.001 <0.001 <0.001 <0.001 <0.001 0.027
M/B 0.030** -0.095*** 0.012 -0.119*** 1 0.212*** 0.090*** -0.048*** -0.127*** -0.015 -0.128*** 0.320***
0.017 <0.001 0.361 <0.001 <0.001 <0.001 <0.001 <0.001 0.221 <0.001 <0.001
SIZE 0.554*** -0.042*** 0.789*** 0.200*** 0.109*** 1 -0.194*** 0.061*** 0.170*** -0.219*** -0.095*** 0.270***
<0.001 0.001 0.000 <0.001 <0.001 <0.001 <0.001 <0.001 <0.001 <0.001 <0.001
IND-NUMB -0.124*** 0.205*** -0.162*** -0.172*** 0.066*** -0.174*** 1 0.652*** -0.622*** 0.618*** 0.197*** -0.086***
<0.001 <0.001 0.000 <0.001 <0.001 <0.001 <0.001 <0.001 <0.001 <0.001 <0.001
IND-SIZE -0.035*** 0.347*** 0.071*** -0.039*** -0.034*** 0.115*** 0.507*** 1 -0.090*** 0.114*** 0.278*** -0.148***
0.005 <0.001 0.000 0.002 0.007 <0.001 <0.001 <0.001 <0.001 <0.001 <0.001
HERF-INDEX 0.078*** -0.044*** 0.104*** 0.051*** -0.100*** 0.113*** 0.390*** 0.018 1 -0.303*** -0.091*** -0.064***
<0.001 <0.001 0.000 <0.001 <0.001 <0.001 <0.001 0.134 <0.001 <0.001 <0.001
VAR-IND-RET -0.021* 0.050** -0.019 -0.006 -0.006 -0.015 0.026** 0.052*** 1 0.316*** -0.186***
0.092 <0.001 0.139 0.645 0.646 0.228 0.039 <0.001 <0.001 <0.001
CRISES 0.031** 0.706*** -0.011 -0.020 -0.089*** -0.084*** 0.158*** 0.276*** -0.027** 0.020 1 -0.073***
0.013 <0.001 0.376 0.111 <0.001 <0.001 <0.001 <0.001 0.031 0.104 <0.001
ROA 0.158*** -0.034*** 0.202*** 0.008 -0.003 0.275*** -0.070*** -0.120*** -0.010 -0.027** -0.391*** 1
<0.001 0.007 0.000 0.540 0.834 <0.001 <0.001 <0.001 0.437 0.031 0.002
Notes: this table presents the correlation coefficients between key variables. Full definitions of variables are described in table 4.3 The full sample comprises 6367 firm-year observations
representing 970 distinct UK firms during the period from 1990-2013. Spearman’s correlations are above the diagonal; Pearson’s correlations are below the diagonal. P-Values appear below
the correlations. See appendix A for variables definitions. Here *, **, and *** indicates the 10%, 5%, and 1% levels of significant, respectively, for a two-tailed test.
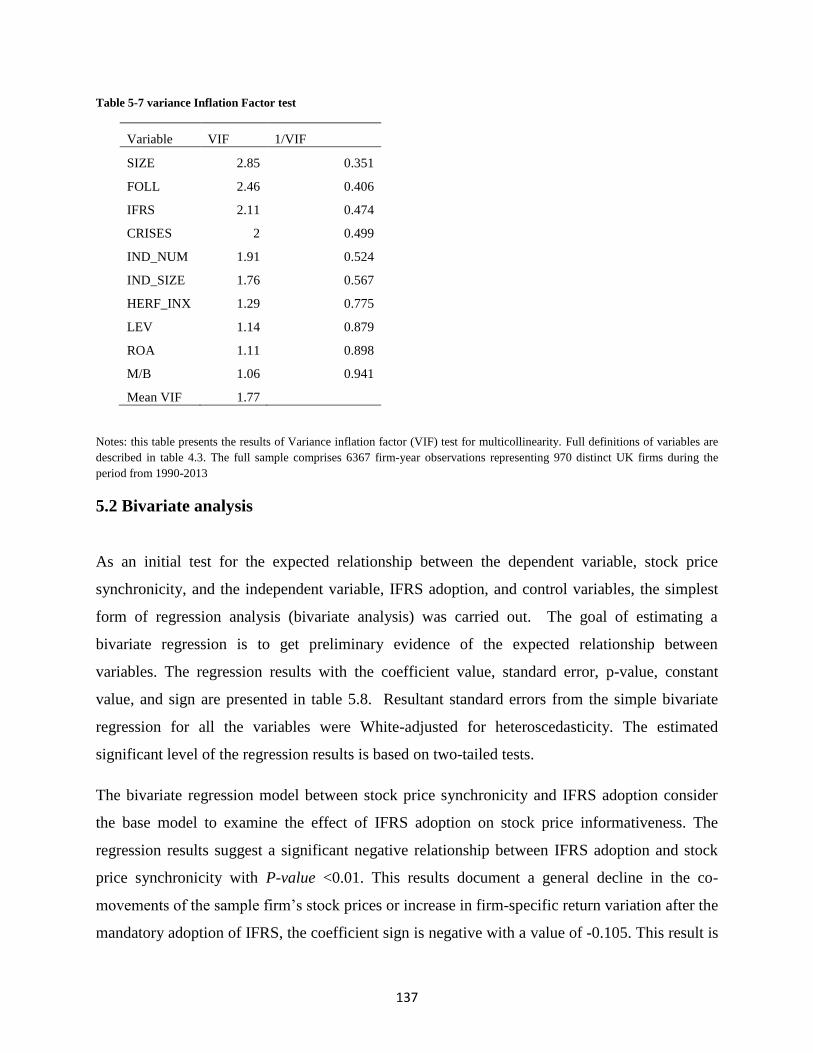
137
Table 5-7 variance Inflation Factor test
Variable VIF 1/VIF
SIZE 2.85 0.351
FOLL 2.46 0.406
IFRS 2.11 0.474
CRISES 2 0.499
IND_NUM 1.91 0.524
IND_SIZE 1.76 0.567
HERF_INX 1.29 0.775
LEV 1.14 0.879
ROA 1.11 0.898
M/B 1.06 0.941
Mean VIF 1.77
Notes: this table presents the results of Variance inflation factor (VIF) test for multicollinearity. Full definitions of variables are
described in table 4.3. The full sample comprises 6367 firm-year observations representing 970 distinct UK firms during the
period from 1990-2013
5.2 Bivariate analysis
As an initial test for the expected relationship between the dependent variable, stock price
synchronicity, and the independent variable, IFRS adoption, and control variables, the simplest
form of regression analysis (bivariate analysis) was carried out. The goal of estimating a
bivariate regression is to get preliminary evidence of the expected relationship between
variables. The regression results with the coefficient value, standard error, p-value, constant
value, and sign are presented in table 5.8. Resultant standard errors from the simple bivariate
regression for all the variables were White-adjusted for heteroscedasticity. The estimated
significant level of the regression results is based on two-tailed tests.
The bivariate regression model between stock price synchronicity and IFRS adoption consider
the base model to examine the effect of IFRS adoption on stock price informativeness. The
regression results suggest a significant negative relationship between IFRS adoption and stock
price synchronicity with P-value <0.01. This results document a general decline in the co-
movements of the sample firm’s stock prices or increase in firm-specific return variation after the
mandatory adoption of IFRS, the coefficient sign is negative with a value of -0.105. This result is
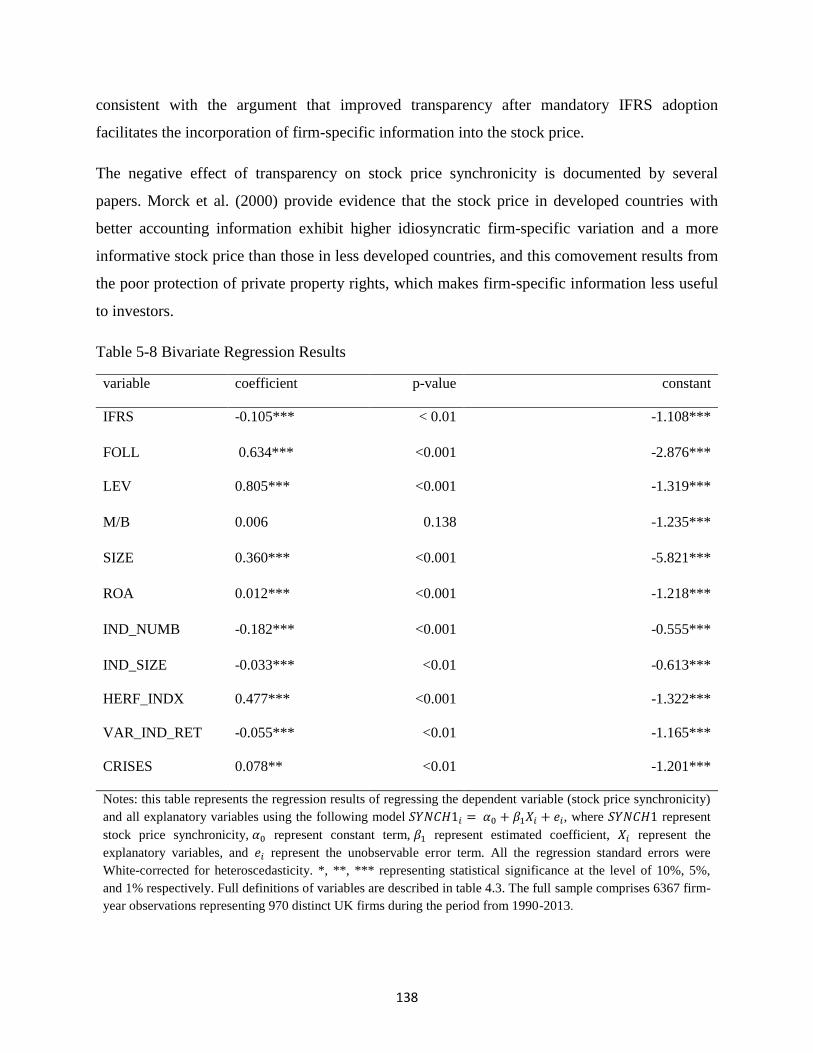
138
consistent with the argument that improved transparency after mandatory IFRS adoption
facilitates the incorporation of firm-specific information into the stock price.
The negative effect of transparency on stock price synchronicity is documented by several
papers. Morck et al. (2000) provide evidence that the stock price in developed countries with
better accounting information exhibit higher idiosyncratic firm-specific variation and a more
informative stock price than those in less developed countries, and this comovement results from
the poor protection of private property rights, which makes firm-specific information less useful
to investors.
Table 5-8 Bivariate Regression Results
variable coefficient p-value constant
IFRS -0.105*** < 0.01 -1.108***
FOLL 0.634*** <0.001 -2.876***
LEV 0.805*** <0.001 -1.319***
M/B 0.006 0.138 -1.235***
SIZE 0.360*** <0.001 -5.821***
ROA 0.012*** <0.001 -1.218***
IND_NUMB -0.182*** <0.001 -0.555***
IND_SIZE -0.033*** <0.01 -0.613***
HERF_INDX 0.477*** <0.001 -1.322***
VAR_IND_RET -0.055*** <0.01 -1.165***
CRISES 0.078** <0.01 -1.201***
Notes: this table represents the regression results of regressing the dependent variable (stock price synchronicity)
and all explanatory variables using the following model 𝑆𝑌𝑁𝐶𝐻1𝑖 = 𝛼0 + 𝛽1𝑋𝑖 + 𝑒𝑖, where 𝑆𝑌𝑁𝐶𝐻1 represent
stock price synchronicity, 𝛼0 represent constant term, 𝛽1 represent estimated coefficient, 𝑋𝑖 represent the
explanatory variables, and 𝑒𝑖 represent the unobservable error term. All the regression standard errors were
White-corrected for heteroscedasticity. *, **, *** representing statistical significance at the level of 10%, 5%,
and 1% respectively. Full definitions of variables are described in table 4.3. The full sample comprises 6367 firm-
year observations representing 970 distinct UK firms during the period from 1990-2013.
139
Eun et al. (2015), Kim, Zhang, et al. (2014), Hutton et al. (2009), Jin and Myers (2006)
,Veldkamp (2006a), Durnev et al. (2003) and others provide evidence to support the argument
that, more transparency improves the availability of firms-specific information in the market and
facilitates the incorporation of firm-specific information into the stock prices, leading to less
synchronous stock prices. These results provide initial evidence to support the hypothesis that
there is a negative relationship between IFRS adoption and stock price synchronicity, and it also
with the same line with the information encouragement role of IFRS adoption as documented by
Kim and Shi (2012a).
Consistent with prior studies and the correlation analysis, the coefficient for analysts-following
(FOLL) is significantly negative with p-value <0.001. The positive effect of analysts-following
on synchronicity is economically significant also, with estimated coefficient 0.634. This positive
effect of the analysts-following (FOLL) on stock price synchronicity corroborates the findings of
Kim and Shi (2012a), Ferreira and Laux (2007), Chan and Hameed (2006), Veldkamp (2006a),
and Piotroski and Roulstone (2004), who document a significant positive effect of (FOLL) on
stock price synchronicity, suggesting that the financial analysts normally tend to produce
common market wide and industry-wide information instead of private firm-specific
information.
Financial leverage (LEV) recorded a significant positive effect on stock price synchronicity with
p_value < 0.001. The firm’s financial leverage is expected to have an effect on synchronicity
through its impact on the sensitivity of firms return to macroeconomic conditions and because it
affects the division of risk bearing between equity shareholders and debtors (Hutton et al., 2009).
However what type of the impact of leverage on synchronicity if it positive or negative contains
a much greater debate in the prior research. Although the suggested negative effect of leverage
on synchronicity is argued by Beuselinck et al. (2010), where they assume that the firms with
high financial leverage have a high intrinsic risk factors which may enforce the investors to
collect firm-specific information, so a negative effect on synchronicity, Gul et al. (2010), Hutton
et al. (2009) and other researchers document a significant positive effect of financial leverage on
synchronicity. At this point, the positive effect of leverage on synchronicity could be justified by
140
the fact that this simple regression does not take into account the effect of other variables, that
may have an effect on synchronicity, other than leverage.
The other firm-specific control variable that is expected to have an effect on synchronicity is the
firm’s market to book ratio (M/B), measured as the market value of equity divided by book value
of equity, which is used to measure the firm’s growth opportunities. Hutton et al. (2009) argue
that the market-to-book ratio places firms along a growth-versus-value spectrum and thus could
be systematically related to the firm-specific return variation. Consistent with the findings of An
and Zhang (2013), Yu et al. (2013) the bivariate regression results suggest a positive impact of
(M/B) on stock price synchronicity. At this point, the positive effect of (M/B) on synchronicity is
insignificant and could be justified by the fact that this simple regression does not take into
account the effect other variables that may have an effect on synchronicity other than (M/B).
The large firms are expected to have a positive relation with stock price synchronicity because
these firms are normally operating in a wider cross section of the economy Hutton et al. (2009).
Operating in a wider cross section of the economy means that more market-wide information
will be incorporated into the stock price and hence more comovement with the market returns. In
addition, the small firms consider the large firms as a market leader, so it is expected for the
large firms to have lower firm-specific return variation, Chan and Hameed (2006). The
preliminary regression results support the previous expectations and with the results of Ben-Nasr
and Cosset (2014), An and Zhang (2013) and Xing and Anderson (2011), by documenting a
highly significant positive effect of firm size (SIZE) on stock price synchronicity, with estimated
coefficient of 0.360 and a significant level p_value < 0.001).
Firm’s performance and profitability (ROA), record a significant positive effect on stock price
synchronicity, with p_value <0.001. This result is in line with the findings of Ben-Nasr and
Cosset (2014), and Gul, Srinidhi, et al. (2011) that more profitable firms tend to have less
informative stock prices.
In terms of industry characteristics control variables, the number of firms in the industry revealed
an economically and statistically negative effect of stock price synchronicity with estimated
coefficient and p_value at -0.182 and <0.001 respectively. The prior research documented
different results on the effect of the number of firms in the industry on synchronicity, where

141
Hasan et al. (2014) and Kim and Shi (2012a) found a positive effect of the number of firms in the
industry on synchronicity. In the other hand Yu et al. (2013) and Gul et al. (2010) document a
negative relation between the number of firms in the industry and the comovement of the stock
prices. As mentioned before because these initial results are based on a bivariate simple
regression that does not take into account the effect of other variables that may have an impact
on synchronicity these results are not robust and cannot be relied on to estimate the actual impact
of industry size on synchronicity.
Industry size (IND_SIZE), records a significant negative effect on the stock price synchronicity.
This result is consistent with the findings of Hasan et al. (2014) , and Gul et al. (2010), who
document a positive effect of industry size on stock price synchronicity. These results suggest
that the firms that operate in the large industry are more able to incorporate firm-specific
information into stock price than those firms that operate in small industries.
Industry concentration (HER_INDX) records a significant positive effect on stock price
synchronicity. Piotroski and Roulstone (2004) suggest that when the industry is more
concentrated, the possibility that the performance of firms in this industry are interdependent on
each other is high, and the induction of news related to any firm may considered as value
relevant for all the other firms in that industry. For this reason they expect a positive effect of
industry concentration on stock price synchronicity. The bivariate regression results suggest a
highly economically and statistically significant effect of industry concentration on stock price
synchronicity with estimated coefficient and p_value at 0.477 and <0.001 respectively. This
positive effect of industry concentration on stock price synchronicity is in line with the findings
of Eun et al. (2015), Ben-Nasr and Cosset (2014), Fernandes and Ferreira (2008), and Piotroski
and Roulstone (2004).
The final industry characteristics control variable, that is expected to have an effect on stock
price synchronicity, is a variance of weekly industry return record a statistically significant
negative relation with stock price synchronicity at p_value less than 0.01 and estimated
coefficient -0.055. These results contradict with the findings of Hutton et al. (2009) whereas they
document a positive relationship between the variance of weekly industry return and industry
size and stock price synchronicity. As mentioned before, this is a bivariate simple regression and

142
the results are not robust. The exact estimation of the variables’ effect variables on stock price
synchronicity will be obtained from multivariate regression.
The financial crises as one of systematic risk factors that affect all the stock in the market have
significant economic and statistical positive impact on the firm’s stock price synchronicity with
estimated coefficient and P_value at 0.078 and <0.01, respectively. Reinhart and Rogoff (2009)
suggest that during The Financial Crisis, the UK equity stock prices collapsed by fifty per cent
on average, meaning that all the UK firms’ stock prices fell during this period. Hutton et al.
(2009) suggest that systematic risk leads to increased comovement of the stock price, for this
reason it is expected for the financial crises to have a positive effect on synchronicity because the
financial crises affect all stocks in the market leading to high comovement of stock prices, hence
higher stock price synchronicity.
5.3 Multivariate analysis: IFRS adoption and stock price informativeness
In the previous section, the descriptive statistics were discussed, correlation analysis, and the t-
test and Wilcoxon-Mann-Whitney test results for the study variables were explained. In this
section, the results of our main regression models that examine the relationships between the
dependent variable, stock price synchronicity, the dependent variable, accounting transparency,
and the control variables, will be discussed.
5.3.1 The results of testing H1
The first hypothesis H1 is concerned with the impact of IFRS adoption, as a measure of
accounting transparency, on the ability of stock price to incorporate firm-specific information, as
measured by stock price synchronicity. To test H1 we use the regression model as in EQ. (6). In
this model the dependent variable (SEYNCH1), refers to the part of stock return that cannot be
explained by market return and industry return, or stock price synchronicity, which is the inverse
measure of stock price informativeness. The variable of interest of this model is the coefficient
on the IFRS variable, 𝛽1, which captures the incremental change in stock price synchronicity for
UK firms after mandatory IFRS adoption in 2005 relative to pre adoption period. A negative
coefficient on 𝛽1 is consistent with the view that improved transparency after IFRS adoption will
143
facilitate the incorporation of firm-specific information into stock price, leading to a more
informative stock price.
Table 5.9 presents the results of the fixed effect regression model for EQ.6. As reported in table
5.9, the coefficient of IFRS adoption is negative and statistically significant with estimated
coefficient and p_value of -0.161 and <0.1, respectively. Specifically, the stock price
synchronicity decreased by about 7.7% after the mandatory adoption of IFRS (the coefficient is -
0.170 and the constant term is -2.2). This result is in line with the encouragement effect of IFRS
adoption and supports the first hypothesis that the higher transparency after the mandatory
adoption of IFRS facilitates the incorporation of firm-specific information into the stock price;
hence reduces the synchronous comovement of the firm’s stock return with market and industry
returns. Where it seems that the improved transparency associated with mandatory IFRS
adoption encourages informed traders to collect, process, and trade on firm-specific information.
Trading on firm-specific information increases the proportion of firms-specific information that
is incorporated into stock price in relation to market-wide and industry-wide information, leading
to less comovement of the stock price, or higher firm-specific return variation (low stock price
synchronicity). This result is in line with the findings of Eun et al. (2015), Hasan et al. (2014),
Kim and Shi (2012a), Hutton et al. (2009), Haggard et al. (2008), Jin and Myers (2006) and
others who provide evidence that more transparency improves the availability of firm-specific
information in the market and facilitates the incorporation of firm-specific information into stock
price, leading to less synchronous stock price.
With regard to the control variables, consistent with prior studies, financial analysts-following
(FOLL) has a significant positive effect on stock price synchronicity, with estimated coefficient
and p-value of 0.187 and <0.001, respectively. This positive effect of analysts-following (FOLL)
on stock price synchronicity corroborates the findings of Kim and Shi (2012a), Fernandes and
Ferreira (2008), Ferreira and Laux (2007), Chan and Hameed (2006), Veldkamp (2006a), and
Piotroski and Roulstone (2004) who document a significant positive effect of (FOLL) on stock
price synchronicity. Piotroski and Roulstone (2004) explain this effect by arguing that, financial
analysts are outsiders with limited access to the firm-specific information, for this reason,
financial analysts try to focus their efforts on collecting and processing market wide and
industry-wide information and mapping these pieces of information with firm’s stock prices. For

144
this reason, the firms that are followed by a higher number of financial analysts are expected to
incorporate more market level and industry level information than firm-specific information,
leading to high stock price synchronicity, or lower firm-specific return variation.
Firm’s financial leverage (LEV) recorded a significant negative effect on stock price
synchronicity with p_value < 0.05. Hutton et al. (2009) suggest that the firm’s financial leverage
is expected to have an effect on stock price synchronicity through its impact on the sensitivity of
firms return to macroeconomic conditions and because it affects the division of risk bearing
between equity shareholders and debtors. Moreover, Beuselinck et al. (2010) expect a positive
relation between firm-specific return variation and firm’s financial leverage ratio, as they suggest
that the firms with high financial leverage have high intrinsic risk factors which may enforce the
investors to collect firm-specific information. So these results support the previous argument.
The negative effect of (LEV) on stock price synchronicity (SYNCH1) is in line with findings of
Kim and Yi (2015), Yu et al. (2013), Kim and Shi (2012a), and Gul, Srinidhi, et al. (2011) who
document a negative effect of the firm’s financial leverage on the firm’s stock price
synchronicity. These results support the view that data for firms with high financial leverage is
more valuable for this reason the investors try to collect, process and trade on this information,
leading to higher firm-specific return variation for high leveraged firms.
The other firm-specific control variable that expected to have an effect on synchronicity is the
firm’s market to book ratio (M/B) which used to measure the firm’s growth opportunities. Hutton
et al. (2009) argue that the market-to-book ratio places firms along a growth-versus-value
spectrum and thus could be systematically related to the firm-specific return variation. Consistent
with the findings of An and Zhang (2013), Yu et al. (2013) the estimated coefficient of (M/B) in
regression results table 4.9 is significantly positive. This result suggests that the firms with high
growth opportunities tend to have a more synchronous stock price.
In terms of firm size the regression results suggest a highly statistically and economically
significant positive effect of firm’s size (SIZE) on stock price synchronicity. Where the
regression results record an estimated coefficient and p_value at 0.332 and <0.001, respectively.
This result is consistent with the findings of Ben-Nasr and Cosset (2014), An and Zhang (2013),
Chan and Hameed (2006) that the higher firm size the higher stock price synchronicity. Piotroski
and Roulstone (2004) try to explain this effect of firm size on synchronicity by arguing that the

145
small firms consider the large firms as a market leader so the stock price of large firms tends to
have high stock price synchronicity. In addition, Bhushan (1989) argue that the firms size have a
great impact on financial analysts’ activities, whereas the large firms tend to attract more
financial analysts because the investors are likely to consider the piece of information about large
firms as more attractive than the same piece of information about a smaller firms, this argument
is supported by the high correlation between firm size and analyst-following (the correlation
between firms size and analysts-following as the highest among all the correlation between
variables). Because the larger firms tend to attract higher number of financial analysts than small
firms and the financial analysts tends to provide market-wide and industry-wide information than
firm-specific information, it is expected for the larger firms to incorporate these market and
industry level information into its stock price, which will lead to higher comovement or stock
price synchronicity.
Firm’s performance and profitability, as measured by the ratio of net income to total assets
(ROA), record a non-significant negative effect on stock price synchronicity.
The industry characteristics control variables reveal that, the higher number of firms on the
industry the higher comovement of stock prices with market and industry prices. This result is
consistent with the findings of Hasan et al. (2014), and Kim and Shi (2012a) who suggest a
positive effect of a number of firms in the industry on stock price synchronicity; however, this
effect is not significant.
Industry size (IND_SIZE), shows a significant negative effect on stock price synchronicity. This
result suggests that the large industries have a higher firm-specific return variation. This result
corporate the findings of Hasan et al. (2014).
The industry concentration (HERF_INDX) records a positive effect on stock price synchronicity.
This result is consistent with the prediction of Piotroski and Roulstone (2004) that in more
concentrated industry sectors the possibility of firms’ interdependence of each other is high, and
the release of new information related to any firm could be considered as a value relevance for
all other firms in that industry, leading to higher comovement of the stock price in more
concentrated industries. This positive effect of industry concentration on stock price

146
synchronicity is in line with the findings of Eun et al. (2015), Ben-Nasr and Cosset (2014),
Fernandes and Ferreira (2008), and Piotroski and Roulstone (2004).
In terms of variance of industry weekly return (VAR_IND_RET), which was used by Hutton et al.
(2009) to control for systematic risk, the regression results suggest a highly statistically
significant negative impact on stock price synchronicity with P_value less than (0.001). This
result contradicts with the findings of Hutton et al. (2009) who argue that the higher industry
return variance increases the systematic risk, and hence increases the stock price synchronicity.
The Financial Crisis (CISES) as one of systematic risk factors that affect all the stocks in the
market and has highly significant economic and statistical positive impact on the stock price
synchronicity with estimated coefficient and P_value at 0.468 and <0.001, respectively. Reinhart
and Rogoff (2009) suggest that during the recent financial crises the UK equity stock prices
collapse on average by 50 per cent, meaning that all the UK firms stock prices fall during this
period. In addition, Hutton et al. (2009) suggest that the systematic risk will lead to higher
comovement of stock prices.
Table 5-9 Regression Results for Testing H1
VARIABLE COEFFICIENT T_test
IFRS -0.161* -1.68
FOLL(log) 0.187*** 4.56
LEV -0.358*** -2.66
M/B(log) 0.192*** 6.07
SIZE(log) 0.330*** 9.66
ROA 0.001 -0.82
IND_NUMB(log) 0.174 1.05
IND_SIZE(log) 0.299*** -2.87
HERF_INDX 0.588 0.95
VAR_IND_RET -0.104*** -12.12
CRISES 0.472*** 12.40
CONSTANT -1.870 -1.17
Notes: this table presents the multivariate regression results for H1. The full sample comprises 6367 firm-year observations
representing 970 distinct UK firms during the period from 1990-2013. This regression results based on panel data industry

147
fixed effect model. The first column presents the explanatory variables. The dependent variable is stock price synchronicity
calculated by this model𝑹𝑬𝑻𝒊,𝒘 = 𝜶 + 𝜷𝟏𝑴𝑲𝑹𝑬𝑻𝑾 + 𝜷𝟐𝑴𝑲𝑹𝑬𝑻 − 𝟏𝑾 + 𝜷𝟑𝑰𝑵𝑫𝑹𝑬𝑻𝒊,𝒘 + 𝜷𝟒𝑰𝑵𝑫𝑹𝑬𝑻 − 𝟏𝒊,𝒘 +𝜺𝒊, 𝒘. The main independent variable is the mandatory adoption of IFRS; the full definitions of variables are available in
table 4.3 . The second, column presents the estimated coefficients change in the dependent variable as a result of one unit
change in the independent variable. The third column presents t_test value. Here *, **, *** present 10, 5, 1 % levels of
significant respectively for two tailed test. The industry fixed effect is included.
So it is expected for the financial crises to have a positive effect on synchronicity because the
financial crises affect all stocks in the market leading to high comovement of stock prices, hence
higher stock price synchronicity. For this reason, the stock price comovement increased during
the financial crises period leading to high stock price synchronicity.
5.3.2 Robustness test for H1 using different measure of stock price synchronicity
As a robustness test for the research results, the regressions were repeated using a different
measure of stock price synchronicity. Where the weekly stock return regressed with value
weighted marker return and value weighted industry return as follows:
𝑅𝐸𝑇𝑖,𝑤 = 𝛼 + 𝛽1𝑀𝐾𝑅𝐸𝑇𝑊 + 𝛽2𝐼𝑁𝐷𝑅𝐸𝑇𝑖,𝑤 + 𝜀𝑖, 𝑤
As reported in table 5.12, the regression results for the robustness test for testing the first
hypothesis (H1) are qualitatively similar to the results of the main regression. Whereas the
coefficient of IFRS adoption is negative and statistically significant with estimated coefficient
and p_value of -0.204 and <0.10, respectively. This result is consistent with the main results and
in line with the encouragement effect of IFRS adoption and supports the first hypothesis that the
higher transparency after the mandatory adoption of IFRS facilitates the incorporation of firm-
specific information into the stock price; hence reduce the synchronous comovement of firm’s
stock return with market and industry returns.
It seems that the improved transparency associated with mandatory IFRS adoption encourages
informed traders to collect, process, and trade on the firm-specific information. Trading on firm-
specific information increases the proportion of firm-specific information that incorporated into
stock price in relation to market-wide and industry-wide information, leading to less
comovement of the stock price, or higher firm-specific return variation (low stock price
synchronicity).
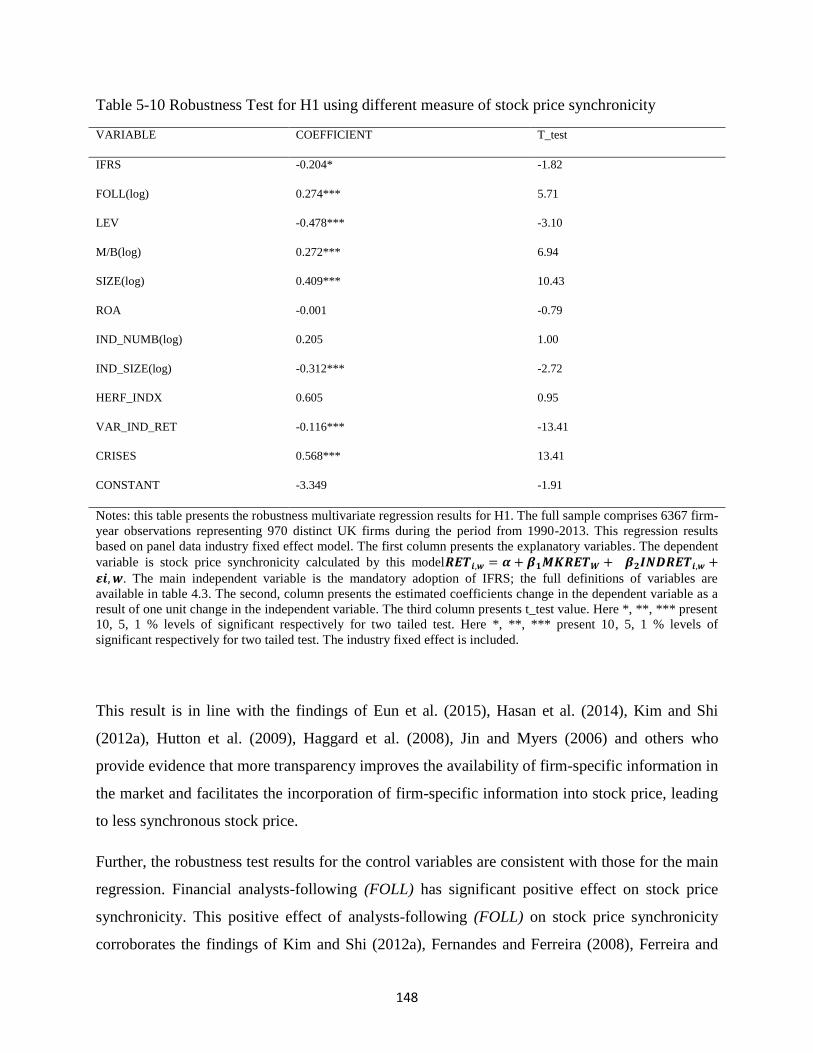
148
Table 5-10 Robustness Test for H1 using different measure of stock price synchronicity
VARIABLE COEFFICIENT T_test
IFRS -0.204* -1.82
FOLL(log) 0.274*** 5.71
LEV -0.478*** -3.10
M/B(log) 0.272*** 6.94
SIZE(log) 0.409*** 10.43
ROA -0.001 -0.79
IND_NUMB(log) 0.205 1.00
IND_SIZE(log) -0.312*** -2.72
HERF_INDX 0.605 0.95
VAR_IND_RET -0.116*** -13.41
CRISES 0.568*** 13.41
CONSTANT -3.349 -1.91
Notes: this table presents the robustness multivariate regression results for H1. The full sample comprises 6367 firm-
year observations representing 970 distinct UK firms during the period from 1990-2013. This regression results
based on panel data industry fixed effect model. The first column presents the explanatory variables. The dependent
variable is stock price synchronicity calculated by this model𝑹𝑬𝑻𝒊,𝒘 = 𝜶 + 𝜷𝟏𝑴𝑲𝑹𝑬𝑻𝑾 + 𝜷𝟐𝑰𝑵𝑫𝑹𝑬𝑻𝒊,𝒘 +𝜺𝒊, 𝒘. The main independent variable is the mandatory adoption of IFRS; the full definitions of variables are
available in table 4.3. The second, column presents the estimated coefficients change in the dependent variable as a
result of one unit change in the independent variable. The third column presents t_test value. Here *, **, *** present
10, 5, 1 % levels of significant respectively for two tailed test. Here *, **, *** present 10, 5, 1 % levels of
significant respectively for two tailed test. The industry fixed effect is included.
This result is in line with the findings of Eun et al. (2015), Hasan et al. (2014), Kim and Shi
(2012a), Hutton et al. (2009), Haggard et al. (2008), Jin and Myers (2006) and others who
provide evidence that more transparency improves the availability of firm-specific information in
the market and facilitates the incorporation of firm-specific information into stock price, leading
to less synchronous stock price.
Further, the robustness test results for the control variables are consistent with those for the main
regression. Financial analysts-following (FOLL) has significant positive effect on stock price
synchronicity. This positive effect of analysts-following (FOLL) on stock price synchronicity
corroborates the findings of Kim and Shi (2012a), Fernandes and Ferreira (2008), Ferreira and
149
Laux (2007), Chan and Hameed (2006), Veldkamp (2006a), and Piotroski and Roulstone (2004)
who document a significant positive effect of (FOLL) on stock price synchronicity.
With respect to other firms control variables the robustness test results are similar to that for the
main regression. Firm’s debt to asset ratio (LEV) and return on assets (ROA) record negative
effect on stock price synchronicity, while firm’s size (SIZE) and market to book ratio (M/B)
show a significant positive effect on stock price synchronicity.
In terms of industry characteristics, also the robustness test results are qualitatively similar to the
results of the main analysis. The number of firms in the industry (IND_NUMB) and the industry
concentration (HERF_INX) records positive effect on the comovement of stock price with
market return and industry return, this effect is not significant. However, the industry size
(IND_SIZE) and the variance of weekly industry return (VAR_IND_RET) have a significant
negative effect on stock price synchronicity.
As expected, consistent with the findings of the main regression The Financial Crises record a
significant positive effect on stock price synchronicity. This positive effect of financial crises on
stock price synchronicity is consistent with the argument of Hutton et al. (2009) that the
systematic risk is expected to increase the comovement of stock prices.
5.3.3 The results of testing H2
The second hypothesis H2 concerned in examining whether if there is an initial decrease in
synchronicity at the time of IFRS adoption followed by a subsequent increase in the latter
periods. To test this relationship, the author follows Houqe et al. (2014) and Li (2010) by
excluding transition period from the analysis. In particular, the data for the years from 2005 to
2007 were excluded, because these are years of transition to IFRS with different adoption dates.
In addition, data were excluded for the year 2008 to avoid the effect of lack of IFRS history and
knowledge on which investor can take their decisions as suggested by Ball (2006). After
applying these procedures, the sample consists of 4727 firm-year observations, 2371 of which
are from post-IFRS adoption sample.

150
All of the firms in the sample prepare their financial statements in accordance with IFRS after
2009, for this reason, to test H2, we follow Bissessur and Hodgson (2012) and Landsman et al.
(2012) by adding a year dummy on the IFRS period from 2009 until 2013. Where these dummy
variables take the value of 1 if the observations occur in 2009,2010,2011,2012, and 2013,
respectively. It is worth to mentioning that, the estimated coefficient for the constant represents
the base level of stock price synchronicity for pre-adoption period, and each of the coefficients
on the IFRS years dummies present the incremental change relative to the baseline level of
synchronicity after the adoption.
Table 5.10 provides the regression results of testing the second hypothesis. All the years after the
mandatory adoption show a negative effect of IFRS adoption on stock price synchronicity. The
economically and statistically significant negative effect of IFRS adoption on synchronicity
during all post-adoption years, except the year 2011 is not significant, suggest that the higher
accounting transparency of financial disclosure after the mandatory adoption of IFRS encourages
investors to collect, process, and use firm-specific information in their investment decisions. The
use of firm-specific information in the investment decision facilitates the incorporation of a
higher proportion of firm-specific information into stock price in relation to common market
wide and industry-wide information, leading to less synchronous and more informative stock
price.
The negative coefficients of year dummies, D_2009, D_2010, D_2011 D_2012, D_2013, support
the view that improved transparency associated with IFRS reporting leads to more informative
stock price. The positive effect of transparency on stock price synchronicity is documented by
previous research. Whereas Morck et al. (2000) find that stock prices of developed and more
transparent economies have more firm-specific return variation than the stock prices for
developing economies. In addition, Hutton et al. (2009), Haggard et al. (2008), Jin and Myers
(2006), and Veldkamp (2006a) provide evidence that higher transparency improve the
availability of firm-specific information, which facilitate the incorporation of firm-specific
information into stock prices leading to lower stock price synchronicity. Also Kim and Shi
(2012a) find that the voluntary IFRS adopters have higher informative stock prices, as measured
by firm-specific return variations than non-adopters. Moreover, a recent paper conducted by Eun
151
et al. (2015) find that the stock prices of more transparent cultures have less comovement than
that located in less transparent cultures.
However this results contradict with the Dasgupta et al. (2010) theoretical prediction that, the
increase in transparency at first is likely to increase the firm-specific information flow to the
market, and hence increase the amount of firm private information that incorporated into stock
price, after that as more firm-specific information becomes available investors improve their
predictions about the occurrence of future events, leading to a reduction of the surprise effect of
future information release, making the stock price more synchronous.
With respect to the control variables the regression results are as follow. Analysts-following
(FOLL) records a significant positive effect on synchronicity. These results support the findings
of Kim and Shi (2012a), Fernandes and Ferreira (2008), Ferreira and Laux (2007), Chan and
Hameed (2006), Veldkamp (2006a), and Piotroski and Roulstone (2004) who document a
significant positive effect of (FOLL) on stock price synchronicity. Piotroski and Roulstone
(2004) explain the positive effect of financial analysts on stock price synchronicity, in that;
financial analysts are part of the firm’s outsiders with limited access to the firms-specific
information. The limited access of firm-specific information enforces financial analysts to focus
their efforts on collecting and processing market wide and industry-wide information and
mapping this information with firm’s stock prices. For this reason, the firms that are followed by
a higher number of financial analysts are expected to incorporate more market level and industry
level information than firm-specific information, leading to high stock price synchronicity, or
lower firm-specific return variation.
Firm’s financial leverage (LEV) recorded a significant negative effect on stock price
synchronicity with p_value < 0.01. Hutton et al. (2009) suggest that the firm’s financial leverage
is expected to have an effect on stock price synchronicity through its impact on the sensitivity of
firms return to macroeconomic conditions and because it affects the division of risk bearing
between equity shareholders and debtors. Moreover, Beuselinck et al. (2010) expect a positive
relation between firm-specific return variation and firm’s financial leverage ratio, as they suggest
that the firms with high financial leverage have high intrinsic risk factors which may enforce the
investors to collect firm-specific information. So this results support the previous argument. The
negative effect of (LEV) on stock price synchronicity (SYNCH1) is in line with findings of Kim

152
and Yi (2015), Yu et al. (2013), Kim and Shi (2012a), and Gul, Srinidhi, et al. (2011) who
document a negative effect of firm’s financial leverage on firm’s stock price synchronicity.
These results support the view that data for firms with high financial leverage are more valuable
for this reason the investors try to collect, process and trade on this information, leading to higher
firm-specific return variation for high leveraged firms.
The other firm-specific control variable that expected to have an effect on synchronicity is the
firm’s market to book ratio (M/B) which used to measure the firm’s growth opportunities. Hutton
et al. (2009) argue that the market-to-book ratio places firms along a growth-versus-value
spectrum and thus could be systematically related to the firm-specific return variation. Consistent
with the findings of An and Zhang (2013), Yu et al. (2013) the estimated coefficient of (M/B) in
regression results table 4.9 is significantly positive. This result suggests that the firms with high
growth opportunities tend to have a more synchronous stock price.
In terms of firm size, the regression results suggest a highly statistically and economically
significant positive effect of firm’s size (SIZE) on stock price synchronicity. Where the
regression results record an estimated coefficient and p_value at 0.327 and <0.001, respectively.
This result is consistent with the findings of Ben-Nasr and Cosset (2014), An and Zhang (2013),
Chan and Hameed (2006) that the higher firm size the higher stock price synchronicity.
Piotroski and Roulstone (2004) try to explain this effect of firm size on synchronicity by arguing
that the small firms consider the large firms as a market leader, so the stock price of large firms
tends to have high stock price synchronicity. In addition, Bhushan (1989) argue that the firms
size have a great impact on financial analysts’ activities, whereas the large firms tend to attract
more financial analysts because the investors are likely to consider the piece of information
about large firms as more attractive than the same piece of information about a smaller firms,
this argument is supported by the high correlation between firm size and analysts-following (the
correlation between firms size and analysts-following as the highest among all the correlation
between variables).
In addition, larger firms tend to attract higher numbers of financial analysts than small firms.
According to Piotroski and Roulstone (2004), Chan and Hameed (2006), and Fernandes and
Ferreira (2008) financial analysts tend to provide market-wide and industry-wide information

153
rather than firm-specific information. For this reason, it is expected for the larger firms to
incorporate these market and industry level information into its stock price, which will lead to
higher comovement or higher stock price synchronicity.
Firm’s performance and profitability (ROA), recording a non-significant negative effect on stock
price synchronicity, suggesting that firm’s performance has no effect on the informativeness of
stock price.
In terms of industry characteristics control variables, the results are as follow:
The number of firms in the industry (IND_NUMB) records insignificant positive effect on stock
price synchronicity. Piotroski and Roulstone (2004) suggest that (IND_NUMB) is expected to
control for any differences in R2 arising from differences in sample size used for estimation
purposes. This result is consistent with the findings of Gul et al. (2010), who find that number of
firms in the industry have no effect on stock price synchronicity.
Industry size (IND_SIZE), shows a significant negative effect on stock price synchronicity. This
result suggests that the large industries have a higher firm-specific return variation. These results
corroborate the findings of Hasan et al. (2014).
The industry concentration (HERF_INDX), records a positive effect on stock price synchronicity.
This result is consistent with the prediction of Piotroski and Roulstone (2004) that in more
concentrated industry sectors the possibility of firms interdependence on each other is high, and
the release of new information related to any firm could be considered as a value relevance for
all other firms in that industry, leading to higher comovement of the stock price in more
concentrated industries. This positive effect of industry concentration on stock price
synchronicity is in line with the findings of Eun et al. (2015), Ben-Nasr and Cosset (2014),
Fernandes and Ferreira (2008), and Piotroski and Roulstone (2004).
In terms of variance of industry weekly return (VAR_IND_RET), which is used by Hutton et al.
(2009) to control for systematic risk, the regression results suggest a highly statistically
significant negative impact on stock price synchronicity with P_value less than (0.001). This
result contradicts with the findings of Hutton et al. (2009) who argue that higher industry return
variance increase systematic risk, and hence increase stock price synchronicity because the

154
systematic risk affects all the firms in the market or the industry leading to high comovement of
firms stock price.
The Financial Crisis (CISES) as one of systematic risk factors that affect all the stocks in the
market has highly significant economic and statistical positive impact on the stock price
synchronicity with estimated coefficient and P_value at 0.651 and <0.05, respectively. Reinhart
and Rogoff (2009) suggest that during the recent financial crisis the UK equity stock prices
collapse in average by 50 per cent, meaning that all the UK firms stock prices fall during this
period. In addition, Hutton et al. (2009) suggest that the systematic risk will lead to higher
comovement of stock prices. So it is expected for the financial crises to have a positive effect on
synchronicity because the financial crises affect all stocks in the market leading to high
comovement of stock prices, hence higher stock price synchronicity. For this reason, the stock
price comovement increased during the financial crises period leading to high stock price
synchronicity.
Table 5-11 Regression Results for Testing H2
VARIABLE COEFFICIENT T_test
D_2009 -0.367* -1.76
D_2010 -0.438** -2.03
D_2011 - 0.118 -0.56
D_2012 -0.708*** -3.33
D_2013 -0.469*** -2.87
FOLL(log) 0.169*** 3.78
LEV -0.488*** -2.71
M/B(log) 0.180*** 4.95
SIZE(log) 0.327*** 9.09
ROA -0.002 -1.57
IND_NUMB(log) 0.120 0.51
IND_SIZE(log) -0.293* -1.92
HERF_INDX 0.331 0.46
VAR_IND_RET -0.104*** -13.43
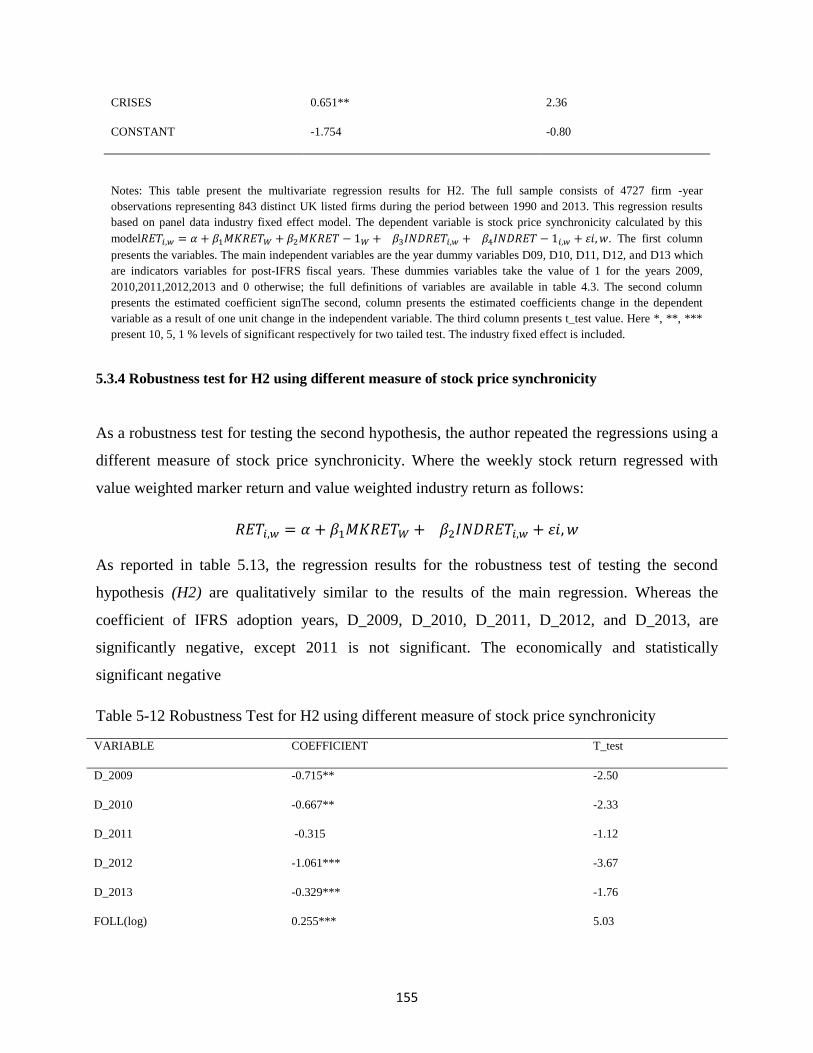
155
CRISES 0.651** 2.36
CONSTANT -1.754 -0.80
Notes: This table present the multivariate regression results for H2. The full sample consists of 4727 firm -year
observations representing 843 distinct UK listed firms during the period between 1990 and 2013. This regression results
based on panel data industry fixed effect model. The dependent variable is stock price synchronicity calculated by this
model𝑅𝐸𝑇𝑖,𝑤 = 𝛼 + 𝛽1𝑀𝐾𝑅𝐸𝑇𝑊 + 𝛽2𝑀𝐾𝑅𝐸𝑇 − 1𝑊 + 𝛽3𝐼𝑁𝐷𝑅𝐸𝑇𝑖,𝑤 + 𝛽4𝐼𝑁𝐷𝑅𝐸𝑇 − 1𝑖,𝑤 + 𝜀𝑖, 𝑤. The first column
presents the variables. The main independent variables are the year dummy variables D09, D10, D11, D12, and D13 which
are indicators variables for post-IFRS fiscal years. These dummies variables take the value of 1 for the years 2009,
2010,2011,2012,2013 and 0 otherwise; the full definitions of variables are available in table 4.3. The second column
presents the estimated coefficient signThe second, column presents the estimated coefficients change in the dependent
variable as a result of one unit change in the independent variable. The third column presents t_test value. Here *, **, ***
present 10, 5, 1 % levels of significant respectively for two tailed test. The industry fixed effect is included.
5.3.4 Robustness test for H2 using different measure of stock price synchronicity
As a robustness test for testing the second hypothesis, the author repeated the regressions using a
different measure of stock price synchronicity. Where the weekly stock return regressed with
value weighted marker return and value weighted industry return as follows:
𝑅𝐸𝑇𝑖,𝑤 = 𝛼 + 𝛽1𝑀𝐾𝑅𝐸𝑇𝑊 + 𝛽2𝐼𝑁𝐷𝑅𝐸𝑇𝑖,𝑤 + 𝜀𝑖, 𝑤
As reported in table 5.13, the regression results for the robustness test of testing the second
hypothesis (H2) are qualitatively similar to the results of the main regression. Whereas the
coefficient of IFRS adoption years, D_2009, D_2010, D_2011, D_2012, and D_2013, are
significantly negative, except 2011 is not significant. The economically and statistically
significant negative
Table 5-12 Robustness Test for H2 using different measure of stock price synchronicity
VARIABLE COEFFICIENT T_test
D_2009 -0.715** -2.50
D_2010 -0.667** -2.33
D_2011 -0.315 -1.12
D_2012 -1.061*** -3.67
D_2013 -0.329*** -1.76
FOLL(log) 0.255*** 5.03
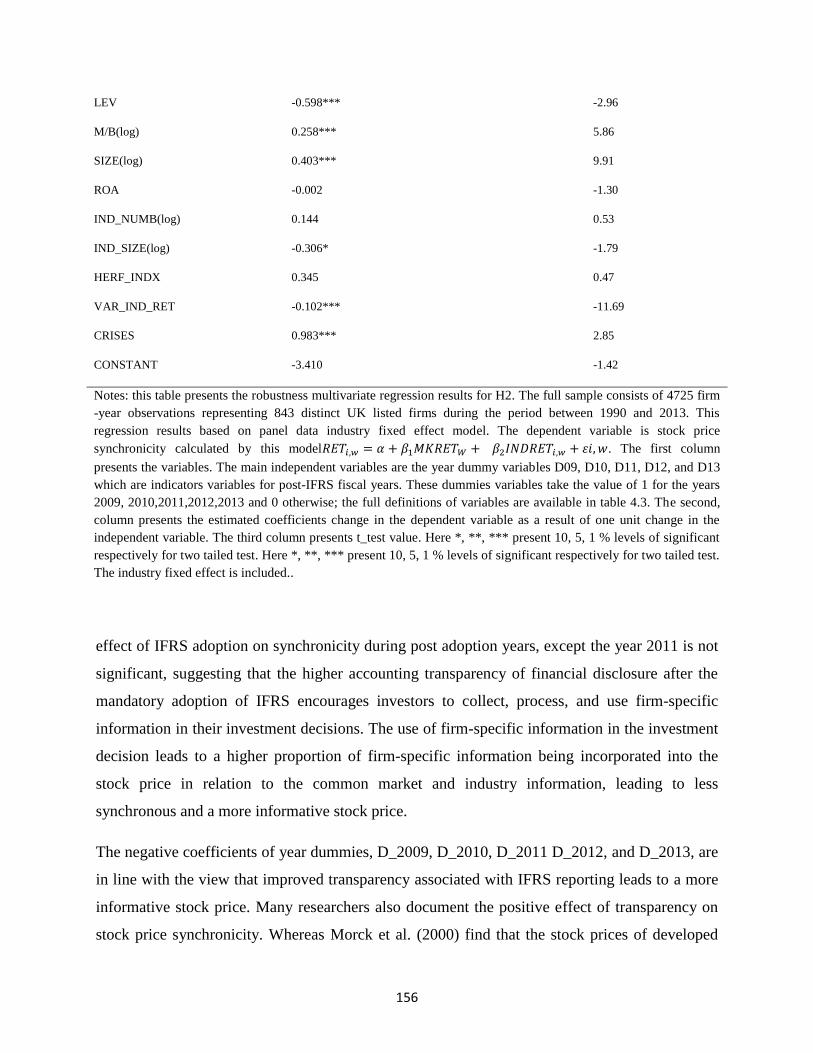
156
LEV -0.598*** -2.96
M/B(log) 0.258*** 5.86
SIZE(log) 0.403*** 9.91
ROA -0.002 -1.30
IND_NUMB(log) 0.144 0.53
IND_SIZE(log) -0.306* -1.79
HERF_INDX 0.345 0.47
VAR_IND_RET -0.102*** -11.69
CRISES 0.983*** 2.85
CONSTANT -3.410 -1.42
Notes: this table presents the robustness multivariate regression results for H2. The full sample consists of 4725 firm
-year observations representing 843 distinct UK listed firms during the period between 1990 and 2013. This
regression results based on panel data industry fixed effect model. The dependent variable is stock price
synchronicity calculated by this model𝑅𝐸𝑇𝑖,𝑤 = 𝛼 + 𝛽1𝑀𝐾𝑅𝐸𝑇𝑊 + 𝛽2𝐼𝑁𝐷𝑅𝐸𝑇𝑖,𝑤 + 𝜀𝑖, 𝑤. The first column
presents the variables. The main independent variables are the year dummy variables D09, D10, D11, D12, and D13
which are indicators variables for post-IFRS fiscal years. These dummies variables take the value of 1 for the years
2009, 2010,2011,2012,2013 and 0 otherwise; the full definitions of variables are available in table 4.3. The second,
column presents the estimated coefficients change in the dependent variable as a result of one unit change in the
independent variable. The third column presents t_test value. Here *, **, *** present 10, 5, 1 % levels of significant
respectively for two tailed test. Here *, **, *** present 10, 5, 1 % levels of significant respectively for two tailed test.
The industry fixed effect is included..
effect of IFRS adoption on synchronicity during post adoption years, except the year 2011 is not
significant, suggesting that the higher accounting transparency of financial disclosure after the
mandatory adoption of IFRS encourages investors to collect, process, and use firm-specific
information in their investment decisions. The use of firm-specific information in the investment
decision leads to a higher proportion of firm-specific information being incorporated into the
stock price in relation to the common market and industry information, leading to less
synchronous and a more informative stock price.
The negative coefficients of year dummies, D_2009, D_2010, D_2011 D_2012, and D_2013, are
in line with the view that improved transparency associated with IFRS reporting leads to a more
informative stock price. Many researchers also document the positive effect of transparency on
stock price synchronicity. Whereas Morck et al. (2000) find that the stock prices of developed
157
and more transparent economies have more firm-specific return variation than the stock prices
for developing economies. In addition, Hutton et al. (2009), Haggard et al. (2008), Jin and Myers
(2006), and Veldkamp (2006a) provide evidence that higher transparency improves the
availability of firm-specific information, which facilitates the incorporation of firm-specific
information into stock prices leading to lower stock price synchronicity. Also Kim and Shi
(2012a) find that the voluntary adopters of IFRS have higher informative stock prices, as
measured by firm-specific return variations. Moreover, a recent paper conducted by Eun et al.
(2015) find that the stock prices of more transparent cultures have less comovement than that
located in less transparent cultures.
This result is consistent with the main results, and it is in line with the encouragement effect of
IFRS adoption and supports the first hypothesis that the higher transparency after the mandatory
adoption of IFRS facilitates the incorporation of firm-specific information into the stock price;
hence reducing the synchronous comovement of firm’s stock return with market and industry
returns.
It seems that the improved transparency associated with mandatory IFRS adoption encourages
informed investors to collect, process, and trade on the firm-specific information. Trading on
firm-specific information increases the proportion of firm-specific information that is
incorporated into stock price in relation to market-wide and industry-wide information, leading
to less comovement of the stock price, or higher firm-specific return variation (low stock price
synchronicity).
This result is in line with the findings of Eun et al. (2015), Hasan et al. (2014), Kim and Shi
(2012a), Hutton et al. (2009), Haggard et al. (2008), Jin and Myers (2006) and others who
provide evidence that more transparency improves the availability of firm-specific information in
the market and facilitates the incorporation of firm-specific information into stock price, leading
to less synchronous stock price.
In terms of the robustness test results for the control variables, it is consistent with that for the
main regression. Financial analysts-following (FOLL) has significant positive effect on stock
price synchronicity. This positive effect of analysts-following (FOLL) on stock price
synchronicity corroborates the findings of Kim and Shi (2012a), Fernandes and Ferreira (2008),

158
Ferreira and Laux (2007), Chan and Hameed (2006), Veldkamp (2006a), and Piotroski and
Roulstone (2004) who document a significant positive effect of (FOLL) on stock price
synchronicity.
With respect to other firms’ control variables the robustness test, results are similar to that for the
main regression. Firm’s debt to asset ratio (LEV) and return on assets (ROA) record negative
effect on stock price synchronicity, while firm’s size (SIZE) and market to book ratio (M/B)
show a significant positive effect on stock price synchronicity.
In terms of industry characteristics, also the robustness test results are qualitatively similar to the
results of the main analysis. The number of firms in the industry (IND_NUMB) and industry
concentration (HERF_INX) records positive effect on the comovement of stock price with
market return and industry return, this effect is not significant. However, the industry size
(IND_SIZE) and the variance of weekly industry return (VAR_IND_RET) have a significant
negative effect on stock price synchronicity.
Consistent with the findings of the main regression The Financial Crises record a significant
positive effect on stock price synchronicity. This positive effect of financial crises on stock price
synchronicity is consistent with the argument of Hutton et al. (2009) that the systematic risk is
expected to increase the comovement of stock prices.
As an additional robustness test, we generate a dynamic variable called adoption age. This
variable capture if the effect of improved transparency leads to an initial decrease in stock price
synchronicity, followed by a subsequent increase in the latter period. This variable equal to zero
for all years before the adoption and equal to one if the year is the first year of the adoption, two
if the year is the second year of the adoption, and so on.
If higher transparency associated with mandatory IFRS adoption leads to an initial reduction in
stock price synchronicity, followed by a subsequent increase in stock price synchronicity during
the latter periods, then one could expect a positive relation between adoption age and stock price
synchronicity. However, if higher transparency associated with mandatory IFRS adoption leads
to a consistent reduction in stock price synchronicity, then one could expect a negative relation
between adoption age and stock price synchronicity.
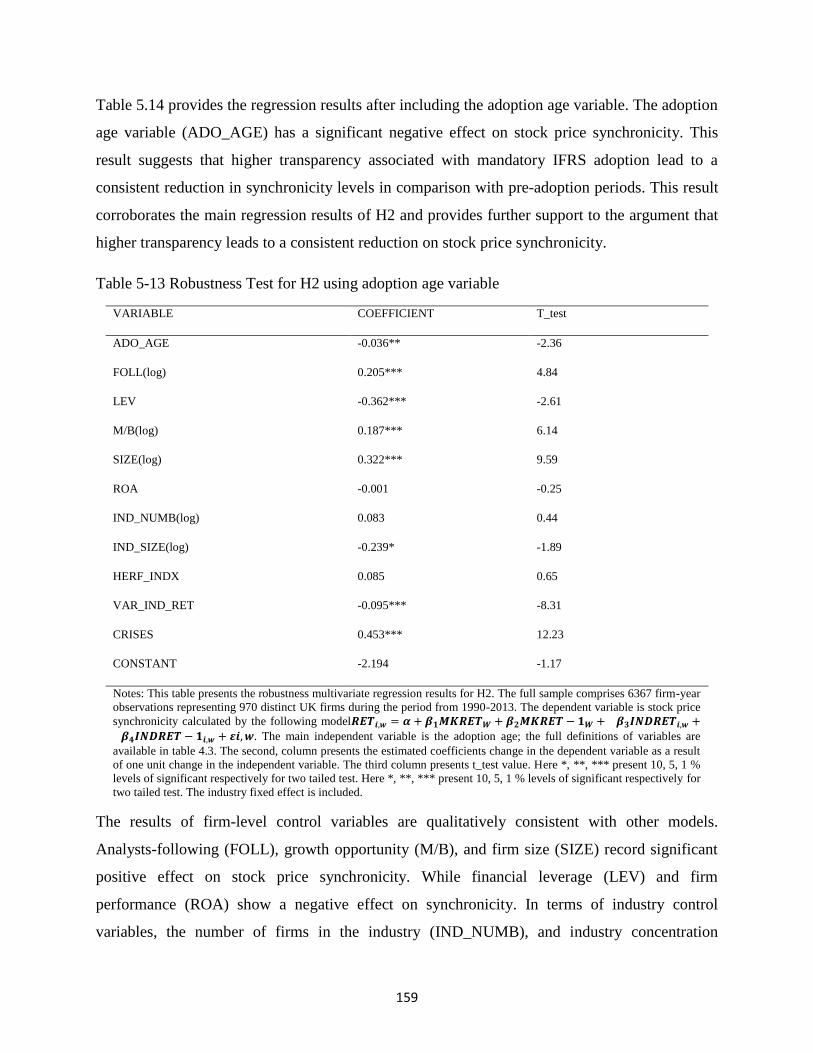
159
Table 5.14 provides the regression results after including the adoption age variable. The adoption
age variable (ADO_AGE) has a significant negative effect on stock price synchronicity. This
result suggests that higher transparency associated with mandatory IFRS adoption lead to a
consistent reduction in synchronicity levels in comparison with pre-adoption periods. This result
corroborates the main regression results of H2 and provides further support to the argument that
higher transparency leads to a consistent reduction on stock price synchronicity.
Table 5-13 Robustness Test for H2 using adoption age variable
VARIABLE COEFFICIENT T_test
ADO_AGE -0.036** -2.36
FOLL(log) 0.205*** 4.84
LEV -0.362*** -2.61
M/B(log) 0.187*** 6.14
SIZE(log) 0.322*** 9.59
ROA -0.001 -0.25
IND_NUMB(log) 0.083 0.44
IND_SIZE(log) -0.239* -1.89
HERF_INDX 0.085 0.65
VAR_IND_RET -0.095*** -8.31
CRISES 0.453*** 12.23
CONSTANT -2.194 -1.17
Notes: This table presents the robustness multivariate regression results for H2. The full sample comprises 6367 firm-year
observations representing 970 distinct UK firms during the period from 1990-2013. The dependent variable is stock price
synchronicity calculated by the following model𝑹𝑬𝑻𝒊,𝒘 = 𝜶 + 𝜷𝟏𝑴𝑲𝑹𝑬𝑻𝑾 + 𝜷𝟐𝑴𝑲𝑹𝑬𝑻 − 𝟏𝑾 + 𝜷𝟑𝑰𝑵𝑫𝑹𝑬𝑻𝒊,𝒘 +
𝜷𝟒𝑰𝑵𝑫𝑹𝑬𝑻 − 𝟏𝒊,𝒘 + 𝜺𝒊, 𝒘. The main independent variable is the adoption age; the full definitions of variables are
available in table 4.3. The second, column presents the estimated coefficients change in the dependent variable as a result
of one unit change in the independent variable. The third column presents t_test value. Here *, **, *** present 10, 5, 1 %
levels of significant respectively for two tailed test. Here *, **, *** present 10, 5, 1 % levels of significant respectively for
two tailed test. The industry fixed effect is included.
The results of firm-level control variables are qualitatively consistent with other models.
Analysts-following (FOLL), growth opportunity (M/B), and firm size (SIZE) record significant
positive effect on stock price synchronicity. While financial leverage (LEV) and firm
performance (ROA) show a negative effect on synchronicity. In terms of industry control
variables, the number of firms in the industry (IND_NUMB), and industry concentration
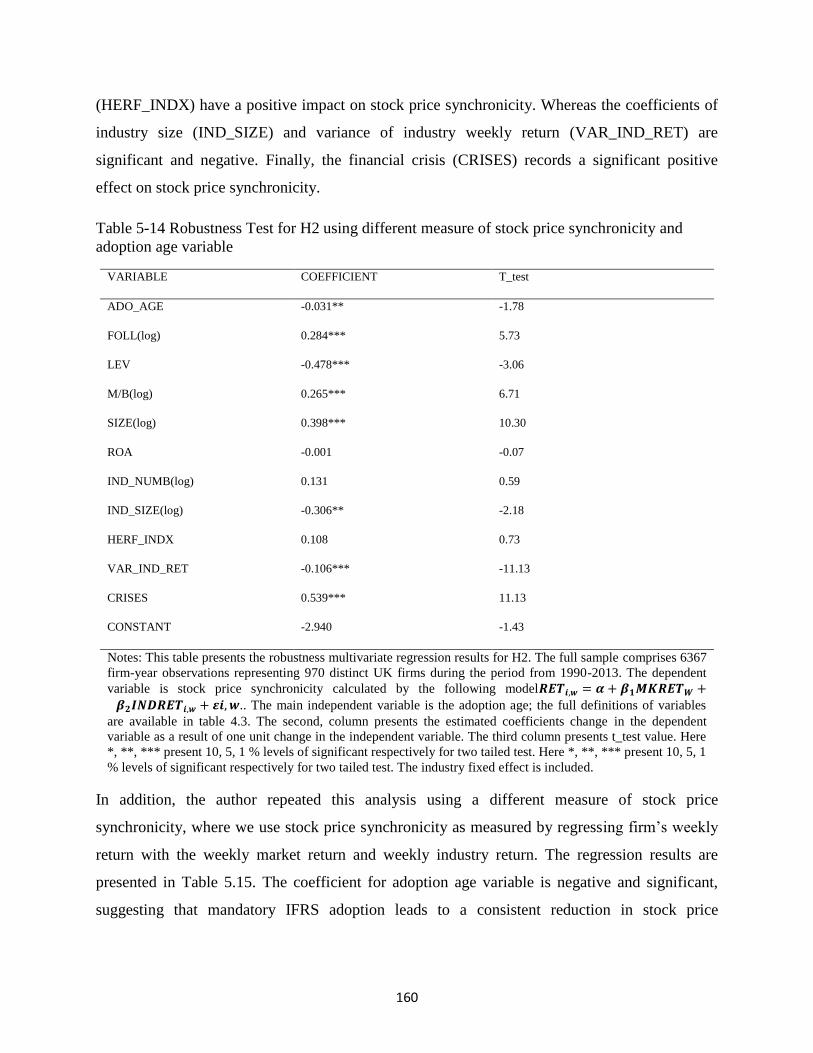
160
(HERF_INDX) have a positive impact on stock price synchronicity. Whereas the coefficients of
industry size (IND_SIZE) and variance of industry weekly return (VAR_IND_RET) are
significant and negative. Finally, the financial crisis (CRISES) records a significant positive
effect on stock price synchronicity.
Table 5-14 Robustness Test for H2 using different measure of stock price synchronicity and
adoption age variable
VARIABLE COEFFICIENT T_test
ADO_AGE -0.031** -1.78
FOLL(log) 0.284*** 5.73
LEV -0.478*** -3.06
M/B(log) 0.265*** 6.71
SIZE(log) 0.398*** 10.30
ROA -0.001 -0.07
IND_NUMB(log) 0.131 0.59
IND_SIZE(log) -0.306** -2.18
HERF_INDX 0.108 0.73
VAR_IND_RET -0.106*** -11.13
CRISES 0.539*** 11.13
CONSTANT -2.940 -1.43
Notes: This table presents the robustness multivariate regression results for H2. The full sample comprises 6367
firm-year observations representing 970 distinct UK firms during the period from 1990-2013. The dependent
variable is stock price synchronicity calculated by the following model𝑹𝑬𝑻𝒊,𝒘 = 𝜶 + 𝜷𝟏𝑴𝑲𝑹𝑬𝑻𝑾 +
𝜷𝟐𝑰𝑵𝑫𝑹𝑬𝑻𝒊,𝒘 + 𝜺𝒊, 𝒘.. The main independent variable is the adoption age; the full definitions of variables
are available in table 4.3. The second, column presents the estimated coefficients change in the dependent
variable as a result of one unit change in the independent variable. The third column presents t_test value. Here
*, **, *** present 10, 5, 1 % levels of significant respectively for two tailed test. Here *, **, *** present 10, 5, 1
% levels of significant respectively for two tailed test. The industry fixed effect is included.
In addition, the author repeated this analysis using a different measure of stock price
synchronicity, where we use stock price synchronicity as measured by regressing firm’s weekly
return with the weekly market return and weekly industry return. The regression results are
presented in Table 5.15. The coefficient for adoption age variable is negative and significant,
suggesting that mandatory IFRS adoption leads to a consistent reduction in stock price
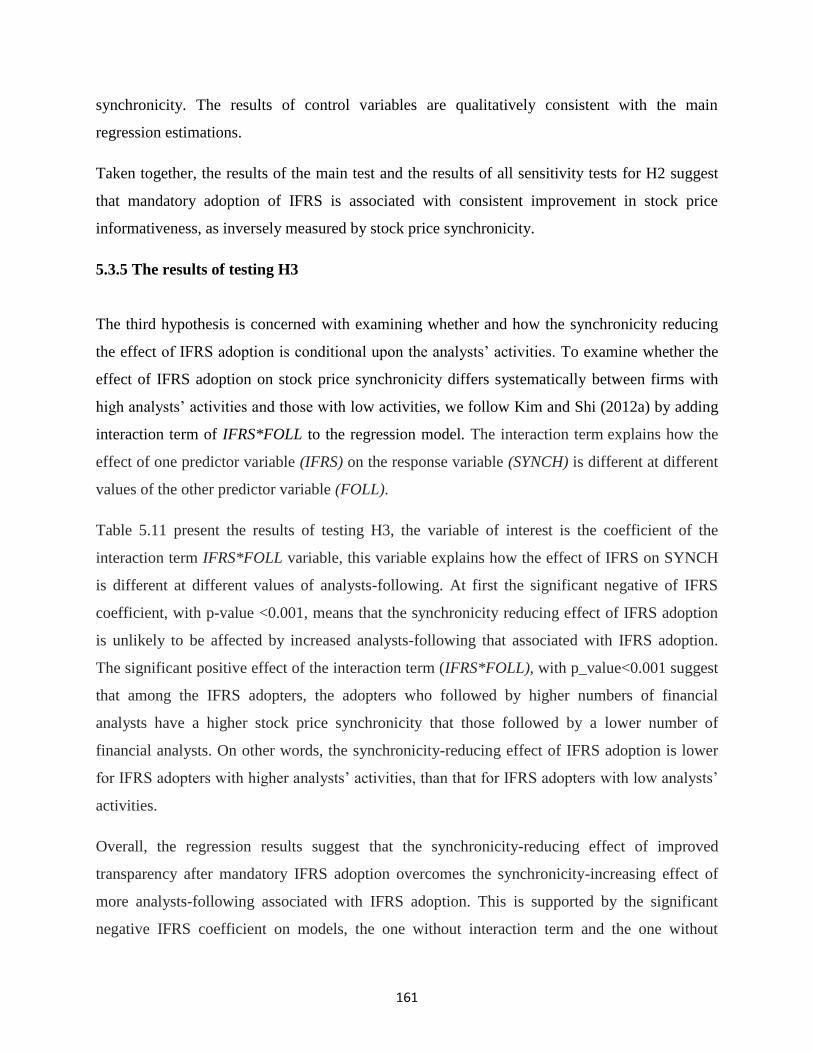
161
synchronicity. The results of control variables are qualitatively consistent with the main
regression estimations.
Taken together, the results of the main test and the results of all sensitivity tests for H2 suggest
that mandatory adoption of IFRS is associated with consistent improvement in stock price
informativeness, as inversely measured by stock price synchronicity.
5.3.5 The results of testing H3
The third hypothesis is concerned with examining whether and how the synchronicity reducing
the effect of IFRS adoption is conditional upon the analysts’ activities. To examine whether the
effect of IFRS adoption on stock price synchronicity differs systematically between firms with
high analysts’ activities and those with low activities, we follow Kim and Shi (2012a) by adding
interaction term of IFRS*FOLL to the regression model. The interaction term explains how the
effect of one predictor variable (IFRS) on the response variable (SYNCH) is different at different
values of the other predictor variable (FOLL).
Table 5.11 present the results of testing H3, the variable of interest is the coefficient of the
interaction term IFRS*FOLL variable, this variable explains how the effect of IFRS on SYNCH
is different at different values of analysts-following. At first the significant negative of IFRS
coefficient, with p-value <0.001, means that the synchronicity reducing effect of IFRS adoption
is unlikely to be affected by increased analysts-following that associated with IFRS adoption.
The significant positive effect of the interaction term (IFRS*FOLL), with p_value<0.001 suggest
that among the IFRS adopters, the adopters who followed by higher numbers of financial
analysts have a higher stock price synchronicity that those followed by a lower number of
financial analysts. On other words, the synchronicity-reducing effect of IFRS adoption is lower
for IFRS adopters with higher analysts’ activities, than that for IFRS adopters with low analysts’
activities.
Overall, the regression results suggest that the synchronicity-reducing effect of improved
transparency after mandatory IFRS adoption overcomes the synchronicity-increasing effect of
more analysts-following associated with IFRS adoption. This is supported by the significant
negative IFRS coefficient on models, the one without interaction term and the one without
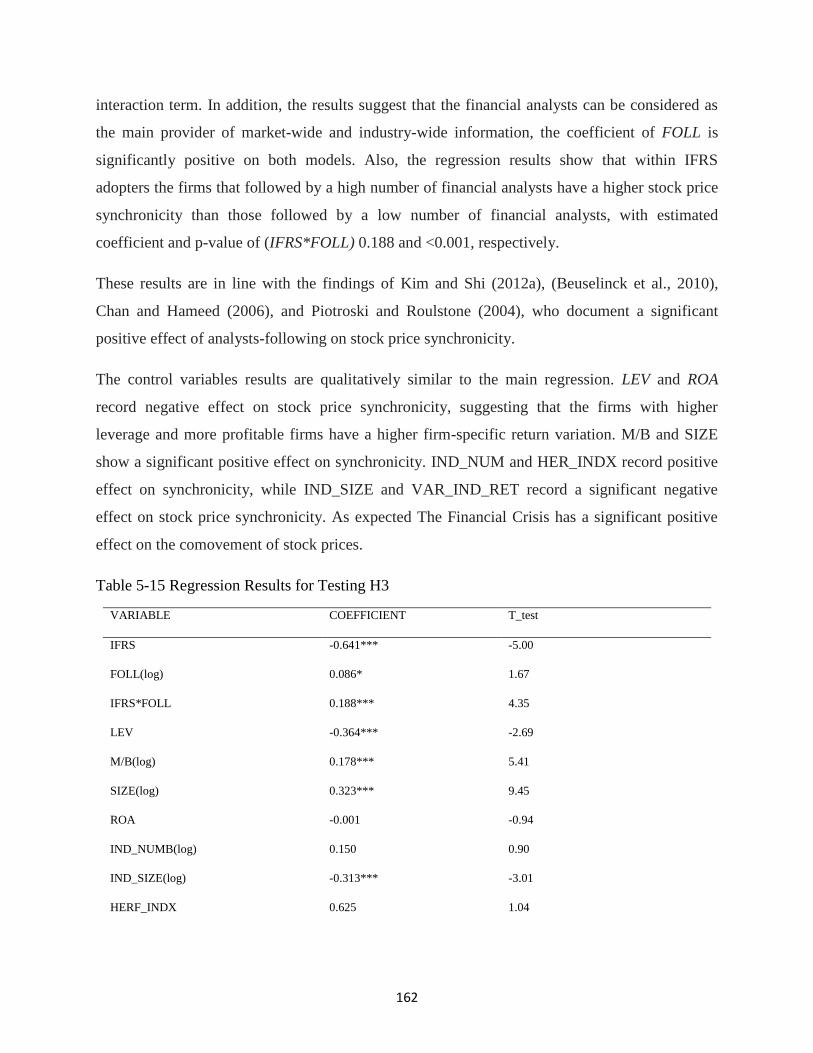
162
interaction term. In addition, the results suggest that the financial analysts can be considered as
the main provider of market-wide and industry-wide information, the coefficient of FOLL is
significantly positive on both models. Also, the regression results show that within IFRS
adopters the firms that followed by a high number of financial analysts have a higher stock price
synchronicity than those followed by a low number of financial analysts, with estimated
coefficient and p-value of (IFRS*FOLL) 0.188 and <0.001, respectively.
These results are in line with the findings of Kim and Shi (2012a), (Beuselinck et al., 2010),
Chan and Hameed (2006), and Piotroski and Roulstone (2004), who document a significant
positive effect of analysts-following on stock price synchronicity.
The control variables results are qualitatively similar to the main regression. LEV and ROA
record negative effect on stock price synchronicity, suggesting that the firms with higher
leverage and more profitable firms have a higher firm-specific return variation. M/B and SIZE
show a significant positive effect on synchronicity. IND_NUM and HER_INDX record positive
effect on synchronicity, while IND_SIZE and VAR_IND_RET record a significant negative
effect on stock price synchronicity. As expected The Financial Crisis has a significant positive
effect on the comovement of stock prices.
Table 5-15 Regression Results for Testing H3
VARIABLE COEFFICIENT T_test
IFRS -0.641*** -5.00
FOLL(log) 0.086* 1.67
IFRS*FOLL 0.188*** 4.35
LEV -0.364*** -2.69
M/B(log) 0.178*** 5.41
SIZE(log) 0.323*** 9.45
ROA -0.001 -0.94
IND_NUMB(log) 0.150 0.90
IND_SIZE(log) -0.313*** -3.01
HERF_INDX 0.625 1.04
163
VAR_IND_RET -0.103*** -11.14
CRISES 0.467*** 12.28
CONSTANT -1.213 -0.76
Notes: this table presents the multivariate regression results for H3. The full sample consists of 6367 firm -year
observations representing 970 distinct UK listed firms during the period between 1990 and 2013. This
regression results based on panel data industry fixed effect model. The dependent variable is stock price
synchronicity calculated by this model𝑅𝐸𝑇𝑖,𝑤 = 𝛼 + 𝛽1𝑀𝐾𝑅𝐸𝑇𝑊 + 𝛽2𝑀𝐾𝑅𝐸𝑇 − 1𝑊 + 𝛽3𝐼𝑁𝐷𝑅𝐸𝑇𝑖,𝑤 +
𝛽4𝐼𝑁𝐷𝑅𝐸𝑇 − 1𝑖,𝑤 + 𝜀𝑖, 𝑤. The first column presents the variables. The main independent variables are the
mandatory IFRS adoption (IFRS), analysts-following (FOLL), and the interaction term between IFRS adoption
and analysts-following (IFRS*FOLL); the full definitions of variables are available in table 4.3. The second,
column presents the estimated coefficients change in the dependent variable as a result of one unit change in
the independent variable. The third column presents t_test value. Here *, **, *** present 10, 5, 1 % levels of
significant respectively for two tailed test. Here *, **, *** present 10, 5, 1 % levels of significant respectively
for two tailed test. The industry fixed effect is included.
5.3.6 Robustness test for H3 using a different measure of stock price synchronicity
As a robustness test for the research results, the regressions were repeated using a different
measure of stock price synchronicity. Where the weekly stock return regressed with value
weighted marker return and value weighted industry return as follows:
𝑅𝐸𝑇𝑖,𝑤 = 𝛼 + 𝛽1𝑀𝐾𝑅𝐸𝑇𝑊 + 𝛽2𝐼𝑁𝐷𝑅𝐸𝑇𝑖,𝑤 + 𝜀𝑖, 𝑤
As reported in table 5.16, the regression results for the robustness test of testing the third
hypothesis (H3) are qualitatively similar to the results of the main regression. Where the
coefficient for IFRS variable, which represents the firms that adopt IFRS, records a significantly
negative effect on stock price synchronicity. This is consistent with the argument that improved
transparency after mandatory IFRS adoption facilitates the incorporation of firm-specific
information into stock prices. Many of previous pieces of research also document positive effect
of improved transparency on firm-specific return variation, for example (Ben-Nasr & Cosset,
2014; Eun et al., 2015; Haggard et al., 2008; Hutton et al., 2009; Jin & Myers, 2006; Kim & Shi,
2012a).
With respect to the financial analyst’s variable (FOLL), the regression results suggest a
significant positive effect of financial analysts on the stock price synchronicity. These results
support the view that financial analysts tend to provide common market wide and industry-wide
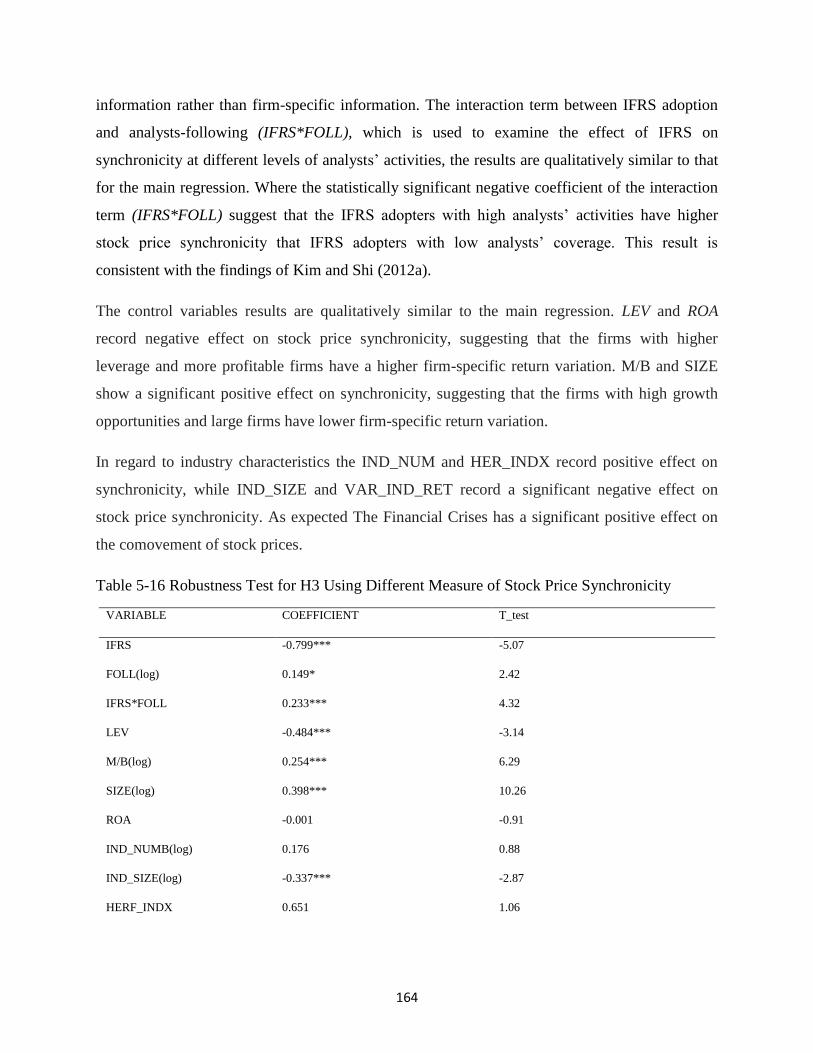
164
information rather than firm-specific information. The interaction term between IFRS adoption
and analysts-following (IFRS*FOLL), which is used to examine the effect of IFRS on
synchronicity at different levels of analysts’ activities, the results are qualitatively similar to that
for the main regression. Where the statistically significant negative coefficient of the interaction
term (IFRS*FOLL) suggest that the IFRS adopters with high analysts’ activities have higher
stock price synchronicity that IFRS adopters with low analysts’ coverage. This result is
consistent with the findings of Kim and Shi (2012a).
The control variables results are qualitatively similar to the main regression. LEV and ROA
record negative effect on stock price synchronicity, suggesting that the firms with higher
leverage and more profitable firms have a higher firm-specific return variation. M/B and SIZE
show a significant positive effect on synchronicity, suggesting that the firms with high growth
opportunities and large firms have lower firm-specific return variation.
In regard to industry characteristics the IND_NUM and HER_INDX record positive effect on
synchronicity, while IND_SIZE and VAR_IND_RET record a significant negative effect on
stock price synchronicity. As expected The Financial Crises has a significant positive effect on
the comovement of stock prices.
Table 5-16 Robustness Test for H3 Using Different Measure of Stock Price Synchronicity
VARIABLE COEFFICIENT T_test
IFRS -0.799*** -5.07
FOLL(log) 0.149* 2.42
IFRS*FOLL 0.233*** 4.32
LEV -0.484*** -3.14
M/B(log) 0.254*** 6.29
SIZE(log) 0.398*** 10.26
ROA -0.001 -0.91
IND_NUMB(log) 0.176 0.88
IND_SIZE(log) -0.337*** -2.87
HERF_INDX 0.651 1.06
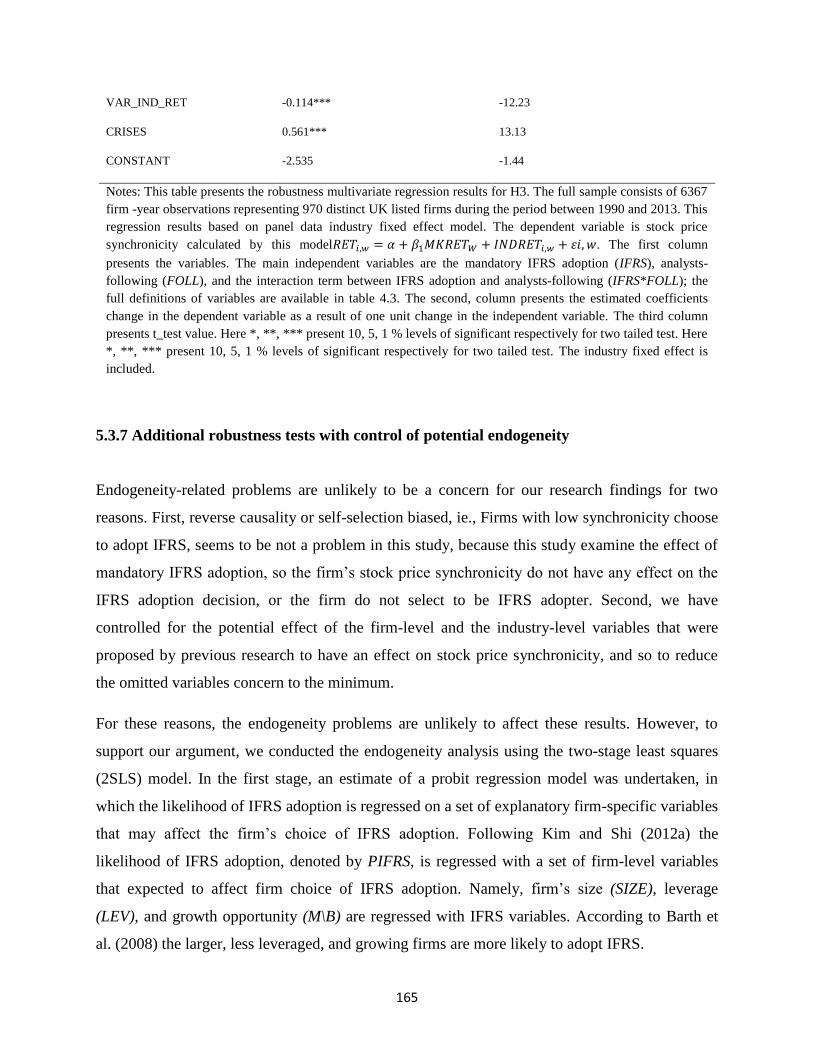
165
VAR_IND_RET -0.114*** -12.23
CRISES 0.561*** 13.13
CONSTANT -2.535 -1.44
Notes: This table presents the robustness multivariate regression results for H3. The full sample consists of 6367
firm -year observations representing 970 distinct UK listed firms during the period between 1990 and 2013. This
regression results based on panel data industry fixed effect model. The dependent variable is stock price
synchronicity calculated by this model𝑅𝐸𝑇𝑖,𝑤 = 𝛼 + 𝛽1𝑀𝐾𝑅𝐸𝑇𝑊 + 𝐼𝑁𝐷𝑅𝐸𝑇𝑖,𝑤 + 𝜀𝑖, 𝑤. The first column
presents the variables. The main independent variables are the mandatory IFRS adoption (IFRS), analysts-
following (FOLL), and the interaction term between IFRS adoption and analysts-following (IFRS*FOLL); the
full definitions of variables are available in table 4.3. The second, column presents the estimated coefficients
change in the dependent variable as a result of one unit change in the independent variable. The third column
presents t_test value. Here *, **, *** present 10, 5, 1 % levels of significant respectively for two tailed test. Here
*, **, *** present 10, 5, 1 % levels of significant respectively for two tailed test. The industry fixed effect is
included.
5.3.7 Additional robustness tests with control of potential endogeneity
Endogeneity-related problems are unlikely to be a concern for our research findings for two
reasons. First, reverse causality or self-selection biased, ie., Firms with low synchronicity choose
to adopt IFRS, seems to be not a problem in this study, because this study examine the effect of
mandatory IFRS adoption, so the firm’s stock price synchronicity do not have any effect on the
IFRS adoption decision, or the firm do not select to be IFRS adopter. Second, we have
controlled for the potential effect of the firm-level and the industry-level variables that were
proposed by previous research to have an effect on stock price synchronicity, and so to reduce
the omitted variables concern to the minimum.
For these reasons, the endogeneity problems are unlikely to affect these results. However, to
support our argument, we conducted the endogeneity analysis using the two-stage least squares
(2SLS) model. In the first stage, an estimate of a probit regression model was undertaken, in
which the likelihood of IFRS adoption is regressed on a set of explanatory firm-specific variables
that may affect the firm’s choice of IFRS adoption. Following Kim and Shi (2012a) the
likelihood of IFRS adoption, denoted by PIFRS, is regressed with a set of firm-level variables
that expected to affect firm choice of IFRS adoption. Namely, firm’s size (SIZE), leverage
(LEV), and growth opportunity (M\B) are regressed with IFRS variables. According to Barth et
al. (2008) the larger, less leveraged, and growing firms are more likely to adopt IFRS.
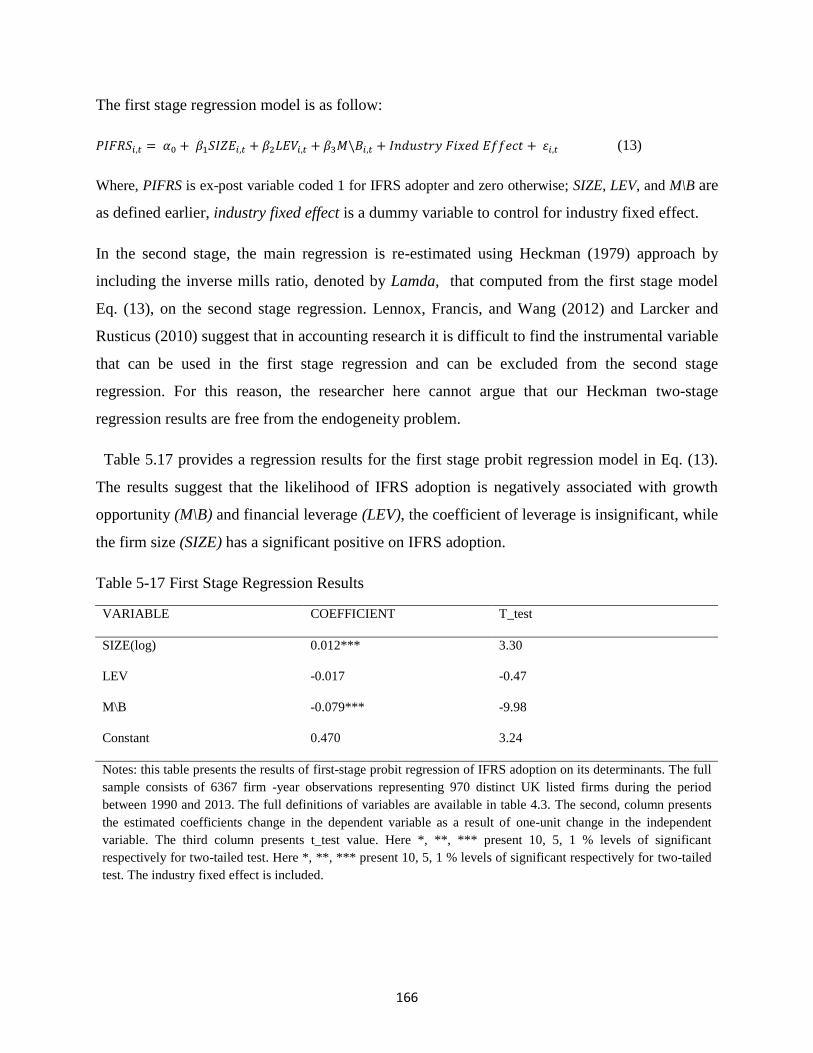
166
The first stage regression model is as follow:
𝑃𝐼𝐹𝑅𝑆𝑖,𝑡 = 𝛼0 + 𝛽1𝑆𝐼𝑍𝐸𝑖,𝑡 + 𝛽2𝐿𝐸𝑉𝑖,𝑡 + 𝛽3𝑀\𝐵𝑖,𝑡 + 𝐼𝑛𝑑𝑢𝑠𝑡𝑟𝑦 𝐹𝑖𝑥𝑒𝑑 𝐸𝑓𝑓𝑒𝑐𝑡 + 𝜀𝑖,𝑡 (13)
Where, PIFRS is ex-post variable coded 1 for IFRS adopter and zero otherwise; SIZE, LEV, and M\B are
as defined earlier, industry fixed effect is a dummy variable to control for industry fixed effect.
In the second stage, the main regression is re-estimated using Heckman (1979) approach by
including the inverse mills ratio, denoted by Lamda, that computed from the first stage model
Eq. (13), on the second stage regression. Lennox, Francis, and Wang (2012) and Larcker and
Rusticus (2010) suggest that in accounting research it is difficult to find the instrumental variable
that can be used in the first stage regression and can be excluded from the second stage
regression. For this reason, the researcher here cannot argue that our Heckman two-stage
regression results are free from the endogeneity problem.
Table 5.17 provides a regression results for the first stage probit regression model in Eq. (13).
The results suggest that the likelihood of IFRS adoption is negatively associated with growth
opportunity (M\B) and financial leverage (LEV), the coefficient of leverage is insignificant, while
the firm size (SIZE) has a significant positive on IFRS adoption.
Table 5-17 First Stage Regression Results
VARIABLE COEFFICIENT T_test
SIZE(log) 0.012*** 3.30
LEV -0.017 -0.47
M\B -0.079*** -9.98
Constant 0.470 3.24
Notes: this table presents the results of first-stage probit regression of IFRS adoption on its determinants. The full
sample consists of 6367 firm -year observations representing 970 distinct UK listed firms during the period
between 1990 and 2013. The full definitions of variables are available in table 4.3. The second, column presents
the estimated coefficients change in the dependent variable as a result of one-unit change in the independent
variable. The third column presents t_test value. Here *, **, *** present 10, 5, 1 % levels of significant
respectively for two-tailed test. Here *, **, *** present 10, 5, 1 % levels of significant respectively for two-tailed
test. The industry fixed effect is included.
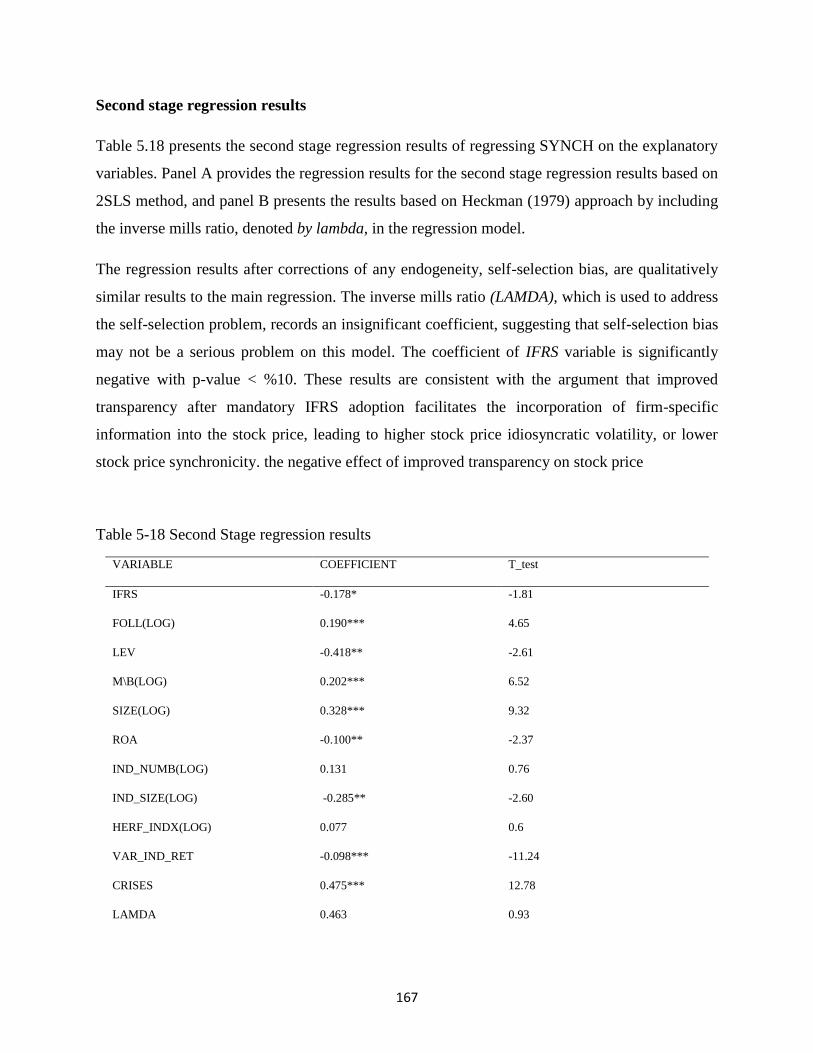
167
Second stage regression results
Table 5.18 presents the second stage regression results of regressing SYNCH on the explanatory
variables. Panel A provides the regression results for the second stage regression results based on
2SLS method, and panel B presents the results based on Heckman (1979) approach by including
the inverse mills ratio, denoted by lambda, in the regression model.
The regression results after corrections of any endogeneity, self-selection bias, are qualitatively
similar results to the main regression. The inverse mills ratio (LAMDA), which is used to address
the self-selection problem, records an insignificant coefficient, suggesting that self-selection bias
may not be a serious problem on this model. The coefficient of IFRS variable is significantly
negative with p-value < %10. These results are consistent with the argument that improved
transparency after mandatory IFRS adoption facilitates the incorporation of firm-specific
information into the stock price, leading to higher stock price idiosyncratic volatility, or lower
stock price synchronicity. the negative effect of improved transparency on stock price
Table 5-18 Second Stage regression results
VARIABLE COEFFICIENT T_test
IFRS -0.178* -1.81
FOLL(LOG) 0.190*** 4.65
LEV -0.418** -2.61
M\B(LOG) 0.202*** 6.52
SIZE(LOG) 0.328*** 9.32
ROA -0.100** -2.37
IND_NUMB(LOG) 0.131 0.76
IND_SIZE(LOG) -0.285** -2.60
HERF_INDX(LOG) 0.077 0.6
VAR_IND_RET -0.098*** -11.24
CRISES 0.475*** 12.78
LAMDA 0.463 0.93
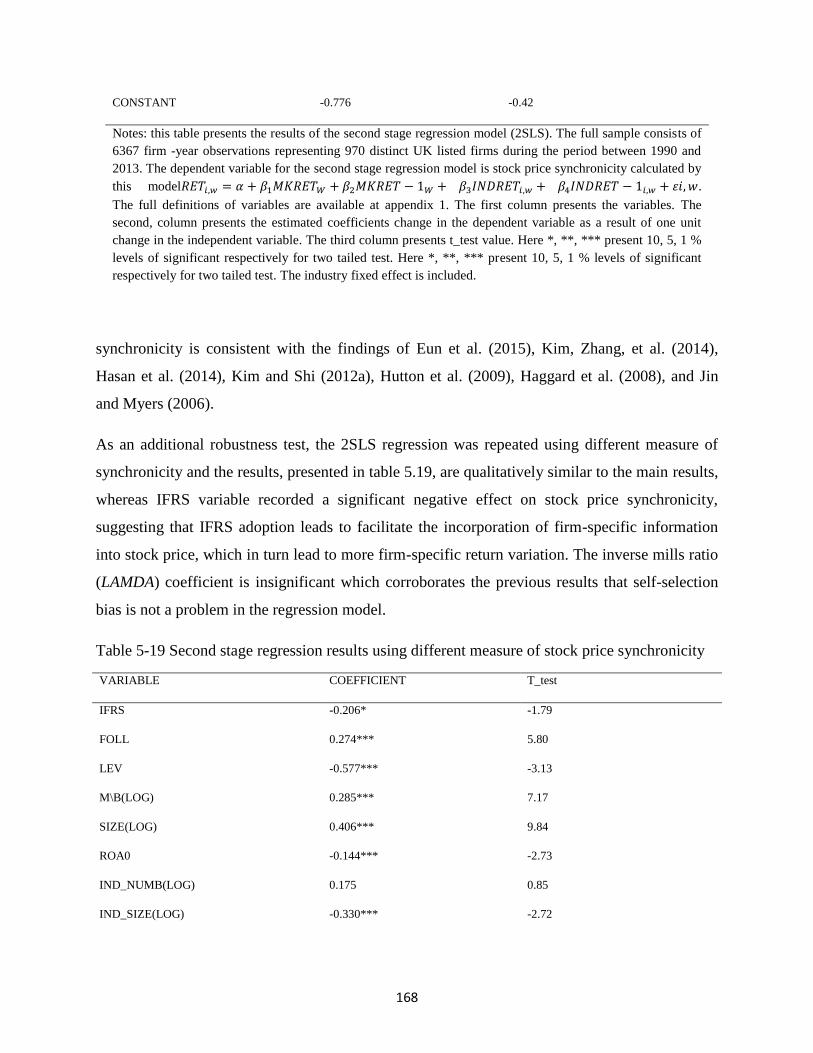
168
CONSTANT -0.776 -0.42
Notes: this table presents the results of the second stage regression model (2SLS). The full sample consists of
6367 firm -year observations representing 970 distinct UK listed firms during the period between 1990 and
2013. The dependent variable for the second stage regression model is stock price synchronicity calculated by
this model𝑅𝐸𝑇𝑖,𝑤 = 𝛼 + 𝛽1𝑀𝐾𝑅𝐸𝑇𝑊 + 𝛽2𝑀𝐾𝑅𝐸𝑇 − 1𝑊 + 𝛽3𝐼𝑁𝐷𝑅𝐸𝑇𝑖,𝑤 + 𝛽4𝐼𝑁𝐷𝑅𝐸𝑇 − 1𝑖,𝑤 + 𝜀𝑖, 𝑤.
The full definitions of variables are available at appendix 1. The first column presents the variables. The
second, column presents the estimated coefficients change in the dependent variable as a result of one unit
change in the independent variable. The third column presents t_test value. Here *, **, *** present 10, 5, 1 %
levels of significant respectively for two tailed test. Here *, **, *** present 10, 5, 1 % levels of significant
respectively for two tailed test. The industry fixed effect is included.
synchronicity is consistent with the findings of Eun et al. (2015), Kim, Zhang, et al. (2014),
Hasan et al. (2014), Kim and Shi (2012a), Hutton et al. (2009), Haggard et al. (2008), and Jin
and Myers (2006).
As an additional robustness test, the 2SLS regression was repeated using different measure of
synchronicity and the results, presented in table 5.19, are qualitatively similar to the main results,
whereas IFRS variable recorded a significant negative effect on stock price synchronicity,
suggesting that IFRS adoption leads to facilitate the incorporation of firm-specific information
into stock price, which in turn lead to more firm-specific return variation. The inverse mills ratio
(LAMDA) coefficient is insignificant which corroborates the previous results that self-selection
bias is not a problem in the regression model.
Table 5-19 Second stage regression results using different measure of stock price synchronicity
VARIABLE COEFFICIENT T_test
IFRS -0.206* -1.79
FOLL 0.274*** 5.80
LEV -0.577*** -3.13
M\B(LOG) 0.285*** 7.17
SIZE(LOG) 0.406*** 9.84
ROA0 -0.144*** -2.73
IND_NUMB(LOG) 0.175 0.85
IND_SIZE(LOG) -0.330*** -2.72
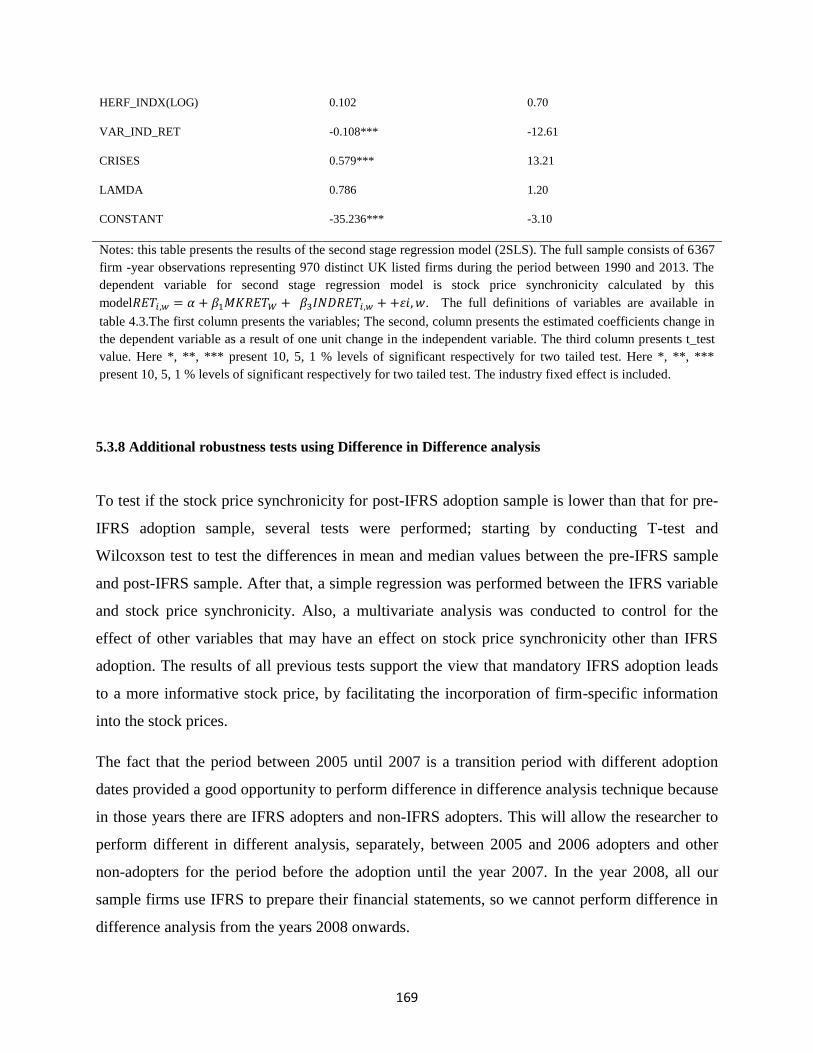
169
HERF_INDX(LOG) 0.102 0.70
VAR_IND_RET -0.108*** -12.61
CRISES 0.579*** 13.21
LAMDA 0.786 1.20
CONSTANT -35.236*** -3.10
Notes: this table presents the results of the second stage regression model (2SLS). The full sample consists of 6367
firm -year observations representing 970 distinct UK listed firms during the period between 1990 and 2013. The
dependent variable for second stage regression model is stock price synchronicity calculated by this
model𝑅𝐸𝑇𝑖,𝑤 = 𝛼 + 𝛽1𝑀𝐾𝑅𝐸𝑇𝑊 + 𝛽3𝐼𝑁𝐷𝑅𝐸𝑇𝑖,𝑤 + +𝜀𝑖, 𝑤. The full definitions of variables are available in
table 4.3.The first column presents the variables; The second, column presents the estimated coefficients change in
the dependent variable as a result of one unit change in the independent variable. The third column presents t_test
value. Here *, **, *** present 10, 5, 1 % levels of significant respectively for two tailed test. Here *, **, ***
present 10, 5, 1 % levels of significant respectively for two tailed test. The industry fixed effect is included.
5.3.8 Additional robustness tests using Difference in Difference analysis
To test if the stock price synchronicity for post-IFRS adoption sample is lower than that for pre-
IFRS adoption sample, several tests were performed; starting by conducting T-test and
Wilcoxson test to test the differences in mean and median values between the pre-IFRS sample
and post-IFRS sample. After that, a simple regression was performed between the IFRS variable
and stock price synchronicity. Also, a multivariate analysis was conducted to control for the
effect of other variables that may have an effect on stock price synchronicity other than IFRS
adoption. The results of all previous tests support the view that mandatory IFRS adoption leads
to a more informative stock price, by facilitating the incorporation of firm-specific information
into the stock prices.
The fact that the period between 2005 until 2007 is a transition period with different adoption
dates provided a good opportunity to perform difference in difference analysis technique because
in those years there are IFRS adopters and non-IFRS adopters. This will allow the researcher to
perform different in different analysis, separately, between 2005 and 2006 adopters and other
non-adopters for the period before the adoption until the year 2007. In the year 2008, all our
sample firms use IFRS to prepare their financial statements, so we cannot perform difference in
difference analysis from the years 2008 onwards.
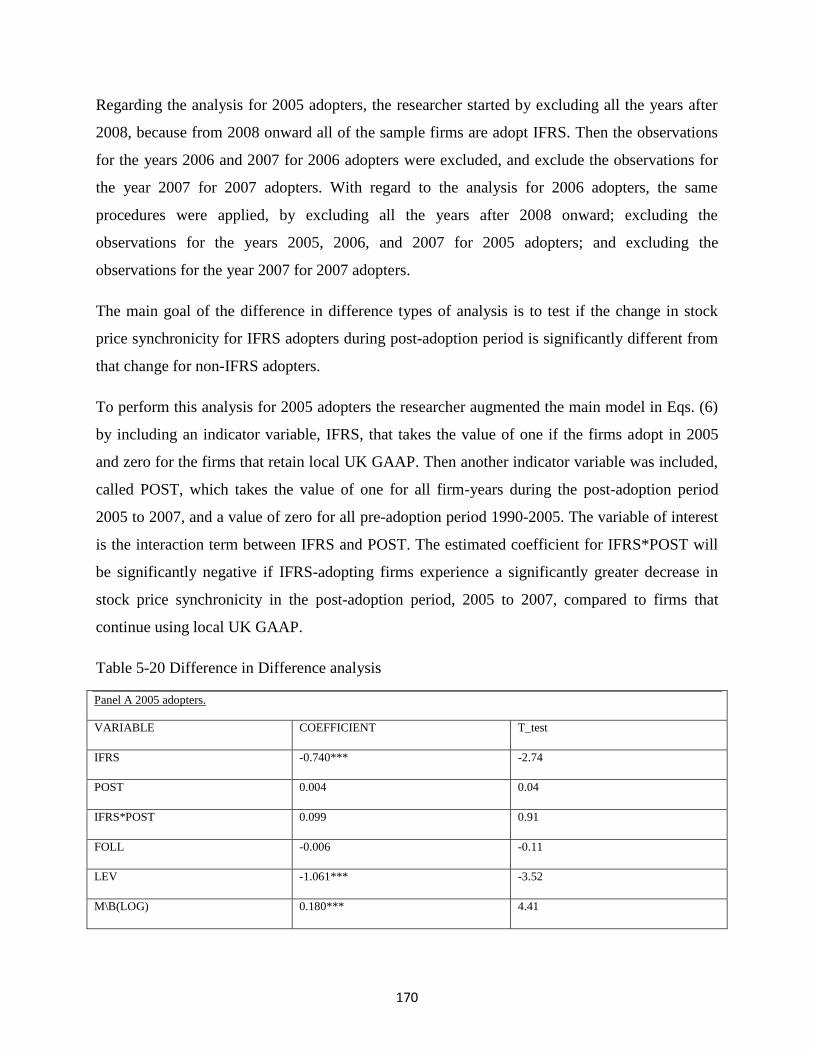
170
Regarding the analysis for 2005 adopters, the researcher started by excluding all the years after
2008, because from 2008 onward all of the sample firms are adopt IFRS. Then the observations
for the years 2006 and 2007 for 2006 adopters were excluded, and exclude the observations for
the year 2007 for 2007 adopters. With regard to the analysis for 2006 adopters, the same
procedures were applied, by excluding all the years after 2008 onward; excluding the
observations for the years 2005, 2006, and 2007 for 2005 adopters; and excluding the
observations for the year 2007 for 2007 adopters.
The main goal of the difference in difference types of analysis is to test if the change in stock
price synchronicity for IFRS adopters during post-adoption period is significantly different from
that change for non-IFRS adopters.
To perform this analysis for 2005 adopters the researcher augmented the main model in Eqs. (6)
by including an indicator variable, IFRS, that takes the value of one if the firms adopt in 2005
and zero for the firms that retain local UK GAAP. Then another indicator variable was included,
called POST, which takes the value of one for all firm-years during the post-adoption period
2005 to 2007, and a value of zero for all pre-adoption period 1990-2005. The variable of interest
is the interaction term between IFRS and POST. The estimated coefficient for IFRS*POST will
be significantly negative if IFRS-adopting firms experience a significantly greater decrease in
stock price synchronicity in the post-adoption period, 2005 to 2007, compared to firms that
continue using local UK GAAP.
Table 5-20 Difference in Difference analysis
Panel A 2005 adopters.
VARIABLE COEFFICIENT T_test
IFRS -0.740*** -2.74
POST 0.004 0.04
IFRS*POST 0.099 0.91
FOLL -0.006 -0.11
LEV -1.061*** -3.52
M\B(LOG) 0.180*** 4.41
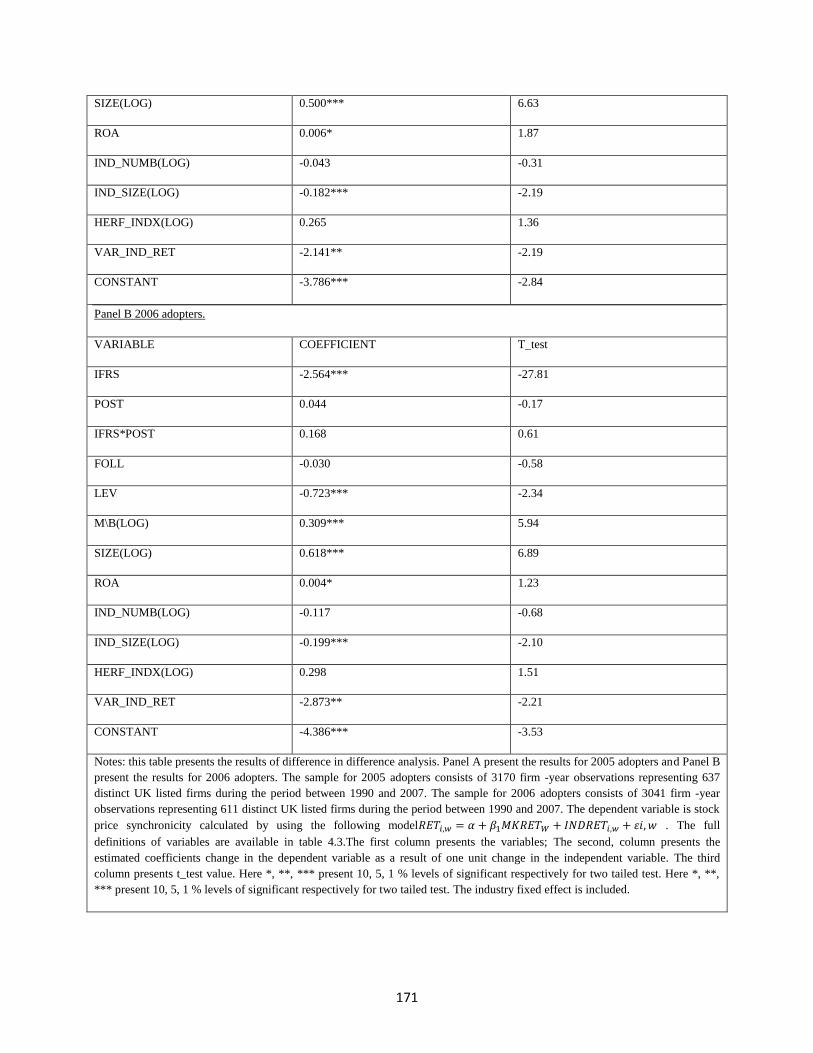
171
SIZE(LOG) 0.500*** 6.63
ROA 0.006* 1.87
IND_NUMB(LOG) -0.043 -0.31
IND_SIZE(LOG) -0.182*** -2.19
HERF_INDX(LOG) 0.265 1.36
VAR_IND_RET -2.141** -2.19
CONSTANT -3.786*** -2.84
Panel B 2006 adopters.
VARIABLE COEFFICIENT T_test
IFRS -2.564*** -27.81
POST 0.044 -0.17
IFRS*POST 0.168 0.61
FOLL -0.030 -0.58
LEV -0.723*** -2.34
M\B(LOG) 0.309*** 5.94
SIZE(LOG) 0.618*** 6.89
ROA 0.004* 1.23
IND_NUMB(LOG) -0.117 -0.68
IND_SIZE(LOG) -0.199*** -2.10
HERF_INDX(LOG) 0.298 1.51
VAR_IND_RET -2.873** -2.21
CONSTANT -4.386*** -3.53
Notes: this table presents the results of difference in difference analysis. Panel A present the results for 2005 adopters and Panel B
present the results for 2006 adopters. The sample for 2005 adopters consists of 3170 firm -year observations representing 637
distinct UK listed firms during the period between 1990 and 2007. The sample for 2006 adopters consists of 3041 firm -year
observations representing 611 distinct UK listed firms during the period between 1990 and 2007. The dependent variable is stock
price synchronicity calculated by using the following model𝑅𝐸𝑇𝑖,𝑤 = 𝛼 + 𝛽1𝑀𝐾𝑅𝐸𝑇𝑊 + 𝐼𝑁𝐷𝑅𝐸𝑇𝑖,𝑤 + 𝜀𝑖, 𝑤 . The full
definitions of variables are available in table 4.3.The first column presents the variables; The second, column presents the
estimated coefficients change in the dependent variable as a result of one unit change in the independent variable. The third
column presents t_test value. Here *, **, *** present 10, 5, 1 % levels of significant respectively for two tailed test. Here *, **,
*** present 10, 5, 1 % levels of significant respectively for two tailed test. The industry fixed effect is included.
172
Table 5.20 presents the regression results for conducting difference in difference analysis. Panel
A provide the results for 2005 adopters and panel B show the results for 2006 adopters. As seen
in panel A and panel B of Table 5.20 the IFRS variable has a lower stock price synchronicity
than non-IFRS adopters for both the 2005 and 2006 analysis. The interaction term between IFRS
adoption and post-adoption period IFRS*POST is not significant. This means that during post-
adoption period the difference between the change in stock price synchronicity for IFRS adopters
and non-IFRS adopters is not significant, suggesting that IFRS adoption does not lead to a
significant reduction in stock price synchronicity for IFRS adopters.
However, Daske et al. (2008) suggest that when applying difference in difference analysis it is
crucial to choose a suitable control sample. In addition (Meyer, 1995) notes that the results of
this type of analysis are more robust when the untreated sample (non-IFRS adopters) is very
similar to the treated sample (IFRS adopters). The fact that, in this research sample the firms
with similar characteristics (for example, firms in the same industry) adopt IFRS at the same year
makes it is difficult to for difference in difference analysis to capture if the change of stock price
synchronicity for IFRS adopters during post-adoption period is significantly different than non-
adopters.
173
Chapter Six: Second study Empirical Results (Earnings quality and stock
price informativeness)
This chapter presents the empirical analytical tests that were performed to examine the effect of
earnings quality, as measured by accruals quality, on stock price informativeness, as inversely
measured by stock price synchronicity. The empirical analysis contains several types of tests
including descriptive statistics for the variables of interest, correlation analysis, bivariate
regression, and multivariate regression. In addition, this study conducts some additional
robustness tests to check the validity of the results after applying some additional adjustments in
methodology.
6.1 Sample description
The initial sample consists of all the firms listed on the L.S.E. with available data on the
DataStream, Worldscope, and Institutional Brokers Estimate System (I/B/E/S) database, for the
period between 1990 and 2013. The initial sample consists of (25,240) firm-year observations.
Following prior research, banking, insurance, and other financial sector firms with SIC code
6000-6999 were excluded from the sample. These industries were excluded from the sample
because these industries have special regulations and financial accounting standards and the
inclusion of these industries in the sample may distort the research results. In addition, the firms
with no available data to calculate the independent variable, stock price synchronicity, and any of
the independents or control variables were excluded. In addition, industries with less than six
firms in each year were removed from the sample, because of the lack of quorum in estimating
the coefficients to calculate earnings quality.
After applying the previous procedures, the final sample consists of 5,214 firm-year observations
collected from 880 distinct UK firms for the period from 1994 to 2013. The total number of
yearly observations increased steadily from 31 firms in 1994 to 458 firms in 2013. Table 6.1
provides the descriptive statistics for the sample firms per year. In general, the years from 1994
until 1997 have the lowest number of yearly observations with almost less than 100 firms per
year. Each year of those years represents about 1% of total sample firms. The sample represents
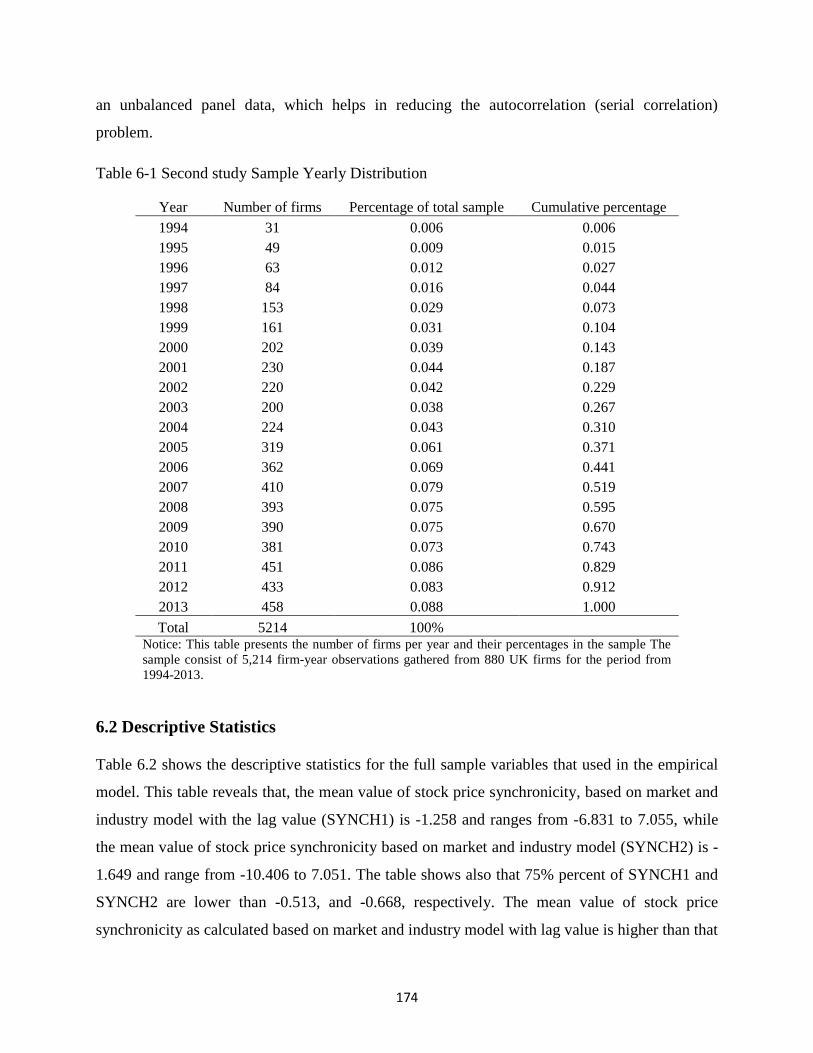
174
an unbalanced panel data, which helps in reducing the autocorrelation (serial correlation)
problem.
Table 6-1 Second study Sample Yearly Distribution
Year Number of firms Percentage of total sample Cumulative percentage
1994 31 0.006 0.006
1995 49 0.009 0.015
1996 63 0.012 0.027
1997 84 0.016 0.044
1998 153 0.029 0.073
1999 161 0.031 0.104
2000 202 0.039 0.143
2001 230 0.044 0.187
2002 220 0.042 0.229
2003 200 0.038 0.267
2004 224 0.043 0.310
2005 319 0.061 0.371
2006 362 0.069 0.441
2007 410 0.079 0.519
2008 393 0.075 0.595
2009 390 0.075 0.670
2010 381 0.073 0.743
2011 451 0.086 0.829
2012 433 0.083 0.912
2013 458 0.088 1.000
Total 5214 100%
Notice: This table presents the number of firms per year and their percentages in the sample The
sample consist of 5,214 firm-year observations gathered from 880 UK firms for the period from
1994-2013.
6.2 Descriptive Statistics
Table 6.2 shows the descriptive statistics for the full sample variables that used in the empirical
model. This table reveals that, the mean value of stock price synchronicity, based on market and
industry model with the lag value (SYNCH1) is -1.258 and ranges from -6.831 to 7.055, while
the mean value of stock price synchronicity based on market and industry model (SYNCH2) is -
1.649 and range from -10.406 to 7.051. The table shows also that 75% percent of SYNCH1 and
SYNCH2 are lower than -0.513, and -0.668, respectively. The mean value of stock price
synchronicity as calculated based on market and industry model with lag value is higher than that
175
based on market and industry model. This is expected because the part of the stock returns that
can be explained by this week and prior week market and industry return is higher than the part
that can be explained by the weekly market and industry return without lag value.1
The average absolute value of discretionary accruals, as estimated by the Modified Jones model,
is 0.0562, and ranges from 0.00066 to 0.4835. While the mean absolute value of Jones model
discretionary accruals is 0.0560. These values are comparable to that in earnings quality
literature. Iatridis (2012) in his UK study find that the average value of discretionary accruals
using Jones (1991) model is about 0.06.
On average, the firms in the sample followed by around 8 financial analysts. With the highest
and lowest number of analysts who follow the firm’s 40 and 1 respectively. The sample firms
have 0.183, 3.214, and 3.801 mean values of financial leverage (LEV), market to book value
(M/B), and return on assets (ROA), respectively. The firm’s total assets, as a measure of firm’s
size, show a mean value of 99,263 million.
Table 6.2 also shows a considerable difference between industry sectors in terms of their size.
The industry size based on the number of firms in the industry show that the largest industry
sector contains 301 firms while the smallest industry contains only 6 firms. The other measure of
industry size, the total assets of all firms in the same industry, shows differences in the sample
industry size. By using a fixed effect model, with controlling for industry fixed effect the author
tries to sidestep these differences between industries. There is a considerable difference between
industries in term of industry concentration as calculated by revenue based Herfindahl index. The
highest Herfindahl index of 1.0 is for the industry with SIC code 14 and the lowest index is .048
is for the industry with SIC code 73.
As shown in Table 6.2 the analysts-following, market to book value, firm’s total asset, the
number of firms in the industry, the industry total asset, and industry concentration are highly
skewed. Therefore, Li (2010) is followed and the log transformation of these variables was used
1 These values are comparable to that of Kim and Shi (2012a) and Fernandes and Ferreira (2008) as explained in
section 4.1.3.
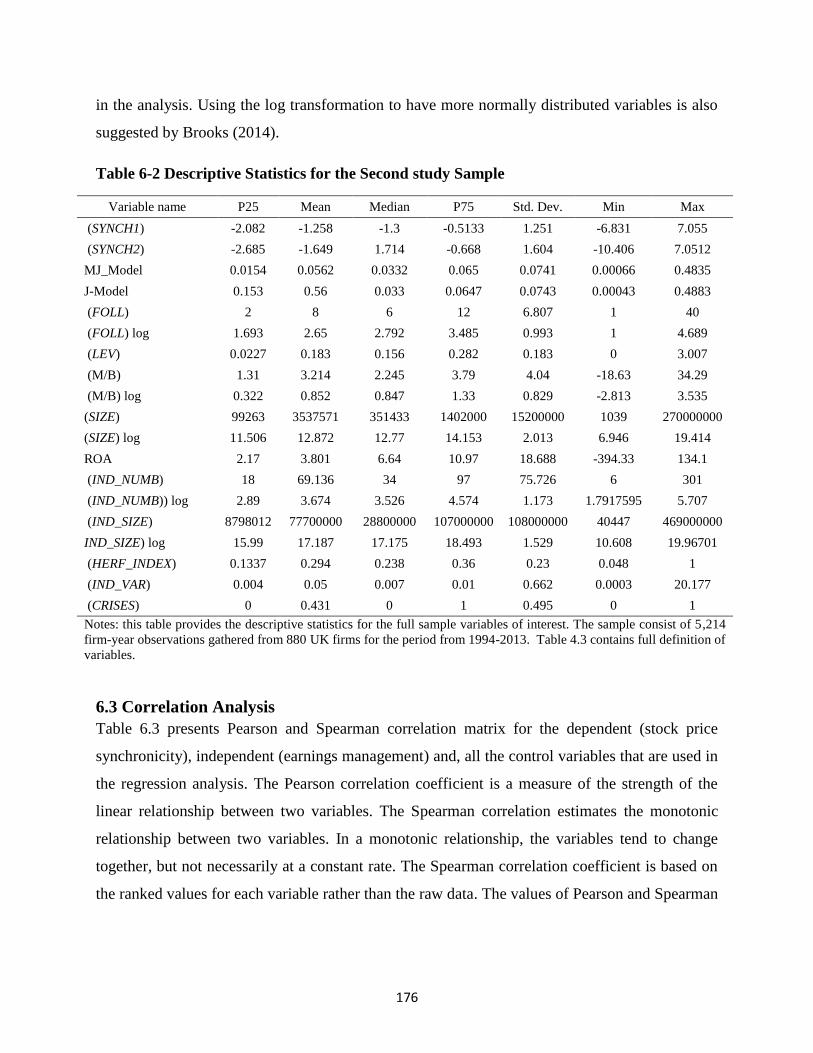
176
in the analysis. Using the log transformation to have more normally distributed variables is also
suggested by Brooks (2014).
Table 6-2 Descriptive Statistics for the Second study Sample
Variable name P25 Mean Median P75 Std. Dev. Min Max
(SYNCH1) -2.082 -1.258 -1.3 -0.5133 1.251 -6.831 7.055
(SYNCH2) -2.685 -1.649 1.714 -0.668 1.604 -10.406 7.0512
MJ_Model 0.0154 0.0562 0.0332 0.065 0.0741 0.00066 0.4835
J-Model 0.153 0.56 0.033 0.0647 0.0743 0.00043 0.4883
(FOLL) 2 8 6 12 6.807 1 40
(FOLL) log 1.693 2.65 2.792 3.485 0.993 1 4.689
(LEV) 0.0227 0.183 0.156 0.282 0.183 0 3.007
(M/B) 1.31 3.214 2.245 3.79 4.04 -18.63 34.29
(M/B) log 0.322 0.852 0.847 1.33 0.829 -2.813 3.535
(SIZE) 99263 3537571 351433 1402000 15200000 1039 270000000
(SIZE) log 11.506 12.872 12.77 14.153 2.013 6.946 19.414
ROA 2.17 3.801 6.64 10.97 18.688 -394.33 134.1
(IND_NUMB) 18 69.136 34 97 75.726 6 301
(IND_NUMB)) log 2.89 3.674 3.526 4.574 1.173 1.7917595 5.707
(IND_SIZE) 8798012 77700000 28800000 107000000 108000000 40447 469000000
IND_SIZE) log 15.99 17.187 17.175 18.493 1.529 10.608 19.96701
(HERF_INDEX) 0.1337 0.294 0.238 0.36 0.23 0.048 1
(IND_VAR) 0.004 0.05 0.007 0.01 0.662 0.0003 20.177
(CRISES) 0 0.431 0 1 0.495 0 1
Notes: this table provides the descriptive statistics for the full sample variables of interest. The sample consist of 5,214
firm-year observations gathered from 880 UK firms for the period from 1994-2013. Table 4.3 contains full definition of
variables.
6.3 Correlation Analysis
Table 6.3 presents Pearson and Spearman correlation matrix for the dependent (stock price
synchronicity), independent (earnings management) and, all the control variables that are used in
the regression analysis. The Pearson correlation coefficient is a measure of the strength of the
linear relationship between two variables. The Spearman correlation estimates the monotonic
relationship between two variables. In a monotonic relationship, the variables tend to change
together, but not necessarily at a constant rate. The Spearman correlation coefficient is based on
the ranked values for each variable rather than the raw data. The values of Pearson and Spearman
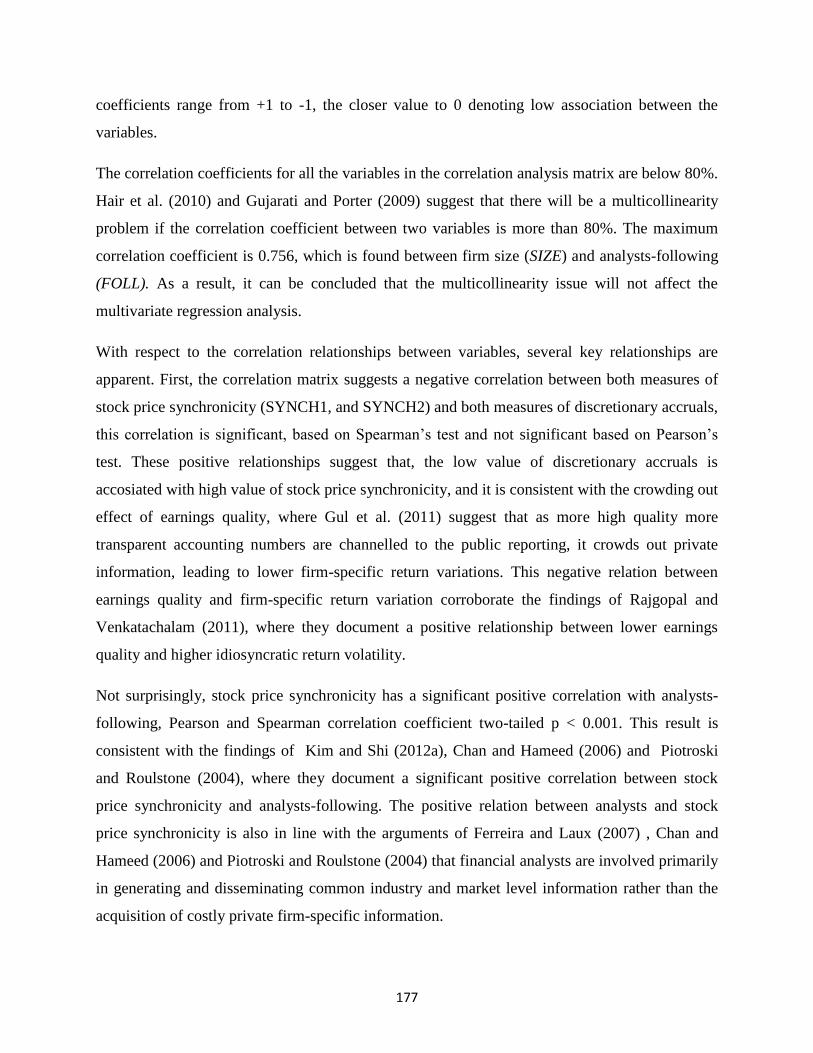
177
coefficients range from +1 to -1, the closer value to 0 denoting low association between the
variables.
The correlation coefficients for all the variables in the correlation analysis matrix are below 80%.
Hair et al. (2010) and Gujarati and Porter (2009) suggest that there will be a multicollinearity
problem if the correlation coefficient between two variables is more than 80%. The maximum
correlation coefficient is 0.756, which is found between firm size (SIZE) and analysts-following
(FOLL). As a result, it can be concluded that the multicollinearity issue will not affect the
multivariate regression analysis.
With respect to the correlation relationships between variables, several key relationships are
apparent. First, the correlation matrix suggests a negative correlation between both measures of
stock price synchronicity (SYNCH1, and SYNCH2) and both measures of discretionary accruals,
this correlation is significant, based on Spearman’s test and not significant based on Pearson’s
test. These positive relationships suggest that, the low value of discretionary accruals is
accosiated with high value of stock price synchronicity, and it is consistent with the crowding out
effect of earnings quality, where Gul et al. (2011) suggest that as more high quality more
transparent accounting numbers are channelled to the public reporting, it crowds out private
information, leading to lower firm-specific return variations. This negative relation between
earnings quality and firm-specific return variation corroborate the findings of Rajgopal and
Venkatachalam (2011), where they document a positive relationship between lower earnings
quality and higher idiosyncratic return volatility.
Not surprisingly, stock price synchronicity has a significant positive correlation with analysts-
following, Pearson and Spearman correlation coefficient two-tailed p < 0.001. This result is
consistent with the findings of Kim and Shi (2012a), Chan and Hameed (2006) and Piotroski
and Roulstone (2004), where they document a significant positive correlation between stock
price synchronicity and analysts-following. The positive relation between analysts and stock
price synchronicity is also in line with the arguments of Ferreira and Laux (2007) , Chan and
Hameed (2006) and Piotroski and Roulstone (2004) that financial analysts are involved primarily
in generating and disseminating common industry and market level information rather than the
acquisition of costly private firm-specific information.

178
Firm’s financial leverage (LEV), firm’s growth opportunity, (M/B), firm’s size, as measured by
total assets, and firm’s performance (ROA), display a significant positive correlation with the
both measures of stock price synchronicity, with Pearson and Spearman correlation coefficient
two-tailed p-value < 0.001. These findings corroborate Kim and Shi (2012a) findings where they
document a positive correlation between stock price synchronicity (SYNCH1) and financial
leverage (LEV) and growth opportunity (M/B).
In terms of industry characteristics, the correlation test results suggest that the number of firms in
the industry (IND_NUM), and variance of weekly industry return (VAR_IND_RET), have a
negative correlation with both measures of stock price synchronicity. This negative correlation
between stock price synchronicity and the number of firms in the industry is also documented by
Kim and Shi (2012a) and Gul et al. (2010), indicating that the firms in big industries that contain
a higher number of firms have lower stock price synchronicity. Industry size, (IND_SIZE), and
industry concentration (HERF_INDEX), records a positive correlation with stock price
synchronicity. The positive relation between industry concentrations (HERF_INDX) and stock
price synchronicity is in line with the findings of Fernandes and Ferreira (2008).
As expected, stock price synchronicity (SYNCH1) and The Financial Crisis have a significant
positive correlation, with Pearson and Spearman correlation coefficient two-tailed p-value <
0.001. The Financial Crisis as one of systematic risk factors that affect all the stock in the market
is expected to have a highly significant positive impact on the stock price synchronicity.
In terms of the correlation between independent variables, it is worth noting that, analysts-
following (FOLL) has a significant positive correlation with firm size (SIZE), Pearson and
Spearman correlation coefficient two-tailed p < 0.001. This significant positive correlation
between analysts-following (FOLL) and firm size (SIZE) is in line with the argument of Bhushan
(1989), that large firms tend to attract more financial analysts than small firms. In addition many
previous studies document that the firm’s size is the most important determinant of analysts-
following (Barth et al., 2001; Lehavy et al., 2011; Lobo et al., 2012), where these studies find
that larger firms have greater analysts-following and suggest that large firms have better
information environments, potentially more complex operations, and greater demand for
investment advice. Chan et al. (2016), Kim and Shi (2012a), and Piotroski and Roulstone (2004)
document a positive correlation between firm size (SIZE) and analysts-following (FOLL). The

179
other firm-specific and industry specific control variables do not record a high correlation
between each other.
Overall, the results of Spearman and Pearson correlation analysis for the entire sample shows
that certain relationships exist between stock price synchronicity and the explanatory variables,
and these relationships are generally consistent with what is suggested by the prior literature.
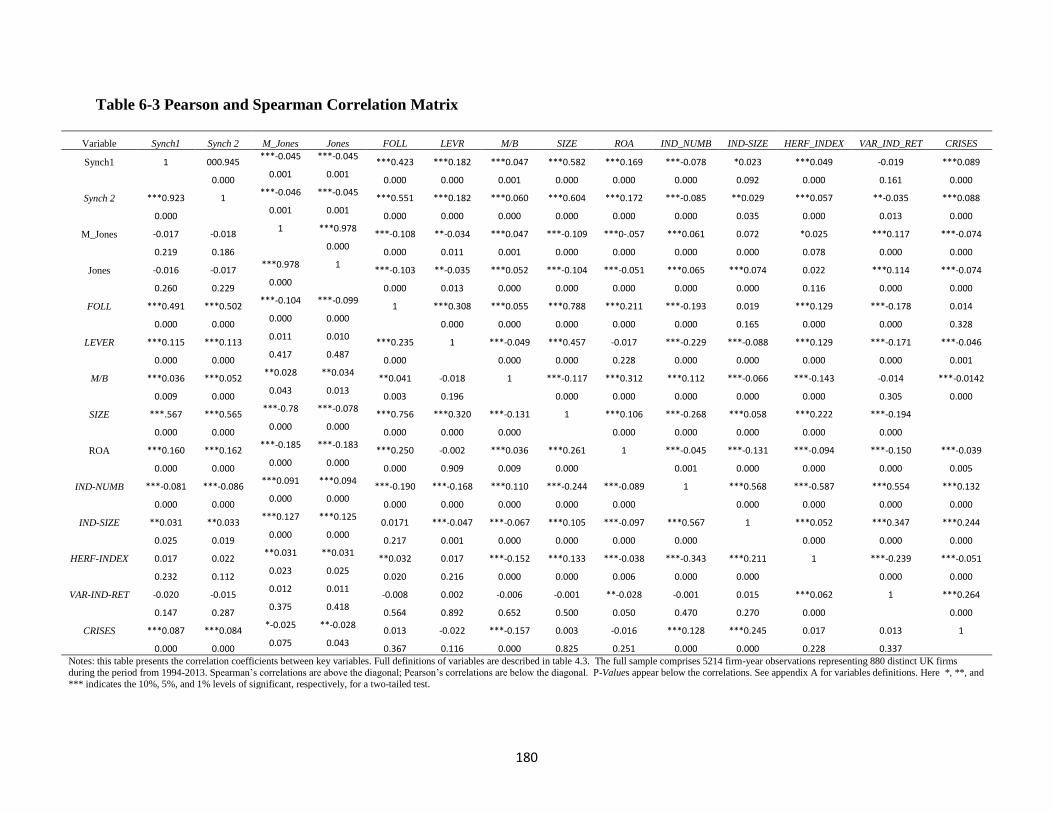
180
Table 6-3 Pearson and Spearman Correlation Matrix
Variable Synch1 Synch 2 M_Jones Jones FOLL LEVR M/B SIZE ROA IND_NUMB IND-SIZE HERF_INDEX VAR_IND_RET CRISES
Synch1 1 000.945 ***-0.045 ***-0.045
***0.423 ***0.182 ***0.047 ***0.582 ***0.169 ***-0.078 *0.023 ***0.049 -0.019 ***0.089
0.000 0.001 0.001
0.000 0.000 0.001 0.000 0.000 0.000 0.092 0.000 0.161 0.000
Synch 2 ***0.923 1 ***-0.046 ***-0.045
***0.551 ***0.182 ***0.060 ***0.604 ***0.172 ***-0.085 **0.029 ***0.057 **-0.035 ***0.088
0.000 0.001 0.001
0.000 0.000 0.000 0.000 0.000 0.000 0.035 0.000 0.013 0.000
M_Jones -0.017 -0.018 1 ***0.978
***-0.108 **-0.034 ***0.047 ***-0.109 ***0-.057 ***0.061 0.072 *0.025 ***0.117 ***-0.074
0.219 0.186 0.000
0.000 0.011 0.001 0.000 0.000 0.000 0.000 0.078 0.000 0.000
Jones -0.016 -0.017 ***0.978 1
***-0.103 **-0.035 ***0.052 ***-0.104 ***-0.051 ***0.065 ***0.074 0.022 ***0.114 ***-0.074
0.260 0.229 0.000
0.000 0.013 0.000 0.000 0.000 0.000 0.000 0.116 0.000 0.000
FOLL ***0.491 ***0.502 ***-0.104 ***-0.099
1 ***0.308 ***0.055 ***0.788 ***0.211 ***-0.193 0.019 ***0.129 ***-0.178 0.014
0.000 0.000 0.000 0.000
0.000 0.000 0.000 0.000 0.000 0.165 0.000 0.000 0.328
LEVER ***0.115 ***0.113 0.011 0.010
***0.235 1 ***-0.049 ***0.457 -0.017 ***-0.229 ***-0.088 ***0.129 ***-0.171 ***-0.046
0.000 0.000 0.417 0.487
0.000 0.000 0.000 0.228 0.000 0.000 0.000 0.000 0.001
M/B ***0.036 ***0.052 **0.028 **0.034
**0.041 -0.018 1 ***-0.117 ***0.312 ***0.112 ***-0.066 ***-0.143 -0.014 ***-0.0142
0.009 0.000 0.043 0.013
0.003 0.196 0.000 0.000 0.000 0.000 0.000 0.305 0.000
SIZE ***.567 ***0.565 ***-0.78 ***-0.078
***0.756 ***0.320 ***-0.131 1 ***0.106 ***-0.268 ***0.058 ***0.222 ***-0.194
0.000 0.000 0.000 0.000
0.000 0.000 0.000 0.000 0.000 0.000 0.000 0.000
ROA ***0.160 ***0.162 ***-0.185 ***-0.183
***0.250 -0.002 ***0.036 ***0.261 1 ***-0.045 ***-0.131 ***-0.094 ***-0.150 ***-0.039
0.000 0.000 0.000 0.000
0.000 0.909 0.009 0.000 0.001 0.000 0.000 0.000 0.005
IND-NUMB ***-0.081 ***-0.086 ***0.091 ***0.094
***-0.190 ***-0.168 ***0.110 ***-0.244 ***-0.089 1 ***0.568 ***-0.587 ***0.554 ***0.132
0.000 0.000 0.000 0.000
0.000 0.000 0.000 0.000 0.000 0.000 0.000 0.000 0.000
IND-SIZE **0.031 **0.033 ***0.127 ***0.125
0.0171 ***-0.047 ***-0.067 ***0.105 ***-0.097 ***0.567 1 ***0.052 ***0.347 ***0.244
0.025 0.019 0.000 0.000
0.217 0.001 0.000 0.000 0.000 0.000 0.000 0.000 0.000
HERF-INDEX 0.017 0.022 **0.031 **0.031
**0.032 0.017 ***-0.152 ***0.133 ***-0.038 ***-0.343 ***0.211 1 ***-0.239 ***-0.051
0.232 0.112 0.023 0.025
0.020 0.216 0.000 0.000 0.006 0.000 0.000 0.000 0.000
VAR-IND-RET -0.020 -0.015 0.012 0.011
-0.008 0.002 -0.006 -0.001 **-0.028 -0.001 0.015 ***0.062 1 ***0.264
0.147 0.287 0.375 0.418
0.564 0.892 0.652 0.500 0.050 0.470 0.270 0.000 0.000
CRISES ***0.087 ***0.084 *-0.025 **-0.028
0.013 -0.022 ***-0.157 0.003 -0.016 ***0.128 ***0.245 0.017 0.013 1
0.000 0.000 0.075 0.043
0.367 0.116 0.000 0.825 0.251 0.000 0.000 0.228 0.337 Notes: this table presents the correlation coefficients between key variables. Full definitions of variables are described in table 4.3. The full sample comprises 5214 firm-year observations representing 880 distinct UK firms
during the period from 1994-2013. Spearman’s correlations are above the diagonal; Pearson’s correlations are below the diagonal. P-Values appear below the correlations. See appendix A for variables definitions. Here *, **, and
*** indicates the 10%, 5%, and 1% levels of significant, respectively, for a two-tailed test.
181
6.4 Bivariate Analysis
As an initial test for the expected effect of IFRS adoption and control variables, on the stock
price synchronicity, the simplest forms of regression analysis, bivariate analysis, was carried out.
The goal of estimating the bivariate regression is to provide preliminary evidence of the expected
effect of the explanatory variables on the dependent variable. The regression results with the
coefficient value, standard error, p-value, constant value, and sign are presented in table 6.4. The
resulting standard errors from the simple bivariate regression for all the variables were adjusted
for heteroscedasticity. The estimated significant levels of the regression results are based on two-
tailed tests.
The bivariate regression results that are reported in Table 6.4 indicate that the higher value of
discretionary accruals is associated with higher stock price synchronicity. This positive effect of
discretionary accruals on the comovement of stock prices suggests that higher earnings quality
leads to a more informative stock price. Although this coefficient is not significant, it provides an
initial indication that the higher earnings quality is associated with lower comovement of stock
return with market return and industry return. This result suggests that for the firms with lower
quality accounting numbers, the firm's investors have less confidence on firms-pecific
information, so they rely more on market-wide and industry-wide information in their investment
decisions, leading to higher comovement of the stock prices. This result is consistent with
findings of Hutton et al. (2009), where they document a positive relationship between earnings
quality and firm-specific return variations.
The coefficient for analysts-following (FOLL) is significantly negative with p-value <0.001. The
positive effect of analysts-following on synchronicity is economically significant as well, with
estimated coefficient 0.271. This positive effect of analysts-following (FOLL) on stock price
synchronicity corroborates the findings of Kim and Shi (2012a), Ferreira and Laux (2007), Chan
and Hameed (2006), Veldkamp (2006a), and Piotroski and Roulstone (2004) who document a
significant positive effect of (FOLL) on stock price synchronicity, suggesting that the financial
analysts normally tend to produce common market wide and industry-wide information instead
of private firm-specific information.
182
Financial leverage (LEV) recorded a significant negative effect on the stock price synchronicity
with p_value < 0.001. The firm’s financial leverage is expected to have an effect on
synchronicity through its impact on the sensitivity of firms returns to macroeconomic conditions
and because it affects the division of risk bearing between equity shareholders and debtors
(Hutton et al., 2009). Also, Beuselinck et al. (2010), assume that the firms with high financial
leverage have higher intrinsic risk factors, which may force the investors to collect firm-specific
information, leading to a low stock price synchronicity for high leveraged firms.
The other firm-specific control variable that is expected to have an effect on synchronicity is the
firm’s market to book ratio (M/B) which is used as a measure of the firm’s growth opportunities.
Hutton et al. (2009) argue that the market-to-book ratio places firms along a growth-versus-value
spectrum and thus could be systematically related to the firm-specific return variation. Consistent
with the findings of An and Zhang (2013), Yu et al. (2013) the bivariate regression results
suggest a positive impact of (M/B) on stock price synchronicity.
The large firms are expected to have a positive relation with stock price synchronicity.
According to Hutton et al. (2009), large firms are normally operating in a wider cross section of
the economy, meaning that more market-wide information will be incorporated into the stock
price and hence illustrate more comovement with the market returns. In addition, the small firms
consider the large firms to be the market leaders, so it is expected for the large firms to have
lower firm-specific return variation, Chan and Hameed (2006). The preliminary regression
results support the previous expectations and are consistent with the results of Ben-Nasr and
Cosset (2014), An and Zhang (2013) and Xing and Anderson (2011) who documented a highly
significant positive effect of firm size (SIZE) on stock price synchronicity, with estimated
coefficient of 0.283 and a significant level p_value < 0.001).
Firm’s performance and profitability (ROA), records a significant positive effect on stock price
synchronicity, with p_value <0.001. This result is in line with the findings of Ben-Nasr and
Cosset (2014), and Gul, Srinidhi, et al. (2011) that more profitable firms tend to have higher
stock price synchronicity.
In terms of industry characteristics, the bivariate analysis suggests some interesting results. The
number of firms in the industry revealed an economically and statistically positive effect on
183
stock price synchronicity with estimated coefficient and p_value at 0.282 and 0.011 respectively.
The prior research documented different results on the effect of the number of firms in the
industry on synchronicity where Hasan et al. (2014) and Kim and Shi (2012a) document a
positive effect of a number of firms in the industry on synchronicity, while Yu et al. (2013) and
Gul et al. (2010) document a negative relation between the number of firms in the industry and
the comovement of the stock prices. As these initial results are based on a bivariate simple
regression that does not take into account the effect of other variables that may have an impact
on synchronicity, these results are un-robust and cannot be relied on to estimate the actual impact
of industry size on synchronicity.
Industry size (IND_SIZE), records a positive effect on stock price synchronicity. This result is
consistent with the findings of Hasan et al. (2014), and Gul et al. (2010), who document a
positive effect of industry size on stock price synchronicity. These results suggest that the firms
that operate in large industry sectors are more able to incorporate firm-specific information into
their stock price than those firms that operate in small industries.
Industry concentration (HERf_INDX) records a negative effect upon stock price synchronicity.
Piotroski and Roulstone (2004) suggest that when the industry is more concentrated the
possibility that the performance of firms in this industry are interdependent on each other is high,
and the release of information related to any firm may be considered as value relevant for all
other firms in that industry, for this reason they expect a positive effect of industry concentration
on stock price synchronicity. The bivariate regression results suggest an insignificant negative
effect of the industry concentration on stock price synchronicity.
The bivariate regression results also suggest that there is no relation between the variance of
weekly industry return, as final industry characteristics control variable, and stock price
synchronicity. These results contradict the findings of Hutton et al. (2009); whereas they
document a positive relation between the variance of weekly industry returns and stock price
synchronicity. As mentioned before, because this is a simple regression, with no control
variables, its results are un-robust and the exact estimation of the expected effect of
(VAR_IND_RET) on stock price synchronicity, will be obtained from the multivariate regression.
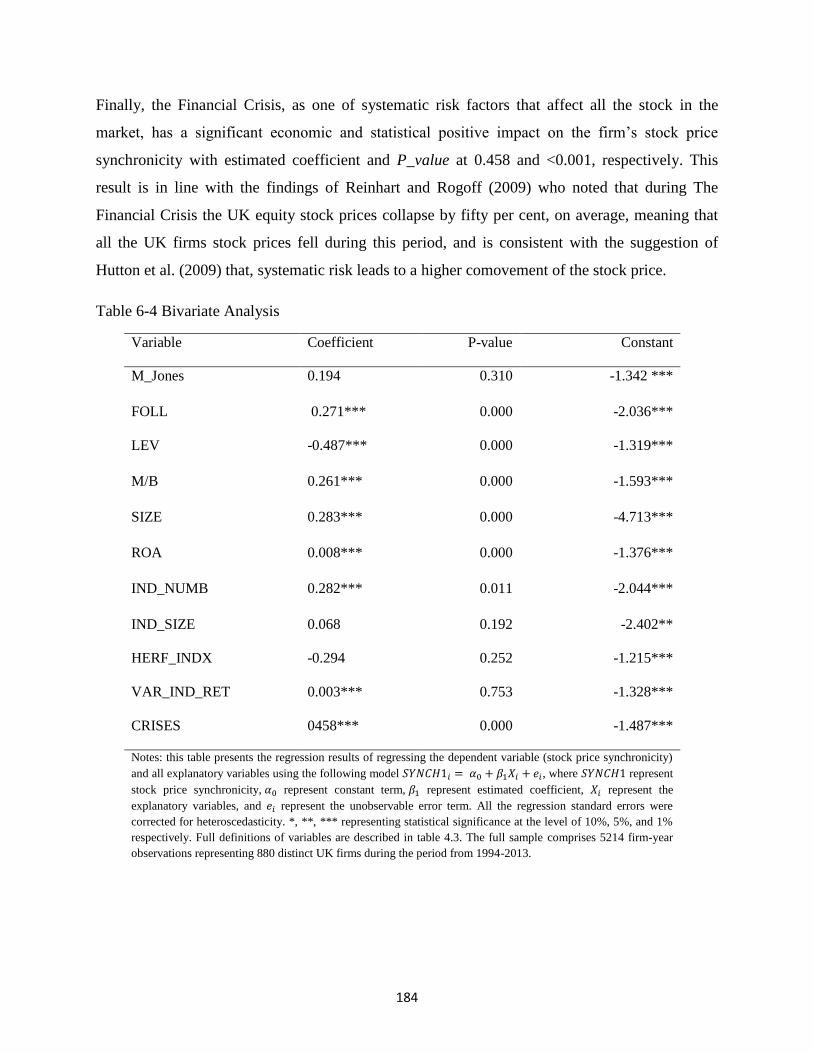
184
Finally, the Financial Crisis, as one of systematic risk factors that affect all the stock in the
market, has a significant economic and statistical positive impact on the firm’s stock price
synchronicity with estimated coefficient and P_value at 0.458 and <0.001, respectively. This
result is in line with the findings of Reinhart and Rogoff (2009) who noted that during The
Financial Crisis the UK equity stock prices collapse by fifty per cent, on average, meaning that
all the UK firms stock prices fell during this period, and is consistent with the suggestion of
Hutton et al. (2009) that, systematic risk leads to a higher comovement of the stock price.
Table 6-4 Bivariate Analysis
Variable Coefficient P-value Constant
M_Jones 0.194 0.310 -1.342 ***
FOLL 0.271*** 0.000 -2.036***
LEV -0.487*** 0.000 -1.319***
M/B 0.261*** 0.000 -1.593***
SIZE 0.283*** 0.000 -4.713***
ROA 0.008*** 0.000 -1.376***
IND_NUMB 0.282*** 0.011 -2.044***
IND_SIZE 0.068 0.192 -2.402**
HERF_INDX -0.294 0.252 -1.215***
VAR_IND_RET 0.003*** 0.753 -1.328***
CRISES 0458*** 0.000 -1.487***
Notes: this table presents the regression results of regressing the dependent variable (stock price synchronicity)
and all explanatory variables using the following model 𝑆𝑌𝑁𝐶𝐻1𝑖 = 𝛼0 + 𝛽1𝑋𝑖 + 𝑒𝑖, where 𝑆𝑌𝑁𝐶𝐻1 represent
stock price synchronicity, 𝛼0 represent constant term, 𝛽1 represent estimated coefficient, 𝑋𝑖 represent the
explanatory variables, and 𝑒𝑖 represent the unobservable error term. All the regression standard errors were
corrected for heteroscedasticity. *, **, *** representing statistical significance at the level of 10%, 5%, and 1%
respectively. Full definitions of variables are described in table 4.3. The full sample comprises 5214 firm-year
observations representing 880 distinct UK firms during the period from 1994-2013.

185
6.5 Multivariate Analysis
The previous sections discuss the descriptive statistics, the correlation analysis, and the bivariate
analysis, to understand the effect of earnings quality, on stock price synchronicity. In this
section, there is a discussion of the main regressions results, by examining the relationships
between stock price synchronicity and the explanatory variables.
6.5.1 Do earnings quality affect stock price informativeness?
The fourth hypothesis is concerned with the impact of accruals quality, as a measure of earnings
quality, on the ability of the stock price to incorporate the firm-specific information, as measured
by stock price synchronicity. To test H4 a regression model as in EQ. (11) will be performed. In
this model the dependent variable (SEYNCH1), refers to stock price synchronicity, which
represents the part of stock return that can be explained by market return and industry return. The
high value of stock price synchronicity means that the stock price tends to commove with market
return and industry return, meaning lower firm-specific information is reflected into the stock
price, thus a less informative stock price. The variable of interest is the coefficient on the
M_Jones variable, 𝛽1, which captures the incremental change in stock price synchronicity for
UK firms, with one unit increase in discretionary accruals. A positive coefficient on 𝛽1 is
consistent with the encouragement effect of earnings quality on stock price synchronicity, that
higher earnings quality reduces the information cost, which encourages investors to collect and
process firm-specific information, leading to more firm-specific information to be incorporated
into stock price, leading to a more informative stock price.
Table 6.5 presents the results of the fixed effect regression model for EQ (11). As reported in
table 6.5, the coefficient of M-Jones variable is positive and statistically significant with
estimated coefficient and p_value of 0.334. and <0.1, respectively. This result is in line with the
encouragement effect of earnings quality and supports the first hypothesis that the higher
earnings quality encourages investors to collect and trade on firm private information, leading to
more firm-specific information being incorporated into the stock price, in relation to market and
industry-wide information; hence reducing the synchronous movement of the firm’s stock return
with market and industry returns. Gul, Srinidhi, et al. (2011) note that the supporters of
186
encouragement effect of higher earnings quality on stock price synchronicity, argue that, the
high-quality accounting numbers reduce the cost of collecting the information and thus
encourage firm’s investors to collect and process firm’s private information, leading to more
firm-specific information to be capitalised into the stock price, and thus lower stock price
synchronicity.
Because higher earnings quality numbers are considered to be evidence of more transparent
accounting disclosure, thus this result is in line with the findings of Eun et al. (2015), Hasan et al.
(2014), Kim and Shi (2012a), Hutton et al. (2009), Haggard et al. (2008), Jin and Myers (2006)
and others, who provide evidence that higher transparency improves incorporation of firm-
specific information into the stock price, leading to a less synchronous stock price.
Consistent with prior studies, financial analysts (FOLL) has a significant positive effect on stock
price synchronicity with estimated coefficient and p-value of 0.187 and <0.001, respectively.
This positive effect of analysts-following (FOLL) on stock price synchronicity corroborates the
findings of Kim and Shi (2012a), Fernandes and Ferreira (2008), Ferreira and Laux (2007), Chan
and Hameed (2006), Veldkamp (2006a), and Piotroski and Roulstone (2004) who document a
significant positive effect of (FOLL) on stock price synchronicity. Piotroski and Roulstone
(2004) try to explain this effect by arguing that, financial analysts are outsiders with limited
access to the firm-specific information, for this reason, financial analysts try to focus their efforts
on collecting and processing market wide and industry-wide information and mapping this
information with firm’s stock prices. For this reason, the firms that are followed by a higher
number of financial analysts are expected to incorporate more market level and industry level
information than firm-specific information, leading to high stock price synchronicity, or lower
firm-specific return variation.
Firm’s financial leverage (LEV) records a significant negative effect on stock price synchronicity
with p_value < 0.05. Hutton et al. (2009) suggest that the firm’s financial leverage is expected to
have an effect on stock price synchronicity through its impact on the sensitivity of the firm’s
return to macroeconomic conditions and because it affects the division of risk bearing between
equity shareholders and debtors. Moreover, Beuselinck et al. (2010) expect a positive
relationship to exist between firm-specific return variation and firm’s financial leverage ratio, as
they suggest that the firms with high financial leverage have high intrinsic risk factors which

187
may enforce the investors to collect firm-specific information. Therefore, these results support
the previous argument. The negative effect of (LEV) on stock price synchronicity (SYNCH1) is in
line with findings of Kim and Yi (2015), Yu et al. (2013), Kim and Shi (2012a), and Gul,
Srinidhi, et al. (2011) who documents a negative effect of firm’s financial leverage on firm’s
stock price synchronicity. This results support the view that data for firms with high financial
leverage is more valuable, for this reason, the investors try to collect, process and trade on this
information, leading to higher firm-specific return variation for high leveraged firms.
The other firm-specific control variable that is expected to have an effect on synchronicity is the
firm’s market to book ratio (M/B), measured as the market value of equity divided by book value
of equity, which is used to measure the firm’s growth opportunities. Hutton et al. (2009) argue
that the market-to-book ratio places firms along a growth-versus-value spectrum and thus could
be systematically related to the firm-specific return variation. Consistent with the findings of An
and Zhang (2013), Yu et al. (2013) the estimated coefficient of (M/B) in regression results table
4.9 is significantly positive. This result suggests that the firms with high growth opportunities
tend to have a more synchronous stock price.
In terms of firm’s size the regression results suggest a highly statistically and economically
significant positive effect of firm’s size (SIZE) on stock price synchronicity. Where the
regression results record an estimated coefficient and p_value at 0.332 and <0.001, respectively.
This result is consistent with the findings of Ben-Nasr and Cosset (2014), An and Zhang (2013),
Chan and Hameed (2006), where they state that the higher firm size is associated with higher
stock price synchronicity. Piotroski and Roulstone (2004) try to explain this effect of firm size on
synchronicity by arguing that the small firms consider the large firms as a market leader so the
stock price of large firms tends to have high stock price synchronicity. In addition, Bhushan
(1989) argues that the firm's size has a great impact on financial analysts’ activities. Whereas he
suggests that the large firms tend to attract more financial analysts, because the investors are
likely to consider the pieces of information about large firms, as being more attractive than the
same pieces of information about smaller firms. This argument is supported by the high
correlation between firm size and analysts-following (the correlation between firm’s size and
analysts-following is the highest among all the correlation between variables). Because the larger
firms tend to attract higher numbers of financial analysts than smaller firms, and the financial

188
analysts tends to provide market-wide and industry-wide information, rather than firm-specific
information, it is expected that the larger firms will incorporate the market and industry level
information into their stock prices. This will lead to a higher comovement or higher stock price
synchronicity.
Firm’s performance and profitability, as measured by the ratio of net income to total assets
(ROA), record a non-significant negative effect on stock price synchronicity.
The industry characteristics control variables revealed that the higher number of firms in the
industry leads to the higher comovement of stock prices with market and industry prices. This
result is consistent with the findings of Hasan et al. (2014), and Kim and Shi (2012a) who
suggest there is a positive effect of the number of firms in the industry on stock price
synchronicity, however, this effect is not significant.
The natural log of industry total assets, as a measure of industry size (IND_SIZE), shows a
significant negative effect on stock price synchronicity. This result suggests that the large
industry sectors have a higher firm-specific return variation. This result collaborates the findings
of Hasan et al. (2014).
The industry concentration (HERF_INDX), records a positive effect on stock price synchronicity.
This result is consistent with the prediction of Piotroski and Roulstone (2004), that in more
concentrated industries, the possibility of firms’ interdependence on each other is high, and the
release of new information related to any firm, could be considered as having value relevance for
all the other firms in that industry, leading to higher comovement of the stock price in more
concentrated industries. This positive effect of industry concentration on stock price
synchronicity is in line with the findings of Eun et al. (2015), Ben-Nasr and Cosset (2014),
Fernandes and Ferreira (2008), and Piotroski and Roulstone (2004).
In terms of variance of industry weekly return (VAR_IND_RET), which was used by Hutton et al.
(2009) to control for systematic risk, the regression results suggest a highly statistically
significant negative impact of the variance of weekly industry return on stock price synchronicity
with P_value less than (0.001). This result contradicts the findings of Hutton et al. (2009), who
argue that a higher industry return variance increases systematic risk, and hence increase stock
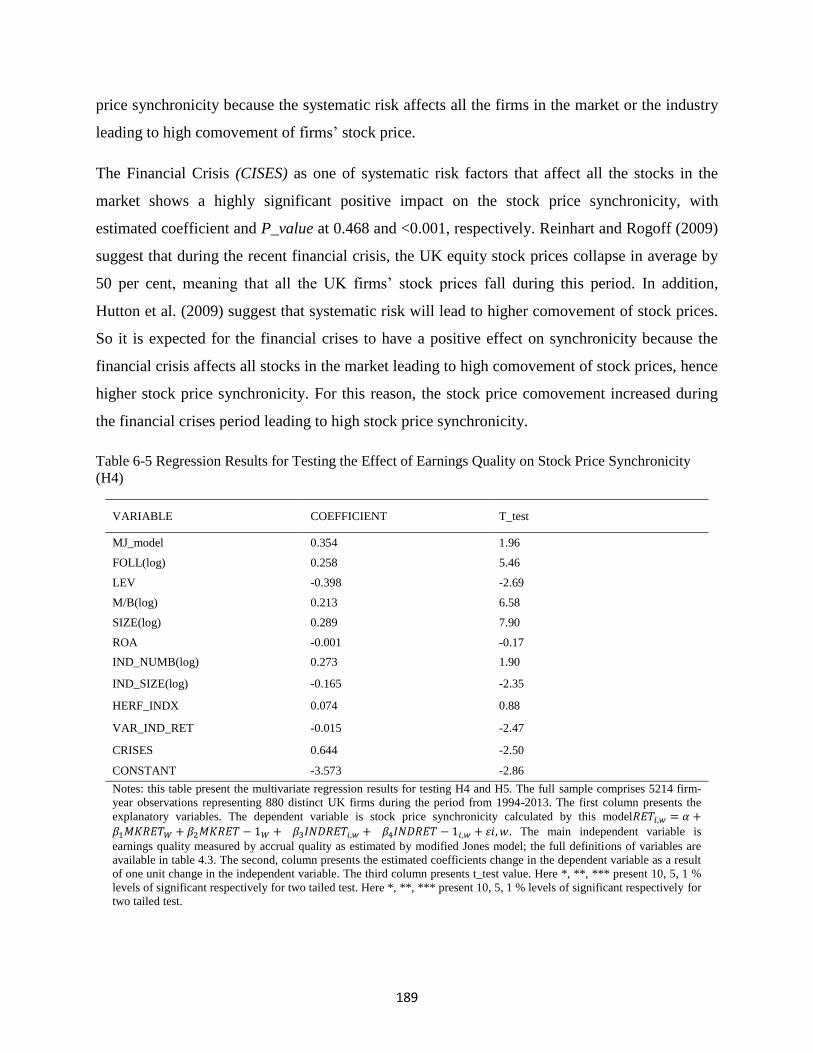
189
price synchronicity because the systematic risk affects all the firms in the market or the industry
leading to high comovement of firms’ stock price.
The Financial Crisis (CISES) as one of systematic risk factors that affect all the stocks in the
market shows a highly significant positive impact on the stock price synchronicity, with
estimated coefficient and P_value at 0.468 and <0.001, respectively. Reinhart and Rogoff (2009)
suggest that during the recent financial crisis, the UK equity stock prices collapse in average by
50 per cent, meaning that all the UK firms’ stock prices fall during this period. In addition,
Hutton et al. (2009) suggest that systematic risk will lead to higher comovement of stock prices.
So it is expected for the financial crises to have a positive effect on synchronicity because the
financial crisis affects all stocks in the market leading to high comovement of stock prices, hence
higher stock price synchronicity. For this reason, the stock price comovement increased during
the financial crises period leading to high stock price synchronicity.
Table 6-5 Regression Results for Testing the Effect of Earnings Quality on Stock Price Synchronicity
(H4)
VARIABLE COEFFICIENT T_test
MJ_model 0.354 1.96
FOLL(log) 0.258 5.46
LEV -0.398 -2.69
M/B(log) 0.213 6.58
SIZE(log) 0.289 7.90
ROA -0.001 -0.17
IND_NUMB(log) 0.273 1.90
IND_SIZE(log) -0.165 -2.35
HERF_INDX 0.074 0.88
VAR_IND_RET -0.015 -2.47
CRISES 0.644 -2.50
CONSTANT -3.573 -2.86
Notes: this table present the multivariate regression results for testing H4 and H5. The full sample comprises 5214 firm-
year observations representing 880 distinct UK firms during the period from 1994-2013. The first column presents the
explanatory variables. The dependent variable is stock price synchronicity calculated by this model𝑅𝐸𝑇𝑖,𝑤 = 𝛼 +
𝛽1𝑀𝐾𝑅𝐸𝑇𝑊 + 𝛽2𝑀𝐾𝑅𝐸𝑇 − 1𝑊 + 𝛽3𝐼𝑁𝐷𝑅𝐸𝑇𝑖,𝑤 + 𝛽4𝐼𝑁𝐷𝑅𝐸𝑇 − 1𝑖,𝑤 + 𝜀𝑖, 𝑤. The main independent variable is
earnings quality measured by accrual quality as estimated by modified Jones model; the full definitions of variables are
available in table 4.3. The second, column presents the estimated coefficients change in the dependent variable as a result
of one unit change in the independent variable. The third column presents t_test value. Here *, **, *** present 10, 5, 1 %
levels of significant respectively for two tailed test. Here *, **, *** present 10, 5, 1 % levels of significant respectively for
two tailed test.
190
6.5.2 Does IFRS adoption affect the relationship between earnings quality and stock price
informativeness?
The fifth and sixth hypotheses are concerned in the effect of mandatory adoption of IFRS on the
relationship between the earning quality and stock price synchronicity. Prior research suggests
that mandatory adoption of IFRS adoption leads to high-quality accounting numbers. For
example, Houqe et al. (2012), and Barth et al. (2008) provide international evidence that IFRS
adoption leads to higher quality accounting numbers. Consistent results from emerging markets
were provided by Ismail et al. (2013). In addition, other research documented an increase in the
value relevance of accounting numbers following the adoption of IFRS. For example, Devalle et
al. (2010) and Clarkson et al. (2011) find that the adoption of IFRS increases the value relevance
for some adopting countries. So one can expect a higher effect of earnings quality on stock price
synchronicity following the mandatory adoption of IFRS.
However, other research fails to document an improvement in earning quality following
mandatory adoption of IFRS. For example, Liu and Sun (2015) , Doukakis (2014), and Paananen
and Lin (2009), find that IFRS adoption does not have a significant impact upon improving
earnings quality. Also Tsalavoutas et al. (2012) and Paananen and Lin (2009) find that IFRS has
no impact on the value relevance of accounting numbers. Based on these results it is expected
that the relationship between earnings quality and stock price synchronicity is not affected by the
mandatory adoption of IFRS.
To examine the net effect of IFRS adoption on the relation between earnings quality and stock
price synchronicity, a separate regression for the period before the mandatory adoption of IFRS
and another regression for the period after the mandatory adoption of IFRS were performed.
After that comparison of the coefficients of earning quality for the pre-adoption period with that
for the post-adoption period was established.
Table 6.6 provides the regression results for examining the effect of earnings quality on stock
price synchronicity. Panel A presents the regression results for the pre-adoption sample, panel B
presents the regression results for the post-adoption sample, and panel C presents the results of
191
testing the difference between earnings quality coefficients for the pre and the post-adoption
samples.
The regression results show that the coefficient of MJ_model for pre-adoption IFRS sample is
not significant. While the coefficient of MJ_model for post adoption sample is positive and
significant. These results are consistent with the hypothesis that, mandatory adoption of IFRS
improves earnings quality and the value relevance of accounting numbers. For these reasons
IFRS adoption could improve the power of earnings quality in explaining the stock price
synchronicity. However, there is a need to test if this different in the coefficient of MJ_model
between pre and post adoption sample is significant or not. To do so a comparison of the
regressions coefficients of MJ_model for the pre-IFRS sample with that for the post-IFRS
sample was performed, to test the hypothesis that the beta coefficients of MJ_model for pre-
IFRS sample are significantly different from the beta coefficient of MJ_model for post-IFRS
sample.
To do this analysis, a dummy variable called IFRS that coded 0 for pre-IFRS sample and 1 for
post-IFRS sample was generated, and the author generates a new variable called IFRS_MJM that
is the product of the interaction between IFRS and MJ_model variables. Then IFRS and
IFRS_MJM variables were used as predictors in the regression equation.
Panel C of table 6.6 presents the regression results from testing the difference between the beta
coefficients of MJ_model for pre-IFRS and post-IFRS samples. The term of interest in this table
is IFRS-MJM because it captures the change in the coefficient of MJ_model in the post-IFRS
period. Consequently, the IFRS-MJM variable tests the hypothesis that the coefficient of
MJ_model for IFRS adopters is significantly different from the coefficient of MJ_model for non-
adopters. The P-value of the interaction term IFRS-MJM is not significant (P-value = 670),
indicating that the coefficient of MJ-model for IFRS adopters is not significantly different from
the coefficient of MJ_model for non-adopters. These results suggest that IFRS adoption has no
effect on the relationship between earnings quality and stock price synchronicity.
Therefore, it seems that mandatory adoption of IFRS does not affect the earnings quality of
accounting numbers, for these reasons the mandatory adoption of IFRS do not affect the
relationship between earnings quality and stock price synchronicity.
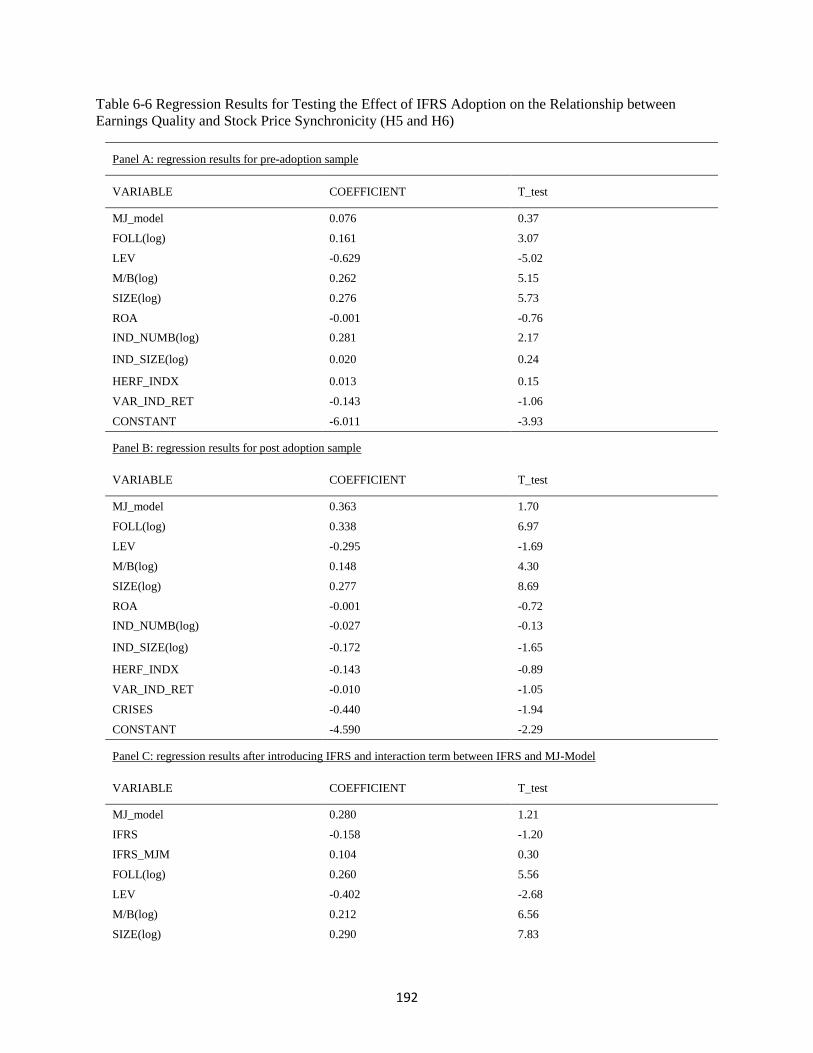
192
Table 6-6 Regression Results for Testing the Effect of IFRS Adoption on the Relationship between
Earnings Quality and Stock Price Synchronicity (H5 and H6)
Panel A: regression results for pre-adoption sample
VARIABLE COEFFICIENT T_test
MJ_model 0.076 0.37
FOLL(log) 0.161 3.07
LEV -0.629 -5.02
M/B(log) 0.262 5.15
SIZE(log) 0.276 5.73
ROA -0.001 -0.76
IND_NUMB(log) 0.281 2.17
IND_SIZE(log) 0.020 0.24
HERF_INDX 0.013 0.15
VAR_IND_RET -0.143 -1.06
CONSTANT -6.011 -3.93
Panel B: regression results for post adoption sample
VARIABLE COEFFICIENT T_test
MJ_model 0.363 1.70
FOLL(log) 0.338 6.97
LEV -0.295 -1.69
M/B(log) 0.148 4.30
SIZE(log) 0.277 8.69
ROA -0.001 -0.72
IND_NUMB(log) -0.027 -0.13
IND_SIZE(log) -0.172 -1.65
HERF_INDX -0.143 -0.89
VAR_IND_RET -0.010 -1.05
CRISES -0.440 -1.94
CONSTANT -4.590 -2.29
Panel C: regression results after introducing IFRS and interaction term between IFRS and MJ-Model
VARIABLE COEFFICIENT T_test
MJ_model 0.280 1.21
IFRS -0.158 -1.20
IFRS_MJM 0.104 0.30
FOLL(log) 0.260 5.56
LEV -0.402 -2.68
M/B(log) 0.212 6.56
SIZE(log) 0.290 7.83
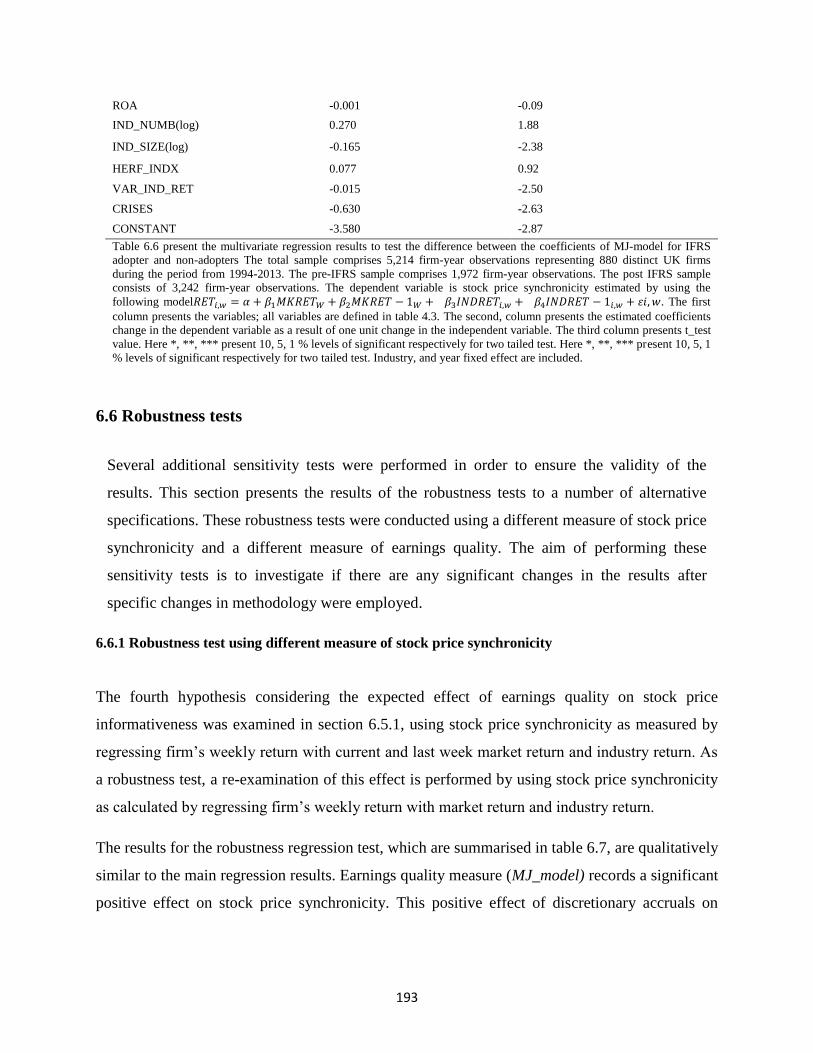
193
ROA -0.001 -0.09
IND_NUMB(log) 0.270 1.88
IND_SIZE(log) -0.165 -2.38
HERF_INDX 0.077 0.92
VAR_IND_RET -0.015 -2.50
CRISES -0.630 -2.63
CONSTANT -3.580 -2.87
Table 6.6 present the multivariate regression results to test the difference between the coefficients of MJ-model for IFRS
adopter and non-adopters The total sample comprises 5,214 firm-year observations representing 880 distinct UK firms
during the period from 1994-2013. The pre-IFRS sample comprises 1,972 firm-year observations. The post IFRS sample
consists of 3,242 firm-year observations. The dependent variable is stock price synchronicity estimated by using the
following model𝑅𝐸𝑇𝑖,𝑤 = 𝛼 + 𝛽1𝑀𝐾𝑅𝐸𝑇𝑊 + 𝛽2𝑀𝐾𝑅𝐸𝑇 − 1𝑊 + 𝛽3𝐼𝑁𝐷𝑅𝐸𝑇𝑖,𝑤 + 𝛽4𝐼𝑁𝐷𝑅𝐸𝑇 − 1𝑖,𝑤 + 𝜀𝑖, 𝑤. The first
column presents the variables; all variables are defined in table 4.3. The second, column presents the estimated coefficients
change in the dependent variable as a result of one unit change in the independent variable. The third column presents t_test
value. Here *, **, *** present 10, 5, 1 % levels of significant respectively for two tailed test. Here *, **, *** present 10, 5, 1
% levels of significant respectively for two tailed test. Industry, and year fixed effect are included.
6.6 Robustness tests
Several additional sensitivity tests were performed in order to ensure the validity of the
results. This section presents the results of the robustness tests to a number of alternative
specifications. These robustness tests were conducted using a different measure of stock price
synchronicity and a different measure of earnings quality. The aim of performing these
sensitivity tests is to investigate if there are any significant changes in the results after
specific changes in methodology were employed.
6.6.1 Robustness test using different measure of stock price synchronicity
The fourth hypothesis considering the expected effect of earnings quality on stock price
informativeness was examined in section 6.5.1, using stock price synchronicity as measured by
regressing firm’s weekly return with current and last week market return and industry return. As
a robustness test, a re-examination of this effect is performed by using stock price synchronicity
as calculated by regressing firm’s weekly return with market return and industry return.
The results for the robustness regression test, which are summarised in table 6.7, are qualitatively
similar to the main regression results. Earnings quality measure (MJ_model) records a significant
positive effect on stock price synchronicity. This positive effect of discretionary accruals on
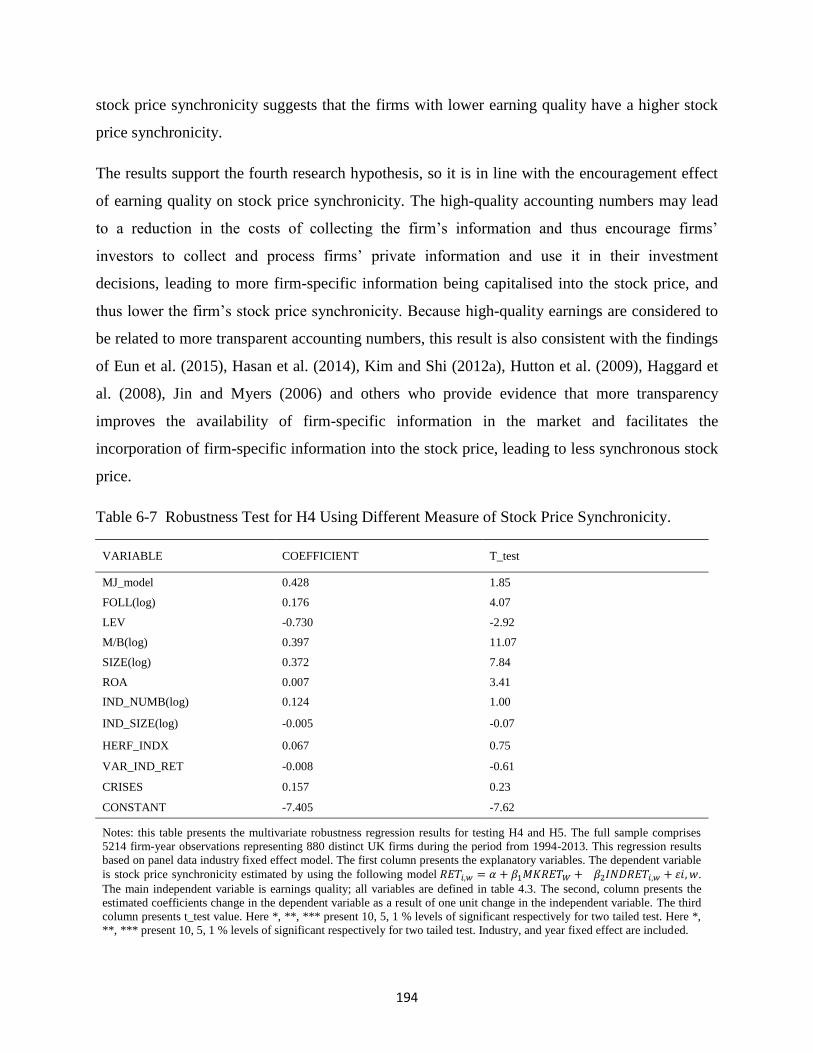
194
stock price synchronicity suggests that the firms with lower earning quality have a higher stock
price synchronicity.
The results support the fourth research hypothesis, so it is in line with the encouragement effect
of earning quality on stock price synchronicity. The high-quality accounting numbers may lead
to a reduction in the costs of collecting the firm’s information and thus encourage firms’
investors to collect and process firms’ private information and use it in their investment
decisions, leading to more firm-specific information being capitalised into the stock price, and
thus lower the firm’s stock price synchronicity. Because high-quality earnings are considered to
be related to more transparent accounting numbers, this result is also consistent with the findings
of Eun et al. (2015), Hasan et al. (2014), Kim and Shi (2012a), Hutton et al. (2009), Haggard et
al. (2008), Jin and Myers (2006) and others who provide evidence that more transparency
improves the availability of firm-specific information in the market and facilitates the
incorporation of firm-specific information into the stock price, leading to less synchronous stock
price.
Table 6-7 Robustness Test for H4 Using Different Measure of Stock Price Synchronicity.
VARIABLE COEFFICIENT T_test
MJ_model 0.428 1.85
FOLL(log) 0.176 4.07
LEV -0.730 -2.92
M/B(log) 0.397 11.07
SIZE(log) 0.372 7.84
ROA 0.007 3.41
IND_NUMB(log) 0.124 1.00
IND_SIZE(log) -0.005 -0.07
HERF_INDX 0.067 0.75
VAR_IND_RET -0.008 -0.61
CRISES 0.157 0.23
CONSTANT -7.405 -7.62
Notes: this table presents the multivariate robustness regression results for testing H4 and H5. The full sample comprises
5214 firm-year observations representing 880 distinct UK firms during the period from 1994-2013. This regression results
based on panel data industry fixed effect model. The first column presents the explanatory variables. The dependent variable
is stock price synchronicity estimated by using the following model 𝑅𝐸𝑇𝑖,𝑤 = 𝛼 + 𝛽1𝑀𝐾𝑅𝐸𝑇𝑊 + 𝛽2𝐼𝑁𝐷𝑅𝐸𝑇𝑖,𝑤 + 𝜀𝑖, 𝑤.
The main independent variable is earnings quality; all variables are defined in table 4.3. The second, column presents the
estimated coefficients change in the dependent variable as a result of one unit change in the independent variable. The third
column presents t_test value. Here *, **, *** present 10, 5, 1 % levels of significant respectively for two tailed test. Here *,
**, *** present 10, 5, 1 % levels of significant respectively for two tailed test. Industry, and year fixed effect are included.

195
The results of control variables are qualitatively similar to that for the main regression. These
results confirm that earnings quality plays an essential role in incorporating firm-specific
information into the stock price, leading to a less synchronous and more informative stock price.
The results of robustness test for examining the effect of IFRS adoption on the relationship
between earning quality and stock price synchronicity are summarized in tables 6.8. Panel A
presents the regression results for the pre-adoption sample, panel B presents the regression
results for the post-adoption sample, and panel C presents the result of testing the difference
between earnings quality coefficients for pre and post adoption samples
Similarly, in this robustness test, stock price synchronicity as measured by regressing firm’s
weekly return with market return and industry return was used, instead of the model in EQ (1) to
test whether the IFRS adoption affects the relationship between earnings quality and stock price
synchronicity. Consistent with the main regression results, the coefficient of MJ-model for the
post-adoption sample records a significant positive effect on synchronicity, whilst that for the
pre-adoption sample is not significant. These results suggest that IFRS adoption improves the
power of earnings quality in predicting stock price synchronicity.
Table 6-8 Robustness Test for H5 and H6 using different measure of stock price synchronicity
Panel A: regression results for pre-adoption sample
VARIABLE COEFFICIENT T_test
MJ_model -0.510 -1.26
FOLL(log) 0.241 3.88
LEV -1.286 -3.54
M/B(log) 0.427 7.11
SIZE(log) 0.414 5.20
ROA 0.004 1.30
IND_NUMB(log) 0.130 0.54
IND_SIZE(log) 0.019 0.20
HERF_INDX 0.316 1.49
VAR_IND_RET -0.032 -0.19
CONSTANT -7.843 -6.51
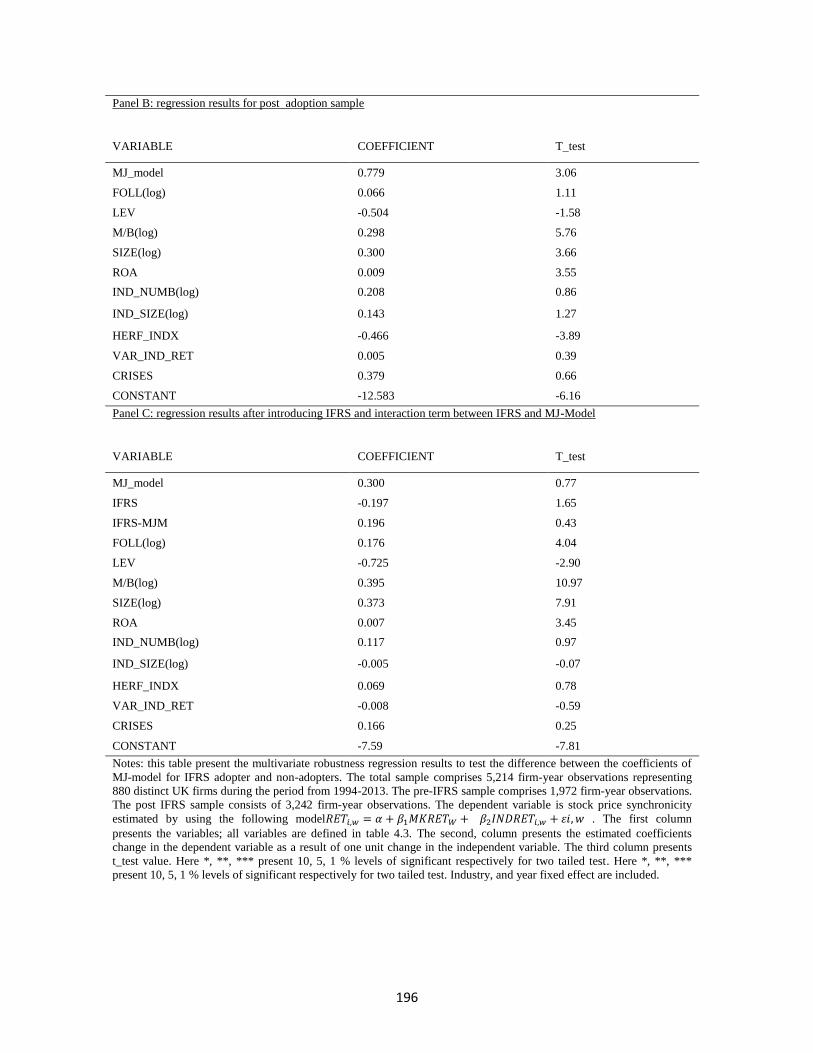
196
Panel B: regression results for post adoption sample
VARIABLE COEFFICIENT T_test
MJ_model 0.779 3.06
FOLL(log) 0.066 1.11
LEV -0.504 -1.58
M/B(log) 0.298 5.76
SIZE(log) 0.300 3.66
ROA 0.009 3.55
IND_NUMB(log) 0.208 0.86
IND_SIZE(log) 0.143 1.27
HERF_INDX -0.466 -3.89
VAR_IND_RET 0.005 0.39
CRISES 0.379 0.66
CONSTANT -12.583 -6.16
Panel C: regression results after introducing IFRS and interaction term between IFRS and MJ-Model
VARIABLE COEFFICIENT T_test
MJ_model 0.300 0.77
IFRS -0.197 1.65
IFRS-MJM 0.196 0.43
FOLL(log) 0.176 4.04
LEV -0.725 -2.90
M/B(log) 0.395 10.97
SIZE(log) 0.373 7.91
ROA 0.007 3.45
IND_NUMB(log) 0.117 0.97
IND_SIZE(log) -0.005 -0.07
HERF_INDX 0.069 0.78
VAR_IND_RET -0.008 -0.59
CRISES 0.166 0.25
CONSTANT -7.59 -7.81
Notes: this table present the multivariate robustness regression results to test the difference between the coefficients of
MJ-model for IFRS adopter and non-adopters. The total sample comprises 5,214 firm-year observations representing
880 distinct UK firms during the period from 1994-2013. The pre-IFRS sample comprises 1,972 firm-year observations.
The post IFRS sample consists of 3,242 firm-year observations. The dependent variable is stock price synchronicity
estimated by using the following model𝑅𝐸𝑇𝑖,𝑤 = 𝛼 + 𝛽1𝑀𝐾𝑅𝐸𝑇𝑊 + 𝛽2𝐼𝑁𝐷𝑅𝐸𝑇𝑖,𝑤 + 𝜀𝑖, 𝑤 . The first column
presents the variables; all variables are defined in table 4.3. The second, column presents the estimated coefficients
change in the dependent variable as a result of one unit change in the independent variable. The third column presents
t_test value. Here *, **, *** present 10, 5, 1 % levels of significant respectively for two tailed test. Here *, **, ***
present 10, 5, 1 % levels of significant respectively for two tailed test. Industry, and year fixed effect are included.
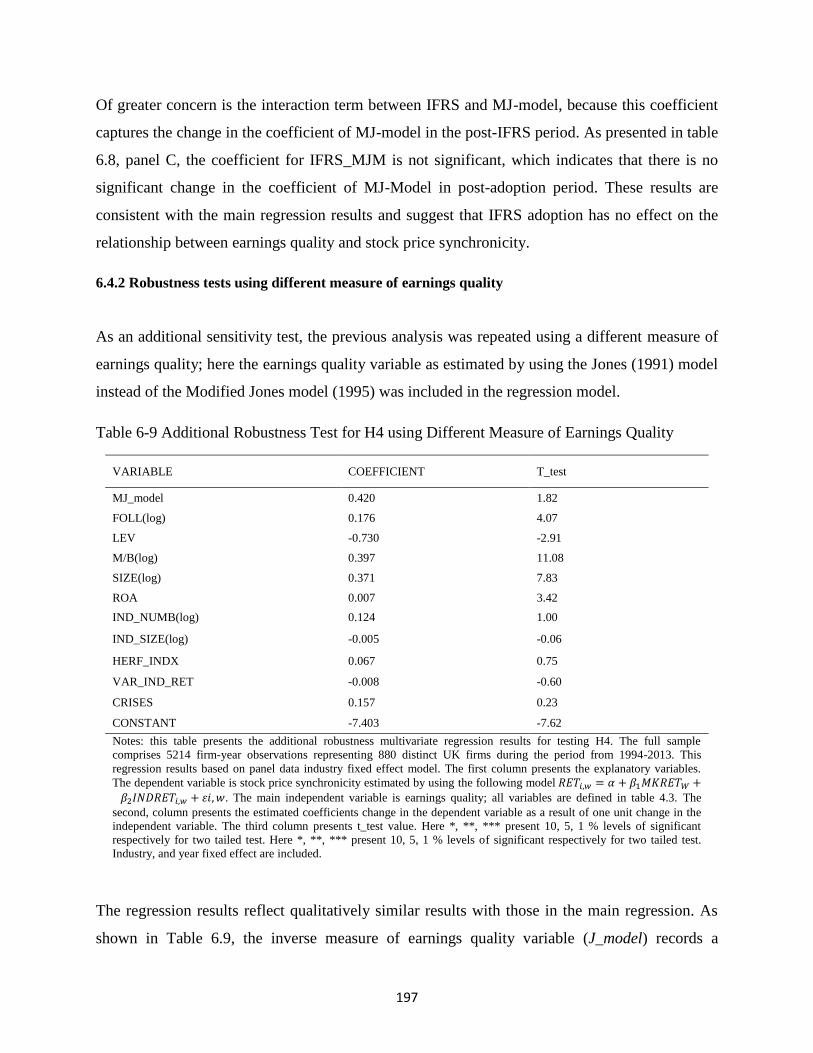
197
Of greater concern is the interaction term between IFRS and MJ-model, because this coefficient
captures the change in the coefficient of MJ-model in the post-IFRS period. As presented in table
6.8, panel C, the coefficient for IFRS_MJM is not significant, which indicates that there is no
significant change in the coefficient of MJ-Model in post-adoption period. These results are
consistent with the main regression results and suggest that IFRS adoption has no effect on the
relationship between earnings quality and stock price synchronicity.
6.4.2 Robustness tests using different measure of earnings quality
As an additional sensitivity test, the previous analysis was repeated using a different measure of
earnings quality; here the earnings quality variable as estimated by using the Jones (1991) model
instead of the Modified Jones model (1995) was included in the regression model.
Table 6-9 Additional Robustness Test for H4 using Different Measure of Earnings Quality
VARIABLE COEFFICIENT T_test
MJ_model 0.420 1.82
FOLL(log) 0.176 4.07
LEV -0.730 -2.91
M/B(log) 0.397 11.08
SIZE(log) 0.371 7.83
ROA 0.007 3.42
IND_NUMB(log) 0.124 1.00
IND_SIZE(log) -0.005 -0.06
HERF_INDX 0.067 0.75
VAR_IND_RET -0.008 -0.60
CRISES 0.157 0.23
CONSTANT -7.403 -7.62
Notes: this table presents the additional robustness multivariate regression results for testing H4. The full sample
comprises 5214 firm-year observations representing 880 distinct UK firms during the period from 1994-2013. This
regression results based on panel data industry fixed effect model. The first column presents the explanatory variables.
The dependent variable is stock price synchronicity estimated by using the following model 𝑅𝐸𝑇𝑖,𝑤 = 𝛼 + 𝛽1𝑀𝐾𝑅𝐸𝑇𝑊 +
𝛽2𝐼𝑁𝐷𝑅𝐸𝑇𝑖,𝑤 + 𝜀𝑖, 𝑤. The main independent variable is earnings quality; all variables are defined in table 4.3. The
second, column presents the estimated coefficients change in the dependent variable as a result of one unit change in the
independent variable. The third column presents t_test value. Here *, **, *** present 10, 5, 1 % levels of significant
respectively for two tailed test. Here *, **, *** present 10, 5, 1 % levels of significant respectively for two tailed test.
Industry, and year fixed effect are included.
The regression results reflect qualitatively similar results with those in the main regression. As
shown in Table 6.9, the inverse measure of earnings quality variable (J_model) records a
198
significant positive effect on stock price synchronicity. This result improves the credibility of the
main results and confirms that the higher earnings quality improves the investor confidence on
firm-specific information, which encourages the investors to collect and process this information
in their investments decisions. Using this firm-specific information in the investment decisions
leads to more capitalisation of firm-specific information into the stock price in relation to
market-wide and industry-wide information thus lower stock price synchronicity and a more
informative stock price.
Additionally, earnings quality, as estimated by Jones model (1991), and stock price
synchronicity, as measured by regressing firm’s weekly return with market return and industry
return, were used in the regression to test whether IFRS adoption affects the relationship between
earnings quality and stock price synchronicity. As shown in Table 6.10 the results are highly
consistent with the main regression results. The coefficient of MJ-model for the post-adoption
sample records a significant positive effect on synchronicity, whilst that for the pre-adoption
sample is not significant. These results suggest that IFRS adoption improves the power of the
earnings quality in predicting stock price synchronicity.
The term of interest is the interaction term between IFRS and MJ-model because this coefficient
captures the change in the coefficient of MJ-model in the post-IFRS period. As presented in table
6.10, panel C, results are qualitatively identical to main regression, the coefficient for
IFRS_MJM is not significant. This indicates that there is no significant change in the coefficient
of MJ-Model in the post-adoption period. These results are consistent with the main regression
results and suggest that IFRS adoption has no effect on the relationship between earnings quality
and stock price synchronicity.
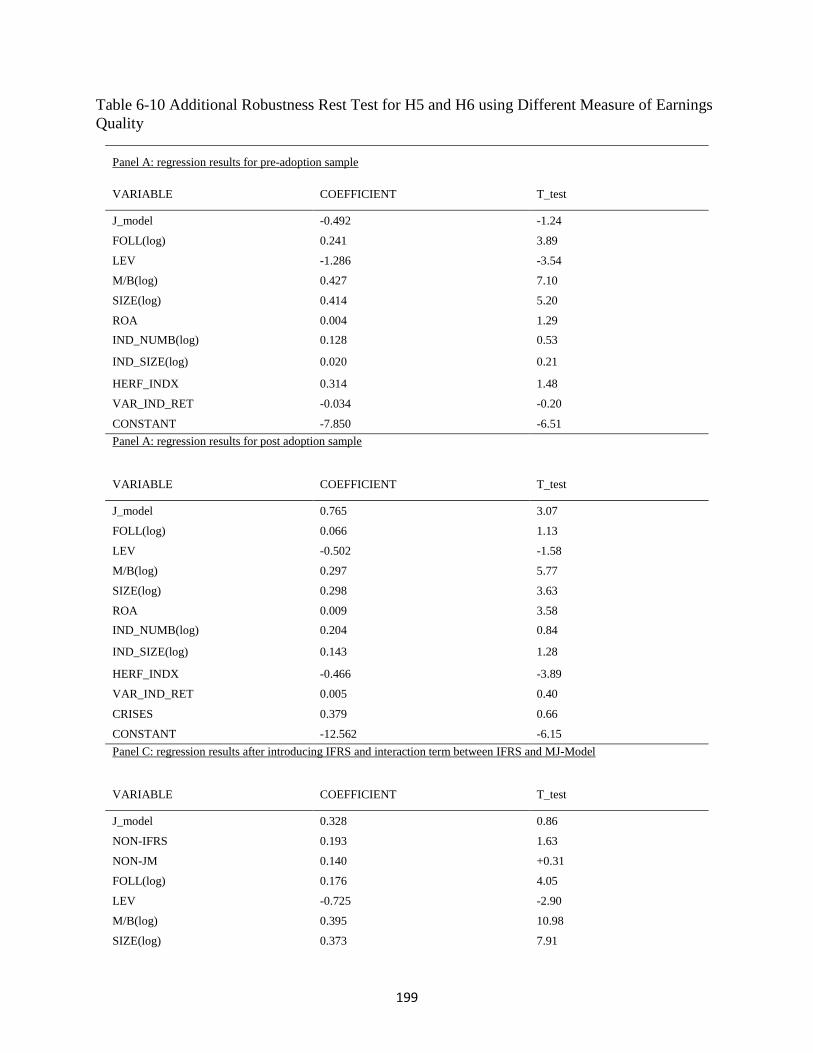
199
Table 6-10 Additional Robustness Rest Test for H5 and H6 using Different Measure of Earnings
Quality
Panel A: regression results for pre-adoption sample
VARIABLE COEFFICIENT T_test
J_model -0.492 -1.24
FOLL(log) 0.241 3.89
LEV -1.286 -3.54
M/B(log) 0.427 7.10
SIZE(log) 0.414 5.20
ROA 0.004 1.29
IND_NUMB(log) 0.128 0.53
IND_SIZE(log) 0.020 0.21
HERF_INDX 0.314 1.48
VAR_IND_RET -0.034 -0.20
CONSTANT -7.850 -6.51
Panel A: regression results for post adoption sample
VARIABLE COEFFICIENT T_test
J_model 0.765 3.07
FOLL(log) 0.066 1.13
LEV -0.502 -1.58
M/B(log) 0.297 5.77
SIZE(log) 0.298 3.63
ROA 0.009 3.58
IND_NUMB(log) 0.204 0.84
IND_SIZE(log) 0.143 1.28
HERF_INDX -0.466 -3.89
VAR_IND_RET 0.005 0.40
CRISES 0.379 0.66
CONSTANT -12.562 -6.15
Panel C: regression results after introducing IFRS and interaction term between IFRS and MJ-Model
VARIABLE COEFFICIENT T_test
J_model 0.328 0.86
NON-IFRS 0.193 1.63
NON-JM 0.140 +0.31
FOLL(log) 0.176 4.05
LEV -0.725 -2.90
M/B(log) 0.395 10.98
SIZE(log) 0.373 7.91
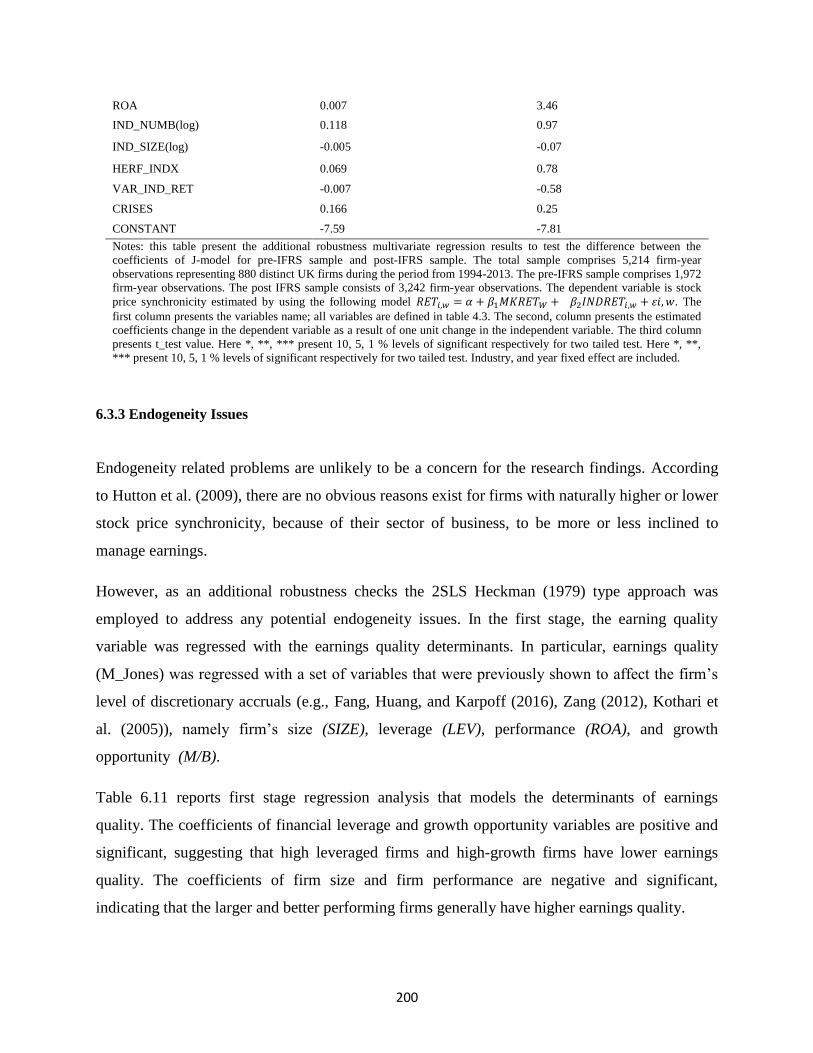
200
ROA 0.007 3.46
IND_NUMB(log) 0.118 0.97
IND_SIZE(log) -0.005 -0.07
HERF_INDX 0.069 0.78
VAR_IND_RET -0.007 -0.58
CRISES 0.166 0.25
CONSTANT -7.59 -7.81
Notes: this table present the additional robustness multivariate regression results to test the difference between the
coefficients of J-model for pre-IFRS sample and post-IFRS sample. The total sample comprises 5,214 firm-year
observations representing 880 distinct UK firms during the period from 1994-2013. The pre-IFRS sample comprises 1,972
firm-year observations. The post IFRS sample consists of 3,242 firm-year observations. The dependent variable is stock
price synchronicity estimated by using the following model 𝑅𝐸𝑇𝑖,𝑤 = 𝛼 + 𝛽1𝑀𝐾𝑅𝐸𝑇𝑊 + 𝛽2𝐼𝑁𝐷𝑅𝐸𝑇𝑖,𝑤 + 𝜀𝑖, 𝑤. The
first column presents the variables name; all variables are defined in table 4.3. The second, column presents the estimated
coefficients change in the dependent variable as a result of one unit change in the independent variable. The third column
presents t_test value. Here *, **, *** present 10, 5, 1 % levels of significant respectively for two tailed test. Here *, **,
*** present 10, 5, 1 % levels of significant respectively for two tailed test. Industry, and year fixed effect are included.
6.3.3 Endogeneity Issues
Endogeneity related problems are unlikely to be a concern for the research findings. According
to Hutton et al. (2009), there are no obvious reasons exist for firms with naturally higher or lower
stock price synchronicity, because of their sector of business, to be more or less inclined to
manage earnings.
However, as an additional robustness checks the 2SLS Heckman (1979) type approach was
employed to address any potential endogeneity issues. In the first stage, the earning quality
variable was regressed with the earnings quality determinants. In particular, earnings quality
(M_Jones) was regressed with a set of variables that were previously shown to affect the firm’s
level of discretionary accruals (e.g., Fang, Huang, and Karpoff (2016), Zang (2012), Kothari et
al. (2005)), namely firm’s size (SIZE), leverage (LEV), performance (ROA), and growth
opportunity (M/B).
Table 6.11 reports first stage regression analysis that models the determinants of earnings
quality. The coefficients of financial leverage and growth opportunity variables are positive and
significant, suggesting that high leveraged firms and high-growth firms have lower earnings
quality. The coefficients of firm size and firm performance are negative and significant,
indicating that the larger and better performing firms generally have higher earnings quality.
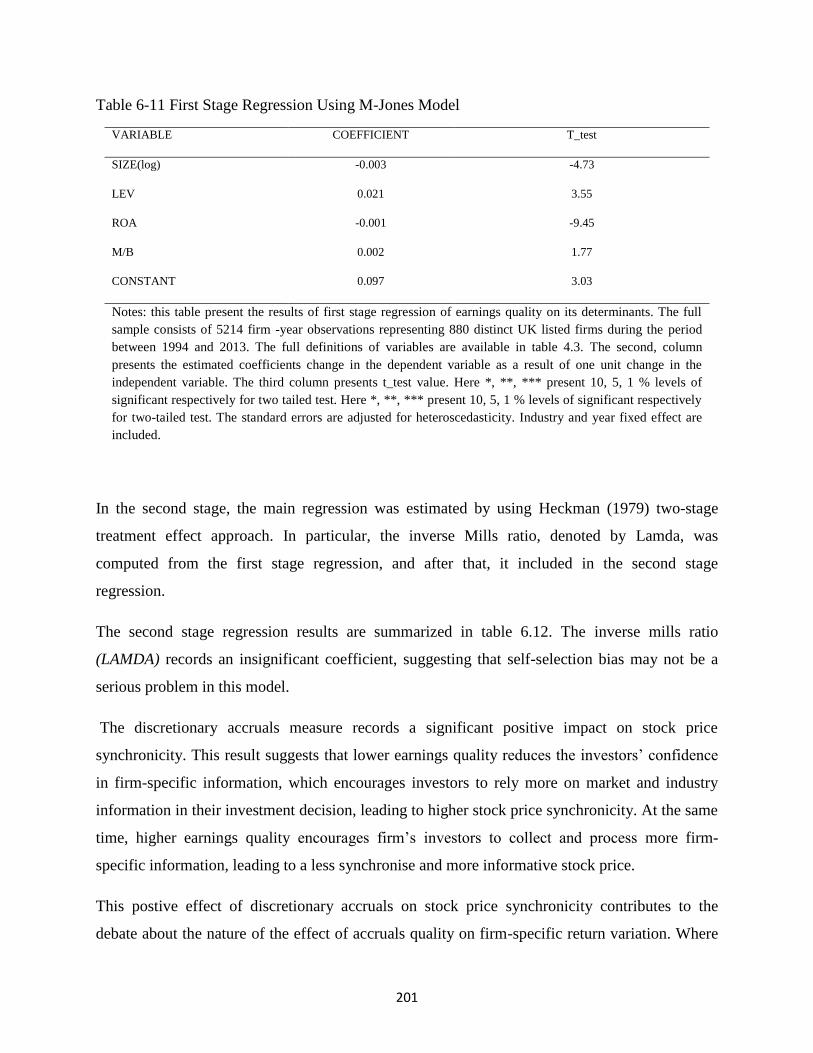
201
Table 6-11 First Stage Regression Using M-Jones Model
VARIABLE COEFFICIENT T_test
SIZE(log) -0.003 -4.73
LEV 0.021 3.55
ROA -0.001 -9.45
M/B 0.002 1.77
CONSTANT 0.097 3.03
Notes: this table present the results of first stage regression of earnings quality on its determinants. The full
sample consists of 5214 firm -year observations representing 880 distinct UK listed firms during the period
between 1994 and 2013. The full definitions of variables are available in table 4.3. The second, column
presents the estimated coefficients change in the dependent variable as a result of one unit change in the
independent variable. The third column presents t_test value. Here *, **, *** present 10, 5, 1 % levels of
significant respectively for two tailed test. Here *, **, *** present 10, 5, 1 % levels of significant respectively
for two-tailed test. The standard errors are adjusted for heteroscedasticity. Industry and year fixed effect are
included.
In the second stage, the main regression was estimated by using Heckman (1979) two-stage
treatment effect approach. In particular, the inverse Mills ratio, denoted by Lamda, was
computed from the first stage regression, and after that, it included in the second stage
regression.
The second stage regression results are summarized in table 6.12. The inverse mills ratio
(LAMDA) records an insignificant coefficient, suggesting that self-selection bias may not be a
serious problem in this model.
The discretionary accruals measure records a significant positive impact on stock price
synchronicity. This result suggests that lower earnings quality reduces the investors’ confidence
in firm-specific information, which encourages investors to rely more on market and industry
information in their investment decision, leading to higher stock price synchronicity. At the same
time, higher earnings quality encourages firm’s investors to collect and process more firm-
specific information, leading to a less synchronise and more informative stock price.
This postive effect of discretionary accruals on stock price synchronicity contributes to the
debate about the nature of the effect of accruals quality on firm-specific return variation. Where
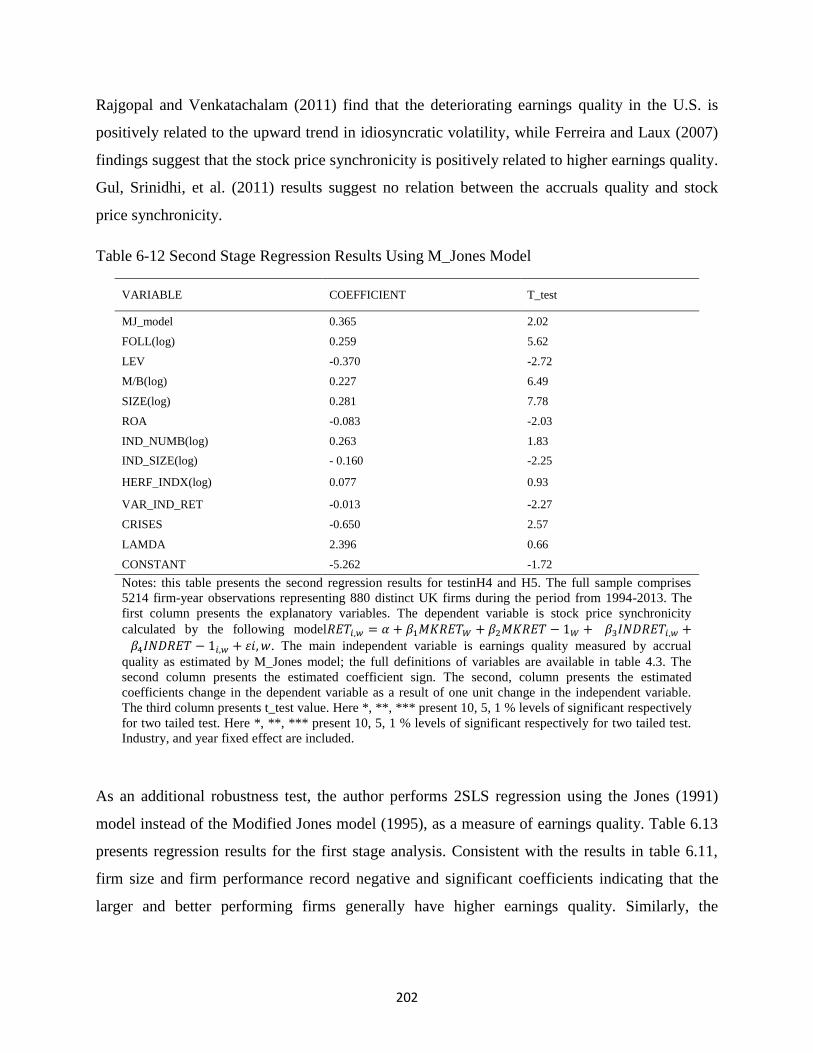
202
Rajgopal and Venkatachalam (2011) find that the deteriorating earnings quality in the U.S. is
positively related to the upward trend in idiosyncratic volatility, while Ferreira and Laux (2007)
findings suggest that the stock price synchronicity is positively related to higher earnings quality.
Gul, Srinidhi, et al. (2011) results suggest no relation between the accruals quality and stock
price synchronicity.
Table 6-12 Second Stage Regression Results Using M_Jones Model
VARIABLE COEFFICIENT T_test
MJ_model 0.365 2.02
FOLL(log) 0.259 5.62
LEV -0.370 -2.72
M/B(log) 0.227 6.49
SIZE(log) 0.281 7.78
ROA -0.083 -2.03
IND_NUMB(log) 0.263 1.83
IND_SIZE(log) - 0.160 -2.25
HERF_INDX(log) 0.077 0.93
VAR_IND_RET -0.013 -2.27
CRISES -0.650 2.57
LAMDA 2.396 0.66
CONSTANT -5.262 -1.72
Notes: this table presents the second regression results for testinH4 and H5. The full sample comprises
5214 firm-year observations representing 880 distinct UK firms during the period from 1994-2013. The
first column presents the explanatory variables. The dependent variable is stock price synchronicity
calculated by the following model𝑅𝐸𝑇𝑖,𝑤 = 𝛼 + 𝛽1𝑀𝐾𝑅𝐸𝑇𝑊 + 𝛽2𝑀𝐾𝑅𝐸𝑇 − 1𝑊 + 𝛽3𝐼𝑁𝐷𝑅𝐸𝑇𝑖,𝑤 +
𝛽4𝐼𝑁𝐷𝑅𝐸𝑇 − 1𝑖,𝑤 + 𝜀𝑖, 𝑤. The main independent variable is earnings quality measured by accrual
quality as estimated by M_Jones model; the full definitions of variables are available in table 4.3. The
second column presents the estimated coefficient sign. The second, column presents the estimated
coefficients change in the dependent variable as a result of one unit change in the independent variable.
The third column presents t_test value. Here *, **, *** present 10, 5, 1 % levels of significant respectively
for two tailed test. Here *, **, *** present 10, 5, 1 % levels of significant respectively for two tailed test.
Industry, and year fixed effect are included.
As an additional robustness test, the author performs 2SLS regression using the Jones (1991)
model instead of the Modified Jones model (1995), as a measure of earnings quality. Table 6.13
presents regression results for the first stage analysis. Consistent with the results in table 6.11,
firm size and firm performance record negative and significant coefficients indicating that the
larger and better performing firms generally have higher earnings quality. Similarly, the
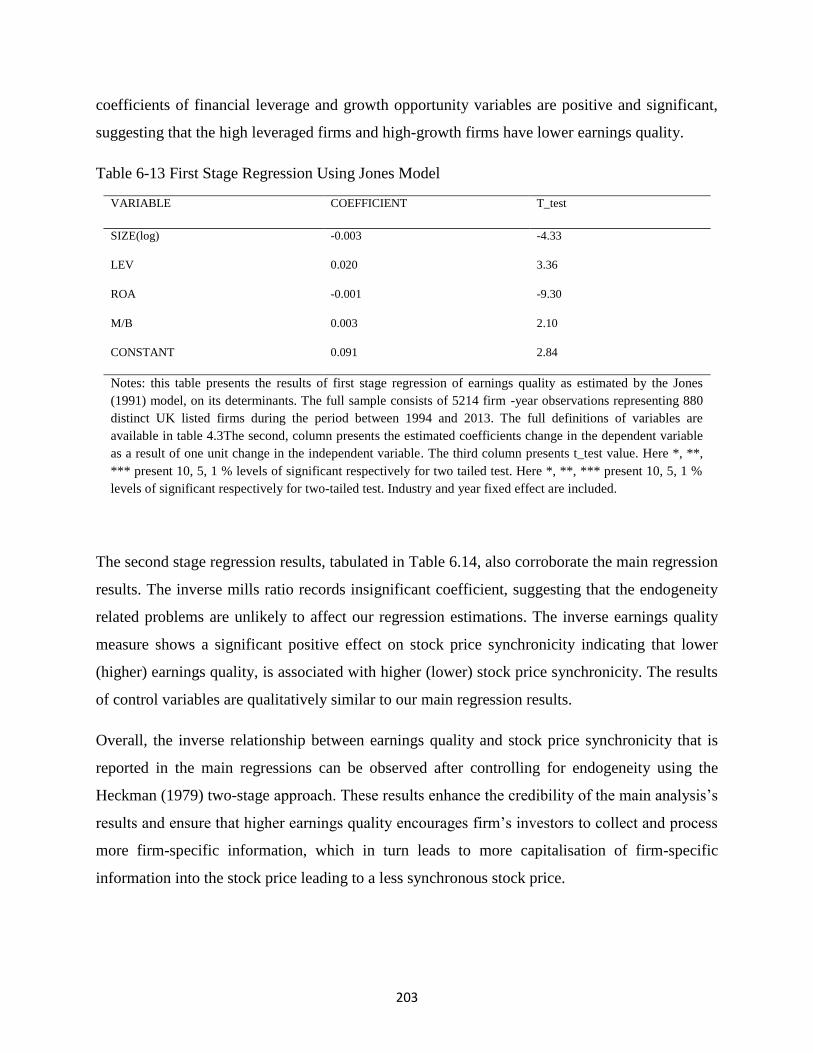
203
coefficients of financial leverage and growth opportunity variables are positive and significant,
suggesting that the high leveraged firms and high-growth firms have lower earnings quality.
Table 6-13 First Stage Regression Using Jones Model
VARIABLE COEFFICIENT T_test
SIZE(log) -0.003 -4.33
LEV 0.020 3.36
ROA -0.001 -9.30
M/B 0.003 2.10
CONSTANT 0.091 2.84
Notes: this table presents the results of first stage regression of earnings quality as estimated by the Jones
(1991) model, on its determinants. The full sample consists of 5214 firm -year observations representing 880
distinct UK listed firms during the period between 1994 and 2013. The full definitions of variables are
available in table 4.3The second, column presents the estimated coefficients change in the dependent variable
as a result of one unit change in the independent variable. The third column presents t_test value. Here *, **,
*** present 10, 5, 1 % levels of significant respectively for two tailed test. Here *, **, *** present 10, 5, 1 %
levels of significant respectively for two-tailed test. Industry and year fixed effect are included.
The second stage regression results, tabulated in Table 6.14, also corroborate the main regression
results. The inverse mills ratio records insignificant coefficient, suggesting that the endogeneity
related problems are unlikely to affect our regression estimations. The inverse earnings quality
measure shows a significant positive effect on stock price synchronicity indicating that lower
(higher) earnings quality, is associated with higher (lower) stock price synchronicity. The results
of control variables are qualitatively similar to our main regression results.
Overall, the inverse relationship between earnings quality and stock price synchronicity that is
reported in the main regressions can be observed after controlling for endogeneity using the
Heckman (1979) two-stage approach. These results enhance the credibility of the main analysis’s
results and ensure that higher earnings quality encourages firm’s investors to collect and process
more firm-specific information, which in turn leads to more capitalisation of firm-specific
information into the stock price leading to a less synchronous stock price.
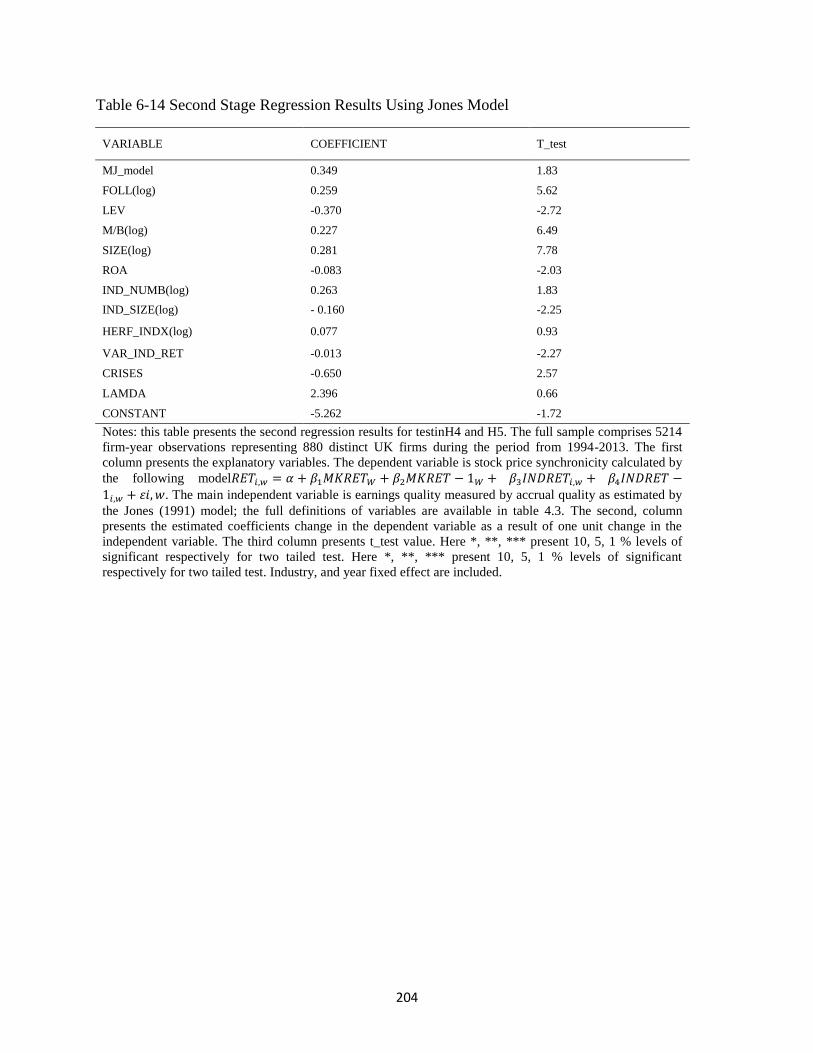
204
Table 6-14 Second Stage Regression Results Using Jones Model
VARIABLE COEFFICIENT T_test
MJ_model 0.349 1.83
FOLL(log) 0.259 5.62
LEV -0.370 -2.72
M/B(log) 0.227 6.49
SIZE(log) 0.281 7.78
ROA -0.083 -2.03
IND_NUMB(log) 0.263 1.83
IND_SIZE(log) - 0.160 -2.25
HERF_INDX(log) 0.077 0.93
VAR_IND_RET -0.013 -2.27
CRISES -0.650 2.57
LAMDA 2.396 0.66
CONSTANT -5.262 -1.72
Notes: this table presents the second regression results for testinH4 and H5. The full sample comprises 5214
firm-year observations representing 880 distinct UK firms during the period from 1994-2013. The first
column presents the explanatory variables. The dependent variable is stock price synchronicity calculated by
the following model𝑅𝐸𝑇𝑖,𝑤 = 𝛼 + 𝛽1𝑀𝐾𝑅𝐸𝑇𝑊 + 𝛽2𝑀𝐾𝑅𝐸𝑇 − 1𝑊 + 𝛽3𝐼𝑁𝐷𝑅𝐸𝑇𝑖,𝑤 + 𝛽4𝐼𝑁𝐷𝑅𝐸𝑇 −
1𝑖,𝑤 + 𝜀𝑖, 𝑤. The main independent variable is earnings quality measured by accrual quality as estimated by
the Jones (1991) model; the full definitions of variables are available in table 4.3. The second, column
presents the estimated coefficients change in the dependent variable as a result of one unit change in the
independent variable. The third column presents t_test value. Here *, **, *** present 10, 5, 1 % levels of
significant respectively for two tailed test. Here *, **, *** present 10, 5, 1 % levels of significant
respectively for two tailed test. Industry, and year fixed effect are included.

205
Chapter 7: Conclusion
7.1 Introduction
In this thesis, I conduct two studies. The first study examines the effect of accounting
transparency, as measured by the mandatory adoption of IFRS, on stock price informativeness.
To perform the first study, 6,367 firm-year observations from the UK market are analysed using
pooled cross-sectional time series panel regression. The second study investigates the effect of
earnings quality, as measured by accruals quality, on stock price informativeness. To perform the
second study, 5,214 firm-year observations from the UK market are analysed using pooled cross-
sectional time series panel regression.
This chapter provides the conclusions revealed from the thesis. Relevant literature on stock price
synchronicity, accounting transparency, IFRS adoption, and earnings quality was critically
reviewed in chapter 2. The research hypotheses, which developed using the extant theoretical
and empirical literature, were reported in chapter 3. Chapter 4 contains the research philosophy,
research approach, research strategy, and data collection and analysis procedures. The
descriptive statistics and the empirical results for the first study that examine the effect of
mandatory IFRS adoption on stock price informativeness were reported in chapter 5, while
chapter 6 contains the descriptive statistics and the empirical results for the second study that
examine the effect of earnings quality on stock price informativeness. This chapter contains a
summary of the thesis, limitations, and suggestions for future research.
The rest of the chapter is structured as follows: Section 7.2 summarise the main empirical
findings of the thesis; Section 7.3 shows the contribution of the study; Section 7.4 reflects on the
implications of the study; and finally, Section 7.5 presents the limitations and the
recommendations for future research.
7.2 Empirical results conclusions
The empirical findings of the first study that examines the effect of mandatory IFRS adoption on
earnings quality are reported in Chapters 5 and the empirical findings of the second study that
investigate the effect of earnings quality on stock price informativeness are discussed in chapter
206
6. This section is separated into two subsections. Subsection 7.2.1 provides a summary of the
empirical results for examining the effect of mandatory IFRS adoption on stock price
informativeness. Subsection 7.2.2 provides a summary of the empirical results for investigating
the impact of earnings quality on the informativeness of stock prices.
7.2.1 Mandatory IFRS adoption and stock price synchronicity
The aim of the first study is to examine whether improved transparency after mandatory adoption
of IFRS leads to a more informative stock price, by facilitating the incorporation of firm-specific
information into stock price. The first study also aims to examine whether the intensity of
financial analysts’ activities affects the relationships between mandatory IFRS adoption and
stock price synchronicity.
This study is motivated by the recent strands in the literature that examine the informativeness of
stock prices, as measured by stock price synchronicity. Roll (1988) has undertaken one of the
first studies that argue that the magnitude of firm-specific return variation could be used as a
measure of stock price informativeness. Roll’s argument is based on his findings that market and
industry returns explain only a small part of firms return17
. Roll’s suggestion is supported by the
findings of Morck et al. (2000) that the R2 from the market model in developing economies is
higher than that in developed markets. This means stock prices in developing markets tend to
commove more than those in developed countries. Morck et al. (2000) provide evidence that the
lack of investors’ protection rights in emerging market impeded informed trading and increase
the reliance on common information. After these two leading research papers, the stock price
synchronicity literature provides a number of theoretical and empirical evidence that support the
link between firm-specific return variation and the amount of firm-specific information that is
incorporated into the stock price.
Prior research suggests that the financial reporting environment has an important effect on the
informativeness of the stock price. Whereas, Hutton et al. (2009), Haggard et al. (2008), Jin and
Myers (2006), and Veldkamp (2006a) provide evidence that improved transparency leads to a
more firm-specific return variation. As higher transparency improves the availability of firm-
17
Roll (1988) find in his US sample that, market return and industry return can explain only 20%-30% of total stock
return.
207
specific information in the market, which facilitates the incorporation of this information into
stock, prices, leading to more informative stock prices.
The proponents of IFRS adoption argue that it improves transparency by increasing the quantity
and quality of financial disclosure. Consistent with this assertion, previous research that
examines the consequences of IFRS adoption, finds that IFRS adoption has a favourable capital
market effect18
.
However, according to Brüggemann et al. (2013), most of the literature on the consequences of
mandatory IFRS adoption provides transitory evidence with low levels of statistical power
because of the short history of IFRS adoption19
. Also, Brüggemann et al. (2013) suggest that
most of the mandatory IFRS papers provide evidence from cross-country data which makes it
difficult to disentangle the effect of the IFRS effect from other synchronous changes that may
affect the financial reporting. For this reason, they ask for future IFRS research to concentrate on
one trading segment or one country and to examine a longer period following the mandatory
adoption. The current thesis attempt to follow the recommendations of Brüggemann et al. (2013)
and fill this gap by exploring the effect of mandatory IFRS adoption on stock price
informativeness, by examining a sample of 6,367 firm-year observations from UK listed firms,
for the period between 1990 to 2013 (15 years before the adoption and 9 years after the
adoption).
The results of the statistical analysis indicate that mandatory IFRS adoption facilitates the
incorporation of firm-specific information into the stock price for the UK companies. The
correlation analysis shows that IFRS adoption is negatively correlated with stock price
synchronicity. The T-test and Wilcoxon-test suggest that the post-adoption sample has a
significantly lower stock price synchronicity than the pre-adoption sample. The multivariate
panel regression results show that the coefficient of the IFRS adoption variable is negative and
statistically significant, meaning that mandatory IFRS adoption leads to a reduction in stock
price synchronicity. This result supports the theoretical view and empirical results that the higher
transparency that results from the mandatory adoption of IFRS facilitates the incorporation of
18
The literature that examine the consequences of IFRS adoption were discussed extensively in literature review
chapter, section 2.3.5 19
They show that the average mandatory IFRS adoption paper covers two to three (and a maximum of four) post-
adoption years

208
firm-specific information into the stock price; accordingly reducing the synchronous
comovement of the firm’s stock return with market and industry returns.
However, these results contradict the second hypotheses that IFRS adoption will not have a
significant impact on stock price synchronicity for UK firms. In contrast, the results suggest that
even though there are small differences between IFRS and UK local GAAP, IFRS does lead to a
significant improvement in the information environment by reducing the stock price
synchronicity in the UK market.
As a robustness test, the model was re-estimated using a different measure of stock price
synchronicity and the results remain constant. In addition, 2SLS regression was performed to
deal with any endogeneity problems and finds that there are no significant changes in the results.
The IFRS variable remains significantly negative, and the coefficient of inverse mills ratio,
denoted by lambda, is insignificant, suggesting that self-selection bias may not be an issue for
the empirical results of this study.
To examine the effect of analysts’ activities on the relationship between IFRS adoption and stock
price synchronicity the regression is run after including the interaction term between IFRS
adoption and analysts-following variables. The regression results show that the coefficient of
IFRS variable remains significantly negative and the coefficient for the interaction term variable
IFRS*FOLL is significantly positive. The significant negative coefficient for IFRS variable
means that the effect of IFRS adoption on facilitating the incorporation of firm-specific
information into the stock price (synchronicity reducing effect) is unlikely to be dominated by
improved analysts’ activities associated with IFRS adoption.20
The results suggest that within the IFRS adopters the firms that are followed by a higher number
of financial analysts have a higher stock price synchronicity than the IFRS adopters who are
followed by a lower number of financial analysts. Therefore, these results suggest that financial
analysts provide market-wide and industry-wide information, which weaken the synchronicity-
reducing effect of the IFRS adoption for firms that are followed by a higher number of financial
20
The prior research suggests that IFRS adoption lead to increase the number of financial analysts who follow the
firm (Kim & Shi, 2012b; Landsman et al., 2012; Tan et al., 2011), and improve analysts forecast accuracy (Horton et
al., 2013; Houqe et al., 2014).

209
analysts. These results are also found to be robust after using a different measure of stock price
synchronicity.
7.2.2 Earnings quality and stock price synchronicity
With regard to the second study, it aims to investigate whether higher earnings quality, as
measured by accruals quality as estimated using the Modified Jones Model (1995), leads to a
more informative stock price, as measured by the amount of firm-specific information that is
incorporated into the stock price, in relation to market-wide and industry-wide information.
Following the previous research, stock price synchronicity is used as an inverse measure of stock
price informativeness. Roll (1988) is one of the first scholars who noticed that higher firm-
specific return variation could be a measure of the amount of firm-specific information that is
incorporated into the stock price, so it reflects the informativeness of stock price. Roll’s
argument is corroborated by theoretical arguments and empirical researches that provide results
to support the informative interpretations of low stock price synchronicity. For example, the
previous research links firm-specific return variation with more efficient resource allocation
(Ben-Nasr & Alshwer, 2016; Durnev et al., 2004; Wurgler, 2000), and with more transparent
information environment (Haggard et al., 2008; Hutton et al., 2009; Jin & Myers, 2006).21
This study is motivated by the contradicting views in the literature about the net effect of higher
earnings quality on stock price synchronicity. Whereas one view suggests that higher earnings
quality encourages investors to collect and process firm-specific information, whilst the other
view argues that higher earnings quality may reduce investors’ incentives to collect firm-specific
information.
In particular, Kim and Verrecchia (1991) suggest that the disclosure of high quality public
financial information supports the investor’s incentives to collect and process costly firm-
specific private information. Based on this argument one can expect more firm-specific return
variation with higher quality financial disclosure. The previous literature provides empirical
evidence to support this view. Durnev et al. (2004) find that higher earnings quality reduces
information processing costs, so it increases firm-specific return variation. Morck et al. (2000)
21
Section 2.2 in the literature review chapter provides full discussion of stock price synchronicity literature.
210
also provide international evidence of higher firm-specific return variation in countries with
better accounting information.
However, Kim and Verrecchia (2001) have the view that the availability of better and high-
quality accounting numbers may reduce the investor's incentives to collect and process firm-
specific private information. For this reason, one could observe less firm-specific stock price
volatility for firms with higher earnings quality, since more information flows via lower-
frequency accounting releases. Rajgopal and Venkatachalam (2011) support this view by
providing evidence that higher firm-specific return volatility is associated with lower earnings
quality.
To contribute to this debate in the literature, a sample of 5214 firm-year observations was
collected from the UK listed companies for the period from 1994 to 2013, and upon this pooled
time series cross-sectional panel regressions were performed. The panel regression results reveal
that the inverse measure of earnings quality (MJ_model) has a significantly positive coefficient
with stock price synchronicity, suggesting that lower (higher) earnings quality leads to higher
(lower) stock price synchronicity. This result supports the view that higher earnings quality
encourages firms’ investors to collect and process firm-specific information, leading to more
incorporation of firm-specific information into the stock price, thus a more informative stock
price.
As a robustness test, the regressions were run using different measures of stock price
synchronicity, and the results are quantitatively similar to the main regressions. Whereas the
inverse measure of earnings quality (MJ_model) records a significant positive impact on stock
price synchronicity.
An additional robustness test was undertaken, by running the regression using the earnings
quality measure as estimated based on the Jones (1991) model (J_model), instead of the
Modified Jones model (MJ_model). The robustness test regression results are consistent with the
main regression results, where the (J_model) variable records a significant positive impact on
both measures of stock price synchronicity.
Additionally, to deal with any effects of endogeneity being present, the 2SLS regression was
performed. In the first stage, the earnings quality variable was regressed with earnings quality
211
determinants, then the estimated value of earnings quality, from the first stage regression, was
used to calculate the inverse mills ratio, which is included in the second stage regression to
address any self-selection bias problems in the model. The earnings quality variable remains
significantly positive, and the coefficient of inverse mills ratio, denoted by lambda, is
insignificant, suggesting that self-selection bias may not be an issue within the empirical results.
7.3 The contributions of the study
This study contributes to the literature in several ways:
1- This study provides new evidence about the consequences of mandatory IFRS adoption.
Where this study follows the recommendation of prior research for the need for future
research for better assessments of the consequences of mandatory IFRS adoption. For
example, Brüggemann et al. (2013) conduct a review of the papers that examine the
effects of mandatory IFRS adoption and recommend that future research should examine
a longer time period and be concentrated in one operating segment or one country. This
research follows the recommendations of Brüggemann et al. (2013) by investigating the
effect of mandatory IFRS adoption on stock price informativeness, as measured by stock
price non- synchronicity, for the UK firms for the period from 1990 to 2013.
2- This study contributes also to the debate in the existing literature about the effect of
earnings quality on stock price synchronicity. Where the current literature provides mixed
results about the effect of earnings quality on stock price synchronicity.
3- This study also contributes to the stock price synchronicity’s literature, by providing new
evidence that supports the informative interpretations of low stock price synchronicity.
4- This study focuses on mandatory IFRS adoption, and so it differs from Kim and Shi
(2012a) in two ways. First, the effect of mandatory IFRS adoption was examined whilst
Kim and Shi (2012a) examined the effect of voluntary adoption. Including the voluntary
adoption criteria may create sample selection biased problems, and increases the
endogeneity problem since the firm with lower synchronicity may tend to voluntary adopt
IFRS. Second, Kim and Shi (2012a) took their sample from different countries, making it
difficult to control for cross countries differences that may affect financial reporting,

212
whilst this sample is from one country, the UK, where early adoption was not permitted,
which provides an ideal setting to examine the effect of IFRS on synchronicity.
5- To the best of the researcher knowledge, this study is amongst the first studies that
examine the effect of mandatory IFRS adoption and earnings quality on stock price
informativeness for the UK listed firms.
7.4 Implications of the study
This research has several implications:
1- This research is important since there is a debate within the literature about the
consequences of IFRS adoption. By providing new evidence about the consequences of
mandatory IFRS adoption, this research will help the standard setters to evaluate the
consequences of their decision to mandate the adoption of IFRS.
2- The previous research suggests that a more informative stock price leads to efficient
allocations of scarce resources. For these reasons, understanding the factors that improve
the informativeness of the stock price is important for efficient resource allocation, which
in turn, leads to more employment and improves the welfare of the society.
3- According to the previous research, the firms’ managers learn from the stock price about
the quality of their decisions. In addition, some researchers suggest that more informative
stock price leads to more efficient management employment decisions. For these reasons,
improving the informativeness of the stock prices, by understanding the factors that affect
stock price informativeness, will lead to better management decisions making.
7.5 The limitations of the study and suggestions for future research
As with any other social research work, this study is not without limitations, so the results should
not be interpreted without caveats. These limitations provide excellent opportunities to support
future researches engagement in addressing these limitations.
First, after an extensive review of stock price informativeness literature, this research uses stock
price non-synchronicity (firm-specific return variation) to measure the informativeness of the

213
stock price. However, previous research provides other measures of stock price informativeness.
For this reason, future researchers may apply different measures of stock price informativeness
in their studies.
Second, this study uses accruals quality to measure the earnings quality; however, it is important
to mention that the accruals based models do not come without criticisms and may fail to capture
all the aspects of earnings quality. Using different measures of earnings quality can provide more
evidence about the relationship between earnings quality and stock price informativeness.
In addition, this study uses the Modified Joins (1995) and the Jones (1991) models to measure
accruals quality, these models are considered to be amongst the best models for identifying
earnings quality (Dechow et al., 2010), and most of the other current models that compete with
these models have not survived (DeFond, 2010). Future research can extend the current study by
using other measures of accruals quality and examine its effect on stock price synchronicity.
Third, the fact that this study collects its data from one country, the UK, during a particular
period, from 1990 to 2013, may limit the generalisation of the results just to the UK market, even
if it can be applicable to the countries that have similar economic characteristics to the UK.
Because the IFRS have been adopted by about 120 countries around the world, an interesting
piece of future work would be to extend the research to a worldwide sample, including as many
countries as possible.
Fourth, data availability is one of the important limitations of the current study. The study relies
on DataStream, Worldscope, and IBES, to collect the data; however, some firms have missing
data for some variables and so are excluded from the regression. Collecting these variables
manually by referring to the firm’s financial report is somewhat impractical and involves a time-
consuming process, and it is difficult in practice to ensure ratio calculation’s compatibility with
the existing databases, especially with the fact that the annual reports for some firms are
unavailable online. Accordingly, the findings cannot be generalised to cover all industry sectors
in the UK.
Fifth, the databases available to the researcher do not provide access to some control variables
that may have an effect on stock price synchronicity. For example, audit quality, and institutional
investor’s ownership are documented by previous research to have an effect of stock price

214
synchronicity, however, the available database to the researcher do not provide access to this
information. Collecting these variables manually by referring to the firm’s financial report are
impractical and a time-consuming process, especially with the fact that the annual reports for
some firms are unavailable online. For these reasons, these variables have not been included in
the empirical model. Future research with full access to this information may include these
variables in their regression model.
Sixth, this study examines the effect of overall IFRS adoption on the informativeness of stock
prices. Future researches may investigate the effect of a specific standard, or set of standards (for
example, fair value related standards) on the informativeness of stock price. Future research may
also examine the impact of the newly introduce IFRS on the informativeness of stock price.
Seventh, this research control for the effect of the Financial Crises on the stock price
informativeness. However, the magnitude of the Financial Crises’ effect on the stock price
synchronicity may vary between industries. For this reason, future research may investigate
whether the effect of the Financial Crisis on stock price synchronicity is more pronounce in
certain industries than another, and consider the results when controlling for the effect of the
Financial Crises.
Eighth, the methodology of this thesis involved the use of empirical models to statistically test
the hypotheses. However, an alternative research methodology could be a combination of
quantitative and qualitative approach. For example, questionnaires could be sent or interviews
could be conducted with firm’s managers, institutional investors, and financial analysts, asking
them to comment on the effect of mandatory IFRS adoption and earnings quality on stock price
informativeness.

215
References
Ahmed, A. S., Neel, M., & Wang, D. (2013). Does Mandatory Adoption of IFRS Improve Accounting Quality? Preliminary Evidence. Contemporary Accounting Research, 30(4), 1344-1372. doi:10.1111/j.1911-3846.2012.01193.x
Aksu, M. H., & Espahbodi, H. (2012). Impact of IFRS adoption and corporate governance principles on transparency and disclosure: the case of Istanbul stock exchange. Emerging Markets Finance and Trade.
An, H., & Zhang, T. (2013). Stock price synchronicity, crash risk, and institutional investors. Journal of Corporate Finance, 21(0), 1-15. doi:http://dx.doi.org/10.1016/j.jcorpfin.2013.01.001
Armstrong, C. S., Barth, M. E., Jagolinzer, A. D., & Riedl, E. J. (2010). Market Reaction to the Adoption of IFRS in Europe. Accounting Review, 85(1), 31-61.
Athanasakou, V. E., Strong, N. C., & Walker, M. (2009). Earnings management or forecast guidance to meet analyst expectations? Accounting and Business Research, 39(1), 3-35. doi:10.1080/00014788.2009.9663347
Bae, K.-H., Kim, J.-M., & Ni, Y. (2013). Is Firm-specific Return Variation a Measure of Information Efficiency? International Review of Finance, 13(4), 407-445. doi:10.1111/irfi.12016
Ball, R. (2006). International Financial Reporting Standards (IFRS): pros and cons for investors. Accounting & Business Research (Wolters Kluwer UK), 36, 5-27.
Ball, R., Kothari, S. P., & Robin, A. (2000). The effect of international institutional factors on properties of accounting earnings. Journal of Accounting and Economics, 29(1), 1-51. doi:http://dx.doi.org/10.1016/S0165-4101(00)00012-4
Ball, R., & Shivakumar, L. (2005). Earnings quality in UK private firms: comparative loss recognition timeliness. Journal of Accounting and Economics, 39(1), 83-128. doi:http://dx.doi.org/10.1016/j.jacceco.2004.04.001
Ballas, A. A., Skoutela, D., & Tzovas, C. A. (2010). The relevance of IFRS to an emerging market: evidence from Greece. Managerial Finance, 36(11), 931-948. doi:doi:10.1108/03074351011081259
Barth, M. E., Kasznik, R., & McNichols, M. F. (2001). Analyst Coverage and Intangible Assets. Journal of Accounting Research, 39(1), 1-34. doi:10.1111/1475-679X.00001
Barth, M. E., Landsman, W. R., & Lang, M. H. (2008). International Accounting Standards and Accounting Quality. Journal of Accounting Research, 46(3), 467-498. doi:10.1111/j.1475-679X.2008.00287.x
Ben-Nasr, H., & Alshwer, A. A. (2016). Does Stock Price Informativeness Affect Labor Investment Efficiency? Journal of Corporate Finance. doi:http://dx.doi.org/10.1016/j.jcorpfin.2016.01.012
Ben-Nasr, H., & Cosset, J.-C. (2014). State Ownership, Political Institutions, and Stock Price Informativeness: Evidence from Privatization. Journal of Corporate Finance, 29(0), 179-199. doi:http://dx.doi.org/10.1016/j.jcorpfin.2014.10.004
Bennis, W. G., Goleman, D., & O'Toole, J. (2008). Transparency : How Leaders Create a Culture of Candor. San Francisco, CA: Jossey-Bass.
Beuselinck, C., Joos, P., Khurana, I. K., & Van der Meulen, S. (2010). Mandatory IFRS reporting and stock price informativeness. Tilburg University.
Bhattacharya, N., Desai, H., & Venkataraman, K. (2013). Does Earnings Quality Affect Information Asymmetry? Evidence from Trading Costs*. Contemporary Accounting Research, 30(2), 482-516. doi:10.1111/j.1911-3846.2012.01161.x
Bhattacharya, N., Ecker, F., Olsson, P. M., & Schipper, K. (2012). Direct and Mediated Associations among Earnings Quality, Information Asymmetry, and the Cost of Equity. Accounting Review, 87(2), 449-482. doi:10.2308/accr-10200

216
Bhattacharya, U., Daouk, H., & Welker, M. (2003). The World Price of Earnings Opacity. The accounting review, 78(3), 641-678. doi:10.2308/accr.2003.78.3.641
Bhattacherjee, A. (2012). Social science research: Principles, methods, and practices (Second Edition ed.): Florida, USA: AnolBhattacherjee.
Bhushan, R. (1989). Firm characteristics and analyst following. Journal of Accounting and Economics, 11(2–3), 255-274. doi:http://dx.doi.org/10.1016/0165-4101(89)90008-6
Biddle, G. C., & Hilary, G. (2006). Accounting Quality and Firm‐Level Capital Investment. The accounting review, 81(5), 963-982. doi:10.2308/accr.2006.81.5.963
Biddle, G. C., Hilary, G., & Verdi, R. S. (2009). How does financial reporting quality relate to investment efficiency? Journal of Accounting and Economics, 48(2–3), 112-131. doi:http://dx.doi.org/10.1016/j.jacceco.2009.09.001
Biddle, G. C., Seow, G. S., & Siegel, A. F. (1995). Relative versus Incremental Information Content. Contemporary Accounting Research, 12(1), 1-23.
Bissessur, S., & Hodgson, A. (2012). Stock market synchronicity - an alternative approach to assessing the information impact of Australian IFRS. Accounting & Finance, 52(1), 187-212. doi:10.1111/j.1467-629X.2010.00388.x
Blaikie, N. (2007). Approaches to social enquiry: Advancing knowledge ( Second Edition ed.). Cambridge: Polity.
Boatright, J. R. (2008). Ethics in finance (2nd ed.): Malden, Mass. ; Oxford : Blackwell Boubaker, S., Mansali, H., & Rjiba, H. (2014). Large controlling shareholders and stock price
synchronicity. Journal of Banking & Finance, 40(0), 80-96. doi:http://dx.doi.org/10.1016/j.jbankfin.2013.11.022
Brochet, F., Jagolinzer, A. D., & Riedl, E. J. (2013). Mandatory IFRS Adoption and Financial Statement Comparability. Contemporary Accounting Research/Recherche Comptable Contemporaine, 30(4), 1373-1400. doi:http://onlinelibrary.wiley.com/journal/10.1111/%28ISSN%291911-3846/issues
Brooks, C. (2014). Introductory econometrics for finance (3rd ed.): Cambridge university press. Brown, P. (2011). International Financial Reporting Standards: what are the benefits? Accounting and
Business Research, 41(3), 269-285. doi:10.1080/00014788.2011.569054 Brüggemann, U., Hitz, J.-M., & Sellhorn, T. (2013). Intended and Unintended Consequences of
Mandatory IFRS Adoption: A Review of Extant Evidence and Suggestions for Future Research. European Accounting Review, 22(1), 1-37. doi:10.1080/09638180.2012.718487
Bryman, A., & Bell, E. (2011). Business research methods 3e (3rd ed.): Oxford university press. Burell, G., & Morgan, G. (1979). Sociological paradigms and organisational analysis. London:
Heninemann. Bushman, R. M., Piotroski, J. D., & Smith, A. J. (2004). What Determines Corporate Transparency?
Journal of Accounting Research, 42(2), 207-252. doi:10.1111/j.1475-679X.2004.00136.x Bushman, R. M., Piotroski, J. D., & Smith, A. J. (2011). Capital Allocation and Timely Accounting
Recognition of Economic Losses. Journal of Business Finance & Accounting, 38(1-2), 1-33. doi:10.1111/j.1468-5957.2010.02231.x
Bushman, R. M., & Smith, A. J. (2003). Transparency, Financial Accounting Information, and Corporate Governance. Federal Reserve Bank of New York Economic Policy Review, 9(1), 65-87. doi:http://www.ny.frb.org/research/epr/
Byard, D., Li, Y., & Yu, Y. (2011). The Effect of Mandatory IFRS Adoption on Financial Analysts' Information Environment. Journal of Accounting Research, 49(1), 69-96. doi:http://onlinelibrary.wiley.com/journal/10.1111/%28ISSN%291475-679X/issues
Chan, C. Y., Lo, H.-C., & Yang, M. J. (2016). The revision frequency of earnings forecasts and firm characteristics. The North American Journal of Economics and Finance, 35, 116-132. doi:http://dx.doi.org/10.1016/j.najef.2015.11.002

217
Chan, K., & Hameed, A. (2006). Stock price synchronicity and analyst coverage in emerging markets. Journal of Financial Economics, 80(1), 115-147.
Chang, E. C., & Luo, Y. (2010). R-Squared, Noise, and Stock Returns. Available at SSRN: http://dx.doi.org/10.2139/ssrn.1572508.
Chen, F., Hope, O.-K., Li, Q., & Wang, X. (2011). Financial Reporting Quality and Investment Efficiency of Private Firms in Emerging Markets. The accounting review, 86(4), 1255-1288. doi:10.2308/accr-10040
Chen, Q., Goldstein, I., & Jiang, W. (2007). Price Informativeness and Investment Sensitivity to Stock Price. Review of Financial Studies, 20(3), 619-650. doi:http://rfs.oxfordjournals.org/content/by/year
Chen, S., Gul, F. A., & Zhou, J. (2013). Do Analysts Incorporate Market/Industry-Wide or Firm-Specific Information into Stock Price: Some Evidence on the Role of Earnings Quality. Available at SSRN:http://dx.doi.org/10.2139/ssrn.2360901.
Cheng, F. C., Gul, F. A., & Srinidhi, B. (2012). Stock Price Informativeness, Analyst Coverage and Economic Growth: Evidence from Emerging Markets. Paper presented at the 25th Australasian Finance and Banking Conference.
Cheng, L. T. W., Leung, T. Y., & Yu, W. (2014). Information arrival, changes in R-square and pricing asymmetry of corporate news. International Review of Economics & Finance, 33, 67-81. doi:http://dx.doi.org/10.1016/j.iref.2014.03.004
Cheng, M., Dhaliwal, D., & Zhang, Y. (2013). Does investment efficiency improve after the disclosure of material weaknesses in internal control over financial reporting? Journal of Accounting and Economics, 56(1), 1-18. doi:http://dx.doi.org/10.1016/j.jacceco.2013.03.001
Christensen, H. B., Hail, L., & Leuz, C. (2011). Capital-market effects of securities regulation: Hysteresis, implementation, and enforcement. Retrieved from
Chun, H., Kim, J.-W., Morck, R., & Yeung, B. (2008). Creative destruction and firm-specific performance heterogeneity. Journal of Financial Economics, 89(1), 109-135. doi:http://dx.doi.org/10.1016/j.jfineco.2007.06.005
Clarkson, P., Hanna, J. D., Richardson, G. D., & Thompson, R. (2011). The impact of IFRS adoption on the value relevance of book value and earnings. Journal of Contemporary Accounting & Economics, 7(1), 1-17. doi:http://dx.doi.org/10.1016/j.jcae.2011.03.001
Dasgupta, S., Gan, J., & Gao, N. (2010). Transparency, Price Informativeness, and Stock Return Synchronicity: Theory and Evidence. Journal of Financial and Quantitative Analysis, 45(05), 1189-1220. doi:doi:10.1017/S0022109010000505
Daske, H. (2006). Economic Benefits of Adopting IFRS or US-GAAP – Have the Expected Cost of Equity Capital Really Decreased? Journal of Business Finance & Accounting, 33(3-4), 329-373. doi:10.1111/j.1468-5957.2006.00611.x
Daske, H., & Gebhardt, G. (2006). International financial reporting standards and experts’ perceptions of disclosure quality. Abacus, 42(3-4), 461-498. doi:10.1111/j.1467-6281.2006.00211.x
Daske, H., Hail, L., Leuz, C., & Verdi, R. (2008). Mandatory IFRS Reporting around the World: Early Evidence on the Economic Consequences. Journal of Accounting Research, 46(5), 1085-1142. doi:10.1111/j.1475-679X.2008.00306.x
Daske, H., Hail, L., Leuz, C., & Verdi, R. (2013). Adopting a Label: Heterogeneity in the Economic Consequences around IAS/IFRS Adoptions. Journal of Accounting Research, 51(3), 495-547. doi:http://onlinelibrary.wiley.com/journal/10.1111/%28ISSN%291475-679X/issues
De Cesari, A., & Huang-Meier, W. (2015). Dividend changes and stock price informativeness. Journal of Corporate Finance, 35, 1-17. doi:http://dx.doi.org/10.1016/j.jcorpfin.2015.08.004
Dechow, P., & Dichev, I. D. (2002). The Quality of Accruals and Earnings: The Role of Accrual Estimation Errors. The accounting review, 77(s-1), 35-59. doi:10.2308/accr.2002.77.s-1.35

218
Dechow, P., Ge, W., & Schrand, C. (2010). Understanding earnings quality: A review of the proxies, their determinants and their consequences. Journal of Accounting and Economics, 50(2–3), 344-401. doi:http://dx.doi.org/10.1016/j.jacceco.2010.09.001
Dechow, P. M., Sloan, R. G., & Sweeney, A. P. (1995). Detecting Earnings Management. The accounting review, 70(2), 193-225. doi:10.2307/248303
DeFond, M., Hu, X., Hung, M., & Li, S. (2011). The impact of mandatory IFRS adoption on foreign mutual fund ownership: The role of comparability. Journal of Accounting and Economics, 51(3), 240-258. doi:http://dx.doi.org/10.1016/j.jacceco.2011.02.001
DeFond, M. L. (2010). Earnings quality research: advances, challenges and future research. Journal of Accounting and Economics, 50(2), 402-409.
DeFond, M. L., Hung, M., Li, S., & Li, Y. (2015). Does Mandatory IFRS Adoption Affect Crash Risk? The accounting review, 90(1), 265-299. doi:doi:10.2308/accr-50859
Delloitte. (2015). IASPLUS. Retrieved from http://www.iasplus.com/en/resources/ifrsf/history/resource25
Demerjian, P. R., Lev, B., Lewis, M. F., & McVay, S. E. (2012). Managerial Ability and Earnings Quality. The accounting review, 88(2), 463-498. doi:10.2308/accr-50318
Devalle, A., Onali, E., & Magarini, R. (2010). Assessing the Value Relevance of Accounting Data After the Introduction of IFRS in Europe. Journal of International Financial Management & Accounting, 21(2), 85-119. doi:10.1111/j.1467-646X.2010.01037.x
Dewally, M., & Shao, Y. (2013). Financial derivatives, opacity, and crash risk: Evidence from large US banks. Journal of Financial Stability, 9(4), 565-577. doi:http://dx.doi.org/10.1016/j.jfs.2012.11.001
Dichev, I. D., Graham, J. R., Harvey, C. R., & Rajgopal, S. (2013). Earnings quality: Evidence from the field. Journal of Accounting and Economics, 56(2–3, Supplement 1), 1-33. doi:http://dx.doi.org/10.1016/j.jacceco.2013.05.004
Ding, R., Hou, W., Kuo, J.-M., & Lee, E. (2013). Fund ownership and stock price informativeness of Chinese listed firms. Journal of Multinational Financial Management, 23(3), 166-185. doi:http://dx.doi.org/10.1016/j.mulfin.2013.03.003
Doukakis, L. C. (2014). The effect of mandatory IFRS adoption on real and accrual-based earnings management activities. Journal of Accounting and Public Policy, 33(6), 551-572. doi:http://dx.doi.org/10.1016/j.jaccpubpol.2014.08.006
Doukakis, L. C. ( 2010). The persistence of earnings and earnings components after the adoption of IFRS. Managerial Finance, 36(11), 969 - 980. doi:10.1108/03074351011081286
Durnev, A., Morck, R., & Yeung, B. (2004). Value-Enhancing Capital Budgeting and Firm-specific Stock Return Variation. The Journal of Finance, 59(1), 65-105. doi:10.1111/j.1540-6261.2004.00627.x
Durnev, A., Morck, R., Yeung, B., & Zarowin, P. (2003). Does Greater Firm-Specific Return Variation Mean More or Less Informed Stock Pricing? Journal of Accounting Research, 41(5), 797-836. doi:10.1046/j.1475-679X.2003.00124.x
Easterby-Smith, M., Thorpe, R., & Jackson, P. R. (2012). Management research: Sage. Emamgholipour, M., Bagheri, S. M. B., Mansourinia, E., & Arabi, A. M. (2013). A study on relationship
between institutional investors and earnings management: Evidence from the Tehran Stock Exchange. Management Science Letters, 3(4).
Ernst, & Young. (2006, 2006). IFRS: Observations on the implementation of IFRS. Ernst & Young Publications. Retrieved from http://www2.eycom.ch/publications/items/ifrs/single/200609_observations_on_ifrs/200609_EY_Observations_on_IFRS.pdf

219
Ernstberger, J., Stich, M., & Vogler, O. (2011). Economic Consequences of Accounting Enforcement Reforms: The Case of Germany. European Accounting Review, 21(2), 217-251. doi:10.1080/09638180.2011.628096
Eun, C. S., Wang, L., & Xiao, S. C. (2015). Culture and R2. Journal of Financial Economics, 115(2), 283-303. doi:http://dx.doi.org/10.1016/j.jfineco.2014.09.003
European Parliament, C. o. t. E. U. (2008). Regulation (EC) No 1606/2002 of the European Parliament and of the Council of 19 July 2002 on the application of international accounting standards Retrieved from http://eur-lex.europa.eu/legal-content/EN/ALL/?uri=CELEX:02002R1606-20080410
Fama, E. F. (1970). Efficient Capital Markets: A Review of Theory and Empirical Work. Journal of Finance, 25(2), 383-417. doi:http://onlinelibrary.wiley.com/journal/10.1111/%28ISSN%291540-6261/issues
Fang, V. W., Huang, A. H., & Karpoff, J. M. (2016). Short Selling and Earnings Management: A Controlled Experiment. The Journal of Finance, 71(3), 1251-1294. doi:10.1111/jofi.12369
Fernandes, N., & Ferreira, M. A. (2008). Does international cross-listing improve the information environment. Journal of Financial Economics, 88(2), 216-244.
Ferreira, M. A., & Laux, P. A. (2007). Corporate Governance, Idiosyncratic Risk, and Information Flow. The Journal of Finance, 62(2), 951-989. doi:10.1111/j.1540-6261.2007.01228.x
Finningham, G. (2010). The impact of the introduction of IFRS on corporate annual report and accounts in the UK. (PhD), Dundee University.
Fitzmaurice, G. (2000). The meaning and interpretation of interaction. Nutrition, 16(4), 313-314. doi:http://dx.doi.org/10.1016/S0899-9007(99)00293-2
Flahive, A., Taniar, D., Rahayu, J., & Apduhan, B. (2011). Ontology expansion: Appending with extracted sub-ontology. Logic Journal Of The Igpl [P], 19(5), 618-647.
Fleetwood, S. (2005). Ontology in organization and management studies: A critical realist perspective. Organization, 12(2), 197-222.
Francis, B., Hasan, I., Song, L., & Yeung, B. (2015). What determines bank-specific variations in bank stock returns? Global evidence. Journal of Financial Intermediation, 24(3), 312-324. doi:http://dx.doi.org/10.1016/j.jfi.2014.06.002
Francis, J., Huang, S., Khurana, I. K., & Pereira, R. (2009). Does Corporate Transparency Contribute to Efficient Resource Allocation? Journal of Accounting Research, 47(4), 943-989. doi:10.1111/j.1475-679X.2009.00340.x
Francis, J., LaFond, R., Olsson, P., & Schipper, K. (2005). The market pricing of accruals quality. Journal of Accounting and Economics, 39(2), 295-327. doi:http://dx.doi.org/10.1016/j.jacceco.2004.06.003
Francis, J., LaFond, R., Olsson, P. M., & Schipper, K. (2004). Costs of equity and earnings attributes. The accounting review, 79(4), 967-1010.
Francis, J., Nanda, D., & Olsson, P. (2008). Voluntary Disclosure, Earnings Quality, and Cost of Capital. Journal of Accounting Research, 46(1), 53-99. doi:http://onlinelibrary.wiley.com/journal/10.1111/%28ISSN%291475-679X/issues
Francis, J., Schipper, K., & Vincent, L. (2003). The Relative and Incremental Explanatory Power of Earnings and Alternative (to Earnings) Performance Measures for Returns. Contemporary Accounting Research/Recherche Comptable Contemporaine, 20(1), 121-164. doi:http://onlinelibrary.wiley.com/journal/10.1111/%28ISSN%291911-3846
Francis, J. R., & Wang, D. (2008). The Joint Effect of Investor Protection and Big 4 Audits on Earnings Quality around the World. Contemporary Accounting Research/Recherche Comptable Contemporaine, 25(1), 157-191. doi:http://onlinelibrary.wiley.com/journal/10.1111/%28ISSN%291911-3846

220
French, K. R., & Roll, R. (1986). Stock return variances. Journal of Financial Economics, 17(1), 5-26. doi:http://dx.doi.org/10.1016/0304-405X(86)90004-8
Gelb, D., & Zarowin, P. (2002). Corporate Disclosure Policy and the Informativeness of Stock Prices. Review of Accounting Studies, 7(1), 33-52. doi:10.1023/a:1017927530007
Gelfand, M. J., Raver, J. L., Nishii, L., Leslie, L. M., Lun, J., Lim, B. C., . . . Yamaguchi, S. (2011). Differences Between Tight and Loose Cultures: A 33-Nation Study. Science, 332(6033), 1100-1104. doi:10.1126/science.1197754
Gill, j., & Johnson, P. (2010). Research methods for Managers (4 ed.). London: Sage. Gillberto Loureiro, & Taboada, A. G. (2012). The impact of IFRS adoption on stock price informativness.
European Financial Management Association, 2012 Annual meeting, June 2012, Barcelona, Spain.
Givoly, D., Hayn, C. K., & Katz, S. P. (2010). Does Public Ownership of Equity Improve Earnings Quality? Accounting Review, 85(1), 195-225.
Gordon, L. A., Loeb, M. P., & Zhu, W. (2012). The impact of IFRS adoption on foreign direct investment. Journal of Accounting and Public Policy, 31(4), 374-398. doi:http://dx.doi.org/10.1016/j.jaccpubpol.2012.06.001
Grossman, S. J., & Stiglitz, J. E. (1980). On the Impossibility of Informationally Efficient Markets. American Economic Review, 70(3), 393-408. doi:http://www.aeaweb.org/aer/
Gujarati, D. N., & Porter, D. (2009). Basic Econometrics Mc Graw-Hill International Edition. Gul, F. A., Cheng, L. T. W., & Leung, T. Y. (2011). Perks and the informativeness of stock prices in the
Chinese market. Journal of Corporate Finance, 17(5), 1410-1429. doi:http://dx.doi.org/10.1016/j.jcorpfin.2011.07.005
Gul, F. A., Fung, S. Y. K., & Jaggi, B. (2009). Earnings quality: Some evidence on the role of auditor tenure and auditors’ industry expertise. Journal of Accounting and Economics, 47(3), 265-287. doi:http://dx.doi.org/10.1016/j.jacceco.2009.03.001
Gul, F. A., Kim, J.-B., & Qiu, A. A. (2010). Ownership concentration, foreign shareholding, audit quality, and stock price synchronicity: Evidence from China. Journal of Financial Economics, 95(3), 425-442. doi:http://dx.doi.org/10.1016/j.jfineco.2009.11.005
Gul, F. A., Srinidhi, B., & Ng, A. C. (2011). Does board gender diversity improve the informativeness of stock prices? Journal of Accounting and Economics, 51(3), 314-338. doi:http://dx.doi.org/10.1016/j.jacceco.2011.01.005
Guy, W., Kothari, P., & Watts, R. (1996). A Market-Based Evaluation of Discretionary Accruals Models. Journal of Accounting Research, 34, 83-105.
Haggard, K. S., Martin, X., & Pereira, R. (2008). Does Voluntary Disclosure Improve Stock Price Informativeness? Financial Management, 37(4), 747-768. doi:10.1111/j.1755-053X.2008.00033.x
Hair, J. F., Black, W. C., Babin, B. J., Anderson, R. E., & Tatham, R. L. (2010). Multivariate Data Analysis (7th ed.): Pearson.
Hakim, C. (2000). Research Design: Successful Designs for Social and Economic Research (2 ed.). London: Routledge.
Hasan, I., Song, L., & Wachtel, P. (2014). Institutional development and stock price synchronicity: Evidence from China. Journal of Comparative Economics, 42(1), 92-108. doi:http://dx.doi.org/10.1016/j.jce.2013.07.006
Haxhi, I., van Ees, H., & Sorge, A. (2013). A Political Perspective on Business Elites and Institutional Embeddedness in the UK Code-Issuing Process. Corporate Governance: An International Review, 21(6), 535-546. doi:10.1111/corg.12036

221
He, W., Li, D., Shen, J., & Zhang, B. (2013). Large foreign ownership and stock price informativeness around the world. Journal of International Money and Finance, 36(0), 211-230. doi:http://dx.doi.org/10.1016/j.jimonfin.2013.04.002
Healey, J. (2014). Statistics: A tool for social research (10th ed.): Cengage Learning. Heckman, J. J. (1979). Sample Selection Bias as a Specification Error. Econometrica, 47(1), 153-161.
doi:10.2307/1912352 Hermalin, B. E., & Weisbach, M. S. (2012). Information Disclosure and Corporate Governance. The
Journal of Finance, 67(1), 195-233. doi:10.1111/j.1540-6261.2011.01710.x Heron, J. (1996). Co-operative inquiry: Research into the human condition. London: Sage. Hofstede, G. (2001). Culture's consequences: Comparing values, behaviors, institutions and organizations
across nations (Second ed.): Sage. Horton, J., Serafeim, G., & Serafeim, I. (2013). Does Mandatory IFRS Adoption Improve the Information
Environment?*. Contemporary Accounting Research, 30(1), 388-423. doi:10.1111/j.1911-3846.2012.01159.x
Houqe, M. N., Easton, S., & van Zijl, T. (2014). Does mandatory IFRS adoption improve information quality in low investor protection countries? Journal of International Accounting, Auditing and Taxation, 23(2), 87-97. doi:http://dx.doi.org/10.1016/j.intaccaudtax.2014.06.002
Houqe, M. N., van Zijl, T., Dunstan, K., & Karim, A. K. M. W. (2012). The Effect of IFRS Adoption and Investor Protection on Earnings Quality Around the World. The International Journal of Accounting, 47(3), 333-355. doi:http://dx.doi.org/10.1016/j.intacc.2012.07.003
Hribar, P., & Collins, D. W. (2002). Errors in Estimating Accruals: Implications for Empirical Research. Journal of Accounting Research, 40(1), 105-134. doi:10.1111/1475-679X.00041
Humphrey, C., Loft, A., & Woods, M. (2009). The global audit profession and the international financial architecture: Understanding regulatory relationships at a time of financial crisis. Accounting, Organizations and Society, 34(6–7), 810-825. doi:http://dx.doi.org/10.1016/j.aos.2009.06.003
Hutton, A. P., Marcus, A. J., & Tehranian, H. (2009). Opaque financial reports, R2, and crash risk. Journal of Financial Economics, 94(1), 67-86. doi:http://dx.doi.org/10.1016/j.jfineco.2008.10.003
Iatridis, G. (2012). Hedging and earnings management in the light of IFRS implementation: Evidence from the UK stock market. The British Accounting Review, 44(1), 21-35. doi:http://dx.doi.org/10.1016/j.bar.2011.12.002
Iatridis, G. E. (2012). Voluntary IFRS disclosures: evidence from the transition from UK GAAP to IFRSs. Managerial Auditing Journal, 27(6), 573-597.
IFRS.ORG. (2015). Who we are and what we do. Retrieved from http://www.ifrs.org/The-organisation/Documents/2015/Who-We-Are-January-2015.pdf
Ismail, W. A. W., Kamarudin, K. A., Van Zijl, T., & Dunstan, K. (2013). Earnings quality and the adoption of IFRS-based accounting standards: Evidence from an emerging market. Asian Review of Accounting, 21(1), 53-73.
Jiang, L., Kim, J.-B., & Pang, L. (2014). The influence of ownership structure, analyst following and institutional infrastructure on stock price informativeness: international evidence. Accounting & Finance, 54(3), 885-919. doi:10.1111/acfi.12026
Jiang, W., Lee, P., & Anandarajan, A. (2008). The association between corporate governance and earnings quality: Further evidence using the GOV-Score. Advances in Accounting, 24(2), 191-201. doi:http://dx.doi.org/10.1016/j.adiac.2008.08.011
Jin, L., & Myers, S. C. (2006). R2 around the world: New theory and new tests. Journal of Financial Economics, 79(2), 257-292. doi:http://dx.doi.org/10.1016/j.jfineco.2004.11.003
Jo, H., & Kim, Y. (2007). Disclosure frequency and earnings management. Journal of Financial Economics, 84(2), 561-590. doi:http://dx.doi.org/10.1016/j.jfineco.2006.03.007

222
Jones, J. J. (1991). Earnings Management during Import Relief Investigations. Journal of Accounting Research, 29(2), 193-228. doi:http://onlinelibrary.wiley.com/journal/10.1111/%28ISSN%291475-679X/issues
Kang, M., & Nam, K. (2015). Informed Trade and Idiosyncratic Return Variation. Review of Quantitative Finance and Accounting, 44(3), 551-572. doi:http://link.springer.com/journal/volumesAndIssues/11156
Kelemen, M. L., & Rumens, N. (2008). An introduction to critical management research. London: Sage. Ketokivi, M., & Mantere, S. (2010). TWO STRATEGIES FOR INDUCTIVE REASONING IN ORGANIZATIONAL
RESEARCH. Academy of Management Review, 35(2), 315-333. doi:10.5465/AMR.2010.48463336 Kim, J.-B., & Li, T. (2014). Multinationals' Offshore Operations, Tax Avoidance, and Firm-Specific
Information Flows: International Evidence. Journal of International Financial Management & Accounting, 25(1), 38-89. doi:10.1111/jifm.12013
Kim, J.-B., & Shi, H. (2012a). IFRS Reporting, Firm-Specific Information Flows, and Institutional Environments: International Evidence. Review of Accounting Studies, 17(3), 474-517. doi:http://link.springer.com/journal/volumesAndIssues/11142
Kim, J.-B., & Shi, H. (2012b). Voluntary IFRS Adoption, Analyst Coverage, and Information Quality: International Evidence. Journal of International Accounting Research, 11(1), 45-76. doi:10.2308/jiar-10216
Kim, J.-B., Shi, H., & Zhou, J. (2014). International Financial Reporting Standards, Institutional Infrastructures, and Implied Cost of Equity Capital around the World. Review of Quantitative Finance and Accounting, 42(3), 469-507. doi:http://link.springer.com/journal/volumesAndIssues/11156
Kim, J.-B., & Yi, C. H. (2015). Foreign versus domestic institutional investors in emerging markets: Who contributes more to firm-specific information flow? China Journal of Accounting Research, 8(1), 1-23. doi:http://dx.doi.org/10.1016/j.cjar.2015.01.001
Kim, J.-B., Zhang, H., Li, L., & Tian, G. (2014). Press freedom, externally-generated transparency, and stock price informativeness: International evidence. Journal of Banking & Finance, 46(0), 299-310. doi:http://dx.doi.org/10.1016/j.jbankfin.2014.05.023
Kim, O., & Verrecchia, R. E. (1991). Trading Volume and Price Reactions to Public Announcements. Journal of Accounting Research, 29(2), 302-321. doi:http://onlinelibrary.wiley.com/journal/10.1111/%28ISSN%291475-679X/issues
Kim, O., & Verrecchia, R. E. (2001). The Relation among Disclosure, Returns, and Trading Volume Information. Accounting Review, 76(4), 633.
Koop, G. (2006). Analysis of financial data: John Wiley & Sons Oxford. Kothari, S. P., Leone, A. J., & Wasley, C. E. (2005). Performance matched discretionary accrual measures.
Journal of Accounting and Economics, 39(1), 163-197. doi:http://dx.doi.org/10.1016/j.jacceco.2004.11.002
Kvaal, E., & Nobes, C. (2012). IFRS Policy Changes and the Continuation of National Patterns of IFRS Practice. European Accounting Review, 21(2), 343-371. doi:10.1080/09638180.2011.611236
Lambert, R. A., Leuz, C., & Verrecchia, R. E. (2012). Information Asymmetry, Information Precision, and the Cost of Capital. Review of Finance, 16(1), 1-29. doi:http://rof.oxfordjournals.org/content/by/year
Landsman, W. R., Maydew, E. L., & Thornock, J. R. (2012). The information content of annual earnings announcements and mandatory adoption of IFRS. Journal of Accounting and Economics, 53(1–2), 34-54. doi:http://dx.doi.org/10.1016/j.jacceco.2011.04.002
Lara, J. M. G., Osma, B. G., & Noguer, B. G. d. A. (2006). Effects of database choice on international accounting research. Abacus, 42(3-4), 426-454. doi:10.1111/j.1467-6281.2006.00209.x

223
Larcker, D. F., & Rusticus, T. O. (2010). On the use of instrumental variables in accounting research. Journal of Accounting and Economics, 49(3), 186-205. doi:http://dx.doi.org/10.1016/j.jacceco.2009.11.004
Leamer, E. E. (1985). Vector autoregressions for causal inference? Carnegie-Rochester Conference Series on Public Policy, 22(0), 255-304. doi:http://dx.doi.org/10.1016/0167-2231(85)90035-1
Lee, D. W., & Liu, M. H. (2011). Does more information in stock price lead to greater or smaller idiosyncratic return volatility? Journal of Banking & Finance, 35(6), 1563-1580.
Lehavy, R., Li, F., & Merkley, K. (2011). The Effect of Annual Report Readability on Analyst Following and the Properties of Their Earnings Forecasts. The accounting review, 86(3), 1087-1115. doi:doi:10.2308/accr.00000043
Lennox, C. S., Francis, J. R., & Wang, Z. (2012). Selection Models in Accounting Research. The accounting review, 87(2), 589-616. doi:doi:10.2308/accr-10195
Levine, R. (1997). Financial Development and Economic Growth: Views and Agenda. Journal of Economic Literature, 35(2), 688-726. doi:http://www.aeaweb.org/jel/index.php
Li, F. (2008). Annual report readability, current earnings, and earnings persistence. Journal of Accounting and Economics, 45(2–3), 221-247. doi:http://dx.doi.org/10.1016/j.jacceco.2008.02.003
Li, S. (2010). Does Mandatory Adoption of International Financial Reporting Standards in the European Union Reduce the Cost of Equity Capital? The accounting review, 85(2), 607-636. doi:10.2308/accr.2010.85.2.607
Li, X., & Yang, H. I. (2016). Mandatory Financial Reporting and Voluntary Disclosure: The Effect of Mandatory IFRS Adoption on Management Forecasts. The accounting review, 91(3), 933-953. doi:doi:10.2308/accr-51296
Lin, K. J., Karim, K., & Carter, C. (2014). Stock Price Informativeness and Idiosyncratic Return Volatility in Emerging Markets: Evidence from China. Review of Pacific Basin Financial Markets and Policies, 17(4), 1-28. doi:http://www.worldscientific.com/loi/rpbfmp
Liu, G., & Sun, J. (2015). Did the Mandatory Adoption of IFRS Affect the Earnings Quality of Canadian Firms? Accounting Perspectives, 14(3), 250-275. doi:10.1111/1911-3838.12047
Liu, J., Nissim, D., & Thomas, J. (2002). Equity Valuation Using Multiples. Journal of Accounting Research, 40(1), 135-172. doi:http://onlinelibrary.wiley.com/journal/10.1111/%28ISSN%291475-679X/issues
Lobo, G. J., Song, M., & Stanford, M. (2012). Accruals quality and analyst coverage. Journal of Banking & Finance, 36(2), 497-508. doi:http://dx.doi.org/10.1016/j.jbankfin.2011.08.006
Marhfor, A., M'Zali, B., Cosset, J.-C., & Charest, G. (2013). Stock price informativeness and analyst coverage. Canadian Journal of Administrative Sciences / Revue Canadienne des Sciences de l'Administration, 30(3), 173-188. doi:10.1002/cjas.1253
McNichols, M. F. (2002). Discussion of the quality of accruals and earnings: The role of accrual estimation errors. The accounting review, 77(s-1), 61-69.
Meyer, B. D. (1995). Natural and Quasi-Experiments in Economics. Journal of Business & Economic Statistics, 13(2), 151-161. doi:10.2307/1392369
Mohammady, A. (2011). A study of the relationship between the qualitative characteristics of accounting earnings and stock return. Kingston University.
Morck, R., Yeung, B., & Yu, W. (2000). The information content of stock markets: why do emerging markets have synchronous stock price movements? Journal of Financial Economics, 58(1–2), 215-260. doi:http://dx.doi.org/10.1016/S0304-405X(00)00071-4
Morten Helbaek, Snorre Lindset, & McLellan, B. (2010). Corporate finance: Maidenhead : Open University Press.
Moscariello, N., Skerratt, L., & Pizzo, M. (2014). Mandatory IFRS adoption and the cost of debt in Italy and UK. Accounting and Business Research, 44(1), 63-82. doi:10.1080/00014788.2013.867402

224
Mouselli, S., Jaafar, A., & Goddard, J. (2013). Accruals quality, stock returns and asset pricing: Evidence from the UK. International Review of Financial Analysis, 30, 203-213. doi:http://dx.doi.org/10.1016/j.irfa.2013.08.006
Mouselli, S., Jaafar, A., & Hussainey, K. (2012). Accruals quality vis-à-vis disclosure quality: Substitutes or complements? The British Accounting Review, 44(1), 36-46. doi:http://dx.doi.org/10.1016/j.bar.2011.12.004
Nelson, M. W., & Skinner, D. J. (2013). How should we think about earnings quality? A discussion of “Earnings quality: Evidence from the field”. Journal of Accounting and Economics, 56(2–3, Supplement 1), 34-41. doi:http://dx.doi.org/10.1016/j.jacceco.2013.10.003
Niglas, K. (2010). The multidimensional model of research methodology: an integrated set of continua. Handbook of mixed methods in social and behavioral research, 215-236.
Norusis, M. J. (2011). SPSS 19.0 Guide to Data Analysis. Englewood Cliffs: Prentice Hall. Olivero, M. P., Li, Y., & Jeon, B. N. (2011). Competition in banking and the lending channel: Evidence
from bank-level data in Asia and Latin America. Journal of Banking & Finance, 35(3), 560-571. doi:http://dx.doi.org/10.1016/j.jbankfin.2010.08.004
Oswald, D. R., & Zarowin, P. (2007). Capitalization of R&D and the Informativeness of Stock Prices. European Accounting Review, 16(4), 703-726. doi:10.1080/09638180701706815
Paananen, M. (2008). The IFRS adoption's effect on accounting quality in Sweden. Available at SSRN 1097659.
Paananen, M., & Lin, H. (2009). The Development of Accounting Quality of IAS and IFRS over Time: The Case of Germany. Journal of International Accounting Research, 8(1), 31-55. doi:10.2308/jiar.2009.8.1.31
Palea, V. (2009). The effects of the IAS/IFRS adoption in the European Union on the financial industry. http://ssrn.com/abstract=1088712[Accessed 21 April 20115], 12(1-2).
Patricia Dechow, & Schrand, C. (2004). Earnings Quality, A monograph Research Foundation of CFA. Peasnell, K. V., Pope, P. F., & Young, S. (2000). Detecting earnings management using cross-sectional
abnormal accruals models. Accounting and Business Research, 30(4), 313-326. doi:10.1080/00014788.2000.9728949
Penman, S. H., & Zhang, X. J. (2002). Accounting Conservatism, the Quality of Earnings, and Stock Returns. The accounting review, 77(2), 237-264. doi:10.2308/accr.2002.77.2.237
Piotroski, J. D., & Roulstone, D. T. (2004). The Influence of Analysts, Institutional Investors, and Insiders
on the Incorporation of Market, Industry, and Firm‐Specific Information into Stock Prices. The accounting review, 79(4), 1119-1151. doi:10.2308/accr.2004.79.4.1119
Rajgopal, S., & Venkatachalam, M. (2011). Financial reporting quality and idiosyncratic return volatility. Journal of Accounting and Economics, 51(1–2), 1-20. doi:http://dx.doi.org/10.1016/j.jacceco.2010.06.001
Ramnath, S. (2002). Investor and Analyst Reactions to Earnings Announcements of Related Firms: An Empirical Analysis. Journal of Accounting Research, 40(5), 1351-1376. doi:10.1111/1475-679X.t01-1-00057
Reinhart, C. M., & Rogoff, K. S. (2009). "The Aftermath of Financial Crises,". American Economic Review, vol. 99(2), pages 466-472. doi: 10.3386/w14656
Richardson, S. A., Sloan, R. G., Soliman, M. T., & Tuna, İ. (2005). Accrual reliability, earnings persistence and stock prices. Journal of Accounting and Economics, 39(3), 437-485. doi:http://dx.doi.org/10.1016/j.jacceco.2005.04.005
Roberts, M. R., & Whited, T. M. (2012). Endogeneity in empirical corporate finance. Robson, C. (2002). Real world research : a resource for social scientists and practitioner-researchers (2nd
ed. ed.): Oxford : Blackwel. Roll, R. (1988). R2. Journal of Finance, 43, 541-566.

225
Ruland, W., Shon, J., & Zhou, P. (2007). Effective controls for research in international accounting. Journal of Accounting and Public Policy, 26(1), 96-116. doi:http://dx.doi.org/10.1016/j.jaccpubpol.2006.11.004
Saunders., M., Philip Lewis, & Thornhill, A. (2012). Research methods for business students (6 ed.). England: Pearson Educational Limited.
Saunders., M., Philip Lewis, & Thornhill, A. (2015). Research methods for business students (Seventh edition. ed.): New York : Pearson Education
Schipper, K. (2005). The introduction of International Accounting Standards in Europe: Implications for international convergence. European Accounting Review, 14(1), 101-126. doi:10.1080/0963818042000338013
Schipper, K., & Vincent, L. (2003). Earnings Quality. Accounting Horizons, 17, 97-110. Serenjianeh, M. M., & Takhtaei, N. (2013). Abnormal Audit Fees and Stock Price Synchronicity: Iranian
Evidence. Asian Journal of Finance & Accounting, 5(2), 244-255. Shima, K. M., & Gordon, E. A. (2011). IFRS and the regulatory environment: The case of U.S. investor
allocation choice. Journal of Accounting and Public Policy, 30(5), 481-500. doi:http://dx.doi.org/10.1016/j.jaccpubpol.2011.07.001
Skaife, H., Gassen, J., & LaFond, R. (2006). Does stock price synchronicity represent firm-specific information? The international evidence. Available at SSRN: http://ssrn.com/abstract=768024.
Song, L. (2015). Accounting disclosure, stock price synchronicity and stock crash risk: An emerging-market perspective. International Journal of Accounting & Information Management, 23(4), 349-363. doi:doi:10.1108/IJAIM-02-2015-0007
Tan, H., Wang, S., & Welker, M. (2011). Analyst Following and Forecast Accuracy after Mandated IFRS Adoptions. Journal of Accounting Research, 49(5), 1307-1357. doi:http://onlinelibrary.wiley.com/journal/10.1111/%28ISSN%291475-679X/issues
Teoh, S. H., Yang, Y. G., & Zhang, Y. (2009). R-square and market efficiency. Available at SSRN 926948. Thomson Reuters. (2012). DATA DEFINITIONS GUIDE (ISSUE 12). Retrieved from
http://datastream.jp/wp/wp-content/uploads/2012/08/guide_Worldscope-Data-Definitions-Guide-Issue-12.pdf
Tsalavoutas, I., André, P., & Evans, L. (2012). The transition to IFRS and the value relevance of financial statements in Greece. The British Accounting Review, 44(4), 262-277. doi:http://dx.doi.org/10.1016/j.bar.2012.09.004
Tucker, J. W., & Zarowin, P. A. (2006). Does income smoothing improve earnings informativeness? The accounting review, 81(1), 251-270.
Veldkamp, L. L. (2006a). Information Markets and the Comovement of Asset Prices. Review of Economic Studies, 73(3), 823-845. doi:http://restud.oxfordjournals.org/content/by/year
Wang, J. W., & Yu, W. W. (2015). The Information Content of Stock Prices, Legal Environments, and Accounting Standards: International Evidence. European Accounting Review, 24(3), 471-493. doi:10.1080/09638180.2014.977802
Wang, Y., & Yu, L. (2013). State-owned bank loan and stock price synchronicity. China Journal of Accounting Studies, 1(2), 91-113.
Watrin, C., & Ullmann, R. (2012). Improving earnings quality: The effect of reporting incentives and accounting standards. Advances in Accounting, 28(1), 179-188. doi:http://dx.doi.org/10.1016/j.adiac.2012.03.001
Watts, R. L. (2003). Conservatism in Accounting Part I: Explanations and Implications. Accounting Horizons, 17(3), 207-221.
Weetman, P. (2006). Discovering the ‘international’ in accounting and finance. The British Accounting Review, 38(4), 351-370. doi:http://dx.doi.org/10.1016/j.bar.2006.09.001

226
Wurgler, J. (2000). Financial markets and the allocation of capital. Journal of Financial Economics, 58(1–2), 187-214. doi:http://dx.doi.org/10.1016/S0304-405X(00)00070-2
Xing, X., & Anderson, R. (2011). Stock price synchronicity and public firm-specificinformation. Journal of Financial Markets, 14(2), 259-276. doi:http://dx.doi.org/10.1016/j.finmar.2010.10.001
Yang, I.-H., Karthik, B., & Xi, L. (2013). Mandatory Financial Reporting Environment and Voluntary Disclosure: Evidence from Mandatory IFRS Adoption. Singapore Management University
Yeh, Y. M. C., Chen, H.-W., & Wu, M.-C. (2014). Can Information Transparency Improve Earnings Quality Attributes? Evidence from an Enhanced Disclosure Regime in Taiwan. Emerging Markets Finance and Trade, 50(4), 237-253. doi:http://mesharpe.metapress.com/openurl.asp?genre=journal&issn=1540-496X
Young, S. (1999). Systematic Measurement Error in the Estimation of Discretionary Accruals: An Evaluation of Alternative Modelling Procedures. Journal of Business Finance & Accounting, 26(7-8), 833-862. doi:10.1111/1468-5957.00277
Yu, Z., Li, L., Tian, G., & Zhang, H. (2013). Aggressive reporting, investor protection and stock price informativeness: Evidence from Chinese firms. Journal of International Accounting, Auditing and Taxation, 22(2), 71-85. doi:http://dx.doi.org/10.1016/j.intaccaudtax.2013.07.004
Zang, A. Y. (2012). Evidence on the Trade-Off between Real Activities Manipulation and Accrual-Based Earnings Management. The accounting review, 87(2), 675-703. doi:doi:10.2308/accr-10196