do health maintenance organizations work for … health maintenance organizations work for ......
TRANSCRIPT
Do Health Maintenance Organizations Work for Medicare? Randall S. Brown, Ph.D., DoloresGurnick Clement, Dr. P.H., JerroldW. Hill, Ph.D.,
Sheldon M. Retchin, M.D., M.S.P.H., and JeanetteW. Bergeron, M.A.
Since 1985, the Health Care Financing Administration (HCFA) has encouraged health maintenance organizations (HMOs) to provide Medicare coverage to enrolled beneficiaries tor fixed prepaid premiums, Our evaluation shows that the risk program achieves some of its goals while not fulfilling others, We find that HMOs provide care ofcomparable quality to that delivered by fee-tor-service (FFS) providers using fewer health care resources. Enrollees experience substantially reduced out-of-pocket costs and greater coverage. However, because the capitation system does not account for the better health of those who enroll, the program does not save money for Medicare.
MEDICARE RISK PROGRAM: PURPOSE AND EVOLUTION
As one of many efforts to control Medicare costs, HCFA has tried to use HMOs to generate the cost savings for Medicare that HMOs are widely believed to produce for employers providing health coverage to non-elderly people. HMOs, which act
This research was supported by the Health care Financing Ad· ministration (HCFA) under Contract Number 501J.88.0006. Randall S. Brown and Jeanette W. Bergeron are with Mathematics Policy Research. Dolores Gumlck Clement is with the Departments of Health Administration and Preventive Medicine, Virginia Commonwealth University. Sheldon M. Retchin is with the Department of lntemal Medicine, Virginia Commonwealth University. Jerrold W. Hill is with $ANUS Corporation Health Systems. The opinions expressed are those of the authors and do not necessarily reflect the views or policy positions of HCFA, Mathematics Policy Research, Inc., Virginia Commonwealth University, SANUS Corporation Health Systems, or their sponsors.
as insurers but have control over the set of providers from which members can choose and how much they are paid, have an incentive to provide care in the most cost-effective manner possible. This costeffectiveness is achieved by reducing unnecessary services and providing health care in the least expensive but appropriate setting. The market power of HMOs can also help them negotiate favorable prices for provider services.
The Medicare risk program, which became operational in April 1985 under the Tax Equity and Fiscal Responsibility Act (TEFRA) of 1982 (Public Law 97-248), allows HMOs to assume responsibility for providing all Medicare-covered services to beneficiaries in return for a capitated payment. The capitation payment to an HMO for an enrolled beneficiary living in a given county is equal to 95 percent of HCFA's actuarial estimate of the average amount that HCFA would spend in FFS reimbursements for a Medicare beneficiary who resides in that county. This county rate, the adjusted average per capita cost (AAPCC), is equal to the projected average Medicare reimbursement per beneficiary In the United States for the year multiplied by the historic average ratio of Medicare reimbursements per beneficiary for the county to Medicare reimbursements per beneficiary for the United States. The payment rate also varies with the individual's age, gender, reason for entitlement (age or disability), institutional status (residing in a nursing home or not), and Medicaid eligibility, to ac-
HEALTH CARE FINANCING REVIEWfFall1993/volume15,Number1 7
count for the possibility that those who enroll in HMOs may not be representative of the Medicare population in that county.
In return for the AAPCC premium, HMOs must provide or arrange all Medicare-covered services for enrolled beneficiaries. HMOs also cover the Medicare deductibles and coinsurance for which a beneficiary is responsible, but can charge a premium for this coverage, as well as for any other benefits covered by the risk plan but not by Medicare (for example, eye exams and lenses, hearing tests and aids, prescription drugs, and preventive care).
HCFA's primary goal in establishing the risk program was to reduce Medicare costs. HCFA also sought to achieve two other objectives: (1) to provide more efficient health care than that rendered by the FFS sector, while maintaining or improving the quality of care; and (2) to give Medicare beneficiaries access to the same range of choices of health care delivery systems available to younger individuals. HCFA also hoped that costs in the FFS sector would decline as more Medicare beneficiaries enrolled in HMOs. The expectation was that the risk pro· gram would be attractive to HMOs, caus· ing rapid expansion in the number of par· ticipatlng risk plans and beneficiaries.
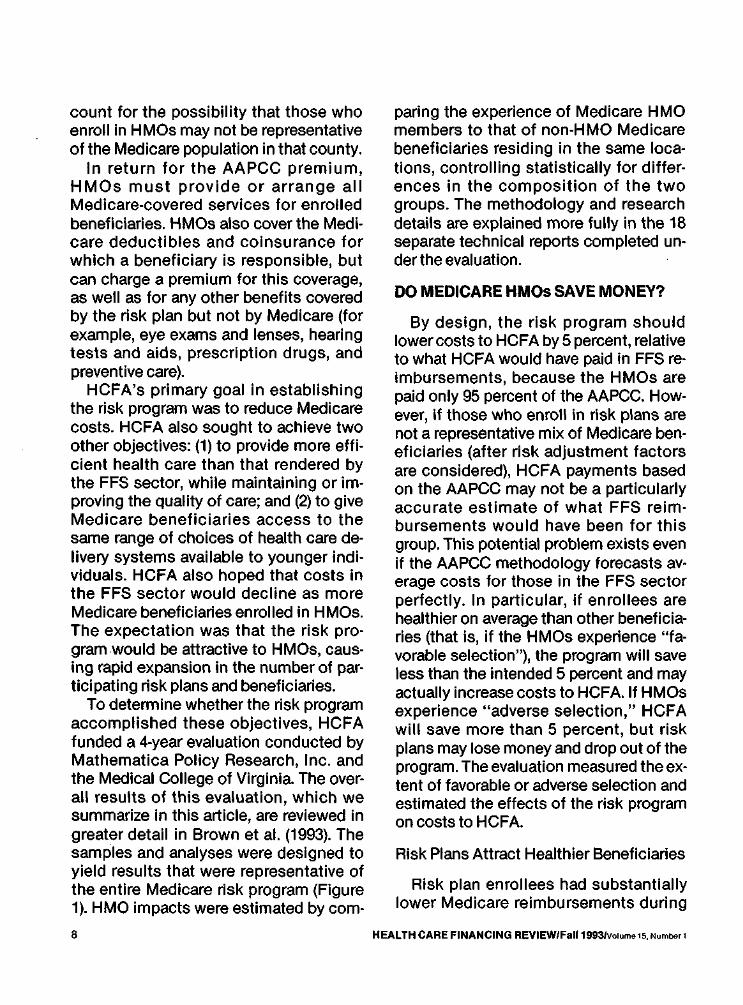
To detennine whether the risk program accomplished these objectives, HCFA funded a 4-year evaluation conducted by Mathematica Policy Research, Inc. and the Medical College of Virginia The overall results of this evaluation, which we summarize in this article, are reviewed in greater detail in Brown et al. (1993). The samples and analyses were designed to yield results that were representative of the entire Medicare risk program (Figure 1). HMO impacts were estimated by com·
paring the experience of Medicare HMO members to that of non-HMO Medicare beneficiaries residing in the same locations, controlling statistically for differ· ences in the composition of the two groups. The methodology and research details are explained more fully in the 18 separate technical reports completed under the evaluation.
DO MEDICARE HMOs SAVE MONEY?
By design, the risk program should lower costs to HCFA by 5 percent, relative to what HCFA would have paid in FFS re· imbursements, because the HMOs are paid only 95 percent of the AAPCC. However, if those who enroll in risk plans are not a representative mix of Medicare beneficiaries (after risk adjustment factors are considered), HCFA payments based on the AAPCC may not be a particularly accurate estimate of what FFS reimbursements would have been for this group. This potential problem exists even if the AAPCC methodology forecasts av· erage costs for those in the FFS sector perfectly. In particular, if enrollees are healthier on average than other beneficiaries (that is, if the HMOs experience "fa· vorable selection"), the program will save less than the intended 5 percent and may actually increase costs to HCFA.If HMOs experience "adverse selection," HCFA will save more than 5 percent, but risk plans may lose money and drop out of the program. The evaluation measured the extent of favorable or adverse selection and estimated the effects of the risk program on costs to HCFA.
Risk Plans Attract Healthier Beneficiaries
Risk plan enrollees had substantially lower Medicare reimbursements during
HEALTH CARE FINANCING REVIEW/Faii19931Volum&15, Number 1 8

Figure 1 Areas Served, by Medicare Risk Plans and Levels of Enrollment: January 1992
Seattle (2)
A. Portland (4)
0 CoNallis ( 1)
Spring~eld (1)0 0 W~cester{1) Rochester {1) Boston (2) A. Minneapolis (2'
lint {1) Buffalo(1) 6Pr ·ence{1)Milwaukee (1) LanSing {1)
0 DDelroitChicago (2) ·cleveland (1)---c0 Omaha (1}
OAkron (1} 0:11adelphia (1)1::. Sacramento (1)
• Denver (3) !::. Indianapolis (1)San Francisco (2)
Bakersfield (1) 0 Kansas City {2) 0 0 las Vegas (1)
0 Wichita (1) !::. Louisville (1}
e Los Angeles (7} 0 Albuquerque (1)
0 Atlanta (1} A Phoenix (2)
0 Honolulu (1) 0 Dallas (1}
0- Less than 5.000 Members Daytona Beach (1) • San Anton;(o"-"(20)__' !::. -5,001 to 10,000 Members 0-10,001 to 20,000 Members •- 20,001 to 50,000 Members A.- 50,001 to 100,000 Members !::. ¢orpus Christi (1)
Miami(S)e- More than 100,000 Members
:t
~ ~ :!!
~ ~
!~
~
r-· !-~
NOTES: In a lew instances, a risk plan will have enrollees;,.. more than one market area (lor example, Miami and Tampa: los Angeles and San Diego). In these cases, the enrollment lor the en~re plan is attributed to the market area of largest enrolment, unless the plan has separate COfltracts lor the areas. The number of plans in the market area are shown in parentheses.
SOURCE: Brown, RS" and Bergeron. J.W., Mathematica Policy Research, Clement. D.G .. and Retchin, S.M .. Virginia Commonwealth University, and Hill, J.W. SANUS Corporatioo Health Systems, 1993.
~
the 2 years prior to enrollment than did non-enrollees during a comparable period, even after controlling for differences between the two groups in the demographic risk factors incorporated in the AAPCC payment mechanism (Hill and Brown, 1990). Prior reimbursements for a sample of nearly 100,000 new enrollees in 1987 and 1988 were about 20 percent lower overall than the risk-adjusted reimbursements for non-enrollees from the same market areas. About two-thirds of the 98 risk plans examined experienced clearly favorable selection according to this measure, and the other one-third experienced slightly favorable or neutral selection. None of the plans experienced adverse selection. Similar results were obtained from comparing the proportions of the two groups of beneficiaries with a prior hospital stay for a condition associated with high costs in subsequent years.
Enrollees also had fewer functional disabilities and other indicators of chronic health problems than non-enrollees, were less likely to rate their health as poor, and expressed less inclination to use health care services when they were not feeling well (Hill and Brown, 1992). Even after controlling for enrollee and non-enrollee differences in health status that could be a result of differences between the groups in factors accounted for by the AAPCC payment mechanism (enrollees were less likely to be on Medicaid, in institutions, 80 years of age or over, or Medicare-entitled because of disability rather than age), enrollees were 15 to 30 percent less likely than non-enrollees to exhibit various health problems. For example, 27 percent of enrollees had a history of cancer, heart disease, or stroke, compared with 32 percent of nonenrollees (a 16-percent lower rate of inci
dence), even after adjusting for the demographic risk factors. These findings were obtained from a 1990 survey of more than 6,400 randomly selected enrollees from 75 risk plans and a comparable number of non-enrollees from the same market areas. The sample was drawn from the full set of enrollees, unlike the prior-use analysis samples, thereby providing a more representative picture of the risk program as it matured.
The differences between enrollees and non-enrollees appear to be due primarily to the self-selection of enrollees, because HMOs must enroll any interested Medicare beneficiary. Beneficiaries with chronic health problems are less likely than those in good health to change doctors or give up their freedom to use the primary care physicians, specialists, and hospitals of their choice.
Costs to Medicare Increased
We estimate that HCFA expenditures for the risk program were approximately 5.7 percent more than they would have been for FFS care, primarily as a result of favorable selection into Medicare risk plans. Although HCFA paid the HMOs 95 percent of the AAPCC estimate of what FFS costs would have been, our estimates of these FFS costs for the survey sample of enrollees were only 90 percent of the AAPCC projection. To project what FFS reimbursements would have been for the enrollees, we Inserted data on various characteristics for enrollees in the survey sample (demographic risk factors, health status, access to care, attitudes, and socioeconomic traits) into a Medicare reimbursements equation that was estimated for the non-enrollees in the survey sample. We used a similar approach
HEALTH CARE FINANCING REVIEW/Fall1993/volume 15, Numbel' 1
based solely on the AAPCC demographic risk factors to project the AAPCC pay· men! that would prevail if it predicted average FFS costs perfectly for the nonenrollees in each market area. The estl· mated effect-the the difference between projected AAPCC payments and the pro· jected FFS costs for enrollees-is statisli· cally significant at the 0.01 level. The 95 percent confidence interval for the esti· mated increase in cost to HCFA resulting from the risk program is 2.4 to 9.1 percent. Our estimates indicate that Medicare Part A costs (for hospital, skilled nursing facil· ity [SNF], and home health care) increased by 8.5 percent; Part B costs (for physician services, laboratory tests, and X-rays) in· creased by only 2.7 percent.
The difference between projected AAPCC payments and projected FFS costs for enrollees were due almost en· tirely to health status differences be· tween enrollees and non-enrollees that were not fully captured by the demographic risk factors-that is, age, gender, residence in a nursing home, Medicaid el· igibility, reason for entitlement, and county of residence. Differences in self· ratings of health, the ability to perform activities of daily living (ADLs) and instru· mental activities of daily living (IADLs) without assistance, and a history of seri· ous illness (cancer, heart disease, or stroke) accounted for 83 percent of the difference between the projected AAPCC rate and the projected FFS costs of enroll· ees. The history of serious illness indica· tor alone accounted for 38 of the 83 percent. Differences in attitudes toward health and health care accounted for 14 percent of the difference, and socioeconomic factors and access to care ac· counted for the remaining 3 percent.
Cost increases to HCFA were greatest
for enrollees in the areas with the highest AAPCCs, HMOs that did not charge a premium, and staff model plans. Costs to HCFA for enrollees in plans that did not charge a premium were more than 8 percent higher than FFS costs would have been, whereas costs increased by only 2 percent for enrollees in plans that charged beneficiaries $50 or more per month. Thus, although costs to HCFA have increased, the program requirement that excess payments be used to lower premiums or increase benefits to benefi· ciaries is clearly working as intended. The higher estimated cost increases to HCFA in areas with high AAPCC rates indicate that selection into risk plans is more favorable In these areas. Our estimates, be· cause of their construction, are driven only by observable differences in the char· acteristics of enrollees and non-enrollees and do not reflect any additional effects on costs that would result from errors in the AAPCC in predicting average FFS costs for a given county or market area.
DO HMOs REDUCE SERVICE UTILIZATION?
The premise of the Medicare risk pro· gram is that HMOs can prosper while pro· viding Medicare coverage for less money than the FFS sector, primarily by reduc· ing unnecessary service use and ineffi· ciency in the delivery of health care. HMOs are believed to achieve most of their savings by reducing hospital use, presumably by substituting less expen· sive types of care, including ambulatory care, home health visits, and nursing home care, and by practicing preventive care.
We estimated the Impact of the risk program on the utilization of hospital ser· vices, SNFs, home health care, and physi·
HEALTH CARE FINANCING REVIEW/Fall1993lvolumet5,Number1 11
clan visits by comparing service use reported on the survey by enrollees and non-enrollees for the year prior to the interview, controlling for differences in health status measures, attitudes toward health care, and demographic variables.
HMOs Reduce Hospital Days
HMOs shortened the average hospital length of stay (LOS) by 1.5 days (16.8 percent) relative to FFS, but did not affect the number of hospital admissions (Table 1). The finding that HMOs reduce total hospital days by shortening stays rather than by reducing admissions is contrary to expectations generated by some previous studies (Manning et al., 1984; Lull, 1981), and is especially surprising given that Medicare's prospective payment system (PPS) provides a similar incentive for hospitals to reduce LOSs among FFS patients. (Under PPS, which was implemented in 1983, hospitals are paid a fixed, pre-<letennined amount on the basis of a patient's diagnosis.) However, our findings are supported by recent literature (Stem et al., 1989) and by our Independent analysis of the quality of inpatient care (described later), which showed that LOSs among two groups of HMO patients with particular conditions (colon cancer and stroke) were 18 to 23 percent shorter, on average, than LOSs among
FFS patients with the same conditions In the same metropolitan areas. Further support for these findings comes from an evaluation case study (Hurley and Bannick, 1992) indicating that many successful risk plans use case management (preadmission planning for each patient by a specially trained nurse, together with the patient's physician, to determine how long the patient should be In the hospital) to shorten hospital stays. Case managers also identify the type of post-discharge care likely to be required and arrange for the care well in advance to ensure that it is available when needed. The lack of an effect on admission rates suggests that few hospital stays for elderly people are discretionary now and that FFS providers are using new technologies to treat Individuals as outpatients. Hospital admissions per 1,000 aged Medicare beneficiaries in the FFS sector declined by 25 percent from 1985 to 1989, indicating that Medicare HMOs may have much less opportunity now than they did in the past to save money by reducing hospital admissions.
H MOs Increase Some Services but Reduce Intensity
Medicare risk plans increased the likelihood that beneficiaries visited a physician at least once during the year from 84
Table 1 Medicare HMO Effects on Hospital Use
Hospital use Measure HMO FFS Impact
Sample Size 6,457 6,071
Probability of 1 or More Hospitalizations in Percent 15.0 15.9 -0.9 Hospital Stays per 1,000 Beneficiaries 218 212 6 Hospital Days per 1,000 Beneficiaries 1,530 1,839 ·-309 Average Length of Stay 7.25 8.69 * -1.44 •statistically significant at the .OS level (one-tailed test).
NOTES: HMO Is health maintenance organization. FFS Is lee-lor-seiVice.
SOURCE: (Hill et al., 1992).
HEALTH CARE FINANCING REYIEW/Fall1993lvolume t!>, Number 1 12
to 89 percent but slightly reduced the likelihood of having one or more visits per month (on average) from 14 to 12.5 per· cent (Hill et al., 1992). HMOs also in· creased the likelihood that beneficiaries had a physical exam by 6 percent, consistent with HMOs' emphasis on and coverage of preventive care. However, these plans had no effect on the average number of visits per beneficiary in the month preceding the interview. This absence of an effect on number of visits reflects competing HMO incentives: to reduce the number of visits per patient to control costs, while encouraging patients to obtain routine preventive care to reduce the need for more expensive services later.
Similarly, risk plans increased by a large proportion (but a small absolute amount) the likelihood of a beneficiary's receiving care in an SNF, but they did not increase the total number of SN F days rei· alive to those beneficiaries in FFS care. These estimates are consistent with the expectation that HMOs may shorten hos· pital stays by substituting SNF care for more expensive hospital days. We found that, for stroke patients, HMO members were discharged sooner and to less Intensive types of care arrangements (SN Fs in· stead of rehabilitation hospitals) than FFS patients. However, HMOs appeared to reduce the intensity of use, because there was no effect on the total number of SNF days despite the increase in SNF ad· missions.
HMOs had no effect on the proportion of Individuals with some home health care utilization, but they reduced the number of home health visits by 50 percent. Again, HMOs do not limit initial access to services but do control costs by reducing the intensity of the service rendered. HMOs reduced visits by registered
nurses for nursing care and physical therapy and visits by home health aides for assistance with personal care.
Effects are Greatest for the Seriously Ill
HMOs increased the use of some services by beneficiaries whose health was poorest, but they reduced the intensity of services more for this group than for other beneficiaries. For example, al· though HMOs had no effect on hospital admissions overall, they increased the probability of admission for enrollees in poor health and those with functional impairments. On the other hand, the largest HMO reductions in hospital days and home health visits were associated with beneficiaries who were in poor health, had ADL or IADL impairments, or died within 9 months after the interview. Our results for quality of care (reviewed later) suggest that these reductions are more likely the result of eliminating unnecessary services or substituting other types of care than of restricting access to needed care.
Effects Vary with Plan Characteristics
Staff model plans, plans that charged high premiums, and plans in low AAPCC areas were less successful than other risk plans at controlling utilization. Staff model plans, which pay physicians a salary and do not expose them to financial risk, were unable to reduce hospital days and home health visits, in contrast with the sizable reductions achieved by indi· vidual practice associations (IPAs) and group plans. Staff plans also increased the number of physician visits substantially, unlike the other model types. The much larger reductions in hospital days per 1,000 enrollees by HMOs in high
HEALTH CARE FINANCING REVIEW/Fall19931vo~umeT5,NumberT 13
AAPCC areas suggest that FFS hospital use in these areas may be especially Inefficient Finally, the HMOs that charged 1990 monthly premiums of $50 or more were unable to reduce hospital use or home health use and showed an increase in physician visits relative to the FFS sector. This finding suggests that {heir utilization management practices or Incentives did not yield more efficient medical practices than FFS and therefore did not enable these H MOs to provide coverage at rates substantially below medlgap rates. However, it is possible that competition from HMOs in some of these areas has forced the FFS sector to be as efficient as the HMOs.
HMOs Use Fewer Medical Resources
The combined HMO effects on hospital, physician, home health, and SNF use suggest that HMOs may have spent about 10.5 percent less for all Medicarecovered services combined than the amount HCFA would have spent in reimbursements to FFS providers. This estimate is a weighted average of the proportionate HMO effects on the four types of services examined (with weights equal to the share of that service In total projected Medicare FFS reimbursements for enrollees). It has no bearing on whether the risk program affects the costs to HCFA, because payments to HMOs are predetermined by the AAPCC and are unaffected by the HMOs' actual resource use. However, the estimate does imply that the potential for cost savings to HCFA may exist The reduction in medical resources consumed is reasonably large (resulting almost entirely from the 17 percent reduction in hospital days) and may be sufficient to allow HMOs to cover their
administrative costs, even if their AAPCC payments were reduced. This estimate is quite rough, however, because the marginal service use eliminated by HMOs may not be as expensive as service use that could not be eliminated (for example, the last days of a hospital stay may be less resource-intensive), thus lowering the amount of potential savings. On the other hand, because HMO members undergo fewer tests and are more likely than FFS patients to be treated by primary care physicians rather than by specialists, the difference between AAPCC payments and the amount pald by an HMO for medical services may exceed the 10.5 percent estimate. Furthermore, HMOs may negotiate more favorable rates for services than those paid by Medicare.
DO HMOs AFFECT QUALITY OF CARE?
The quality of care delivered by HMOs has the potential to be better or worse than that rendered by FFS providers. In responding to the financial incentives to provide care more efficiently, HMOs may restrict services too much, leading to lower-quality care. Efforts to economize can also lead to poorer care if the H MOs' physicians, other service providers, or facilities are inferior to those in the FFS sector. On the other hand, the features that distinguish HMOs from FFS providers-the coordination of care, the emphasis on preventive care, and lower out-ofpocket costs to members-can lead to higher-quality care for enrollees.
We assessed the impacts of risk plans on quality of care by: comparing the services received by HMO and FFS patients who were hospitalized for colon cancer or stroke and their outcomes; comparing the ambulatory care received by HMO and
HEALTH CARE FINANCING REVIEWIFall19931volume 15, Number 1 14
FFS patients for three chronic problems (joint pain, urinary incontinence, and recurring chest pain); and comparing the satisfaction of HMO enrollees and non-enrollees with various aspects of the care they received.'
Inpatient Outcomes Are Similar to FFS
The rates of death, hospital readmission, and post-admission complications among HMO and FFS patients were similar, Indicating no differences in outcomes (fable 2). Furthermore, HMOs achieved these outcomes with significantly lower use of various procedures, tests, or services. HMOs reduced hospital LOS by 23 percent among colon cancer patients and by 18 percent among stroke patients, consistent with the 17 percent shorter LOS observed overall among the survey sample (which did not control for diagnosis). HMO members also spent about onethird less time, on average, in intensive care units for both conditions. In addition, HMOs substantially reduced the use of various laboratory tests and procedures that appeared to be discretionary, such as multiple computerized axial tomography scans and electroencephalograms for stroke patients.
Although the similarity in outcomes suggests no major differences In quality
1we assessed the effects on quality of care separately for stroke and colon cancer patients by comparing, for each group, the treatments received by a sample of about 400 HMO patients (from 19 HMOs) with those received by an equal num· ber of comparable FFS patients at hospitals serving the same oountles; the data for this analysis were abStracted from the reoolds of 154 hospitals. (Se& Retchin et al. (1992] for adetailed discussion of methodology and results.) Data for analyzing the effects on access to care and satisfaction with care came from the same survey of beneficiaries that we used to estimate ef· feels on cost and utilization. Statistical models were used to control for differences between enrollees and non-enrollees that coold create differences in access or satisfaction not resulting from the influence of an HMO. (See Clement et al. (1992) for a detailed discussion of the study procedures and findings.)
of care, a few differences do Indicate that HMOs may be providing less adequate care in some situations. The most striking evidence for this inference was the significantly shorter distance between the tumor and the margin of resection (the portion of the colon that was removed) for HMO patients. For these patients, the average distance was approximately equal to the minimum recommendation. However, various other indicators of quality of surgical care revealed no differences between the two systems of care-for example, the amount of colon removed, the amount of blood lost during surgery, and the average number of lymph nodes removed. HMO stroke patients received significantly less physical therapy while in the hospital and had greater motor and speech deficits at discharge, yet were not more likely to have post-discharge speech or physical therapy planned. This pattern suggests that HMOs may economize on rehabilitative care; on the other hand, HMO patients were discharged sooner and may well have recovered an equivalent level of functioning with the passage of an equivalent number of days after the date of admission. Finally, HMO patients were not more likely to have post-admission complications, and the responses of HMOs to complications were similar In most cases. However, HMOs were less likely than FFS providers (49 versus 64 percent) to give chest X-rays to colon cancer patients who experienced post-operative fevers. (A review of the literature indicates X-rays are called for In 80 to 100 percent of such patients.) HMOs also administered pre-operative antibiotics less frequently than did FFS providers. This precaution Is recommended for all colon surgery patients by the American Society of Hospital Pharmacists as
HEALTH CARE FINANCING REVIEWIFall1993/volume1~>,Number1 15
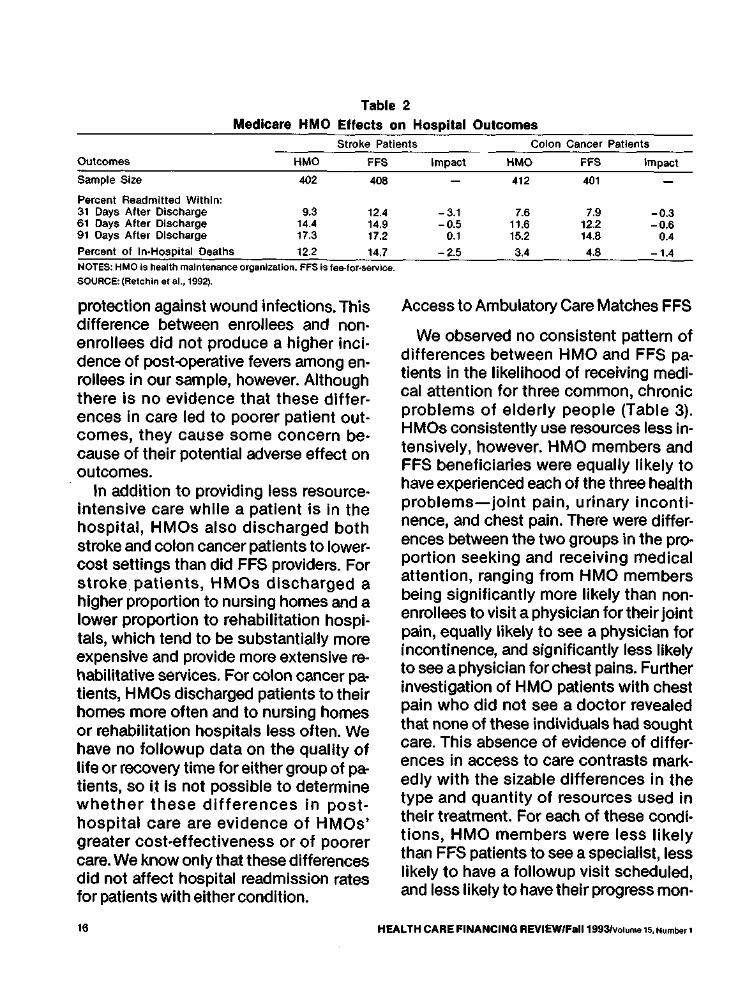
Table 2 Medicare HMO Effects on Hospital Outcomes
Stroke Patients Colon Cancer Patients
Outcomes HMO FFS Impact HMO FFS Impact
Sample Size 402 408 412 401
Percent Readmitted Within: 31 Days After Discharge 9.3 12.4 -3.1 7.6 7.9 -0.3 61 Days After Discharge 14.4 14.9 -0.5 11.6 12.2 -0.6 91 Days After Discharge 17.3 17.2 0.1 15.2 14.8 0.4 Percent of In-Hospital Deaths 12.2 14.7 2.5 3.4 4.8 1.4 NOTES: HMO is health maintenance organization. FFS is fee-for·service. SOURCE: (Retch in et el., 1992).
protection against wound infections. This difference between enrollees and non· enrollees did not produce a higher incidence of post-operative fevers among en· rollees in our sample, however. Although there is no evidence that these differences In care led to poorer patient out· comes, they cause some concern be· cause of their potential adverse effect on outcomes.
In addition to providing less resourceintensive care while a patient is in the hospital, HMOs also discharged both stroke and colon cancer patients to lowercost settings than did FFS providers. For stroke. patients, HMOs discharged a higher proportion to nursing homes and a lower proportion to rehabilitation hospitals, which tend to be substantially more expensive and provide more extensive rehabilitative services. For colon cancer patients, HMOs discharged patients to their homes more often and to nursing homes or rehabilitation hospitals less often. We have no followup data on the quality of life or recovery time for either group of patients, so it Is not possible to determine whether these differences In posthospital care are evidence of HMOs' greater cost-effectiveness or of poorer care. We know only that these differences did not affect hospital readmission rates for patients with either condition.
Access to Ambulatory Care Matches FFS
We observed no consistent pattern of differences between HMO and FFS patients in the likelihood of receiving medi· cal attention for three common, chronic problems of elderly people (Table 3). HMOs consistently use resources less Intensively, however. HMO members and FFS beneficiaries were equally likely to have experienced each of the three health problems-joint pain, urinary inconti nence, and chest pain. There were differences between the two groups in the proportion seeking and receiving medical attention, ranging from HMO members being significantly more likely than nonenrollees to visit a physician for their joint pain, equally likely to see a physician for incontinence, and significantly less likely to see a physician for chest pains. Further investigation of HMO patients with chest pain who did not see a doctor revealed that none of these individuals had sought care. This absence of evidence of differences in access to care contrasts markedly with the sizable differences in the type and quantity of resources used in their treatment. For each of these conditions, HMO members were less likely than FFS patients to see a specialist less likely to have a followup visit scheduled, and less likely to have their progress man·
HEALTH CARE FINANCING REVIEWIFall19931volume 15, Number 1 18
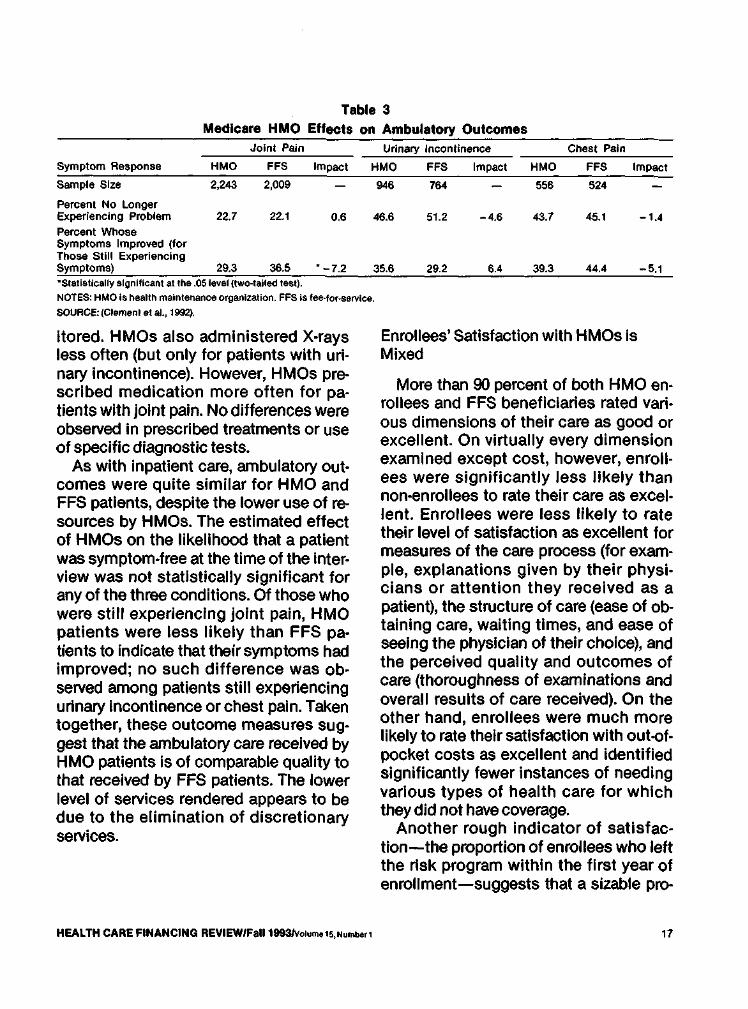
Table 3 Medicare HMO Effects on Ambulatory Outcomes
Joint Pain Urinary Incontinence Chest Pain
Symptom Response HMO FFS Impact HMO FFS Impact HMO FFS Impact
Sample Size 2,243 2,009 946 764 556 524
Percent No Longer Experiencing Problem 22.7 22.1 0.6 46.6 51.2 -4.6 43.7 45.1 -1.4 Percent Whose Symptoms Improved (for Those Still Experiencing Symptoms) 29.3 36.5 .-7.2 35.6 29.2 6.4 39.3 44.4 -5.1 ·statistically significant at the .05tevet (two-tailed test). NOTES: HMO is health maintenance organization. FFS Is fee-tor-service. SOURCE: (Clement et al., 1992).
ltored. HMOs also administered X·rays less often (but only for patients with uri· nary Incontinence). However, HMOs prescribed medication more often for pa· tients with joint pain. No differences were observed in prescribed treatments or use of specific diagnostic tests.
As with Inpatient care, ambulatory out· comes were quite similar for HMO and FFS patients, despite the lower use of resources by HMOs. The estimated effect of HMOs on the likelihood that a patient was symptom·free at the time of the inter· view was not statistically significant for any of the three conditions. Of those who were still experiencing joint pain HMO . ' pat1ents were less likely than FFS pa· tients to Indicate that their symptoms had improved; no such difference was ob· served among patients still experiencing urinary Incontinence or chest pain. Taken together, these outcome measures suggest that the ambulatory care received by HMO patients Is of comparable quality to that received by FFS patients. The lower level of services rendered appears to be due to the elimination of discretionary services.
Enrollees' Satisfaction with HMOs is Mixed
More than 90 percent of both HMO en· rollees and FFS beneficiaries rated various dimensions of their care as good or excellent. On virtually every dimension examined except cost, however, enroll· ees were significantly less likely than non-enrollees to rate their care as excel· lent. Enrollees were less likely to rate their level of satisfaction as excellent for measures of the care process (for exam· pie, explanations given by their physi· clans or attention they received as a patient), the structure of care (ease of obtaining care, waiting times, and ease of seeing the physician of their choice), and the perceived quality and outcomes of care (thoroughness of examinations and overall results of care received). On the other hand, enrollees were much more likely to rate their satisfaction with out-of· pocket costs as excellent and identified significantly fewer instances of needing various types of health care for which they did not have coverage.
Another rough indicator of satisfac· lion-the proportion of enrollees who left the risk program within the first year of enrollment-suggests that a sizable pro-
HEALTH CARE FINANCING REVIEWIFaii1993Jvolume15,Number1 17
portion of new enrollees are not satisfied. Of the beneficiaries who joined a risk plan voluntarily, 20 percent dropped out within 12 months after joining, although the rates varied widely across risk plans.
Most enrollees, however, seemed to feel that HMOs' lower costs and wider set of benefits more than compensated tor their lower level of satisfaction with care recieved. About 93 percent of HMO enroll· ees indicated that they would recommend their HMO to a friend or relative.
IMPLICATIONS FOR MEDICARE RISK CONTRACTING
The Medicare risk program has increased beneficiaries' range of choices in health care delivery systems, and risk plans do appear to be able to reduce utilization rates without affecting the quality of care. However, the primary goal of the risk program-to reduce costs to HCFA -has not been realized. Our estimate of a 5.7-percent increase In costs implies that the $578 million paid out to HMOs in capitation payments tor the month of June 1992 was about $31 million more than HCFA would have spent in FFS reimbursements tor the 1.4 million enrollees. Although HMOs channeled much of this increase in costs into lower out-of-pocket expenses and additional benefits for enrolled beneficiaries, the intent of the program was to lower costs to HCFA, rather than to subsidize the health care of beneflcl~ries In selected areas. However, our estomates suggest that the potential exIsts tor such cost savings, as a result of sizable reductions In utilization of hospitals and home health seovices.
The difficulty In achieving these cost savings is that adjusting the payment mechanism to account for the favorable
selection experienced by risk plans will lower the average AAPCC payment to most HMOs, which is likely to reduce protits and discourage HMOs from participating. One-half of the participating risk plans are already losing money (Shin and Brown, 1993), nearly one-half of the plans that were active at some time from 1987 to 1990 had discontinued their risk contracts by 1991 (McGee and Brown, 1992), and very few new risk contracts have been signed. Furthermore, reductions In AAPCC payments may cause HMOs to increase their premiums, which is likely to slow growth in the rate of enrollment in existing risk plans. Changing the AAPCC in order to save money tor HCFA may compromise the objective of offering a managed care option to more beneficiaries.
Finding a solution that will enable HCFA to hold the current costs of the risk program to FFS levels while not driving HMOs and beneficiaries out of the program is important, because managed care has many inherent advantages that should lead to greater efficiency in the long run. The incentives In the risk program are structured to minimize costs rather than to maximize revenues, as in the FFS sector. Risk plans also do not have an incentive or opportunity to shift costs to other types of providers, as often occurs in response to a HCFA initiative to control Medicare costs for a particular seovice. Finally, HMOs are organized to facilitate the coordination of care (which should eliminate provision of overlapping seovices to beneficiaries), and their emphasis on preventive care could lead to better long-term outcomes and perhaps lower costs. However, these potential efficiencies will not affect costs to HCFA unless the AAPCC payment mechanism is changed to reflect favorable selection.
HEALTH CARE FINANCING REVIEW/Fall19931volume 16, Number 1 18
HCFA could take several actions to help make the potential cost savings of the risk program a reality without driving HMOs away. One change, modifying the AAPCC, must occur to eliminate the cost Increases to HCFA. Several other actions would help HMOs accomplish three key cost-cutting objectives: (1) enrolling a sui· flcient number of beneficiaries to spread the financial risk and fixed costs ade· quately; (2) bringing administrative costs for Medicare plans under control; and (3) holding service utilization rates down (es· pecially for hospital care). The burden is not solely HCFA's; HMOs must also make some changes to increase their likelihood of succeeding in the Medicare market.
Revise Payment Methodology
Our results suggest that adding one ad· ditlonal factor to the AAPCC payment rate formula-a history of cancer, heart disease, or stroke-could eliminate the increase in costs to HCFA. Our simula· !Ions show that if this change were imple· mented and the plans were still paid only 95 percent of the revised AAPCC, HCFA would actually save 1.1 percent relative to FFScosts, rather than losing money. This approach is similar to the diagnostic cost group (DCG) method developed by Ash et al. (1986) but Is simpler, Includes a larger proportion of beneficiaries in the high· cost group (about one-third of Medicare beneficiaries have had cancer, heart dis· ease, or a stroke), and is not limited to the experience of the previous year. Data from HMOs on a refined version of this type of indicator would be much easier to verify than some of the risk factors pro· posed by others, such as measures of functioning. In addition, these data would
only need to be updated when a benefi· ciary experiences such a health problem for the first time. This change would reduce AAPCC payments the most for plans that create the greatest cost in· creases to HCFA-that is, those experiencing the most favorable selection. Our estimates suggest that the change would not yield the full 5 percent savings originally intended but would at least eliml· nate cost increases to HCFA.
Modifying the AAPCC formula by add· ing an adjuster for health status is likely to force HMOs with particularly favorable selection to charge beneficiaries a higher premium. Because a number of these plans charge no premium, and others charge a rate well below the market price for the benefits they offer, premiums could Increase significantly without driving enrollees out of these plans. Enrollees would still receive a favorable price, but the price would no longer be subsidized by the Medicare program.
Several other changes to the AAPCC could benefit HMOs without increasing costs to HCFA-in particular, standardizing the rate paid within a given metropolitan area, reducing the year-to-year volatility In payment rates, and tying changes in payment rates to current market factors rather than to outdated trends. These changes, which we and others have proposed before, would make payments to risk plans more consistent with their costs for particular members or in a par· tlcular year, enable them to plan more ef· fectively, and smooth out the erratic annual changes in their revenue flow. These changes should be cost neutral and rela· tively easy to Implement.
Finally, although the relative accuracy of AAPCC rates for different counties was beyond the scope of our analysis, there is
HEALTH CARE FINANCING REYIEWIFall19931volume15,Number1 19
widespread belief in the industry that the rates are much more generous In some market areas than others. These differences account in part for the fact that risk plans in some areas are able to offer, at no charge to beneficiaries, extensive services beyond what Medicare covers, while risk plans in other areas struggle to survive. Until these disparities are eliminated, there will continue to be great differences across areas in the number size ' ' and financial success of Medicare risk plans.
Increase Plan Enrollments
Increasing the average enrollment in risk plans and enrolling a greater proportion of individuals who require the most health care are perllaps the best ways to offset the adverse effects that a more accurate payment formula might have on HMO revenues. Having more Medicare members (the median enrollment in 1990 was only 4,733 members) would help HMOs reduce their costs per member month by spreading the large fixed portion of administrative costs over more members and diluting its influence. (Boles [1992] estimates that few HMOs whose administrative costs exceed 10 percent of revenues make a profit overall.) Enrollment growth would also reduce the risk that a few seriously ill members would create overall losses tor a risk plan. (A risk plan with 5,000 members that would normally break even has a 12percent chance of losing 5 percent or more in a given year, simply because of variability In health care costs tor beneficiaries.) Encouraging the enrollment of sicker beneficiaries to create a more neutral mix of enrollees would keep AAPCC payments from shrinking as the change
was implemented. This change could be especially beneficial in light of the evaluation finding that HMOs achieved their greatest resource savings tor the benefi· ciaries who normally have the greatest health care use. Implicit HMO profit margins on these individuals should be higher than average.
Two changes could make enrollment more attractive to beneficiaries, including those in poor health: (1) increasing the number of area physicians affiliated with a Medicare risk plan; and (2) increasing the number of employers that provide health care coverage to their retirees through a Medicare risk plan. The proposed reduction in AAPCC payment rates would probably engender higher risk plan premiums tor beneficiaries, which will dampen their interest in the program. Increasing the likelihood that beneficiaries could join a Medicare risk plan without changing their physicians would offset this adverse effect substantially and could create a more neutral mix of enrollees. Various ways to encourage the participation of physicians in HMOs could be devised, including offering some form of Incentive to either physicians or HMOs. However, adding physicians who are not necessarily agreeable to managed care concepts will be unattractive to HMOs. Alternatively, HMOs could be offered financial incentives for net increases in enrollments of a given size or percentage. Employers could be given financial incentives to offer risk plan membership as a health care option for their retirees. All of these incentives that involve payments to physicians, HMOs, or beneficiaries would have to be temporary, in order to avoid further net increases in long-term costs. The objective of Incentives is to help risk
HEALTH CARE FINANCING REVIEW/Fall1993/volume 15, Number 1 20
plans reach a size at which they can at least break even.
One frequently proposed option for Increasing enrollment growth that should not be adopted Is reducing the Part B premium of beneficiaries who enroll in an HMO, because It would be very expensive and probably ineffective. It would be difficult and probably illegal to restrict such benefits to new enrollees; hence, unnecessary Part B premium rebates would be made to 1.4 million current enrollees. Furthermore, because only about 20 percent of Medicare beneficiaries enroll in Medicare risk plans in areas where the plans do not charge any premium (a savings of $50 to $100 per month relative to medigap coverage), offering beneficiaries a rebate of $5 to $10 per month on their Part B premium is unlikely to attract many new members.
Minimize Administrative Burdens
HCFA could also look lor ways to minimize the administrative burden that risk program rules and requirements impose on participating plans. For example, HMOs have long complained that the mandated peer review organization (PRO) process lorensuring quality of care is burdensome and redundant, given their own quality assurance procedures. A number of changes have been made to reduce the PRO and other administrative burdens in recent years, but there may still be areas where administrative demands of the program could be reduced without compromising HCFA's ability to comply with its oversight responsibilities.
Reduce Certain Legislative Constraints
HCFA could encourage States to eliminate regulations that require HMOS to pay
fixed rates per hospital admission on the basis of diagnosis; these rates vitiate hospitals' incentive to reduce hospital LOS and Ioree them to pay higher effective prices than they might be able to negotiate lor hospital care. HCFA could also advocate eliminating regulations that reduce HMOs' ability to impose reasonable levels of financial risk on physicians. Similarly, States could be encouraged to allow the market to determine the appropriate price lor medigap policies. These changes would introduce more competitive pressure into the market, increasing the likelihood that the twofold goal of cost reductions lor HCFA and growth in the risk program can be attained.
HMOs Must Adapt to Medicare
Although HCFA can take some actions to facilitate HMOs' ability to operate successful risk plans, much of the burden must fall on the HMOs themselves. Many risk plans are simply too small to achieve the stable utilization patterns and low administrative cost per member month needed to plan effectively and operate efficiently. These plans will need to be more aggressive about growth if they expect to prosper under a payment system that eliminates the benefits of favorable selection. Larger plans may also have high administrative costs that are incompatible with acceptable financial performancethese plans must look lor ways to reduce these costs.
HMOs can also be more innovative about finding ways to control utilization, especially hospital care. We found that successful risk plans now tend to be proactive rather than reactive in seeking ways to lower utilization, try to foster a spirit of cooperation between the plan
HEALTH CARE FINANCING REVIEW/Faii1993Jvolum&15,Numbm1 21
and the physicians in managing member services, and emphasize educating physi· cians rather than attempting to control their behavior (Hurley and Bannick, 1992). These HMOs tend to rely heavily on case management of hospital stays to keep them as short as possible, planning strat· egies for individual patients' treatment and recovery and arranging for needed post-discharge services well In advance. They also are continually seeking ways to improve their performance. Risk plans that find it difficult to control utilization for their Medicare beneficiaries may want to explore these approaches and look for other innovative ways, such as risk sharing, monitoring, practice guidelines, and other mechanisms, to manage the care of their elderly members.
CONCLUSIONS
These suggestions for change clearly require a much more thorough examina· tlon of the possible consequences and operational concerns. The recommenda· tlons are put forth simply to illustrate the potential to improve the risk program, from the perspective of both HMOs and taxpayers. At present, HMOs In the risk program provide care that is approxi· mately equal in quality to that rendered in the FFS sector, with more extensive ben· efit coverage and at a much lower price to beneficiaries than alternative supplemen· tal coverage. HMOs successfully reduce utilization by sizable margins by practic· lng cost-effective care. They are also capable of generating savings that can be shared among beneficiaries, HCFA, and HMOs. Furthermore, although a number of HMOs have left the risk program and others complain of financial difficulties, the non-renewal rate has declined and a
high proportion of plans that have left the program would be interested in reentering if the payment mechanism were reformed. With a carefully planned pack· age of changes by HCFA and continued efforts on the part of H MOs, H MOs' abil· ity to deliver Medicare services more effi· ciently could bring savings to HCFA, ben· eficiaries, and H MOs.
REFERENCES
Ash, A., Porell, F., Gruenberg, L. et al.: Adjusting Medicare Capitation Payments Using Prior Hospitalization Data. Health Care Financing Review 10(4):17-30, August 1989.
Brown, R.S., Bergeron, J.W., Clement, D.G. et al.: The Medicare Risk Program for HMOs-Final Summary Report on Findings from the Evaluation. Contract Number 500-88-0006. Princeton. Mathematica Policy Research, Inc., February 1993.
Boles, E.: Insolvency in Managed Care Organizations: Financial Indicators. Topics in Health Care Financing 19(2): 40-57, Winter 1992.
Clement, D.G., Retch in, S.M., Stegall, M.H., and Brown, R.S.: Evaluation of Access and Satisfaction with Care in the TEFRA Program. Richmond. Williamson Institute for Health Studies, October 1992.
Hill, J.W., and Brown, R.S.: Biased Selection In the TEFRA HMOICMP Program. Princeton. Mathematlca Policy Research, Inc., September 1990.
Hill, J.W., and Brown, R.S.: Health Status, Finan· cial Barriers, and the Decision to Enroll in Medi· care Risk Plans. Princeton. Mathematica Polley Research, Inc., June 1992.
Hill, J.W., Brown, R.S., Chu, D., and Bergeron, J.W.: The Impact of the Medicare Risk Program on the Use of Services and Cost to Medicare. Princeton. Mathematica Policy Research, Inc., Oecember1992. Hurley, R.E., and Bannick, R.R.: Utilization Man· agement Practices in HMOs with Medicare Risk Contracts. Richmond. Williamson Institute for Health Studies, October 1992. Luft, H.S.: Health Maintenance Organizations: Dimensions of Performance. New York. John Wiley andSons,1981.
HEALTH CARE FINANCING AEVIEW/Fall1993/volume 15, Number 1 22
Manning, W.G., Liebowitz, A., Goldberg, G. et al.: A Controlled Trial of the Effect of a Prepaid Group Practice on Use of services. New England Journal ofMedicine310(23):1505-1511, June 1984.
McGee, J., and Brown, R.S.: What Makes HMOs Drop Their Medicare Risk Contracts? Princeton. Mathematica Policy Research, Inc., May ~992.
Retchin, S.M., Brown, R.S., Cohen, R. et al.: The Quality of Care in TEFRA HMOs/CMPs. Rich· mond. Medical College of Virginia, December 1992.
Shin, R.T., and Brown, R.S.: HMOs' Profits on Their Medicare Risk Plans. Princeton. Mathematica Policy Research, Inc., February 1993.
Stem, R.S., Juhn, P.l., Gertler, P.J., and Epstein, A.M.: A Comparison of Length of Stay and Costs for Health Maintenance Organizations and Fee-for-service Patients. Archives of Internal Med· icine 149:1185-1188, May ~989.
Reprint requests: Randall S. Brown, Ph.D., Mathematics Policy Research, Inc., 101 Morgan Lane, Plainsboro, New Jersey 08536.
HEALTH CARE FINANCING REVIEW/Fa111993/Volume15,Number1 23