do employers prefer undocumented workers? evidence from ...ftp.iza.org/dp8289.pdf · do employers...
TRANSCRIPT

DI
SC
US
SI
ON
P
AP
ER
S
ER
IE
S
Forschungsinstitut zur Zukunft der ArbeitInstitute for the Study of Labor
Do Employers Prefer Undocumented WorkersEvidence from Chinarsquos Hukou System
IZA DP No 8289
June 2014
Peter KuhnKailing Shen
Do Employers Prefer
Undocumented Workers Evidence from Chinarsquos Hukou System
Peter Kuhn University of California Santa Barbara
NBER and IZA
Kailing Shen WISE Xiamen University
and IZA
Discussion Paper No 8289 June 2014
IZA
PO Box 7240 53072 Bonn
Germany
Phone +49-228-3894-0 Fax +49-228-3894-180
E-mail izaizaorg
Any opinions expressed here are those of the author(s) and not those of IZA Research published in this series may include views on policy but the institute itself takes no institutional policy positions The IZA research network is committed to the IZA Guiding Principles of Research Integrity The Institute for the Study of Labor (IZA) in Bonn is a local and virtual international research center and a place of communication between science politics and business IZA is an independent nonprofit organization supported by Deutsche Post Foundation The center is associated with the University of Bonn and offers a stimulating research environment through its international network workshops and conferences data service project support research visits and doctoral program IZA engages in (i) original and internationally competitive research in all fields of labor economics (ii) development of policy concepts and (iii) dissemination of research results and concepts to the interested public IZA Discussion Papers often represent preliminary work and are circulated to encourage discussion Citation of such a paper should account for its provisional character A revised version may be available directly from the author
IZA Discussion Paper No 8289 June 2014
ABSTRACT
Do Employers Prefer Undocumented Workers Evidence from Chinarsquos Hukou System
We study urban Chinese employersrsquo preferences between workers with and without a local residence permit (hukou) using callback information from an Internet job board serving private sector employers We find that employers prefer migrant workers to locals who are identically matched to the jobrsquos requirements these preferences are especially strong at low skill levels We argue that migrantsrsquo higher work hours and effort help to account for employersrsquo preferences and present evidence that efficiency wage and intertemporal labor substitution effects might explain these hourseffort gaps JEL Classification O15 R23 Keywords temporary migration China hukou undocumented migrants Corresponding author Peter Kuhn Department of Economics University of California Santa Barbara Santa Barbara CA 93106 USA E-mail pjkuhneconucsbedu
This research is supported by National Natural Science Foundation of China through Grant No 71203188 titled ldquoImpacts of Hukou Education and Wage on Job Search and Match Evidence Based on Online Job Board Microdatardquo Both authors contributed equally to the research in this paper
ldquoId rather hire a foreigner - they push themselves morehellip The mentality is just different
Those who come from overseas have this huge drive to succeed When you come here
your family expects you to succeed no matter what You cant come here the land of
opportunity and fail Theyll think youre crazyrdquo -- Ola Ayeni founder of startup
Eateria reported on CNNMoney February 7 2013
1 Introduction
A common claim in popular discussions of immigration is that employers prefer
to hire workers with limited residency rights ndashsuch as those on temporary visas and
undocumented entrantsmdashover equally qualified natives because these migrant workers
are willing to work harder for longer hours and for less pay Perhaps surprisingly this
claim has apparently not been directly assessed in the vast empirical literature on
immigration whether in the US or in other countries One reason of course is that
workers with limited or nonexistent documents and the firms employing them may have
incentives to hide their status from investigators Another reason is the scarcity of firm-
level data on immigrants especially data on applicant pools with information on visa
status
Studying how workers with limited residency rights fare in the hiring process
does more than address a common claim in public discourse It also provides useful
evidence on the causes of immigrant-native gaps in employment and wages more
generally and contributes specifically to our understanding of the economics of
temporary migration-- an growing and important aspect of migration that has been
relatively overlooked As Dustmann (2000) has pointed out the incentives facing
temporary migrants differ substantially from those facing permanent migrants favoring
large responses on hours and effort margins among the former versus investment in host-
region-specific skills in the latter Since the legal status of the migrant workers we study
strongly discourages them from forming permanent ties with the host economy they
represent a group whose ex ante intentions to stay in the host region are likely very low
such groups can be hard to identify empirically but shed useful light on the temporary
migration process
Specifically this paper studies employersrsquo choices between workers with and
without permanent residency rights in an important but understudied context Chinarsquos
cities As is well known Chinarsquos cities have experienced massive in-migration over the
past several decades Indeed in some large cities migrants constitute a majority of the
employed population A unique and less well known feature of this migration is that
unlike the US and unlike many other developing nations Chinese people do not have
the right to permanently reside in any part of the country Instead each person is born
with a city or province of permanent registration (hukou) While this does not prevent
people from migrating to other jurisdictions for temporary work it places severe limits on
their ability to settle permanently in any location other than the one corresponding to their
birth hukou Since a workerrsquos hukou status is relatively public information Chinarsquos
2
internal migration system provides a unique laboratory in which to study employersrsquo
preferences between workers with different residency rights
To that end this paper uses internal data from the main Internet job board of
Xiamen a medium-sized prosperous Chinese city about the size of Los Angeles to pose
the following question Among equally qualified local hukou (LH) versus non-local
hukou (NLH) candidates who have applied for the same job which applicants are more
likely to receive an employer contact Our main finding is that employers on this job
board which caters to private-sector firms prefer workers without a permanent residence
permit over equally-matched permanent residents specifically there is a robust difference
in callback rates of about 14 percentage points or 20 percent While possible
explanations of this gap include within-job wage discrimination against migrants
positive selection of migrants and higher work effort among migrants we argue that it is
hard to explain the patterns in the data without at least some role for the latter factor To
our knowledge ours is the only paper to study employersrsquo hiring choices between
workers with and without permanent residency rights in any jurisdiction1
Section 2 provides some background on Chinarsquos hukou system both nationally
and as it applies to our study city Section 3 describes our data and methods while Section
4 presents the main results Section 5 discusses possible causes for employersrsquo NLH
preference in our data while Section 6 concludes
2 What is Hukou
21 Hukou in China
Hukou is the legal right to permanently reside in a province or city It is inherited
from a parent (historically the mother) regardless of where one is born and is very
difficult to change For example neither long periods of residence in a new location or
marriage to a person of different hukou are sufficient to change onersquos hukou The
institution of hukou is ancient dating back to Shang dynasty (1617 BC ndash 1046 BC) and
was originally used by local rulers to prevent emigration More recently under Chinarsquos
planned economy hukou was extensively used by the central government to restrict
internal migration while nowadays it is primarily migrant-receiving provincesrsquo and
citiesrsquo hukou-based policies that constrain migrantsrsquo rights While Chinese workers are de
facto relatively free to migrate and take jobs in areas where they do not have a permanent
residence permit both state and city governments have created a set of rules that
distinguish between local hukou (LH) and non-local hukou persons (NLH) in a number of
key markets including those for housing labor education and health Local governments
1 Borjas and Tienda (1993) Rivera-Batiz (1999) Kossoudji and Cobb-Clark (2002) and Barcellos (2010)
study the effect on workers of acquiring legal status in the US While they generally find that workersrsquo
labor market outcomes improve as a result of legalization they do not address the question of which type of
workers employers prefer to hire holding qualifications fixed Oreopoulos (2011) studies Canadian
employersrsquo choices between natives and persons with Asian-sounding names but the latter are
predominantly legal permanent residents
3
also set the rules for how migrants can acquire a local hukou2 Since China is to our
knowledge the only major country where residency rights are allocated by sub-national
governments it provides a unique opportunity for the study of migration and migration
policy
One main set of legal differences between LH and NLH persons in most Chinese
jurisdictions is in eligibility for government-provided benefits and services For example
access to public primary education (9 years) is generally guaranteed only to persons with
local hukou NLH children are sometimes accommodated if space is available but
availability can be highly limited in the major migrant-receiving cities3 And since most
social insurance programs including public retirement benefits medical insurance
unemployment insurance industrial injury insurance and childbirth benefits are all
administered by Chinarsquos provincial and city governments migrants are treated differently
by these programs as well Typically this involves both lower benefits and lower payroll
taxes Also despite recent attempts to improve access and portability some benefits that
have been earned can be hard to access For example it can be difficult to claim
retirement benefits earned in a city after leaving it
The second main set of legal distinctions between NLH and LH persons is a
patchwork of rules limiting migrantsrsquo access to certain labor and real estate markets
Hukou-based restrictions apply in many urban housing markets including long waiting
periods before a non-local is allowed to buy a home4 In addition a variety of formal and
informal restrictions affect the types of jobs NLH workers are allowed to take While
often hard to document officially a variety of sources report explicit or implicit bans in
Beijing on hiring NLH persons as taxi drivers hotel front desk personnel lawyers and in
Kentucky Fried Chicken stores Some state-owned enterprises as well as provincial and
city governments are claimed to favor LH workers and occasionally will even announce
explicit LH quotas5 These and other features of Chinarsquos hukou system continue to
2 The main pathways for acquiring hukou in a new location are through family relationships business
investment and targeted labor recruitment though in all cases the barriers are steep Waiting periods for
family cases can be as long as 15 years Local governments sometimes make small numbers of local
hukous available to businesses in exchange for major investments and sometimes offer expedited access to
designated categories of lsquohighly skilledrsquo individuals state-owned enterprise (SOE) employees and local
government employees 3 Access to public high schools is usually very limited for NLH children though exceptions are made for
lsquohighly desired talentsrsquo That said even NLH children who gain access to urban primary schools often
choose to return home for high school in order to prepare for college admission exams which must be
taken in the official hukou location 4 In Beijing and Shanghai for example non-local hukou holders must be in the local social insurance and
payroll tax system for a pre-specified period of time before being allowed to buy a home Similar
restrictions apply to entering the lottery for a car license plate In at least some cities eligibility for public
and subsidized housing is restricted to LH persons only 5 See Huang (2010) regarding lawyers and Aimeiaishenghu (2013) regarding taxi drivers Hukou-based
requirements for hotel front desk personnel and KFC employment have been claimed by a number of
commentators on social media Aluminum Corporation of China (2012) is an ad for new college and
university graduates placed by a large SOE The company advertises an explicit recruitment quota of 30
percent LH and 70 percent NLH but adds the following note at the bottom of the ad ldquoNote Beijing
students education can be relaxedrdquo
4
evolve rapidly For a more detailed discussion of the institutionrsquos history and ongoing
evolution see Chan and Buckingham (2008) Bao Bodvarsson Hou and Zhao (2009) or
Deacutemurger and Xu (2013)
The LH and NLH populations of Chinarsquos major cities are described in Table 1
which is calculated from 2005 Census microdata Column 1 (LH) shows characteristics
of all working-age persons who have a permanent residence permit in their current city of
residence Column (2) (NLH) is for the remainder of urban residents whose hukou
registration is elsewhere most but not all of these persons are rural-urban migrants from
poorer parts of China In the following discussion we also refer to LH and NLH persons
as natives and migrants respectively
A first observation from Table 1 is that NLH workers form a large share of the
population of Chinarsquos major cities 51 of these citiesrsquo residents and 57 of their
employed residents do not have a local hukou In addition migrants are much younger
than natives and have much less education 48 percent of migrants are 35 or younger
compared to 30 percent of natives Sixty-four percent of migrants have at most a junior
middle school education (9 years) compared to 38 percent of natives Several statistics in
Table 1 show a much higher level of labor force commitment among migrants than
natives For example 77 percent of working-age migrants are employed compared to 62
percent of urban natives Seventy-six percent of migrantsrsquo income comes from the labor
market compared to 61 percent for working-age urban LH persons Among persons who
work migrants put in an average of 4914 hours per week compared to 4410 for urban
natives Finally 57 percent of NLH workers worked more than 40 hours per week
compared to just 30 percent of natives
Reflecting the differential treatment by the social insurance system discussed
above Table 1 also shows that many fewer migrants are eligible for social insurance
coverage This difference occurs despite their higher levels of labor force commitment --
which under a uniform policy would qualify more of them for benefits-- and applies
separately to unemployment insurance medical insurance and public pension coverage
Reflecting both this lower eligibility and their higher rates of labor force participation
only 6 percent of working-age migrantsrsquo income was from public transfers compared to
23 percent of working-age nativesrsquo Unsurprisingly employed migrants also have less
formal work arrangements Only (33+15=) 48 percent have any form of employment
contract compared to 74 percent of natives and the duration of their contracts is much
shorter Finally consistent with the notion that NLH workers face barriers to public
sector employment only 22 percent of employed migrants work in the public sector or in
SOEs compared to 62 percent of employed urban natives As we shall argue this strong
tendency for urban natives to cluster in non-private-sector jobs provides an important
context for our results in this paper which as already noted apply to private-sector jobs
only
5
22 Hukou in Xiamen
During the period of our data (July 2010 to June 2011) LH and NLH workers in
our study city Xiamen paid the same mandatory payroll taxes for unemployment
insurance workerrsquos compensation and childbirth benefits and were entitled to the same
benefits under these programs The two most important social insurance programsmdash
retirement and medical insurancemdashhowever provided much lower benefits to NLH
workers but also levied lower payroll taxes on those workers Since these tax and
benefit differences could affect employersrsquo preferences between LH and NLH workers
we detail their structure in Section 5 of the paper Both NLH and LH children enjoy free
tuition in Xiamenrsquos elementary and junior middle schools but LH children have priority
in admissions any places not filled by LH children are assigned by lottery among NLH
children In practice this can severely restrict access to NLH children6 NLH personsrsquo
access to housing markets is also restricted in Xiamen mainly by the fact that persons
without local hukou may currently purchase a maximum of one apartment this
constitutes an important difference between locals and migrants because real estate
investments are reportedly a significant income source for many local residents Routes
for NLH workers to acquire Xiamen hukou are similar to other major migrant receiving
areas though certainly less restrictive than the lsquohottestrsquo migration destinations including
Beijing Shanghai and Guangzhou (BeiShangGuang)
Descriptive statistics on Xiamenrsquos LH and NLH populations are provided in
columns 3 and 4 of Table 1 which replicate columns 1 and 2 for the city of Xiamen only
As in other major cities Xiamenrsquos NLH population is younger less well educated more
likely to be employed yet less likely to have social insurance coverage than its working-
age native population When employed migrants work much longer hours (74 percent
put in more than 57 hours per week) and have less formal and permanent employment
arrangements Xiamen has an even larger NLH population share than other major cities
constituting 56 percent of its residents and 61 percent of its workers
With 21 and 23 percent of its LH population employed in public sector jobs and
SOEs respectively Xiamenrsquos native workers are actually less concentrated in the broader
public sector than in other major cities (where the comparable numbers are 21 and 41
percent) Still as in other cities Xiamenrsquos NLH workers are dramatically
underrepresented in public- and quasi-public sector jobs only 4 percent of them have
public sector jobs and 11 percent work in SOEs While we are aware of no formal
restrictions excluding NLH workers from public sector jobs in Xiamen this gap suggests
that some hiring preferences similar to those documented in Beijing might exist in
Xiamen also
6 For example Xiamen News Net (2013) documents an August 27 2013 protest where several hundred
NLH parents blocked the entrance road to a Xiamen primary school demanding access for their children
In part because NLH students can only take college entrance exams in their home provinces and since the
materials the admission process and admission rates vary across provinces NLH students typically do not
attend high school in Xiamen
6
In sum in Xiamen as in most major migrant-receiving cities in China the hukou
system is relatively accommodating to unattached persons who wish to work in the city
for a limited period of time in fact it even includes NLH workers ndashat reduced tax and
benefit rates-- in its social insurance system At the same time Xiamen limits migrantsrsquo
access to some key public benefits ndashespecially education and retirement benefitsmdashin
ways that can make it hard for NLH workers to put down roots and raise a family
Xiamen also appears to make it hard for NLH workers to get jobs in the broader public
sector (government plus SOEs) While Xiamen is perceived as being somewhat more
welcoming to NLH workers than larger destination cities like Beijing and Shanghai
official policy goals of the local government still appear to place different weights on the
welfare of native and migrant workers Specifically local labor market policy objectives
tend to emphasize protection of LH workers such as reducing unemployment and
assisting displaced workers while objectives involving NLH workers emphasize their
role as a source of labor supply to allow industrial growth7 Naturally one would expect
these policy differences to affect both the type of worker who migrates to Xiamen as an
NLH worker and those workersrsquo labor market behavior after they arrive We explore
these differences in the remainder of the paper
3 Data and Methods
31 Xiamen and XMRC
The city of Xiamen had a 2010 Census population of 35 million and forms the
center of a prosperous metropolitan area of 168 million people on Chinarsquos southern coast
In part because Xiamen was one of the five economic zones established immediately
after the 1979 economic reforms that opened China to the international economy the city
is highly modernized and integrated into the world economy relative to most similarly-
sized Chinese cities While considerably smaller in population than Beijing and
Shanghai Xiamenrsquos income levels are relatively close to those citiesrsquo with 2010 GDP
per capita at 58337 RMB compared to 75943 and 76074 RMB for Beijing and
Shanghai respectively
XMRC (httpwwwxmrccomcn) the job board that is the source of our data is
a for-profit company sponsored by the local government While its primary mandate is to
serve the market for skilled private-sector workers in the Xiamen metropolitan area in
fact it serves private-sector employers seeking workers with a wide range of skills
XMRC operates like a typical US job board with both job ads and resumes posted
online Workers and firms can contact each other to submit applications arrange
interviews etc through the site8
7 For example a 2007 statement on ldquoImproving Employment and Re-employmentrdquo includes the following
targets specifically for LH workers an unemployment rate of under 4 percent and a re-employment rates
for displaced and lsquohard-to-employrsquo LH workers of at least 60 Goals involving NLH workers in the same
statement mostly focus on increasing the total numbers employed 8 The other main employment service in the Xiamen area is XMZYJS (the Xia-Zhang-Quan 3 city public
job board wwwxmzyjscom) that is operated directly by local government employees of the local labor
7
Our analysis sample is extracted from XMRCrsquos internal database Specifically
we asked XMRC to provide us with all the ads for jobs in Xiamen that received their first
application between May 1 and October 30 2010 Then we asked XMRC to provide us
with all the resumes that applied to those ads plus information on all the firms that
posted those ads We also have a mapping of which resumes applied to which ads and a
record of which resumes were contacted by each firm through the XMRC website
Receiving such a contact is our indicator of worker success in the hiring process9 To
ensure that we capture all contacts resulting from applications made during our sampling
window we continued to monitor all the ads posted during that window until January 13
2011 (74 days after Oct 30 2010) Most contacts occur very quickly however (within 2
weeks of application) Finally since our interest is in which workers are selected by firms
for interviews or employment the sample of ads used in this paper restricts attention to
ads that resulted in at least one worker being contacted by the firm10
Other criteria used in constructing our analysis sample include excluding ads with
a minimum requested age below 18 or a maximum requested age over 60 ads offering
more than 10000 yuanmonth ads requesting a masterrsquos professional or PhD degree (all
of these were rare) ads for more than 10 vacancies (since job descriptions tended to be
vague) ads for jobs located outside the city of Xiamen and ads with missing firm
information We also dropped resumes listing a current wage above 12500 yuanmonth
with missing hukou information or with non-Chinese citizenship as well as applications
that couldnrsquot be matched to both an ad and a resume Finally we dropped a small number
of XMRC ads for jobs in State-Owned Enterprises and Not-for-Profit organizations
Despite being a substantial share of employment in Xiamen ads for SOE jobs are very
rare on XMRC as most recruiting for these positions goes through other channels Thus
our results refer to hiring for private-sector jobs only
32 Sample characteristics
In all our data consist of 237128 applications that were made by 82113 workers
(resumes) to 3708 ads placed by 1653 firms Sample means are presented in Table 2
separately for workers with local and non-local hukou A first important fact from Table
2 is that the XMRC site is populated primarily with ads from workers without Xiamen
hukou in fact about 919 percent of the applications are from workers without local
hukou This preponderance of NLH workers while at first glance surprising is less so
bureau Its mandate is to serve less-skilled workers reflecting this XMZYJS does not post worker
resumes and does not allow firms and workers to contact each other via the site Indeed a large component
of the services provided by XMZYJS is brick-and-mortar offices where workers can go to view job
postings and meet with employers 9 Since only about 8 percent of applications in our sample result in such contacts we interpret these
contacts as a relatively strong interest on the firmrsquos part in hiring the worker Conversations with XMRC
officials support this interpretation as does evidence in all our regressions (detailed below) that the
probability of contact is strongly and positively related to the quality of the match between workersrsquo
characteristics and the jobrsquos advertised requirements 10
No responses could mean the firm didnrsquot hire during our observation period or they contacted successful
workers using means other than the job board
8
when we recall that 61 percent of Xiamenrsquos employed population does not have local
hukou and that posting a resume on an Internet job board such as XMRC would be a
natural port of entry into Xiamenrsquos labor market for workers from outside the city
Indeed the fact that many of the NLH applicants on XMRC could be applying from a
distance makes our result that firms seem to prefer NLH applicants even more
surprising11
Overall Table 2 shows that 71 percent of applicants with local hukou are
contacted by firmsrsquo HR departments when they apply for a job This figure rises to 85
percent among applicants without local hukou Put a different way in the raw data NLH
workers have a 20 greater chance of receiving a callback when they apply for a job
Users of XMRC are highly qualified even by urban Chinese standards Focusing first on
the NLH workers the mean applicant has 144 years of education and a mean wage in
hisher current job (among the 69 of applicants who list a current wage) of 2263 yuan
per month These workers are applying to jobs with a mean minimum education
requirement of 125 years and with a mean advertised wage of 2372 yuan (for ads where
the wage is advertised) Our sample of applicants is also very young with a mean age
under 25 years this reflects the tendency for both jobseekers and internet users to be
younger than the average worker Nineteen percent are new graduates On average when
the number of positions available was specified about 21 positions were available per
ad
While most of the differences between LH and NLH workers in Table 2 are
statistically significant due to the large sample sizes in the vast majority of cases the
differences are quantitatively very small and exhibit few clear patterns One substantial
difference however is that NLH workers are younger and more likely to be new
graduates which is perhaps not surprising since the early career may be the time when
workers seek to relocate to a new city
Part (b) of Table 2 illustrates the detailed list of applicant characteristics that are
measured in our data Among these characteristics are several that are rare in other data
sets including the applicantrsquos current wage height an indicator for myopia the number
of schools attended experience spells and professional certifications In addition a
unique feature of our data is that we observe each applicantrsquos level of qualification within
hisher occupation or zhicheng Zhicheng is a nationally-recognized system that assigns
an official rank (from one through six) to workers in almost every occupation While
education and experience play key roles in many occupationsrsquo ranking schemes several
professions also use government-organized nationwide or province-wide exams both to
qualify for and to maintain onersquos zhicheng rank12
11
Unfortunately our confidentiality agreement with XMRC does not allow us to determine where
applicants are living when they apply to jobs via the website 12
In addition to providing a summary index of workersrsquo skills workersrsquo zhicheng ranks can also confer
direct benefits to the firm For example construction firms are required to have certain minimum number
of construction managers above a certain zhicheng rank to be permitted to do projects of a given type
9
Comparing Tables 1 and 2 our sample of applicants on XMRC differs from the
employed population of Xiamen in at least two important ways One already noted is
that despite being a substantial share of jobs in the city public sector and SOE jobs are so
rarely posted on XMRC that we excluded them from our analysis sample Second
applicants on XMRC are much younger and better educated than Xiamenrsquos employed
labor force Specifically the mean applicant on XMRC is 25 years old while less than
20 percent of Xiamenrsquos working population is under 25 And XMRCrsquos applicants have
over 14 years of education on average while over 70 percent of Xiamenrsquos workers have
12 or fewer years One reason for this difference is the fact that any sample of jobseekers
is likely to be younger than the stock of currently employed workers combined with the
massive recent expansion of higher education in China13
Another reason is that young
highly educated workers are more likely to look for work on line than other workers
(Kuhn and Skuterud 2004 Kuhn and Mansour 2013) Overall however despite the fact
that both the LH and NLH workers on our site are on average considerably more skilled
than existing Xiamen workforce the similarity of LH and NLH applicants in our sample
should help us identify the pure effect of the applicantrsquos official residency status on his or
her success in the job search process
33 Methods
Our sample for the analysis of employer callback decisions is the 237128
applications summarized in Table 2 In this sample we estimate linear probability
regressions for whether the applicant received a callback as a function of the
characteristics of the firm placing the ad the characteristics of the ad itself (primarily the
stated job requirements and the employerrsquos preferred employee demographics) the
characteristics of the applicant the match between the jobrsquos requirements and the
applicantrsquos characteristics and the level of competition for the job (number of applicants
and number of positions available) Thus our approach is similar to that of
correspondence studies (Bertrand and Mullainathan 2004Oreopoulos 2011) in that we
study firmsrsquo callback responses to a set of resumes with some key differences On the
minus side migrant status in our approach is not randomly assigned to resumes that are
otherwise constructed to be as identical as possible thus we need to rely on our extensive
list of controls for ad and job characteristics On the plus side the population of
naturally-occurring resumes in our sample avoids well known problems with audit
studies including the credibility of resumes and the tendency for those studies to focus
on narrow ranges of occupations only limiting their generalizability In contrast to audit
studies we also observe the complete pool of applications submitted to a job (at least via
XMRC) not just the ads that are crafted and submitted by the investigator
In all our regression tables we present a series of specifications with increasingly
detailed controls the most saturated of which includes a fixed effect for every ad in the
13
See Kuhn and Shen (2013) for some statistics on Chinarsquos recent higher education boom
10
dataset14
In that specification our estimated coefficients compare the callback rates of
LH and NLH workers who have applied to the same job controlling for a long list of
worker characteristics and their match with the advertised job requirements
4 Results
Table 3 presents estimates of linear probability regressions in which the
dependent variable equals one if the applicant was contacted by the firmrsquos HR
department after applying to the ad15
Column 1 contains no regressors other than NLH
it replicates Table 2rsquos finding that on average NLH workers were 14 percentage points
(or twenty percent) more likely to receive an employer contact than LH workers Column
2 adds controls for basic characteristics of the job ad (specifically the requested levels of
education age experience gender and whether a new graduate is sought) plus measures
of the match between those characteristics and the workerrsquos actual characteristics16
Unsurprisingly we find that workers with less than the required level of education and
experience are less likely to receive a callback than workers who lsquoexactlyrsquo meet the
firmrsquos hiring criteria17
Perhaps more surprisingly workers who have more than the
requested level of education are also less likely to be contacted Workers outside the
firmrsquos advertised age range for the job are also less likely to be contacted regardless of
whether they are older or younger than the range Having less than the required level of
experience and not being of the desired gender also reduce an applicantrsquos chances of
being contacted by the firm18
Column 3 adds controls for a more detailed set of CV characteristics that are
available in our data These are whether the applicant attended a technical school the
applicantrsquos zhicheng rank (6 categories) whether the CV is in English the number of
schools attended the number of job experience spells and the number of certifications
reported The following characteristics are also included both as main effects and
interacted with the applicantrsquos gender myopia height and marital status Adding these
detailed controls for the applicantrsquos qualifications leaves the NLH coefficient essentially
unchanged the same is true when occupation fixed effects (for the job) are added in
column 4
14
This specification of course vitiates the need to control for job characteristics 15
Note that firms may contact more than one applicant for a job either because they have not finalized the
selection process or they are filling more than one vacancy Recall also that applicants who were contacted
via methods other than the website (such as telephone) will be treated as not being contacted in our data
This could be an issue if firms tend to use different methods to contact LH versus NLH workers We
explored this issue in discussions with XMRC officials who stated that this was highly unlikely The
marginal financial cost of contacting an applicant anywhere in China is zero both by telephone and via the
site and recruiters generally find it easiest to issue all callbacks to the same job in the same way 16
In addition to the regressors shown in Table 3 columns 2-6 also include controls for the advertised wage
and its lsquomatchrsquo with the applicantrsquos current wage and a dummy for whether this wage information is
missing The NLH coefficients are not affected by whether we include or exclude these controls 17
Education is measured in six broad categories so an exact match simply means the same broad category
An exact experience match is defined as having the desired experience level or up to three years more 18
We also ran regressions where we added controls for the total amount of over- and underqualification
(and its square) on all these dimensions The coefficients on hukou were very similar
11
Column 5 of Table 3 adds two indicators of the amount of competition for the job
in question specifically the number of positions available and the number of persons who
applied to the ad Both have strong effects in the expected directions but their inclusion
does not change the NLH coefficient Column 6 adds fixed effects for the firm that
posted the ad Once again the NLH coefficient is essentially unchanged and remains
highly statistically significant Finally column 7 adds a full set of job ad fixed effects
thus as noted we are now effectively comparing the success rates of LH and NLH
workers who have applied to the same job ad Again the NLH coefficient is essentially
unchanged from the previous column Interestingly the similarity of the column 6 and 7
results means that NLH workers do not disproportionately direct their applications to ads
in which they are more likely to receive an employer contact19
Instead NLH workers
seem to apply to the same mix of jobs but achieve differential success when they get
there
In sum Table 3 presents robust evidence that NLH workers have a higher chance
of receiving an employer callback than observationally-equivalent LH workers when both
groups of workers are competing for the same private-sector job In the following
section we consider the plausibility of various explanations for this gap by exploring
how the size of the gap varies across types of ads firms and workers
5 What Explains Firmsrsquo Preferences for NLH Workers
51 Discriminatory Tastes
It is of course possible that employers co-workers or customers have differential
tastes for interacting with migrant versus local workers All available evidence however
suggests that if anything Chinese urban residents are either indifferent or have some
distastes for interacting with non-local workers (Dulleck Fooken and He 2012 Tse 2014
Goerg and Chmura in progress) Since tastes of this nature should raise nativesrsquo hiring
rates above migrantsrsquo they cannot explain employersrsquo revealed preference for NLH
applicants in our data20
52 Payroll tax differentials
As noted LH and NLH workers are treated differently by Xiamenrsquos retirement
and medical insurance programs Specifically LH workers and their employers
contributed 8 and 14 of the workerrsquos actual average monthly salary respectively to
the retirement insurance program for NLH workers these contributions are both 8
19
Some search models of discrimination such as Lang Manove and Dickens (2005) have the property that
in equilibrium groups that anticipate encountering discrimination in the hiring process direct their search
towards lower-wage jobs 20
That said we do not expect high levels of taste-based discrimination in our sample largely because a
large majority (74 percent) of the NLH workers in our sample come from Fujian province in which
Xiamen is located This similarity suggests that Xiamenrsquos NLH workers might provide a cleaner test of the
lsquopurersquo effects of temporary residence status than studies of other temporary migrants such as
undocumented workers or H1-B visaholders in the US
12
percent of the monthly minimum wage (900 RMB)21
Similarly LH workers and their
employers contribute 2 and 7 respectively of their average actual monthly salary to
medical insurance while NLH workers and their employers each contribute 2 of the
monthly minimum wage each month22
As a result NLH workersrsquo combined retirement
and medical payroll tax rate was about 44 percent of LH workersrsquo rate near bottom of the
earnings distribution in our sample (specifically at 1500RMB per month) This tax
advantage increases monotonically with the level of monthly earnings near the top of
the earnings distribution (at 5000RMBmonth) NLH workers incurred only 16 cents of
tax for every 100 cents paid by LH workers23
Theoretically the effect of differential payroll taxes on the relative callback rates
of LH and NLH workers depends on whether firms can wage discriminate on the basis of
residency status If they can the payroll tax gap should have no effect since employers
can simply adjust wages to compensate for any gap24
If firmsrsquo ability to wage
discriminate between native and migrants is limited however firms should prefer NLH
applicants to equally qualified LH applicants25
Moreover due to the structure of payroll
taxes in Xiamen the strength of these preferences should increase with a jobrsquos skill
requirements
To assess this hypothesis Table 4 estimates a different effect of NLH status for
each of the five levels of required education for the job while Table 5 does the same for
six different advertised wage levels For both wages and education levels we find the
opposite pattern from what is predicted by NLH workersrsquo payroll tax advantage firmsrsquo
revealed preferences for NLH workers are considerably stronger at low skill levels than
higher ones This pattern is more pronounced across wage than education levels while
the NLH advantage is present in all education groups except university graduates it is
confined to jobs offering under 3000 yuan per month Firms recruiting for very high-
wage jobs where NLH workersrsquo payroll tax advantage is the highest do not have a
systematic preference for NLH workers Given these patterns which are inconsistent
with a payroll tax-based explanation we consider other possible explanations of firmsrsquo
NLH preference below
21
LH workersrsquo retirement- and UI-taxable earnings are capped at three times the city average wage
(9114RMBmonth) less than one percent of the ads or workers in our data are affected by this cap 22
Informally the rationale for these differentials seems to be to mimic benefit levels in migrantsrsquo home
regions which are generally much lower than in the coastal cities In addition as one local official
expressed the number of migrant workers is so large and many of them will never use retirement and
medical insurance benefits due to their age structure and migration pattern 23
Some of these tax policies have been adjusted since our data was collected partly in response to a
perception that they negatively affected some LH workersrsquo employment prospects Specifically Xiamenrsquos
government recently moved in the direction of eliminating payroll tax differentials between LH and NLH
workers by granting NLH payroll tax rates to firms hiring lsquoemployment-disadvantagedrsquo LH workers LH
new college graduates and LH workers in public service jobs 24
The extent to which this wage discrimination actually hurts native workers depends on the extent to
which they value the additional social benefits attached to their higher tax rates (Summers 1989) 25
Notice also that if firms cannot wage-discriminate only the employerrsquos share of the payroll tax should
affect their decision on whom to hire Incidentally adjusting offered wages to cancel out the LHNLH
payroll tax differential is explicitly prohibited in Xiamen and is subject to large fines
13
53 Wage differentials
If NLH workersrsquo lower tax cost cannot explain their callback advantage what
about their relative wage costs Is it possible that firms systematically prefer NLH
applicants simply because they can hire them for a lower wage In this section we
describe two ways in which a wage gap might account for the NLH hiring advantage
They are based on the possibility of LH-NLH wage differentials between jobs (ie ads)
and within jobs respectively
Turning first to between-job wage variation one scenario that might account for a
higher NLH hiring rate is a situation where NLH workers disproportionately apply to
lower-wage jobs and where lower-wage jobs on average are easier to get (ie they have
higher callback rates) A closely related possibility is a scenario where firms engaging in
monopsonistic wage discrimination (or for that matter firms who want to protect native
workersrsquo wages while still benefiting from cheaper migrant labor) create distinct job
categories tailored to the two groups26
If migrants apply mostly to the lower-wage
categories where the hiring rate is higher that could account for our main result
While these seem like plausible scenarios they are not likely explanations for the
NLH hiring advantage in our data for at least two reasons First all our estimates control
for the level of both the advertised wage and the applicantrsquos current wage27
Second if
firms wage-discriminate against NLH workers by posting separate (lower-wage) job ads
specifically tailored to them then the estimated NLH hiring advantage should decline in
size when we replace the firm fixed effects in column 6 of Table 3 by job ad fixed effects
in column 7 As already noted they do not Put a different way the fact that the NLH
hiring advantage persists within ads rules out explanations based on the idea that NLH
workers disproportionately apply to lower-wage jobs which may be easier for them to
get
Next we turn to the possibility of within-job wage discrimination ie the possibility
that firms might prefer NLH workers over LH workers who have applied to the same job
if they can subsequently hire the NLH worker for a lower wage While we cannot
measure the amount of within-job wage discrimination directly it seems likely that this
type of discrimination is more difficult in posted-wage jobs than in jobs where the wage
is not specified in the ad28
If that is the case then firmsrsquo preferences for NLH workers
should be weaker in posted-wage jobs
26
Wage discrimination against migrants can be profit-maximizing if migrants supply labor less elastically
to the firm See for example Hotchkiss and Quispe-Agnoli (2009) Hirsch and Jahn (2012) and Depew et
al (2013) 27
Strictly speaking the estimates in Table 3 only control for the advertised and current wage when each
variable is available in the data (which is the case for 59 and 69 percent of applications respectively) The
results are very similar however when we estimate the Table 3 on the subsample of observations where
both variables are present 28
Note that within-job wage discrimination is typically ignored in correspondence studies which cannot
ascertain whether different wages would be offered to different types of candidates at the interview stage or
later
14
To examine this hypothesis Table 6 estimates separate NLH effects on callback
rates to job ads with and without posted wages using the same regression specifications
as Tables 3-5 As it turns out the NLH hiring advantage is greater in posted-wage jobs in
some specifications and lower in others and the difference between posted- and non-
posted-wage jobs is never statistically significant at conventional levels (p-values are
reported in the bottom row of the Table) We interpret this as evidence against within-job
wage discrimination as the primary reason why firms exhibit a preference for NLH
workers We also note that a widespread and robust feature of job board data including
the data in this paper is that wage posting is much more common in unskilled than
skilled jobs29
If the disproportionate use of posted wages in unskilled jobs indicates a
greater overall reluctance by firms to engage in individual wage negotiation in less-
skilled jobs a scenario based on within-job wage discrimination faces challenges in
explaining why the NLH hiring advantage is greatest in the least-skilled jobs Relative to
skilled jobs wages in those jobs are more likely to be set by inflexible rules than by
individual negotiation
54 Selection
Another reason why similarly-qualified migrants might be preferred to locals is
selection While we have a detailed set of controls and while our LH and NLH samples
have very similar observable characteristics it is still possible that migrants have on
average higher unobserved skills That said selection on unobservables faces at least two
challenges as an explanation of the NLH advantage in our data First note that even if
migrants are positively selected relative to stayers in their home regions ndashas one would
expect for example from Borjasrsquos (1987) selection model when there is more inequality
in the receiving region-- this type of positive selection does not necessarily imply that
migrants will be more productive than natives with identical observables Second if
anything we would probably expect NLH workers to suffer deficits in education quality
connections (guanxi) and other destination-specific skills which would all appear as
negative selection on unobservables in our data
Still we acknowledge that positive selection on unobservables could be part of
the reason why NLH workers are more likely to receive employer callbacks than LH
workers in our data Persons who choose to migrate to a city especially in a capacity
where their temporary residence status excludes them from key components of the public
goods and social protections available to urban natives are likely to have a stronger work
ethic than their compatriots who remain behind
55 Hours and Effort
A final potential explanation of the NLH callback advantage is the possibility that
migrants and natives of identical ability differ in their effort and labor supply choices in a
29
See for example Brencic (2012) and Delgado Helleseter Kuhn and Shen (2014)
15
way that makes migrants more desirable to employers30
One possible source of such a
gap emerges from intertemporal labor supply models to the extent that NLH workers
face a significant prospect of returning to their (low-wage) region of origin NLH workers
face a wage that is temporarily high relative to other points in their lifetime This creates
an intertemporal substitution effect that should raise migrantsrsquo work hours and effort
relative to nativesrsquo at the same wage (Dustmann 2000) This prediction of longer work
hours among migrants is strongly supported by the Census data presented in Table 1
A second possible source of a migrant-native effort gap is an efficiency wage
effect to the extent that migrantsrsquo outside options are poorer than nativesrsquo migrants
should be willing to exert more effort to keep their jobs This will certainly be the case if
migrantsrsquo outside options consist primarily of jobs in their home regions but may apply
even if it is relatively easy for migrants to change jobs within the host city One reason is
that migrants are excluded from some key components of the urban social safety net
(Recall from Table 1 that NLH workers in Xiamen are much less likely to have
unemployment and medical insurance coverage) In addition migrants probably have
less wealth (including owned housing) than natives and Table 1rsquos employment statistics
suggest that migrants are excluded from a number of attractive secure public sector and
SOE employment options that are available to natives Finally note that the LH-NLH
gap in social insurance coverage is probably most relevant to workersrsquo outside options at
low skill levels which is precisely where employers have the strongest revealed
preference for NLH workers31
To explore the possible role of intertemporal labor supply effects Table 7
provides separate estimates of the NLH hiring advantage by applicant gender and marital
status The idea is to compare groups who potentially have more flexibility to work
extremely long hours and at high intensity (men and single women) to a group that might
be less able to do so (married women) If the flexibility to work long intense hours
explains why firms prefer NLH workers we might expect to see a smaller NLH
advantage among married women than among other groups Interestingly in the absence
of controls (column 1) we find that the NLH advantage is indeed statistically significant
for men and for single women but insignificant for married women Further menrsquos NLH
advantage is twice as large as womenrsquos and the gap between menrsquos and married
womenrsquos NLH advantage is highly statistically significant In the most saturated
specification (column 7) the same pattern of statistical significance appears but a very
noisy estimate for married women makes it impossible to conclude that they have a lower
30
In general firms will prefer workers who choose higher effort levels or who will accept additional work
hours whenever employment contracts are incomplete ie as long as the pay rate per hour or piece gives
workers less than 100 of the surplus they generate at the margin 31
Another aspect of worker performance that might differ between LH and NLH workers is their expected
turnover rate While it is unclear whether we would expect LH or NLH workers turn over more frequently
in the short run the fact that hukou regulations make it difficult to settle down and raise a family suggests
that firms wishing to hire long-term workers might prefer LH workers To the extent that firm-specific
human capital is complementary with education and other indicators of general skills this could also help
explain why we estimate a weaker NLH preference at higher skill levels
16
NLH advantage In part this is because married women constitute only 67 percent of
our sample of NLH applicants compared to 477 365 and 93 for single women single
men and married men respectively We view this as suggestive but weak evidence that
the NLH advantage in our data is driven disproportionately by men and single women
who may have more flexibility to provide longer work hours and intense work effort than
married women32
In Figure 1 and Table 8 we explore a prediction that is shared by the
intertemporal labor supply and efficiency wage explanations of the NLH callback
advantage Specifically if a workerrsquos outside options in the event of job loss consist at
least in part of working in her home province then NLH workers who come from low-
wage provinces should have stronger work incentives in the city than NLH workers from
richer provinces Similarly intertemporal labor supply effects should be stronger for
workers from poor than rich provinces Thus both hypotheses predict that --holding
worker qualifications and job characteristics constantmdashemployers should prefer NLH
workers from poor provinces to NLH workers from rich provinces Note that both these
predictions contrast with the predictions of simple human capital models which suggest
that the lower quality of education poorer health and lower familiarity with modern
work practices in poorer regions would hurt those residentsrsquo employment prospects in
Xiamen
Figure 1 shows the unadjusted GDP-NLH advantage relationship in our data
graphically showing very high callback rates for applicants from Chinarsquos two poorest
provinces ndashGuizhou and Yunnan-- low callback rates from richer areas like Guangdong
and Inner Mongolia and almost no applicants to jobs in Xiamen from the richest
provinces Beijing Shanghai and Tianjin The linear regression line in the Figure shows
a clear negative relationship between per-capita GDP in the sending region and workersrsquo
callback rates from employers in Xiamen To quantify this relationship Table 8 adds
three regressors to our baseline specification in Table 3 The first is a fixed effect for
whether the NLH applicant is not from Fujian (the province in which Xiamen is located)
this allows us to see whether interprovincial applicants as a group are treated differently
from intraprovincial ones33
The next two variables interact interprovincial migrant status
with the distance of the applicantrsquos home province from Fujian and its level of per capita
income
32
We also explored the effects of the applicantrsquos age interacted with gender as a crude proxy for whether
the NLH advantage was lower among women who are likely to have children We found that the NLH
callback advantage is higher among workers in the lsquoprimersquo ages for temporary migration to cities (22-34)
than in other age groups for both men and women Within this age range the NLH advantage is smallest
among women aged 22-27 which is consistent with the idea that flexibility to work long hard hours plays
a role in the NLH advantage 33
Intraprovincial migrants might have different outcomes since some of these applicants come from
suburban and rural areas that are very close to the city of Xiamen some of whom could commute to jobs in
the city
17
Consistent with efficiency-wage and intertemporal labor supply interpretations of
the NLH advantage row 3 of Table 8 shows that the NLH callback advantage decreases
with the origin provincersquos per capita GDP reflecting the pattern in Figure 1 While not
statistically significant in every specification this effect is significant (at 10 percent) in
the absence of controls (column 1) and in the most saturated specification (column 7)
which includes job ad fixed effects Row 2 of Table 8 also shows a larger NLH hiring
advantage for interprovincial applicants than for applicants from Xiamenrsquos own province
but this advantage disappears and becomes statistically insignificant in the presence of
firm or job ad fixed effects Similar results but with larger magnitudes are present in
Panel B of Table 8 which replicates Panel A for less-skilled jobs only (specifically for
ads requiring high school or less) where we have shown that firmsrsquo NLH preference is
strongest Here the coefficient on per capita GDP in the migrantrsquos home region is
statistically significant in a larger share of the specifications though it is not in column 7
where job ad fixed effects are present Panel C focuses on skilled jobs As expected it
shows a much smaller NLH advantage and no effects of origin-region GDP can be
identified
Overall we see Table 8rsquos results as supportive of both the efficiency wage and
intertemporal labor supply interpretations of the NLH hiring advantage Especially given
the fact that applicants from poorer regions are likely less qualified on a number of
unobservable dimensions we find it highly suggestive that employers seem to prefer non-
local applicants from poorer provinces to applicants from richer provinces
6 Discussion
To our knowledge this is the first paper to study employersrsquo hiring choices
between equally-qualified workers with and without permanent residence permits in the
region of employment Our main finding is that despite evidence of taste-based
discrimination against NLH persons from other studies (eg Dulleck Fooken and He
2012) and despite the fact that NLH workers likely have lower levels of transferable
unobserved skills than natives employers in our data are more likely to call back
identically-matched NLH than LH applicants to the same job Because this preference is
much stronger when firms are seeking to fill less-skilled positions it cannot be explained
by payroll tax differences between LH and NLH workers Explanations based on
between-job wage discrimination are ruled out by job ad fixed effects while a within-ad
wage discrimination scenario is hard to reconcile with the fact that the NLH preference
does not differ between posted-wage and non-posted wage ads
Another candidate to explain the callback gap in our data is selection
unregistered migrants may be more qualified than local-hukou workers While we expect
that positive selection probably plays some role in explaining the NLH callback
advantage we note that a purely selection-based story faces some challenges One is that
our detailed measures of observable skills show only very small differences between
migrants and natives most of which favor natives not migrants Thus a selection-based
18
explanation would require a different selection pattern on observables than observables
and would require this selection pattern to be confined to less-skilled workers Most
importantly to explain the NLH callback advantage vis-agrave-vis natives in our data positive
selection among migrants would need to be strong enough to outweigh migrantsrsquo likely
disadvantages in education quality and health in the poorer regions they come from
The above discussion suggests that explanations based on different choices made
by NLH versus LH workers in the destination city ndashsuch as work hours and effort levels--
deserve serious consideration Indeed both life cycle labor supply models and efficiency
wage models provide theoretical reasons to expect NLH workers to work longer and
harder than natives at the same wage while they are in the destination city These
predicted differences in labor supply are strongly supported by Census data on work
hours and employment rates Further NLH workersrsquo low social insurance coverage
provide a natural reason to expect a larger efficiency wage effect at low skill levels
Additional support comes from evidence that employersrsquo NLH preferences are weakest
among married women (who may have less flexibility to work long hard hours) and
strongest for NLH workers from Chinarsquos poorest provinces Indeed the negative relation
between source-province GDP per capita and firmsrsquo preferences for migrant workers
strikes us as especially supportive of efficiency wage and intertemporal labor supply
mechanisms because if anything we would expect workers coming from poorer regions
to have lower levels of unobserved skills
While we believe the above findings are thought-provoking we also emphasize
that they should be interpreted with a number of important caveats in mind One is the
fact that ndashas in all correspondence studies-- our dependent variable measures callbacks
only not whether a worker ultimately receives a job offer As a result our main result
could be in jeopardy if firms systematically make fewer offers per callback to NLH than
LH workers provided they do this more at low skill levels than high ones While we
cannot rule this out it is hard to think of plausible reasons why callback and offer
patterns might differ in this way34
Second recall that our sample of applicants is restricted to people who have
chosen to search for work online and on XMRCcom specifically Thus our main result
could also be explained by differential selection into online job search if this selection is
more positive among NLH than among LH workers While this is possible we note
again that it would require a different pattern of selection on unobservables than
34
A key source of the difficulty is that most unobserved factors that could affect callback rates should
theoretically affect offer rates conditional on callbacks in the same direction For example suppose (as
seems likely) that NLH workersrsquo productivity is harder to predict than natives In that case their higher
option value suggests that employers should not only interview more of them but make more job offers to
them as well (Lazear 1995) The same should apply if NLH workers are more likely to accept a job offer
than LH applicants both callbacks and offers should be higher with no clear prediction for the ratio of
offers to callbacks Equally challenging is identifying factors that affect callback and offer rates
differently but only for less-skilled workers In contrast there are clear reasons to expect stronger
efficiency wage and intertemporal labor supply effects among less skilled NLH workers compared to
skilled ones
19
observables In addition this difference in selection into online search would have to be
confined to low skill levels to explain our result Finally we note that Kuhn and Skuterud
(2004) find evidence of negative not positive selection into internet job search on
unobservables
Third recall that XMRC serves private-sector employers almost exclusively thus
our results say nothing about the preferences of public-sector employers and state-owned
enterprises which ndashas we have notedmdashare much more likely to employ LH than NLH
workers In fact since public sector and SOE jobs are sometimes explicitly reserved for
LH workers in China our results are consistent with a segmented labor markets scenario
in which ndashholding match quality fixed-- private-sector employers tend to prefer NLH
workers while public service and SOE employers prefer LH workers Indeed the latter
sectors which are generally not exposed to significant competitive pressures in product
markets may play an important role in sheltering native workers from competition with
the massive influx of migrants in many Chinese cities35
Fourth the generality of our results is limited by the fact that Chinese NLH
workers differ in important ways from workers with insecure or limited residency rights
in other jurisdictions For example unlike undocumented workers in the US employed
NLH workers are not at risk of summary deportation This might make NLH workers
more desirable employees than someone who could disappear unexpectedly as a result of
and Immigration and Customs Enforcement raid Also in contrast to US undocumented
workers and to temporary visa-holders in many countries the NLH workers in our
sample are relatively similar in language culture and ethnicity to locals as noted most of
them come from Fujian province in which Xiamen is located The NLH applicants in
our sample also have a very similar skill distribution to local applicants This contrasts
starkly to undocumented workers and holders of temporary visas in the United States
who tend to occupy the tails of the skill distribution Taken together these similarities in
culture and skills between Xiamenrsquos LH and NLH workers suggest that that our results
may come closer than other comparisons to isolating the lsquopurersquo effect of workersrsquo
insecure residency rights on firmsrsquo recruiting decisions Perhaps paradoxically our main
finding is that --at least at low skill levels-- limited residency rights appear to make
workers more attractive to employers
35
House (2012) documents a similar though more extreme phenomenon in Saudi Arabia where 90 percent
of private-sector jobs are held by foreigners while natives either work in the public sector or not at all
20
References
Aimeiaishenghu ldquoOutsiders can do a taxi driver in Beijingrdquo Wendacom May 20 2013
httpfinanceifengcommoneywealthstory201004232095640shtml (accessed April
22 2014)
Aluminum Corporation of China ldquo2012 college graduates recruitment noticerdquo Yingjieshengcom
January 16 2012 httpwwwyingjieshengcomjob-001-253-682html (accessed April
22 2014)
Bao Shuming Orn B Bodvarsson Jack W Hou and Yaohui Zhao ldquoThe Regulation of Migration
in a Transition Economyrdquo IZA discussion paper no 4493 October 2009
Barcellos Silvia H ldquoLegalization and the Economic Status of Immigrantsrdquo RAND working paper
no WR-754 March 2010
Bertrand Marianne and Sendhil Mullainathan lsquolsquoAre Emily and Greg More Employable Than
Lakisha and Jamal A Field Experiment on Labor Market Discriminationrsquorsquo American
Economic Review 94 (2004) 991ndash1013
Bodvarsson Orn B Jack W Hou and Kailing Shen ldquoAging and Migration in a Transition
Economy The Case of Chinardquo WISE working paper 2014
Borjas George ldquoSelf-Selection and the Earnings of Immigrantsrdquo American Economic Review
September 1987 77(4) 531-53
Borjas GJ and M Tienda 1993 ldquoThe Employment and Wages of Legalized Immigrantsrdquo
International Migration Review 27(4)712-747
Brencic Vera ldquoWage Posting Evidence from Job Adsrdquo Canadian Journal of Economics 45(4)
(Nov 2012) 1529-1559
Chan Kam Wing and Will Buckingham ldquoIs China Abolishing the Hukou Systemrdquo The China
Quarterly 195 September 2008 582-606
Depew Briggs Peter Norlander and Todd Sorensen ldquoFlight of the H-1B Inter-Firm Mobility
and Return Migration Patterns for Skilled Guest Workersrdquo IZA Discussion Paper No
7456 June 2013
Deacutemurger Sylvie and Hui Xu ldquoLeft-Behind Children and Return Decisions of Rural Migrants in
Chinardquo IZA discussion paper no 7727 (November 2013)
Dulleck Uwe Jonas Fooken and Yumei He 2012 ldquoPublic Policy and Individual Labor Market
Discrimination An Artefactual Field Experiment in Chinardquo Unpublished paper
Queensland University of Technology
Dustmann Christian 2000 ldquoTemporary Migration and Economic Assimilationrdquo Swedish
Economic Policy Review 7(2) 213-244
Goerg Sebastian and Thorsten Chmura ldquoGift exchange with migrant workers and students in
Chinardquo work in progress Florida State University
21
Hirsch Boris and Elke Jahn ldquoIs There Monopsonistic Discrimination Against Immigrantsrdquo IZA
discussion paper no 6472 April 2012
Hotchkiss Julie L and Myriam Quispe-Agnoli ldquoEmployer Monopsony Power in the Labor
Market for Undocumented Workersrdquo SSRN eLibrary December 2009
House Karen Elliott On Saudi Arabia its people past religion fault lines--and future New
York Knopf 2012
Huang Xiuli ldquoBeijing Lawyers are not welcome foreign lawyersrdquo Eduifengcom April 23 2010
(accessed April 22 2014)
Kossoudji SA and DA Cobb-Clark 2002 ldquoComing out of the Shadows Learning about Legal
Status and Wages from the Legalized Populationrdquo Journal of Labor Economics 20(3)
598-628
Kuhn Peter and Kailing Shen 2013 ldquoDo Chinese Employers Avoid Hiring Overqualified
Workers Evidence from an Internet Job Boardrdquo Research in Labor Economics 37 1-30
Kuhn Peter Miguel Delgado Helleseter and Kailing Shen 2014 ldquoEmployersrsquo Age and Gender
Preferences Direct Evidence from Four Job Boardsrdquo unpublished paper UCSB
Kuhn Peter and Mikal Skuterud ldquoldquoInternet Job Search and Unemployment Durationsrdquo American
Economic Review 94(1) (March 2004) 218-232
Kuhn Peter and Hani Mansour Is Internet Job Search Still Ineffective Economic Journal
forthcoming 2014
Lang K M Manove and W T Dickens ldquoRacial Discrimination in Labor Markets with Posted
Wage Offersrdquo American Economic Review September 2005 95(4) 1327-40
Lazear E P (1995) Hiring risky workers National Bureau of Economic Research Inc NBER
Working Papers 5334
Oreopoulos Philip ldquoWhy Do Skilled Immigrants Struggle in the Labor Market A Field
Experiment with Thirteen Thousand Resumesrdquo American Economic Journal Economic
Policy 4 (Nov 2011) 148-171
Rivera-Batiz FL 1999 ldquoUndocumented Workers in the Labor Market An Analysis of the
Earnings of Legal and Illegal Mexican Immigrants in the United Statesrdquo Journal of
Population Economics 12(1) 91-116
Summers LH Some Simple Economics of Mandated Benefits American Economic Review 79
(May 1989) 177-183
Tse Chun-Wing ldquoUrban Residents Discrimination and Well-Being of Rural-to-Urban Migrants
in Chinardquo unpublished paper Central University of Finance and Economics Beijing
2014
Xiamen News Net (August 27 2013) ldquoXiamen hundreds of people took to the streets because of
their children to school probemsrdquo httpfjqqcoma20130827014835_allhtm (accessed
April 182014)
Table 1 Employment Statistics by Hukou and Current Residence 2005 Census
All Urban Residents in Major Cities Residents of Xiamen
A ALL WORKING-AGE PERSONS With
Local Hukou
With
Non-local Hukou
With
Local Hukou
With
Non-local Hukou
(1) (2) (3) (4)
Age
18-25 9 15 12 18
26-35 21 33 27 42
36-45 28 26 28 24
46-55 28 17 23 12
56-65 13 8 10 3
Education
Primary (6 years or less) 7 20 21 26
Junior Middle School (9 years) 31 44 25 40
High School (12 years) 34 21 27 21
Junior Technical School (15 years) 16 8 13 7
University Degree (16 years or more) 12 7 14 5
Employment status
employed 62 77 68 83
not employed 38 23 32 17
Sources of income
labor market 61 76 67 81
public transfers 23 6 13 3
capital income 3 3 3 2
family members 13 15 16 14
Social insurance coverage
UI covered 44 18 38 21
pension covered 72 31 60 30
medical insurance covered 69 42 73 39
Share of the population 49 51 44 56
23
Table 1 continued
Note Data are from the 2005 Census of China 1 sample persons aged 15-65 healthy current living in urban regions excluding students All rural
hukou individuals are regarded as without local hukou in the urban area Major cities are the 4 municipalities directly under the jurisdiction of the central
government (Beijing Shanghai Tianjing and Chongqing) and the 15 subprovincial cities Xiamen is one of the 15 subprovincial cities
All Urban Residents in Major Cities Residents of Xiamen
B WORKERS ONLY With
Local Hukou
With
Non-local Hukou
With
Local Hukou
With
Non-local Hukou
(1) (2) (3) (4)
Weekly working hours (mean) 4410 4914 4649 5489
1-39 hours 4 8 8 6
40 hours 66 35 47 21
41-56 hours 23 39 33 41
57 hours or more 7 18 12 33
Employer type
public sector 21 7 21 4
SOE ( includes collectives) 41 15 23 11
self employment 11 24 13 25
private enterprise 23 32 31 43
other 5 23 13 17
Nature of work contract
fixed term 34 33 43 37
infinite term 40 15 23 7
no contract 27 52 35 57
Duration of contract if fixed term
1 year or below 59 73 62 71
1-2 years 12 10 13 10
2-3 years 19 11 21 12
more than 3 years 9 6 5 6
Share of the population 43 57 39 61
24
Table 2 Sample Means by Applicantrsquos Hukou Status XMRC Data
Local Hukou
Non-Local
Hukou a Contacted by HR department 0071 0085
bCharacteristics of the Applicant
Education (years) 1442 1438
Age (years) 2595 2458
Experience (years) 409 315
New Graduate 0131 0191
Female 0594 0542
Current wage listed 0686 0689
Current wage if listed (yuanmonth) 2313 2263
Completed Tech School 0315 0158
Married 1126 1195
Occupational Qualification (Zhicheng) 0336 0299
Myopic 1655 1656
Height (cm) 0129 0127
English CV as well 0838 0783
Number of Schools listed in the CV 2720 2417
Number of Experience Spells described in the CV 1383 1178
Number of Certifications 1442 1438
c Characteristics of the Job Ad
Education Requested (years) 1268 1253
Desired Age Range specified 0546 0536
Desired Age if Requested (midpoint of interval) 2745 2708
Experience Requested 1022 0932
New Graduate Requested 0048 0045
Male Applicants Requested 0127 0132
Female Applicants Requested 0326 0297
Wage Advertised 0568 0588
Wage if advertised (yuanmonth midpoint of interval) 2324 2372
Number of positions advertised 1893 2130
Number of applicants 1821 1920
d Characteristics of the Firm Placing the Ad
Domestically Owned 0692 0728
Taiwan Hong Kong Ownership 0095 0085
Foreign Owned 0160 0146
Other (eg non-profits) 0053 0041
Xiamen Firm Location 0969 0970
Fujian Firm Location 0026 0026
Other Firm Location 0005 0004
Number of Employees 634 556
e Sample Size 19314 217814
Note LH-NLH gaps in Current wage listed English CV Xiamen Firm Location Fujian Firm Location are not
statistically significant Height differs at the 10 level New graduate requested and Male Applicant requested and
Other firm location differs at 5 and all remaining variables at 1 Zhicheng level is an integer ranging from 1 to
6 LH in Table 2 and throughout our main analysis denotes Xiamen city hukou only workers with Fujian province
(but not Xiamen) hukou are treated as NLH because their legal status in the city is the same as workers from other
provinces
Table 3 Effects of Non-Local Hukou on the Probability of Employer Contact Linear Probability Models
(1) (2) (3) (4) (5) (6) (7)
Non-Local Hukou (NLH) 0140 0125 0114 0100 0117 0082 0080
(0028) (0026) (0025) (0024) (0023) (0019) (0019)
Education less than requested -0067 -0133 -0130 -0122 -0103 -0101
(0049) (0055) (0052) (0053) (0026) (0025)
Education more than requested -0043 0016 0000 -0005 0020 0021
(0031) (0038) (0037) (0038) (0017) (0016)
Age less than requested1
-0008 -0025 -0025 -0003 -0096 -0120
(0058) (0058) (0058) (0052) (0033) (0032)
Age more than requested1
-0292 -0270 -0255 -0157 -0211 -0264
(0087) (0088) (0084) (0074) (0071) (0076)
Experience less than requested2
-0067 -0070 -0076 -0103 -0110 -0112
(0057) (0057) (0054) (0052) (0025) (0025)
Experience more than requested2
0003 -0003 -0007 -0003 -0016 -0015
(0032) (0028) (0027) (0026) (0017) (0016)
Wage below advertised3
0004 -0001 -0009 -0019 -0005 0002
(0040) (0040) (0038) (0038) (0023) (0022)
Wage above advertised3
-0004 0001 -0011 -0019 -0074 -0084
(0039) (0039) (0039) (0042) (0023) (0023)
Sex differs from requested -0109 -0105 -0085 -0060 -0060 -0051
(0050) (0050) (0047) (0045) (0033) (0031)
Number of positions advertised (100) 5345 3016
(2177) (2015)
Number of applicants (100) -0134 -0088
(0027) (0023)
Detailed CV controls No No Yes Yes Yes Yes Yes
Occupation Fixed Effects No No No Yes Yes Yes No
Firm Fixed Effects No No No No No Yes No
Ad Fixed Effects No No No No No No Yes
Observations 237128 237128 232600 232600 232600 232600 232600 R-squared 0002 0045 0050 0172 0269 2710 2955
Standard errors in parentheses clustered by ad plt001 plt005 plt01
26
Notes to Table 3
1 Age matching variables refer to whether the applicantrsquos age is below within or above the requested age range
2 Experience matching variables refer to whether the applicantrsquos experience is below 0-2 years above or more than 3 years above the requested experience level
3 Wage matching variables refer to whether the applicantrsquos current wage and the advertised wage are in the same wage bin (8 bins are used)
In addition to the covariates shown columns 2-7 include the following covariates the jobrsquos requested education level (5 categories) requested experience level
(quadratic) requested age level (quadratic in midpoint of range) requested gender (male female not specified) advertised wage (quadratic in midpoint of bin 8 bins)
and dummies for whether a new graduate is requested for whether the worker is a new graduate for whether the workerrsquos new graduate status matches the employerrsquos
request and whether the worker is female Indicators for missing age and wage information for either the ad or the worker are also included
Columns 3-7 also include controls for the following worker (CV) characteristics (these characteristics are not mentioned in job ads very often) whether attended technical
school the applicantrsquos Zhicheng rank (6 categories) whether the CV is in English the number of schools attended number of job experience spells number of
certifications reported applicant height (interacted with applicant gender) an indicator for myopia indicator (interacted with applicant gender) and marital status
(interacted with applicant gender)
Sample size drops between columns 3 and 4 because height information is missing for 19 percent of the cvs
27
Table 4 Effects of Non-Local Hukou (NLH) on Job Offer Probabilities by Required Education
(1) (2) (3) (4) (5) (6) (7)
Primary 0358 0251 0240 0212 0214 0114 0117
(6 years or less) (0097) (0077) (0078) (0079) (0079) (0058) (0059)
Junior Middle School 0465 0352 0339 0351 0365 0262 0216
(9 years) (0134) (0118) (0121) (0123) (0123) (0109) (0107)
Senior Middle School 0184 0234 0214 0164 0143 0225 0159
(12 years) (0077) (0072) (0072) (0073) (0072) (0064) (0058)
Technical School -0115 -0087 -0083 -0044 0020 -0194 -0105
(12 years) (0104) (0104) (0104) (0106) (0104) (0082) (0070)
College 0079 0032 0024 0023 0042 0057 0057
(15 years) (0051) (0040) (0040) (0038) (0038) (0029) (0029)
University Degree -0032 0059 0053 0035 0050 0002 0025
(16 years) (0115) (0093) (0088) (0088) (0087) (0050) (0050)
Detailed CV controls Yes Yes Yes Yes Yes
Occupation Fixed Effects Yes Yes Yes Yes
Firm Fixed Effects Yes No
Ad Fixed Effects Yes
Observations 237128 237128 232600 232600 232600 232600 232600
R-squared 0022 0046 0051 0173 0270 2711 2956
Standard errors in parentheses clustered by ad
plt001 plt005 plt01
See Table 3 for regression specifications
28
Table 5 Effects of Non-Local Hukou (NLH) on Contact Rate by the Jobrsquos Posted Wage Level
(1) (2) (3) (4) (5) (6) (7)
Posted Wage
Around 1000 yuanmonth 0795 0846 0843 0873 0756 0264 -0090
(0331) (0358) (0363) (0368) (0388) (0501) (0678)
1000-2000 yuanmonth 0128 0175 0154 0130 0138 0139 0142
(0065) (0061) (0061) (0059) (0058) (0047) (0048)
2000-3000 yuanmonth 0073 0038 0012 0011 0047 0073 0059
(0061) (0061) (0060) (0057) (0058) (0045) (0048)
3000-4000 yuanmonth 0099 0009 -0007 -0038 -0094 -0097 0071
(0149) (0150) (0150) (0147) (0142) (0100) (0078)
4000-5000 yuanmonth 0525 0379 0374 0345 0293 0326 0018
(0255) (0223) (0224) (0215) (0208) (0201) (0165)
More than 5000 yuanmonth 0423 0108 0107 0071 0062 -0315 -0216
(0196) (0337) (0339) (0351) (0332) (0276) (0275)
Basic Ad CV and Match controls Yes Yes Yes Yes Yes Yes
Detailed CV controls Yes Yes Yes Yes Yes
Occupation Fixed Effects Yes Yes Yes Yes
Firm Fixed Effects Yes No
Ad Fixed Effects Yes
Observations 96689 96689 95477 95477 95477 95477 95477
R-squared 0015 0053 0061 0148 0232 2539 2727
Standard errors in parentheses clustered by ad
plt001 plt005 plt01
See Table 3 for Regression Specifications
29
Table 6 Effects of Non-Local Hukou (NLH) on Contact Rate by whether a wage was advertised
(1) (2) (3) (4) (5) (6) (7)
Ad posted a wage 0144 0137 0127 0114 0130 0070 0067
(0035) (0030) (0030) (0030) (0029) (0023) (0023)
Ad didnrsquot post a wage 0135 0107 0095 0079 0097 0100 0100
(0040) (0042) (0042) (0040) (0039) (0031) (0031)
Basic Ad CV and Match controls Yes Yes Yes Yes Yes Yes
Detailed CV controls Yes Yes Yes Yes Yes
Occupation Fixed Effects Yes Yes Yes Yes
Firm Fixed Effects Yes No
Ad Fixed Effects Yes
Observations 237128 237128 232600 232600 232600 232600 232600
R-squared 0002 0045 0050 0172 0269 2710 2955
p-value for posted wage = not posted 8669 5438 5265 4896 5072 4355 3767
Standard errors in parentheses clustered by ad
plt001 plt005 plt01
See Table 3 for Regression Specifications
30
Table 7 Effects of Non-Local Hukou (NLH) on Contact Rate by Applicants gender and marital status
(1) (2) (3) (4) (5) (6) (7)
singlefemale 0085 0086 0062 0052 0077 0051 0057
(0037) (0036) (0037) (0035) (0034) (0028) (0028)
marriedfemale 0045 0033 0071 0041 0073 0056 0068
(0041) (0041) (0056) (0054) (0053) (0042) (0042)
singlemale 0210 0204 0161 0149 0148 0103 0096
(0041) (0037) (0040) (0040) (0040) (0033) (0033)
marriedmale 0217 0164 0233 0220 0229 0167 0134
(0057) (0046) (0061) (0061) (0060) (0048) (0048)
Basic Ad CV and Match controls Yes Yes Yes Yes Yes Yes
Detailed CV controls Yes Yes Yes Yes Yes
Occupation Fixed Effects Yes Yes Yes Yes
Firm Fixed Effects Yes No
Ad Fixed Effects Yes
Observations 237128 237128 232600 232600 232600 232600 232600
R-squared 0007 0045 0050 0173 0270 2710 2955
Standard errors in parentheses clustered by ad
plt001 plt005 plt01
See Table 3 for Regression Specifications
31
Table 8 Effects of Origin Provincesrsquo GDP on the Probability Employer Contact for Non-Local Hukou (NLH)
(1) (2) (3) (4) (5) (6) (7)
A Full Sample
Non-Local Hukou (NLH) 0123 0114 0105 0094 0113 0083 0082
(0028) (0026) (0025) (0024) (0024) (0019) (0019)
Other than Fujian (Local) Province (OH) 0077 0063 0049 0029 0016 -0009 -0014
(0024) (0023) (0023) (0022) (0022) (0018) (0018)
OHOrigin Provincersquos per capita GDP -0044 -0023 -0026 -0028 -0030 -0034 -0031
(0025) (0023) (0023) (0023) (0023) (0020) (0020)
OHLog of Railroad Distance (in km) 0051 0052 0047 0031 0029 0017 0014
(0024) (0023) (0023) (0023) (0023) (0019) (0018)
Observations
R-squared
237127 237127 232599 232599 232599 232599 232599
0003 0045 0050 0172 0269 2710 2955
B Jobs Requiring High School Education or Less
Non-Local Hukou (NLH) 0229 0222 0218 0186 0192 0152 0147
(0052) (0050) (0050) (0046) (0045) (0038) (0038)
Other than Fujian (Local) Province (OH) 0056 0043 0034 0024 0006 -0007 -0009
(0047) (0045) (0044) (0042) (0043) (0037) (0036)
OHOrigin Provincersquos per capita GDP -0084 -0074 -0085 -0080 -0087 -0052 -0045
(0047) (0047) (0046) (0044) (0043) (0038) (0038)
OHLog of Railroad Distance (in km) 0059 0061 0059 0053 0052 0030 0025
(0039) (0039) (0040) (0039) (0039) (0032) (0032)
Observations
R-squared
74429 74429 73344 73344 73344 73344 73344
0006 0073 0079 0278 0374 2664 2902
C Jobs Requiring Tech School Education or More
Non-Local Hukou (NLH) 0076 0068 0062 0054 0075 0054 0057
(0033) (0030) (0029) (0028) (0028) (0022) (0022)
Other than Fujian (Local) Province (OH) 0070 0066 0049 0018 0009 -0014 -0019
(0028) (0027) (0026) (0025) (0024) (0020) (0020)
OHOrigin Provincersquos per capita GDP -0001 0001 -0003 -0003 -0004 -0027 -0023
(0027) (0026) (0027) (0026) (0026) (0023) (0023)
OHLog of Railroad Distance (in km) 0041 0044 0035 0008 0007 0008 0006
(0029) (0029) (0029) (0028) (0028) (0023) (0022)
Observations
R-squared
162698 162698 159255 159255 159255 159255 159255
0002 0026 0034 0203 0320 2805 2972
plt001 plt005 plt01 Standard errors in parentheses clustered by ad
See Table 3 for regression specifications Per capita GDP refers to 2008-2010 measured in logs and standardized Railroad distance is between the capital cities of the
origin province and Fujian (Bodvarsson Hou and Shen (2014) and is normalized to have a mean of zero for the non-Fujian provinces
32
Figure 1 Mean Callback Rates of NLH Applicants by Origin Provincersquos per capita GDP
Symbol size is proportional to the number of observations from the source province
Linear regression line is weighted by number of observations from the province 95 confidence band is shown
Beijing
Tianjin
Hebei
Shanxi
Inner Mongolia
Liaoning
Jilin
Heilongjiang
Shanghai
Jiangsu
Zhejiang
Anhui
JiangxiShandong
Henan
Hubei
Hunan
Guangdong
GuangxiHainan
Chongqing
Sichuan
Guizhou
Yunnan
Shaanxi
Gansu
Qinghai
Ningxia
Xinjiang
07
08
09
1
11
12
Mea
n C
on
tact
Rat
es
-2 -15 -1 -5 0 5 1 15 2 25Standardized GDP
11
Column 5 of Table 3 adds two indicators of the amount of competition for the job
in question specifically the number of positions available and the number of persons who
applied to the ad Both have strong effects in the expected directions but their inclusion
does not change the NLH coefficient Column 6 adds fixed effects for the firm that
posted the ad Once again the NLH coefficient is essentially unchanged and remains
highly statistically significant Finally column 7 adds a full set of job ad fixed effects
thus as noted we are now effectively comparing the success rates of LH and NLH
workers who have applied to the same job ad Again the NLH coefficient is essentially
unchanged from the previous column Interestingly the similarity of the column 6 and 7
results means that NLH workers do not disproportionately direct their applications to ads
in which they are more likely to receive an employer contact19
Instead NLH workers
seem to apply to the same mix of jobs but achieve differential success when they get
there
In sum Table 3 presents robust evidence that NLH workers have a higher chance
of receiving an employer callback than observationally-equivalent LH workers when both
groups of workers are competing for the same private-sector job In the following
section we consider the plausibility of various explanations for this gap by exploring
how the size of the gap varies across types of ads firms and workers
5 What Explains Firmsrsquo Preferences for NLH Workers
51 Discriminatory Tastes
It is of course possible that employers co-workers or customers have differential
tastes for interacting with migrant versus local workers All available evidence however
suggests that if anything Chinese urban residents are either indifferent or have some
distastes for interacting with non-local workers (Dulleck Fooken and He 2012 Tse 2014
Goerg and Chmura in progress) Since tastes of this nature should raise nativesrsquo hiring
rates above migrantsrsquo they cannot explain employersrsquo revealed preference for NLH
applicants in our data20
52 Payroll tax differentials
As noted LH and NLH workers are treated differently by Xiamenrsquos retirement
and medical insurance programs Specifically LH workers and their employers
contributed 8 and 14 of the workerrsquos actual average monthly salary respectively to
the retirement insurance program for NLH workers these contributions are both 8
19
Some search models of discrimination such as Lang Manove and Dickens (2005) have the property that
in equilibrium groups that anticipate encountering discrimination in the hiring process direct their search
towards lower-wage jobs 20
That said we do not expect high levels of taste-based discrimination in our sample largely because a
large majority (74 percent) of the NLH workers in our sample come from Fujian province in which
Xiamen is located This similarity suggests that Xiamenrsquos NLH workers might provide a cleaner test of the
lsquopurersquo effects of temporary residence status than studies of other temporary migrants such as
undocumented workers or H1-B visaholders in the US
12
percent of the monthly minimum wage (900 RMB)21
Similarly LH workers and their
employers contribute 2 and 7 respectively of their average actual monthly salary to
medical insurance while NLH workers and their employers each contribute 2 of the
monthly minimum wage each month22
As a result NLH workersrsquo combined retirement
and medical payroll tax rate was about 44 percent of LH workersrsquo rate near bottom of the
earnings distribution in our sample (specifically at 1500RMB per month) This tax
advantage increases monotonically with the level of monthly earnings near the top of
the earnings distribution (at 5000RMBmonth) NLH workers incurred only 16 cents of
tax for every 100 cents paid by LH workers23
Theoretically the effect of differential payroll taxes on the relative callback rates
of LH and NLH workers depends on whether firms can wage discriminate on the basis of
residency status If they can the payroll tax gap should have no effect since employers
can simply adjust wages to compensate for any gap24
If firmsrsquo ability to wage
discriminate between native and migrants is limited however firms should prefer NLH
applicants to equally qualified LH applicants25
Moreover due to the structure of payroll
taxes in Xiamen the strength of these preferences should increase with a jobrsquos skill
requirements
To assess this hypothesis Table 4 estimates a different effect of NLH status for
each of the five levels of required education for the job while Table 5 does the same for
six different advertised wage levels For both wages and education levels we find the
opposite pattern from what is predicted by NLH workersrsquo payroll tax advantage firmsrsquo
revealed preferences for NLH workers are considerably stronger at low skill levels than
higher ones This pattern is more pronounced across wage than education levels while
the NLH advantage is present in all education groups except university graduates it is
confined to jobs offering under 3000 yuan per month Firms recruiting for very high-
wage jobs where NLH workersrsquo payroll tax advantage is the highest do not have a
systematic preference for NLH workers Given these patterns which are inconsistent
with a payroll tax-based explanation we consider other possible explanations of firmsrsquo
NLH preference below
21
LH workersrsquo retirement- and UI-taxable earnings are capped at three times the city average wage
(9114RMBmonth) less than one percent of the ads or workers in our data are affected by this cap 22
Informally the rationale for these differentials seems to be to mimic benefit levels in migrantsrsquo home
regions which are generally much lower than in the coastal cities In addition as one local official
expressed the number of migrant workers is so large and many of them will never use retirement and
medical insurance benefits due to their age structure and migration pattern 23
Some of these tax policies have been adjusted since our data was collected partly in response to a
perception that they negatively affected some LH workersrsquo employment prospects Specifically Xiamenrsquos
government recently moved in the direction of eliminating payroll tax differentials between LH and NLH
workers by granting NLH payroll tax rates to firms hiring lsquoemployment-disadvantagedrsquo LH workers LH
new college graduates and LH workers in public service jobs 24
The extent to which this wage discrimination actually hurts native workers depends on the extent to
which they value the additional social benefits attached to their higher tax rates (Summers 1989) 25
Notice also that if firms cannot wage-discriminate only the employerrsquos share of the payroll tax should
affect their decision on whom to hire Incidentally adjusting offered wages to cancel out the LHNLH
payroll tax differential is explicitly prohibited in Xiamen and is subject to large fines
13
53 Wage differentials
If NLH workersrsquo lower tax cost cannot explain their callback advantage what
about their relative wage costs Is it possible that firms systematically prefer NLH
applicants simply because they can hire them for a lower wage In this section we
describe two ways in which a wage gap might account for the NLH hiring advantage
They are based on the possibility of LH-NLH wage differentials between jobs (ie ads)
and within jobs respectively
Turning first to between-job wage variation one scenario that might account for a
higher NLH hiring rate is a situation where NLH workers disproportionately apply to
lower-wage jobs and where lower-wage jobs on average are easier to get (ie they have
higher callback rates) A closely related possibility is a scenario where firms engaging in
monopsonistic wage discrimination (or for that matter firms who want to protect native
workersrsquo wages while still benefiting from cheaper migrant labor) create distinct job
categories tailored to the two groups26
If migrants apply mostly to the lower-wage
categories where the hiring rate is higher that could account for our main result
While these seem like plausible scenarios they are not likely explanations for the
NLH hiring advantage in our data for at least two reasons First all our estimates control
for the level of both the advertised wage and the applicantrsquos current wage27
Second if
firms wage-discriminate against NLH workers by posting separate (lower-wage) job ads
specifically tailored to them then the estimated NLH hiring advantage should decline in
size when we replace the firm fixed effects in column 6 of Table 3 by job ad fixed effects
in column 7 As already noted they do not Put a different way the fact that the NLH
hiring advantage persists within ads rules out explanations based on the idea that NLH
workers disproportionately apply to lower-wage jobs which may be easier for them to
get
Next we turn to the possibility of within-job wage discrimination ie the possibility
that firms might prefer NLH workers over LH workers who have applied to the same job
if they can subsequently hire the NLH worker for a lower wage While we cannot
measure the amount of within-job wage discrimination directly it seems likely that this
type of discrimination is more difficult in posted-wage jobs than in jobs where the wage
is not specified in the ad28
If that is the case then firmsrsquo preferences for NLH workers
should be weaker in posted-wage jobs
26
Wage discrimination against migrants can be profit-maximizing if migrants supply labor less elastically
to the firm See for example Hotchkiss and Quispe-Agnoli (2009) Hirsch and Jahn (2012) and Depew et
al (2013) 27
Strictly speaking the estimates in Table 3 only control for the advertised and current wage when each
variable is available in the data (which is the case for 59 and 69 percent of applications respectively) The
results are very similar however when we estimate the Table 3 on the subsample of observations where
both variables are present 28
Note that within-job wage discrimination is typically ignored in correspondence studies which cannot
ascertain whether different wages would be offered to different types of candidates at the interview stage or
later
14
To examine this hypothesis Table 6 estimates separate NLH effects on callback
rates to job ads with and without posted wages using the same regression specifications
as Tables 3-5 As it turns out the NLH hiring advantage is greater in posted-wage jobs in
some specifications and lower in others and the difference between posted- and non-
posted-wage jobs is never statistically significant at conventional levels (p-values are
reported in the bottom row of the Table) We interpret this as evidence against within-job
wage discrimination as the primary reason why firms exhibit a preference for NLH
workers We also note that a widespread and robust feature of job board data including
the data in this paper is that wage posting is much more common in unskilled than
skilled jobs29
If the disproportionate use of posted wages in unskilled jobs indicates a
greater overall reluctance by firms to engage in individual wage negotiation in less-
skilled jobs a scenario based on within-job wage discrimination faces challenges in
explaining why the NLH hiring advantage is greatest in the least-skilled jobs Relative to
skilled jobs wages in those jobs are more likely to be set by inflexible rules than by
individual negotiation
54 Selection
Another reason why similarly-qualified migrants might be preferred to locals is
selection While we have a detailed set of controls and while our LH and NLH samples
have very similar observable characteristics it is still possible that migrants have on
average higher unobserved skills That said selection on unobservables faces at least two
challenges as an explanation of the NLH advantage in our data First note that even if
migrants are positively selected relative to stayers in their home regions ndashas one would
expect for example from Borjasrsquos (1987) selection model when there is more inequality
in the receiving region-- this type of positive selection does not necessarily imply that
migrants will be more productive than natives with identical observables Second if
anything we would probably expect NLH workers to suffer deficits in education quality
connections (guanxi) and other destination-specific skills which would all appear as
negative selection on unobservables in our data
Still we acknowledge that positive selection on unobservables could be part of
the reason why NLH workers are more likely to receive employer callbacks than LH
workers in our data Persons who choose to migrate to a city especially in a capacity
where their temporary residence status excludes them from key components of the public
goods and social protections available to urban natives are likely to have a stronger work
ethic than their compatriots who remain behind
55 Hours and Effort
A final potential explanation of the NLH callback advantage is the possibility that
migrants and natives of identical ability differ in their effort and labor supply choices in a
29
See for example Brencic (2012) and Delgado Helleseter Kuhn and Shen (2014)
15
way that makes migrants more desirable to employers30
One possible source of such a
gap emerges from intertemporal labor supply models to the extent that NLH workers
face a significant prospect of returning to their (low-wage) region of origin NLH workers
face a wage that is temporarily high relative to other points in their lifetime This creates
an intertemporal substitution effect that should raise migrantsrsquo work hours and effort
relative to nativesrsquo at the same wage (Dustmann 2000) This prediction of longer work
hours among migrants is strongly supported by the Census data presented in Table 1
A second possible source of a migrant-native effort gap is an efficiency wage
effect to the extent that migrantsrsquo outside options are poorer than nativesrsquo migrants
should be willing to exert more effort to keep their jobs This will certainly be the case if
migrantsrsquo outside options consist primarily of jobs in their home regions but may apply
even if it is relatively easy for migrants to change jobs within the host city One reason is
that migrants are excluded from some key components of the urban social safety net
(Recall from Table 1 that NLH workers in Xiamen are much less likely to have
unemployment and medical insurance coverage) In addition migrants probably have
less wealth (including owned housing) than natives and Table 1rsquos employment statistics
suggest that migrants are excluded from a number of attractive secure public sector and
SOE employment options that are available to natives Finally note that the LH-NLH
gap in social insurance coverage is probably most relevant to workersrsquo outside options at
low skill levels which is precisely where employers have the strongest revealed
preference for NLH workers31
To explore the possible role of intertemporal labor supply effects Table 7
provides separate estimates of the NLH hiring advantage by applicant gender and marital
status The idea is to compare groups who potentially have more flexibility to work
extremely long hours and at high intensity (men and single women) to a group that might
be less able to do so (married women) If the flexibility to work long intense hours
explains why firms prefer NLH workers we might expect to see a smaller NLH
advantage among married women than among other groups Interestingly in the absence
of controls (column 1) we find that the NLH advantage is indeed statistically significant
for men and for single women but insignificant for married women Further menrsquos NLH
advantage is twice as large as womenrsquos and the gap between menrsquos and married
womenrsquos NLH advantage is highly statistically significant In the most saturated
specification (column 7) the same pattern of statistical significance appears but a very
noisy estimate for married women makes it impossible to conclude that they have a lower
30
In general firms will prefer workers who choose higher effort levels or who will accept additional work
hours whenever employment contracts are incomplete ie as long as the pay rate per hour or piece gives
workers less than 100 of the surplus they generate at the margin 31
Another aspect of worker performance that might differ between LH and NLH workers is their expected
turnover rate While it is unclear whether we would expect LH or NLH workers turn over more frequently
in the short run the fact that hukou regulations make it difficult to settle down and raise a family suggests
that firms wishing to hire long-term workers might prefer LH workers To the extent that firm-specific
human capital is complementary with education and other indicators of general skills this could also help
explain why we estimate a weaker NLH preference at higher skill levels
16
NLH advantage In part this is because married women constitute only 67 percent of
our sample of NLH applicants compared to 477 365 and 93 for single women single
men and married men respectively We view this as suggestive but weak evidence that
the NLH advantage in our data is driven disproportionately by men and single women
who may have more flexibility to provide longer work hours and intense work effort than
married women32
In Figure 1 and Table 8 we explore a prediction that is shared by the
intertemporal labor supply and efficiency wage explanations of the NLH callback
advantage Specifically if a workerrsquos outside options in the event of job loss consist at
least in part of working in her home province then NLH workers who come from low-
wage provinces should have stronger work incentives in the city than NLH workers from
richer provinces Similarly intertemporal labor supply effects should be stronger for
workers from poor than rich provinces Thus both hypotheses predict that --holding
worker qualifications and job characteristics constantmdashemployers should prefer NLH
workers from poor provinces to NLH workers from rich provinces Note that both these
predictions contrast with the predictions of simple human capital models which suggest
that the lower quality of education poorer health and lower familiarity with modern
work practices in poorer regions would hurt those residentsrsquo employment prospects in
Xiamen
Figure 1 shows the unadjusted GDP-NLH advantage relationship in our data
graphically showing very high callback rates for applicants from Chinarsquos two poorest
provinces ndashGuizhou and Yunnan-- low callback rates from richer areas like Guangdong
and Inner Mongolia and almost no applicants to jobs in Xiamen from the richest
provinces Beijing Shanghai and Tianjin The linear regression line in the Figure shows
a clear negative relationship between per-capita GDP in the sending region and workersrsquo
callback rates from employers in Xiamen To quantify this relationship Table 8 adds
three regressors to our baseline specification in Table 3 The first is a fixed effect for
whether the NLH applicant is not from Fujian (the province in which Xiamen is located)
this allows us to see whether interprovincial applicants as a group are treated differently
from intraprovincial ones33
The next two variables interact interprovincial migrant status
with the distance of the applicantrsquos home province from Fujian and its level of per capita
income
32
We also explored the effects of the applicantrsquos age interacted with gender as a crude proxy for whether
the NLH advantage was lower among women who are likely to have children We found that the NLH
callback advantage is higher among workers in the lsquoprimersquo ages for temporary migration to cities (22-34)
than in other age groups for both men and women Within this age range the NLH advantage is smallest
among women aged 22-27 which is consistent with the idea that flexibility to work long hard hours plays
a role in the NLH advantage 33
Intraprovincial migrants might have different outcomes since some of these applicants come from
suburban and rural areas that are very close to the city of Xiamen some of whom could commute to jobs in
the city
17
Consistent with efficiency-wage and intertemporal labor supply interpretations of
the NLH advantage row 3 of Table 8 shows that the NLH callback advantage decreases
with the origin provincersquos per capita GDP reflecting the pattern in Figure 1 While not
statistically significant in every specification this effect is significant (at 10 percent) in
the absence of controls (column 1) and in the most saturated specification (column 7)
which includes job ad fixed effects Row 2 of Table 8 also shows a larger NLH hiring
advantage for interprovincial applicants than for applicants from Xiamenrsquos own province
but this advantage disappears and becomes statistically insignificant in the presence of
firm or job ad fixed effects Similar results but with larger magnitudes are present in
Panel B of Table 8 which replicates Panel A for less-skilled jobs only (specifically for
ads requiring high school or less) where we have shown that firmsrsquo NLH preference is
strongest Here the coefficient on per capita GDP in the migrantrsquos home region is
statistically significant in a larger share of the specifications though it is not in column 7
where job ad fixed effects are present Panel C focuses on skilled jobs As expected it
shows a much smaller NLH advantage and no effects of origin-region GDP can be
identified
Overall we see Table 8rsquos results as supportive of both the efficiency wage and
intertemporal labor supply interpretations of the NLH hiring advantage Especially given
the fact that applicants from poorer regions are likely less qualified on a number of
unobservable dimensions we find it highly suggestive that employers seem to prefer non-
local applicants from poorer provinces to applicants from richer provinces
6 Discussion
To our knowledge this is the first paper to study employersrsquo hiring choices
between equally-qualified workers with and without permanent residence permits in the
region of employment Our main finding is that despite evidence of taste-based
discrimination against NLH persons from other studies (eg Dulleck Fooken and He
2012) and despite the fact that NLH workers likely have lower levels of transferable
unobserved skills than natives employers in our data are more likely to call back
identically-matched NLH than LH applicants to the same job Because this preference is
much stronger when firms are seeking to fill less-skilled positions it cannot be explained
by payroll tax differences between LH and NLH workers Explanations based on
between-job wage discrimination are ruled out by job ad fixed effects while a within-ad
wage discrimination scenario is hard to reconcile with the fact that the NLH preference
does not differ between posted-wage and non-posted wage ads
Another candidate to explain the callback gap in our data is selection
unregistered migrants may be more qualified than local-hukou workers While we expect
that positive selection probably plays some role in explaining the NLH callback
advantage we note that a purely selection-based story faces some challenges One is that
our detailed measures of observable skills show only very small differences between
migrants and natives most of which favor natives not migrants Thus a selection-based
18
explanation would require a different selection pattern on observables than observables
and would require this selection pattern to be confined to less-skilled workers Most
importantly to explain the NLH callback advantage vis-agrave-vis natives in our data positive
selection among migrants would need to be strong enough to outweigh migrantsrsquo likely
disadvantages in education quality and health in the poorer regions they come from
The above discussion suggests that explanations based on different choices made
by NLH versus LH workers in the destination city ndashsuch as work hours and effort levels--
deserve serious consideration Indeed both life cycle labor supply models and efficiency
wage models provide theoretical reasons to expect NLH workers to work longer and
harder than natives at the same wage while they are in the destination city These
predicted differences in labor supply are strongly supported by Census data on work
hours and employment rates Further NLH workersrsquo low social insurance coverage
provide a natural reason to expect a larger efficiency wage effect at low skill levels
Additional support comes from evidence that employersrsquo NLH preferences are weakest
among married women (who may have less flexibility to work long hard hours) and
strongest for NLH workers from Chinarsquos poorest provinces Indeed the negative relation
between source-province GDP per capita and firmsrsquo preferences for migrant workers
strikes us as especially supportive of efficiency wage and intertemporal labor supply
mechanisms because if anything we would expect workers coming from poorer regions
to have lower levels of unobserved skills
While we believe the above findings are thought-provoking we also emphasize
that they should be interpreted with a number of important caveats in mind One is the
fact that ndashas in all correspondence studies-- our dependent variable measures callbacks
only not whether a worker ultimately receives a job offer As a result our main result
could be in jeopardy if firms systematically make fewer offers per callback to NLH than
LH workers provided they do this more at low skill levels than high ones While we
cannot rule this out it is hard to think of plausible reasons why callback and offer
patterns might differ in this way34
Second recall that our sample of applicants is restricted to people who have
chosen to search for work online and on XMRCcom specifically Thus our main result
could also be explained by differential selection into online job search if this selection is
more positive among NLH than among LH workers While this is possible we note
again that it would require a different pattern of selection on unobservables than
34
A key source of the difficulty is that most unobserved factors that could affect callback rates should
theoretically affect offer rates conditional on callbacks in the same direction For example suppose (as
seems likely) that NLH workersrsquo productivity is harder to predict than natives In that case their higher
option value suggests that employers should not only interview more of them but make more job offers to
them as well (Lazear 1995) The same should apply if NLH workers are more likely to accept a job offer
than LH applicants both callbacks and offers should be higher with no clear prediction for the ratio of
offers to callbacks Equally challenging is identifying factors that affect callback and offer rates
differently but only for less-skilled workers In contrast there are clear reasons to expect stronger
efficiency wage and intertemporal labor supply effects among less skilled NLH workers compared to
skilled ones
19
observables In addition this difference in selection into online search would have to be
confined to low skill levels to explain our result Finally we note that Kuhn and Skuterud
(2004) find evidence of negative not positive selection into internet job search on
unobservables
Third recall that XMRC serves private-sector employers almost exclusively thus
our results say nothing about the preferences of public-sector employers and state-owned
enterprises which ndashas we have notedmdashare much more likely to employ LH than NLH
workers In fact since public sector and SOE jobs are sometimes explicitly reserved for
LH workers in China our results are consistent with a segmented labor markets scenario
in which ndashholding match quality fixed-- private-sector employers tend to prefer NLH
workers while public service and SOE employers prefer LH workers Indeed the latter
sectors which are generally not exposed to significant competitive pressures in product
markets may play an important role in sheltering native workers from competition with
the massive influx of migrants in many Chinese cities35
Fourth the generality of our results is limited by the fact that Chinese NLH
workers differ in important ways from workers with insecure or limited residency rights
in other jurisdictions For example unlike undocumented workers in the US employed
NLH workers are not at risk of summary deportation This might make NLH workers
more desirable employees than someone who could disappear unexpectedly as a result of
and Immigration and Customs Enforcement raid Also in contrast to US undocumented
workers and to temporary visa-holders in many countries the NLH workers in our
sample are relatively similar in language culture and ethnicity to locals as noted most of
them come from Fujian province in which Xiamen is located The NLH applicants in
our sample also have a very similar skill distribution to local applicants This contrasts
starkly to undocumented workers and holders of temporary visas in the United States
who tend to occupy the tails of the skill distribution Taken together these similarities in
culture and skills between Xiamenrsquos LH and NLH workers suggest that that our results
may come closer than other comparisons to isolating the lsquopurersquo effect of workersrsquo
insecure residency rights on firmsrsquo recruiting decisions Perhaps paradoxically our main
finding is that --at least at low skill levels-- limited residency rights appear to make
workers more attractive to employers
35
House (2012) documents a similar though more extreme phenomenon in Saudi Arabia where 90 percent
of private-sector jobs are held by foreigners while natives either work in the public sector or not at all
20
References
Aimeiaishenghu ldquoOutsiders can do a taxi driver in Beijingrdquo Wendacom May 20 2013
httpfinanceifengcommoneywealthstory201004232095640shtml (accessed April
22 2014)
Aluminum Corporation of China ldquo2012 college graduates recruitment noticerdquo Yingjieshengcom
January 16 2012 httpwwwyingjieshengcomjob-001-253-682html (accessed April
22 2014)
Bao Shuming Orn B Bodvarsson Jack W Hou and Yaohui Zhao ldquoThe Regulation of Migration
in a Transition Economyrdquo IZA discussion paper no 4493 October 2009
Barcellos Silvia H ldquoLegalization and the Economic Status of Immigrantsrdquo RAND working paper
no WR-754 March 2010
Bertrand Marianne and Sendhil Mullainathan lsquolsquoAre Emily and Greg More Employable Than
Lakisha and Jamal A Field Experiment on Labor Market Discriminationrsquorsquo American
Economic Review 94 (2004) 991ndash1013
Bodvarsson Orn B Jack W Hou and Kailing Shen ldquoAging and Migration in a Transition
Economy The Case of Chinardquo WISE working paper 2014
Borjas George ldquoSelf-Selection and the Earnings of Immigrantsrdquo American Economic Review
September 1987 77(4) 531-53
Borjas GJ and M Tienda 1993 ldquoThe Employment and Wages of Legalized Immigrantsrdquo
International Migration Review 27(4)712-747
Brencic Vera ldquoWage Posting Evidence from Job Adsrdquo Canadian Journal of Economics 45(4)
(Nov 2012) 1529-1559
Chan Kam Wing and Will Buckingham ldquoIs China Abolishing the Hukou Systemrdquo The China
Quarterly 195 September 2008 582-606
Depew Briggs Peter Norlander and Todd Sorensen ldquoFlight of the H-1B Inter-Firm Mobility
and Return Migration Patterns for Skilled Guest Workersrdquo IZA Discussion Paper No
7456 June 2013
Deacutemurger Sylvie and Hui Xu ldquoLeft-Behind Children and Return Decisions of Rural Migrants in
Chinardquo IZA discussion paper no 7727 (November 2013)
Dulleck Uwe Jonas Fooken and Yumei He 2012 ldquoPublic Policy and Individual Labor Market
Discrimination An Artefactual Field Experiment in Chinardquo Unpublished paper
Queensland University of Technology
Dustmann Christian 2000 ldquoTemporary Migration and Economic Assimilationrdquo Swedish
Economic Policy Review 7(2) 213-244
Goerg Sebastian and Thorsten Chmura ldquoGift exchange with migrant workers and students in
Chinardquo work in progress Florida State University
21
Hirsch Boris and Elke Jahn ldquoIs There Monopsonistic Discrimination Against Immigrantsrdquo IZA
discussion paper no 6472 April 2012
Hotchkiss Julie L and Myriam Quispe-Agnoli ldquoEmployer Monopsony Power in the Labor
Market for Undocumented Workersrdquo SSRN eLibrary December 2009
House Karen Elliott On Saudi Arabia its people past religion fault lines--and future New
York Knopf 2012
Huang Xiuli ldquoBeijing Lawyers are not welcome foreign lawyersrdquo Eduifengcom April 23 2010
(accessed April 22 2014)
Kossoudji SA and DA Cobb-Clark 2002 ldquoComing out of the Shadows Learning about Legal
Status and Wages from the Legalized Populationrdquo Journal of Labor Economics 20(3)
598-628
Kuhn Peter and Kailing Shen 2013 ldquoDo Chinese Employers Avoid Hiring Overqualified
Workers Evidence from an Internet Job Boardrdquo Research in Labor Economics 37 1-30
Kuhn Peter Miguel Delgado Helleseter and Kailing Shen 2014 ldquoEmployersrsquo Age and Gender
Preferences Direct Evidence from Four Job Boardsrdquo unpublished paper UCSB
Kuhn Peter and Mikal Skuterud ldquoldquoInternet Job Search and Unemployment Durationsrdquo American
Economic Review 94(1) (March 2004) 218-232
Kuhn Peter and Hani Mansour Is Internet Job Search Still Ineffective Economic Journal
forthcoming 2014
Lang K M Manove and W T Dickens ldquoRacial Discrimination in Labor Markets with Posted
Wage Offersrdquo American Economic Review September 2005 95(4) 1327-40
Lazear E P (1995) Hiring risky workers National Bureau of Economic Research Inc NBER
Working Papers 5334
Oreopoulos Philip ldquoWhy Do Skilled Immigrants Struggle in the Labor Market A Field
Experiment with Thirteen Thousand Resumesrdquo American Economic Journal Economic
Policy 4 (Nov 2011) 148-171
Rivera-Batiz FL 1999 ldquoUndocumented Workers in the Labor Market An Analysis of the
Earnings of Legal and Illegal Mexican Immigrants in the United Statesrdquo Journal of
Population Economics 12(1) 91-116
Summers LH Some Simple Economics of Mandated Benefits American Economic Review 79
(May 1989) 177-183
Tse Chun-Wing ldquoUrban Residents Discrimination and Well-Being of Rural-to-Urban Migrants
in Chinardquo unpublished paper Central University of Finance and Economics Beijing
2014
Xiamen News Net (August 27 2013) ldquoXiamen hundreds of people took to the streets because of
their children to school probemsrdquo httpfjqqcoma20130827014835_allhtm (accessed
April 182014)
Table 1 Employment Statistics by Hukou and Current Residence 2005 Census
All Urban Residents in Major Cities Residents of Xiamen
A ALL WORKING-AGE PERSONS With
Local Hukou
With
Non-local Hukou
With
Local Hukou
With
Non-local Hukou
(1) (2) (3) (4)
Age
18-25 9 15 12 18
26-35 21 33 27 42
36-45 28 26 28 24
46-55 28 17 23 12
56-65 13 8 10 3
Education
Primary (6 years or less) 7 20 21 26
Junior Middle School (9 years) 31 44 25 40
High School (12 years) 34 21 27 21
Junior Technical School (15 years) 16 8 13 7
University Degree (16 years or more) 12 7 14 5
Employment status
employed 62 77 68 83
not employed 38 23 32 17
Sources of income
labor market 61 76 67 81
public transfers 23 6 13 3
capital income 3 3 3 2
family members 13 15 16 14
Social insurance coverage
UI covered 44 18 38 21
pension covered 72 31 60 30
medical insurance covered 69 42 73 39
Share of the population 49 51 44 56
23
Table 1 continued
Note Data are from the 2005 Census of China 1 sample persons aged 15-65 healthy current living in urban regions excluding students All rural
hukou individuals are regarded as without local hukou in the urban area Major cities are the 4 municipalities directly under the jurisdiction of the central
government (Beijing Shanghai Tianjing and Chongqing) and the 15 subprovincial cities Xiamen is one of the 15 subprovincial cities
All Urban Residents in Major Cities Residents of Xiamen
B WORKERS ONLY With
Local Hukou
With
Non-local Hukou
With
Local Hukou
With
Non-local Hukou
(1) (2) (3) (4)
Weekly working hours (mean) 4410 4914 4649 5489
1-39 hours 4 8 8 6
40 hours 66 35 47 21
41-56 hours 23 39 33 41
57 hours or more 7 18 12 33
Employer type
public sector 21 7 21 4
SOE ( includes collectives) 41 15 23 11
self employment 11 24 13 25
private enterprise 23 32 31 43
other 5 23 13 17
Nature of work contract
fixed term 34 33 43 37
infinite term 40 15 23 7
no contract 27 52 35 57
Duration of contract if fixed term
1 year or below 59 73 62 71
1-2 years 12 10 13 10
2-3 years 19 11 21 12
more than 3 years 9 6 5 6
Share of the population 43 57 39 61
24
Table 2 Sample Means by Applicantrsquos Hukou Status XMRC Data
Local Hukou
Non-Local
Hukou a Contacted by HR department 0071 0085
bCharacteristics of the Applicant
Education (years) 1442 1438
Age (years) 2595 2458
Experience (years) 409 315
New Graduate 0131 0191
Female 0594 0542
Current wage listed 0686 0689
Current wage if listed (yuanmonth) 2313 2263
Completed Tech School 0315 0158
Married 1126 1195
Occupational Qualification (Zhicheng) 0336 0299
Myopic 1655 1656
Height (cm) 0129 0127
English CV as well 0838 0783
Number of Schools listed in the CV 2720 2417
Number of Experience Spells described in the CV 1383 1178
Number of Certifications 1442 1438
c Characteristics of the Job Ad
Education Requested (years) 1268 1253
Desired Age Range specified 0546 0536
Desired Age if Requested (midpoint of interval) 2745 2708
Experience Requested 1022 0932
New Graduate Requested 0048 0045
Male Applicants Requested 0127 0132
Female Applicants Requested 0326 0297
Wage Advertised 0568 0588
Wage if advertised (yuanmonth midpoint of interval) 2324 2372
Number of positions advertised 1893 2130
Number of applicants 1821 1920
d Characteristics of the Firm Placing the Ad
Domestically Owned 0692 0728
Taiwan Hong Kong Ownership 0095 0085
Foreign Owned 0160 0146
Other (eg non-profits) 0053 0041
Xiamen Firm Location 0969 0970
Fujian Firm Location 0026 0026
Other Firm Location 0005 0004
Number of Employees 634 556
e Sample Size 19314 217814
Note LH-NLH gaps in Current wage listed English CV Xiamen Firm Location Fujian Firm Location are not
statistically significant Height differs at the 10 level New graduate requested and Male Applicant requested and
Other firm location differs at 5 and all remaining variables at 1 Zhicheng level is an integer ranging from 1 to
6 LH in Table 2 and throughout our main analysis denotes Xiamen city hukou only workers with Fujian province
(but not Xiamen) hukou are treated as NLH because their legal status in the city is the same as workers from other
provinces
Table 3 Effects of Non-Local Hukou on the Probability of Employer Contact Linear Probability Models
(1) (2) (3) (4) (5) (6) (7)
Non-Local Hukou (NLH) 0140 0125 0114 0100 0117 0082 0080
(0028) (0026) (0025) (0024) (0023) (0019) (0019)
Education less than requested -0067 -0133 -0130 -0122 -0103 -0101
(0049) (0055) (0052) (0053) (0026) (0025)
Education more than requested -0043 0016 0000 -0005 0020 0021
(0031) (0038) (0037) (0038) (0017) (0016)
Age less than requested1
-0008 -0025 -0025 -0003 -0096 -0120
(0058) (0058) (0058) (0052) (0033) (0032)
Age more than requested1
-0292 -0270 -0255 -0157 -0211 -0264
(0087) (0088) (0084) (0074) (0071) (0076)
Experience less than requested2
-0067 -0070 -0076 -0103 -0110 -0112
(0057) (0057) (0054) (0052) (0025) (0025)
Experience more than requested2
0003 -0003 -0007 -0003 -0016 -0015
(0032) (0028) (0027) (0026) (0017) (0016)
Wage below advertised3
0004 -0001 -0009 -0019 -0005 0002
(0040) (0040) (0038) (0038) (0023) (0022)
Wage above advertised3
-0004 0001 -0011 -0019 -0074 -0084
(0039) (0039) (0039) (0042) (0023) (0023)
Sex differs from requested -0109 -0105 -0085 -0060 -0060 -0051
(0050) (0050) (0047) (0045) (0033) (0031)
Number of positions advertised (100) 5345 3016
(2177) (2015)
Number of applicants (100) -0134 -0088
(0027) (0023)
Detailed CV controls No No Yes Yes Yes Yes Yes
Occupation Fixed Effects No No No Yes Yes Yes No
Firm Fixed Effects No No No No No Yes No
Ad Fixed Effects No No No No No No Yes
Observations 237128 237128 232600 232600 232600 232600 232600 R-squared 0002 0045 0050 0172 0269 2710 2955
Standard errors in parentheses clustered by ad plt001 plt005 plt01
26
Notes to Table 3
1 Age matching variables refer to whether the applicantrsquos age is below within or above the requested age range
2 Experience matching variables refer to whether the applicantrsquos experience is below 0-2 years above or more than 3 years above the requested experience level
3 Wage matching variables refer to whether the applicantrsquos current wage and the advertised wage are in the same wage bin (8 bins are used)
In addition to the covariates shown columns 2-7 include the following covariates the jobrsquos requested education level (5 categories) requested experience level
(quadratic) requested age level (quadratic in midpoint of range) requested gender (male female not specified) advertised wage (quadratic in midpoint of bin 8 bins)
and dummies for whether a new graduate is requested for whether the worker is a new graduate for whether the workerrsquos new graduate status matches the employerrsquos
request and whether the worker is female Indicators for missing age and wage information for either the ad or the worker are also included
Columns 3-7 also include controls for the following worker (CV) characteristics (these characteristics are not mentioned in job ads very often) whether attended technical
school the applicantrsquos Zhicheng rank (6 categories) whether the CV is in English the number of schools attended number of job experience spells number of
certifications reported applicant height (interacted with applicant gender) an indicator for myopia indicator (interacted with applicant gender) and marital status
(interacted with applicant gender)
Sample size drops between columns 3 and 4 because height information is missing for 19 percent of the cvs
27
Table 4 Effects of Non-Local Hukou (NLH) on Job Offer Probabilities by Required Education
(1) (2) (3) (4) (5) (6) (7)
Primary 0358 0251 0240 0212 0214 0114 0117
(6 years or less) (0097) (0077) (0078) (0079) (0079) (0058) (0059)
Junior Middle School 0465 0352 0339 0351 0365 0262 0216
(9 years) (0134) (0118) (0121) (0123) (0123) (0109) (0107)
Senior Middle School 0184 0234 0214 0164 0143 0225 0159
(12 years) (0077) (0072) (0072) (0073) (0072) (0064) (0058)
Technical School -0115 -0087 -0083 -0044 0020 -0194 -0105
(12 years) (0104) (0104) (0104) (0106) (0104) (0082) (0070)
College 0079 0032 0024 0023 0042 0057 0057
(15 years) (0051) (0040) (0040) (0038) (0038) (0029) (0029)
University Degree -0032 0059 0053 0035 0050 0002 0025
(16 years) (0115) (0093) (0088) (0088) (0087) (0050) (0050)
Detailed CV controls Yes Yes Yes Yes Yes
Occupation Fixed Effects Yes Yes Yes Yes
Firm Fixed Effects Yes No
Ad Fixed Effects Yes
Observations 237128 237128 232600 232600 232600 232600 232600
R-squared 0022 0046 0051 0173 0270 2711 2956
Standard errors in parentheses clustered by ad
plt001 plt005 plt01
See Table 3 for regression specifications
28
Table 5 Effects of Non-Local Hukou (NLH) on Contact Rate by the Jobrsquos Posted Wage Level
(1) (2) (3) (4) (5) (6) (7)
Posted Wage
Around 1000 yuanmonth 0795 0846 0843 0873 0756 0264 -0090
(0331) (0358) (0363) (0368) (0388) (0501) (0678)
1000-2000 yuanmonth 0128 0175 0154 0130 0138 0139 0142
(0065) (0061) (0061) (0059) (0058) (0047) (0048)
2000-3000 yuanmonth 0073 0038 0012 0011 0047 0073 0059
(0061) (0061) (0060) (0057) (0058) (0045) (0048)
3000-4000 yuanmonth 0099 0009 -0007 -0038 -0094 -0097 0071
(0149) (0150) (0150) (0147) (0142) (0100) (0078)
4000-5000 yuanmonth 0525 0379 0374 0345 0293 0326 0018
(0255) (0223) (0224) (0215) (0208) (0201) (0165)
More than 5000 yuanmonth 0423 0108 0107 0071 0062 -0315 -0216
(0196) (0337) (0339) (0351) (0332) (0276) (0275)
Basic Ad CV and Match controls Yes Yes Yes Yes Yes Yes
Detailed CV controls Yes Yes Yes Yes Yes
Occupation Fixed Effects Yes Yes Yes Yes
Firm Fixed Effects Yes No
Ad Fixed Effects Yes
Observations 96689 96689 95477 95477 95477 95477 95477
R-squared 0015 0053 0061 0148 0232 2539 2727
Standard errors in parentheses clustered by ad
plt001 plt005 plt01
See Table 3 for Regression Specifications
29
Table 6 Effects of Non-Local Hukou (NLH) on Contact Rate by whether a wage was advertised
(1) (2) (3) (4) (5) (6) (7)
Ad posted a wage 0144 0137 0127 0114 0130 0070 0067
(0035) (0030) (0030) (0030) (0029) (0023) (0023)
Ad didnrsquot post a wage 0135 0107 0095 0079 0097 0100 0100
(0040) (0042) (0042) (0040) (0039) (0031) (0031)
Basic Ad CV and Match controls Yes Yes Yes Yes Yes Yes
Detailed CV controls Yes Yes Yes Yes Yes
Occupation Fixed Effects Yes Yes Yes Yes
Firm Fixed Effects Yes No
Ad Fixed Effects Yes
Observations 237128 237128 232600 232600 232600 232600 232600
R-squared 0002 0045 0050 0172 0269 2710 2955
p-value for posted wage = not posted 8669 5438 5265 4896 5072 4355 3767
Standard errors in parentheses clustered by ad
plt001 plt005 plt01
See Table 3 for Regression Specifications
30
Table 7 Effects of Non-Local Hukou (NLH) on Contact Rate by Applicants gender and marital status
(1) (2) (3) (4) (5) (6) (7)
singlefemale 0085 0086 0062 0052 0077 0051 0057
(0037) (0036) (0037) (0035) (0034) (0028) (0028)
marriedfemale 0045 0033 0071 0041 0073 0056 0068
(0041) (0041) (0056) (0054) (0053) (0042) (0042)
singlemale 0210 0204 0161 0149 0148 0103 0096
(0041) (0037) (0040) (0040) (0040) (0033) (0033)
marriedmale 0217 0164 0233 0220 0229 0167 0134
(0057) (0046) (0061) (0061) (0060) (0048) (0048)
Basic Ad CV and Match controls Yes Yes Yes Yes Yes Yes
Detailed CV controls Yes Yes Yes Yes Yes
Occupation Fixed Effects Yes Yes Yes Yes
Firm Fixed Effects Yes No
Ad Fixed Effects Yes
Observations 237128 237128 232600 232600 232600 232600 232600
R-squared 0007 0045 0050 0173 0270 2710 2955
Standard errors in parentheses clustered by ad
plt001 plt005 plt01
See Table 3 for Regression Specifications
31
Table 8 Effects of Origin Provincesrsquo GDP on the Probability Employer Contact for Non-Local Hukou (NLH)
(1) (2) (3) (4) (5) (6) (7)
A Full Sample
Non-Local Hukou (NLH) 0123 0114 0105 0094 0113 0083 0082
(0028) (0026) (0025) (0024) (0024) (0019) (0019)
Other than Fujian (Local) Province (OH) 0077 0063 0049 0029 0016 -0009 -0014
(0024) (0023) (0023) (0022) (0022) (0018) (0018)
OHOrigin Provincersquos per capita GDP -0044 -0023 -0026 -0028 -0030 -0034 -0031
(0025) (0023) (0023) (0023) (0023) (0020) (0020)
OHLog of Railroad Distance (in km) 0051 0052 0047 0031 0029 0017 0014
(0024) (0023) (0023) (0023) (0023) (0019) (0018)
Observations
R-squared
237127 237127 232599 232599 232599 232599 232599
0003 0045 0050 0172 0269 2710 2955
B Jobs Requiring High School Education or Less
Non-Local Hukou (NLH) 0229 0222 0218 0186 0192 0152 0147
(0052) (0050) (0050) (0046) (0045) (0038) (0038)
Other than Fujian (Local) Province (OH) 0056 0043 0034 0024 0006 -0007 -0009
(0047) (0045) (0044) (0042) (0043) (0037) (0036)
OHOrigin Provincersquos per capita GDP -0084 -0074 -0085 -0080 -0087 -0052 -0045
(0047) (0047) (0046) (0044) (0043) (0038) (0038)
OHLog of Railroad Distance (in km) 0059 0061 0059 0053 0052 0030 0025
(0039) (0039) (0040) (0039) (0039) (0032) (0032)
Observations
R-squared
74429 74429 73344 73344 73344 73344 73344
0006 0073 0079 0278 0374 2664 2902
C Jobs Requiring Tech School Education or More
Non-Local Hukou (NLH) 0076 0068 0062 0054 0075 0054 0057
(0033) (0030) (0029) (0028) (0028) (0022) (0022)
Other than Fujian (Local) Province (OH) 0070 0066 0049 0018 0009 -0014 -0019
(0028) (0027) (0026) (0025) (0024) (0020) (0020)
OHOrigin Provincersquos per capita GDP -0001 0001 -0003 -0003 -0004 -0027 -0023
(0027) (0026) (0027) (0026) (0026) (0023) (0023)
OHLog of Railroad Distance (in km) 0041 0044 0035 0008 0007 0008 0006
(0029) (0029) (0029) (0028) (0028) (0023) (0022)
Observations
R-squared
162698 162698 159255 159255 159255 159255 159255
0002 0026 0034 0203 0320 2805 2972
plt001 plt005 plt01 Standard errors in parentheses clustered by ad
See Table 3 for regression specifications Per capita GDP refers to 2008-2010 measured in logs and standardized Railroad distance is between the capital cities of the
origin province and Fujian (Bodvarsson Hou and Shen (2014) and is normalized to have a mean of zero for the non-Fujian provinces
32
Figure 1 Mean Callback Rates of NLH Applicants by Origin Provincersquos per capita GDP
Symbol size is proportional to the number of observations from the source province
Linear regression line is weighted by number of observations from the province 95 confidence band is shown
Beijing
Tianjin
Hebei
Shanxi
Inner Mongolia
Liaoning
Jilin
Heilongjiang
Shanghai
Jiangsu
Zhejiang
Anhui
JiangxiShandong
Henan
Hubei
Hunan
Guangdong
GuangxiHainan
Chongqing
Sichuan
Guizhou
Yunnan
Shaanxi
Gansu
Qinghai
Ningxia
Xinjiang
07
08
09
1
11
12
Mea
n C
on
tact
Rat
es
-2 -15 -1 -5 0 5 1 15 2 25Standardized GDP
12
percent of the monthly minimum wage (900 RMB)21
Similarly LH workers and their
employers contribute 2 and 7 respectively of their average actual monthly salary to
medical insurance while NLH workers and their employers each contribute 2 of the
monthly minimum wage each month22
As a result NLH workersrsquo combined retirement
and medical payroll tax rate was about 44 percent of LH workersrsquo rate near bottom of the
earnings distribution in our sample (specifically at 1500RMB per month) This tax
advantage increases monotonically with the level of monthly earnings near the top of
the earnings distribution (at 5000RMBmonth) NLH workers incurred only 16 cents of
tax for every 100 cents paid by LH workers23
Theoretically the effect of differential payroll taxes on the relative callback rates
of LH and NLH workers depends on whether firms can wage discriminate on the basis of
residency status If they can the payroll tax gap should have no effect since employers
can simply adjust wages to compensate for any gap24
If firmsrsquo ability to wage
discriminate between native and migrants is limited however firms should prefer NLH
applicants to equally qualified LH applicants25
Moreover due to the structure of payroll
taxes in Xiamen the strength of these preferences should increase with a jobrsquos skill
requirements
To assess this hypothesis Table 4 estimates a different effect of NLH status for
each of the five levels of required education for the job while Table 5 does the same for
six different advertised wage levels For both wages and education levels we find the
opposite pattern from what is predicted by NLH workersrsquo payroll tax advantage firmsrsquo
revealed preferences for NLH workers are considerably stronger at low skill levels than
higher ones This pattern is more pronounced across wage than education levels while
the NLH advantage is present in all education groups except university graduates it is
confined to jobs offering under 3000 yuan per month Firms recruiting for very high-
wage jobs where NLH workersrsquo payroll tax advantage is the highest do not have a
systematic preference for NLH workers Given these patterns which are inconsistent
with a payroll tax-based explanation we consider other possible explanations of firmsrsquo
NLH preference below
21
LH workersrsquo retirement- and UI-taxable earnings are capped at three times the city average wage
(9114RMBmonth) less than one percent of the ads or workers in our data are affected by this cap 22
Informally the rationale for these differentials seems to be to mimic benefit levels in migrantsrsquo home
regions which are generally much lower than in the coastal cities In addition as one local official
expressed the number of migrant workers is so large and many of them will never use retirement and
medical insurance benefits due to their age structure and migration pattern 23
Some of these tax policies have been adjusted since our data was collected partly in response to a
perception that they negatively affected some LH workersrsquo employment prospects Specifically Xiamenrsquos
government recently moved in the direction of eliminating payroll tax differentials between LH and NLH
workers by granting NLH payroll tax rates to firms hiring lsquoemployment-disadvantagedrsquo LH workers LH
new college graduates and LH workers in public service jobs 24
The extent to which this wage discrimination actually hurts native workers depends on the extent to
which they value the additional social benefits attached to their higher tax rates (Summers 1989) 25
Notice also that if firms cannot wage-discriminate only the employerrsquos share of the payroll tax should
affect their decision on whom to hire Incidentally adjusting offered wages to cancel out the LHNLH
payroll tax differential is explicitly prohibited in Xiamen and is subject to large fines
13
53 Wage differentials
If NLH workersrsquo lower tax cost cannot explain their callback advantage what
about their relative wage costs Is it possible that firms systematically prefer NLH
applicants simply because they can hire them for a lower wage In this section we
describe two ways in which a wage gap might account for the NLH hiring advantage
They are based on the possibility of LH-NLH wage differentials between jobs (ie ads)
and within jobs respectively
Turning first to between-job wage variation one scenario that might account for a
higher NLH hiring rate is a situation where NLH workers disproportionately apply to
lower-wage jobs and where lower-wage jobs on average are easier to get (ie they have
higher callback rates) A closely related possibility is a scenario where firms engaging in
monopsonistic wage discrimination (or for that matter firms who want to protect native
workersrsquo wages while still benefiting from cheaper migrant labor) create distinct job
categories tailored to the two groups26
If migrants apply mostly to the lower-wage
categories where the hiring rate is higher that could account for our main result
While these seem like plausible scenarios they are not likely explanations for the
NLH hiring advantage in our data for at least two reasons First all our estimates control
for the level of both the advertised wage and the applicantrsquos current wage27
Second if
firms wage-discriminate against NLH workers by posting separate (lower-wage) job ads
specifically tailored to them then the estimated NLH hiring advantage should decline in
size when we replace the firm fixed effects in column 6 of Table 3 by job ad fixed effects
in column 7 As already noted they do not Put a different way the fact that the NLH
hiring advantage persists within ads rules out explanations based on the idea that NLH
workers disproportionately apply to lower-wage jobs which may be easier for them to
get
Next we turn to the possibility of within-job wage discrimination ie the possibility
that firms might prefer NLH workers over LH workers who have applied to the same job
if they can subsequently hire the NLH worker for a lower wage While we cannot
measure the amount of within-job wage discrimination directly it seems likely that this
type of discrimination is more difficult in posted-wage jobs than in jobs where the wage
is not specified in the ad28
If that is the case then firmsrsquo preferences for NLH workers
should be weaker in posted-wage jobs
26
Wage discrimination against migrants can be profit-maximizing if migrants supply labor less elastically
to the firm See for example Hotchkiss and Quispe-Agnoli (2009) Hirsch and Jahn (2012) and Depew et
al (2013) 27
Strictly speaking the estimates in Table 3 only control for the advertised and current wage when each
variable is available in the data (which is the case for 59 and 69 percent of applications respectively) The
results are very similar however when we estimate the Table 3 on the subsample of observations where
both variables are present 28
Note that within-job wage discrimination is typically ignored in correspondence studies which cannot
ascertain whether different wages would be offered to different types of candidates at the interview stage or
later
14
To examine this hypothesis Table 6 estimates separate NLH effects on callback
rates to job ads with and without posted wages using the same regression specifications
as Tables 3-5 As it turns out the NLH hiring advantage is greater in posted-wage jobs in
some specifications and lower in others and the difference between posted- and non-
posted-wage jobs is never statistically significant at conventional levels (p-values are
reported in the bottom row of the Table) We interpret this as evidence against within-job
wage discrimination as the primary reason why firms exhibit a preference for NLH
workers We also note that a widespread and robust feature of job board data including
the data in this paper is that wage posting is much more common in unskilled than
skilled jobs29
If the disproportionate use of posted wages in unskilled jobs indicates a
greater overall reluctance by firms to engage in individual wage negotiation in less-
skilled jobs a scenario based on within-job wage discrimination faces challenges in
explaining why the NLH hiring advantage is greatest in the least-skilled jobs Relative to
skilled jobs wages in those jobs are more likely to be set by inflexible rules than by
individual negotiation
54 Selection
Another reason why similarly-qualified migrants might be preferred to locals is
selection While we have a detailed set of controls and while our LH and NLH samples
have very similar observable characteristics it is still possible that migrants have on
average higher unobserved skills That said selection on unobservables faces at least two
challenges as an explanation of the NLH advantage in our data First note that even if
migrants are positively selected relative to stayers in their home regions ndashas one would
expect for example from Borjasrsquos (1987) selection model when there is more inequality
in the receiving region-- this type of positive selection does not necessarily imply that
migrants will be more productive than natives with identical observables Second if
anything we would probably expect NLH workers to suffer deficits in education quality
connections (guanxi) and other destination-specific skills which would all appear as
negative selection on unobservables in our data
Still we acknowledge that positive selection on unobservables could be part of
the reason why NLH workers are more likely to receive employer callbacks than LH
workers in our data Persons who choose to migrate to a city especially in a capacity
where their temporary residence status excludes them from key components of the public
goods and social protections available to urban natives are likely to have a stronger work
ethic than their compatriots who remain behind
55 Hours and Effort
A final potential explanation of the NLH callback advantage is the possibility that
migrants and natives of identical ability differ in their effort and labor supply choices in a
29
See for example Brencic (2012) and Delgado Helleseter Kuhn and Shen (2014)
15
way that makes migrants more desirable to employers30
One possible source of such a
gap emerges from intertemporal labor supply models to the extent that NLH workers
face a significant prospect of returning to their (low-wage) region of origin NLH workers
face a wage that is temporarily high relative to other points in their lifetime This creates
an intertemporal substitution effect that should raise migrantsrsquo work hours and effort
relative to nativesrsquo at the same wage (Dustmann 2000) This prediction of longer work
hours among migrants is strongly supported by the Census data presented in Table 1
A second possible source of a migrant-native effort gap is an efficiency wage
effect to the extent that migrantsrsquo outside options are poorer than nativesrsquo migrants
should be willing to exert more effort to keep their jobs This will certainly be the case if
migrantsrsquo outside options consist primarily of jobs in their home regions but may apply
even if it is relatively easy for migrants to change jobs within the host city One reason is
that migrants are excluded from some key components of the urban social safety net
(Recall from Table 1 that NLH workers in Xiamen are much less likely to have
unemployment and medical insurance coverage) In addition migrants probably have
less wealth (including owned housing) than natives and Table 1rsquos employment statistics
suggest that migrants are excluded from a number of attractive secure public sector and
SOE employment options that are available to natives Finally note that the LH-NLH
gap in social insurance coverage is probably most relevant to workersrsquo outside options at
low skill levels which is precisely where employers have the strongest revealed
preference for NLH workers31
To explore the possible role of intertemporal labor supply effects Table 7
provides separate estimates of the NLH hiring advantage by applicant gender and marital
status The idea is to compare groups who potentially have more flexibility to work
extremely long hours and at high intensity (men and single women) to a group that might
be less able to do so (married women) If the flexibility to work long intense hours
explains why firms prefer NLH workers we might expect to see a smaller NLH
advantage among married women than among other groups Interestingly in the absence
of controls (column 1) we find that the NLH advantage is indeed statistically significant
for men and for single women but insignificant for married women Further menrsquos NLH
advantage is twice as large as womenrsquos and the gap between menrsquos and married
womenrsquos NLH advantage is highly statistically significant In the most saturated
specification (column 7) the same pattern of statistical significance appears but a very
noisy estimate for married women makes it impossible to conclude that they have a lower
30
In general firms will prefer workers who choose higher effort levels or who will accept additional work
hours whenever employment contracts are incomplete ie as long as the pay rate per hour or piece gives
workers less than 100 of the surplus they generate at the margin 31
Another aspect of worker performance that might differ between LH and NLH workers is their expected
turnover rate While it is unclear whether we would expect LH or NLH workers turn over more frequently
in the short run the fact that hukou regulations make it difficult to settle down and raise a family suggests
that firms wishing to hire long-term workers might prefer LH workers To the extent that firm-specific
human capital is complementary with education and other indicators of general skills this could also help
explain why we estimate a weaker NLH preference at higher skill levels
16
NLH advantage In part this is because married women constitute only 67 percent of
our sample of NLH applicants compared to 477 365 and 93 for single women single
men and married men respectively We view this as suggestive but weak evidence that
the NLH advantage in our data is driven disproportionately by men and single women
who may have more flexibility to provide longer work hours and intense work effort than
married women32
In Figure 1 and Table 8 we explore a prediction that is shared by the
intertemporal labor supply and efficiency wage explanations of the NLH callback
advantage Specifically if a workerrsquos outside options in the event of job loss consist at
least in part of working in her home province then NLH workers who come from low-
wage provinces should have stronger work incentives in the city than NLH workers from
richer provinces Similarly intertemporal labor supply effects should be stronger for
workers from poor than rich provinces Thus both hypotheses predict that --holding
worker qualifications and job characteristics constantmdashemployers should prefer NLH
workers from poor provinces to NLH workers from rich provinces Note that both these
predictions contrast with the predictions of simple human capital models which suggest
that the lower quality of education poorer health and lower familiarity with modern
work practices in poorer regions would hurt those residentsrsquo employment prospects in
Xiamen
Figure 1 shows the unadjusted GDP-NLH advantage relationship in our data
graphically showing very high callback rates for applicants from Chinarsquos two poorest
provinces ndashGuizhou and Yunnan-- low callback rates from richer areas like Guangdong
and Inner Mongolia and almost no applicants to jobs in Xiamen from the richest
provinces Beijing Shanghai and Tianjin The linear regression line in the Figure shows
a clear negative relationship between per-capita GDP in the sending region and workersrsquo
callback rates from employers in Xiamen To quantify this relationship Table 8 adds
three regressors to our baseline specification in Table 3 The first is a fixed effect for
whether the NLH applicant is not from Fujian (the province in which Xiamen is located)
this allows us to see whether interprovincial applicants as a group are treated differently
from intraprovincial ones33
The next two variables interact interprovincial migrant status
with the distance of the applicantrsquos home province from Fujian and its level of per capita
income
32
We also explored the effects of the applicantrsquos age interacted with gender as a crude proxy for whether
the NLH advantage was lower among women who are likely to have children We found that the NLH
callback advantage is higher among workers in the lsquoprimersquo ages for temporary migration to cities (22-34)
than in other age groups for both men and women Within this age range the NLH advantage is smallest
among women aged 22-27 which is consistent with the idea that flexibility to work long hard hours plays
a role in the NLH advantage 33
Intraprovincial migrants might have different outcomes since some of these applicants come from
suburban and rural areas that are very close to the city of Xiamen some of whom could commute to jobs in
the city
17
Consistent with efficiency-wage and intertemporal labor supply interpretations of
the NLH advantage row 3 of Table 8 shows that the NLH callback advantage decreases
with the origin provincersquos per capita GDP reflecting the pattern in Figure 1 While not
statistically significant in every specification this effect is significant (at 10 percent) in
the absence of controls (column 1) and in the most saturated specification (column 7)
which includes job ad fixed effects Row 2 of Table 8 also shows a larger NLH hiring
advantage for interprovincial applicants than for applicants from Xiamenrsquos own province
but this advantage disappears and becomes statistically insignificant in the presence of
firm or job ad fixed effects Similar results but with larger magnitudes are present in
Panel B of Table 8 which replicates Panel A for less-skilled jobs only (specifically for
ads requiring high school or less) where we have shown that firmsrsquo NLH preference is
strongest Here the coefficient on per capita GDP in the migrantrsquos home region is
statistically significant in a larger share of the specifications though it is not in column 7
where job ad fixed effects are present Panel C focuses on skilled jobs As expected it
shows a much smaller NLH advantage and no effects of origin-region GDP can be
identified
Overall we see Table 8rsquos results as supportive of both the efficiency wage and
intertemporal labor supply interpretations of the NLH hiring advantage Especially given
the fact that applicants from poorer regions are likely less qualified on a number of
unobservable dimensions we find it highly suggestive that employers seem to prefer non-
local applicants from poorer provinces to applicants from richer provinces
6 Discussion
To our knowledge this is the first paper to study employersrsquo hiring choices
between equally-qualified workers with and without permanent residence permits in the
region of employment Our main finding is that despite evidence of taste-based
discrimination against NLH persons from other studies (eg Dulleck Fooken and He
2012) and despite the fact that NLH workers likely have lower levels of transferable
unobserved skills than natives employers in our data are more likely to call back
identically-matched NLH than LH applicants to the same job Because this preference is
much stronger when firms are seeking to fill less-skilled positions it cannot be explained
by payroll tax differences between LH and NLH workers Explanations based on
between-job wage discrimination are ruled out by job ad fixed effects while a within-ad
wage discrimination scenario is hard to reconcile with the fact that the NLH preference
does not differ between posted-wage and non-posted wage ads
Another candidate to explain the callback gap in our data is selection
unregistered migrants may be more qualified than local-hukou workers While we expect
that positive selection probably plays some role in explaining the NLH callback
advantage we note that a purely selection-based story faces some challenges One is that
our detailed measures of observable skills show only very small differences between
migrants and natives most of which favor natives not migrants Thus a selection-based
18
explanation would require a different selection pattern on observables than observables
and would require this selection pattern to be confined to less-skilled workers Most
importantly to explain the NLH callback advantage vis-agrave-vis natives in our data positive
selection among migrants would need to be strong enough to outweigh migrantsrsquo likely
disadvantages in education quality and health in the poorer regions they come from
The above discussion suggests that explanations based on different choices made
by NLH versus LH workers in the destination city ndashsuch as work hours and effort levels--
deserve serious consideration Indeed both life cycle labor supply models and efficiency
wage models provide theoretical reasons to expect NLH workers to work longer and
harder than natives at the same wage while they are in the destination city These
predicted differences in labor supply are strongly supported by Census data on work
hours and employment rates Further NLH workersrsquo low social insurance coverage
provide a natural reason to expect a larger efficiency wage effect at low skill levels
Additional support comes from evidence that employersrsquo NLH preferences are weakest
among married women (who may have less flexibility to work long hard hours) and
strongest for NLH workers from Chinarsquos poorest provinces Indeed the negative relation
between source-province GDP per capita and firmsrsquo preferences for migrant workers
strikes us as especially supportive of efficiency wage and intertemporal labor supply
mechanisms because if anything we would expect workers coming from poorer regions
to have lower levels of unobserved skills
While we believe the above findings are thought-provoking we also emphasize
that they should be interpreted with a number of important caveats in mind One is the
fact that ndashas in all correspondence studies-- our dependent variable measures callbacks
only not whether a worker ultimately receives a job offer As a result our main result
could be in jeopardy if firms systematically make fewer offers per callback to NLH than
LH workers provided they do this more at low skill levels than high ones While we
cannot rule this out it is hard to think of plausible reasons why callback and offer
patterns might differ in this way34
Second recall that our sample of applicants is restricted to people who have
chosen to search for work online and on XMRCcom specifically Thus our main result
could also be explained by differential selection into online job search if this selection is
more positive among NLH than among LH workers While this is possible we note
again that it would require a different pattern of selection on unobservables than
34
A key source of the difficulty is that most unobserved factors that could affect callback rates should
theoretically affect offer rates conditional on callbacks in the same direction For example suppose (as
seems likely) that NLH workersrsquo productivity is harder to predict than natives In that case their higher
option value suggests that employers should not only interview more of them but make more job offers to
them as well (Lazear 1995) The same should apply if NLH workers are more likely to accept a job offer
than LH applicants both callbacks and offers should be higher with no clear prediction for the ratio of
offers to callbacks Equally challenging is identifying factors that affect callback and offer rates
differently but only for less-skilled workers In contrast there are clear reasons to expect stronger
efficiency wage and intertemporal labor supply effects among less skilled NLH workers compared to
skilled ones
19
observables In addition this difference in selection into online search would have to be
confined to low skill levels to explain our result Finally we note that Kuhn and Skuterud
(2004) find evidence of negative not positive selection into internet job search on
unobservables
Third recall that XMRC serves private-sector employers almost exclusively thus
our results say nothing about the preferences of public-sector employers and state-owned
enterprises which ndashas we have notedmdashare much more likely to employ LH than NLH
workers In fact since public sector and SOE jobs are sometimes explicitly reserved for
LH workers in China our results are consistent with a segmented labor markets scenario
in which ndashholding match quality fixed-- private-sector employers tend to prefer NLH
workers while public service and SOE employers prefer LH workers Indeed the latter
sectors which are generally not exposed to significant competitive pressures in product
markets may play an important role in sheltering native workers from competition with
the massive influx of migrants in many Chinese cities35
Fourth the generality of our results is limited by the fact that Chinese NLH
workers differ in important ways from workers with insecure or limited residency rights
in other jurisdictions For example unlike undocumented workers in the US employed
NLH workers are not at risk of summary deportation This might make NLH workers
more desirable employees than someone who could disappear unexpectedly as a result of
and Immigration and Customs Enforcement raid Also in contrast to US undocumented
workers and to temporary visa-holders in many countries the NLH workers in our
sample are relatively similar in language culture and ethnicity to locals as noted most of
them come from Fujian province in which Xiamen is located The NLH applicants in
our sample also have a very similar skill distribution to local applicants This contrasts
starkly to undocumented workers and holders of temporary visas in the United States
who tend to occupy the tails of the skill distribution Taken together these similarities in
culture and skills between Xiamenrsquos LH and NLH workers suggest that that our results
may come closer than other comparisons to isolating the lsquopurersquo effect of workersrsquo
insecure residency rights on firmsrsquo recruiting decisions Perhaps paradoxically our main
finding is that --at least at low skill levels-- limited residency rights appear to make
workers more attractive to employers
35
House (2012) documents a similar though more extreme phenomenon in Saudi Arabia where 90 percent
of private-sector jobs are held by foreigners while natives either work in the public sector or not at all
20
References
Aimeiaishenghu ldquoOutsiders can do a taxi driver in Beijingrdquo Wendacom May 20 2013
httpfinanceifengcommoneywealthstory201004232095640shtml (accessed April
22 2014)
Aluminum Corporation of China ldquo2012 college graduates recruitment noticerdquo Yingjieshengcom
January 16 2012 httpwwwyingjieshengcomjob-001-253-682html (accessed April
22 2014)
Bao Shuming Orn B Bodvarsson Jack W Hou and Yaohui Zhao ldquoThe Regulation of Migration
in a Transition Economyrdquo IZA discussion paper no 4493 October 2009
Barcellos Silvia H ldquoLegalization and the Economic Status of Immigrantsrdquo RAND working paper
no WR-754 March 2010
Bertrand Marianne and Sendhil Mullainathan lsquolsquoAre Emily and Greg More Employable Than
Lakisha and Jamal A Field Experiment on Labor Market Discriminationrsquorsquo American
Economic Review 94 (2004) 991ndash1013
Bodvarsson Orn B Jack W Hou and Kailing Shen ldquoAging and Migration in a Transition
Economy The Case of Chinardquo WISE working paper 2014
Borjas George ldquoSelf-Selection and the Earnings of Immigrantsrdquo American Economic Review
September 1987 77(4) 531-53
Borjas GJ and M Tienda 1993 ldquoThe Employment and Wages of Legalized Immigrantsrdquo
International Migration Review 27(4)712-747
Brencic Vera ldquoWage Posting Evidence from Job Adsrdquo Canadian Journal of Economics 45(4)
(Nov 2012) 1529-1559
Chan Kam Wing and Will Buckingham ldquoIs China Abolishing the Hukou Systemrdquo The China
Quarterly 195 September 2008 582-606
Depew Briggs Peter Norlander and Todd Sorensen ldquoFlight of the H-1B Inter-Firm Mobility
and Return Migration Patterns for Skilled Guest Workersrdquo IZA Discussion Paper No
7456 June 2013
Deacutemurger Sylvie and Hui Xu ldquoLeft-Behind Children and Return Decisions of Rural Migrants in
Chinardquo IZA discussion paper no 7727 (November 2013)
Dulleck Uwe Jonas Fooken and Yumei He 2012 ldquoPublic Policy and Individual Labor Market
Discrimination An Artefactual Field Experiment in Chinardquo Unpublished paper
Queensland University of Technology
Dustmann Christian 2000 ldquoTemporary Migration and Economic Assimilationrdquo Swedish
Economic Policy Review 7(2) 213-244
Goerg Sebastian and Thorsten Chmura ldquoGift exchange with migrant workers and students in
Chinardquo work in progress Florida State University
21
Hirsch Boris and Elke Jahn ldquoIs There Monopsonistic Discrimination Against Immigrantsrdquo IZA
discussion paper no 6472 April 2012
Hotchkiss Julie L and Myriam Quispe-Agnoli ldquoEmployer Monopsony Power in the Labor
Market for Undocumented Workersrdquo SSRN eLibrary December 2009
House Karen Elliott On Saudi Arabia its people past religion fault lines--and future New
York Knopf 2012
Huang Xiuli ldquoBeijing Lawyers are not welcome foreign lawyersrdquo Eduifengcom April 23 2010
(accessed April 22 2014)
Kossoudji SA and DA Cobb-Clark 2002 ldquoComing out of the Shadows Learning about Legal
Status and Wages from the Legalized Populationrdquo Journal of Labor Economics 20(3)
598-628
Kuhn Peter and Kailing Shen 2013 ldquoDo Chinese Employers Avoid Hiring Overqualified
Workers Evidence from an Internet Job Boardrdquo Research in Labor Economics 37 1-30
Kuhn Peter Miguel Delgado Helleseter and Kailing Shen 2014 ldquoEmployersrsquo Age and Gender
Preferences Direct Evidence from Four Job Boardsrdquo unpublished paper UCSB
Kuhn Peter and Mikal Skuterud ldquoldquoInternet Job Search and Unemployment Durationsrdquo American
Economic Review 94(1) (March 2004) 218-232
Kuhn Peter and Hani Mansour Is Internet Job Search Still Ineffective Economic Journal
forthcoming 2014
Lang K M Manove and W T Dickens ldquoRacial Discrimination in Labor Markets with Posted
Wage Offersrdquo American Economic Review September 2005 95(4) 1327-40
Lazear E P (1995) Hiring risky workers National Bureau of Economic Research Inc NBER
Working Papers 5334
Oreopoulos Philip ldquoWhy Do Skilled Immigrants Struggle in the Labor Market A Field
Experiment with Thirteen Thousand Resumesrdquo American Economic Journal Economic
Policy 4 (Nov 2011) 148-171
Rivera-Batiz FL 1999 ldquoUndocumented Workers in the Labor Market An Analysis of the
Earnings of Legal and Illegal Mexican Immigrants in the United Statesrdquo Journal of
Population Economics 12(1) 91-116
Summers LH Some Simple Economics of Mandated Benefits American Economic Review 79
(May 1989) 177-183
Tse Chun-Wing ldquoUrban Residents Discrimination and Well-Being of Rural-to-Urban Migrants
in Chinardquo unpublished paper Central University of Finance and Economics Beijing
2014
Xiamen News Net (August 27 2013) ldquoXiamen hundreds of people took to the streets because of
their children to school probemsrdquo httpfjqqcoma20130827014835_allhtm (accessed
April 182014)
Table 1 Employment Statistics by Hukou and Current Residence 2005 Census
All Urban Residents in Major Cities Residents of Xiamen
A ALL WORKING-AGE PERSONS With
Local Hukou
With
Non-local Hukou
With
Local Hukou
With
Non-local Hukou
(1) (2) (3) (4)
Age
18-25 9 15 12 18
26-35 21 33 27 42
36-45 28 26 28 24
46-55 28 17 23 12
56-65 13 8 10 3
Education
Primary (6 years or less) 7 20 21 26
Junior Middle School (9 years) 31 44 25 40
High School (12 years) 34 21 27 21
Junior Technical School (15 years) 16 8 13 7
University Degree (16 years or more) 12 7 14 5
Employment status
employed 62 77 68 83
not employed 38 23 32 17
Sources of income
labor market 61 76 67 81
public transfers 23 6 13 3
capital income 3 3 3 2
family members 13 15 16 14
Social insurance coverage
UI covered 44 18 38 21
pension covered 72 31 60 30
medical insurance covered 69 42 73 39
Share of the population 49 51 44 56
23
Table 1 continued
Note Data are from the 2005 Census of China 1 sample persons aged 15-65 healthy current living in urban regions excluding students All rural
hukou individuals are regarded as without local hukou in the urban area Major cities are the 4 municipalities directly under the jurisdiction of the central
government (Beijing Shanghai Tianjing and Chongqing) and the 15 subprovincial cities Xiamen is one of the 15 subprovincial cities
All Urban Residents in Major Cities Residents of Xiamen
B WORKERS ONLY With
Local Hukou
With
Non-local Hukou
With
Local Hukou
With
Non-local Hukou
(1) (2) (3) (4)
Weekly working hours (mean) 4410 4914 4649 5489
1-39 hours 4 8 8 6
40 hours 66 35 47 21
41-56 hours 23 39 33 41
57 hours or more 7 18 12 33
Employer type
public sector 21 7 21 4
SOE ( includes collectives) 41 15 23 11
self employment 11 24 13 25
private enterprise 23 32 31 43
other 5 23 13 17
Nature of work contract
fixed term 34 33 43 37
infinite term 40 15 23 7
no contract 27 52 35 57
Duration of contract if fixed term
1 year or below 59 73 62 71
1-2 years 12 10 13 10
2-3 years 19 11 21 12
more than 3 years 9 6 5 6
Share of the population 43 57 39 61
24
Table 2 Sample Means by Applicantrsquos Hukou Status XMRC Data
Local Hukou
Non-Local
Hukou a Contacted by HR department 0071 0085
bCharacteristics of the Applicant
Education (years) 1442 1438
Age (years) 2595 2458
Experience (years) 409 315
New Graduate 0131 0191
Female 0594 0542
Current wage listed 0686 0689
Current wage if listed (yuanmonth) 2313 2263
Completed Tech School 0315 0158
Married 1126 1195
Occupational Qualification (Zhicheng) 0336 0299
Myopic 1655 1656
Height (cm) 0129 0127
English CV as well 0838 0783
Number of Schools listed in the CV 2720 2417
Number of Experience Spells described in the CV 1383 1178
Number of Certifications 1442 1438
c Characteristics of the Job Ad
Education Requested (years) 1268 1253
Desired Age Range specified 0546 0536
Desired Age if Requested (midpoint of interval) 2745 2708
Experience Requested 1022 0932
New Graduate Requested 0048 0045
Male Applicants Requested 0127 0132
Female Applicants Requested 0326 0297
Wage Advertised 0568 0588
Wage if advertised (yuanmonth midpoint of interval) 2324 2372
Number of positions advertised 1893 2130
Number of applicants 1821 1920
d Characteristics of the Firm Placing the Ad
Domestically Owned 0692 0728
Taiwan Hong Kong Ownership 0095 0085
Foreign Owned 0160 0146
Other (eg non-profits) 0053 0041
Xiamen Firm Location 0969 0970
Fujian Firm Location 0026 0026
Other Firm Location 0005 0004
Number of Employees 634 556
e Sample Size 19314 217814
Note LH-NLH gaps in Current wage listed English CV Xiamen Firm Location Fujian Firm Location are not
statistically significant Height differs at the 10 level New graduate requested and Male Applicant requested and
Other firm location differs at 5 and all remaining variables at 1 Zhicheng level is an integer ranging from 1 to
6 LH in Table 2 and throughout our main analysis denotes Xiamen city hukou only workers with Fujian province
(but not Xiamen) hukou are treated as NLH because their legal status in the city is the same as workers from other
provinces
Table 3 Effects of Non-Local Hukou on the Probability of Employer Contact Linear Probability Models
(1) (2) (3) (4) (5) (6) (7)
Non-Local Hukou (NLH) 0140 0125 0114 0100 0117 0082 0080
(0028) (0026) (0025) (0024) (0023) (0019) (0019)
Education less than requested -0067 -0133 -0130 -0122 -0103 -0101
(0049) (0055) (0052) (0053) (0026) (0025)
Education more than requested -0043 0016 0000 -0005 0020 0021
(0031) (0038) (0037) (0038) (0017) (0016)
Age less than requested1
-0008 -0025 -0025 -0003 -0096 -0120
(0058) (0058) (0058) (0052) (0033) (0032)
Age more than requested1
-0292 -0270 -0255 -0157 -0211 -0264
(0087) (0088) (0084) (0074) (0071) (0076)
Experience less than requested2
-0067 -0070 -0076 -0103 -0110 -0112
(0057) (0057) (0054) (0052) (0025) (0025)
Experience more than requested2
0003 -0003 -0007 -0003 -0016 -0015
(0032) (0028) (0027) (0026) (0017) (0016)
Wage below advertised3
0004 -0001 -0009 -0019 -0005 0002
(0040) (0040) (0038) (0038) (0023) (0022)
Wage above advertised3
-0004 0001 -0011 -0019 -0074 -0084
(0039) (0039) (0039) (0042) (0023) (0023)
Sex differs from requested -0109 -0105 -0085 -0060 -0060 -0051
(0050) (0050) (0047) (0045) (0033) (0031)
Number of positions advertised (100) 5345 3016
(2177) (2015)
Number of applicants (100) -0134 -0088
(0027) (0023)
Detailed CV controls No No Yes Yes Yes Yes Yes
Occupation Fixed Effects No No No Yes Yes Yes No
Firm Fixed Effects No No No No No Yes No
Ad Fixed Effects No No No No No No Yes
Observations 237128 237128 232600 232600 232600 232600 232600 R-squared 0002 0045 0050 0172 0269 2710 2955
Standard errors in parentheses clustered by ad plt001 plt005 plt01
26
Notes to Table 3
1 Age matching variables refer to whether the applicantrsquos age is below within or above the requested age range
2 Experience matching variables refer to whether the applicantrsquos experience is below 0-2 years above or more than 3 years above the requested experience level
3 Wage matching variables refer to whether the applicantrsquos current wage and the advertised wage are in the same wage bin (8 bins are used)
In addition to the covariates shown columns 2-7 include the following covariates the jobrsquos requested education level (5 categories) requested experience level
(quadratic) requested age level (quadratic in midpoint of range) requested gender (male female not specified) advertised wage (quadratic in midpoint of bin 8 bins)
and dummies for whether a new graduate is requested for whether the worker is a new graduate for whether the workerrsquos new graduate status matches the employerrsquos
request and whether the worker is female Indicators for missing age and wage information for either the ad or the worker are also included
Columns 3-7 also include controls for the following worker (CV) characteristics (these characteristics are not mentioned in job ads very often) whether attended technical
school the applicantrsquos Zhicheng rank (6 categories) whether the CV is in English the number of schools attended number of job experience spells number of
certifications reported applicant height (interacted with applicant gender) an indicator for myopia indicator (interacted with applicant gender) and marital status
(interacted with applicant gender)
Sample size drops between columns 3 and 4 because height information is missing for 19 percent of the cvs
27
Table 4 Effects of Non-Local Hukou (NLH) on Job Offer Probabilities by Required Education
(1) (2) (3) (4) (5) (6) (7)
Primary 0358 0251 0240 0212 0214 0114 0117
(6 years or less) (0097) (0077) (0078) (0079) (0079) (0058) (0059)
Junior Middle School 0465 0352 0339 0351 0365 0262 0216
(9 years) (0134) (0118) (0121) (0123) (0123) (0109) (0107)
Senior Middle School 0184 0234 0214 0164 0143 0225 0159
(12 years) (0077) (0072) (0072) (0073) (0072) (0064) (0058)
Technical School -0115 -0087 -0083 -0044 0020 -0194 -0105
(12 years) (0104) (0104) (0104) (0106) (0104) (0082) (0070)
College 0079 0032 0024 0023 0042 0057 0057
(15 years) (0051) (0040) (0040) (0038) (0038) (0029) (0029)
University Degree -0032 0059 0053 0035 0050 0002 0025
(16 years) (0115) (0093) (0088) (0088) (0087) (0050) (0050)
Detailed CV controls Yes Yes Yes Yes Yes
Occupation Fixed Effects Yes Yes Yes Yes
Firm Fixed Effects Yes No
Ad Fixed Effects Yes
Observations 237128 237128 232600 232600 232600 232600 232600
R-squared 0022 0046 0051 0173 0270 2711 2956
Standard errors in parentheses clustered by ad
plt001 plt005 plt01
See Table 3 for regression specifications
28
Table 5 Effects of Non-Local Hukou (NLH) on Contact Rate by the Jobrsquos Posted Wage Level
(1) (2) (3) (4) (5) (6) (7)
Posted Wage
Around 1000 yuanmonth 0795 0846 0843 0873 0756 0264 -0090
(0331) (0358) (0363) (0368) (0388) (0501) (0678)
1000-2000 yuanmonth 0128 0175 0154 0130 0138 0139 0142
(0065) (0061) (0061) (0059) (0058) (0047) (0048)
2000-3000 yuanmonth 0073 0038 0012 0011 0047 0073 0059
(0061) (0061) (0060) (0057) (0058) (0045) (0048)
3000-4000 yuanmonth 0099 0009 -0007 -0038 -0094 -0097 0071
(0149) (0150) (0150) (0147) (0142) (0100) (0078)
4000-5000 yuanmonth 0525 0379 0374 0345 0293 0326 0018
(0255) (0223) (0224) (0215) (0208) (0201) (0165)
More than 5000 yuanmonth 0423 0108 0107 0071 0062 -0315 -0216
(0196) (0337) (0339) (0351) (0332) (0276) (0275)
Basic Ad CV and Match controls Yes Yes Yes Yes Yes Yes
Detailed CV controls Yes Yes Yes Yes Yes
Occupation Fixed Effects Yes Yes Yes Yes
Firm Fixed Effects Yes No
Ad Fixed Effects Yes
Observations 96689 96689 95477 95477 95477 95477 95477
R-squared 0015 0053 0061 0148 0232 2539 2727
Standard errors in parentheses clustered by ad
plt001 plt005 plt01
See Table 3 for Regression Specifications
29
Table 6 Effects of Non-Local Hukou (NLH) on Contact Rate by whether a wage was advertised
(1) (2) (3) (4) (5) (6) (7)
Ad posted a wage 0144 0137 0127 0114 0130 0070 0067
(0035) (0030) (0030) (0030) (0029) (0023) (0023)
Ad didnrsquot post a wage 0135 0107 0095 0079 0097 0100 0100
(0040) (0042) (0042) (0040) (0039) (0031) (0031)
Basic Ad CV and Match controls Yes Yes Yes Yes Yes Yes
Detailed CV controls Yes Yes Yes Yes Yes
Occupation Fixed Effects Yes Yes Yes Yes
Firm Fixed Effects Yes No
Ad Fixed Effects Yes
Observations 237128 237128 232600 232600 232600 232600 232600
R-squared 0002 0045 0050 0172 0269 2710 2955
p-value for posted wage = not posted 8669 5438 5265 4896 5072 4355 3767
Standard errors in parentheses clustered by ad
plt001 plt005 plt01
See Table 3 for Regression Specifications
30
Table 7 Effects of Non-Local Hukou (NLH) on Contact Rate by Applicants gender and marital status
(1) (2) (3) (4) (5) (6) (7)
singlefemale 0085 0086 0062 0052 0077 0051 0057
(0037) (0036) (0037) (0035) (0034) (0028) (0028)
marriedfemale 0045 0033 0071 0041 0073 0056 0068
(0041) (0041) (0056) (0054) (0053) (0042) (0042)
singlemale 0210 0204 0161 0149 0148 0103 0096
(0041) (0037) (0040) (0040) (0040) (0033) (0033)
marriedmale 0217 0164 0233 0220 0229 0167 0134
(0057) (0046) (0061) (0061) (0060) (0048) (0048)
Basic Ad CV and Match controls Yes Yes Yes Yes Yes Yes
Detailed CV controls Yes Yes Yes Yes Yes
Occupation Fixed Effects Yes Yes Yes Yes
Firm Fixed Effects Yes No
Ad Fixed Effects Yes
Observations 237128 237128 232600 232600 232600 232600 232600
R-squared 0007 0045 0050 0173 0270 2710 2955
Standard errors in parentheses clustered by ad
plt001 plt005 plt01
See Table 3 for Regression Specifications
31
Table 8 Effects of Origin Provincesrsquo GDP on the Probability Employer Contact for Non-Local Hukou (NLH)
(1) (2) (3) (4) (5) (6) (7)
A Full Sample
Non-Local Hukou (NLH) 0123 0114 0105 0094 0113 0083 0082
(0028) (0026) (0025) (0024) (0024) (0019) (0019)
Other than Fujian (Local) Province (OH) 0077 0063 0049 0029 0016 -0009 -0014
(0024) (0023) (0023) (0022) (0022) (0018) (0018)
OHOrigin Provincersquos per capita GDP -0044 -0023 -0026 -0028 -0030 -0034 -0031
(0025) (0023) (0023) (0023) (0023) (0020) (0020)
OHLog of Railroad Distance (in km) 0051 0052 0047 0031 0029 0017 0014
(0024) (0023) (0023) (0023) (0023) (0019) (0018)
Observations
R-squared
237127 237127 232599 232599 232599 232599 232599
0003 0045 0050 0172 0269 2710 2955
B Jobs Requiring High School Education or Less
Non-Local Hukou (NLH) 0229 0222 0218 0186 0192 0152 0147
(0052) (0050) (0050) (0046) (0045) (0038) (0038)
Other than Fujian (Local) Province (OH) 0056 0043 0034 0024 0006 -0007 -0009
(0047) (0045) (0044) (0042) (0043) (0037) (0036)
OHOrigin Provincersquos per capita GDP -0084 -0074 -0085 -0080 -0087 -0052 -0045
(0047) (0047) (0046) (0044) (0043) (0038) (0038)
OHLog of Railroad Distance (in km) 0059 0061 0059 0053 0052 0030 0025
(0039) (0039) (0040) (0039) (0039) (0032) (0032)
Observations
R-squared
74429 74429 73344 73344 73344 73344 73344
0006 0073 0079 0278 0374 2664 2902
C Jobs Requiring Tech School Education or More
Non-Local Hukou (NLH) 0076 0068 0062 0054 0075 0054 0057
(0033) (0030) (0029) (0028) (0028) (0022) (0022)
Other than Fujian (Local) Province (OH) 0070 0066 0049 0018 0009 -0014 -0019
(0028) (0027) (0026) (0025) (0024) (0020) (0020)
OHOrigin Provincersquos per capita GDP -0001 0001 -0003 -0003 -0004 -0027 -0023
(0027) (0026) (0027) (0026) (0026) (0023) (0023)
OHLog of Railroad Distance (in km) 0041 0044 0035 0008 0007 0008 0006
(0029) (0029) (0029) (0028) (0028) (0023) (0022)
Observations
R-squared
162698 162698 159255 159255 159255 159255 159255
0002 0026 0034 0203 0320 2805 2972
plt001 plt005 plt01 Standard errors in parentheses clustered by ad
See Table 3 for regression specifications Per capita GDP refers to 2008-2010 measured in logs and standardized Railroad distance is between the capital cities of the
origin province and Fujian (Bodvarsson Hou and Shen (2014) and is normalized to have a mean of zero for the non-Fujian provinces
32
Figure 1 Mean Callback Rates of NLH Applicants by Origin Provincersquos per capita GDP
Symbol size is proportional to the number of observations from the source province
Linear regression line is weighted by number of observations from the province 95 confidence band is shown
Beijing
Tianjin
Hebei
Shanxi
Inner Mongolia
Liaoning
Jilin
Heilongjiang
Shanghai
Jiangsu
Zhejiang
Anhui
JiangxiShandong
Henan
Hubei
Hunan
Guangdong
GuangxiHainan
Chongqing
Sichuan
Guizhou
Yunnan
Shaanxi
Gansu
Qinghai
Ningxia
Xinjiang
07
08
09
1
11
12
Mea
n C
on
tact
Rat
es
-2 -15 -1 -5 0 5 1 15 2 25Standardized GDP
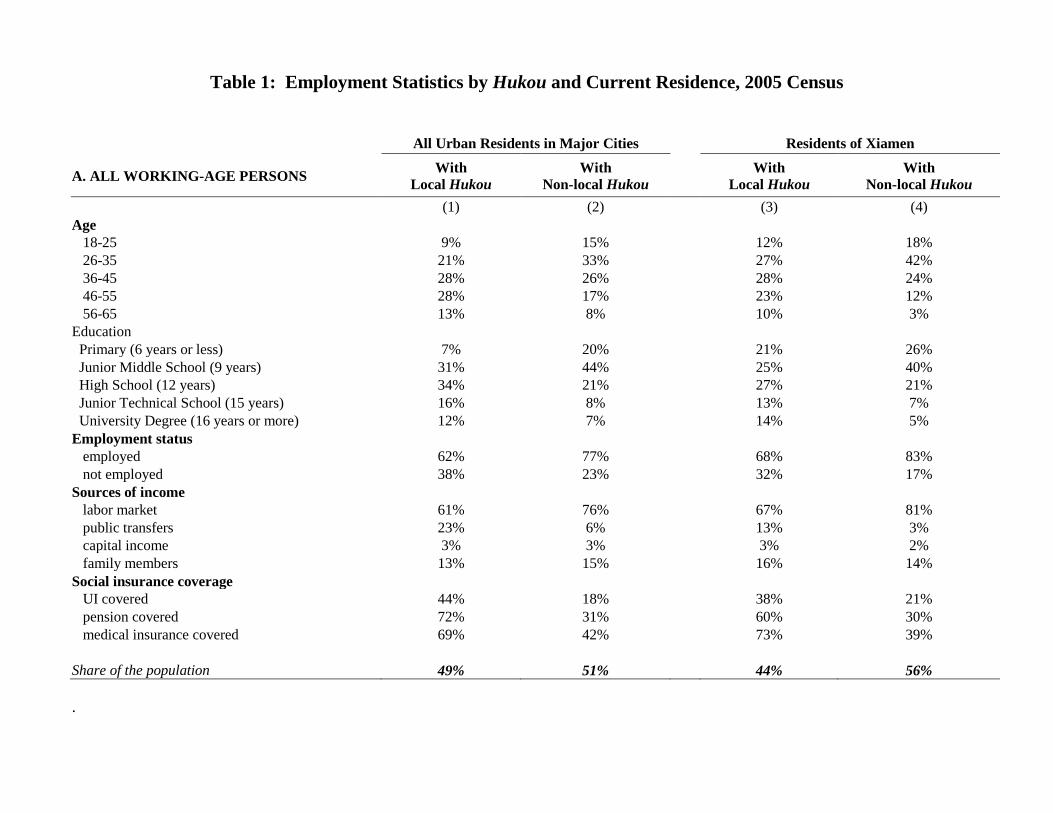
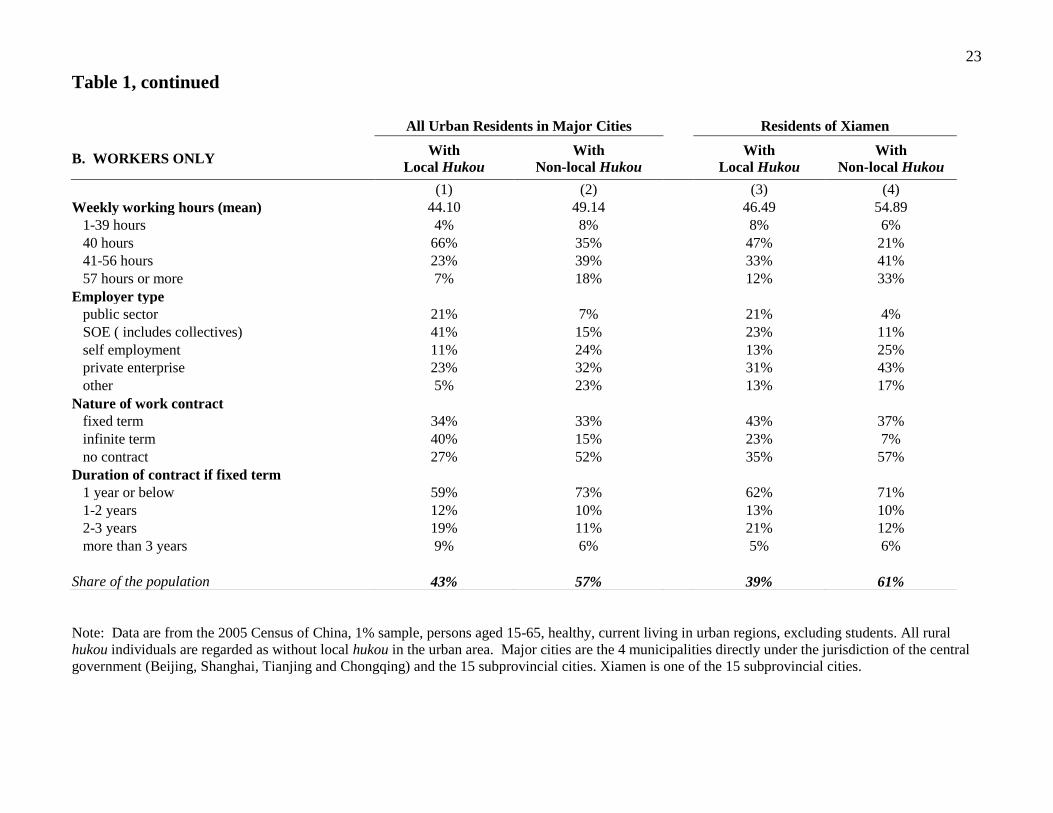
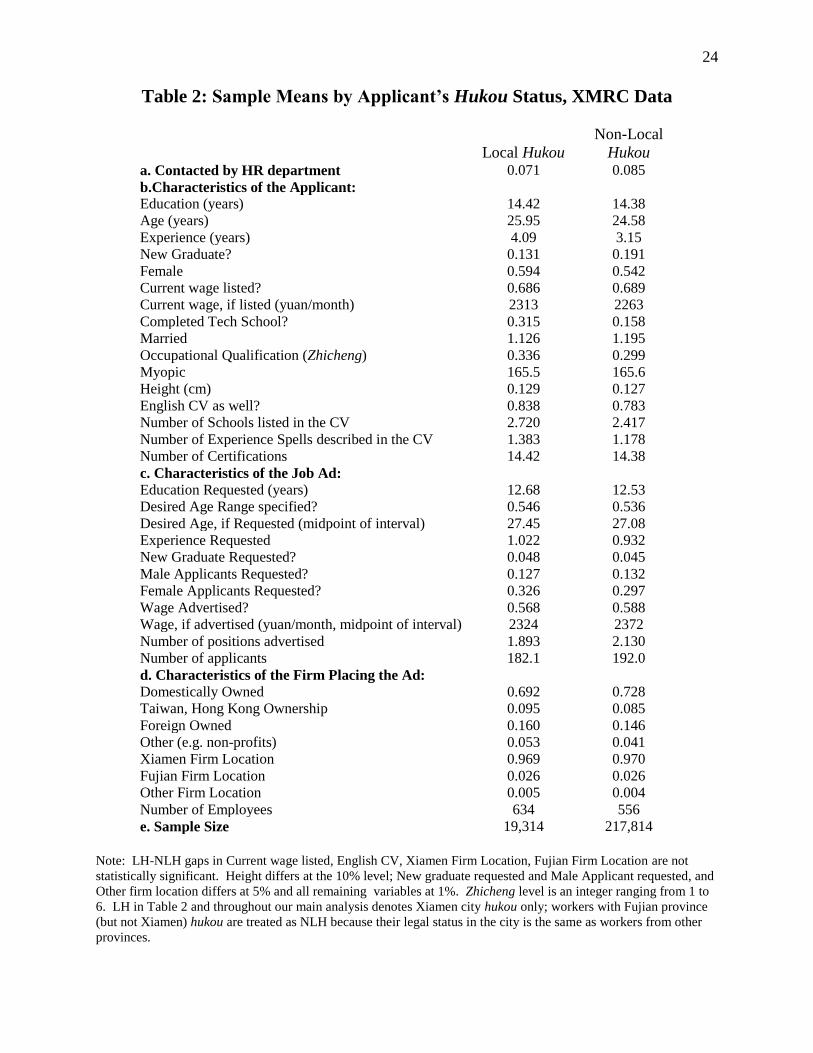
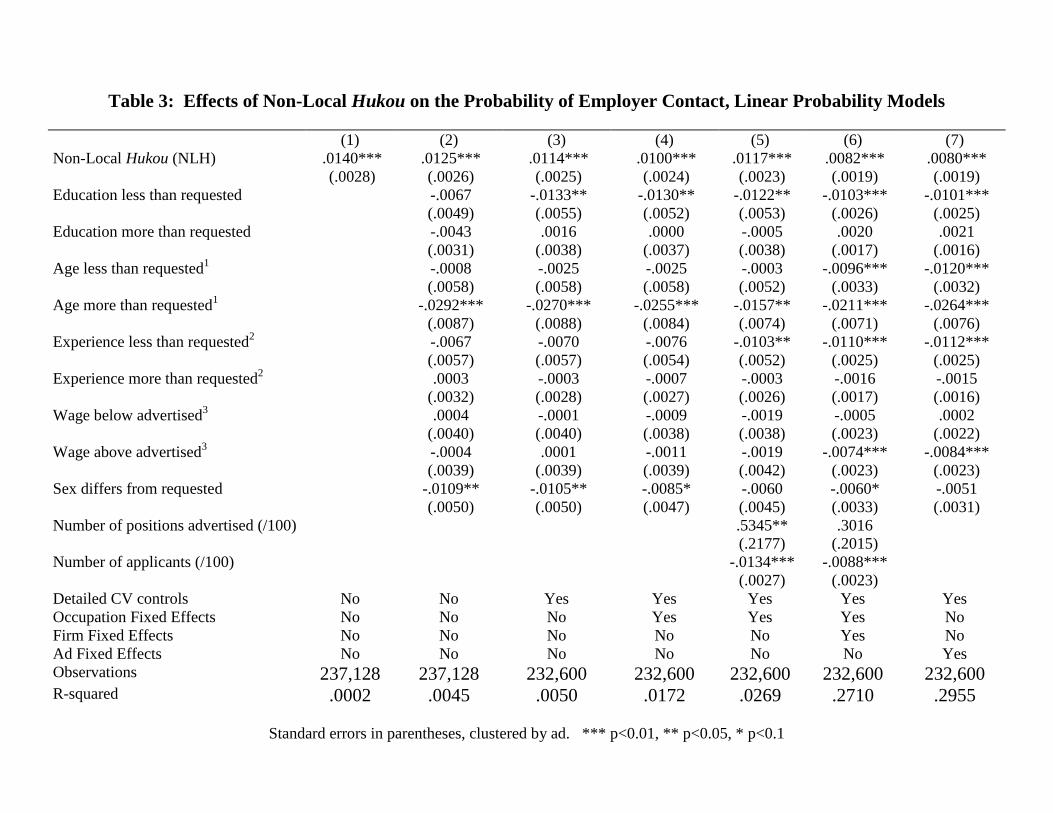
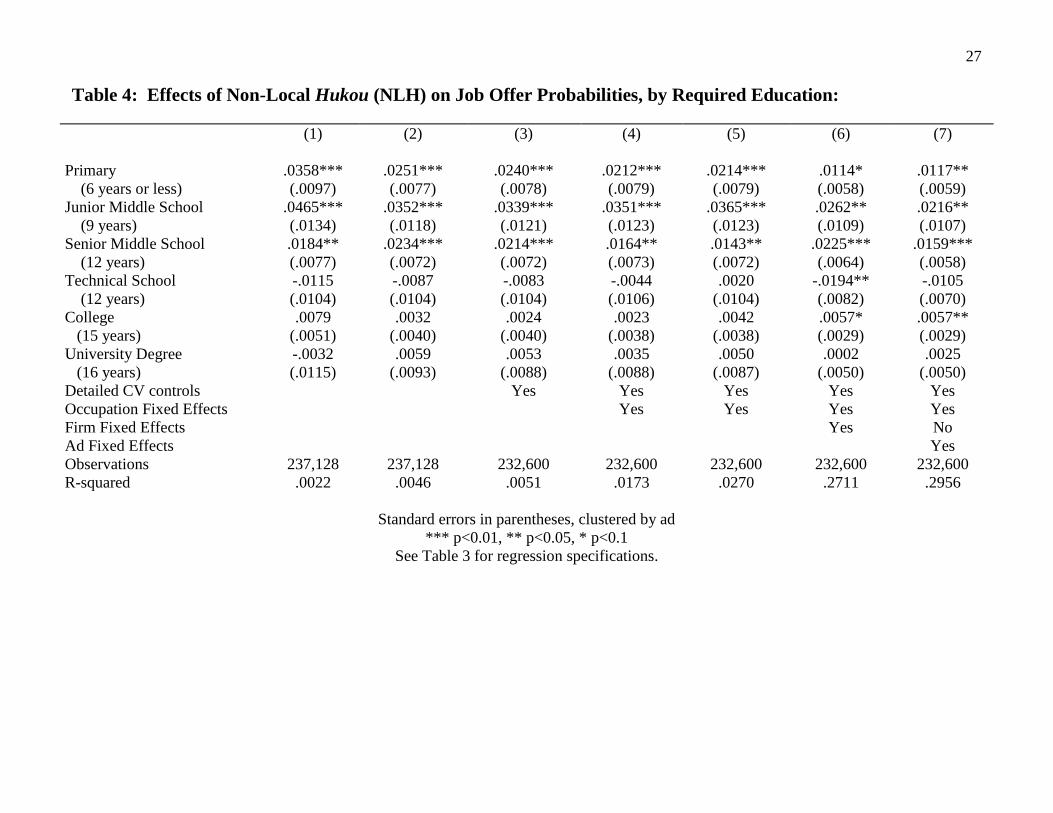
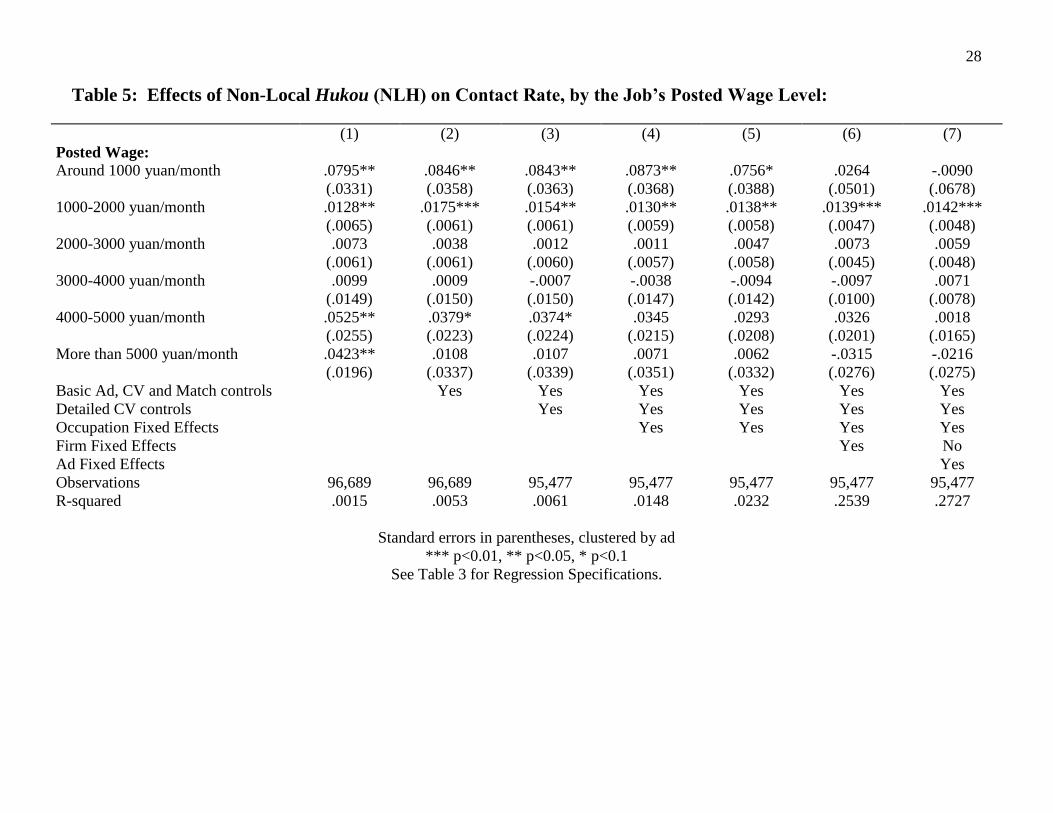
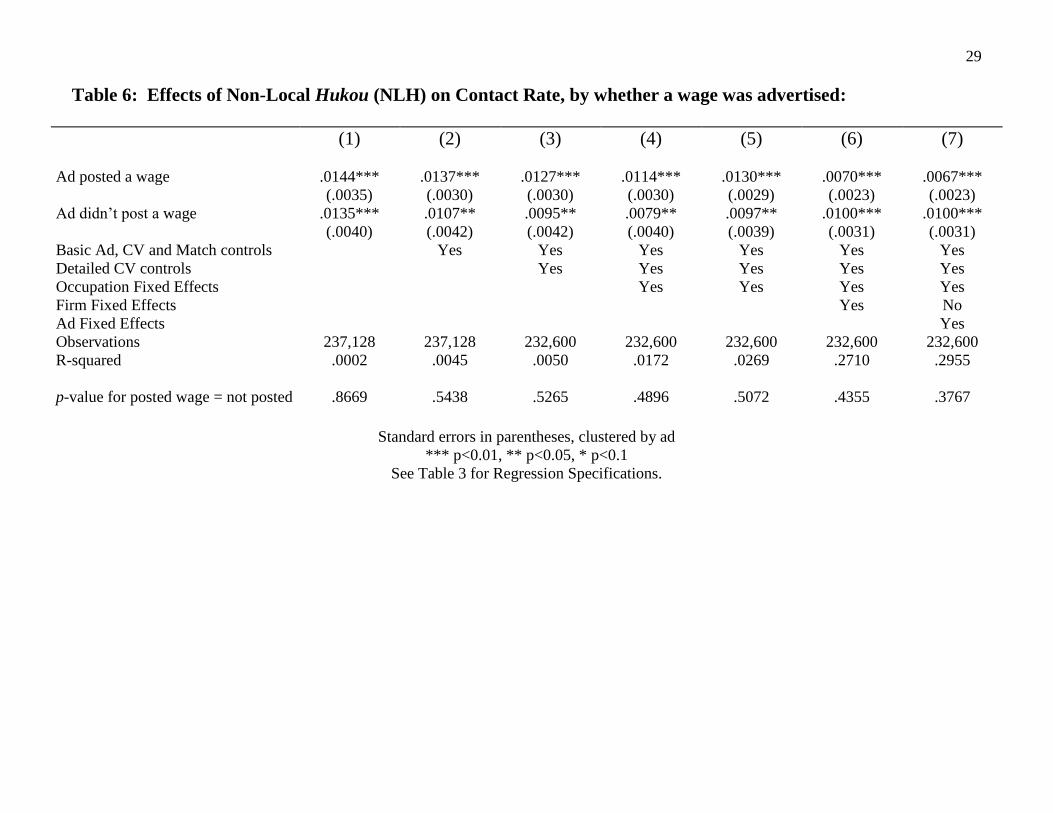
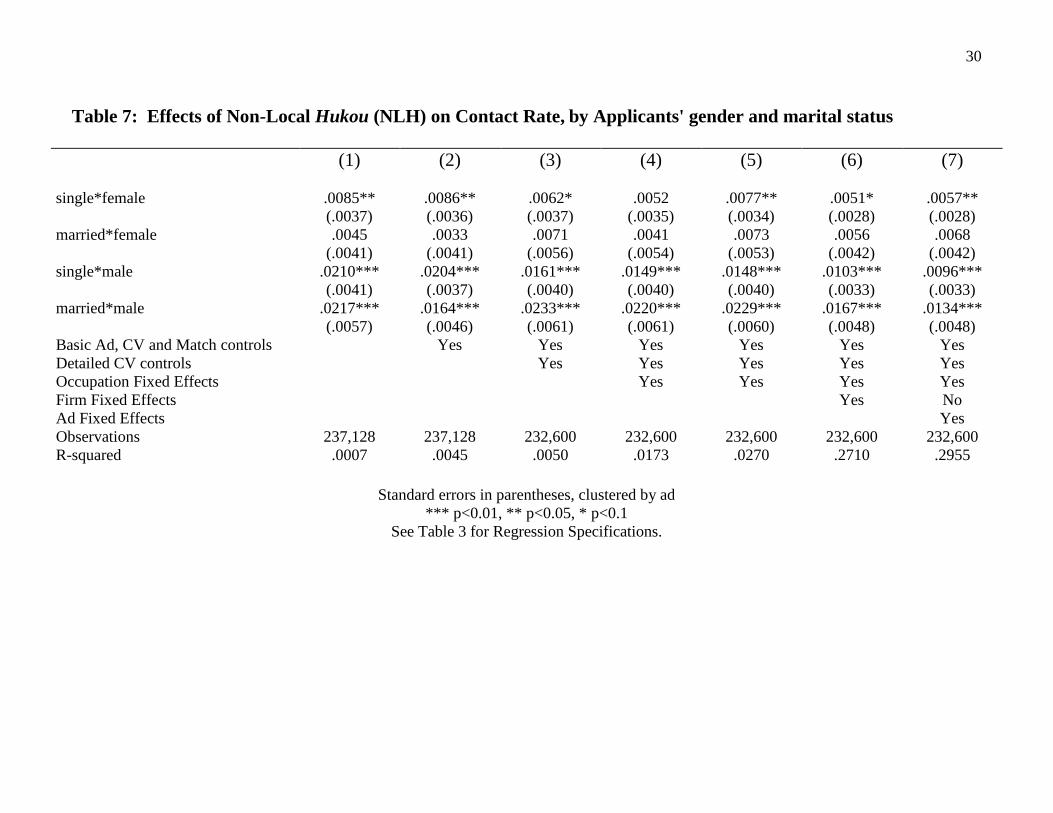
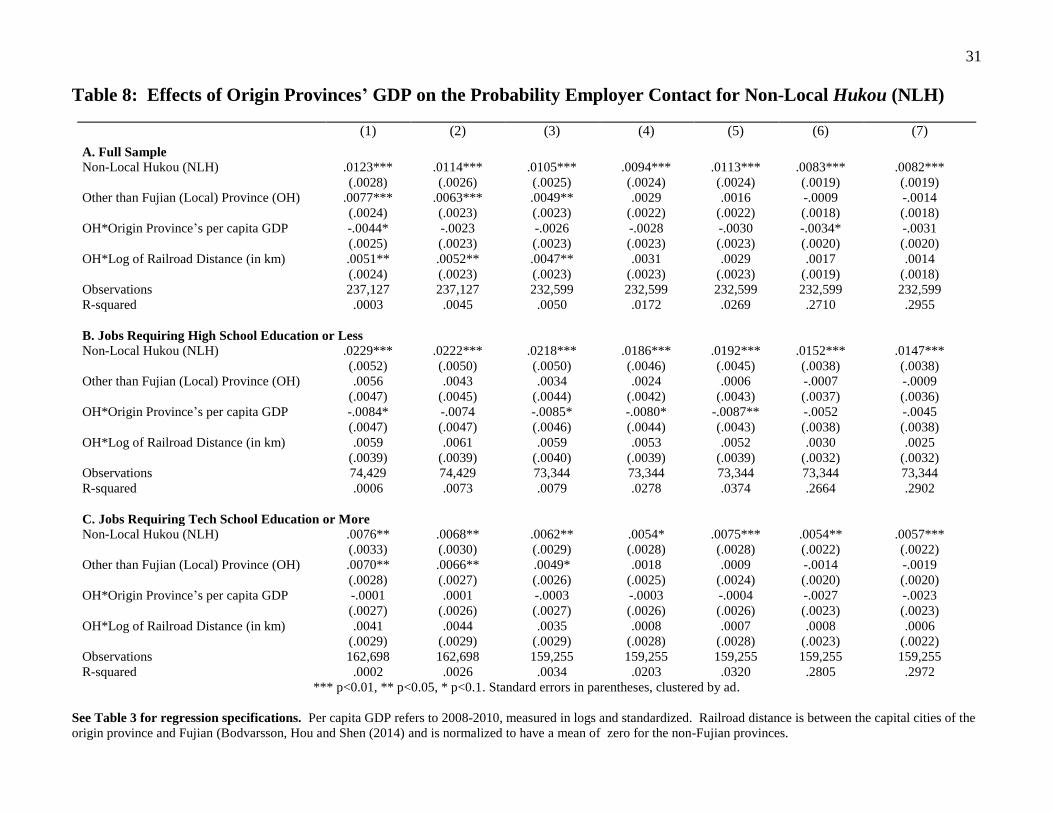
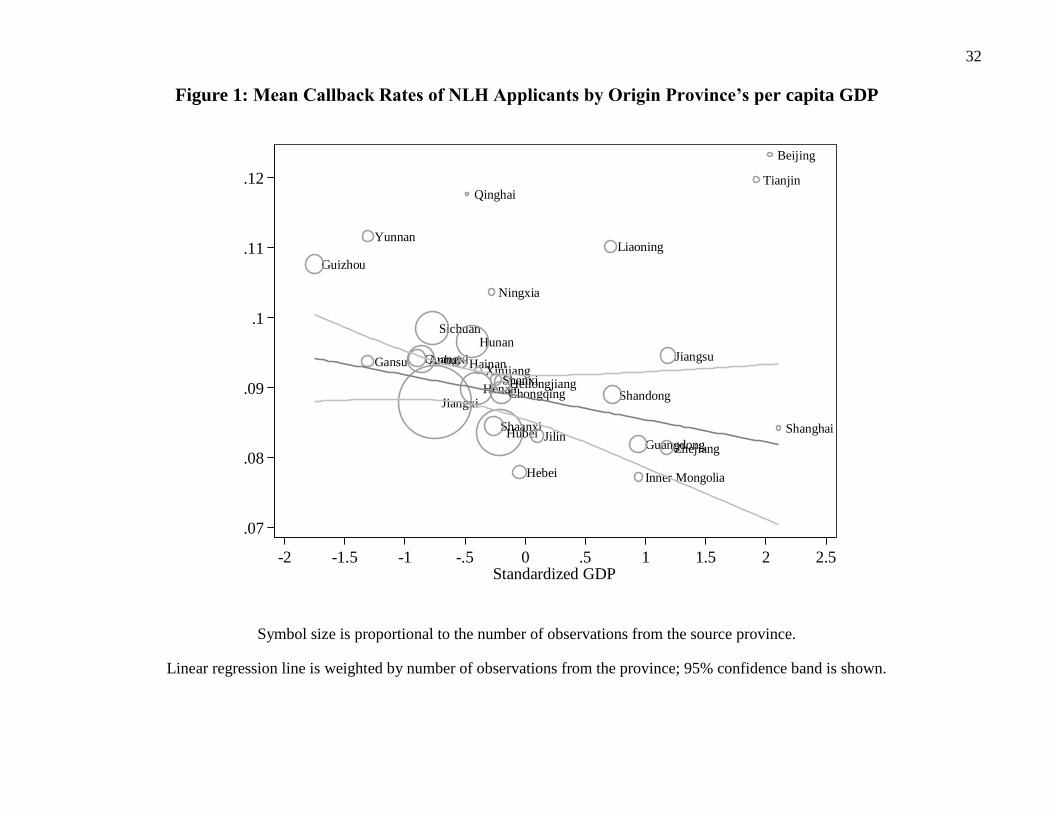