dlr-onera accurate cfd support for the pre-x project · 4,5 onera, toulouse center, dmae, b.p....
TRANSCRIPT
1
DLR-ONERA accurate CFD support for the Pre-X project
J. Oswald1, H. Lüdeke2, J. Longo3, F. Thivet4, J. Hylkema5, M. Spel6, W. Dieudonné7
1CNES Evry, Rond point de l'espace – Courcouronnes 91023 Evry Cedex, France, [email protected] 2,3DLR Braunschweig, Lilienthalplatz 7 D-38108 Braunschweig, Germany, [email protected]
4,5ONERA, Toulouse Center, DMAE, B.P. 4025, F-31055 Toulouse Cedex 04, France, [email protected] 6,7R.Tech, Parc Technologique Cap Delta, F-09340 Verniolle, France, [email protected]
Absract : During the development of Pre-X demonstrator supported by CNES , industries are in charge of aerodynamic and aerothermodynamic defintion and characterisation of the vehicle. For this preliminary phase of the project, most of the time industries only used Euler computations associated to boundary layer, so that a lot of parametric analysis can be carried out and the feasibility of the project was globally checked. It is clear that deeper analyses for some critical trajectory points are required to overcome potential infeasibilities. The main objective of the accurate CFD support, provided by DLR and ONERA consists in assessing these high level objectives. Two critical issues are investigated. The heat fluxes level on the windward side of the body, the deflected flap in the hypersonic regime and the aerodynamic static margin at the end of the trajectory in the supersonic regime. Two relevant codes where used: the TAU code from DLR and CELHYO3D from ONERA. • The unstructured TAU code is a finite volume Navier-Stokes solver which is validated in a wide range of
sub- trans- and hypersonic cases. Different one and two equation turbulence models are implemented and chemical equilibrium as well as non equilibrium flows can be modelled. Furthermore adaptation of tetrahedral grids on any given output quantity is possible.
• The structured CELHYO3D code is a finite volume Navier-Stokes solver with upwind schemes adapted to supersonic and hypersonic flows. Flows of air or CO2 in chemical or thermo-chemical non-equilibrium can be considered. A specific grid management procedure is used in order to provide shock-adapted grids together with information of the grid-convergence of the results.
The results of the computations with TAU and CELHYO3D confirm the feasibility of the project with respect to the heat-flux and static-margin issues.
1 – Introduction Since late 2000, CNES, French space agency, has engaged a feasibility study for an experimental vehicle, named Pre-X, aimed at providing in-flight data to improve the prediction of Aerothermo-dynamics (ATD) and Thermal Protection Systems (TPS) features of future Reusable Launch Vehicles �[1]. The CNES has engaged with EADS-ST as the leading contractor for the feasibility of this Pre-X experiment generation with the support of DASSAULT for aerodynamic synthesis and of various other European partners. This demonstrator is designed to perform re-entry conditions from hypersonic down to supersonic conditions. At this level of definition of the vehicle corresponding to the first part of phase i in the development process, some critical issues were not yet investigated. So before engaging the next development phase, a confirmation that these issues won't kill the feasibility of the vehicle is requested. The aerodynamic is a key activity with respect to preliminary design and targeted objectives. Most of the aerodynamic analysis performed up to the beginning of this phase, were only based on Euler computations. The aerothermodynamic characteristic of the vehicle at the beginning of the hypersonic flight must be clearly identified and compared to preliminary results, in particular the shock boundary layer interaction or shock shock interactions which have therefore to be investigated. During this phase, only one wind tunnel campaign was carried out at Sigma 4 (IAT St Cyr), in order to assess supersonic characteristic. So the sting support influence on the wind tunnel data has to be analysed. Two main contributors were not yet involved in the Pre-X development DLR and ONERA. In order to demonstrate at the same time their capacity to provide accurate CFD data and an advantage of the Pre-
2
X project from cooperation, both DLR and ONERA has proposed to carried out some accurate CFD on their own budget. Two issues are investigated by DLR on their own resources, the heat flux level on the windward side of the body for chemical non equilibrium flow at Mach 25 and the influence of the wind tunnel support on the aerodynamic coefficients and the wake for M=2 conditions. ONERA, supported by the internal project Hypersonic In-Flight Measurements (PRF MH) has also carried out full 3D non-equilibrium Navier-Stokes computations at Mach 25 and attention was focused on the vehicle windward side. Finally CNES project in advance to what will be done in the next phase for both institute has financed ONERA for an other computation at Mach 17,75 dedicated to transitional study. This paper presents the high level CFD results of DLR and ONERA on preX project phase i
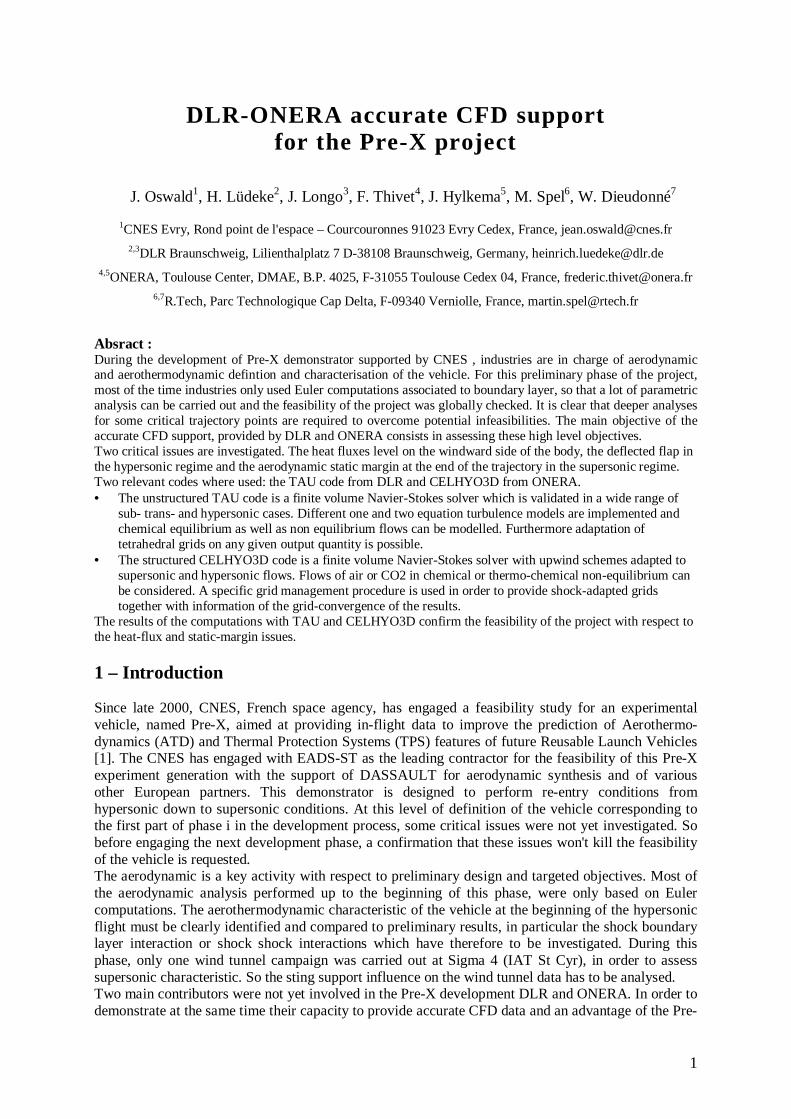
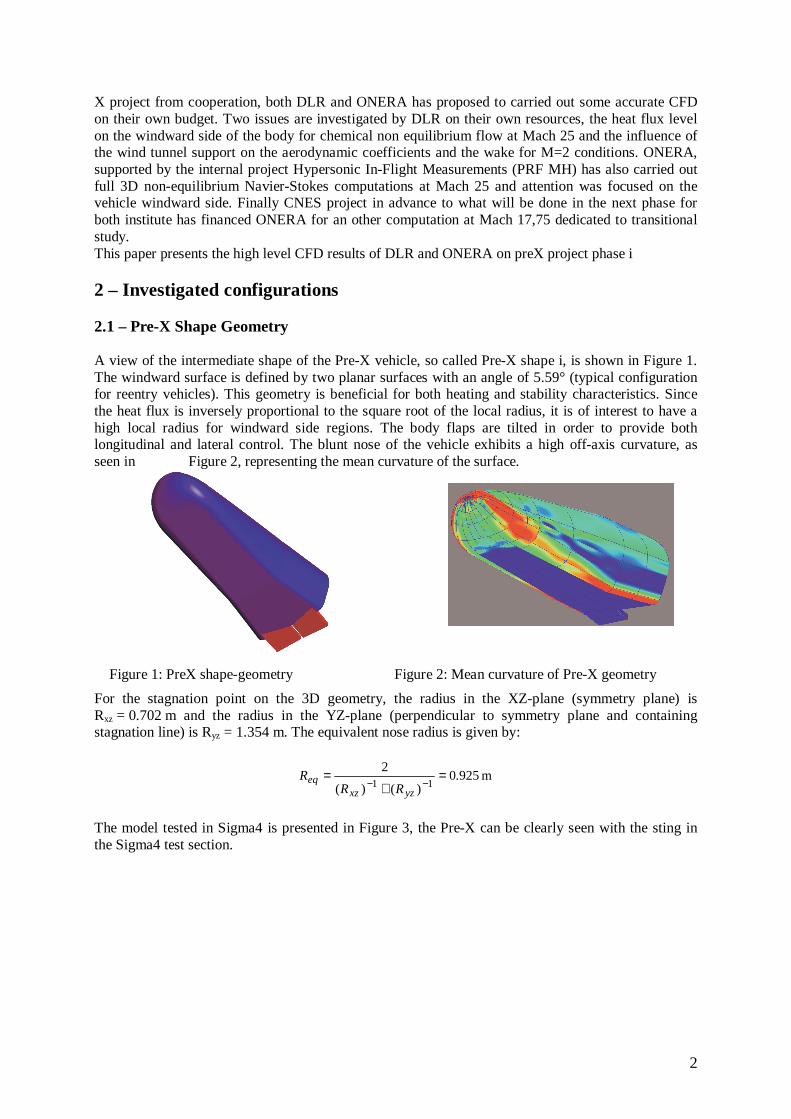
2 – Investigated configurations 2.1 – Pre-X Shape Geometry A view of the intermediate shape of the Pre-X vehicle, so called Pre-X shape i, is shown in Figure 1. The windward surface is defined by two planar surfaces with an angle of 5.59° (typical configuration for reentry vehicles). This geometry is beneficial for both heating and stability characteristics. Since the heat flux is inversely proportional to the square root of the local radius, it is of interest to have a high local radius for windward side regions. The body flaps are tilted in order to provide both longitudinal and lateral control. The blunt nose of the vehicle exhibits a high off-axis curvature, as seen in Figure 2, representing the mean curvature of the surface.
Figure 1: PreX shape-geometry Figure 2: Mean curvature of Pre-X geometry
For the stagnation point on the 3D geometry, the radius in the XZ-plane (symmetry plane) is Rxz = 0.702 m and the radius in the YZ-plane (perpendicular to symmetry plane and containing stagnation line) is Ryz = 1.354 m. The equivalent nose radius is given by:
m 925.0)()(
211
=+
=−−
yzxzeq
RRR
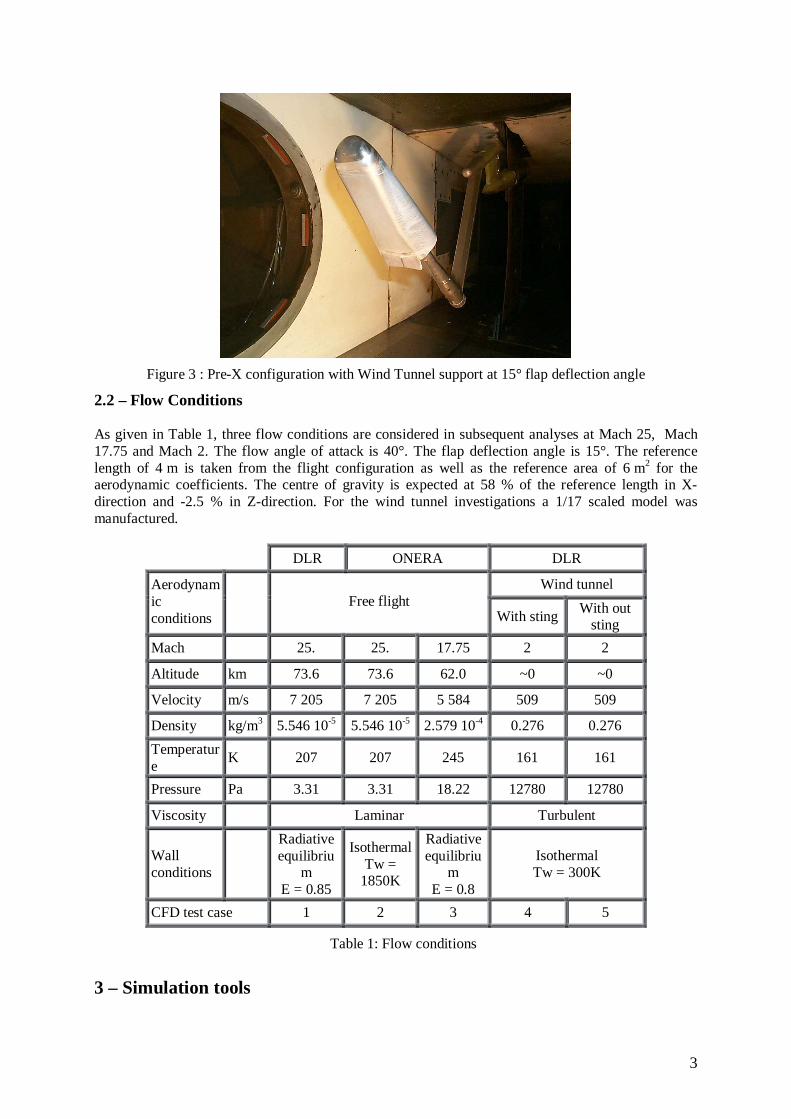
The model tested in Sigma4 is presented in Figure 3, the Pre-X can be clearly seen with the sting in the Sigma4 test section.
3
Figure 3 : Pre-X configuration with Wind Tunnel support at 15° flap deflection angle
2.2 – Flow Conditions As given in Table 1, three flow conditions are considered in subsequent analyses at Mach 25, Mach 17.75 and Mach 2. The flow angle of attack is 40°. The flap deflection angle is 15°. The reference length of 4 m is taken from the flight configuration as well as the reference area of 6 m2 for the aerodynamic coefficients. The centre of gravity is expected at 58 % of the reference length in X-direction and -2.5 % in Z-direction. For the wind tunnel investigations a 1/17 scaled model was manufactured.
DLR ONERA DLR
Wind tunnel Aerodynamic conditions
Free flight With sting
With out sting
Mach 25. 25. 17.75 2 2
Altitude km 73.6 73.6 62.0 ~0 ~0
Velocity m/s 7 205 7 205 5 584 509 509
Density kg/m3 5.546 10-5 5.546 10-5 2.579 10-4 0.276 0.276
Temperature
K 207 207 245 161 161
Pressure Pa 3.31 3.31 18.22 12780 12780
Viscosity Laminar Turbulent
Wall conditions
Radiative equilibriu
m E = 0.85
Isothermal Tw =
1850K
Radiative equilibriu
m E = 0.8
Isothermal Tw = 300K
CFD test case 1 2 3 4 5
Table 1: Flow conditions
3 – Simulation tools
4
3.1 DLR process
Grid generation
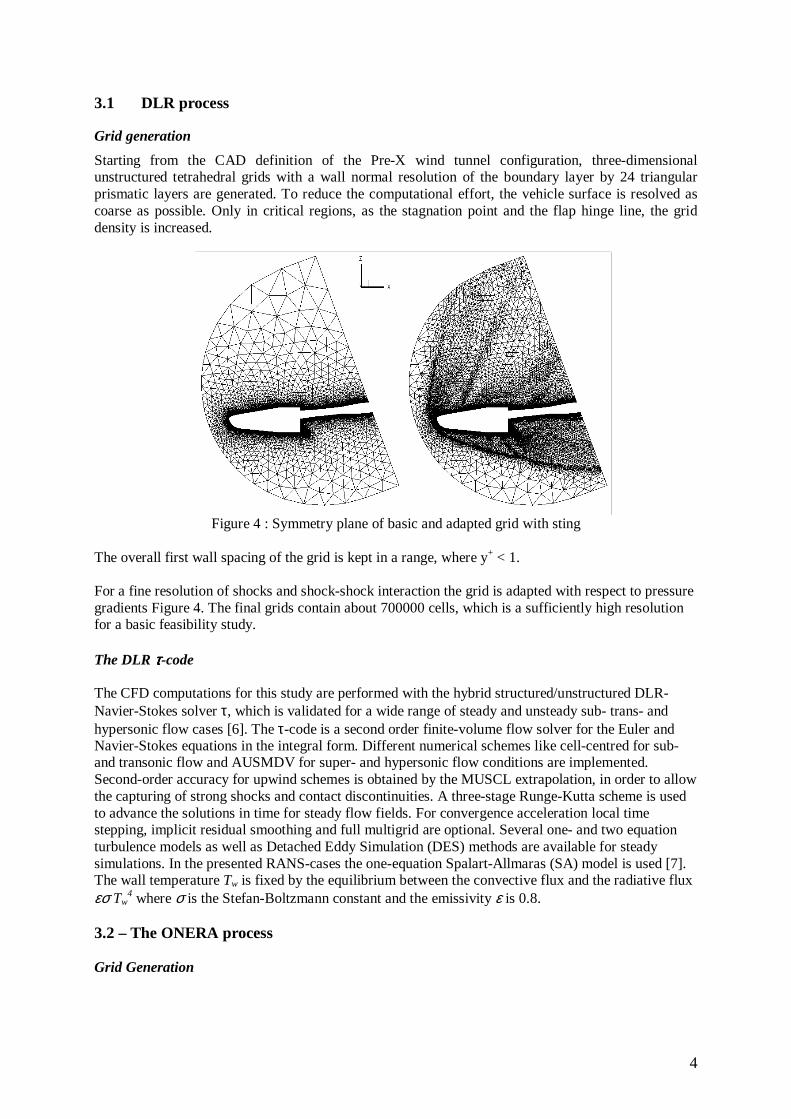
Starting from the CAD definition of the Pre-X wind tunnel configuration, three-dimensional unstructured tetrahedral grids with a wall normal resolution of the boundary layer by 24 triangular prismatic layers are generated. To reduce the computational effort, the vehicle surface is resolved as coarse as possible. Only in critical regions, as the stagnation point and the flap hinge line, the grid density is increased.
Figure 4 : Symmetry plane of basic and adapted grid with sting
The overall first wall spacing of the grid is kept in a range, where y+ < 1. For a fine resolution of shocks and shock-shock interaction the grid is adapted with respect to pressure gradients Figure 4. The final grids contain about 700000 cells, which is a sufficiently high resolution for a basic feasibility study. The DLR ττττ-code The CFD computations for this study are performed with the hybrid structured/unstructured DLR-Navier-Stokes solver τ, which is validated for a wide range of steady and unsteady sub- trans- and hypersonic flow cases �[6]. The τ-code is a second order finite-volume flow solver for the Euler and Navier-Stokes equations in the integral form. Different numerical schemes like cell-centred for sub- and transonic flow and AUSMDV for super- and hypersonic flow conditions are implemented. Second-order accuracy for upwind schemes is obtained by the MUSCL extrapolation, in order to allow the capturing of strong shocks and contact discontinuities. A three-stage Runge-Kutta scheme is used to advance the solutions in time for steady flow fields. For convergence acceleration local time stepping, implicit residual smoothing and full multigrid are optional. Several one- and two equation turbulence models as well as Detached Eddy Simulation (DES) methods are available for steady simulations. In the presented RANS-cases the one-equation Spalart-Allmaras (SA) model is used �[7]. The wall temperature Tw is fixed by the equilibrium between the convective flux and the radiative flux εσ Tw
4 where σ is the Stefan-Boltzmann constant and the emissivity ε is 0.8. 3.2 – The ONERA process Grid Generation
5
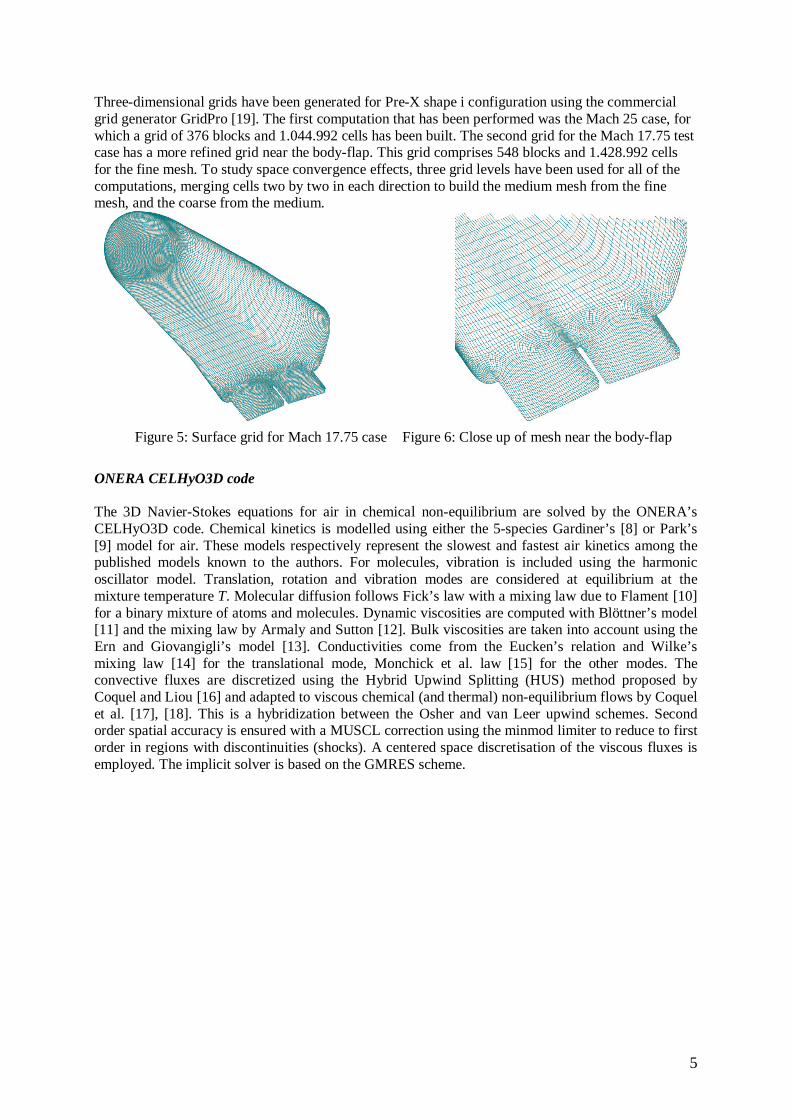
Three-dimensional grids have been generated for Pre-X shape i configuration using the commercial grid generator GridPro �[19]. The first computation that has been performed was the Mach 25 case, for which a grid of 376 blocks and 1.044.992 cells has been built. The second grid for the Mach 17.75 test case has a more refined grid near the body-flap. This grid comprises 548 blocks and 1.428.992 cells for the fine mesh. To study space convergence effects, three grid levels have been used for all of the computations, merging cells two by two in each direction to build the medium mesh from the fine mesh, and the coarse from the medium.
Figure 5: Surface grid for Mach 17.75 case Figure 6: Close up of mesh near the body-flap
ONERA CELHyO3D code The 3D Navier-Stokes equations for air in chemical non-equilibrium are solved by the ONERA’s CELHyO3D code. Chemical kinetics is modelled using either the 5-species Gardiner’s �[8] or Park’s �[9] model for air. These models respectively represent the slowest and fastest air kinetics among the published models known to the authors. For molecules, vibration is included using the harmonic oscillator model. Translation, rotation and vibration modes are considered at equilibrium at the mixture temperature T. Molecular diffusion follows Fick’s law with a mixing law due to Flament �[10] for a binary mixture of atoms and molecules. Dynamic viscosities are computed with Blöttner’s model �[11] and the mixing law by Armaly and Sutton �[12]. Bulk viscosities are taken into account using the Ern and Giovangigli’s model �[13]. Conductivities come from the Eucken’s relation and Wilke’s mixing law �[14] for the translational mode, Monchick et al. law �[15] for the other modes. The convective fluxes are discretized using the Hybrid Upwind Splitting (HUS) method proposed by Coquel and Liou �[16] and adapted to viscous chemical (and thermal) non-equilibrium flows by Coquel et al. �[17], �[18]. This is a hybridization between the Osher and van Leer upwind schemes. Second order spatial accuracy is ensured with a MUSCL correction using the minmod limiter to reduce to first order in regions with discontinuities (shocks). A centered space discretisation of the viscous fluxes is employed. The implicit solver is based on the GMRES scheme.
6
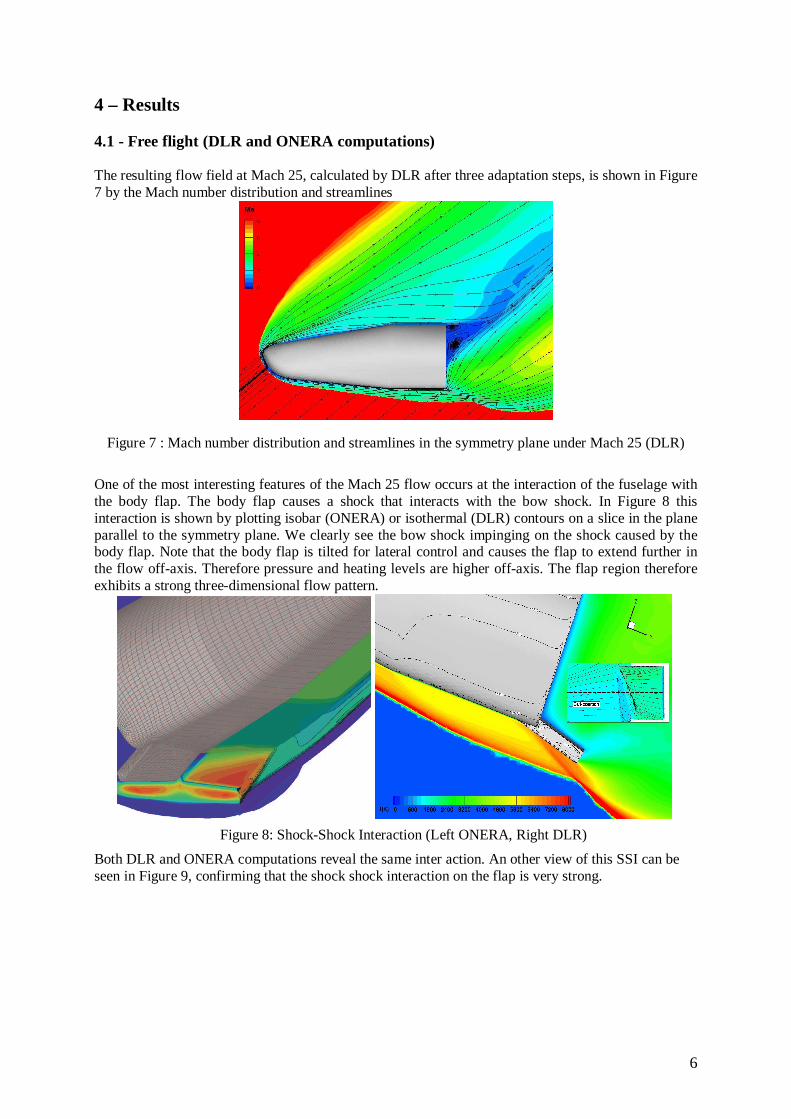
4 – Results 4.1 - Free flight (DLR and ONERA computations) The resulting flow field at Mach 25, calculated by DLR after three adaptation steps, is shown in Figure 7 by the Mach number distribution and streamlines
Figure 7 : Mach number distribution and streamlines in the symmetry plane under Mach 25 (DLR)
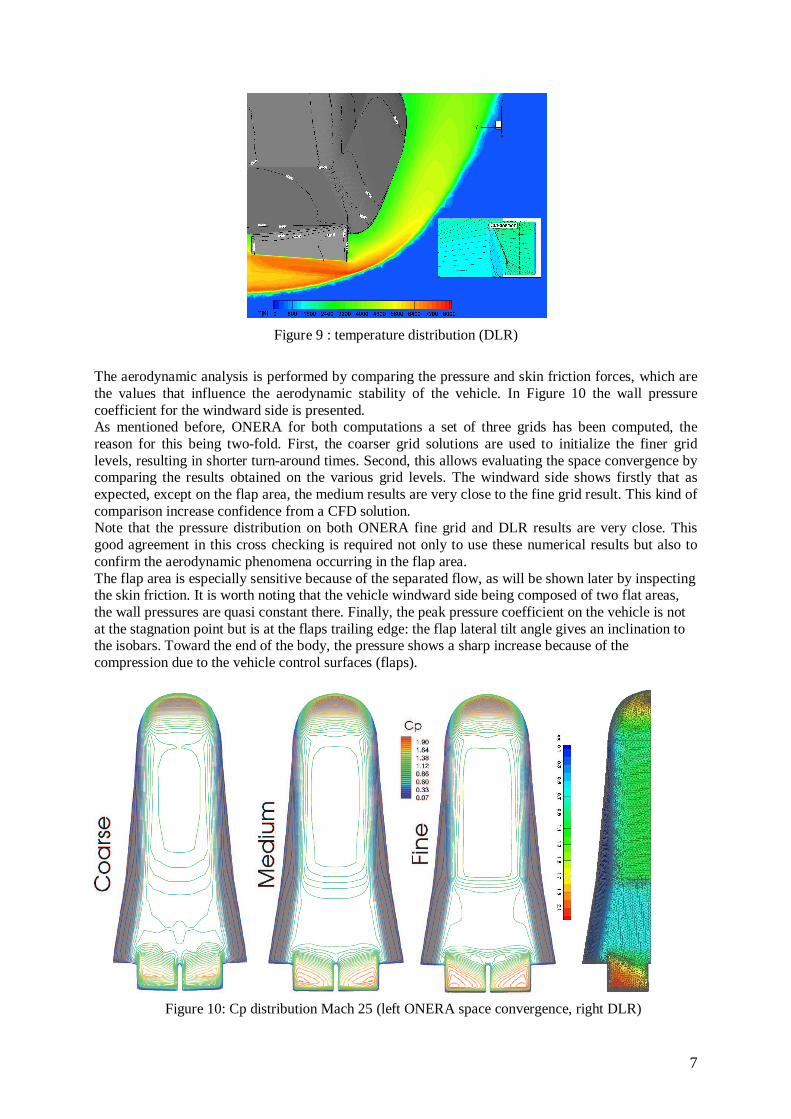
One of the most interesting features of the Mach 25 flow occurs at the interaction of the fuselage with the body flap. The body flap causes a shock that interacts with the bow shock. In Figure 8 this interaction is shown by plotting isobar (ONERA) or isothermal (DLR) contours on a slice in the plane parallel to the symmetry plane. We clearly see the bow shock impinging on the shock caused by the body flap. Note that the body flap is tilted for lateral control and causes the flap to extend further in the flow off-axis. Therefore pressure and heating levels are higher off-axis. The flap region therefore exhibits a strong three-dimensional flow pattern.
Figure 8: Shock-Shock Interaction (Left ONERA, Right DLR)
Both DLR and ONERA computations reveal the same inter action. An other view of this SSI can be seen in Figure 9, confirming that the shock shock interaction on the flap is very strong.
7
Figure 9 : temperature distribution (DLR)
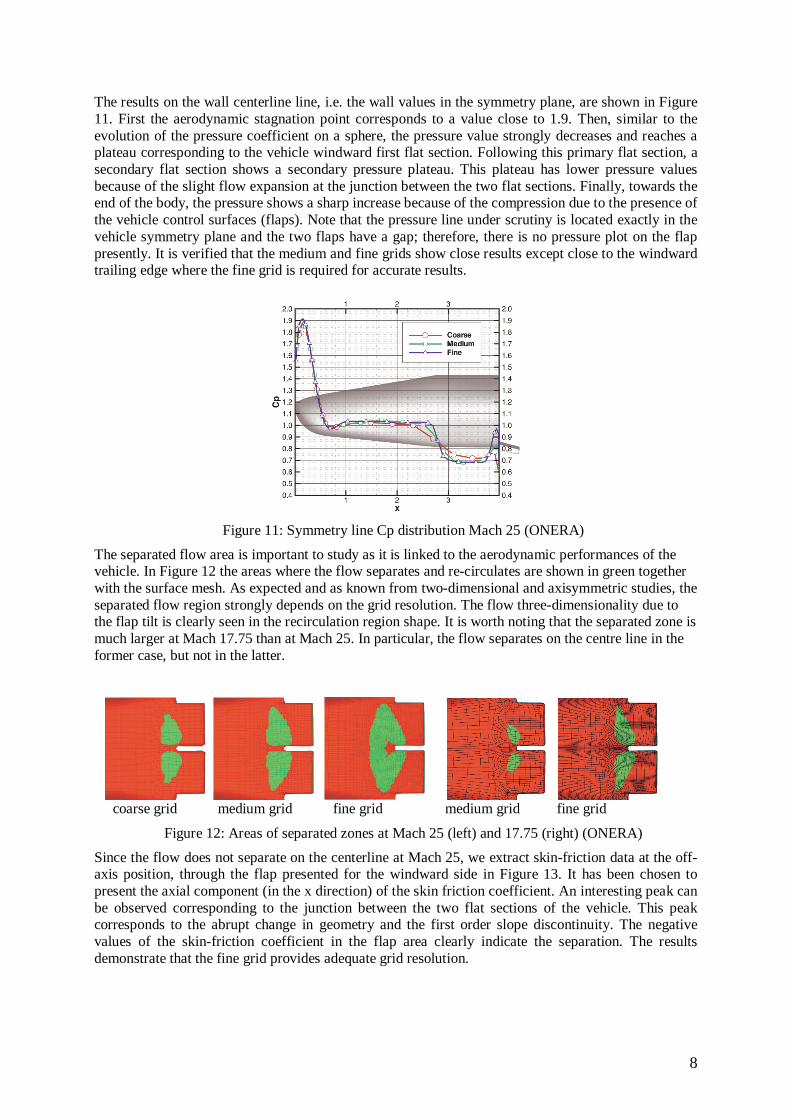
The aerodynamic analysis is performed by comparing the pressure and skin friction forces, which are the values that influence the aerodynamic stability of the vehicle. In Figure 10 the wall pressure coefficient for the windward side is presented. As mentioned before, ONERA for both computations a set of three grids has been computed, the reason for this being two-fold. First, the coarser grid solutions are used to initialize the finer grid levels, resulting in shorter turn-around times. Second, this allows evaluating the space convergence by comparing the results obtained on the various grid levels. The windward side shows firstly that as expected, except on the flap area, the medium results are very close to the fine grid result. This kind of comparison increase confidence from a CFD solution. Note that the pressure distribution on both ONERA fine grid and DLR results are very close. This good agreement in this cross checking is required not only to use these numerical results but also to confirm the aerodynamic phenomena occurring in the flap area. The flap area is especially sensitive because of the separated flow, as will be shown later by inspecting the skin friction. It is worth noting that the vehicle windward side being composed of two flat areas, the wall pressures are quasi constant there. Finally, the peak pressure coefficient on the vehicle is not at the stagnation point but is at the flaps trailing edge: the flap lateral tilt angle gives an inclination to the isobars. Toward the end of the body, the pressure shows a sharp increase because of the compression due to the vehicle control surfaces (flaps).
Figure 10: Cp distribution Mach 25 (left ONERA space convergence, right DLR)
8
The results on the wall centerline line, i.e. the wall values in the symmetry plane, are shown in Figure 11. First the aerodynamic stagnation point corresponds to a value close to 1.9. Then, similar to the evolution of the pressure coefficient on a sphere, the pressure value strongly decreases and reaches a plateau corresponding to the vehicle windward first flat section. Following this primary flat section, a secondary flat section shows a secondary pressure plateau. This plateau has lower pressure values because of the slight flow expansion at the junction between the two flat sections. Finally, towards the end of the body, the pressure shows a sharp increase because of the compression due to the presence of the vehicle control surfaces (flaps). Note that the pressure line under scrutiny is located exactly in the vehicle symmetry plane and the two flaps have a gap; therefore, there is no pressure plot on the flap presently. It is verified that the medium and fine grids show close results except close to the windward trailing edge where the fine grid is required for accurate results.
Figure 11: Symmetry line Cp distribution Mach 25 (ONERA)
The separated flow area is important to study as it is linked to the aerodynamic performances of the vehicle. In Figure 12 the areas where the flow separates and re-circulates are shown in green together with the surface mesh. As expected and as known from two-dimensional and axisymmetric studies, the separated flow region strongly depends on the grid resolution. The flow three-dimensionality due to the flap tilt is clearly seen in the recirculation region shape. It is worth noting that the separated zone is much larger at Mach 17.75 than at Mach 25. In particular, the flow separates on the centre line in the former case, but not in the latter.
coarse grid medium grid fine grid medium grid fine grid
Figure 12: Areas of separated zones at Mach 25 (left) and 17.75 (right) (ONERA)
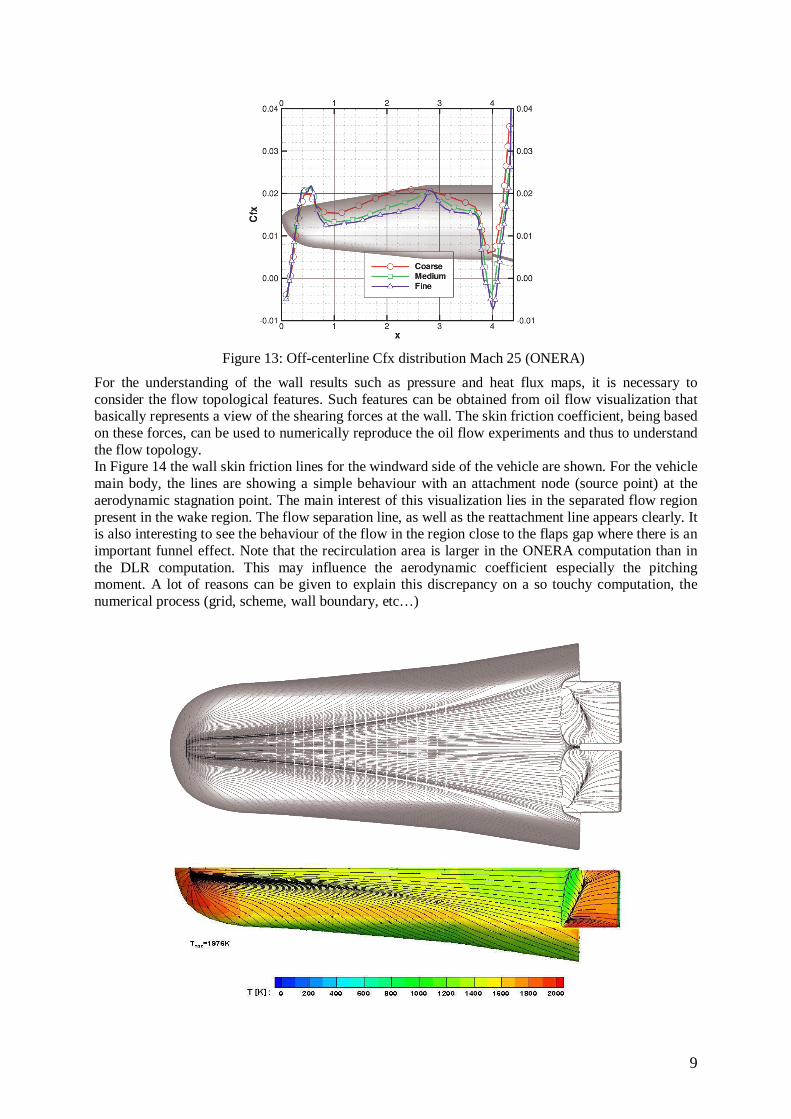
Since the flow does not separate on the centerline at Mach 25, we extract skin-friction data at the off-axis position, through the flap presented for the windward side in Figure 13. It has been chosen to present the axial component (in the x direction) of the skin friction coefficient. An interesting peak can be observed corresponding to the junction between the two flat sections of the vehicle. This peak corresponds to the abrupt change in geometry and the first order slope discontinuity. The negative values of the skin-friction coefficient in the flap area clearly indicate the separation. The results demonstrate that the fine grid provides adequate grid resolution.
9
Figure 13: Off-centerline Cfx distribution Mach 25 (ONERA)
For the understanding of the wall results such as pressure and heat flux maps, it is necessary to consider the flow topological features. Such features can be obtained from oil flow visualization that basically represents a view of the shearing forces at the wall. The skin friction coefficient, being based on these forces, can be used to numerically reproduce the oil flow experiments and thus to understand the flow topology. In Figure 14 the wall skin friction lines for the windward side of the vehicle are shown. For the vehicle main body, the lines are showing a simple behaviour with an attachment node (source point) at the aerodynamic stagnation point. The main interest of this visualization lies in the separated flow region present in the wake region. The flow separation line, as well as the reattachment line appears clearly. It is also interesting to see the behaviour of the flow in the region close to the flaps gap where there is an important funnel effect. Note that the recirculation area is larger in the ONERA computation than in the DLR computation. This may influence the aerodynamic coefficient especially the pitching moment. A lot of reasons can be given to explain this discrepancy on a so touchy computation, the numerical process (grid, scheme, wall boundary, etc…)
10
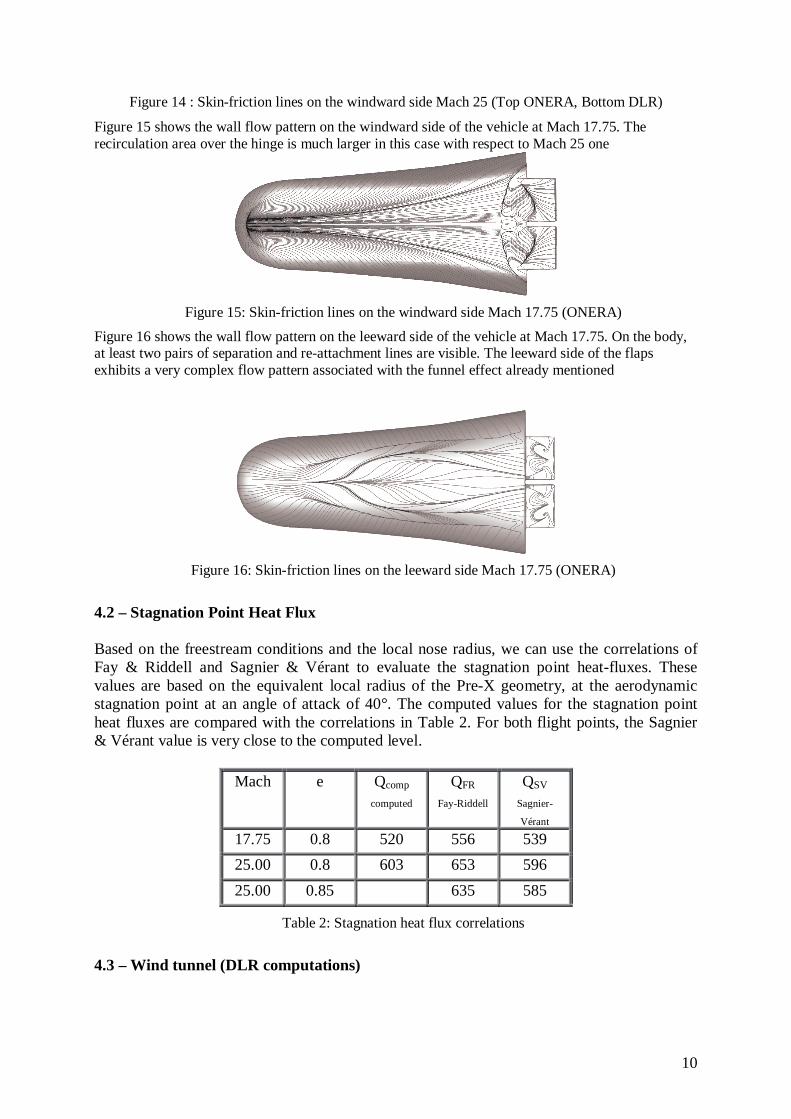
Figure 14 : Skin-friction lines on the windward side Mach 25 (Top ONERA, Bottom DLR)
Figure 15 shows the wall flow pattern on the windward side of the vehicle at Mach 17.75. The recirculation area over the hinge is much larger in this case with respect to Mach 25 one
Figure 15: Skin-friction lines on the windward side Mach 17.75 (ONERA)
Figure 16 shows the wall flow pattern on the leeward side of the vehicle at Mach 17.75. On the body, at least two pairs of separation and re-attachment lines are visible. The leeward side of the flaps exhibits a very complex flow pattern associated with the funnel effect already mentioned
Figure 16: Skin-friction lines on the leeward side Mach 17.75 (ONERA)
4.2 – Stagnation Point Heat Flux Based on the freestream conditions and the local nose radius, we can use the correlations of Fay & Riddell and Sagnier & Vérant to evaluate the stagnation point heat-fluxes. These values are based on the equivalent local radius of the Pre-X geometry, at the aerodynamic stagnation point at an angle of attack of 40°. The computed values for the stagnation point heat fluxes are compared with the correlations in Table 2. For both flight points, the Sagnier & Vérant value is very close to the computed level.
Mach e Qcomp
computed
QFR
Fay-Riddell
QSV
Sagnier-
Vérant
17.75 0.8 520 556 539
25.00 0.8 603 653 596
25.00 0.85 635 585
Table 2: Stagnation heat flux correlations
4.3 – Wind tunnel (DLR computations)
11
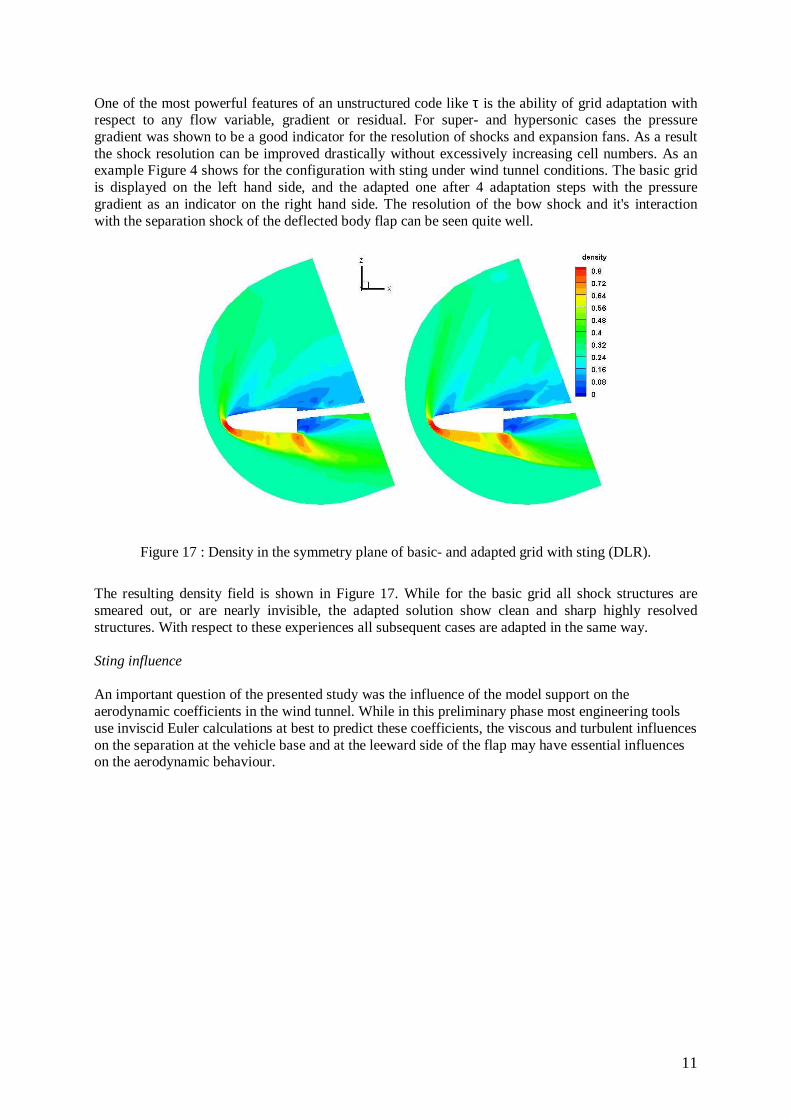
One of the most powerful features of an unstructured code like τ is the ability of grid adaptation with respect to any flow variable, gradient or residual. For super- and hypersonic cases the pressure gradient was shown to be a good indicator for the resolution of shocks and expansion fans. As a result the shock resolution can be improved drastically without excessively increasing cell numbers. As an example Figure 4 shows for the configuration with sting under wind tunnel conditions. The basic grid is displayed on the left hand side, and the adapted one after 4 adaptation steps with the pressure gradient as an indicator on the right hand side. The resolution of the bow shock and it's interaction with the separation shock of the deflected body flap can be seen quite well.
Figure 17 : Density in the symmetry plane of basic- and adapted grid with sting (DLR).
The resulting density field is shown in Figure 17. While for the basic grid all shock structures are smeared out, or are nearly invisible, the adapted solution show clean and sharp highly resolved structures. With respect to these experiences all subsequent cases are adapted in the same way. Sting influence An important question of the presented study was the influence of the model support on the aerodynamic coefficients in the wind tunnel. While in this preliminary phase most engineering tools use inviscid Euler calculations at best to predict these coefficients, the viscous and turbulent influences on the separation at the vehicle base and at the leeward side of the flap may have essential influences on the aerodynamic behaviour.
12
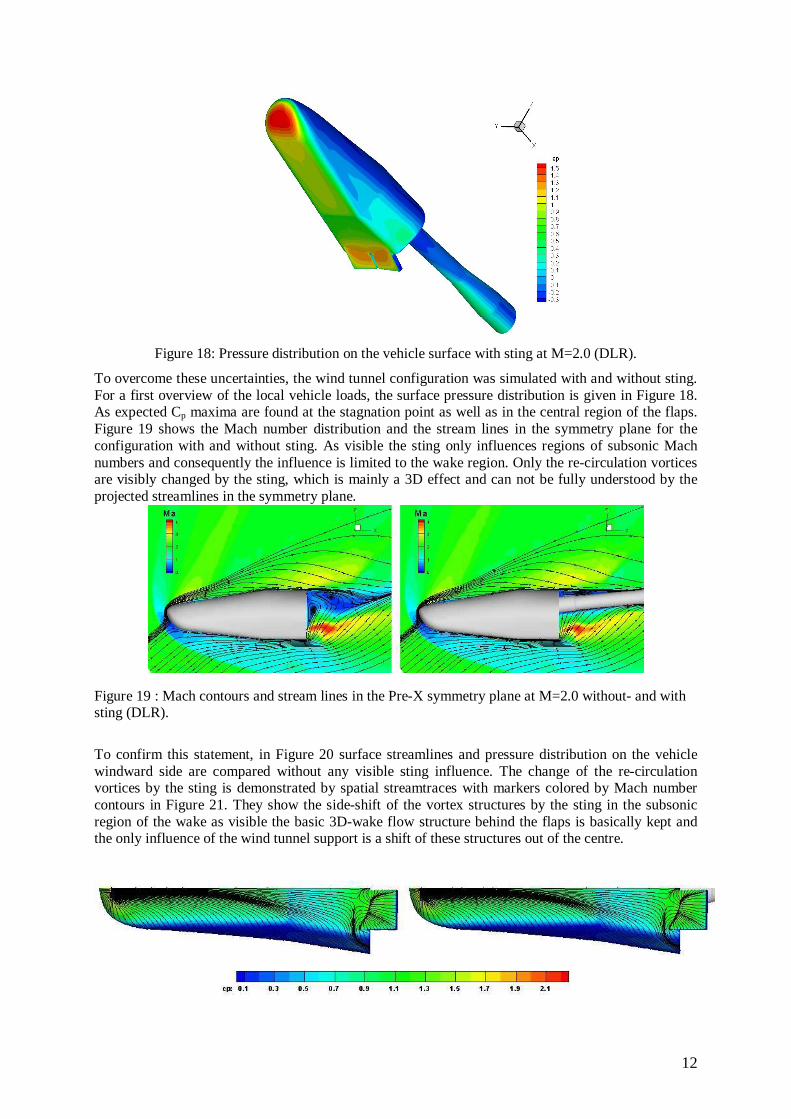
Figure 18: Pressure distribution on the vehicle surface with sting at M=2.0 (DLR).
To overcome these uncertainties, the wind tunnel configuration was simulated with and without sting. For a first overview of the local vehicle loads, the surface pressure distribution is given in Figure 18. As expected Cp maxima are found at the stagnation point as well as in the central region of the flaps. Figure 19 shows the Mach number distribution and the stream lines in the symmetry plane for the configuration with and without sting. As visible the sting only influences regions of subsonic Mach numbers and consequently the influence is limited to the wake region. Only the re-circulation vortices are visibly changed by the sting, which is mainly a 3D effect and can not be fully understood by the projected streamlines in the symmetry plane.
Figure 19 : Mach contours and stream lines in the Pre-X symmetry plane at M=2.0 without- and with sting (DLR).
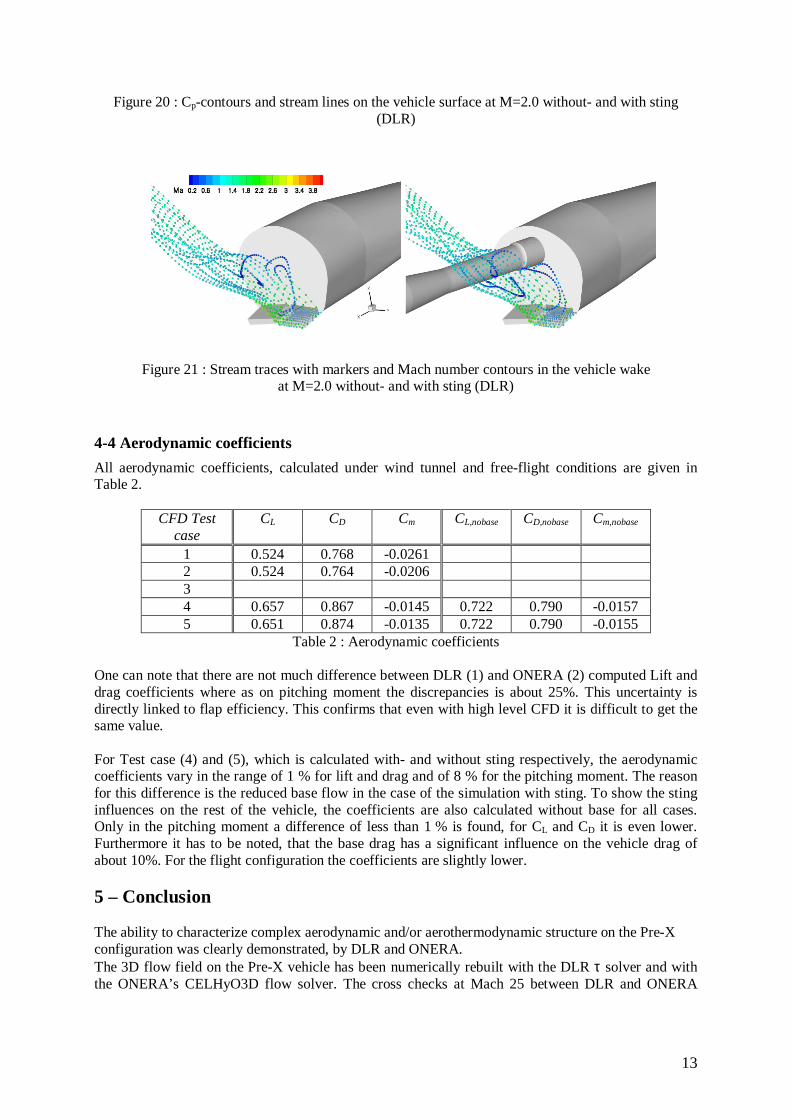
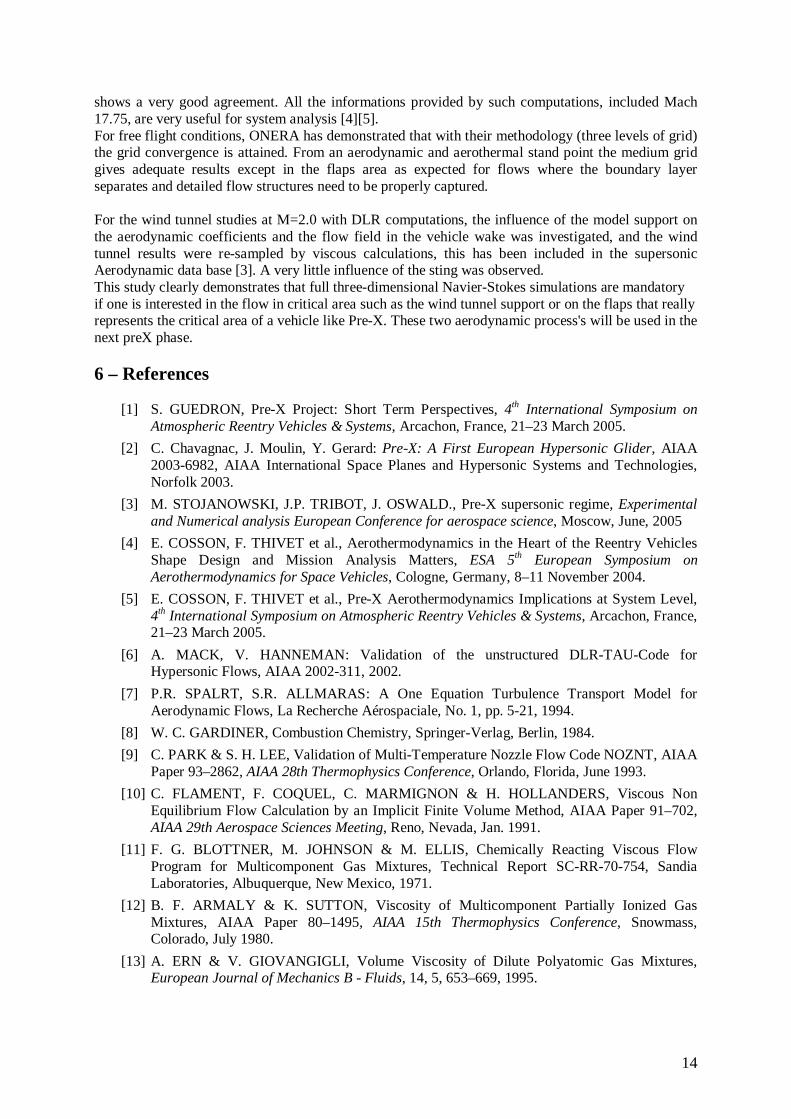
To confirm this statement, in Figure 20 surface streamlines and pressure distribution on the vehicle windward side are compared without any visible sting influence. The change of the re-circulation vortices by the sting is demonstrated by spatial streamtraces with markers colored by Mach number contours in Figure 21. They show the side-shift of the vortex structures by the sting in the subsonic region of the wake as visible the basic 3D-wake flow structure behind the flaps is basically kept and the only influence of the wind tunnel support is a shift of these structures out of the centre.
13
Figure 20 : Cp-contours and stream lines on the vehicle surface at M=2.0 without- and with sting (DLR)
Figure 21 : Stream traces with markers and Mach number contours in the vehicle wake at M=2.0 without- and with sting (DLR)
4-4 Aerodynamic coefficients
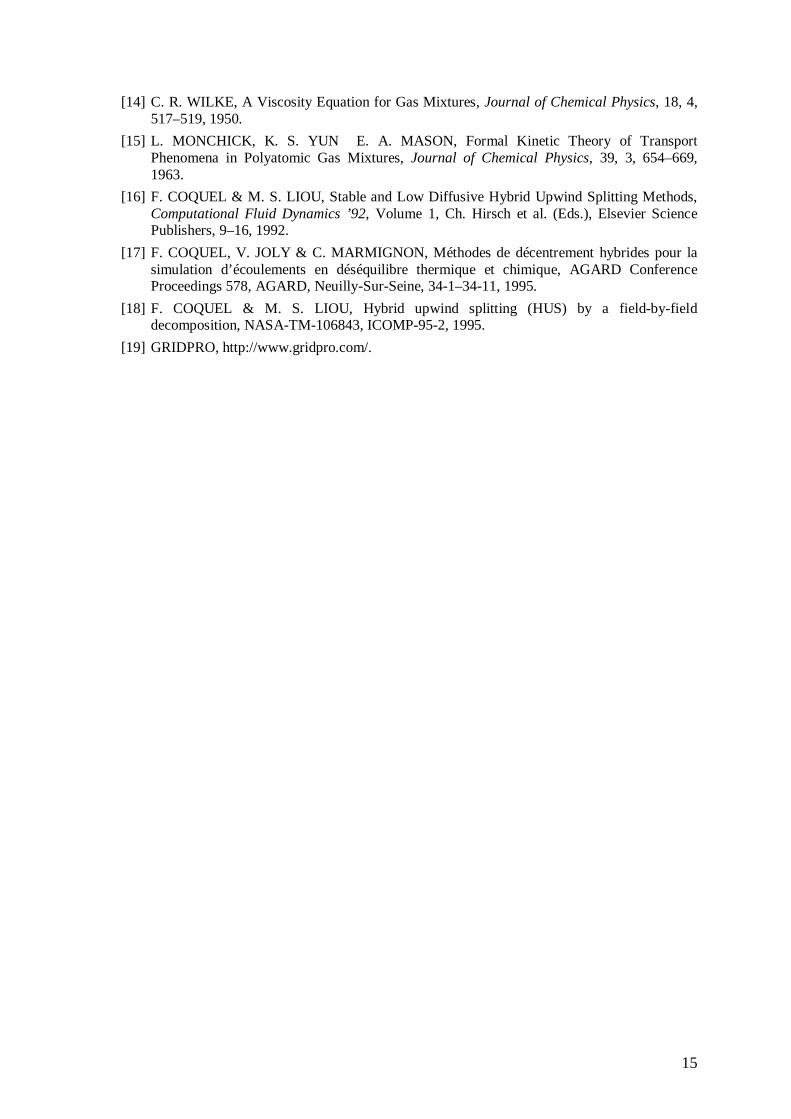
All aerodynamic coefficients, calculated under wind tunnel and free-flight conditions are given in Table 2.
CFD Test case
CL CD Cm CL,nobase CD,nobase Cm,nobase
1 0.524 0.768 -0.0261 2 0.524 0.764 -0.0206 3 4 0.657 0.867 -0.0145 0.722 0.790 -0.0157 5 0.651 0.874 -0.0135 0.722 0.790 -0.0155
Table 2 : Aerodynamic coefficients One can note that there are not much difference between DLR (1) and ONERA (2) computed Lift and drag coefficients where as on pitching moment the discrepancies is about 25%. This uncertainty is directly linked to flap efficiency. This confirms that even with high level CFD it is difficult to get the same value. For Test case (4) and (5), which is calculated with- and without sting respectively, the aerodynamic coefficients vary in the range of 1 % for lift and drag and of 8 % for the pitching moment. The reason for this difference is the reduced base flow in the case of the simulation with sting. To show the sting influences on the rest of the vehicle, the coefficients are also calculated without base for all cases. Only in the pitching moment a difference of less than 1 % is found, for CL and CD it is even lower. Furthermore it has to be noted, that the base drag has a significant influence on the vehicle drag of about 10%. For the flight configuration the coefficients are slightly lower.
5 – Conclusion The ability to characterize complex aerodynamic and/or aerothermodynamic structure on the Pre-X configuration was clearly demonstrated, by DLR and ONERA. The 3D flow field on the Pre-X vehicle has been numerically rebuilt with the DLR τ solver and with the ONERA’s CELHyO3D flow solver. The cross checks at Mach 25 between DLR and ONERA
14
shows a very good agreement. All the informations provided by such computations, included Mach 17.75, are very useful for system analysis �[4]�[5]. For free flight conditions, ONERA has demonstrated that with their methodology (three levels of grid) the grid convergence is attained. From an aerodynamic and aerothermal stand point the medium grid gives adequate results except in the flaps area as expected for flows where the boundary layer separates and detailed flow structures need to be properly captured. For the wind tunnel studies at M=2.0 with DLR computations, the influence of the model support on the aerodynamic coefficients and the flow field in the vehicle wake was investigated, and the wind tunnel results were re-sampled by viscous calculations, this has been included in the supersonic Aerodynamic data base �[3]. A very little influence of the sting was observed. This study clearly demonstrates that full three-dimensional Navier-Stokes simulations are mandatory if one is interested in the flow in critical area such as the wind tunnel support or on the flaps that really represents the critical area of a vehicle like Pre-X. These two aerodynamic process's will be used in the next preX phase.
6 – References
[1] S. GUEDRON, Pre-X Project: Short Term Perspectives, 4th International Symposium on Atmospheric Reentry Vehicles & Systems, Arcachon, France, 21–23 March 2005.
[2] C. Chavagnac, J. Moulin, Y. Gerard: Pre-X: A First European Hypersonic Glider, AIAA 2003-6982, AIAA International Space Planes and Hypersonic Systems and Technologies, Norfolk 2003.
[3] M. STOJANOWSKI, J.P. TRIBOT, J. OSWALD., Pre-X supersonic regime, Experimental and Numerical analysis European Conference for aerospace science, Moscow, June, 2005
[4] E. COSSON, F. THIVET et al., Aerothermodynamics in the Heart of the Reentry Vehicles Shape Design and Mission Analysis Matters, ESA 5th European Symposium on Aerothermodynamics for Space Vehicles, Cologne, Germany, 8–11 November 2004.
[5] E. COSSON, F. THIVET et al., Pre-X Aerothermodynamics Implications at System Level, 4th International Symposium on Atmospheric Reentry Vehicles & Systems, Arcachon, France, 21–23 March 2005.
[6] A. MACK, V. HANNEMAN: Validation of the unstructured DLR-TAU-Code for Hypersonic Flows, AIAA 2002-311, 2002.
[7] P.R. SPALRT, S.R. ALLMARAS: A One Equation Turbulence Transport Model for Aerodynamic Flows, La Recherche Aérospaciale, No. 1, pp. 5-21, 1994.
[8] W. C. GARDINER, Combustion Chemistry, Springer-Verlag, Berlin, 1984.
[9] C. PARK & S. H. LEE, Validation of Multi-Temperature Nozzle Flow Code NOZNT, AIAA Paper 93–2862, AIAA 28th Thermophysics Conference, Orlando, Florida, June 1993.
[10] C. FLAMENT, F. COQUEL, C. MARMIGNON & H. HOLLANDERS, Viscous Non Equilibrium Flow Calculation by an Implicit Finite Volume Method, AIAA Paper 91–702, AIAA 29th Aerospace Sciences Meeting, Reno, Nevada, Jan. 1991.
[11] F. G. BLOTTNER, M. JOHNSON & M. ELLIS, Chemically Reacting Viscous Flow Program for Multicomponent Gas Mixtures, Technical Report SC-RR-70-754, Sandia Laboratories, Albuquerque, New Mexico, 1971.
[12] B. F. ARMALY & K. SUTTON, Viscosity of Multicomponent Partially Ionized Gas Mixtures, AIAA Paper 80–1495, AIAA 15th Thermophysics Conference, Snowmass, Colorado, July 1980.
[13] A. ERN & V. GIOVANGIGLI, Volume Viscosity of Dilute Polyatomic Gas Mixtures, European Journal of Mechanics B - Fluids, 14, 5, 653–669, 1995.
15
[14] C. R. WILKE, A Viscosity Equation for Gas Mixtures, Journal of Chemical Physics, 18, 4, 517–519, 1950.
[15] L. MONCHICK, K. S. YUN E. A. MASON, Formal Kinetic Theory of Transport Phenomena in Polyatomic Gas Mixtures, Journal of Chemical Physics, 39, 3, 654–669, 1963.
[16] F. COQUEL & M. S. LIOU, Stable and Low Diffusive Hybrid Upwind Splitting Methods, Computational Fluid Dynamics ’92, Volume 1, Ch. Hirsch et al. (Eds.), Elsevier Science Publishers, 9–16, 1992.
[17] F. COQUEL, V. JOLY & C. MARMIGNON, Méthodes de décentrement hybrides pour la simulation d’écoulements en déséquilibre thermique et chimique, AGARD Conference Proceedings 578, AGARD, Neuilly-Sur-Seine, 34-1–34-11, 1995.
[18] F. COQUEL & M. S. LIOU, Hybrid upwind splitting (HUS) by a field-by-field decomposition, NASA-TM-106843, ICOMP-95-2, 1995.
[19] GRIDPRO, http://www.gridpro.com/.