dl1540c/1540cl digital oscilloscope user's...
TRANSCRIPT

IM 701530-01E2nd Edition
Digital Oscilloscope/
1IM 701530-01E
Introduction
Thank you for purchasing the YOKOGAWA DL1540C/DL1540CL DigitalOscilloscope.This User’s Manual contains useful information about the functions and operatingprocedures of the instrument, mainly DL1540C. It also contains precautions thatshould be observed during use. Main differences in the specifications betweenDL1540C and DL1540CL is that DL1540CL allows record length of up to 2M words.Due to these differences, functions and operations differ slightly among thesemodels. For a detailed description, refer to the relevant sections of this manual. Toensure correct use of the instrument, please read this manual thoroughly beforeoperating it.Keep the manual in a safe place for quick reference whenever a question arises.Two manuals are provided with the instrument in addition to this manual.
Manual Name Manual No. Description
DL1540C/1540CL IM701530-02E Describes basic operations only.Operation Guide
DL1540C/1540CL IM701530-11E Describes the communications functionsCommunication Interface for the GP-IB/RS-232-C interface.User’s Manual
Notes• The contents of this manual are subject to change without prior notice as a result
of improvements in the instrument’s performance and functions. Display contentsillustrated in this manual may differ slightly from what actually appears on yourscreen.
• Every effort has been made in the preparation of this manual to ensure theaccuracy of its contents. However, should you have any questions or find anyerrors, please contact your nearest YOKOGAWA representative as listed on theback cover of this manual.
• Copying or reproduction of all or any part of the contents of this manual withoutYOKOGAWA’s permission is strictly prohibited.
TrademarksMS-DOS is a registered trademark of Microsoft Corporation.HP-GL is a registered trademark of Hewlett-Packard Company.PostScript is a registered trademark of Adobe Systems Incorporated.
Revisions1st Edition: December 19982nd Edition: May 2000
Disk No. DL26
2nd Edition: May 2000 (YK)
All Rights Reserved, Copyright © 1998 Yokogawa Electric Corporation
2 IM 701530-01E
Checking the Contents of the Package
Unpack the box and check the contents before operating the instrument. If thewrong instrument or accessories have been delivered, if some accessories aremissing or if they appear abnormal, contact the dealer from which you purchasedthem.
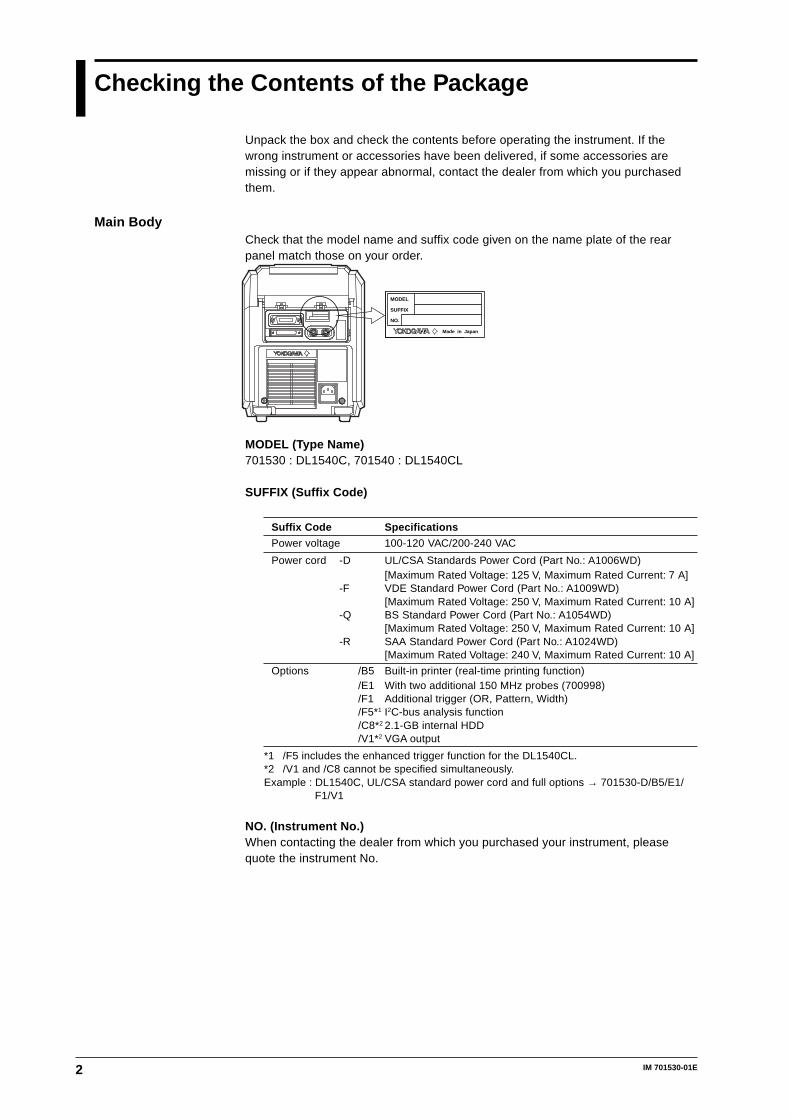
Main BodyCheck that the model name and suffix code given on the name plate of the rearpanel match those on your order.
MODEL
SUFFIX
NO.
Made in Japan
MODEL (Type Name)701530 : DL1540C, 701540 : DL1540CL
SUFFIX (Suffix Code)
Suffix Code Specifications
Power voltage 100-120 VAC/200-240 VAC
Power cord -D UL/CSA Standards Power Cord (Part No.: A1006WD)[Maximum Rated Voltage: 125 V, Maximum Rated Current: 7 A]
-F VDE Standard Power Cord (Part No.: A1009WD)[Maximum Rated Voltage: 250 V, Maximum Rated Current: 10 A]
-Q BS Standard Power Cord (Part No.: A1054WD)[Maximum Rated Voltage: 250 V, Maximum Rated Current: 10 A]
-R SAA Standard Power Cord (Part No.: A1024WD)[Maximum Rated Voltage: 240 V, Maximum Rated Current: 10 A]
Options /B5 Built-in printer (real-time printing function)/E1 With two additional 150 MHz probes (700998)/F1 Additional trigger (OR, Pattern, Width)/F5*1 I2C-bus analysis function/C8*2 2.1-GB internal HDD/V1*2 VGA output
*1 /F5 includes the enhanced trigger function for the DL1540CL.*2 /V1 and /C8 cannot be specified simultaneously.Example : DL1540C, UL/CSA standard power cord and full options → 701530-D/B5/E1/
F1/V1
NO. (Instrument No.)When contacting the dealer from which you purchased your instrument, pleasequote the instrument No.
3IM 701530-01E
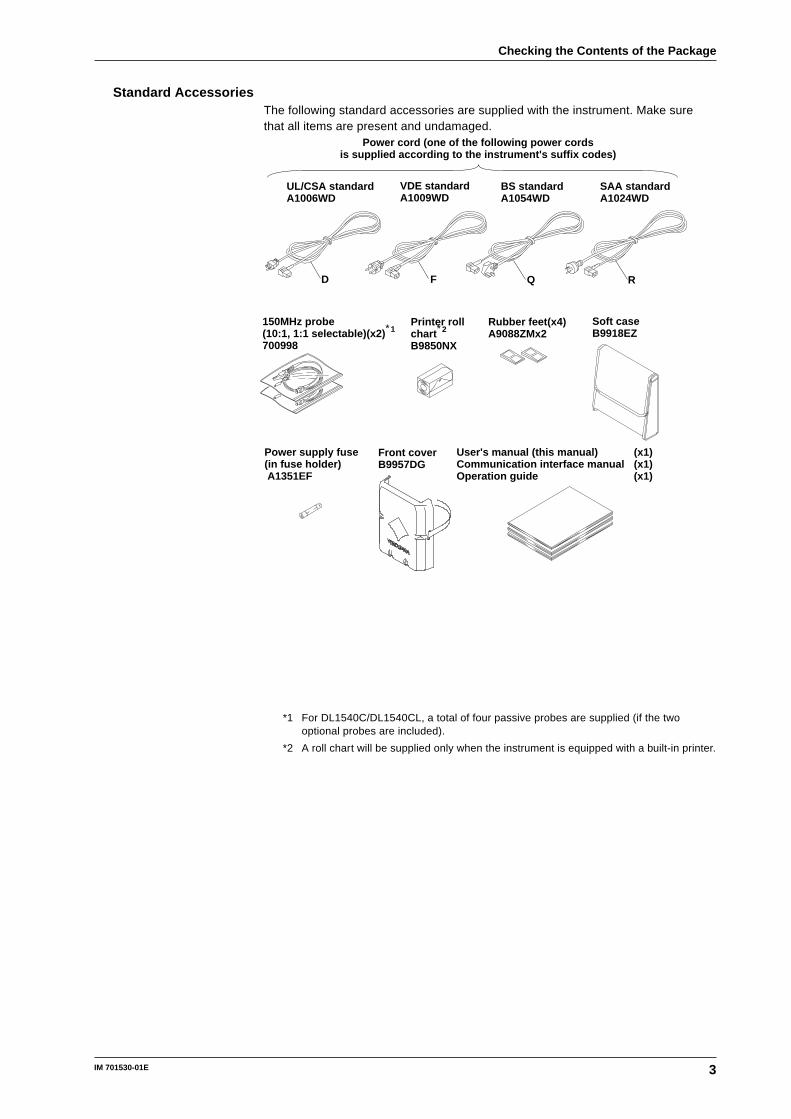
Standard AccessoriesThe following standard accessories are supplied with the instrument. Make surethat all items are present and undamaged.
User's manual (this manual)Communication interface manualOperation guide
Printer rollchart∗2
B9850NX
Power supply fuse(in fuse holder) A1351EF
150MHz probe(10:1, 1:1 selectable)(x2)∗1
700998
UL/CSA standardA1006WD
VDE standardA1009WD
BS standardA1054WD
SAA standardA1024WD
D F R
(x1)(x1)(x1)
Rubber feet(x4)A9088ZMx2
Soft caseB9918EZ
Q
Front coverB9957DG
Power cord (one of the following power cordsis supplied according to the instrument's suffix codes)
*1 For DL1540C/DL1540CL, a total of four passive probes are supplied (if the twooptional probes are included).
*2 A roll chart will be supplied only when the instrument is equipped with a built-in printer.
Checking the Contents of the Package
4 IM 701530-01E
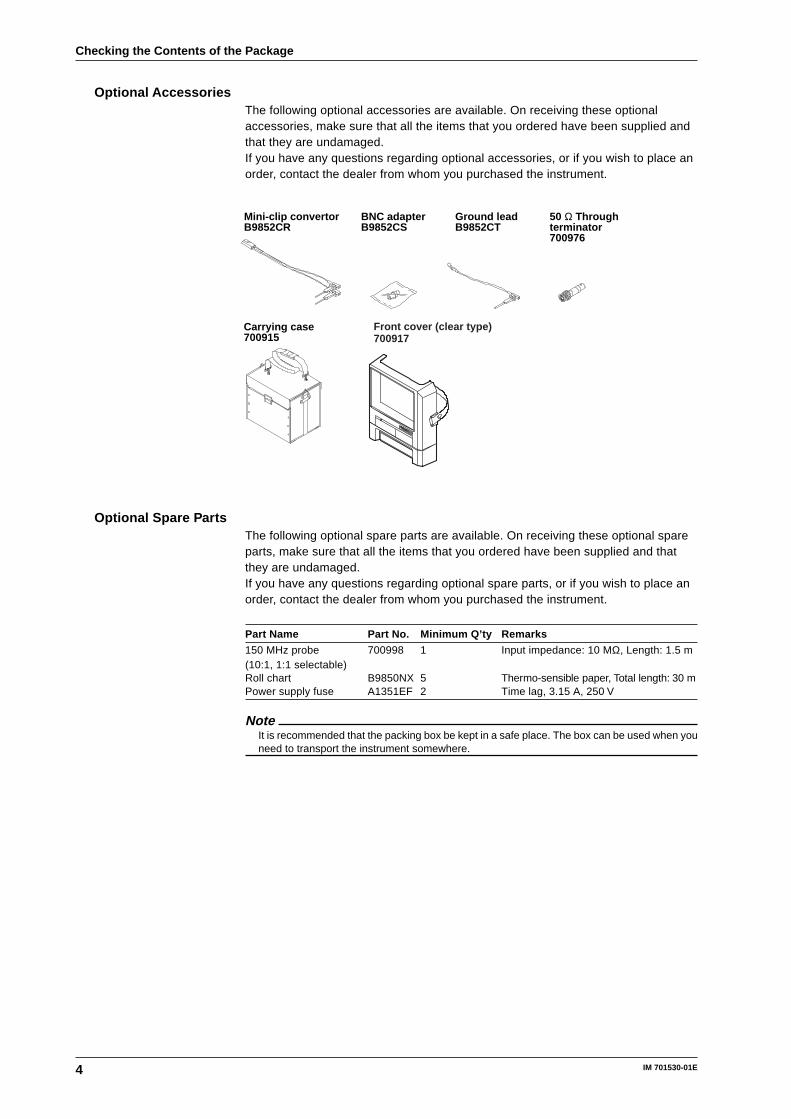
Optional AccessoriesThe following optional accessories are available. On receiving these optionalaccessories, make sure that all the items that you ordered have been supplied andthat they are undamaged.If you have any questions regarding optional accessories, or if you wish to place anorder, contact the dealer from whom you purchased the instrument.
BNC adapterB9852CS
Ground leadB9852CT
Mini-clip convertorB9852CR
50 Ω Throughterminator700976
Carrying case700915
Front cover (clear type)700917
Optional Spare PartsThe following optional spare parts are available. On receiving these optional spareparts, make sure that all the items that you ordered have been supplied and thatthey are undamaged.If you have any questions regarding optional spare parts, or if you wish to place anorder, contact the dealer from whom you purchased the instrument.
Part Name Part No. Minimum Q’ty Remarks
150 MHz probe 700998 1 Input impedance: 10 MΩ, Length: 1.5 m(10:1, 1:1 selectable)Roll chart B9850NX 5 Thermo-sensible paper, Total length: 30 mPower supply fuse A1351EF 2 Time lag, 3.15 A, 250 V
NoteIt is recommended that the packing box be kept in a safe place. The box can be used when youneed to transport the instrument somewhere.
Checking the Contents of the Package
5IM 701530-01E
Safety Precautions
This instrument is an IEC safety class I instrument (provided with terminal forprotective grounding). The following general safety precautions must be observedduring all phases of operation, service, and repair of this instrument. If thisinstrument is used in a manner not specified in this manual, the protection providedby this instrument may be impaired. Also, YOKOGAWA Electric Corporationassumes no liability for the customer’s failure to comply with these requirements.
The following symbols are used on this instrument.
To avoid injury, death of personnel or damage to the instrument, the operator mustrefer to an explanation in the User’s Manual or Service manual.
Function Grounding Terminal (This terminals shold not be used as a “Protectivegrounding terminal”.)
Alternating current
ON(power)
OFF(power)
In-position of a bistable push control
Out-position of a bistable push control
6 IM 701530-01E
WARNING Power SupplyEnsure the source voltage matches the voltage of the power supply before turningon the power.
Power Cord and PlugTo prevent an electric shock or fire, be sure to use the power supply cord suppliedby YOKOGAWA. The main power plug must be plugged in an outlet with protectivegrounding terminal. Do not invalidate protection by using an extension cord withoutprotective grounding.
Protective GroundingMake sure to connect the protective grounding to prevent an electric shock beforeturning on the power.
Necessity of Protective GroundingNever cut off the internal or external protective grounding wire or disconnect thewiring of protective grounding terminal. Doing so poses a potential shock hazard.
Defect of Protective Grounding and FuseDo not operate the instrument when protective grounding or fuse might bedefective.
FuseTo prevent a fire, make sure to use fuses with specified standard (current, voltage,type). Before replacing the fuses, turn off the power and disconnect the powersource. Do not use a different fuse or short-circuit the fuse holder.
Do not Operate in an Explosive AtmosphereDo not operate the instrument in the presence of flammable liquids or vapors.Operation of any electrical instrument in such an environment constitutes a safetyhazard.
Do not Remove any CoversThere are some areas with high voltage. Do not remove any cover if the powersupply is connected. The cover should be removed by qualified personnel only.
External ConnectionTo ground securely, connect the protective grounding before connecting tomeasurement or control unit.
Safety Precaustions
7IM 701530-01E
How to Use this Manual
Structure of the ManualThis User’s Manual consists of 16 chapters, an Appendix and an Index as describedbelow.
Chapter Title Description1 Functions Describes measurement principles and functions. Although
this section does not give a description of the operatingmethods, it will help you to understand the basic operations.
2 Name and Use of Gives the name of each part and describes how to use it.Each Part The corresponding reference pages for panel keys and the
rotary knobs are also given.
3 Before Starting Describes points to watch during use and describes how toObservation and install the instrument, connect the power cord, turn theMeasurement of power switch ON/OFF and connect probes as well as how toWaveforms set the date and time.
4 Common Describes the operations used to make settings, such asOperations start/stop acquisition, auto set-up and initialization of each
setting as well as operations, such as snapshot, clear traceand calibration, that are used frequently during operation.
5 Setting the Vertical Describes how to turn channels ON/OFF, how to makeand Horizontal settings, such as input coupling, probe attenuation andAxes vertical sensitivity, that are related to the vertical axis
(voltage axis), as well as how to make settings related to thehorizontal axis (time axis).
6 Activating a Trigger Describes trigger setting operations, such as those forsetting trigger mode, trigger type, trigger source and triggerlevel, that enable you to determine acquisition timing.
7 Changing Describes how to make acquisition condition settings, suchAcquisition as acquisition mode, sampling mode, input filter andand Display hysteresis, as well as how to make display conditionConditions settings, such as waveform expansion, interpolation,
accumulation, X-Y display and graticule.
8 Analyzing Describes how to measure waveforms using cursors,Waveforms performautomatic measurement of waveform parameters
and waveform math, and how to display the power spectrumobtained by FFT computation.
9 Performing a Describes how to perform a GO/NO-GO action by setting theGO/NO-GO Action waveform zone or setting limits for waveform parameters,
then detecting whether the input signal waveform is withinthe specified range (zone or limits).
10 Outputting Displayed Describes how to output displayed waveforms (screenWaveforms and hardcopy) and set-up information to the built-in printer orSetting Parameters plotter connected to the GP-IB interface.to the Printer/Plotter
11 Storing and Recalling Describes how to store displayed waveforms or settings in theData from the internal memory, how to recall stored waveform data and displayInternal Memory the waveforms, and how to recall settings and change them.
12 Saving and Describes how to save waveform data or set-up data to aLoading Data floppy disk, how to load saved data, how to initialize a floppyfrom a Floppy Disk disk and how to delete data.
13 Saving and Describes how to save the waveform data or set-up data toLoading Data from the SCSI device or the internal hard disk. Describes how toa SCSI Device or load the saved data, initialize the disk, delete the data, andthe Internal Hard Disk other operations.
14 Other Operations Describes operations such as those required for trigger output.
15 Troubleshooting, Describes how to diagnose the cause of trouble and how toMaintenance and correct it, as well as describing each message that mayInspection appear on the screen and how to perform a self test.
16 Specifications Describes the specifications.
Appendix Shows a menu map, describes the relationship between the timeaxis, sample rate and record length, and describes the dataformat which must be specified when waveform data is saved.
Index Important terms used in this manual with correspondingreference page numbers are given.
8 IM 701530-01E
Conventions Used in this Manual
Unitk ........... Denotes “1000”. Example: 100kS/sK ........... Denotes “1024” or “1002”.
• Example of when K indicates “1024” : 640 KB (storage capacity of afloppy disk)
• Example of when K indicates “1002” : 100 KW (record length foracquisition memory)
Used CharactersAlphanumerics enclosed in double quotation marks usually refer to characters andset values that appear on the screen and panel.The SHIFT + xxx key refers to first pressing the SHIFT key (the indicator above theSHIFT key lights), and then pressing the xxx key to obtain another, specified,function.
Symbols UsedThe following symbol marks are used in this User's Manual.
To avoid injury or death of personnel, or damage to theinstrument, the operator must refer to the User's Manual. Inthe User's Manual, these symbols appear on the pages towhich the operator must refer.
Describes precautions that should be observed to preventthe danger of serious injury or death to the user.
Describes precautions that should be observed to preventthe danger of minor or moderate injury to the user, or thedamage to the property.
Note Provides information that is important for proper operationof the instrument.
Symbol Marks Used for Descriptions of OperationsThe following symbol marks are used in Chapters 3 to 14 to distinguish certainfeg|ures in descriptions.
Relevant Keys Indicates the relevant panel key which arenecessary to carry out the operation.
Operating Procedure Carry out steps in the order shown. Theoperating procedures are given with theassumption that you are not familiar with theoperation. Thus, it may not be necessary to carryout all the steps when changing settings.
Keys and Procedure Shows the above mentioned relevant keys andthe operating procedure in one block.
Explanation Describes settings and restrictions relating to theoperation. A detailed description of the functionis not provided. For a detailed description of thefunction, refer to Chapter 1.
WARNING
CAUTION
9IM 701530-01E
3
2
1
4
5
6
7
8
9
10
11
12
13
14
15
16
App
Index
Contents
Introduction ................................................................................................................... ....................... 1Checking the Contents of the Package ........................................................................................... ... 2Safety Precautions ............................................................................................................. .................. 5How to Use this Manual ......................................................................................................... .............. 7Conventions Used in this Manual ................................................................................................ ....... 8
Chapter 1 Functions1.1 System Configuration and Block Diagram ............................................................................ 1-1
1.2 Setting the Vertical and Horizontal Axes ............................................................................... 1-2
1.3 Setting a Trigger .................................................................................................................... 1-8
1.4 Setting the Acquisition and Display Conditions .................................................................. 1-12
1.5 Analyzing the Waveform ..................................................................................................... 1-18
1.6 Other Useful Functions ....................................................................................................... 1-20
Chapter 2 Name and Use of Each Part2.1 Front Panel / Rear Panel / Top View ..................................................................................... 2-1
2.2 Operation Keys / Rotary Knob .............................................................................................. 2-3
2.3 Display .................................................................................................................................. 2-6
Chapter 3 Before Starting Observation and Measurement of Waveforms3.1 Precautions During Use ....................................................................................................... 3-1
3.2 Installing the Main Unit ......................................................................................................... 3-2
3.3 Connecting the Power Cord .................................................................................................. 3-3
3.4 Turning the Power Switch ON/OFF....................................................................................... 3-4
3.5 Connecting a Probe .............................................................................................................. 3-5
3.6 Compensating the Probe (Phase Correction) ....................................................................... 3-6
3.7 Setting the Date and Time .................................................................................................... 3-7
Chapter4 Common Operations4.1 Starting and Stopping Acquisition ........................................................................................ 4-1
4.2 Displaying Waveforms using the Auto Set-up Function ........................................................ 4-2
4.3 Initializing Settings ................................................................................................................ 4-4
4.4 Halting a Waveform and Erasing the Halted Waveform (Snapshot and Clear Trace) ........... 4-5
4.5 Performing Calibration .......................................................................................................... 4-6
4.6 Setting Values ....................................................................................................................... 4-7
4.7 Entering Characters using the Keyboard .............................................................................. 4-8
Chapter 5 Setting the Vertical and Horizontal Axes5.1 Turning Display of Input Signal Waveforms ON/OFF ............................................................ 5-1
5.2 Setting the Input Coupling .................................................................................................... 5-2
5.3 Setting the Probe Attenuation ............................................................................................... 5-4
5.4 Inverting a Waveform ............................................................................................................ 5-5
5.5 Setting the Vertical Sensitivity .............................................................................................. 5-6
5.6 Changing the Waveform’s Vertical Position........................................................................... 5-7
5.7 Selecting the Timebase ........................................................................................................ 5-8
5.8 Setting the Time Axis .......................................................................................................... 5-10
5.9 Changing the Waveform’s Horizontal Position .................................................................... 5-12
10 IM 701530-01E
Contents
Chapter 6 Activating a Trigger6.1 Relationship between Trigger Type and Trigger Source/Slope/Level .................................... 6-1
6.2 Setting the Edge Trigger ....................................................................................................... 6-2
6.3 Setting the Window Trigger ................................................................................................... 6-4
6.4 Setting the TV Trigger ........................................................................................................... 6-5
6.5 Setting the OR Trigger (Optional) ......................................................................................... 6-8
6.6 Setting the Pattern Trigger (Optional) ................................................................................... 6-9
6.7 Setting the Width Trigger (Optional) .................................................................................... 6-11
6.8 Setting the Trigger Mode..................................................................................................... 6-13
6.9 Setting the Action-On Trigger ............................................................................................. 6-15
6.10 Setting the Trigger Coupling and HF Rejection................................................................... 6-17
6.11 Changing the Trigger Position ............................................................................................. 6-18
6.12 Setting the Trigger Delay .................................................................................................... 6-19
6.13 Setting the Hold-off Time .................................................................................................... 6-20
Chapter 7 Changing Acquisition and Display Conditions7.1 Selecting Acquisition Mode, Sampling Mode, and Record Length for DL1540CL................ 7-1
7.2 Setting the Input Filter .......................................................................................................... 7-3
7.3 Zooming the Waveform ......................................................................................................... 7-4
7.4 Acquiring Waveforms using the Sequential Store Function .................................................. 7-7
7.5 Using the History Memory Function ..................................................................................... 7-9
7.6 Changing the area for displaying the waveform .................................................................. 7-11
7.7 Changing the Interpolation Settings ................................................................................... 7-12
7.8 Displaying an Accumulated Waveform ............................................................................... 7-13
7.9 Displaying an X-Y Waveform .............................................................................................. 7-15
7.10 Changing the Graticule, Scale and % Marker Settings ...................................................... 7-16
7.11 Turning the Waveform Information Display ON/OFF........................................................... 7-17
7.12 Changing the Screen Intensity ........................................................................................... 7-18
Chapter 8 Analyzing Waveforms8.1 Measuring a V-T Waveform using Cursors ........................................................................... 8-1
8.2 Measuring an X-Y Waveform using Cursors ......................................................................... 8-6
8.3 Measuring Waveform Parameters Automatically .................................................................. 8-8
8.4 Using the Linear Scaling Function ...................................................................................... 8-16
8.5 Performing Waveform Math (Addition, Subtraction and Multiplication) ............................... 8-18
8.6 Displaying the Power Spectrum (Performing FFT Computation) ........................................ 8-20
8.7 Measuring the Power Spectrum using Cursors .................................................................. 8-21
Chapter 9 Performing a GO/NO-GO Action9.1 Judging using a Waveform Zone .......................................................................................... 9-1
9.2 Judging using Measured Values of Waveform Parameters................................................... 9-8
9.3 Using the GO/NO-GO Signal Output Function ................................................................... 9-13
Chapter 10 Outputting Displayed Waveforms and Setting Parameters to the Printer/Plotter10.1 Loading a Chart in the Optional Built-in Printer .................................................................. 10-1
10.2 Printing Waveforms and Additional Information using the Optional Built-in Printer ............ 10-3
10.3 Real-time Printing using the Optional Built-in Printer ......................................................... 10-6
10.4 Connecting an External Plotter ........................................................................................... 10-7
10.5 Printing Displayed Waveforms and Additional Information using an External Plotter ......... 10-8
10.6 Entering a Comment ........................................................................................................ 10-10
10.7 Printing the Screen Image to an External Printer ............................................................. 10-11
11IM 701530-01E
3
2
1
4
5
6
7
8
9
10
11
12
13
14
15
16
App
Index
Contents
Chapter 11 Storing and Recalling Data from the Internal Memory11.1 Storing and Recalling Displayed Waveforms ...................................................................... 11-1
11.2 Storing and Recalling Setting Parameters .......................................................................... 11-3
Chapter 12 Saving and Loading Data from a Flopply Disk12.1 Floppy Disks ....................................................................................................................... 12-1
12.2 Formatting a Floppy Disk .................................................................................................... 12-2
12.3 Saving and Loading Waveform Data .................................................................................. 12-4
12.4 Saving and Loading Setting Parameters ............................................................................ 12-9
12.5 Saving Screen Image Data ............................................................................................... 12-11
12.6 Deleting and Protecting Saved Data ................................................................................ 12-14
Chapter 13 Saving and Loading Data from the SCSI Device or the Internal Hard Disk13.1 Connecting a SCSI Device ................................................................................................. 13-1
13.2 About the Internal Hard Disk (for /C8 option only) .............................................................. 13-2
13.3 Selecting the SCSI Device or the Internal Hard Disk ......................................................... 13-3
13.4 Formatting the Media .......................................................................................................... 13-4
13.5 Saving and Loading Waveform Data .................................................................................. 13-6
13.6 Saving and Loading Setting Parameters .......................................................................... 13-11
13.7 Saving Screen Image Data ............................................................................................... 13-13
13.8 Deleting and Protecting Saved Data ................................................................................ 13-17
13.9 Changing the SCSI ID Number (on Models with the Internal Hard Disk) ......................... 13-19
13.10Copying the Data Saved on the Internal Hard Disk (option) to the Floppy Disk ............... 13-20
13.11Connecting a PC to the DL1540CL /C8............................................................................ 13-21
Chapter 14 Other Operations14.1 Using a Trigger Output Signal ............................................................................................. 14-1
14.2 Downloading Waveform Data to an AG Arbitrary Waveform Generator ............................. 14-2
14.3 Checking the System Condition ......................................................................................... 14-3
14.4 Adjusting the Printer Density .............................................................................................. 14-4
14.5 Using a Video Signal Output (VIDEO OUT) ....................................................................... 14-5
14.6 Setting the Brightness of the LCD ...................................................................................... 14-6
Chapter 15 Troubleshooting, Maintenance and Inspection15.1 Troubleshooting .................................................................................................................. 15-1
15.2 Error Messages and Corrective Actions ............................................................................. 15-2
15.3 Self Test .............................................................................................................................. 15-6
15.4 Replacing the Power Supply Fuse ...................................................................................... 15-7
15.5 Recommended Parts for Replacement .............................................................................. 15-8
Chapter 16 Specifications16.1 Input Section ....................................................................................................................... 16-1
16.2 Trigger Section.................................................................................................................... 16-2
16.3 Time Axis ............................................................................................................................ 16-3
16.4 Display ................................................................................................................................ 16-3
16.5 Functions ............................................................................................................................ 16-4
16.6 Rear Panel Input/Output Section ........................................................................................ 16-5
16.7 Communication Interface .................................................................................................... 16-6
16.8 Built-in Printer (optional) ..................................................................................................... 16-7
16.9 Built-in Floppy Disk Drive ................................................................................................... 16-7
16.10Internal Hard Disk (for /C8 option) ...................................................................................... 16-7
16.11General Specifications ........................................................................................................ 16-8
16.12External Dimensions ........................................................................................................ 16-10

12 IM 701530-01E
Contents
AppendixAppendix 1 Menu Map ...............................................................................................................App-1
Appendix 2 Relationship between the Time Axis Setting, Sample Rate and Record Length (for
DL1540C) ..................................................................................................................................App-2
Appendix 3 Relationship between the Time Axis Setting, Sample Rate and Record Length (for
DL1540CL) ................................................................................................................................App-5
Appendix 4 How to Calculate the Area of a Waveform ............................................................App-11
Appendix 5 Output Data Format used when Saving Waveform Data (Example DL1540CL) ..App-12
Index
1-1IM 701530-01E
Functions
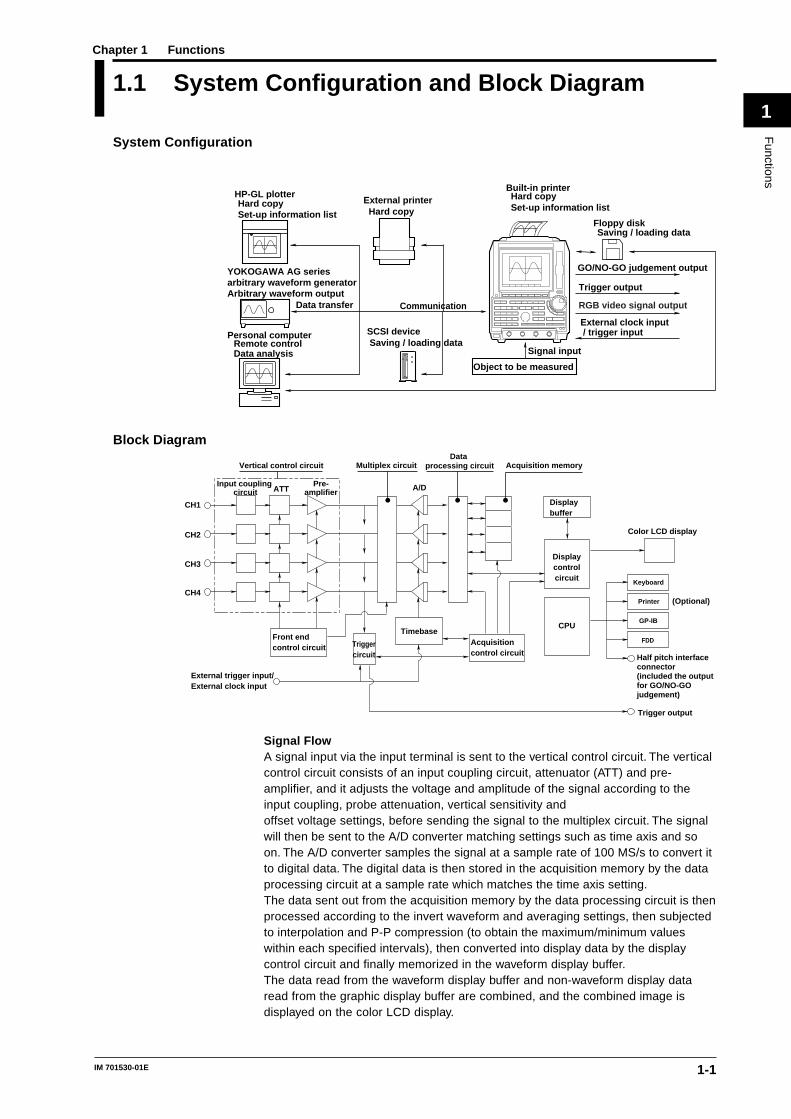
11.1 System Configuration and Block Diagram
System Configuration
HP-GL plotterHard copySet-up information list
Built-in printerHard copySet-up information list
Data transfer
Signal input
Floppy diskSaving / loading data
Personal computerRemote controlData analysis
Object to be measured
External clock input / trigger input
YOKOGAWA AG seriesarbitrary waveform generatorArbitrary waveform output
GO/NO-GO judgement output
Trigger output
Communication
SCSI device Saving / loading data
External printer Hard copy
RGB video signal output
Block Diagram
Front endcontrol circuit Trigger
circuit
Timebase
CH1
CH2
CH3
CH4
A/D
External trigger input/External clock input
Trigger output
Acquisition memory
Color LCD display
Keyboard
Printer
GP-IB
Vertical control circuit
Input coupling circuit
(Optional)
ATT
Acquisitioncontrol circuit
Displaycontrolcircuit
FDD
Half pitch interface connector(included the output for GO/NO-GOjudgement)
Display buffer
CPU
Data processing circuitMultiplex circuit
Pre-amplifier
Signal FlowA signal input via the input terminal is sent to the vertical control circuit. The verticalcontrol circuit consists of an input coupling circuit, attenuator (ATT) and pre-amplifier, and it adjusts the voltage and amplitude of the signal according to theinput coupling, probe attenuation, vertical sensitivity andoffset voltage settings, before sending the signal to the multiplex circuit. The signalwill then be sent to the A/D converter matching settings such as time axis and soon. The A/D converter samples the signal at a sample rate of 100 MS/s to convert itto digital data. The digital data is then stored in the acquisition memory by the dataprocessing circuit at a sample rate which matches the time axis setting.The data sent out from the acquisition memory by the data processing circuit is thenprocessed according to the invert waveform and averaging settings, then subjectedto interpolation and P-P compression (to obtain the maximum/minimum valueswithin each specified intervals), then converted into display data by the displaycontrol circuit and finally memorized in the waveform display buffer.The data read from the waveform display buffer and non-waveform display dataread from the graphic display buffer are combined, and the combined image isdisplayed on the color LCD display.
Chapter 1 Functions
1-2 IM 701530-01E
1.2 Setting the Vertical and Horizontal Axes
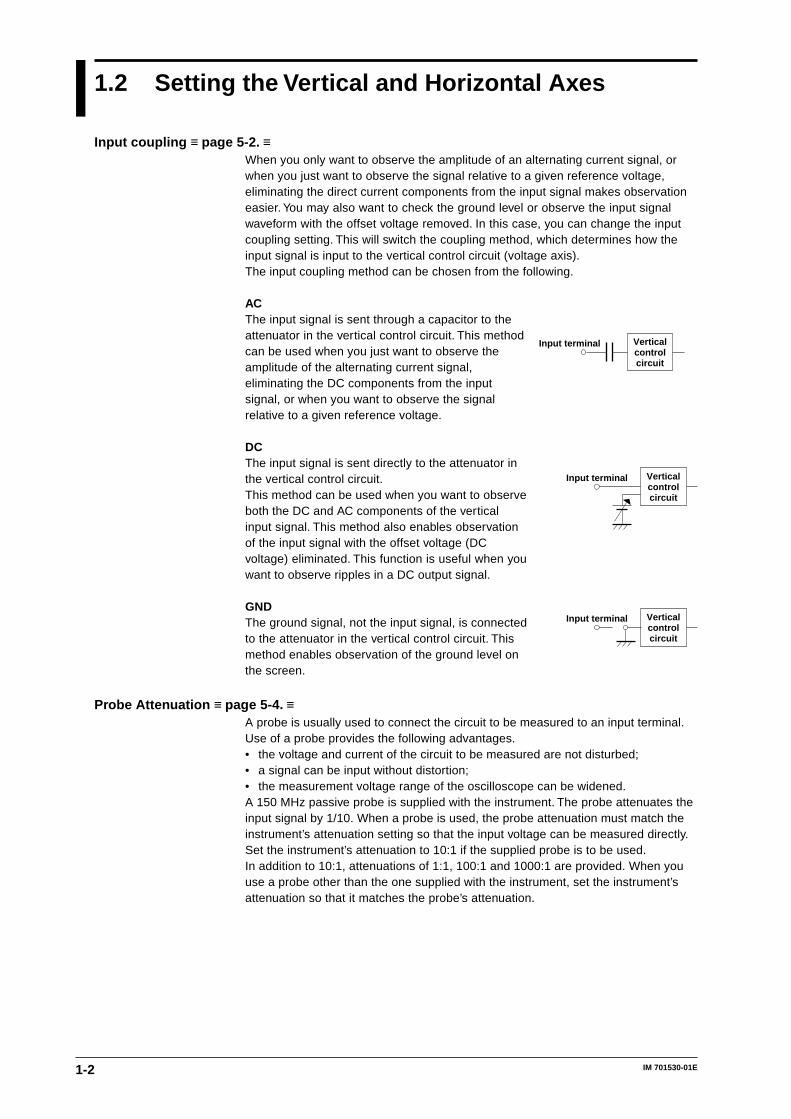
Input coupling ≡ page 5-2. ≡When you only want to observe the amplitude of an alternating current signal, orwhen you just want to observe the signal relative to a given reference voltage,eliminating the direct current components from the input signal makes observationeasier. You may also want to check the ground level or observe the input signalwaveform with the offset voltage removed. In this case, you can change the inputcoupling setting. This will switch the coupling method, which determines how theinput signal is input to the vertical control circuit (voltage axis).The input coupling method can be chosen from the following.
ACThe input signal is sent through a capacitor to theattenuator in the vertical control circuit. This methodcan be used when you just want to observe theamplitude of the alternating current signal,eliminating the DC components from the inputsignal, or when you want to observe the signalrelative to a given reference voltage.
DCThe input signal is sent directly to the attenuator inthe vertical control circuit.This method can be used when you want to observeboth the DC and AC components of the verticalinput signal. This method also enables observationof the input signal with the offset voltage (DCvoltage) eliminated. This function is useful when youwant to observe ripples in a DC output signal.
GNDThe ground signal, not the input signal, is connectedto the attenuator in the vertical control circuit. Thismethod enables observation of the ground level onthe screen.
Probe Attenuation ≡ page 5-4. ≡A probe is usually used to connect the circuit to be measured to an input terminal.Use of a probe provides the following advantages.• the voltage and current of the circuit to be measured are not disturbed;• a signal can be input without distortion;• the measurement voltage range of the oscilloscope can be widened.A 150 MHz passive probe is supplied with the instrument. The probe attenuates theinput signal by 1/10. When a probe is used, the probe attenuation must match theinstrument’s attenuation setting so that the input voltage can be measured directly.Set the instrument’s attenuation to 10:1 if the supplied probe is to be used.In addition to 10:1, attenuations of 1:1, 100:1 and 1000:1 are provided. When youuse a probe other than the one supplied with the instrument, set the instrument’sattenuation so that it matches the probe’s attenuation.
Verticalcontrolcircuit
Input terminal
Verticalcontrolcircuit
Input terminal
Verticalcontrolcircuit
Input terminal
1-3IM 701530-01E
Functions
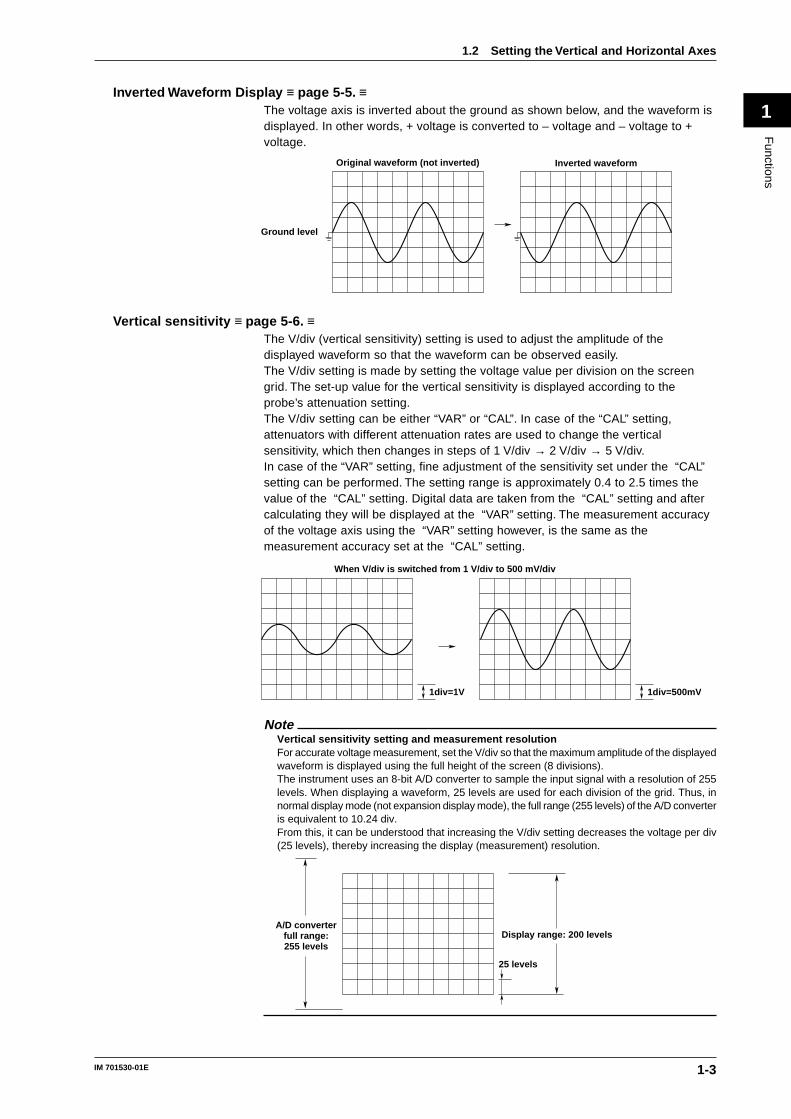
1Inverted Waveform Display ≡ page 5-5. ≡
The voltage axis is inverted about the ground as shown below, and the waveform isdisplayed. In other words, + voltage is converted to – voltage and – voltage to +voltage.
Ground level
Original waveform (not inverted) Inverted waveform
Vertical sensitivity ≡ page 5-6. ≡The V/div (vertical sensitivity) setting is used to adjust the amplitude of thedisplayed waveform so that the waveform can be observed easily.The V/div setting is made by setting the voltage value per division on the screengrid. The set-up value for the vertical sensitivity is displayed according to theprobe’s attenuation setting.The V/div setting can be either “VAR” or “CAL”. In case of the “CAL” setting,attenuators with different attenuation rates are used to change the verticalsensitivity, which then changes in steps of 1 V/div → 2 V/div → 5 V/div.In case of the “VAR” setting, fine adjustment of the sensitivity set under the “CAL”setting can be performed. The setting range is approximately 0.4 to 2.5 times thevalue of the “CAL” setting. Digital data are taken from the “CAL” setting and aftercalculating they will be displayed at the “VAR” setting. The measurement accuracyof the voltage axis using the “VAR” setting however, is the same as themeasurement accuracy set at the “CAL” setting.
1div=1V 1div=500mV
When V/div is switched from 1 V/div to 500 mV/div
NoteVertical sensitivity setting and measurement resolutionFor accurate voltage measurement, set the V/div so that the maximum amplitude of the displayedwaveform is displayed using the full height of the screen (8 divisions).The instrument uses an 8-bit A/D converter to sample the input signal with a resolution of 255levels. When displaying a waveform, 25 levels are used for each division of the grid. Thus, innormal display mode (not expansion display mode), the full range (255 levels) of the A/D converteris equivalent to 10.24 div.From this, it can be understood that increasing the V/div setting decreases the voltage per div(25 levels), thereby increasing the display (measurement) resolution.
Display range: 200 levels
25 levels
A/D converterfull range:255 levels
1.2 Setting the Vertical and Horizontal Axes
1-4 IM 701530-01E
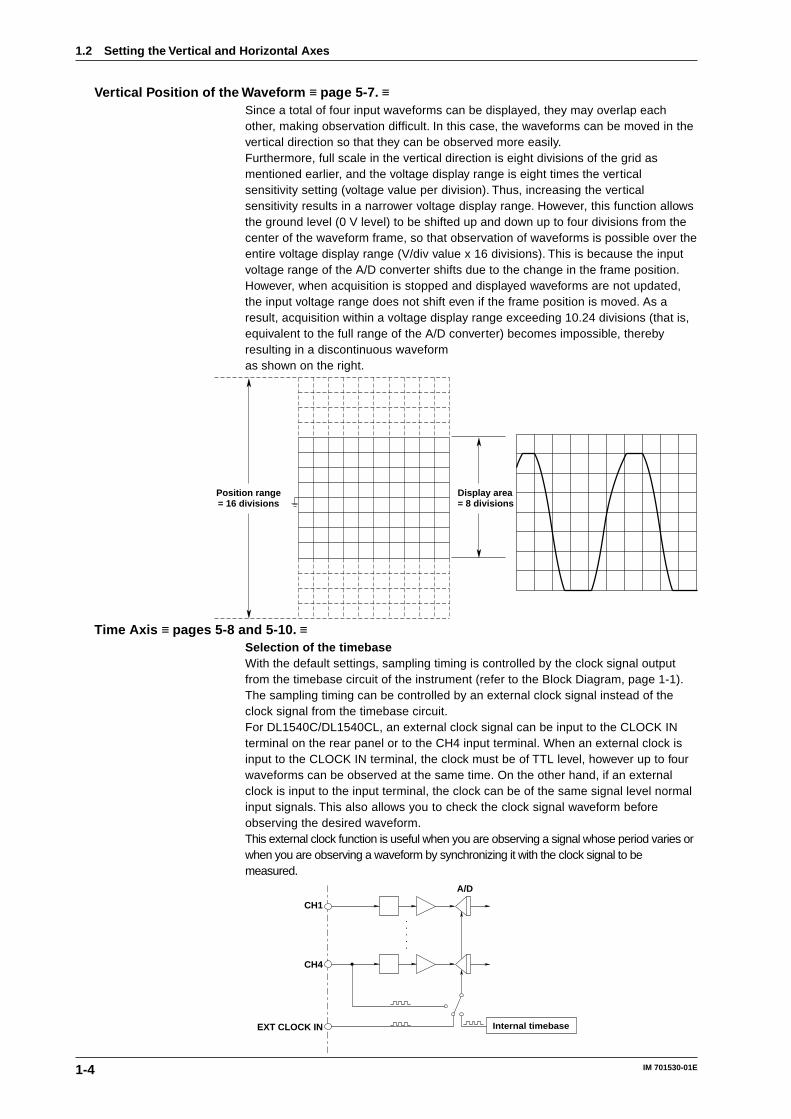
Vertical Position of the Waveform ≡ page 5-7. ≡Since a total of four input waveforms can be displayed, they may overlap eachother, making observation difficult. In this case, the waveforms can be moved in thevertical direction so that they can be observed more easily.Furthermore, full scale in the vertical direction is eight divisions of the grid asmentioned earlier, and the voltage display range is eight times the verticalsensitivity setting (voltage value per division). Thus, increasing the verticalsensitivity results in a narrower voltage display range. However, this function allowsthe ground level (0 V level) to be shifted up and down up to four divisions from thecenter of the waveform frame, so that observation of waveforms is possible over theentire voltage display range (V/div value x 16 divisions). This is because the inputvoltage range of the A/D converter shifts due to the change in the frame position.However, when acquisition is stopped and displayed waveforms are not updated,the input voltage range does not shift even if the frame position is moved. As aresult, acquisition within a voltage display range exceeding 10.24 divisions (that is,equivalent to the full range of the A/D converter) becomes impossible, therebyresulting in a discontinuous waveformas shown on the right.
Position range= 16 divisions
Display area = 8 divisions
Time Axis ≡ pages 5-8 and 5-10. ≡Selection of the timebaseWith the default settings, sampling timing is controlled by the clock signal outputfrom the timebase circuit of the instrument (refer to the Block Diagram, page 1-1).The sampling timing can be controlled by an external clock signal instead of theclock signal from the timebase circuit.For DL1540C/DL1540CL, an external clock signal can be input to the CLOCK INterminal on the rear panel or to the CH4 input terminal. When an external clock isinput to the CLOCK IN terminal, the clock must be of TTL level, however up to fourwaveforms can be observed at the same time. On the other hand, if an externalclock is input to the input terminal, the clock can be of the same signal level normalinput signals. This also allows you to check the clock signal waveform beforeobserving the desired waveform.This external clock function is useful when you are observing a signal whose period varies orwhen you are observing a waveform by synchronizing it with the clock signal to bemeasured.
Internal timebase
CH1
CH4
A/D
EXT CLOCK IN
1.2 Setting the Vertical and Horizontal Axes
1-5IM 701530-01E
Functions
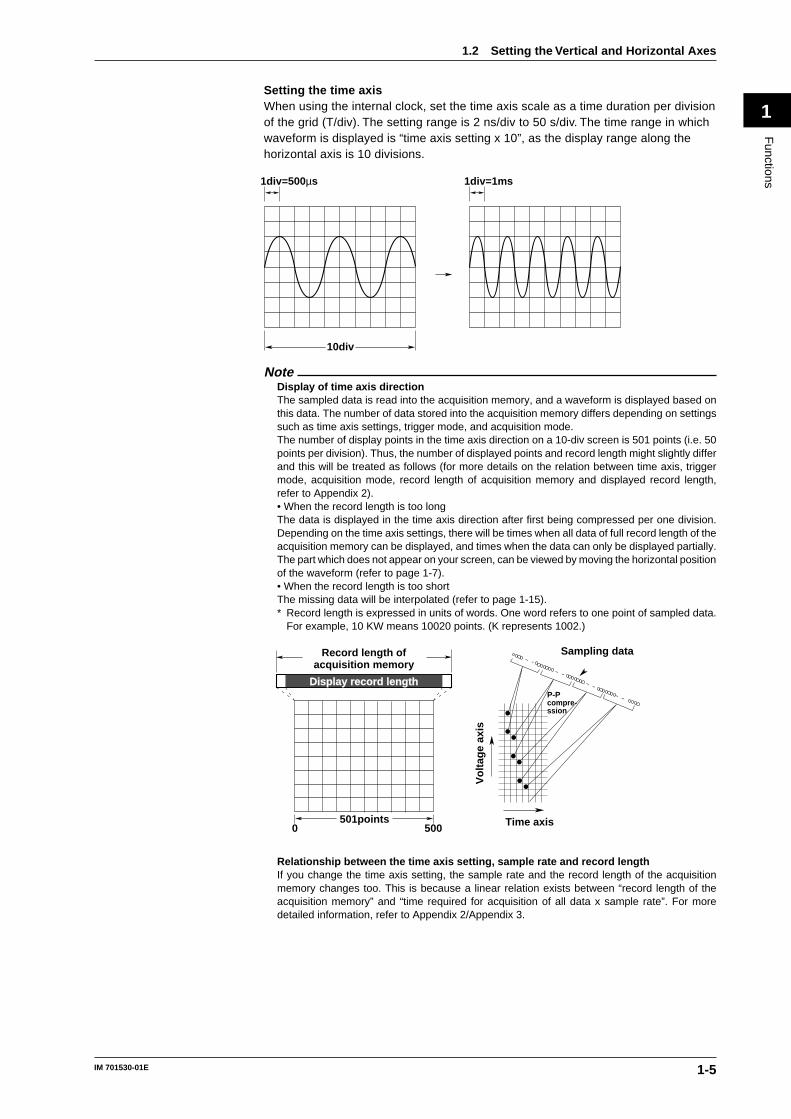
1Setting the time axisWhen using the internal clock, set the time axis scale as a time duration per divisionof the grid (T/div). The setting range is 2 ns/div to 50 s/div. The time range in whichwaveform is displayed is “time axis setting x 10”, as the display range along thehorizontal axis is 10 divisions.
1div=500µs
10div
1div=1ms
NoteDisplay of time axis directionThe sampled data is read into the acquisition memory, and a waveform is displayed based onthis data. The number of data stored into the acquisition memory differs depending on settingssuch as time axis settings, trigger mode, and acquisition mode.The number of display points in the time axis direction on a 10-div screen is 501 points (i.e. 50points per division). Thus, the number of displayed points and record length might slightly differand this will be treated as follows (for more details on the relation between time axis, triggermode, acquisition mode, record length of acquisition memory and displayed record length,refer to Appendix 2).• When the record length is too longThe data is displayed in the time axis direction after first being compressed per one division.Depending on the time axis settings, there will be times when all data of full record length of theacquisition memory can be displayed, and times when the data can only be displayed partially.The part which does not appear on your screen, can be viewed by moving the horizontal positionof the waveform (refer to page 1-7).• When the record length is too shortThe missing data will be interpolated (refer to page 1-15).* Record length is expressed in units of words. One word refers to one point of sampled data.
For example, 10 KW means 10020 points. (K represents 1002.)
501points0 500
Sampling data
Time axis
Display record lengthDisplay record length
Record length ofacquisition memory
P-Pcompre-ssion
Vo
ltag
e ax
is
Relationship between the time axis setting, sample rate and record lengthIf you change the time axis setting, the sample rate and the record length of the acquisitionmemory changes too. This is because a linear relation exists between “record length of theacquisition memory” and “time required for acquisition of all data x sample rate”. For moredetailed information, refer to Appendix 2/Appendix 3.
1.2 Setting the Vertical and Horizontal Axes
1-6 IM 701530-01E
Relationship between time axis setting and sampling modeThe sampling method (sampling mode) for an input signal changes according to the time axissetting as described hereafter.For T/div settings in the range between 5 µs/div and 100 ns/div, it is possible to switch real-timesampling area to repetitive sampling area. But, for DL1540CL, note that the time axis rangeover which this feature is actually available will vary according to the maximum displayablerecord length, as shown in Appendix 3.
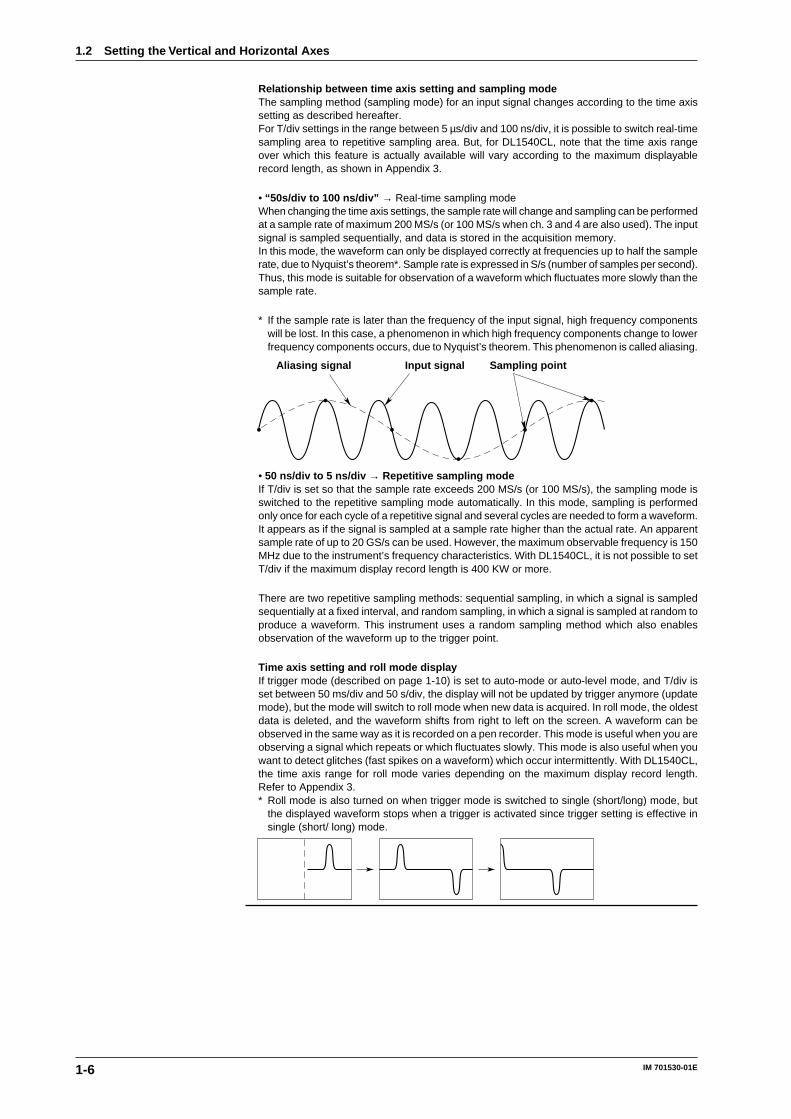
• “50s/div to 100 ns/div” → Real-time sampling modeWhen changing the time axis settings, the sample rate will change and sampling can be performedat a sample rate of maximum 200 MS/s (or 100 MS/s when ch. 3 and 4 are also used). The inputsignal is sampled sequentially, and data is stored in the acquisition memory.In this mode, the waveform can only be displayed correctly at frequencies up to half the samplerate, due to Nyquist’s theorem*. Sample rate is expressed in S/s (number of samples per second).Thus, this mode is suitable for observation of a waveform which fluctuates more slowly than thesample rate.
* If the sample rate is later than the frequency of the input signal, high frequency componentswill be lost. In this case, a phenomenon in which high frequency components change to lowerfrequency components occurs, due to Nyquist’s theorem. This phenomenon is called aliasing.
Aliasing signal Input signal Sampling point
• 50 ns/div to 5 ns/div → Repetitive sampling modeIf T/div is set so that the sample rate exceeds 200 MS/s (or 100 MS/s), the sampling mode isswitched to the repetitive sampling mode automatically. In this mode, sampling is performedonly once for each cycle of a repetitive signal and several cycles are needed to form a waveform.It appears as if the signal is sampled at a sample rate higher than the actual rate. An apparentsample rate of up to 20 GS/s can be used. However, the maximum observable frequency is 150MHz due to the instrument’s frequency characteristics. With DL1540CL, it is not possible to setT/div if the maximum display record length is 400 KW or more.
There are two repetitive sampling methods: sequential sampling, in which a signal is sampledsequentially at a fixed interval, and random sampling, in which a signal is sampled at random toproduce a waveform. This instrument uses a random sampling method which also enablesobservation of the waveform up to the trigger point.
Time axis setting and roll mode displayIf trigger mode (described on page 1-10) is set to auto-mode or auto-level mode, and T/div isset between 50 ms/div and 50 s/div, the display will not be updated by trigger anymore (updatemode), but the mode will switch to roll mode when new data is acquired. In roll mode, the oldestdata is deleted, and the waveform shifts from right to left on the screen. A waveform can beobserved in the same way as it is recorded on a pen recorder. This mode is useful when you areobserving a signal which repeats or which fluctuates slowly. This mode is also useful when youwant to detect glitches (fast spikes on a waveform) which occur intermittently. With DL1540CL,the time axis range for roll mode varies depending on the maximum display record length.Refer to Appendix 3.* Roll mode is also turned on when trigger mode is switched to single (short/long) mode, but
the displayed waveform stops when a trigger is activated since trigger setting is effective insingle (short/ long) mode.
1.2 Setting the Vertical and Horizontal Axes
1-7IM 701530-01E
Functions
1Horizontal Position of the Waveform ≡ page 5-12 ≡
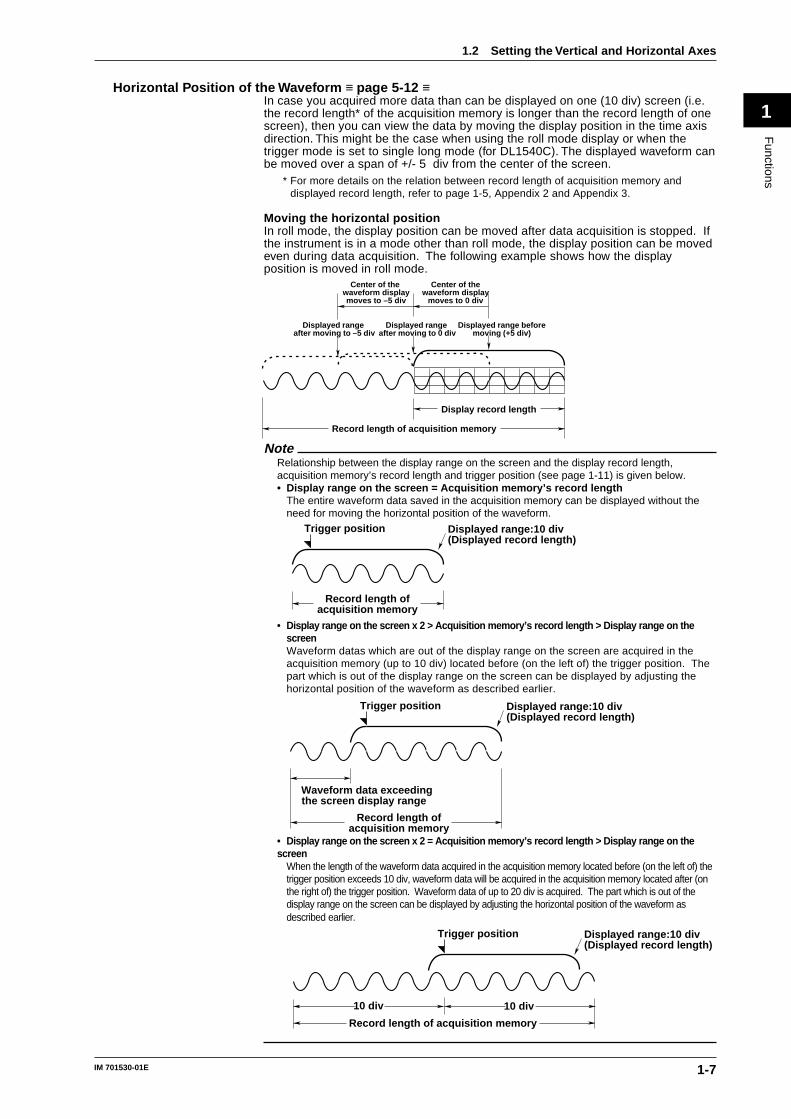
In case you acquired more data than can be displayed on one (10 div) screen (i.e.the record length* of the acquisition memory is longer than the record length of onescreen), then you can view the data by moving the display position in the time axisdirection. This might be the case when using the roll mode display or when thetrigger mode is set to single long mode (for DL1540C). The displayed waveform canbe moved over a span of +/- 5 div from the center of the screen.
* For more details on the relation between record length of acquisition memory anddisplayed record length, refer to page 1-5, Appendix 2 and Appendix 3.
Moving the horizontal positionIn roll mode, the display position can be moved after data acquisition is stopped. Ifthe instrument is in a mode other than roll mode, the display position can be movedeven during data acquisition. The following example shows how the displayposition is moved in roll mode.
Displayed range beforemoving (+5 div)
Displayed range after moving to –5 div
Displayed range after moving to 0 div
Center of thewaveform display
moves to 0 div
Center of the waveform displaymoves to –5 div
Display record length
Record length of acquisition memory
NoteRelationship between the display range on the screen and the display record length,acquisition memory’s record length and trigger position (see page 1-11) is given below.• Display range on the screen = Acquisition memory’s record length
The entire waveform data saved in the acquisition memory can be displayed without theneed for moving the horizontal position of the waveform.
Displayed range:10 div(Displayed record length)
Record length ofacquisition memory
Trigger position
• Display range on the screen x 2 > Acquisition memory’s record length > Display range on thescreenWaveform datas which are out of the display range on the screen are acquired in theacquisition memory (up to 10 div) located before (on the left of) the trigger position. Thepart which is out of the display range on the screen can be displayed by adjusting thehorizontal position of the waveform as described earlier.
Displayed range:10 div(Displayed record length)
Record length ofacquisition memory
Waveform data exceedingthe screen display range
Trigger position
• Display range on the screen x 2 = Acquisition memory’s record length > Display range on thescreen
When the length of the waveform data acquired in the acquisition memory located before (on the left of) thetrigger position exceeds 10 div, waveform data will be acquired in the acquisition memory located after (onthe right of) the trigger position. Waveform data of up to 20 div is acquired. The part which is out of thedisplay range on the screen can be displayed by adjusting the horizontal position of the waveform asdescribed earlier.
Displayed range:10 div(Displayed record length)
Record length of acquisition memory
Trigger position
10 div 10 div
1.2 Setting the Vertical and Horizontal Axes
1-8 IM 701530-01E
1.3 Setting a Trigger
Trigger Type / Trigger Source / Trigger Level ≡ pages 6-1 to 6-11. ≡Trigger type : Selects the type of trigger. The following types are available as
described below: Edge trigger, TV trigger and window trigger.Furthermore, the OR trigger, pattern trigger and width trigger areavailable as an option.
Trigger source : Selects the signal for the selected trigger type.Trigger level : Sets the voltage level used to judge trigger conditions such as
trigger slope (rise/fall of a signal) and trigger state (high/lowlevel).
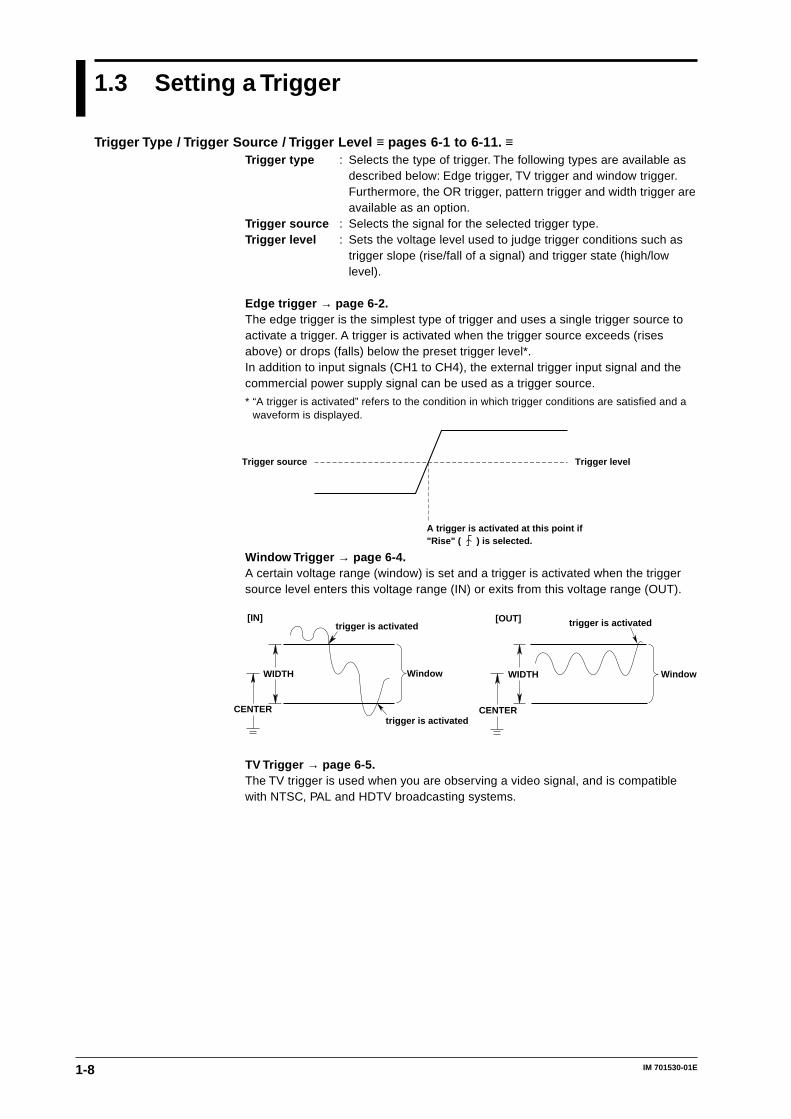
Edge trigger → page 6-2.The edge trigger is the simplest type of trigger and uses a single trigger source toactivate a trigger. A trigger is activated when the trigger source exceeds (risesabove) or drops (falls) below the preset trigger level*.In addition to input signals (CH1 to CH4), the external trigger input signal and thecommercial power supply signal can be used as a trigger source.
* “A trigger is activated” refers to the condition in which trigger conditions are satisfied and awaveform is displayed.
Trigger level
A trigger is activated at this point if "Rise" ( ) is selected.
Trigger source
Window Trigger → page 6-4.A certain voltage range (window) is set and a trigger is activated when the triggersource level enters this voltage range (IN) or exits from this voltage range (OUT).
WIDTH
trigger is activated[OUT]trigger is activated
[IN]
Window Window
trigger is activatedCENTER
WIDTH
CENTER
TV Trigger → page 6-5.The TV trigger is used when you are observing a video signal, and is compatiblewith NTSC, PAL and HDTV broadcasting systems.
1-9IM 701530-01E
Functions
1
1.3 Setting a Trigger
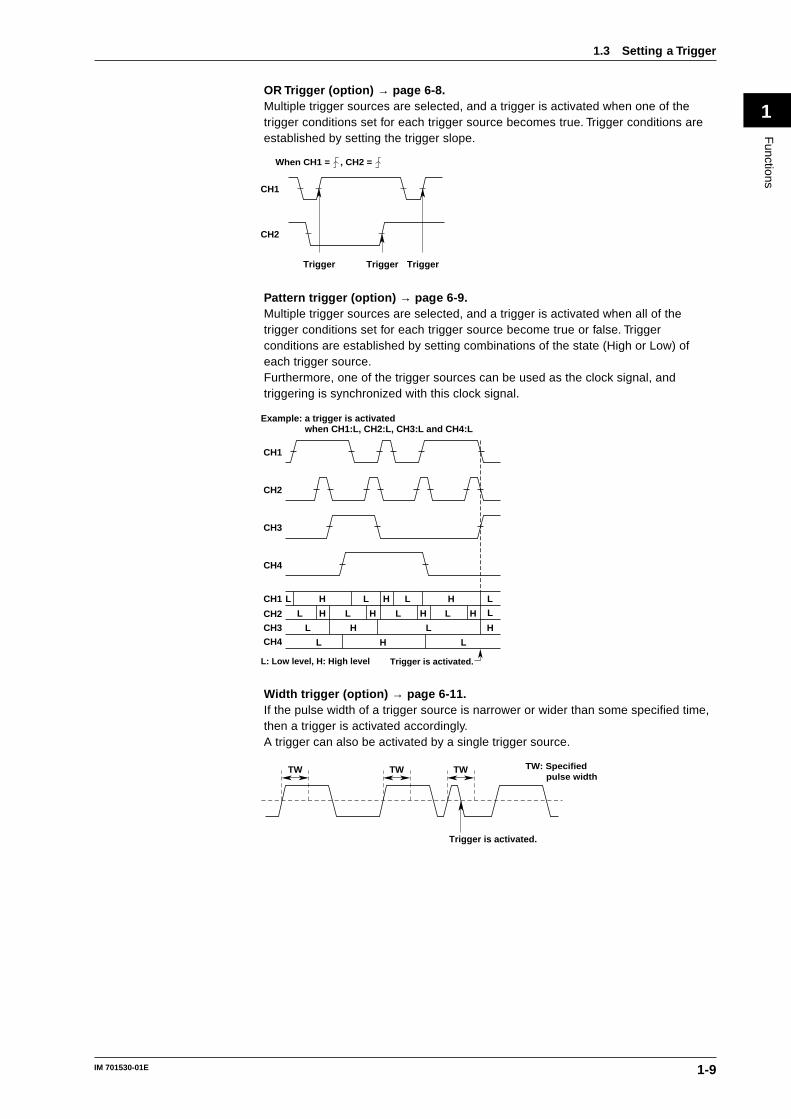
OR Trigger (option) → page 6-8.Multiple trigger sources are selected, and a trigger is activated when one of thetrigger conditions set for each trigger source becomes true. Trigger conditions areestablished by setting the trigger slope.
When CH1 = , CH2 =
Trigger
CH1
TriggerTrigger
CH2
Pattern trigger (option) → page 6-9.Multiple trigger sources are selected, and a trigger is activated when all of thetrigger conditions set for each trigger source become true or false. Triggerconditions are established by setting combinations of the state (High or Low) ofeach trigger source.Furthermore, one of the trigger sources can be used as the clock signal, andtriggering is synchronized with this clock signal.
L H L L LH
H H H HLL L L L
HL LH
HL L
H
CH1
CH2
CH3
CH4
CH1
CH2
CH3
CH4
L: Low level, H: High level Trigger is activated.
Example: a trigger is activated when CH1:L, CH2:L, CH3:L and CH4:L
Width trigger (option) → page 6-11.If the pulse width of a trigger source is narrower or wider than some specified time,then a trigger is activated accordingly.A trigger can also be activated by a single trigger source.
TW: Specified pulse width
Trigger is activated.
TW TW TW
1-10 IM 701530-01E
Trigger Mode ≡ page 6-13. ≡Conditions for updating displayed waveforms are set. The following six types oftrigger mode are available.
Auto-modeDisplayed waveforms are updated each time a trigger is activated within a specifiedtime (approximately 100 ms, referred to as the time-out period) and are updatedautomatically after each time-out period.
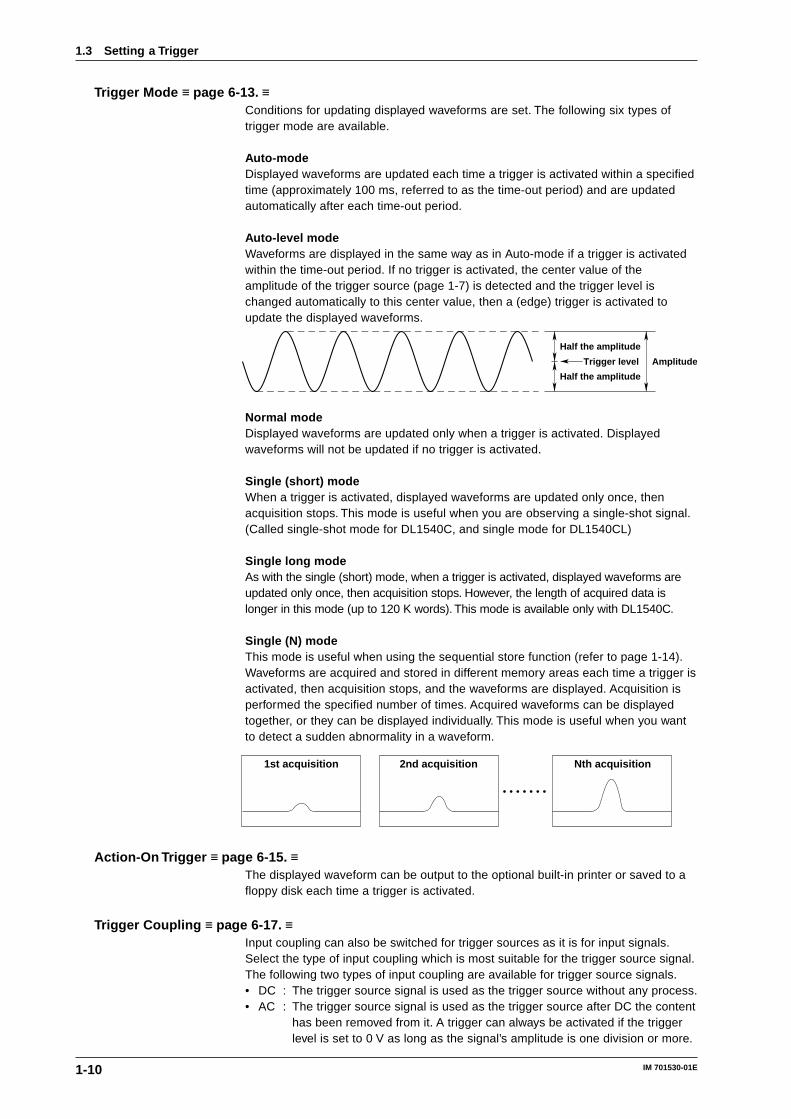
Auto-level modeWaveforms are displayed in the same way as in Auto-mode if a trigger is activatedwithin the time-out period. If no trigger is activated, the center value of theamplitude of the trigger source (page 1-7) is detected and the trigger level ischanged automatically to this center value, then a (edge) trigger is activated toupdate the displayed waveforms.
Half the amplitude
Half the amplitude
Trigger level Amplitude
Normal modeDisplayed waveforms are updated only when a trigger is activated. Displayedwaveforms will not be updated if no trigger is activated.
Single (short) modeWhen a trigger is activated, displayed waveforms are updated only once, thenacquisition stops. This mode is useful when you are observing a single-shot signal.(Called single-shot mode for DL1540C, and single mode for DL1540CL)
Single long modeAs with the single (short) mode, when a trigger is activated, displayed waveforms areupdated only once, then acquisition stops. However, the length of acquired data islonger in this mode (up to 120 K words). This mode is available only with DL1540C.
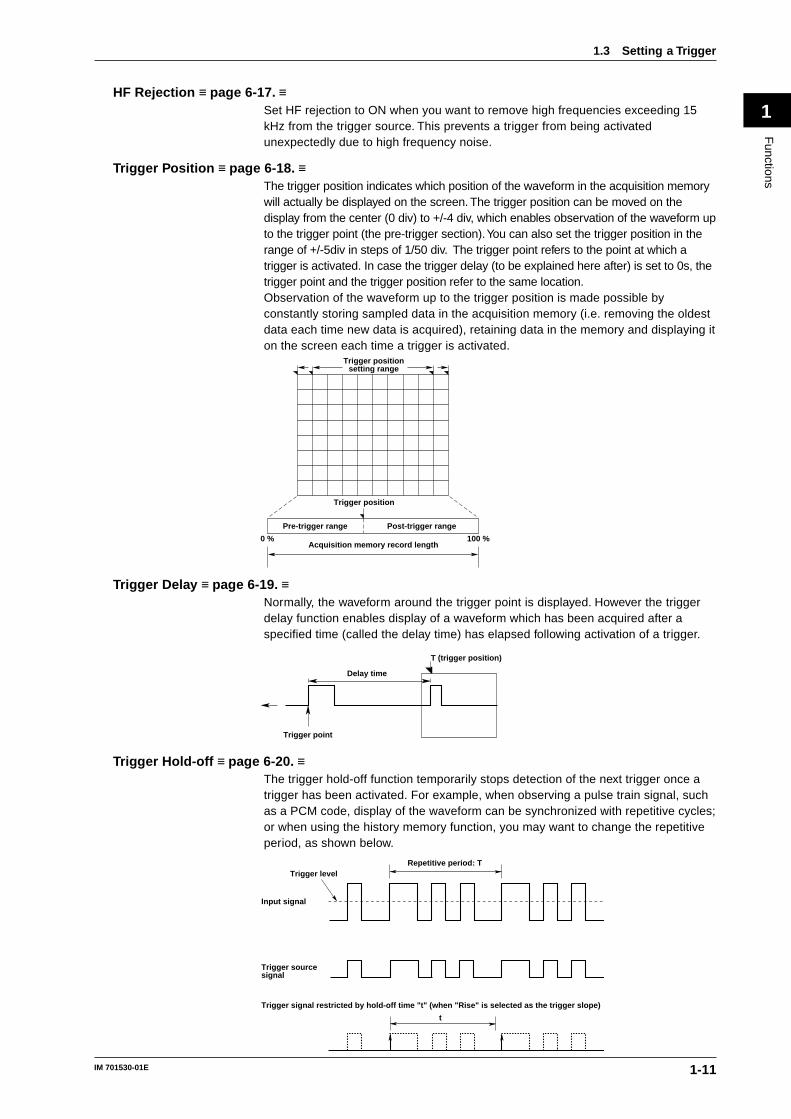
Single (N) modeThis mode is useful when using the sequential store function (refer to page 1-14).Waveforms are acquired and stored in different memory areas each time a trigger isactivated, then acquisition stops, and the waveforms are displayed. Acquisition isperformed the specified number of times. Acquired waveforms can be displayedtogether, or they can be displayed individually. This mode is useful when you wantto detect a sudden abnormality in a waveform.
1st acquisition 2nd acquisition Nth acquisition
Action-On Trigger ≡ page 6-15. ≡The displayed waveform can be output to the optional built-in printer or saved to afloppy disk each time a trigger is activated.
Trigger Coupling ≡ page 6-17. ≡Input coupling can also be switched for trigger sources as it is for input signals.Select the type of input coupling which is most suitable for the trigger source signal.The following two types of input coupling are available for trigger source signals.• DC : The trigger source signal is used as the trigger source without any process.• AC : The trigger source signal is used as the trigger source after DC the content
has been removed from it. A trigger can always be activated if the triggerlevel is set to 0 V as long as the signal’s amplitude is one division or more.
1.3 Setting a Trigger
1-11IM 701530-01E
Functions
1HF Rejection ≡ page 6-17. ≡
Set HF rejection to ON when you want to remove high frequencies exceeding 15kHz from the trigger source. This prevents a trigger from being activatedunexpectedly due to high frequency noise.
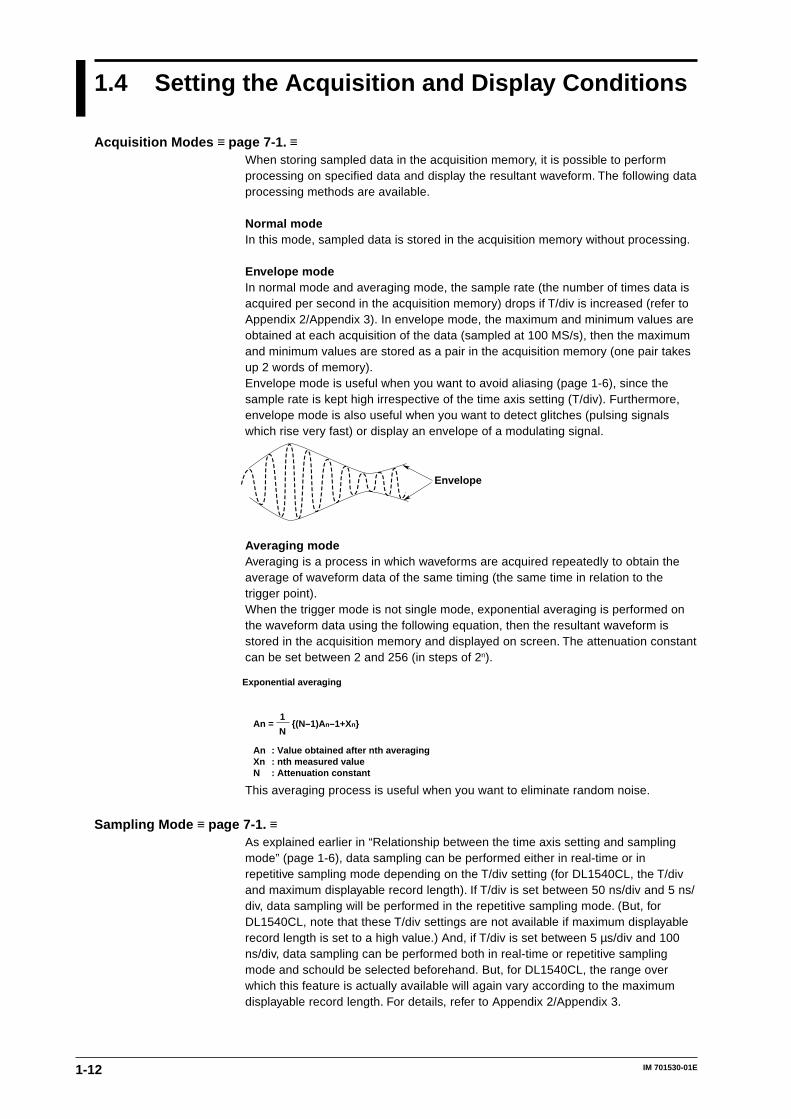
Trigger Position ≡ page 6-18. ≡The trigger position indicates which position of the waveform in the acquisition memorywill actually be displayed on the screen. The trigger position can be moved on thedisplay from the center (0 div) to +/-4 div, which enables observation of the waveform upto the trigger point (the pre-trigger section). You can also set the trigger position in therange of +/-5div in steps of 1/50 div. The trigger point refers to the point at which atrigger is activated. In case the trigger delay (to be explained here after) is set to 0s, thetrigger point and the trigger position refer to the same location.Observation of the waveform up to the trigger position is made possible byconstantly storing sampled data in the acquisition memory (i.e. removing the oldestdata each time new data is acquired), retaining data in the memory and displaying iton the screen each time a trigger is activated.
Acquisition memory record length
Trigger position
Trigger positionsetting range
Pre-trigger range Post-trigger range
0 % 100 %
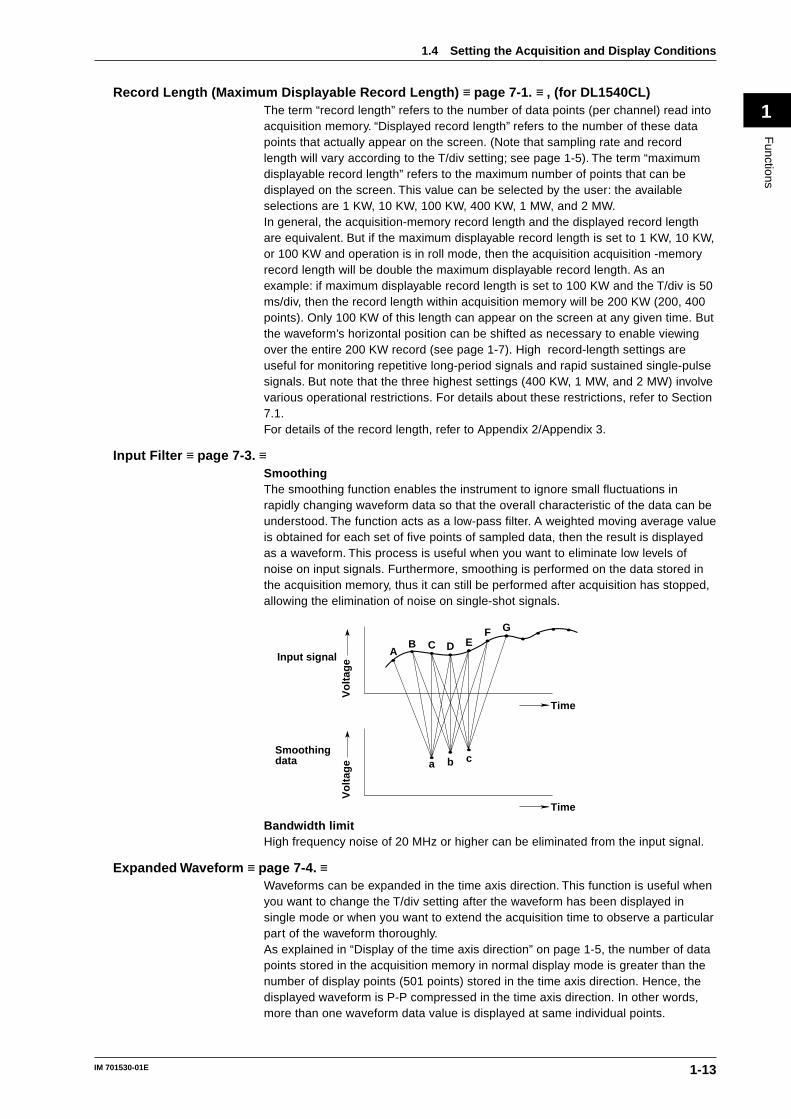
Trigger Delay ≡ page 6-19. ≡Normally, the waveform around the trigger point is displayed. However the triggerdelay function enables display of a waveform which has been acquired after aspecified time (called the delay time) has elapsed following activation of a trigger.
Delay time
Trigger point
T (trigger position)
Trigger Hold-off ≡ page 6-20. ≡The trigger hold-off function temporarily stops detection of the next trigger once atrigger has been activated. For example, when observing a pulse train signal, suchas a PCM code, display of the waveform can be synchronized with repetitive cycles;or when using the history memory function, you may want to change the repetitiveperiod, as shown below.
Input signal
Repetitive period: TTrigger level
Trigger source signal
t
Trigger signal restricted by hold-off time "t" (when "Rise" is selected as the trigger slope)
1.3 Setting a Trigger
1-12 IM 701530-01E
1.4 Setting the Acquisition and Display Conditions
Acquisition Modes ≡ page 7-1. ≡When storing sampled data in the acquisition memory, it is possible to performprocessing on specified data and display the resultant waveform. The following dataprocessing methods are available.
Normal modeIn this mode, sampled data is stored in the acquisition memory without processing.
Envelope modeIn normal mode and averaging mode, the sample rate (the number of times data isacquired per second in the acquisition memory) drops if T/div is increased (refer toAppendix 2/Appendix 3). In envelope mode, the maximum and minimum values areobtained at each acquisition of the data (sampled at 100 MS/s), then the maximumand minimum values are stored as a pair in the acquisition memory (one pair takesup 2 words of memory).Envelope mode is useful when you want to avoid aliasing (page 1-6), since thesample rate is kept high irrespective of the time axis setting (T/div). Furthermore,envelope mode is also useful when you want to detect glitches (pulsing signalswhich rise very fast) or display an envelope of a modulating signal.
Envelope
Averaging modeAveraging is a process in which waveforms are acquired repeatedly to obtain theaverage of waveform data of the same timing (the same time in relation to thetrigger point).When the trigger mode is not single mode, exponential averaging is performed onthe waveform data using the following equation, then the resultant waveform isstored in the acquisition memory and displayed on screen. The attenuation constantcan be set between 2 and 256 (in steps of 2n).
An = (N–1)An–1+Xn1
N
Exponential averaging
AnXnN
: Value obtained after nth averaging: nth measured value: Attenuation constant
This averaging process is useful when you want to eliminate random noise.
Sampling Mode ≡ page 7-1. ≡As explained earlier in “Relationship between the time axis setting and samplingmode” (page 1-6), data sampling can be performed either in real-time or inrepetitive sampling mode depending on the T/div setting (for DL1540CL, the T/divand maximum displayable record length). If T/div is set between 50 ns/div and 5 ns/div, data sampling will be performed in the repetitive sampling mode. (But, forDL1540CL, note that these T/div settings are not available if maximum displayablerecord length is set to a high value.) And, if T/div is set between 5 µs/div and 100ns/div, data sampling can be performed both in real-time or repetitive samplingmode and schould be selected beforehand. But, for DL1540CL, the range overwhich this feature is actually available will again vary according to the maximumdisplayable record length. For details, refer to Appendix 2/Appendix 3.
1-13IM 701530-01E
Functions
1Record Length (Maximum Displayable Record Length) ≡ page 7-1. ≡ , (for DL1540CL)
The term “record length” refers to the number of data points (per channel) read intoacquisition memory. “Displayed record length” refers to the number of these datapoints that actually appear on the screen. (Note that sampling rate and recordlength will vary according to the T/div setting; see page 1-5). The term “maximumdisplayable record length” refers to the maximum number of points that can bedisplayed on the screen. This value can be selected by the user: the availableselections are 1 KW, 10 KW, 100 KW, 400 KW, 1 MW, and 2 MW.In general, the acquisition-memory record length and the displayed record lengthare equivalent. But if the maximum displayable record length is set to 1 KW, 10 KW,or 100 KW and operation is in roll mode, then the acquisition acquisition -memoryrecord length will be double the maximum displayable record length. As anexample: if maximum displayable record length is set to 100 KW and the T/div is 50ms/div, then the record length within acquisition memory will be 200 KW (200, 400points). Only 100 KW of this length can appear on the screen at any given time. Butthe waveform’s horizontal position can be shifted as necessary to enable viewingover the entire 200 KW record (see page 1-7). High record-length settings areuseful for monitoring repetitive long-period signals and rapid sustained single-pulsesignals. But note that the three highest settings (400 KW, 1 MW, and 2 MW) involvevarious operational restrictions. For details about these restrictions, refer to Section7.1.For details of the record length, refer to Appendix 2/Appendix 3.
Input Filter ≡ page 7-3. ≡SmoothingThe smoothing function enables the instrument to ignore small fluctuations inrapidly changing waveform data so that the overall characteristic of the data can beunderstood. The function acts as a low-pass filter. A weighted moving average valueis obtained for each set of five points of sampled data, then the result is displayedas a waveform. This process is useful when you want to eliminate low levels ofnoise on input signals. Furthermore, smoothing is performed on the data stored inthe acquisition memory, thus it can still be performed after acquisition has stopped,allowing the elimination of noise on single-shot signals.
Vo
ltag
eV
olt
age
Time
Time
AB C D E
F
a b c
G
Input signal
Smoothing data
Bandwidth limitHigh frequency noise of 20 MHz or higher can be eliminated from the input signal.
Expanded Waveform ≡ page 7-4. ≡Waveforms can be expanded in the time axis direction. This function is useful whenyou want to change the T/div setting after the waveform has been displayed insingle mode or when you want to extend the acquisition time to observe a particularpart of the waveform thoroughly.As explained in “Display of the time axis direction” on page 1-5, the number of datapoints stored in the acquisition memory in normal display mode is greater than thenumber of display points (501 points) stored in the time axis direction. Hence, thedisplayed waveform is P-P compressed in the time axis direction. In other words,more than one waveform data value is displayed at same individual points.
1.4 Setting the Acquisition and Display Conditions
1-14 IM 701530-01E
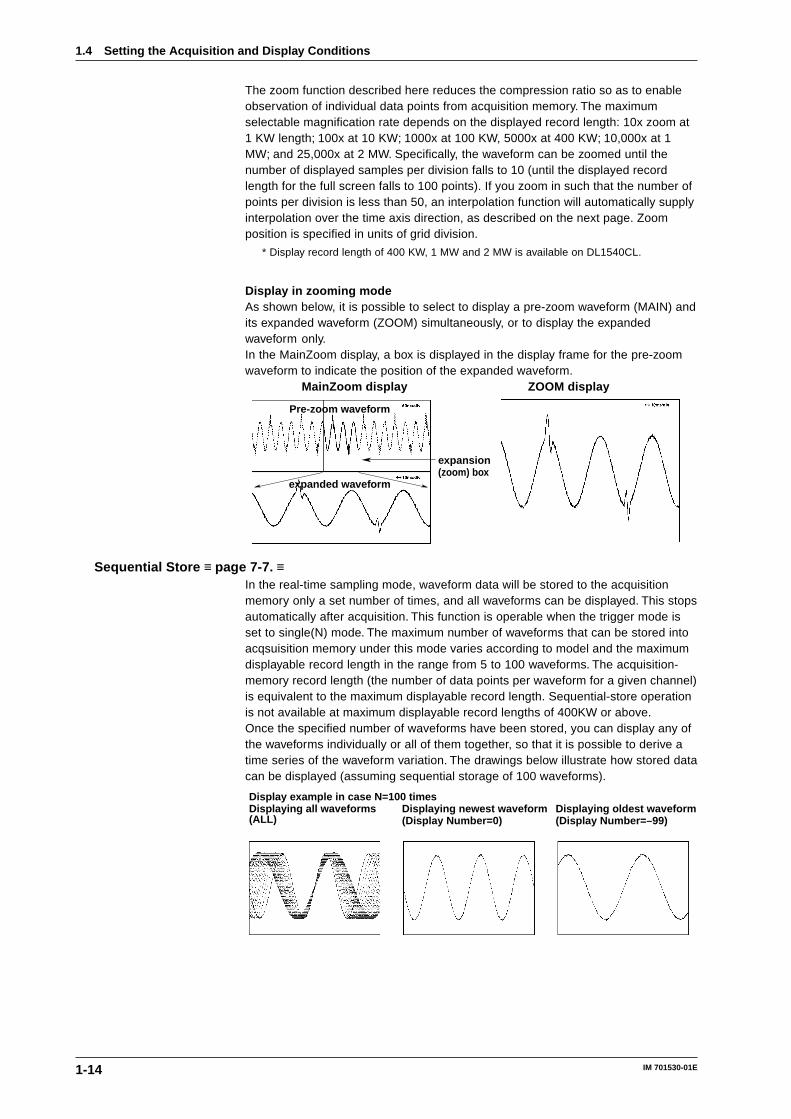
The zoom function described here reduces the compression ratio so as to enableobservation of individual data points from acquisition memory. The maximumselectable magnification rate depends on the displayed record length: 10x zoom at1 KW length; 100x at 10 KW; 1000x at 100 KW, 5000x at 400 KW; 10,000x at 1MW; and 25,000x at 2 MW. Specifically, the waveform can be zoomed until thenumber of displayed samples per division falls to 10 (until the displayed recordlength for the full screen falls to 100 points). If you zoom in such that the number ofpoints per division is less than 50, an interpolation function will automatically supplyinterpolation over the time axis direction, as described on the next page. Zoomposition is specified in units of grid division.
* Display record length of 400 KW, 1 MW and 2 MW is available on DL1540CL.
Display in zooming modeAs shown below, it is possible to select to display a pre-zoom waveform (MAIN) andits expanded waveform (ZOOM) simultaneously, or to display the expandedwaveform only.In the MainZoom display, a box is displayed in the display frame for the pre-zoomwaveform to indicate the position of the expanded waveform.
MainZoom display ZOOM display
expansion(zoom) box
Pre-zoom waveform
expanded waveform
Sequential Store ≡ page 7-7. ≡In the real-time sampling mode, waveform data will be stored to the acquisitionmemory only a set number of times, and all waveforms can be displayed. This stopsautomatically after acquisition. This function is operable when the trigger mode isset to single(N) mode. The maximum number of waveforms that can be stored intoacqsuisition memory under this mode varies according to model and the maximumdisplayable record length in the range from 5 to 100 waveforms. The acquisition-memory record length (the number of data points per waveform for a given channel)is equivalent to the maximum displayable record length. Sequential-store operationis not available at maximum displayable record lengths of 400KW or above.Once the specified number of waveforms have been stored, you can display any ofthe waveforms individually or all of them together, so that it is possible to derive atime series of the waveform variation. The drawings below illustrate how stored datacan be displayed (assuming sequential storage of 100 waveforms).
Display example in case N=100 timesDisplaying all waveforms(ALL)
Displaying newest waveform(Display Number=0)
Displaying oldest waveform(Display Number=–99)
1.4 Setting the Acquisition and Display Conditions
1-15IM 701530-01E
Functions
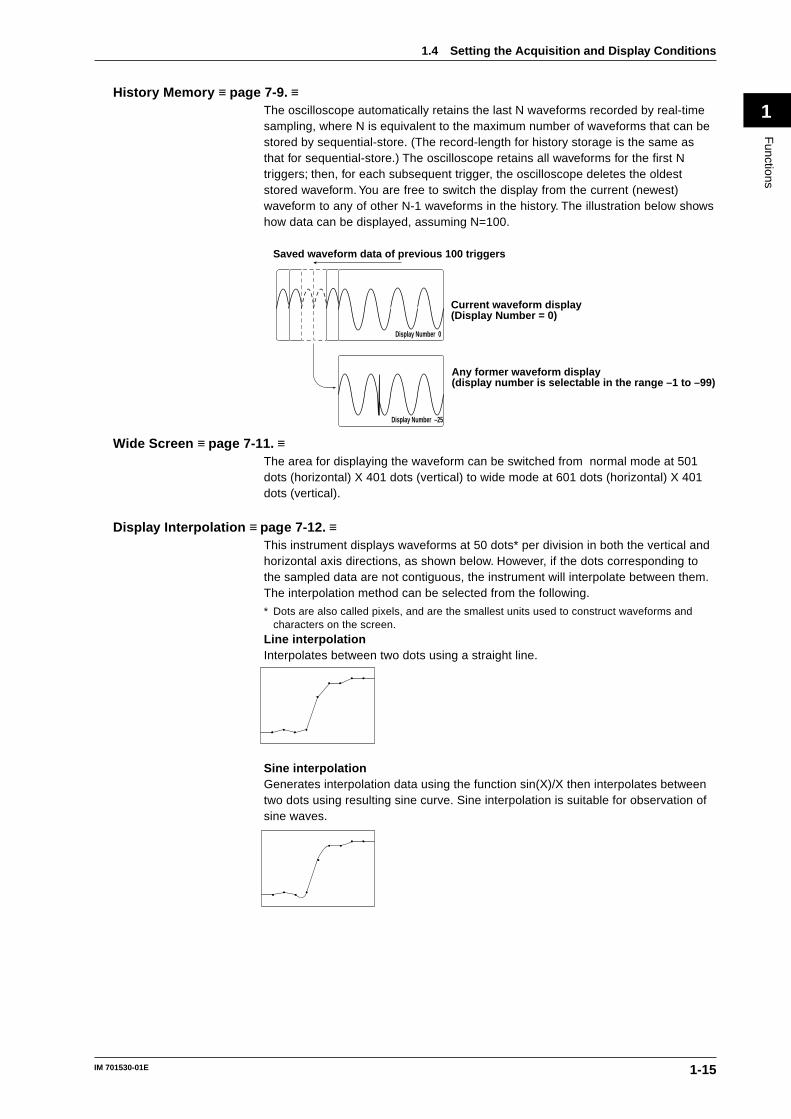
1History Memory ≡ page 7-9. ≡
The oscilloscope automatically retains the last N waveforms recorded by real-timesampling, where N is equivalent to the maximum number of waveforms that can bestored by sequential-store. (The record-length for history storage is the same asthat for sequential-store.) The oscilloscope retains all waveforms for the first Ntriggers; then, for each subsequent trigger, the oscilloscope deletes the oldeststored waveform. You are free to switch the display from the current (newest)waveform to any of other N-1 waveforms in the history. The illustration below showshow data can be displayed, assuming N=100.
Saved waveform data of previous 100 triggers
Display Number 0
Display Number –25
Current waveform display(Display Number = 0)
Any former waveform display(display number is selectable in the range –1 to –99)
Wide Screen ≡ page 7-11. ≡The area for displaying the waveform can be switched from normal mode at 501dots (horizontal) X 401 dots (vertical) to wide mode at 601 dots (horizontal) X 401dots (vertical).
Display Interpolation ≡ page 7-12. ≡This instrument displays waveforms at 50 dots* per division in both the vertical andhorizontal axis directions, as shown below. However, if the dots corresponding tothe sampled data are not contiguous, the instrument will interpolate between them.The interpolation method can be selected from the following.
* Dots are also called pixels, and are the smallest units used to construct waveforms andcharacters on the screen.
Line interpolationInterpolates between two dots using a straight line.
Sine interpolationGenerates interpolation data using the function sin(X)/X then interpolates betweentwo dots using resulting sine curve. Sine interpolation is suitable for observation ofsine waves.
1.4 Setting the Acquisition and Display Conditions
1-16 IM 701530-01E
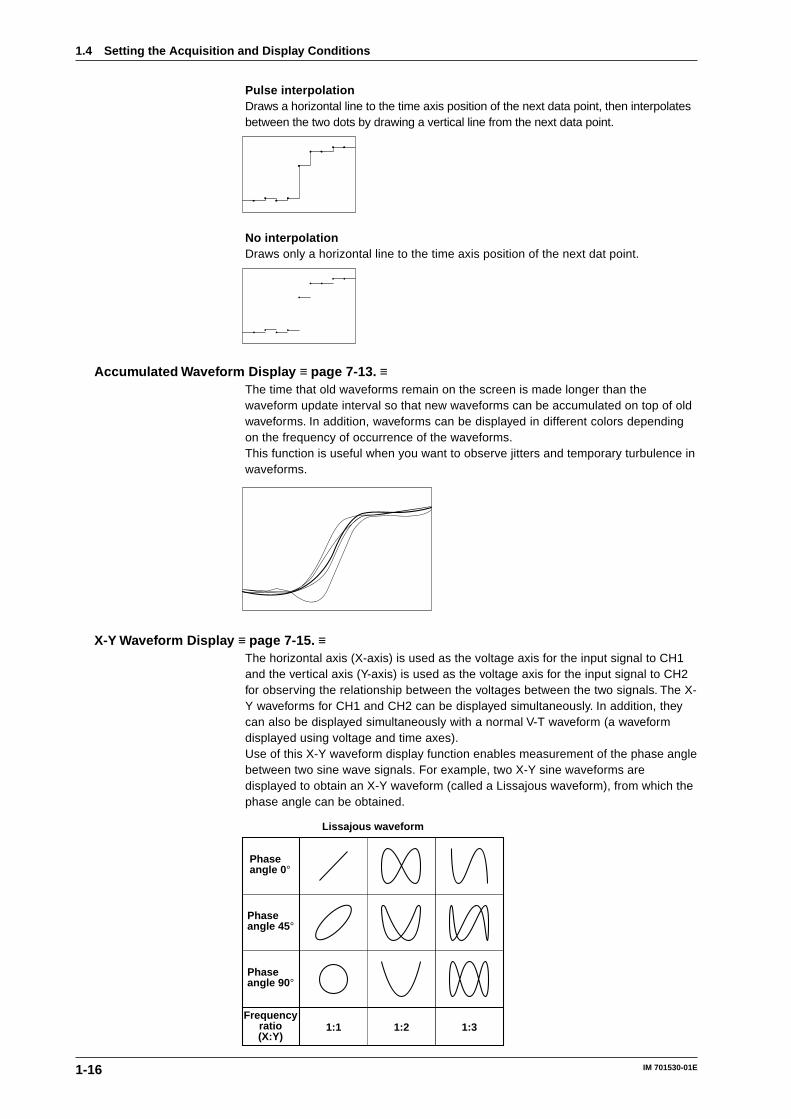
Pulse interpolationDraws a horizontal line to the time axis position of the next data point, then interpolatesbetween the two dots by drawing a vertical line from the next data point.
No interpolationDraws only a horizontal line to the time axis position of the next dat point.
Accumulated Waveform Display ≡ page 7-13. ≡The time that old waveforms remain on the screen is made longer than thewaveform update interval so that new waveforms can be accumulated on top of oldwaveforms. In addition, waveforms can be displayed in different colors dependingon the frequency of occurrence of the waveforms.This function is useful when you want to observe jitters and temporary turbulence inwaveforms.
X-Y Waveform Display ≡ page 7-15. ≡The horizontal axis (X-axis) is used as the voltage axis for the input signal to CH1and the vertical axis (Y-axis) is used as the voltage axis for the input signal to CH2for observing the relationship between the voltages between the two signals. The X-Y waveforms for CH1 and CH2 can be displayed simultaneously. In addition, theycan also be displayed simultaneously with a normal V-T waveform (a waveformdisplayed using voltage and time axes).Use of this X-Y waveform display function enables measurement of the phase anglebetween two sine wave signals. For example, two X-Y sine waveforms aredisplayed to obtain an X-Y waveform (called a Lissajous waveform), from which thephase angle can be obtained.
Phase angle 0°
Phase angle 45°
Phase angle 90°
Frequencyratio(X:Y)
1:1 1:2 1:3
Lissajous waveform
1.4 Setting the Acquisition and Display Conditions
1-17IM 701530-01E
Functions
1Other Display Modes Settings ≡ pages 7-16 to 7-18. ≡
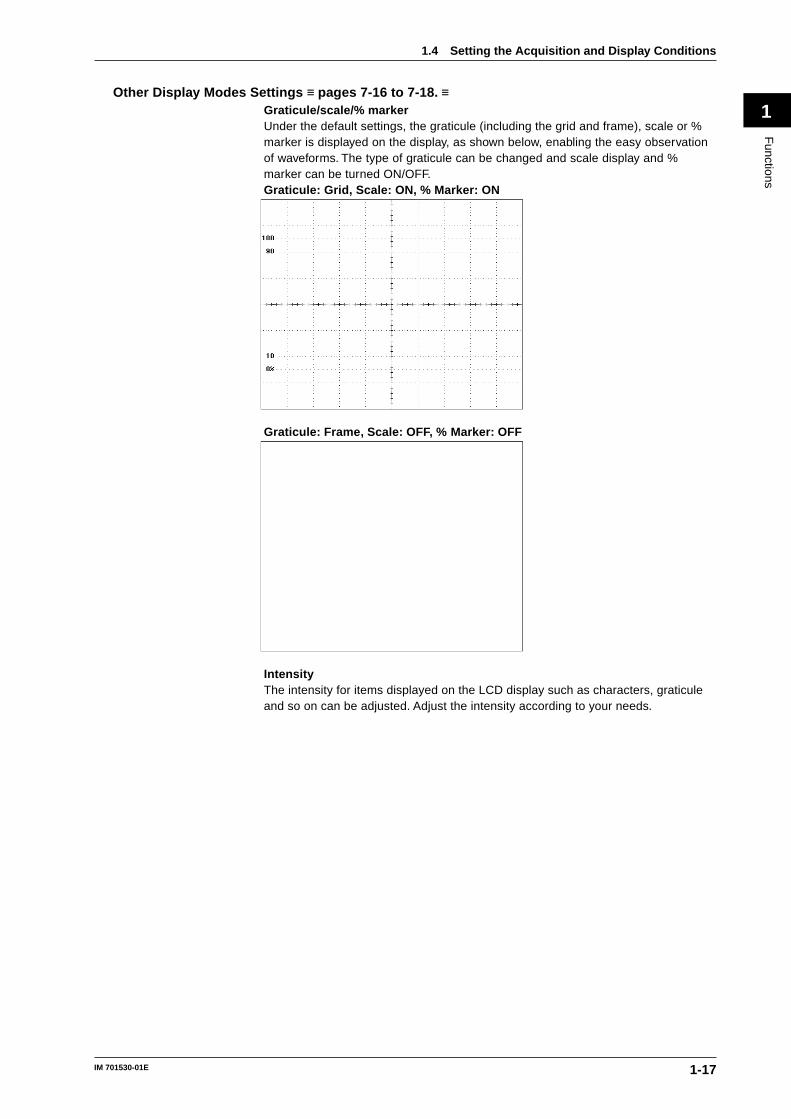
Graticule/scale/% markerUnder the default settings, the graticule (including the grid and frame), scale or %marker is displayed on the display, as shown below, enabling the easy observationof waveforms. The type of graticule can be changed and scale display and %marker can be turned ON/OFF.Graticule: Grid, Scale: ON, % Marker: ON
Graticule: Frame, Scale: OFF, % Marker: OFF
IntensityThe intensity for items displayed on the LCD display such as characters, graticuleand so on can be adjusted. Adjust the intensity according to your needs.
1.4 Setting the Acquisition and Display Conditions
1-18 IM 701530-01E
1.5 Analyzing the Waveform
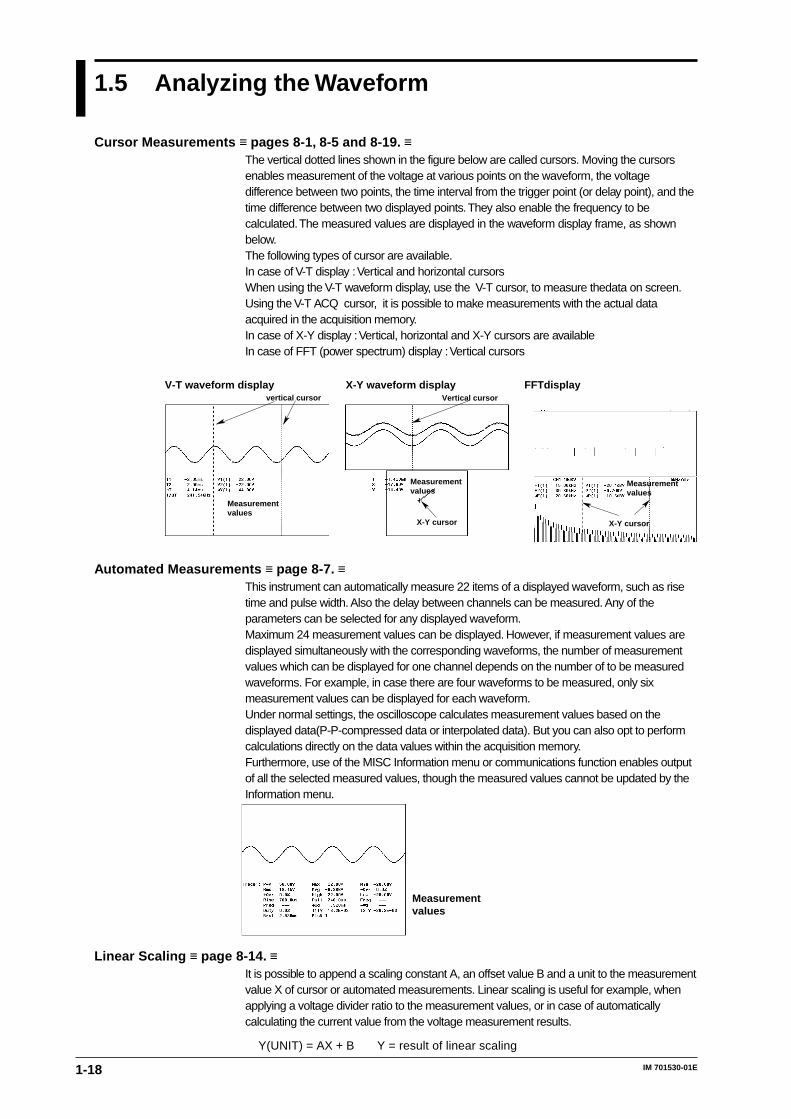
Cursor Measurements ≡ pages 8-1, 8-5 and 8-19. ≡The vertical dotted lines shown in the figure below are called cursors. Moving the cursorsenables measurement of the voltage at various points on the waveform, the voltagedifference between two points, the time interval from the trigger point (or delay point), and thetime difference between two displayed points. They also enable the frequency to becalculated. The measured values are displayed in the waveform display frame, as shownbelow.The following types of cursor are available.In case of V-T display : Vertical and horizontal cursorsWhen using the V-T waveform display, use the V-T cursor, to measure thedata on screen.Using the V-T ACQ cursor, it is possible to make measurements with the actual dataacquired in the acquisition memory.In case of X-Y display : Vertical, horizontal and X-Y cursors are availableIn case of FFT (power spectrum) display : Vertical cursors
vertical cursor
V-T waveform display X-Y waveform displayVertical cursor
X-Y cursor
Measurement values
Measurement values
FFTdisplay
X-Y cursor
Measurement values
Automated Measurements ≡ page 8-7. ≡This instrument can automatically measure 22 items of a displayed waveform, such as risetime and pulse width. Also the delay between channels can be measured. Any of theparameters can be selected for any displayed waveform.Maximum 24 measurement values can be displayed. However, if measurement values aredisplayed simultaneously with the corresponding waveforms, the number of measurementvalues which can be displayed for one channel depends on the number of to be measuredwaveforms. For example, in case there are four waveforms to be measured, only sixmeasurement values can be displayed for each waveform.Under normal settings, the oscilloscope calculates measurement values based on thedisplayed data(P-P-compressed data or interpolated data). But you can also opt to performcalculations directly on the data values within the acquisition memory.Furthermore, use of the MISC Information menu or communications function enables outputof all the selected measured values, though the measured values cannot be updated by theInformation menu.
Measurementvalues
Linear Scaling ≡ page 8-14. ≡It is possible to append a scaling constant A, an offset value B and a unit to the measurementvalue X of cursor or automated measurements. Linear scaling is useful for example, whenapplying a voltage divider ratio to the measurement values, or in case of automaticallycalculating the current value from the voltage measurement results.
Y(UNIT) = AX + B Y = result of linear scaling
1-19IM 701530-01E
Functions
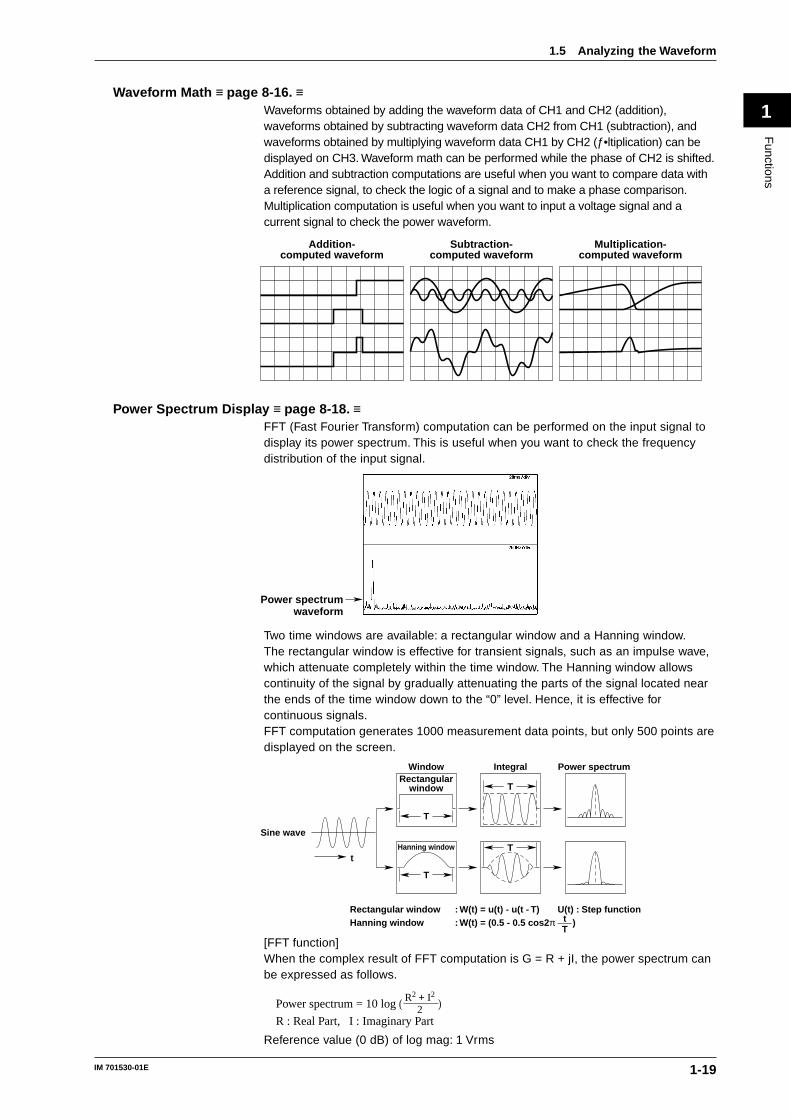
1Waveform Math ≡ page 8-16. ≡
Waveforms obtained by adding the waveform data of CH1 and CH2 (addition),waveforms obtained by subtracting waveform data CH2 from CH1 (subtraction), andwaveforms obtained by multiplying waveform data CH1 by CH2 (ĥltiplication) can bedisplayed on CH3. Waveform math can be performed while the phase of CH2 is shifted.Addition and subtraction computations are useful when you want to compare data witha reference signal, to check the logic of a signal and to make a phase comparison.Multiplication computation is useful when you want to input a voltage signal and acurrent signal to check the power waveform.
Subtraction-computed waveform
Addition-computed waveform
Multiplication-computed waveform
Power Spectrum Display ≡ page 8-18. ≡FFT (Fast Fourier Transform) computation can be performed on the input signal todisplay its power spectrum. This is useful when you want to check the frequencydistribution of the input signal.
Power spectrumwaveform
Two time windows are available: a rectangular window and a Hanning window.The rectangular window is effective for transient signals, such as an impulse wave,which attenuate completely within the time window. The Hanning window allowscontinuity of the signal by gradually attenuating the parts of the signal located nearthe ends of the time window down to the “0” level. Hence, it is effective forcontinuous signals.FFT computation generates 1000 measurement data points, but only 500 points aredisplayed on the screen.
T
T
T
Tt
Sine wave
Window Integral Power spectrumRectangular
window
Hanning window
Rectangular windowHanning window
: W(t) = u(t) - u(t - T) U(t) : Step function: W(t) = (0.5 - 0.5 cos2π )t
T
[FFT function]When the complex result of FFT computation is G = R + jI, the power spectrum canbe expressed as follows.
Power spectrum = 10 log ( )
R : Real Part, I : Imaginary Part
R2 + I2
2
Reference value (0 dB) of log mag: 1 Vrms
1.5 Analyzing the Waveform
1-20 IM 701530-01E
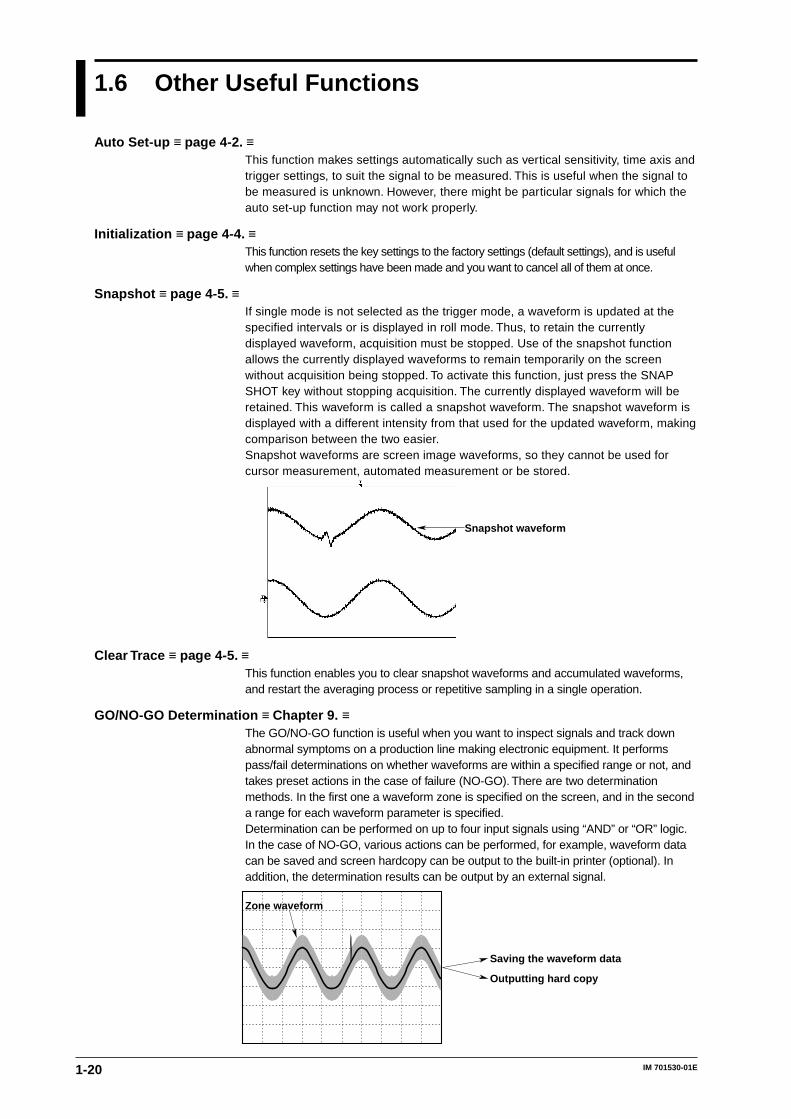
1.6 Other Useful Functions
Auto Set-up ≡ page 4-2. ≡This function makes settings automatically such as vertical sensitivity, time axis andtrigger settings, to suit the signal to be measured. This is useful when the signal tobe measured is unknown. However, there might be particular signals for which theauto set-up function may not work properly.
Initialization ≡ page 4-4. ≡This function resets the key settings to the factory settings (default settings), and is usefulwhen complex settings have been made and you want to cancel all of them at once.
Snapshot ≡ page 4-5. ≡If single mode is not selected as the trigger mode, a waveform is updated at thespecified intervals or is displayed in roll mode. Thus, to retain the currentlydisplayed waveform, acquisition must be stopped. Use of the snapshot functionallows the currently displayed waveforms to remain temporarily on the screenwithout acquisition being stopped. To activate this function, just press the SNAPSHOT key without stopping acquisition. The currently displayed waveform will beretained. This waveform is called a snapshot waveform. The snapshot waveform isdisplayed with a different intensity from that used for the updated waveform, makingcomparison between the two easier.Snapshot waveforms are screen image waveforms, so they cannot be used forcursor measurement, automated measurement or be stored.
Snapshot waveform
Clear Trace ≡ page 4-5. ≡This function enables you to clear snapshot waveforms and accumulated waveforms,and restart the averaging process or repetitive sampling in a single operation.
GO/NO-GO Determination ≡ Chapter 9. ≡The GO/NO-GO function is useful when you want to inspect signals and track downabnormal symptoms on a production line making electronic equipment. It performspass/fail determinations on whether waveforms are within a specified range or not, andtakes preset actions in the case of failure (NO-GO). There are two determinationmethods. In the first one a waveform zone is specified on the screen, and in the seconda range for each waveform parameter is specified.Determination can be performed on up to four input signals using “AND” or “OR” logic.In the case of NO-GO, various actions can be performed, for example, waveform datacan be saved and screen hardcopy can be output to the built-in printer (optional). Inaddition, the determination results can be output by an external signal.
Saving the waveform data
Outputting hard copy
Zone waveform
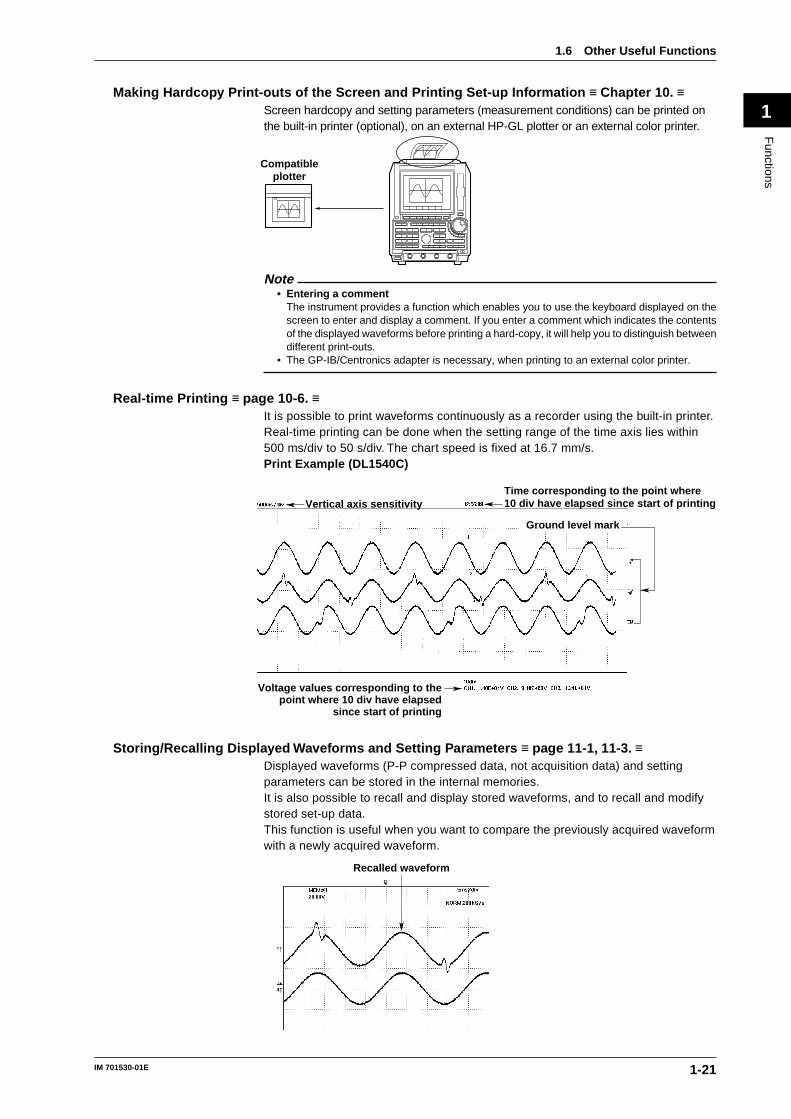
1-21IM 701530-01E
Functions
1Making Hardcopy Print-outs of the Screen and Printing Set-up Information ≡ Chapter 10. ≡
Screen hardcopy and setting parameters (measurement conditions) can be printed onthe built-in printer (optional), on an external HP-GL plotter or an external color printer.
Compatibleplotter
Note• Entering a comment
The instrument provides a function which enables you to use the keyboard displayed on thescreen to enter and display a comment. If you enter a comment which indicates the contentsof the displayed waveforms before printing a hard-copy, it will help you to distinguish betweendifferent print-outs.
• The GP-IB/Centronics adapter is necessary, when printing to an external color printer.
Real-time Printing ≡ page 10-6. ≡It is possible to print waveforms continuously as a recorder using the built-in printer.Real-time printing can be done when the setting range of the time axis lies within500 ms/div to 50 s/div. The chart speed is fixed at 16.7 mm/s.Print Example (DL1540C)
Vertical axis sensitivityTime corresponding to the point where10 div have elapsed since start of printing
Voltage values corresponding to the point where 10 div have elapsed
since start of printing
Ground level mark
Storing/Recalling Displayed Waveforms and Setting Parameters ≡ page 11-1, 11-3. ≡Displayed waveforms (P-P compressed data, not acquisition data) and settingparameters can be stored in the internal memories.It is also possible to recall and display stored waveforms, and to recall and modifystored set-up data.This function is useful when you want to compare the previously acquired waveformwith a newly acquired waveform.
Recalled waveform
1.6 Other Useful Functions
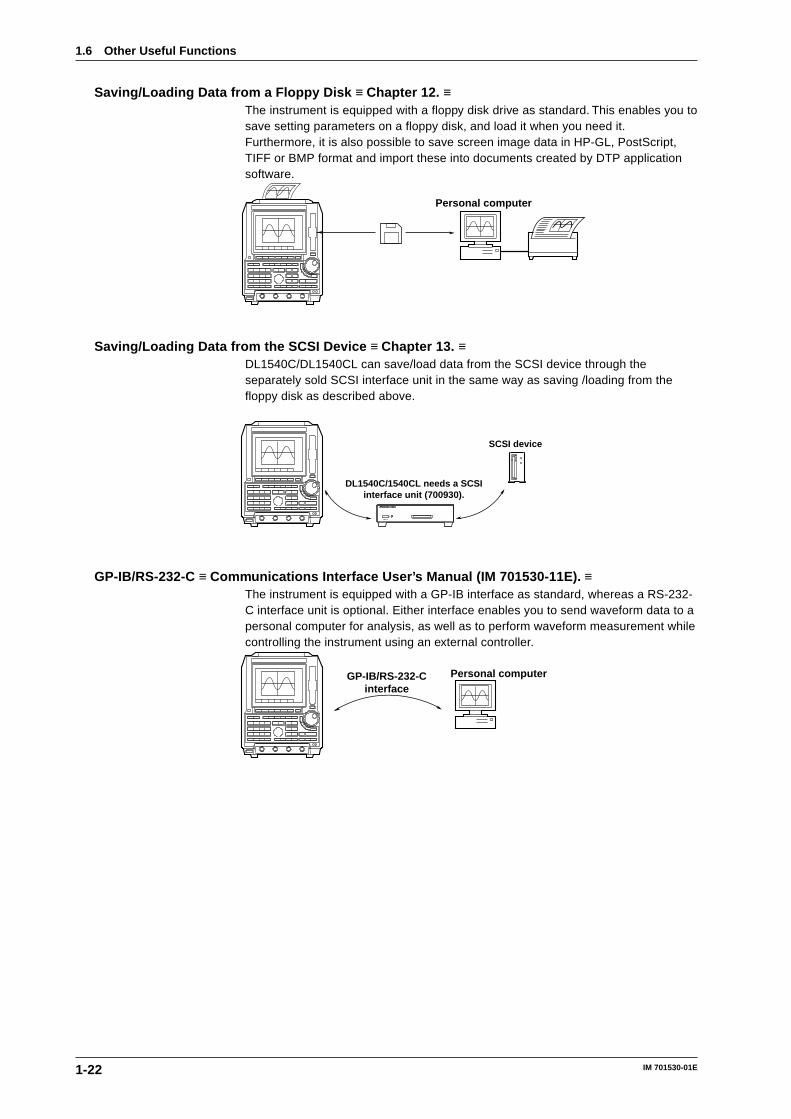
1-22 IM 701530-01E
1.6 Other Useful Functions
Saving/Loading Data from a Floppy Disk ≡ Chapter 12. ≡The instrument is equipped with a floppy disk drive as standard. This enables you tosave setting parameters on a floppy disk, and load it when you need it.Furthermore, it is also possible to save screen image data in HP-GL, PostScript,TIFF or BMP format and import these into documents created by DTP applicationsoftware.
Personal computer
Saving/Loading Data from the SCSI Device ≡ Chapter 13. ≡DL1540C/DL1540CL can save/load data from the SCSI device through theseparately sold SCSI interface unit in the same way as saving /loading from thefloppy disk as described above.
DL1540C/1540CL needs a SCSIinterface unit (700930).
SCSI device
GP-IB/RS-232-C ≡ Communications Interface User’s Manual (IM 701530-11E). ≡The instrument is equipped with a GP-IB interface as standard, whereas a RS-232-C interface unit is optional. Either interface enables you to send waveform data to apersonal computer for analysis, as well as to perform waveform measurement whilecontrolling the instrument using an external controller.
Personal computerGP-IB/RS-232-Cinterface
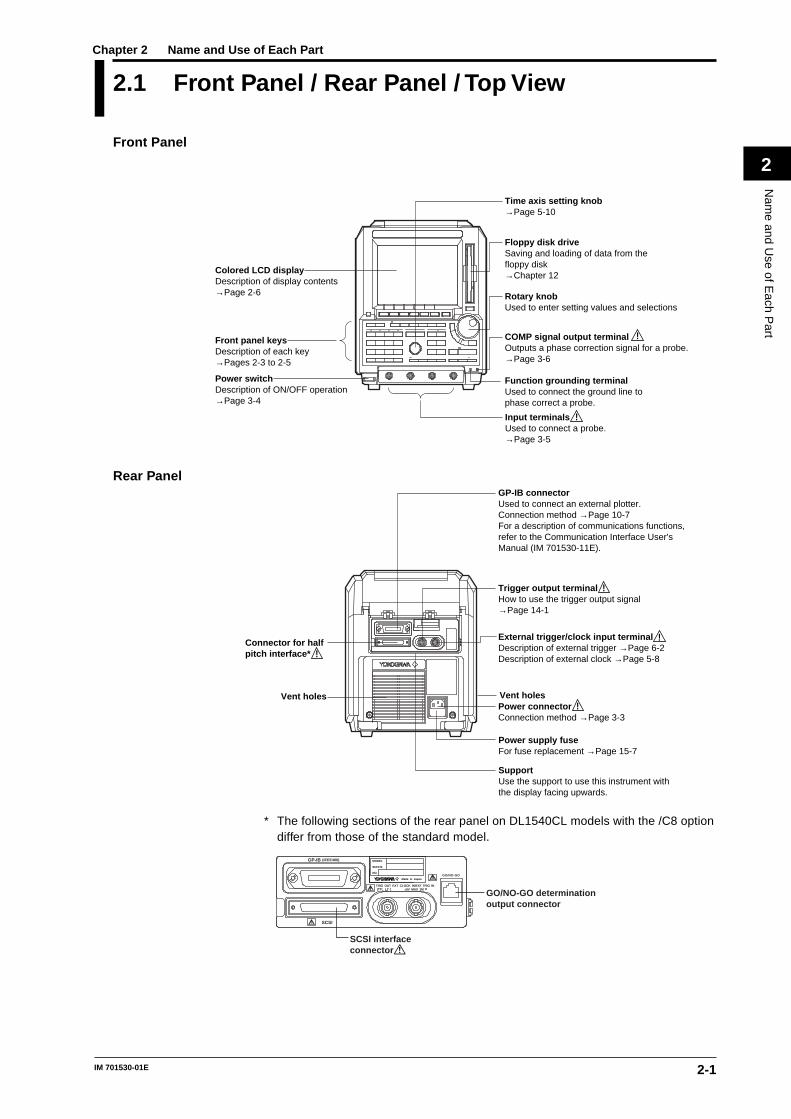
2-1IM 701530-01E
Nam
e and Use of E
ach Part
2
2.1 Front Panel / Rear Panel / Top View
Front Panel
Time axis setting knob→Page 5-10
Colored LCD displayDescription of display contents→Page 2-6
Floppy disk driveSaving and loading of data from the floppy disk→Chapter 12
Rotary knobUsed to enter setting values and selections
COMP signal output terminalOutputs a phase correction signal for a probe.→Page 3-6
Function grounding terminalUsed to connect the ground line to phase correct a probe.
Power switchDescription of ON/OFF operation→Page 3-4
Front panel keysDescription of each key→Pages 2-3 to 2-5
Input terminalsUsed to connect a probe.→Page 3-5
!
!
Rear PanelGP-IB connectorUsed to connect an external plotter.Connection method →Page 10-7For a description of communications functions,refer to the Communication Interface User's Manual (IM 701530-11E).
Trigger output terminalHow to use the trigger output signal→Page 14-1
External trigger/clock input terminalDescription of external trigger →Page 6-2Description of external clock →Page 5-8
Power connectorConnection method →Page 3-3
Power supply fuseFor fuse replacement →Page 15-7
SupportUse the support to use this instrument withthe display facing upwards.
Vent holesVent holes
Connector for half pitch interface*
!
!
!
!
* The following sections of the rear panel on DL1540CL models with the /C8 optiondiffer from those of the standard model.
GP-IB (IEEE488)
TRIG OUT EXT CLOCK IN/EXT TRIG IN
GO/NO-GO
(TTL ) ±6V MAX 1M
SCSI
MODEL
SUFFIX
NO.
Made in Japan
GO/NO-GO determinationoutput connector
SCSI interfaceconnector
Chapter 2 Name and Use of Each Part
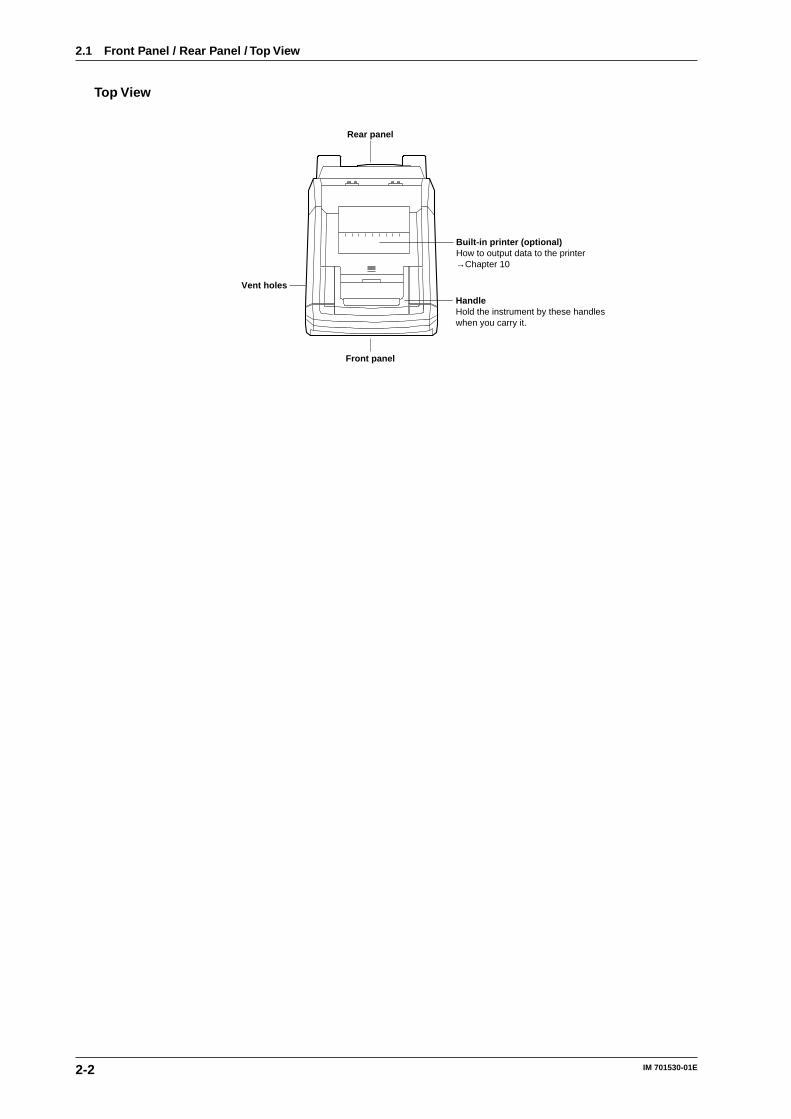
2-2 IM 701530-01E
Top View
Rear panel
HandleHold the instrument by these handles when you carry it.
Built-in printer (optional)How to output data to the printer→Chapter 10
Front panel
Vent holes
2.1 Front Panel / Rear Panel / Top View
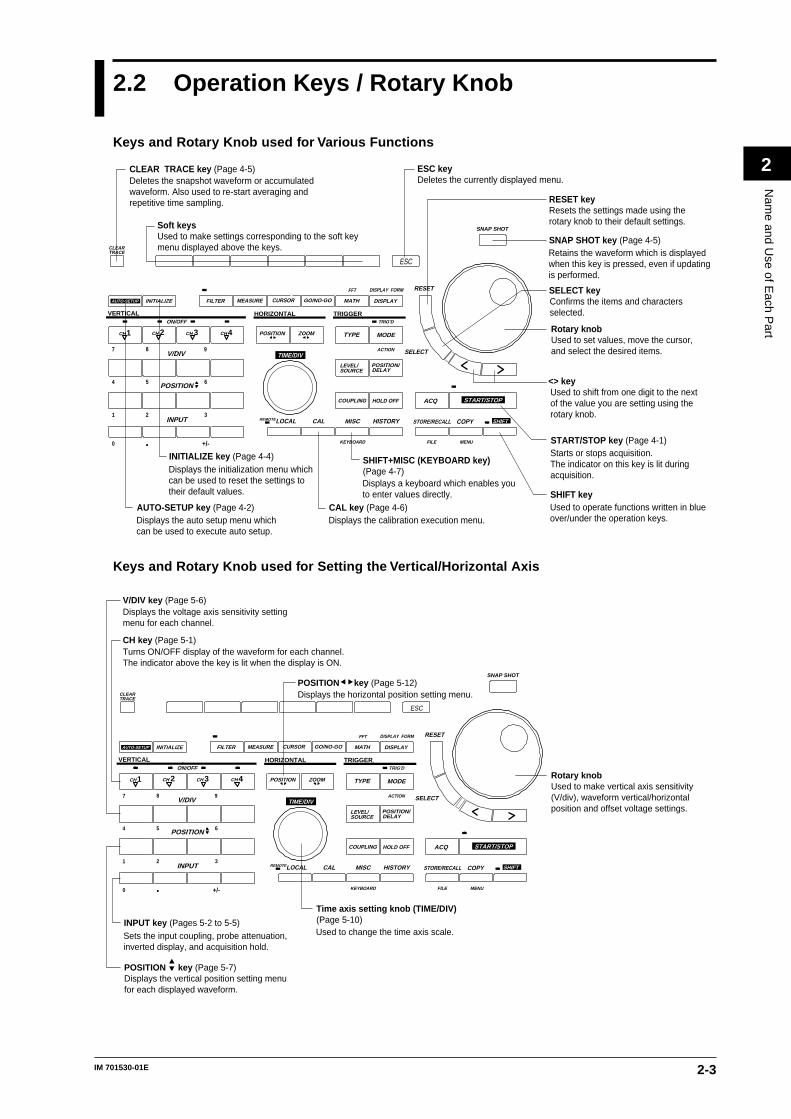
2-3IM 701530-01E
Nam
e and Use of E
ach Part
2
2.2 Operation Keys / Rotary Knob
Keys and Rotary Knob used for Various Functions
VERTICAL HORIZONTAL
V/DIV
POSITION
INPUT
TRIG'D
REMOTE STORE/RECALLCAL
DISPLAYGO/NO-GO
SOURCE
COUPLING
LEVEL/
CH1 CH 2 CH 3 CH 4
COPYLOCAL
CURSOR FILTER
MISC
MEASURE MATH
HOLD OFF
POSITION/
INITIALIZE
ZOOM MODEPOSITION TYPE
SNAP SHOT
HISTORY
CLEARTRACE
DELAY
FILE
7 8 9
4 5 6
1 32
0 +/-
FFT
KEYBOARD MENU
START/STOP
ESC
SHIFT
TIME/DIV
DISPLAY FORM
ON/OFF
RESET
SELECTACTION
ACQ
AUTO-SETUP
TRIGGER
Soft keysUsed to make settings corresponding to the soft keymenu displayed above the keys.
CLEAR TRACE key (Page 4-5)Deletes the snapshot waveform or accumulatedwaveform. Also used to re-start averaging and repetitive time sampling.
Displays the initialization menu whichcan be used to reset the settings to their default values.
AUTO-SETUP key (Page 4-2)Displays the auto setup menu whichcan be used to execute auto setup.
INITIALIZE key (Page 4-4)
CAL key (Page 4-6)Displays the calibration execution menu.
SHIFT+MISC (KEYBOARD key)(Page 4-7)Displays a keyboard which enables youto enter values directly.
ESC keyDeletes the currently displayed menu.
RESET keyResets the settings made using the rotary knob to their default settings.
SELECT keyConfirms the items and characters selected.
SNAP SHOT key (Page 4-5)Retains the waveform which is displayed when this key is pressed, even if updating is performed.
Rotary knobUsed to set values, move the cursor, and select the desired items.
<> keyUsed to shift from one digit to the next of the value you are setting using the rotary knob.
SHIFT keyUsed to operate functions written in blueover/under the operation keys.
START/STOP key (Page 4-1)Starts or stops acquisition.The indicator on this key is lit duringacquisition.
Keys and Rotary Knob used for Setting the Vertical/Horizontal Axis
VERTICAL HORIZONTAL
V/DIV
POSITION
INPUT
TRIG'D
REMOTE STORE/RECALLCAL
DISPLAYGO/NO-GO
SOURCE
COUPLING
LEVEL/
CH1 CH 2 CH 3 CH 4
COPYLOCAL
CURSOR FILTER
MISC
MEASURE MATH
HOLD OFF
POSITION/
INITIALIZE
ZOOM MODEPOSITION TYPE
SNAP SHOT
HISTORY
CLEARTRACE
DELAY
FILE
7 8 9
4 5 6
1 32
0 +/-
FFT
KEYBOARD MENU
START/STOP
ESC
SHIFT
TIME/DIV
DISPLAY FORM
ON/OFF
RESET
SELECTACTION
ACQ
AUTO-SETUP
TRIGGER
CH key (Page 5-1)Turns ON/OFF display of the waveform for each channel. The indicator above the key is lit when the display is ON.
Sets the input coupling, probe attenuation,inverted display, and acquisition hold.
INPUT key (Pages 5-2 to 5-5)
Time axis setting knob (TIME/DIV)(Page 5-10)Used to change the time axis scale.
POSITION key (Page 5-7)Displays the vertical position setting menufor each displayed waveform.
Rotary knobUsed to make vertical axis sensitivity(V/div), waveform vertical/horizontalposition and offset voltage settings.
POSITION key (Page 5-12)Displays the horizontal position setting menu.
V/DIV key (Page 5-6)Displays the voltage axis sensitivity settingmenu for each channel.
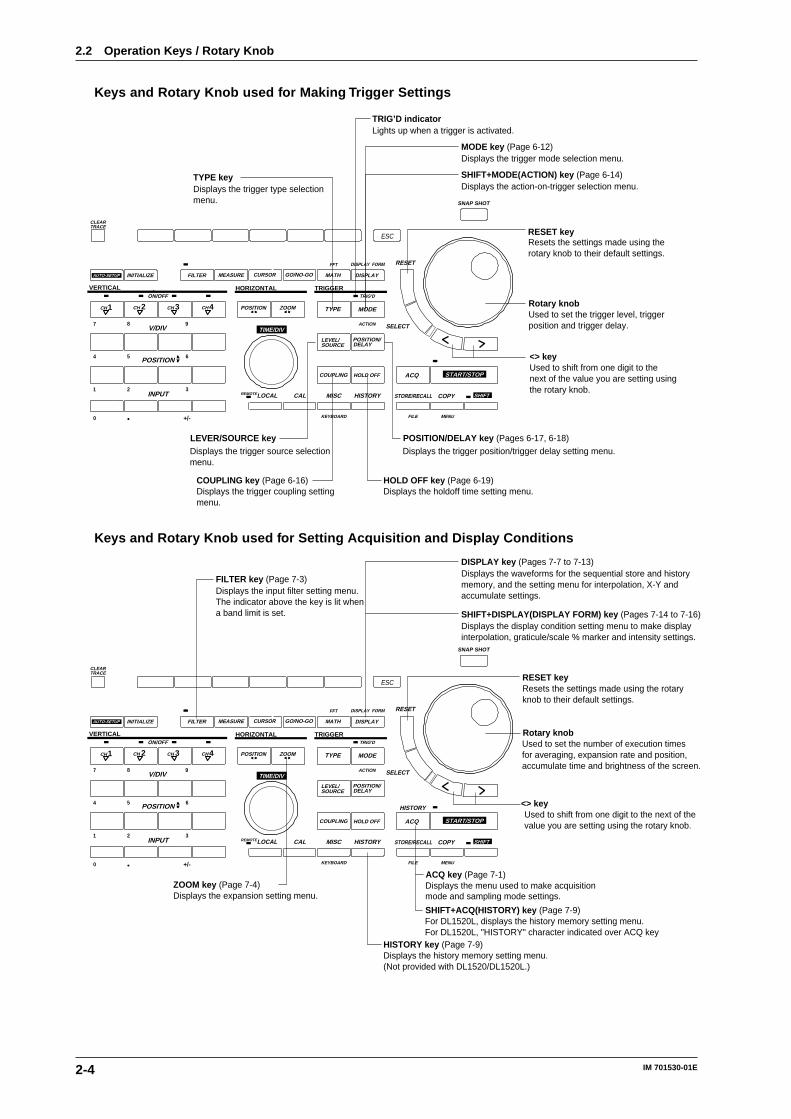
2-4 IM 701530-01E
Keys and Rotary Knob used for Making Trigger Settings
VERTICAL HORIZONTAL
V/DIV
POSITION
INPUT
TRIG'D
REMOTE STORE/RECALLCAL
DISPLAYGO/NO-GO
SOURCE
COUPLING
LEVEL/
CH1 CH 2 CH 3 CH 4
COPYLOCAL
CURSOR FILTER
MISC
MEASURE MATH
HOLD OFF
POSITION/
INITIALIZE
ZOOM MODEPOSITION TYPE
SNAP SHOT
HISTORY
CLEARTRACE
DELAY
FILE
7 8 9
4 5 6
1 32
0 +/-
FFT
KEYBOARD MENU
START/STOP
ESC
SHIFT
TIME/DIV
DISPLAY FORM
ON/OFF
RESET
SELECTACTION
ACQ
AUTO-SETUP
TRIGGER
TYPE keyDisplays the trigger type selectionmenu.
Displays the trigger source selectionmenu.
LEVER/SOURCE key
COUPLING key (Page 6-16)Displays the trigger coupling setting menu.
Rotary knobUsed to set the trigger level, triggerposition and trigger delay.
Resets the settings made using the rotary knob to their default settings.
TRIG’D indicatorLights up when a trigger is activated.
Displays the trigger position/trigger delay setting menu.POSITION/DELAY key (Pages 6-17, 6-18)
HOLD OFF key (Page 6-19)Displays the holdoff time setting menu.
MODE key (Page 6-12)Displays the trigger mode selection menu.
SHIFT+MODE(ACTION) key (Page 6-14)Displays the action-on-trigger selection menu.
RESET key
<> keyUsed to shift from one digit to the next of the value you are setting usingthe rotary knob.
Keys and Rotary Knob used for Setting Acquisition and Display Conditions
VERTICAL HORIZONTAL
V/DIV
POSITION
INPUT
TRIG'D
REMOTE STORE/RECALLCAL
DISPLAYGO/NO-GO
SOURCE
COUPLING
LEVEL/
CH1 CH 2 CH 3 CH 4
COPYLOCAL
CURSOR FILTER
MISC
MEASURE MATH
HOLD OFF
POSITION/
INITIALIZE
ZOOM MODEPOSITION TYPE
SNAP SHOT
HISTORY
CLEARTRACE
DELAY
FILE
7 8 9
4 5 6
1 32
0 +/-
FFT
KEYBOARD MENU
START/STOP
ESC
SHIFT
TIME/DIV
DISPLAY FORM
ON/OFF
RESET
SELECTACTION
ACQ
AUTO-SETUP
TRIGGER
FILTER key (Page 7-3)Displays the input filter setting menu.The indicator above the key is lit when a band limit is set.
ZOOM key (Page 7-4)Displays the expansion setting menu.
Rotary knobUsed to set the number of execution times for averaging, expansion rate and position, accumulate time and brightness of the screen.
Resets the settings made using the rotary knob to their default settings.
Displays the menu used to make acquisition mode and sampling mode settings.
ACQ key (Page 7-1)
HISTORY key (Page 7-9)Displays the history memory setting menu. (Not provided with DL1520/DL1520L.)
DISPLAY key (Pages 7-7 to 7-13)Displays the waveforms for the sequential store and historymemory, and the setting menu for interpolation, X-Y and accumulate settings.
SHIFT+DISPLAY(DISPLAY FORM) key (Pages 7-14 to 7-16)Displays the display condition setting menu to make display interpolation, graticule/scale % marker and intensity settings.
RESET key
<> keyUsed to shift from one digit to the next of the value you are setting using the rotary knob.
For DL1520L, displays the history memory setting menu. For DL1520L, "HISTORY" character indicated over ACQ key
SHIFT+ACQ(HISTORY) key (Page 7-9)
HISTORY
2.2 Operation Keys / Rotary Knob
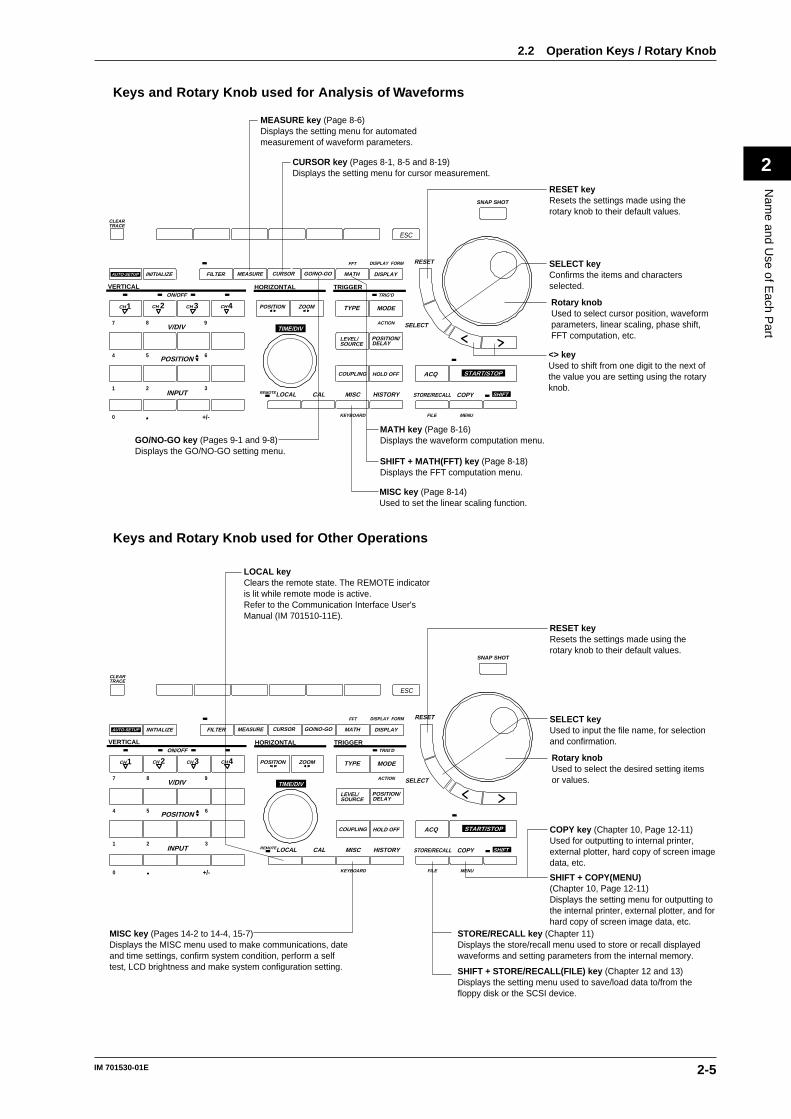
2-5IM 701530-01E
Nam
e and Use of E
ach Part
2
Keys and Rotary Knob used for Analysis of Waveforms
VERTICAL HORIZONTAL
V/DIV
POSITION
INPUT
TRIG'D
REMOTE STORE/RECALLCAL
DISPLAYGO/NO-GO
SOURCE
COUPLING
LEVEL/
CH1 CH 2 CH 3 CH 4
COPYLOCAL
CURSOR FILTER
MISC
MEASURE MATH
HOLD OFF
POSITION/
INITIALIZE
ZOOM MODEPOSITION TYPE
SNAP SHOT
HISTORY
CLEARTRACE
DELAY
FILE
7 8 9
4 5 6
1 32
0 +/-
FFT
KEYBOARD MENU
START/STOP
ESC
SHIFT
TIME/DIV
DISPLAY FORM
ON/OFF
RESET
SELECTACTION
ACQ
AUTO-SETUP
TRIGGER
RESET key Resets the settings made using the rotary knob to their default values.
SELECT keyConfirms the items and characters selected.
Rotary knobUsed to select cursor position, waveform parameters, linear scaling, phase shift, FFT computation, etc.
<> keyUsed to shift from one digit to the next of the value you are setting using the rotary knob.
MEASURE key (Page 8-6)Displays the setting menu for automated measurement of waveform parameters.
CURSOR key (Pages 8-1, 8-5 and 8-19)Displays the setting menu for cursor measurement.
MATH key (Page 8-16)Displays the waveform computation menu.
SHIFT + MATH(FFT) key (Page 8-18)Displays the FFT computation menu.
GO/NO-GO key (Pages 9-1 and 9-8)Displays the GO/NO-GO setting menu.
MISC key (Page 8-14)Used to set the linear scaling function.
Keys and Rotary Knob used for Other Operations
VERTICAL HORIZONTAL
V/DIV
POSITION
INPUT
TRIG'D
REMOTE STORE/RECALLCAL
DISPLAYGO/NO-GO
SOURCE
COUPLING
LEVEL/
CH1 CH 2 CH 3 CH 4
COPYLOCAL
CURSOR FILTER
MISC
MEASURE MATH
HOLD OFF
POSITION/
INITIALIZE
ZOOM MODEPOSITION TYPE
SNAP SHOT
HISTORY
CLEARTRACE
DELAY
FILE
7 8 9
4 5 6
1 32
0 +/-
FFT
KEYBOARD MENU
START/STOP
ESC
SHIFT
TIME/DIV
DISPLAY FORM
ON/OFF
RESET
SELECTACTION
ACQ
AUTO-SETUP
TRIGGER
RESET keyResets the settings made using the rotary knob to their default values.
SELECT keyUsed to input the file name, for selectionand confirmation.
Rotary knobUsed to select the desired setting items or values.
COPY key (Chapter 10, Page 12-11)Used for outputting to internal printer, external plotter, hard copy of screen imagedata, etc.
SHIFT + COPY(MENU)(Chapter 10, Page 12-11)Displays the setting menu for outputting to the internal printer, external plotter, and for hard copy of screen image data, etc.
STORE/RECALL key (Chapter 11)Displays the store/recall menu used to store or recall displayed waveforms and setting parameters from the internal memory.
SHIFT + STORE/RECALL(FILE) key (Chapter 12 and 13)Displays the setting menu used to save/load data to/from the floppy disk or the SCSI device.
MISC key (Pages 14-2 to 14-4, 15-7)Displays the MISC menu used to make communications, dateand time settings, confirm system condition, perform a selftest, LCD brightness and make system configuration setting.
LOCAL keyClears the remote state. The REMOTE indicatoris lit while remote mode is active.Refer to the Communication Interface User's Manual (IM 701510-11E).
2.2 Operation Keys / Rotary Knob
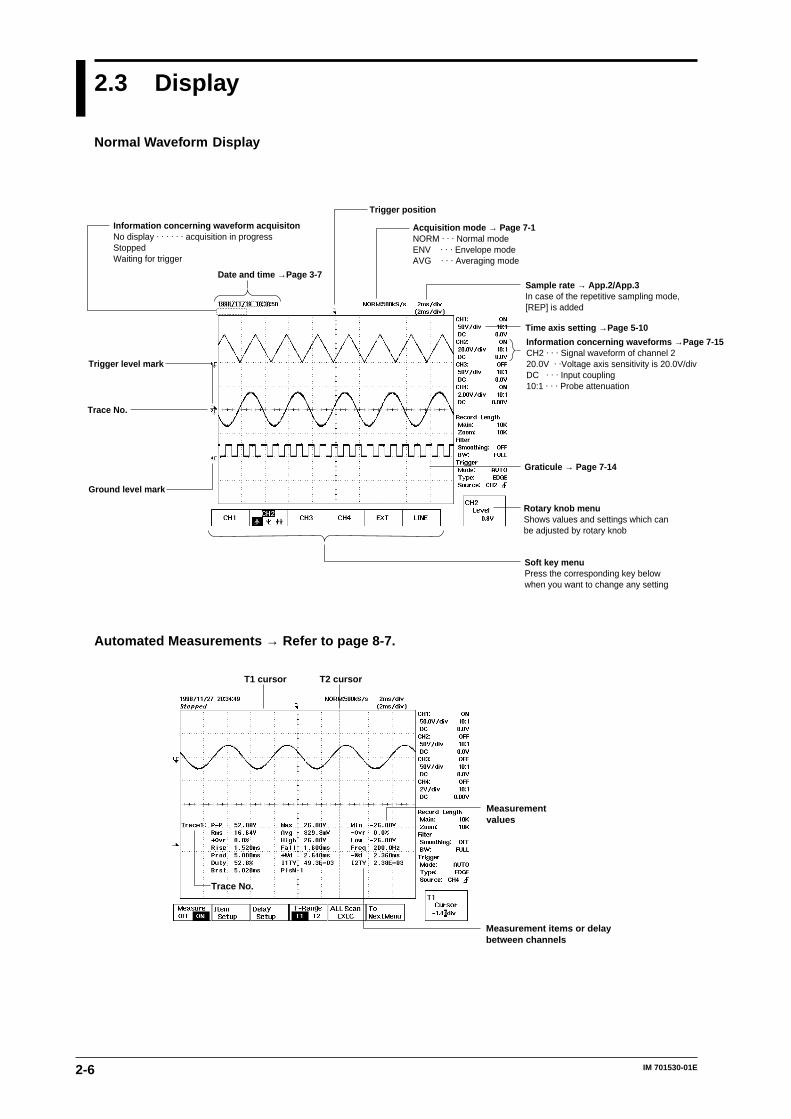
2-6 IM 701530-01E
2.3 Display
Normal Waveform Display
Information concerning waveforms →Page 7-15CH2 . . . Signal waveform of channel 220.0V . .Voltage axis sensitivity is 20.0V/divDC . . . Input coupling10:1 . . . Probe attenuation
Trigger position
Date and time →Page 3-7
Time axis setting →Page 5-10
Sample rate → App.2/App.3In case of the repetitive sampling mode,[REP] is added
Acquisition mode → Page 7-1NORM . . . Normal modeENV . . . Envelope modeAVG . . . Averaging mode
Graticule → Page 7-14
Rotary knob menuShows values and settings which can be adjusted by rotary knob
Soft key menuPress the corresponding key belowwhen you want to change any setting
Trace No.
Ground level mark
Trigger level mark
Information concerning waveform acquisitonNo display . . . . . . acquisition in progressStoppedWaiting for trigger
Automated Measurements → Refer to page 8-7.
Measurementvalues
Measurement items or delay between channels
T2 cursorT1 cursor
Trace No.
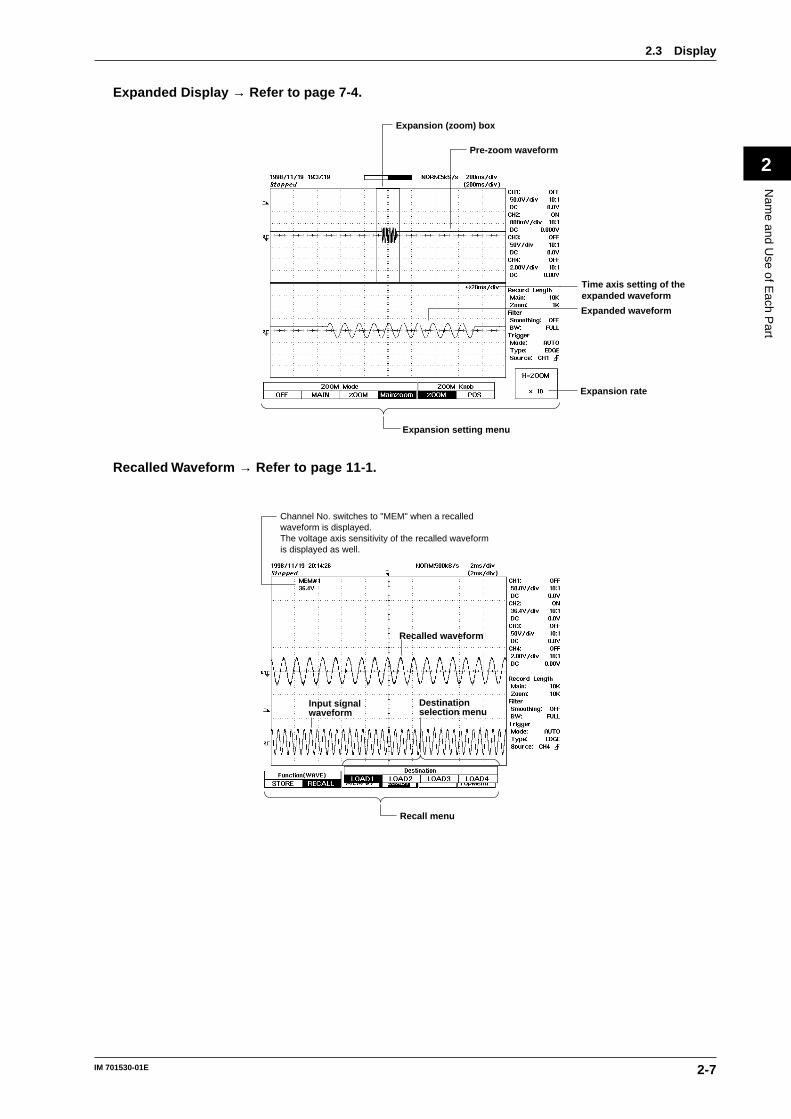
2-7IM 701530-01E
Nam
e and Use of E
ach Part
2
Expanded Display → Refer to page 7-4.
Expansion setting menu
Expansion rate
Expanded waveform
Time axis setting of the expanded waveform
Expansion (zoom) box
Pre-zoom waveform
Recalled Waveform → Refer to page 11-1.
Recall menu
Destination selection menu
Input signal waveform
Recalled waveform
Channel No. switches to "MEM" when a recalledwaveform is displayed.The voltage axis sensitivity of the recalled waveformis displayed as well.
2.3 Display
3-1IM 701530-01E
Before S
tarting Observation and M
easurement of W
aveforms
3
3.1 Precautions During Use
Safety PrecautionsWhen using this instrument, thoroughly read the “Safety Precautions” given on page5 and 6. In addition, pay attention to the following points:
Do not remove the cover from the instrumentSome parts of the instrument use high voltages, which are extremely dangerous.When the instrument needs internal inspection or adjustment, contact your dealer ornearest YOKOGAWA representative as listed on the back cover of this manual.
Unusual occurrencesIf you notice smoke or unusual odors coming from the instrument, turn OFF thepower and unplug the power cord immediately. Contact your dealer or the nearestYOKOGAWA representative as listed on the back cover of this manual.
Power cordNothing should be placed on the power cord; also, it should be kept away from anyheat sources. When unplugging the power cord from the AC outlet, never pull thecord itself. Always hold the plug and pull it. If the power cord is damaged, contactyour dealer. Refer to page 3 for the part number to quote when placing an order.
General Handling PrecautionsNever place anything on top of the instrumentNever place another instrument or any objects containing water on top of theinstrument, otherwise a breakdown may occur.
Do not subject the input terminals or connecting cables to shockShock to the input terminals or connecting cables may turn into electrical noise andenter the instrument via the signal lines.
When the instrument is not going to be used for a long periodUnplug the power cord from the AC outlet.
Do not scratch the LCDThe LCD is very susceptible to scratches. Make sure not to scratch the surface withpointed objects. In addition, never apply vibration or shock to the LCD.
When moving the instrumentDisconnect the power cord and connectingcables. Always carry the instrument by thehandles or carry it with both hands as shown onthe right.Note that the chart paper might show somediscoloration due to friction after the instrumentis moved with the roll paper installed. In such acase, we recommend to remove and re-installthe chart paper again. For details on theprocedure, refer to page 10-1.
CleaningFor cleaning the case and the operation panel, unplug the power cord first, thengently wipe with a dry, soft and clean cloth. Do not use chemicals such as benzeneor thinner, since these may cause discoloration or damage.
Chapter 3 Before Starting Observation and Measurement of Waveforms
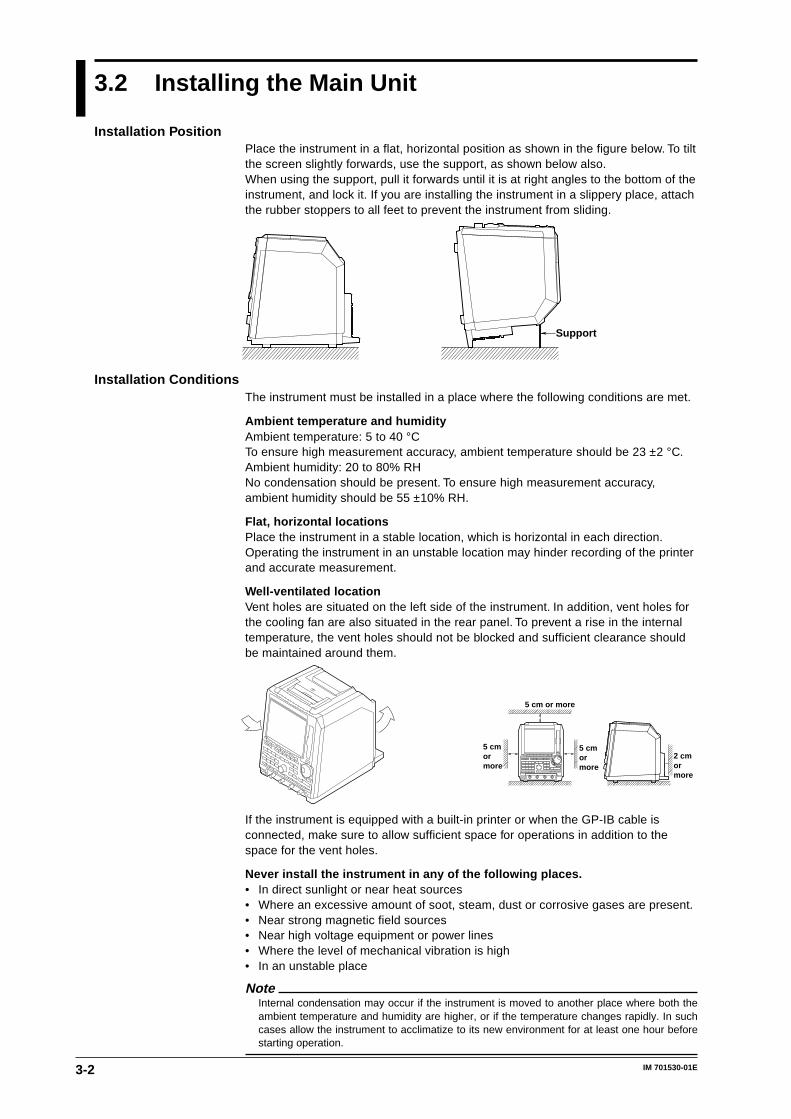
3-2 IM 701530-01E
3.2 Installing the Main Unit
Installation PositionPlace the instrument in a flat, horizontal position as shown in the figure below. To tiltthe screen slightly forwards, use the support, as shown below also.When using the support, pull it forwards until it is at right angles to the bottom of theinstrument, and lock it. If you are installing the instrument in a slippery place, attachthe rubber stoppers to all feet to prevent the instrument from sliding.
Support
Installation ConditionsThe instrument must be installed in a place where the following conditions are met.
Ambient temperature and humidityAmbient temperature: 5 to 40 °CTo ensure high measurement accuracy, ambient temperature should be 23 ±2 °C.Ambient humidity: 20 to 80% RHNo condensation should be present. To ensure high measurement accuracy,ambient humidity should be 55 ±10% RH.
Flat, horizontal locationsPlace the instrument in a stable location, which is horizontal in each direction.Operating the instrument in an unstable location may hinder recording of the printerand accurate measurement.
Well-ventilated locationVent holes are situated on the left side of the instrument. In addition, vent holes forthe cooling fan are also situated in the rear panel. To prevent a rise in the internaltemperature, the vent holes should not be blocked and sufficient clearance shouldbe maintained around them.
5 cmor more
5 cmor more
2 cmor more
5 cm or more
If the instrument is equipped with a built-in printer or when the GP-IB cable isconnected, make sure to allow sufficient space for operations in addition to thespace for the vent holes.
Never install the instrument in any of the following places.• In direct sunlight or near heat sources• Where an excessive amount of soot, steam, dust or corrosive gases are present.• Near strong magnetic field sources• Near high voltage equipment or power lines• Where the level of mechanical vibration is high• In an unstable place
NoteInternal condensation may occur if the instrument is moved to another place where both theambient temperature and humidity are higher, or if the temperature changes rapidly. In suchcases allow the instrument to acclimatize to its new environment for at least one hour beforestarting operation.
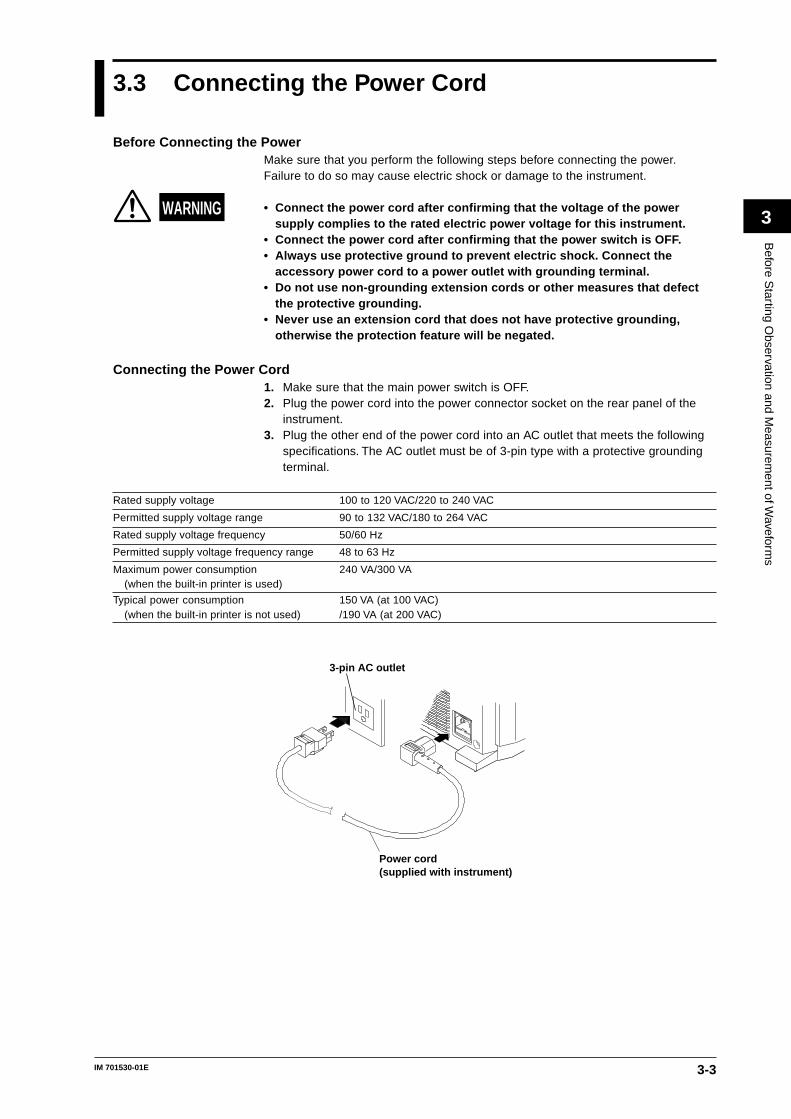
3-3IM 701530-01E
Before S
tarting Observation and M
easurement of W
aveforms
3
3.3 Connecting the Power Cord
Before Connecting the PowerMake sure that you perform the following steps before connecting the power.Failure to do so may cause electric shock or damage to the instrument.
WARNING • Connect the power cord after confirming that the voltage of the powersupply complies to the rated electric power voltage for this instrument.
• Connect the power cord after confirming that the power switch is OFF.• Always use protective ground to prevent electric shock. Connect the
accessory power cord to a power outlet with grounding terminal.• Do not use non-grounding extension cords or other measures that defect
the protective grounding.• Never use an extension cord that does not have protective grounding,
otherwise the protection feature will be negated.
Connecting the Power Cord1. Make sure that the main power switch is OFF.2. Plug the power cord into the power connector socket on the rear panel of the
instrument.3. Plug the other end of the power cord into an AC outlet that meets the following
specifications. The AC outlet must be of 3-pin type with a protective groundingterminal.
Rated supply voltage 100 to 120 VAC/220 to 240 VAC
Permitted supply voltage range 90 to 132 VAC/180 to 264 VAC
Rated supply voltage frequency 50/60 Hz
Permitted supply voltage frequency range 48 to 63 Hz
Maximum power consumption 240 VA/300 VA(when the built-in printer is used)
Typical power consumption 150 VA (at 100 VAC)(when the built-in printer is not used) /190 VA (at 200 VAC)
3-pin AC outlet
Power cord(supplied with instrument)
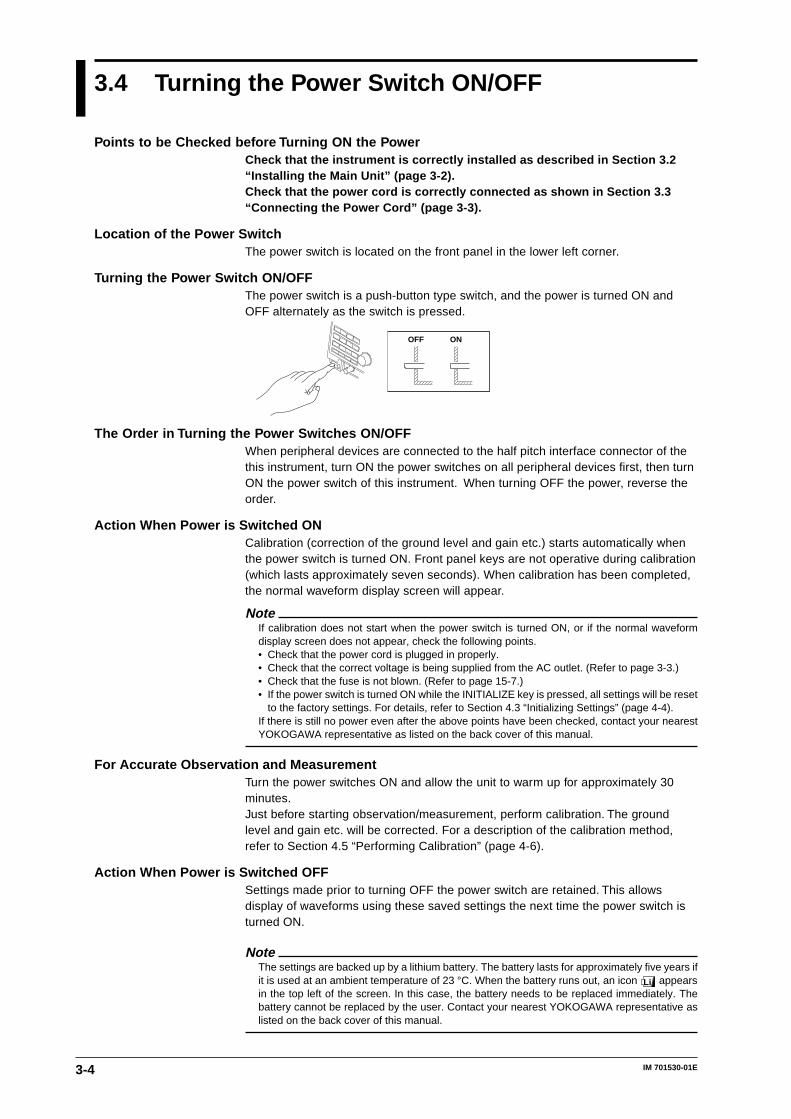
3-4 IM 701530-01E
3.4 Turning the Power Switch ON/OFF
Points to be Checked before Turning ON the PowerCheck that the instrument is correctly installed as described in Section 3.2“Installing the Main Unit” (page 3-2).Check that the power cord is correctly connected as shown in Section 3.3“Connecting the Power Cord” (page 3-3).
Location of the Power SwitchThe power switch is located on the front panel in the lower left corner.
Turning the Power Switch ON/OFFThe power switch is a push-button type switch, and the power is turned ON andOFF alternately as the switch is pressed.
OFF ON
The Order in Turning the Power Switches ON/OFFWhen peripheral devices are connected to the half pitch interface connector of thethis instrument, turn ON the power switches on all peripheral devices first, then turnON the power switch of this instrument. When turning OFF the power, reverse theorder.
Action When Power is Switched ONCalibration (correction of the ground level and gain etc.) starts automatically whenthe power switch is turned ON. Front panel keys are not operative during calibration(which lasts approximately seven seconds). When calibration has been completed,the normal waveform display screen will appear.
NoteIf calibration does not start when the power switch is turned ON, or if the normal waveformdisplay screen does not appear, check the following points.• Check that the power cord is plugged in properly.• Check that the correct voltage is being supplied from the AC outlet. (Refer to page 3-3.)• Check that the fuse is not blown. (Refer to page 15-7.)• If the power switch is turned ON while the INITIALIZE key is pressed, all settings will be reset
to the factory settings. For details, refer to Section 4.3 “Initializing Settings” (page 4-4).If there is still no power even after the above points have been checked, contact your nearestYOKOGAWA representative as listed on the back cover of this manual.
For Accurate Observation and MeasurementTurn the power switches ON and allow the unit to warm up for approximately 30minutes.Just before starting observation/measurement, perform calibration. The groundlevel and gain etc. will be corrected. For a description of the calibration method,refer to Section 4.5 “Performing Calibration” (page 4-6).
Action When Power is Switched OFFSettings made prior to turning OFF the power switch are retained. This allowsdisplay of waveforms using these saved settings the next time the power switch isturned ON.
NoteThe settings are backed up by a lithium battery. The battery lasts for approximately five years ifit is used at an ambient temperature of 23 °C. When the battery runs out, an icon Li appearsin the top left of the screen. In this case, the battery needs to be replaced immediately. Thebattery cannot be replaced by the user. Contact your nearest YOKOGAWA representative aslisted on the back cover of this manual.
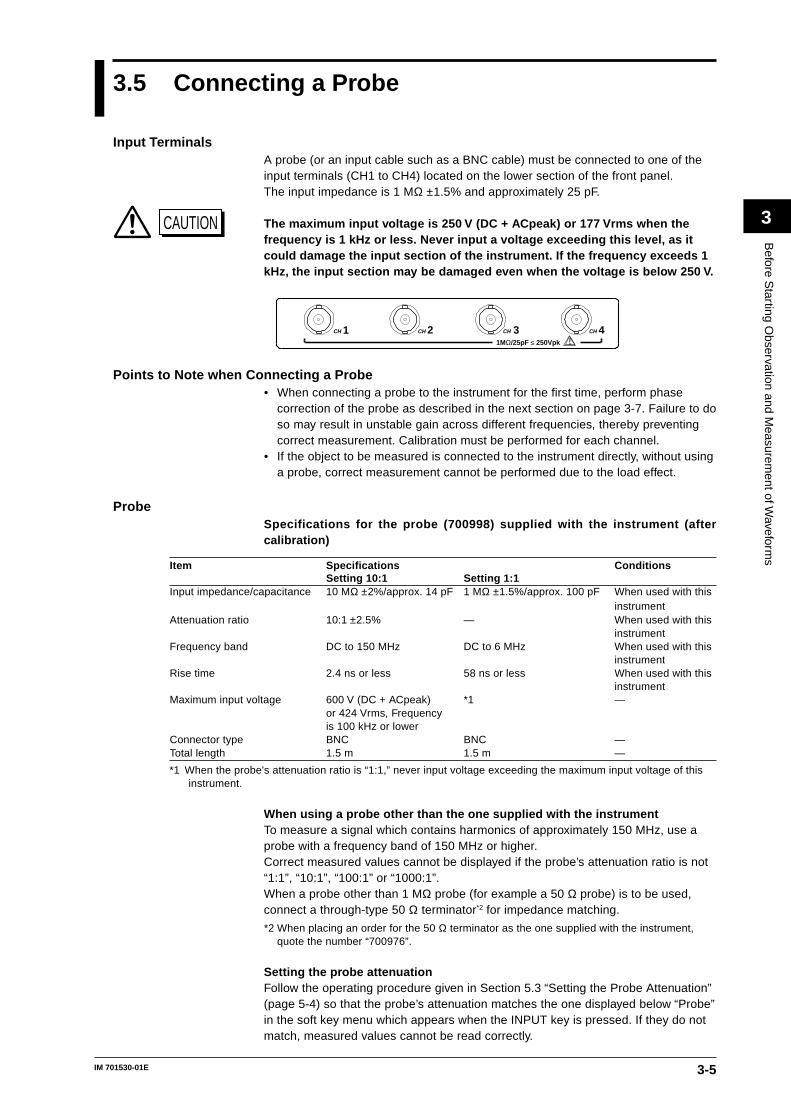
3-5IM 701530-01E
Before S
tarting Observation and M
easurement of W
aveforms
3
3.5 Connecting a Probe
Input TerminalsA probe (or an input cable such as a BNC cable) must be connected to one of theinput terminals (CH1 to CH4) located on the lower section of the front panel.The input impedance is 1 MΩ ±1.5% and approximately 25 pF.
CAUTION The maximum input voltage is 250 V (DC + ACpeak) or 177 Vrms when thefrequency is 1 kHz or less. Never input a voltage exceeding this level, as itcould damage the input section of the instrument. If the frequency exceeds 1kHz, the input section may be damaged even when the voltage is below 250 V.
1 2 3 4CHCHCH
1MΩ/25pF ≤ 250Vpk
CH
Points to Note when Connecting a Probe• When connecting a probe to the instrument for the first time, perform phase
correction of the probe as described in the next section on page 3-7. Failure to doso may result in unstable gain across different frequencies, thereby preventingcorrect measurement. Calibration must be performed for each channel.
• If the object to be measured is connected to the instrument directly, without usinga probe, correct measurement cannot be performed due to the load effect.
ProbeSpecifications for the probe (700998) supplied with the instrument (aftercalibration)
Item Specifications ConditionsSetting 10:1 Setting 1:1
Input impedance/capacitance 10 MΩ ±2%/approx. 14 pF 1 MΩ ±1.5%/approx. 100 pF When used with thisinstrument
Attenuation ratio 10:1 ±2.5% — When used with thisinstrument
Frequency band DC to 150 MHz DC to 6 MHz When used with thisinstrument
Rise time 2.4 ns or less 58 ns or less When used with thisinstrument
Maximum input voltage 600 V (DC + ACpeak) *1 —or 424 Vrms, Frequencyis 100 kHz or lower
Connector type BNC BNC —Total length 1.5 m 1.5 m —
*1 When the probe's attenuation ratio is “1:1,” never input voltage exceeding the maximum input voltage of thisinstrument.
When using a probe other than the one supplied with the instrumentTo measure a signal which contains harmonics of approximately 150 MHz, use aprobe with a frequency band of 150 MHz or higher.Correct measured values cannot be displayed if the probe’s attenuation ratio is not“1:1”, “10:1”, “100:1” or “1000:1”.When a probe other than 1 MΩ probe (for example a 50 Ω probe) is to be used,connect a through-type 50 Ω terminator*2 for impedance matching.
*2 When placing an order for the 50 Ω terminator as the one supplied with the instrument,quote the number “700976”.
Setting the probe attenuationFollow the operating procedure given in Section 5.3 “Setting the Probe Attenuation”(page 5-4) so that the probe’s attenuation matches the one displayed below “Probe”in the soft key menu which appears when the INPUT key is pressed. If they do notmatch, measured values cannot be read correctly.
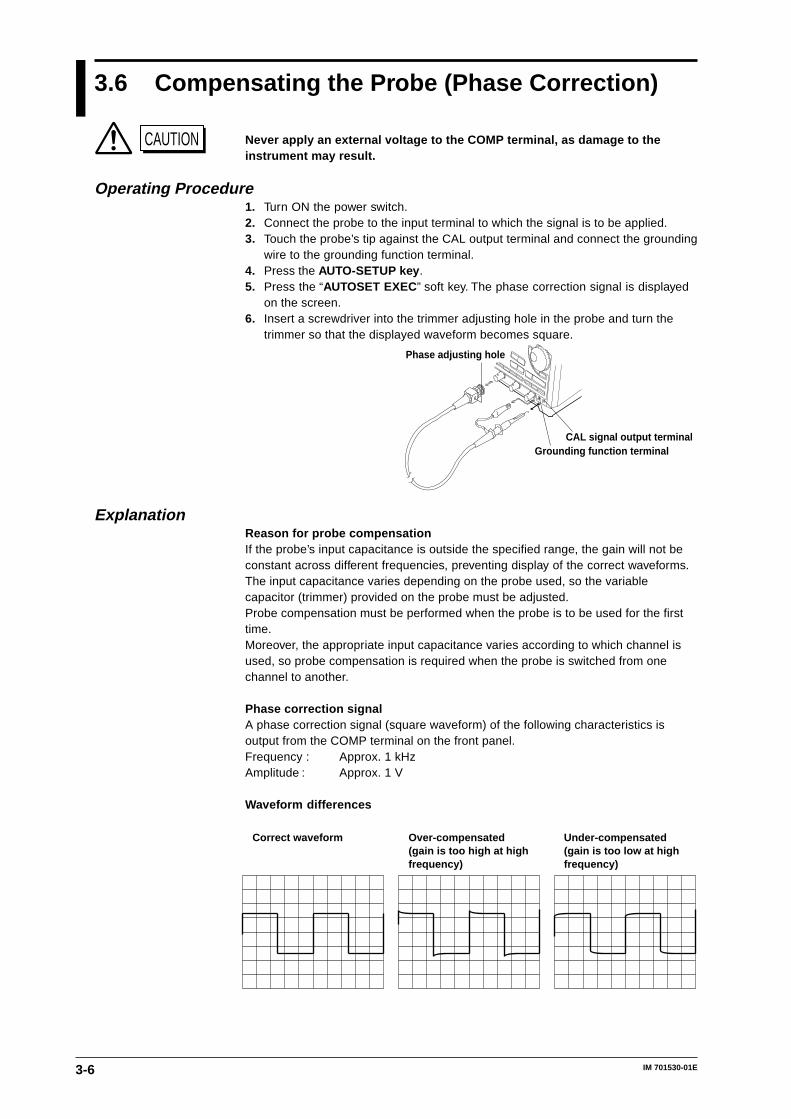
3-6 IM 701530-01E
3.6 Compensating the Probe (Phase Correction)
CAUTION Never apply an external voltage to the COMP terminal, as damage to theinstrument may result.
Operating Procedure1. Turn ON the power switch.2. Connect the probe to the input terminal to which the signal is to be applied.3. Touch the probe’s tip against the CAL output terminal and connect the grounding
wire to the grounding function terminal.4. Press the AUTO-SETUP key .5. Press the “AUTOSET EXEC” soft key. The phase correction signal is displayed
on the screen.6. Insert a screwdriver into the trimmer adjusting hole in the probe and turn the
trimmer so that the displayed waveform becomes square.
Grounding function terminalCAL signal output terminal
Phase adjusting hole
ExplanationReason for probe compensationIf the probe’s input capacitance is outside the specified range, the gain will not beconstant across different frequencies, preventing display of the correct waveforms.The input capacitance varies depending on the probe used, so the variablecapacitor (trimmer) provided on the probe must be adjusted.Probe compensation must be performed when the probe is to be used for the firsttime.Moreover, the appropriate input capacitance varies according to which channel isused, so probe compensation is required when the probe is switched from onechannel to another.
Phase correction signalA phase correction signal (square waveform) of the following characteristics isoutput from the COMP terminal on the front panel.Frequency : Approx. 1 kHzAmplitude : Approx. 1 V
Waveform differences
Correct waveform Over-compensated(gain is too high at highfrequency)
Under-compensated(gain is too low at highfrequency)
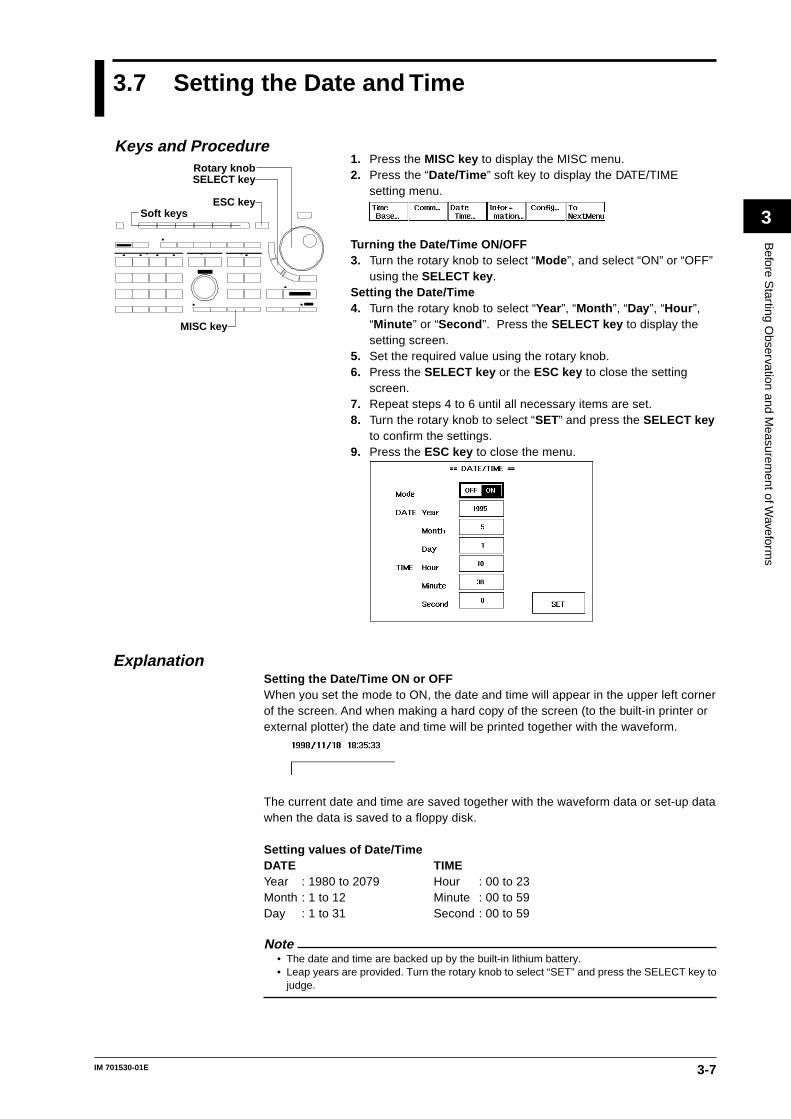
3-7IM 701530-01E
Before S
tarting Observation and M
easurement of W
aveforms
3
3.7 Setting the Date and Time
1. Press the MISC key to display the MISC menu.2. Press the “Date/Time ” soft key to display the DATE/TIME
setting menu.
Turning the Date/Time ON/OFF3. Turn the rotary knob to select “Mode ”, and select “ON” or “OFF”
using the SELECT key .Setting the Date/Time4. Turn the rotary knob to select “Year”, “Month ”, “Day”, “Hour ”,
“Minute ” or “Second ”. Press the SELECT key to display thesetting screen.
5. Set the required value using the rotary knob.6. Press the SELECT key or the ESC key to close the setting
screen.7. Repeat steps 4 to 6 until all necessary items are set.8. Turn the rotary knob to select “SET” and press the SELECT key
to confirm the settings.9. Press the ESC key to close the menu.
ExplanationSetting the Date/Time ON or OFFWhen you set the mode to ON, the date and time will appear in the upper left cornerof the screen. And when making a hard copy of the screen (to the built-in printer orexternal plotter) the date and time will be printed together with the waveform.
The current date and time are saved together with the waveform data or set-up datawhen the data is saved to a floppy disk.
Setting values of Date/TimeDATE TIMEYear : 1980 to 2079 Hour : 00 to 23Month : 1 to 12 Minute : 00 to 59Day : 1 to 31 Second : 00 to 59
Note• The date and time are backed up by the built-in lithium battery.• Leap years are provided. Turn the rotary knob to select “SET” and press the SELECT key to
judge.
Keys and Procedure
MISC key
Rotary knob
Soft keys
SELECT key
ESC key
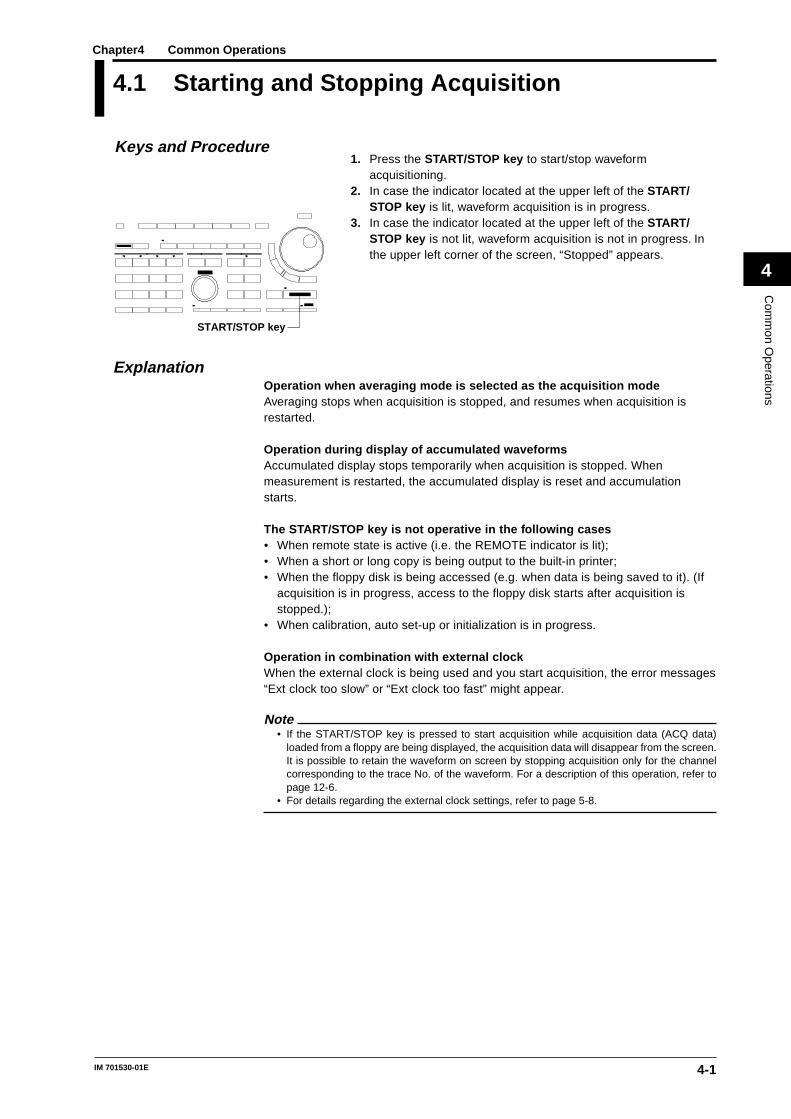
4-1IM 701530-01E
Com
mon O
perations
4
4.1 Starting and Stopping Acquisition
1. Press the START/STOP key to start/stop waveformacquisitioning.
2. In case the indicator located at the upper left of the START/STOP key is lit, waveform acquisition is in progress.
3. In case the indicator located at the upper left of the START/STOP key is not lit, waveform acquisition is not in progress. Inthe upper left corner of the screen, “Stopped” appears.
ExplanationOperation when averaging mode is selected as the acquisition modeAveraging stops when acquisition is stopped, and resumes when acquisition isrestarted.
Operation during display of accumulated waveformsAccumulated display stops temporarily when acquisition is stopped. Whenmeasurement is restarted, the accumulated display is reset and accumulationstarts.
The START/STOP key is not operative in the following cases• When remote state is active (i.e. the REMOTE indicator is lit);• When a short or long copy is being output to the built-in printer;• When the floppy disk is being accessed (e.g. when data is being saved to it). (If
acquisition is in progress, access to the floppy disk starts after acquisition isstopped.);
• When calibration, auto set-up or initialization is in progress.
Operation in combination with external clockWhen the external clock is being used and you start acquisition, the error messages“Ext clock too slow” or “Ext clock too fast” might appear.
Note• If the START/STOP key is pressed to start acquisition while acquisition data (ACQ data)
loaded from a floppy are being displayed, the acquisition data will disappear from the screen.It is possible to retain the waveform on screen by stopping acquisition only for the channelcorresponding to the trace No. of the waveform. For a description of this operation, refer topage 12-6.
• For details regarding the external clock settings, refer to page 5-8.
Keys and Procedure
START/STOP key
Chapter4 Common Operations
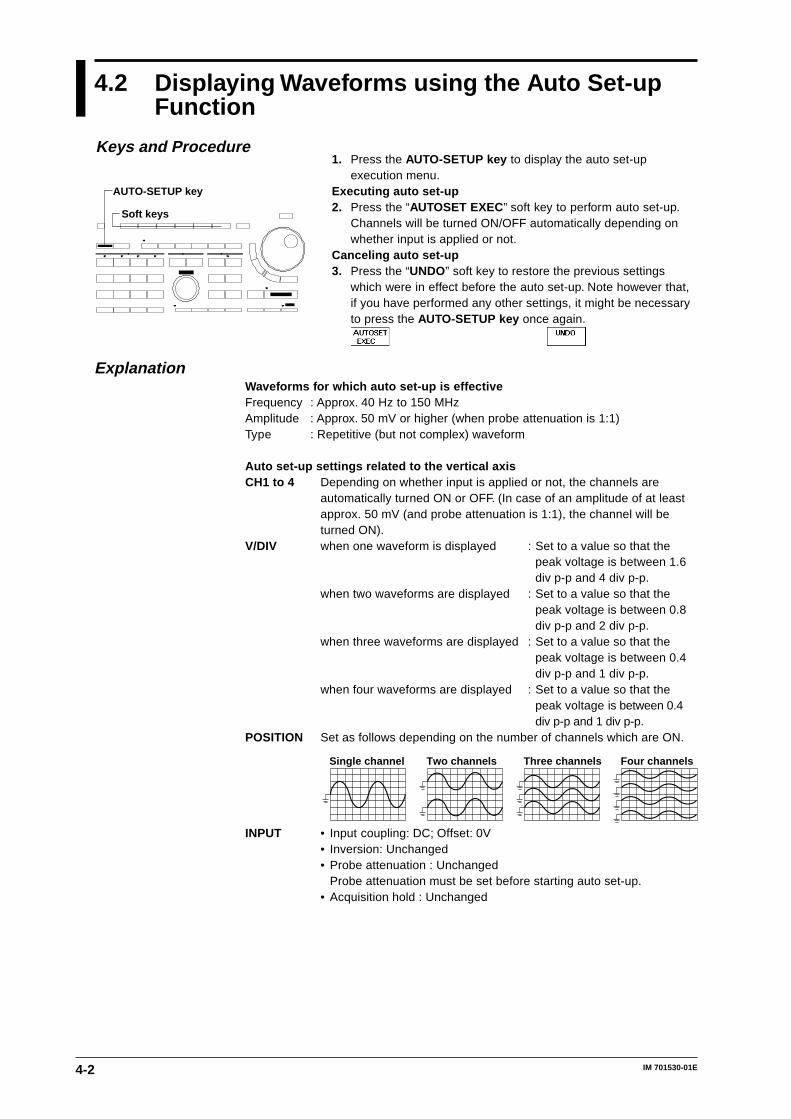
4-2 IM 701530-01E
4.2 Displaying Waveforms using the Auto Set-upFunction
1. Press the AUTO-SETUP key to display the auto set-upexecution menu.
Executing auto set-up2. Press the “AUTOSET EXEC” soft key to perform auto set-up.
Channels will be turned ON/OFF automatically depending onwhether input is applied or not.
Canceling auto set-up3. Press the “UNDO” soft key to restore the previous settings
which were in effect before the auto set-up. Note however that,if you have performed any other settings, it might be necessaryto press the AUTO-SETUP key once again.
ExplanationWaveforms for which auto set-up is effectiveFrequency : Approx. 40 Hz to 150 MHzAmplitude : Approx. 50 mV or higher (when probe attenuation is 1:1)Type : Repetitive (but not complex) waveform
Auto set-up settings related to the vertical axisCH1 to 4 Depending on whether input is applied or not, the channels are
automatically turned ON or OFF. (In case of an amplitude of at leastapprox. 50 mV (and probe attenuation is 1:1), the channel will beturned ON).
V/DIV when one waveform is displayed : Set to a value so that thepeak voltage is between 1.6div p-p and 4 div p-p.
when two waveforms are displayed : Set to a value so that thepeak voltage is between 0.8div p-p and 2 div p-p.
when three waveforms are displayed : Set to a value so that thepeak voltage is between 0.4div p-p and 1 div p-p.
when four waveforms are displayed : Set to a value so that thepeak voltage is between 0.4div p-p and 1 div p-p.
POSITION Set as follows depending on the number of channels which are ON.
Single channel Two channels Three channels Four channels
INPUT • Input coupling: DC; Offset: 0V• Inversion: Unchanged• Probe attenuation : Unchanged
Probe attenuation must be set before starting auto set-up.• Acquisition hold : Unchanged
Keys and Procedure
Soft keys
AUTO-SETUP key
4-3IM 701530-01E
Com
mon O
perations
4
Auto set-up settings related to the horizontal axisTIME/DIV Time axis is set so that the waveform with the longest cycle
shows 2 to 4 cycles on the screen.If this is not possible for any of the channel input signals, set to1ms/div.
TIMEBASE Set to “INT”.
Auto set-up settings related to triggersMODE Set to “AUTO”.TYPE Set to “EDGE”.LEVEL/SOURCE The trigger level is set to half the amplitude of the trigger source.
The Channel having the waveform with the longest cycle isselected as the trigger source. The slope setting is set to “ ”.
COUPLING Set to “DC”, HF rejection remains unchanged.POSITION Set to 0div.DELAY Set to “0s”.HOLD OFF Set to “OFF”.
Auto set-up settings related to acquisition/display conditionsSTART/STOP Acquisition is started.ACQUISITION Set to “NORMAL”.LENGTH (for DL1540CL)
Unchanged.FILTER Smoothing is set to “OFF”, Band to “FULL”.ZOOM Mode is set to “OFF”, and other settings remain unchanged.DISPLAY Settings related to interpolation, the X-Y display, and accumulate
display remain unchanged.DISPLAY FORM Settings related to graticule, scale, %marker and Waveform
information remain unchanged.
Auto set-up settings related to waveform analysisMEASURE Settings related to automated measurements remain
unchanged.CURSOR Settings related to cursor measurements remain unchanged.MATH Waveform computation and phase shift are set to “OFF”.
Other Auto set-up related settingsSTORE/RECALL Display of recalled waveforms is set to “OFF”.SAVE/LOAD Display of loaded waveforms is set to “OFF”.
UNDO : Cancellation of auto set-upAfter auto set-up has been completed, this function allows you to restore thesettings which were in effect before the auto set-up was performed.However, if the power is turned OFF, the settings which were in effect before theauto set-up will be lost. Thus, it is not possible to perform an UNDO before an autoset-up.
Note• It is not possible to perform auto set-up while GO/NO-GO determination is in progress.• The snapshot waveform will be deleted if auto set-up is performed.• The auto set-up function may not operate correctly in certain cases such as when the waveform
contains DC components or high frequency components.
4.2 Displaying Waveforms using the Auto Set-up Function
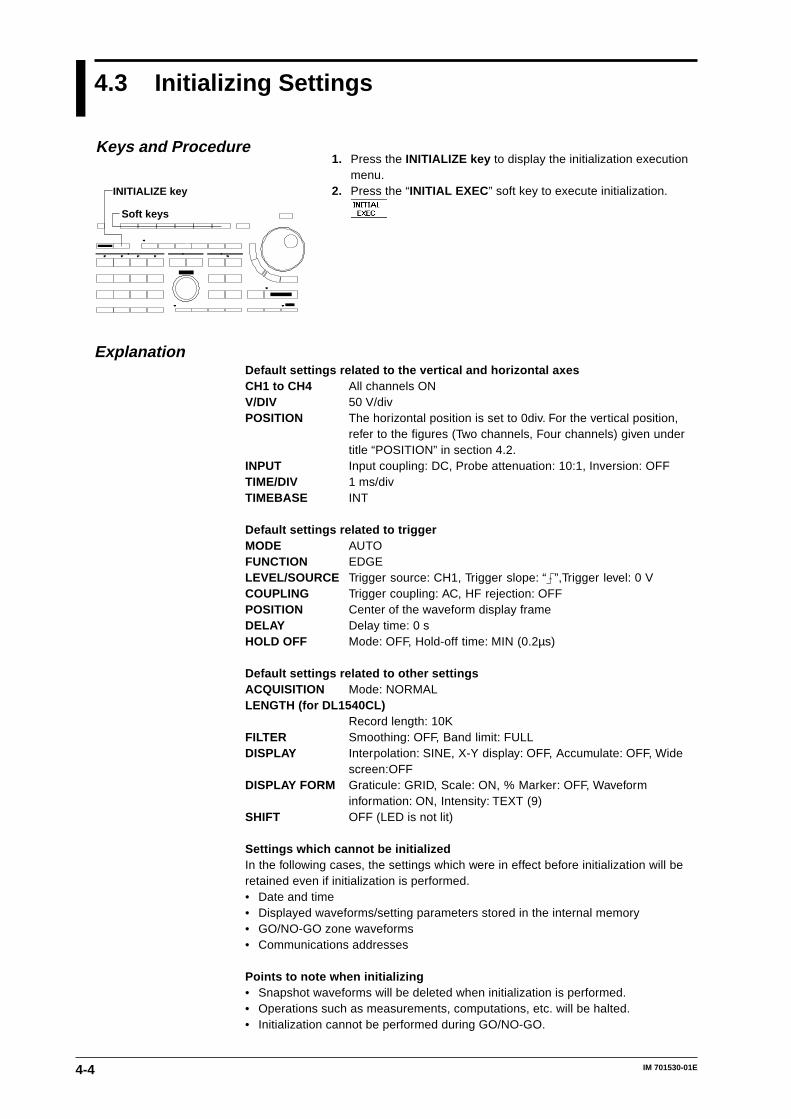
4-4 IM 701530-01E
4.3 Initializing Settings
1. Press the INITIALIZE key to display the initialization executionmenu.
2. Press the “INITIAL EXEC ” soft key to execute initialization.
ExplanationDefault settings related to the vertical and horizontal axesCH1 to CH4 All channels ONV/DIV 50 V/divPOSITION The horizontal position is set to 0div. For the vertical position,
refer to the figures (Two channels, Four channels) given undertitle “POSITION” in section 4.2.
INPUT Input coupling: DC, Probe attenuation: 10:1, Inversion: OFFTIME/DIV 1 ms/divTIMEBASE INT
Default settings related to triggerMODE AUTOFUNCTION EDGELEVEL/SOURCE Trigger source: CH1, Trigger slope: “ ”,Trigger level: 0 VCOUPLING Trigger coupling: AC, HF rejection: OFFPOSITION Center of the waveform display frameDELAY Delay time: 0 sHOLD OFF Mode: OFF, Hold-off time: MIN (0.2µs)
Default settings related to other settingsACQUISITION Mode: NORMALLENGTH (for DL1540CL)
Record length: 10KFILTER Smoothing: OFF, Band limit: FULLDISPLAY Interpolation: SINE, X-Y display: OFF, Accumulate: OFF, Wide
screen:OFFDISPLAY FORM Graticule: GRID, Scale: ON, % Marker: OFF, Waveform
information: ON, Intensity: TEXT (9)SHIFT OFF (LED is not lit)
Settings which cannot be initializedIn the following cases, the settings which were in effect before initialization will beretained even if initialization is performed.• Date and time• Displayed waveforms/setting parameters stored in the internal memory• GO/NO-GO zone waveforms• Communications addresses
Points to note when initializing• Snapshot waveforms will be deleted when initialization is performed.• Operations such as measurements, computations, etc. will be halted.• Initialization cannot be performed during GO/NO-GO.
Keys and Procedure
Soft keys
INITIALIZE key
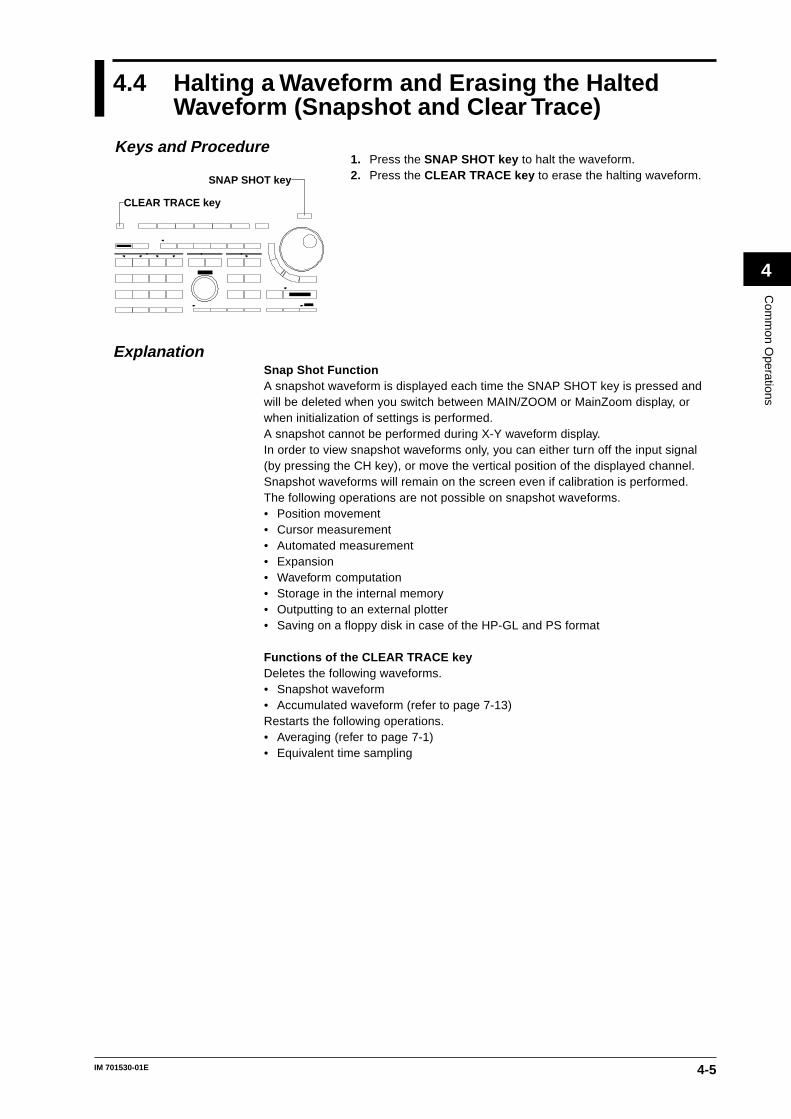
4-5IM 701530-01E
Com
mon O
perations
4
4.4 Halting a Waveform and Erasing the HaltedWaveform (Snapshot and Clear Trace)
1. Press the SNAP SHOT key to halt the waveform.2. Press the CLEAR TRACE key to erase the halting waveform.
ExplanationSnap Shot FunctionA snapshot waveform is displayed each time the SNAP SHOT key is pressed andwill be deleted when you switch between MAIN/ZOOM or MainZoom display, orwhen initialization of settings is performed.A snapshot cannot be performed during X-Y waveform display.In order to view snapshot waveforms only, you can either turn off the input signal(by pressing the CH key), or move the vertical position of the displayed channel.Snapshot waveforms will remain on the screen even if calibration is performed.The following operations are not possible on snapshot waveforms.• Position movement• Cursor measurement• Automated measurement• Expansion• Waveform computation• Storage in the internal memory• Outputting to an external plotter• Saving on a floppy disk in case of the HP-GL and PS format
Functions of the CLEAR TRACE keyDeletes the following waveforms.• Snapshot waveform• Accumulated waveform (refer to page 7-13)Restarts the following operations.• Averaging (refer to page 7-1)• Equivalent time sampling
Keys and Procedure
CLEAR TRACE key
SNAP SHOT key
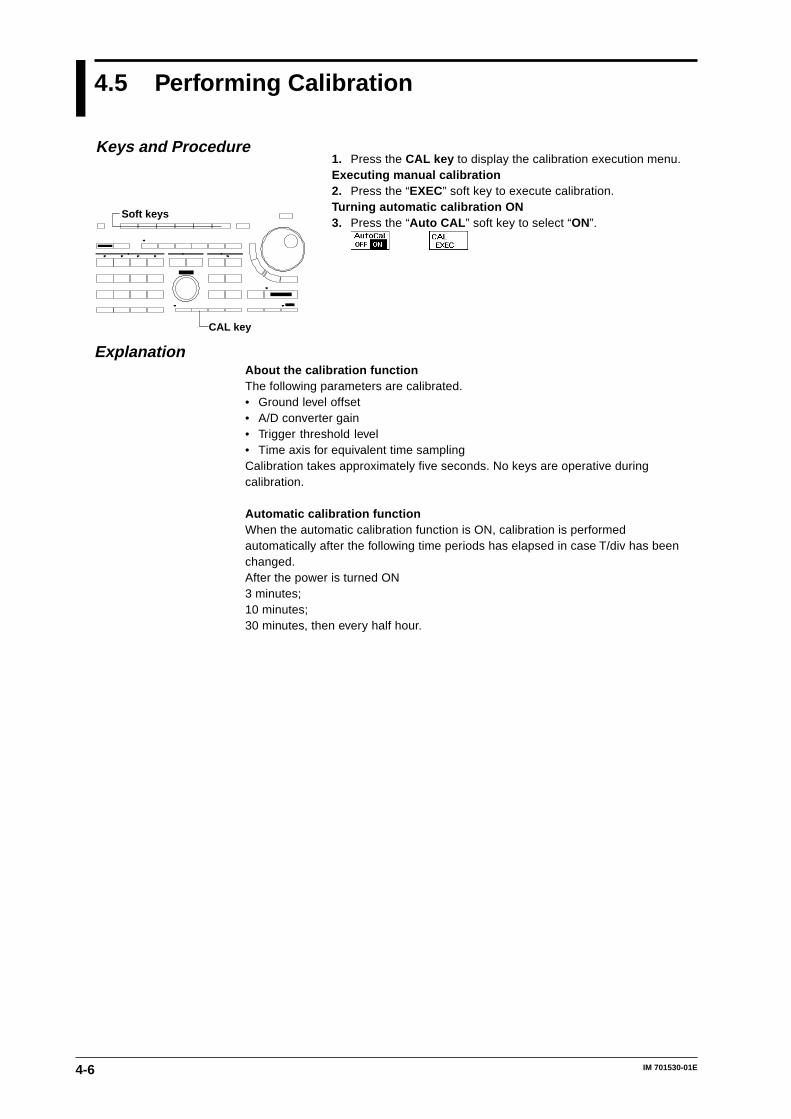
4-6 IM 701530-01E
4.5 Performing Calibration
1. Press the CAL key to display the calibration execution menu.Executing manual calibration2. Press the “EXEC” soft key to execute calibration.Turning automatic calibration ON3. Press the “Auto CAL ” soft key to select “ON”.
ExplanationAbout the calibration functionThe following parameters are calibrated.• Ground level offset• A/D converter gain• Trigger threshold level• Time axis for equivalent time samplingCalibration takes approximately five seconds. No keys are operative duringcalibration.
Automatic calibration functionWhen the automatic calibration function is ON, calibration is performedautomatically after the following time periods has elapsed in case T/div has beenchanged.After the power is turned ON3 minutes;10 minutes;30 minutes, then every half hour.
Keys and Procedure
CAL key
Soft keys
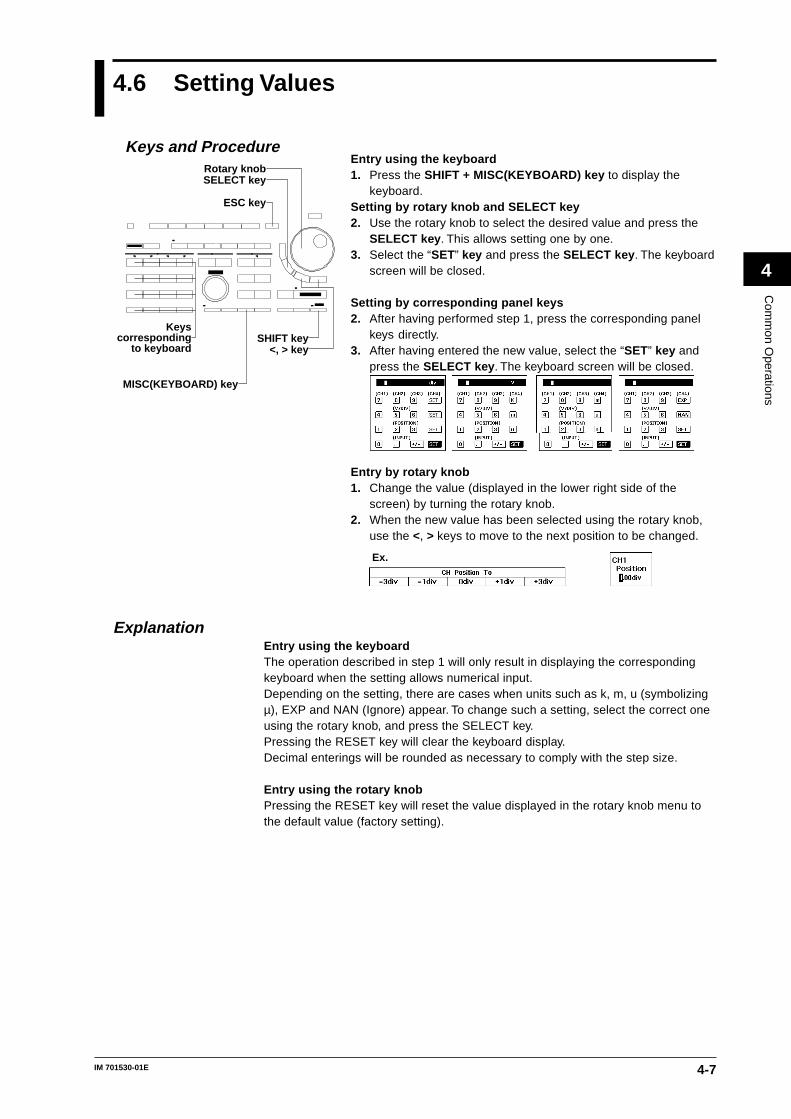
4-7IM 701530-01E
Com
mon O
perations
4
4.6 Setting Values
Entry using the keyboard1. Press the SHIFT + MISC(KEYBOARD) key to display the
keyboard.Setting by rotary knob and SELECT key2. Use the rotary knob to select the desired value and press the
SELECT key . This allows setting one by one.3. Select the “SET” key and press the SELECT key . The keyboard
screen will be closed.
Setting by corresponding panel keys2. After having performed step 1, press the corresponding panel
keys directly.3. After having entered the new value, select the “SET” key and
press the SELECT key . The keyboard screen will be closed.
Entry by rotary knob1. Change the value (displayed in the lower right side of the
screen) by turning the rotary knob.2. When the new value has been selected using the rotary knob,
use the <, > keys to move to the next position to be changed.
Ex.
ExplanationEntry using the keyboardThe operation described in step 1 will only result in displaying the correspondingkeyboard when the setting allows numerical input.Depending on the setting, there are cases when units such as k, m, u (symbolizingµ), EXP and NAN (Ignore) appear. To change such a setting, select the correct oneusing the rotary knob, and press the SELECT key.Pressing the RESET key will clear the keyboard display.Decimal enterings will be rounded as necessary to comply with the step size.
Entry using the rotary knobPressing the RESET key will reset the value displayed in the rotary knob menu tothe default value (factory setting).
Keys and Procedure
MISC(KEYBOARD) key
Rotary knobSELECT key
ESC key
SHIFT key<, > key
Keys corresponding
to keyboard
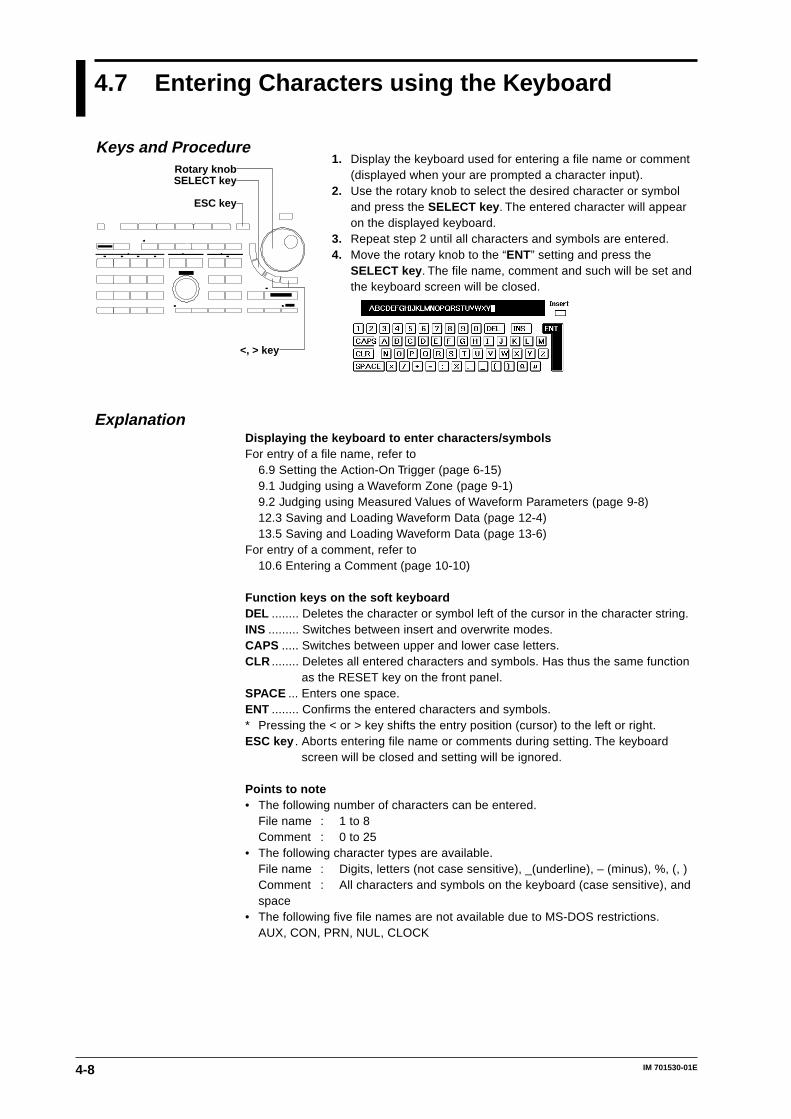
4-8 IM 701530-01E
4.7 Entering Characters using the Keyboard
1. Display the keyboard used for entering a file name or comment(displayed when your are prompted a character input).
2. Use the rotary knob to select the desired character or symboland press the SELECT key . The entered character will appearon the displayed keyboard.
3. Repeat step 2 until all characters and symbols are entered.4. Move the rotary knob to the “ENT” setting and press the
SELECT key . The file name, comment and such will be set andthe keyboard screen will be closed.
ExplanationDisplaying the keyboard to enter characters/symbolsFor entry of a file name, refer to
6.9 Setting the Action-On Trigger (page 6-15)9.1 Judging using a Waveform Zone (page 9-1)9.2 Judging using Measured Values of Waveform Parameters (page 9-8)12.3 Saving and Loading Waveform Data (page 12-4)13.5 Saving and Loading Waveform Data (page 13-6)
For entry of a comment, refer to10.6 Entering a Comment (page 10-10)
Function keys on the soft keyboardDEL ........ Deletes the character or symbol left of the cursor in the character string.INS ......... Switches between insert and overwrite modes.CAPS ..... Switches between upper and lower case letters.CLR ........ Deletes all entered characters and symbols. Has thus the same function
as the RESET key on the front panel.SPACE ... Enters one space.ENT ........ Confirms the entered characters and symbols.* Pressing the < or > key shifts the entry position (cursor) to the left or right.ESC key . Aborts entering file name or comments during setting. The keyboard
screen will be closed and setting will be ignored.
Points to note• The following number of characters can be entered.
File name : 1 to 8Comment : 0 to 25
• The following character types are available.File name : Digits, letters (not case sensitive), _(underline), – (minus), %, (, )Comment : All characters and symbols on the keyboard (case sensitive), andspace
• The following five file names are not available due to MS-DOS restrictions.AUX, CON, PRN, NUL, CLOCK
Keys and ProcedureRotary knobSELECT key
ESC key
<, > key
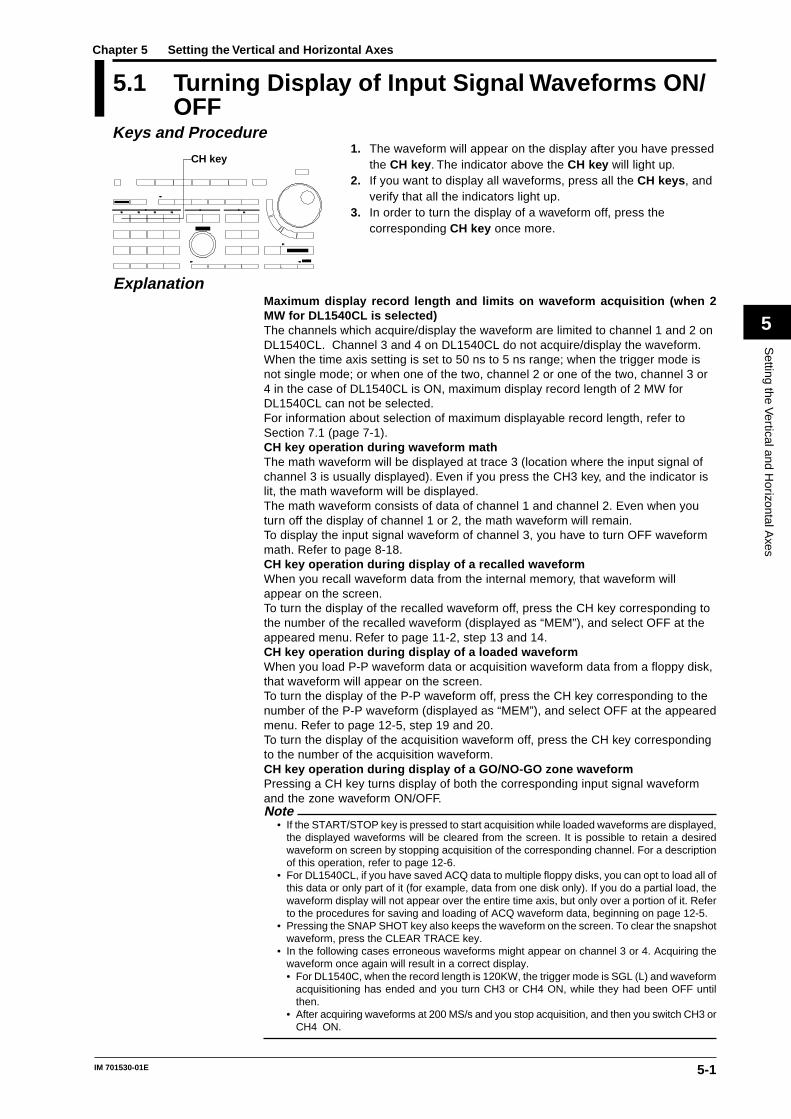
5-1IM 701530-01E
Setting the V
ertical and Horizontal A
xes
5
5.1 Turning Display of Input Signal Waveforms ON/OFF
1. The waveform will appear on the display after you have pressedthe CH key . The indicator above the CH key will light up.
2. If you want to display all waveforms, press all the CH keys , andverify that all the indicators light up.
3. In order to turn the display of a waveform off, press thecorresponding CH key once more.
ExplanationMaximum display record length and limits on waveform acquisition (when 2MW for DL1540CL is selected)The channels which acquire/display the waveform are limited to channel 1 and 2 onDL1540CL. Channel 3 and 4 on DL1540CL do not acquire/display the waveform.When the time axis setting is set to 50 ns to 5 ns range; when the trigger mode isnot single mode; or when one of the two, channel 2 or one of the two, channel 3 or4 in the case of DL1540CL is ON, maximum display record length of 2 MW forDL1540CL can not be selected.For information about selection of maximum displayable record length, refer toSection 7.1 (page 7-1).CH key operation during waveform mathThe math waveform will be displayed at trace 3 (location where the input signal ofchannel 3 is usually displayed). Even if you press the CH3 key, and the indicator islit, the math waveform will be displayed.The math waveform consists of data of channel 1 and channel 2. Even when youturn off the display of channel 1 or 2, the math waveform will remain.To display the input signal waveform of channel 3, you have to turn OFF waveformmath. Refer to page 8-18.CH key operation during display of a recalled waveformWhen you recall waveform data from the internal memory, that waveform willappear on the screen.To turn the display of the recalled waveform off, press the CH key corresponding tothe number of the recalled waveform (displayed as “MEM”), and select OFF at theappeared menu. Refer to page 11-2, step 13 and 14.CH key operation during display of a loaded waveformWhen you load P-P waveform data or acquisition waveform data from a floppy disk,that waveform will appear on the screen.To turn the display of the P-P waveform off, press the CH key corresponding to thenumber of the P-P waveform (displayed as “MEM”), and select OFF at the appearedmenu. Refer to page 12-5, step 19 and 20.To turn the display of the acquisition waveform off, press the CH key correspondingto the number of the acquisition waveform.CH key operation during display of a GO/NO-GO zone waveformPressing a CH key turns display of both the corresponding input signal waveformand the zone waveform ON/OFF.Note
• If the START/STOP key is pressed to start acquisition while loaded waveforms are displayed,the displayed waveforms will be cleared from the screen. It is possible to retain a desiredwaveform on screen by stopping acquisition of the corresponding channel. For a descriptionof this operation, refer to page 12-6.
• For DL1540CL, if you have saved ACQ data to multiple floppy disks, you can opt to load all ofthis data or only part of it (for example, data from one disk only). If you do a partial load, thewaveform display will not appear over the entire time axis, but only over a portion of it. Referto the procedures for saving and loading of ACQ waveform data, beginning on page 12-5.
• Pressing the SNAP SHOT key also keeps the waveform on the screen. To clear the snapshotwaveform, press the CLEAR TRACE key.
• In the following cases erroneous waveforms might appear on channel 3 or 4. Acquiring thewaveform once again will result in a correct display.• For DL1540C, when the record length is 120KW, the trigger mode is SGL (L) and waveform
acquisitioning has ended and you turn CH3 or CH4 ON, while they had been OFF untilthen.
• After acquiring waveforms at 200 MS/s and you stop acquisition, and then you switch CH3 orCH4 ON.
Keys and Procedure
CH key
Chapter 5 Setting the Vertical and Horizontal Axes
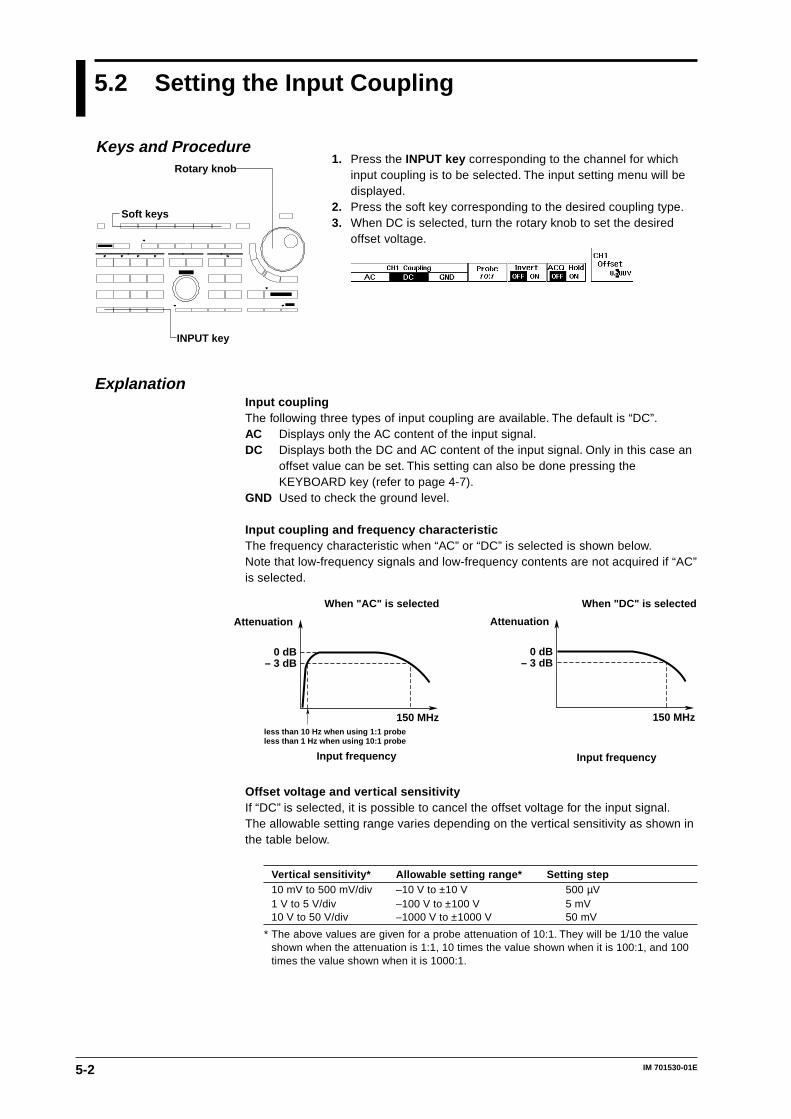
5-2 IM 701530-01E
5.2 Setting the Input Coupling
1. Press the INPUT key corresponding to the channel for whichinput coupling is to be selected. The input setting menu will bedisplayed.
2. Press the soft key corresponding to the desired coupling type.3. When DC is selected, turn the rotary knob to set the desired
offset voltage.
ExplanationInput couplingThe following three types of input coupling are available. The default is “DC”.AC Displays only the AC content of the input signal.DC Displays both the DC and AC content of the input signal. Only in this case an
offset value can be set. This setting can also be done pressing theKEYBOARD key (refer to page 4-7).
GND Used to check the ground level.
Input coupling and frequency characteristicThe frequency characteristic when “AC” or “DC” is selected is shown below.Note that low-frequency signals and low-frequency contents are not acquired if “AC”is selected.
0 dB– 3 dB
150 MHz
Attenuation
0 dB– 3 dB
150 MHz
Attenuation
less than 10 Hz when using 1:1 probeless than 1 Hz when using 10:1 probe
Input frequency Input frequency
When "AC" is selected When "DC" is selected
Offset voltage and vertical sensitivityIf “DC” is selected, it is possible to cancel the offset voltage for the input signal.The allowable setting range varies depending on the vertical sensitivity as shown inthe table below.
Vertical sensitivity* Allowable setting range* Setting step10 mV to 500 mV/div –10 V to ±10 V 500 µV1 V to 5 V/div –100 V to ±100 V 5 mV10 V to 50 V/div –1000 V to ±1000 V 50 mV
* The above values are given for a probe attenuation of 10:1. They will be 1/10 the valueshown when the attenuation is 1:1, 10 times the value shown when it is 100:1, and 100times the value shown when it is 1000:1.
Keys and ProcedureRotary knob
INPUT key
Soft keys
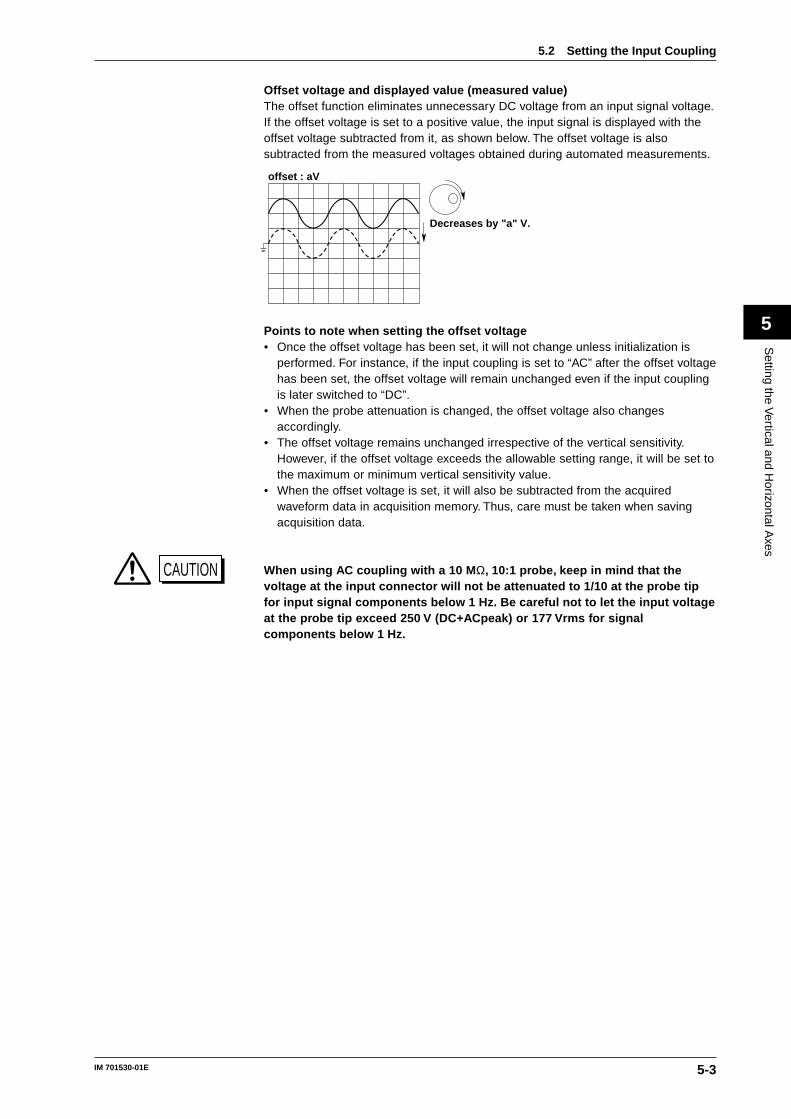
5-3IM 701530-01E
Setting the V
ertical and Horizontal A
xes
5
Offset voltage and displayed value (measured value)The offset function eliminates unnecessary DC voltage from an input signal voltage.If the offset voltage is set to a positive value, the input signal is displayed with theoffset voltage subtracted from it, as shown below. The offset voltage is alsosubtracted from the measured voltages obtained during automated measurements.
Decreases by "a" V.
offset : aV
Points to note when setting the offset voltage• Once the offset voltage has been set, it will not change unless initialization is
performed. For instance, if the input coupling is set to “AC” after the offset voltagehas been set, the offset voltage will remain unchanged even if the input couplingis later switched to “DC”.
• When the probe attenuation is changed, the offset voltage also changesaccordingly.
• The offset voltage remains unchanged irrespective of the vertical sensitivity.However, if the offset voltage exceeds the allowable setting range, it will be set tothe maximum or minimum vertical sensitivity value.
• When the offset voltage is set, it will also be subtracted from the acquiredwaveform data in acquisition memory. Thus, care must be taken when savingacquisition data.
CAUTION When using AC coupling with a 10 M Ω, 10:1 probe, keep in mind that thevoltage at the input connector will not be attenuated to 1/10 at the probe tipfor input signal components below 1 Hz. Be careful not to let the input voltageat the probe tip exceed 250 V (DC+ACpeak) or 177 Vrms for signalcomponents below 1 Hz.
5.2 Setting the Input Coupling
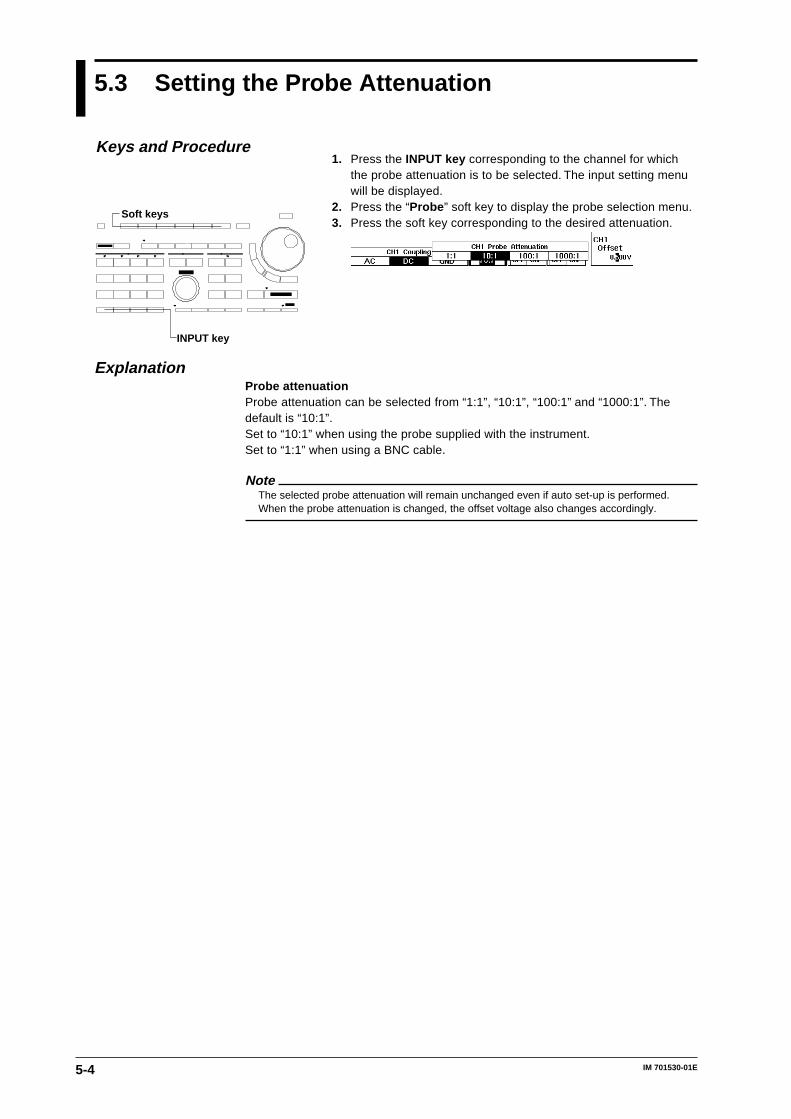
5-4 IM 701530-01E
5.3 Setting the Probe Attenuation
1. Press the INPUT key corresponding to the channel for whichthe probe attenuation is to be selected. The input setting menuwill be displayed.
2. Press the “Probe ” soft key to display the probe selection menu.3. Press the soft key corresponding to the desired attenuation.
ExplanationProbe attenuationProbe attenuation can be selected from “1:1”, “10:1”, “100:1” and “1000:1”. Thedefault is “10:1”.Set to “10:1” when using the probe supplied with the instrument.Set to “1:1” when using a BNC cable.
NoteThe selected probe attenuation will remain unchanged even if auto set-up is performed.When the probe attenuation is changed, the offset voltage also changes accordingly.
Keys and Procedure
INPUT key
Soft keys
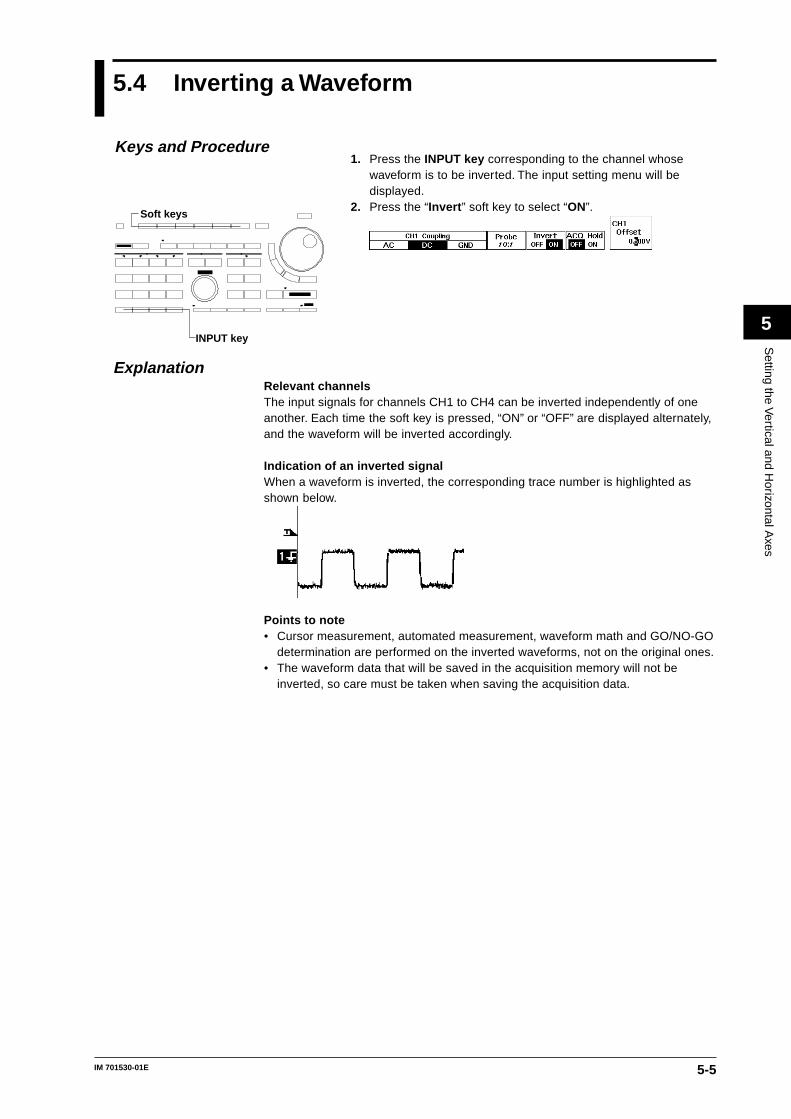
5-5IM 701530-01E
Setting the V
ertical and Horizontal A
xes
5
5.4 Inverting a Waveform
1. Press the INPUT key corresponding to the channel whosewaveform is to be inverted. The input setting menu will bedisplayed.
2. Press the “Invert ” soft key to select “ON”.
ExplanationRelevant channelsThe input signals for channels CH1 to CH4 can be inverted independently of oneanother. Each time the soft key is pressed, “ON” or “OFF” are displayed alternately,and the waveform will be inverted accordingly.
Indication of an inverted signalWhen a waveform is inverted, the corresponding trace number is highlighted asshown below.
Points to note• Cursor measurement, automated measurement, waveform math and GO/NO-GO
determination are performed on the inverted waveforms, not on the original ones.• The waveform data that will be saved in the acquisition memory will not be
inverted, so care must be taken when saving the acquisition data.
Keys and Procedure
INPUT key
Soft keys
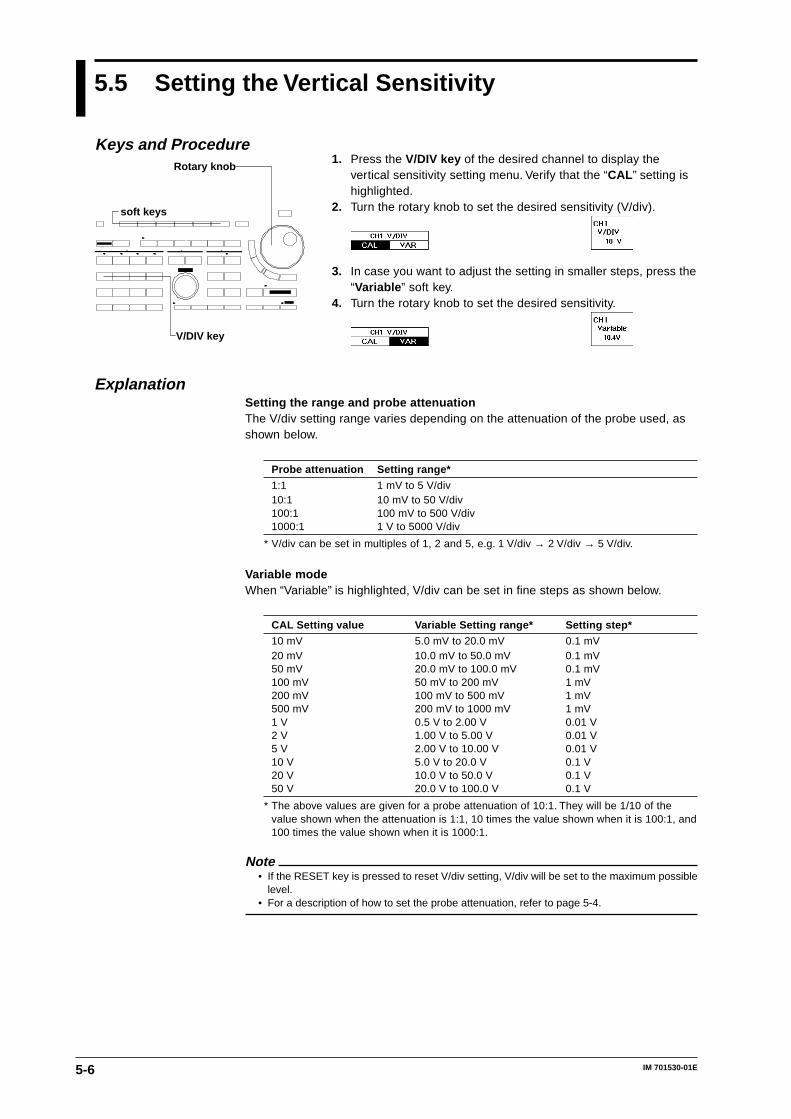
5-6 IM 701530-01E
5.5 Setting the Vertical Sensitivity
1. Press the V/DIV key of the desired channel to display thevertical sensitivity setting menu. Verify that the “CAL ” setting ishighlighted.
2. Turn the rotary knob to set the desired sensitivity (V/div).
3. In case you want to adjust the setting in smaller steps, press the“Variable ” soft key.
4. Turn the rotary knob to set the desired sensitivity.
ExplanationSetting the range and probe attenuationThe V/div setting range varies depending on the attenuation of the probe used, asshown below.
Probe attenuation Setting range*
1:1 1 mV to 5 V/div10:1 10 mV to 50 V/div100:1 100 mV to 500 V/div1000:1 1 V to 5000 V/div
* V/div can be set in multiples of 1, 2 and 5, e.g. 1 V/div → 2 V/div → 5 V/div.
Variable modeWhen “Variable” is highlighted, V/div can be set in fine steps as shown below.
CAL Setting value Variable Setting range* Setting step*
10 mV 5.0 mV to 20.0 mV 0.1 mV20 mV 10.0 mV to 50.0 mV 0.1 mV50 mV 20.0 mV to 100.0 mV 0.1 mV100 mV 50 mV to 200 mV 1 mV200 mV 100 mV to 500 mV 1 mV500 mV 200 mV to 1000 mV 1 mV1 V 0.5 V to 2.00 V 0.01 V2 V 1.00 V to 5.00 V 0.01 V5 V 2.00 V to 10.00 V 0.01 V10 V 5.0 V to 20.0 V 0.1 V20 V 10.0 V to 50.0 V 0.1 V50 V 20.0 V to 100.0 V 0.1 V
* The above values are given for a probe attenuation of 10:1. They will be 1/10 of thevalue shown when the attenuation is 1:1, 10 times the value shown when it is 100:1, and100 times the value shown when it is 1000:1.
Note• If the RESET key is pressed to reset V/div setting, V/div will be set to the maximum possible
level.• For a description of how to set the probe attenuation, refer to page 5-4.
Keys and ProcedureRotary knob
V/DIV key
soft keys
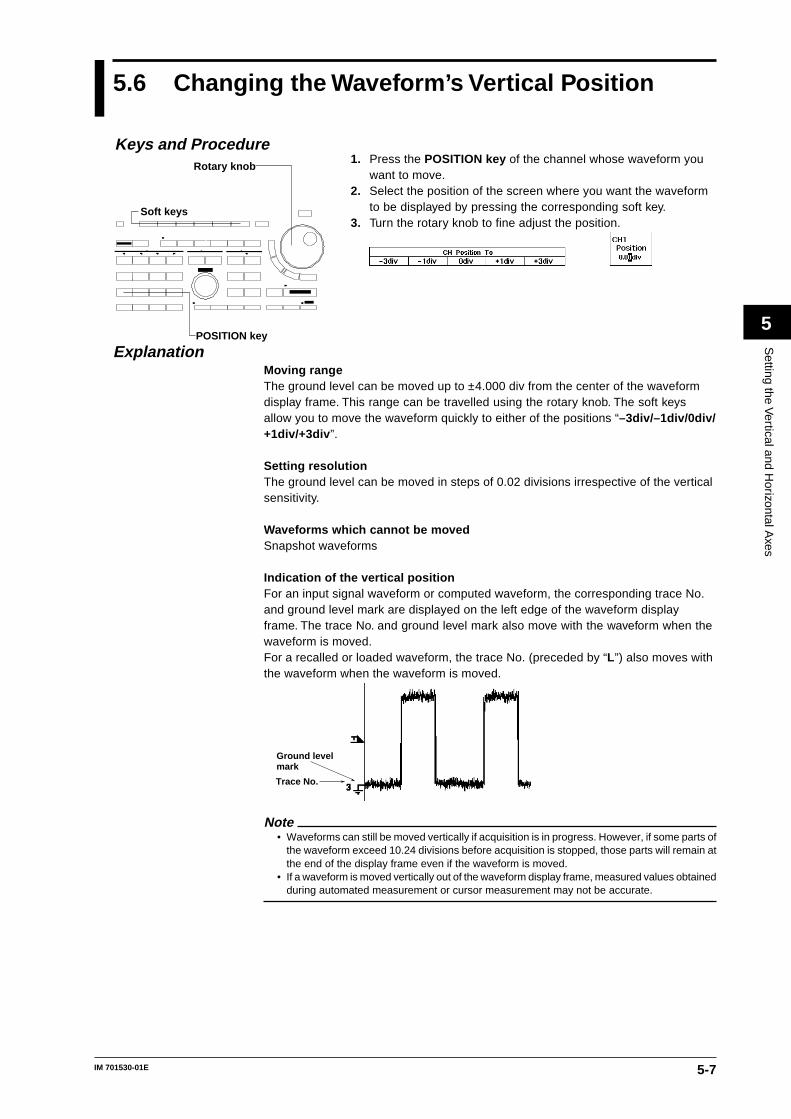
5-7IM 701530-01E
Setting the V
ertical and Horizontal A
xes
5
5.6 Changing the Waveform’s Vertical Position
1. Press the POSITION key of the channel whose waveform youwant to move.
2. Select the position of the screen where you want the waveformto be displayed by pressing the corresponding soft key.
3. Turn the rotary knob to fine adjust the position.
ExplanationMoving rangeThe ground level can be moved up to ±4.000 div from the center of the waveformdisplay frame. This range can be travelled using the rotary knob. The soft keysallow you to move the waveform quickly to either of the positions “–3div/–1div/0div/+1div/+3div ”.
Setting resolutionThe ground level can be moved in steps of 0.02 divisions irrespective of the verticalsensitivity.
Waveforms which cannot be movedSnapshot waveforms
Indication of the vertical positionFor an input signal waveform or computed waveform, the corresponding trace No.and ground level mark are displayed on the left edge of the waveform displayframe. The trace No. and ground level mark also move with the waveform when thewaveform is moved.For a recalled or loaded waveform, the trace No. (preceded by “L”) also moves withthe waveform when the waveform is moved.
Trace No.
Ground levelmark
Note• Waveforms can still be moved vertically if acquisition is in progress. However, if some parts of
the waveform exceed 10.24 divisions before acquisition is stopped, those parts will remain atthe end of the display frame even if the waveform is moved.
• If a waveform is moved vertically out of the waveform display frame, measured values obtainedduring automated measurement or cursor measurement may not be accurate.
Keys and ProcedureRotary knob
POSITION key
Soft keys
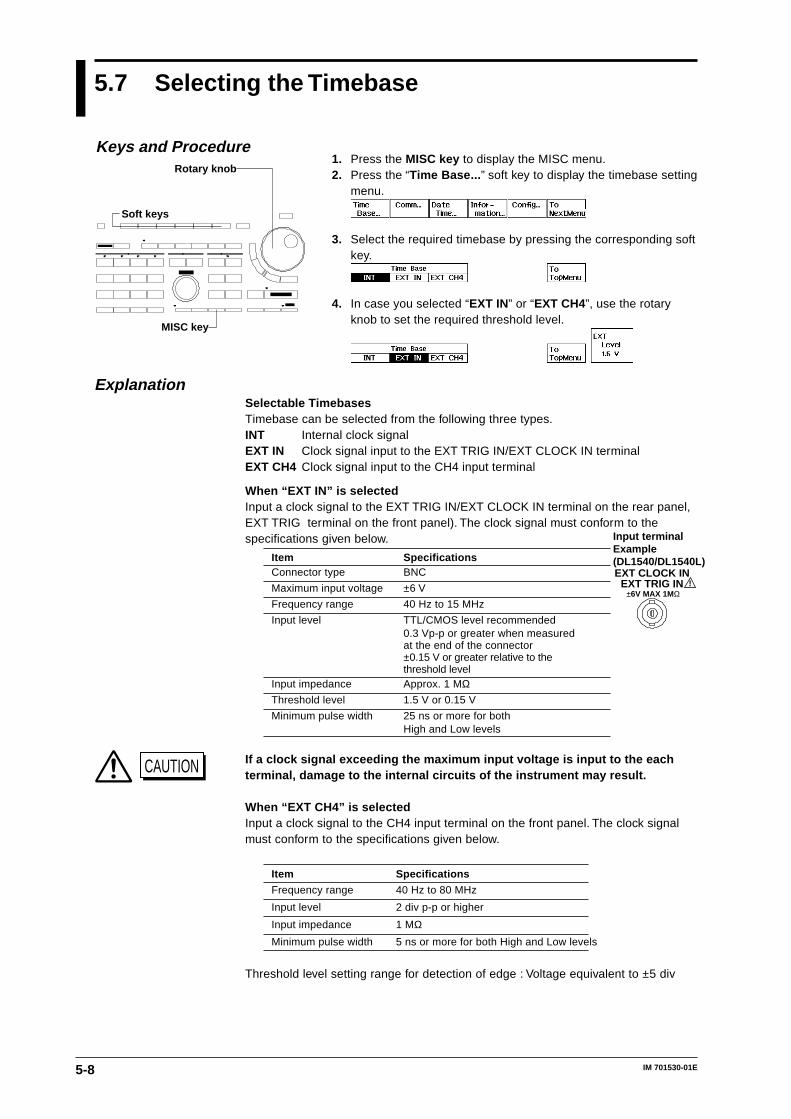
5-8 IM 701530-01E
5.7 Selecting the Timebase
1. Press the MISC key to display the MISC menu.2. Press the “Time Base... ” soft key to display the timebase setting
menu.
3. Select the required timebase by pressing the corresponding softkey.
4. In case you selected “EXT IN” or “EXT CH4”, use the rotaryknob to set the required threshold level.
ExplanationSelectable TimebasesTimebase can be selected from the following three types.INT Internal clock signalEXT IN Clock signal input to the EXT TRIG IN/EXT CLOCK IN terminalEXT CH4 Clock signal input to the CH4 input terminal
When “EXT IN” is selectedInput a clock signal to the EXT TRIG IN/EXT CLOCK IN terminal on the rear panel,EXT TRIG terminal on the front panel). The clock signal must conform to thespecifications given below.
Item SpecificationsConnector type BNC
Maximum input voltage ±6 V
Frequency range 40 Hz to 15 MHz
Input level TTL/CMOS level recommended0.3 Vp-p or greater when measuredat the end of the connector±0.15 V or greater relative to thethreshold level
Input impedance Approx. 1 MΩThreshold level 1.5 V or 0.15 V
Minimum pulse width 25 ns or more for bothHigh and Low levels
CAUTION If a clock signal exceeding the maximum input voltage is input to the eachterminal, damage to the internal circuits of the instrument may result.
When “EXT CH4” is selectedInput a clock signal to the CH4 input terminal on the front panel. The clock signalmust conform to the specifications given below.
Item Specifications
Frequency range 40 Hz to 80 MHz
Input level 2 div p-p or higher
Input impedance 1 MΩMinimum pulse width 5 ns or more for both High and Low levels
Threshold level setting range for detection of edge : Voltage equivalent to ±5 div
Keys and Procedure
MISC key
Rotary knob
Soft keys
Input terminalExample (DL1540/DL1540L)EXT CLOCK IN
EXT TRIG IN ±6V MAX 1MΩ
!

5-9IM 701530-01E
Setting the V
ertical and Horizontal A
xes
5
Points to note when sampling using an external clock• The clock signal must be continuous. No burst signal is allowed.• If the frequency of the clock signal is out of specification, a warning message
“External Clock too slow” or “External Clock too fast” will be displayed at the topof the screen. When the internal clock is switched to the external clock, nowaveforms will be displayed until the clock conforms to the specifications.
• Only real-time sampling mode is available.• Envelope mode cannot be set.• Display of waveforms is not possible in roll mode.• No function to divide the clock signal is available.• Since the time axis setting cannot be changed, expand the time axis if you want
to change the display range. For a description of expanding waveforms, refer topage 7-4.
• Trigger delay setting is invalidated.• The time measured by the cursor measurement or automated measurement
function is expressed in the number of pulses of the clock signal. No unit isdisplayed.
5.7 Selecting the Timebase
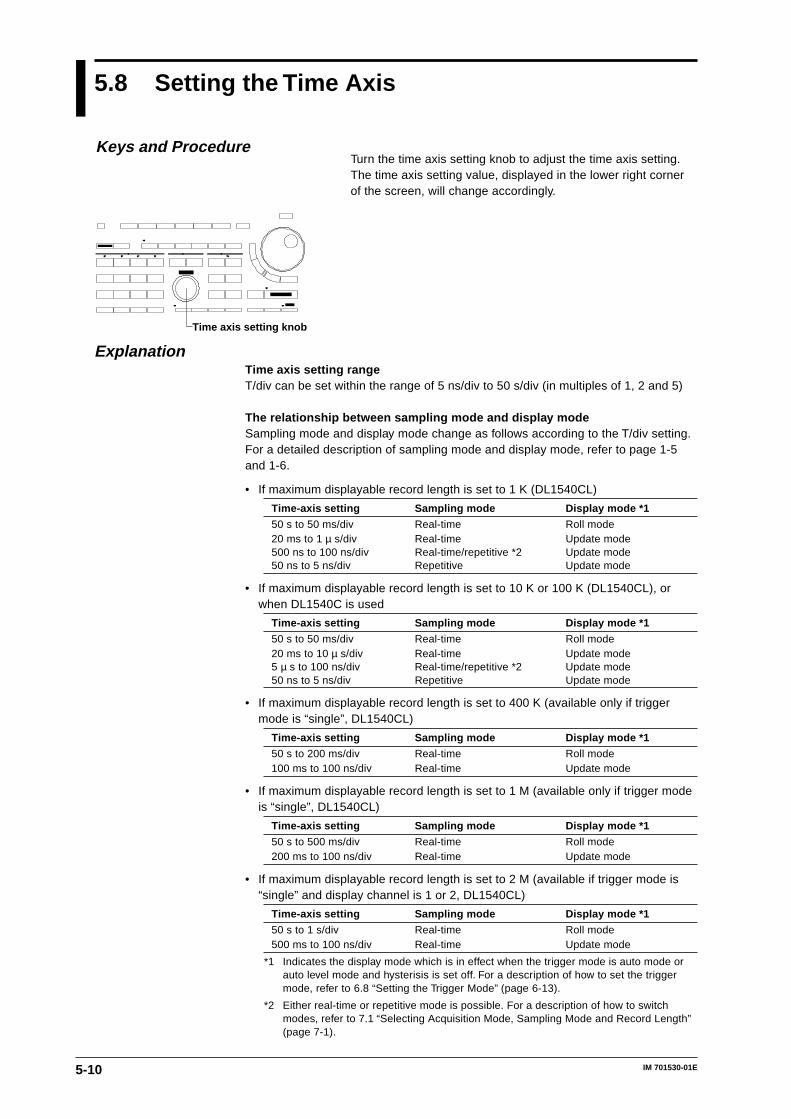
5-10 IM 701530-01E
5.8 Setting the Time Axis
Turn the time axis setting knob to adjust the time axis setting.The time axis setting value, displayed in the lower right cornerof the screen, will change accordingly.
ExplanationTime axis setting rangeT/div can be set within the range of 5 ns/div to 50 s/div (in multiples of 1, 2 and 5)
The relationship between sampling mode and display modeSampling mode and display mode change as follows according to the T/div setting.For a detailed description of sampling mode and display mode, refer to page 1-5and 1-6.
• If maximum displayable record length is set to 1 K (DL1540CL)
Time-axis setting Sampling mode Display mode *1
50 s to 50 ms/div Real-time Roll mode20 ms to 1 µ s/div Real-time Update mode500 ns to 100 ns/div Real-time/repetitive *2 Update mode50 ns to 5 ns/div Repetitive Update mode
• If maximum displayable record length is set to 10 K or 100 K (DL1540CL), orwhen DL1540C is used
Time-axis setting Sampling mode Display mode *1
50 s to 50 ms/div Real-time Roll mode20 ms to 10 µ s/div Real-time Update mode5 µ s to 100 ns/div Real-time/repetitive *2 Update mode50 ns to 5 ns/div Repetitive Update mode
• If maximum displayable record length is set to 400 K (available only if triggermode is “single”, DL1540CL)
Time-axis setting Sampling mode Display mode *1
50 s to 200 ms/div Real-time Roll mode100 ms to 100 ns/div Real-time Update mode
• If maximum displayable record length is set to 1 M (available only if trigger modeis “single”, DL1540CL)
Time-axis setting Sampling mode Display mode *1
50 s to 500 ms/div Real-time Roll mode200 ms to 100 ns/div Real-time Update mode
• If maximum displayable record length is set to 2 M (available if trigger mode is“single” and display channel is 1 or 2, DL1540CL)
Time-axis setting Sampling mode Display mode *1
50 s to 1 s/div Real-time Roll mode500 ms to 100 ns/div Real-time Update mode
*1 Indicates the display mode which is in effect when the trigger mode is auto mode orauto level mode and hysterisis is set off. For a description of how to set the triggermode, refer to 6.8 “Setting the Trigger Mode” (page 6-13).
*2 Either real-time or repetitive mode is possible. For a description of how to switchmodes, refer to 7.1 “Selecting Acquisition Mode, Sampling Mode and Record Length”(page 7-1).
Keys and Procedure
Time axis setting knob
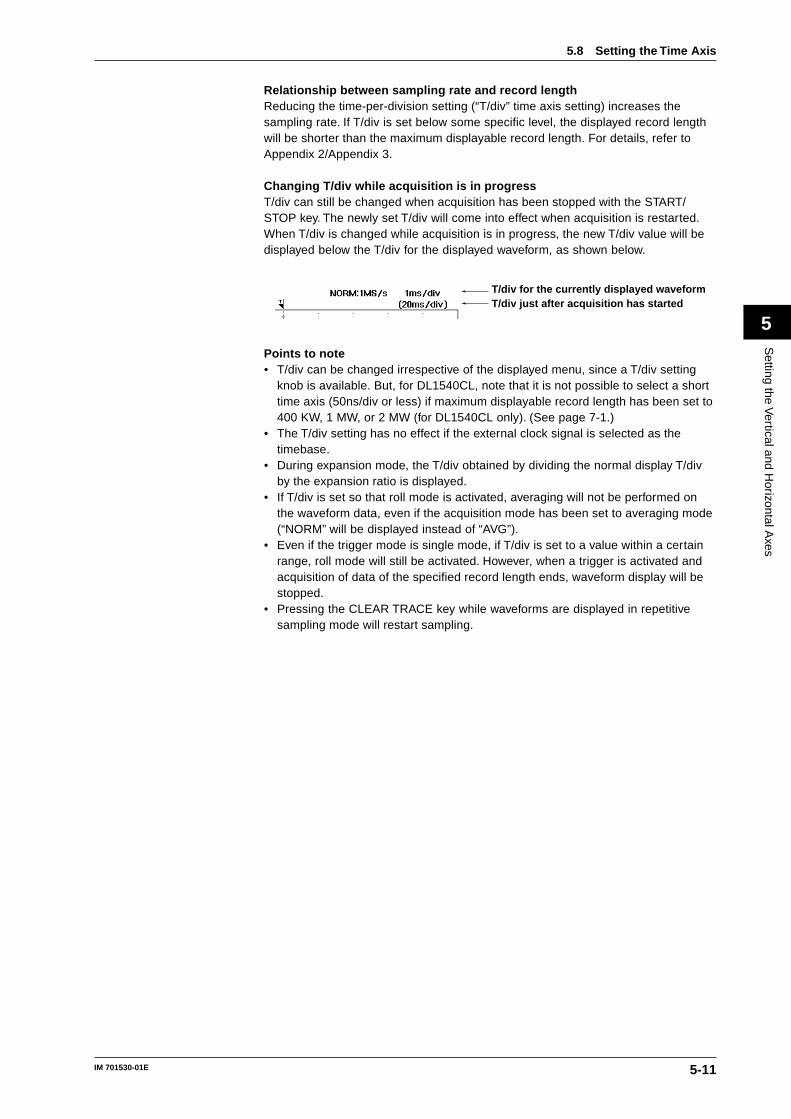
5-11IM 701530-01E
Setting the V
ertical and Horizontal A
xes
5
Relationship between sampling rate and record lengthReducing the time-per-division setting (“T/div” time axis setting) increases thesampling rate. If T/div is set below some specific level, the displayed record lengthwill be shorter than the maximum displayable record length. For details, refer toAppendix 2/Appendix 3.
Changing T/div while acquisition is in progressT/div can still be changed when acquisition has been stopped with the START/STOP key. The newly set T/div will come into effect when acquisition is restarted.When T/div is changed while acquisition is in progress, the new T/div value will bedisplayed below the T/div for the displayed waveform, as shown below.
T/div for the currently displayed waveformT/div just after acquisition has started
Points to note• T/div can be changed irrespective of the displayed menu, since a T/div setting
knob is available. But, for DL1540CL, note that it is not possible to select a shorttime axis (50ns/div or less) if maximum displayable record length has been set to400 KW, 1 MW, or 2 MW (for DL1540CL only). (See page 7-1.)
• The T/div setting has no effect if the external clock signal is selected as thetimebase.
• During expansion mode, the T/div obtained by dividing the normal display T/divby the expansion ratio is displayed.
• If T/div is set so that roll mode is activated, averaging will not be performed onthe waveform data, even if the acquisition mode has been set to averaging mode(“NORM” will be displayed instead of “AVG”).
• Even if the trigger mode is single mode, if T/div is set to a value within a certainrange, roll mode will still be activated. However, when a trigger is activated andacquisition of data of the specified record length ends, waveform display will bestopped.
• Pressing the CLEAR TRACE key while waveforms are displayed in repetitivesampling mode will restart sampling.
5.8 Setting the Time Axis
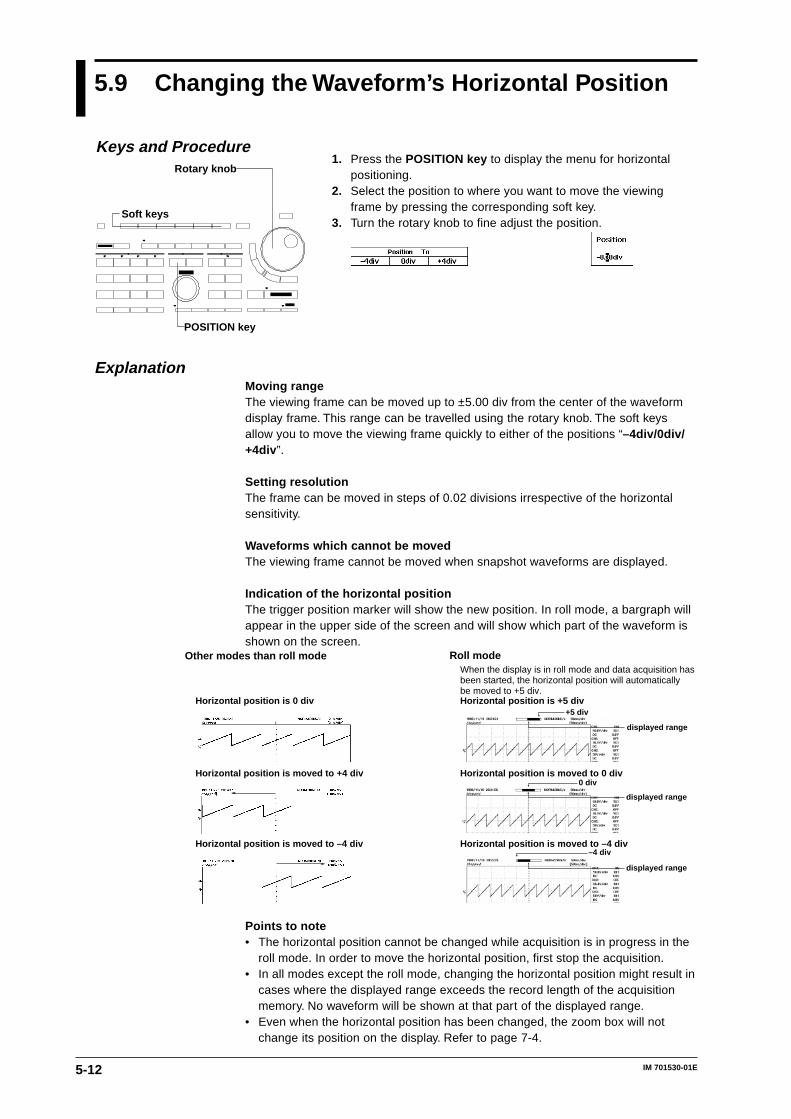
5-12 IM 701530-01E
5.9 Changing the Waveform’s Horizontal Position
1. Press the POSITION key to display the menu for horizontalpositioning.
2. Select the position to where you want to move the viewingframe by pressing the corresponding soft key.
3. Turn the rotary knob to fine adjust the position.
ExplanationMoving rangeThe viewing frame can be moved up to ±5.00 div from the center of the waveformdisplay frame. This range can be travelled using the rotary knob. The soft keysallow you to move the viewing frame quickly to either of the positions “–4div/0div/+4div ”.
Setting resolutionThe frame can be moved in steps of 0.02 divisions irrespective of the horizontalsensitivity.
Waveforms which cannot be movedThe viewing frame cannot be moved when snapshot waveforms are displayed.
Indication of the horizontal positionThe trigger position marker will show the new position. In roll mode, a bargraph willappear in the upper side of the screen and will show which part of the waveform isshown on the screen.
Other modes than roll mode
Horizontal position is 0 div
Horizontal position is moved to +4 div
Horizontal position is moved to –4 div
Roll mode
Horizontal position is +5 div
Horizontal position is moved to 0 div
Horizontal position is moved to –4 div
+5 div
0 div
–4 div
When the display is in roll mode and data acquisition has been started, the horizontal position will automaticallybe moved to +5 div.
displayed range
displayed range
displayed range
Points to note• The horizontal position cannot be changed while acquisition is in progress in the
roll mode. In order to move the horizontal position, first stop the acquisition.• In all modes except the roll mode, changing the horizontal position might result in
cases where the displayed range exceeds the record length of the acquisitionmemory. No waveform will be shown at that part of the displayed range.
• Even when the horizontal position has been changed, the zoom box will notchange its position on the display. Refer to page 7-4.
Keys and Procedure
POSITION key
Rotary knob
Soft keys
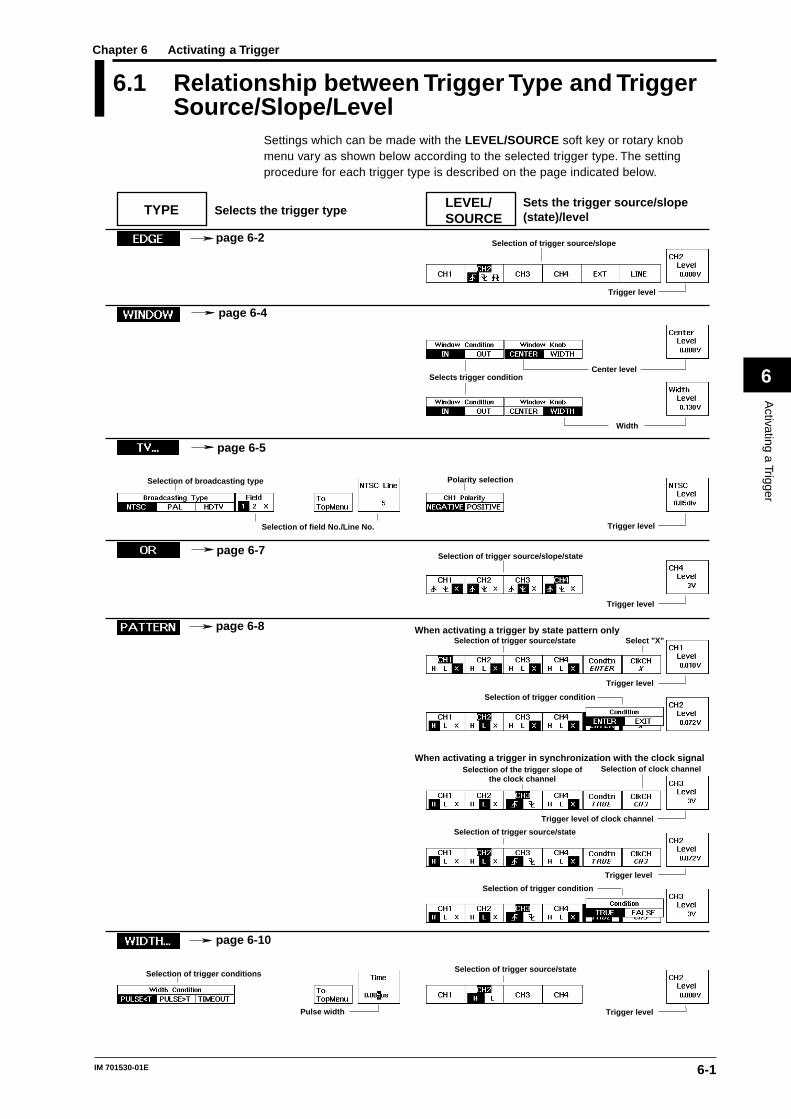
6-1IM 701530-01E
Activating a Trigger
6
6.1 Relationship between Trigger Type and TriggerSource/Slope/Level
Settings which can be made with the LEVEL/SOURCE soft key or rotary knobmenu vary as shown below according to the selected trigger type. The settingprocedure for each trigger type is described on the page indicated below.
TYPE LEVEL/SOURCE
Selects the trigger typeSets the trigger source/slope(state)/level
page 6-10
page 6-8
page 6-7
page 6-5
page 6-4
page 6-2 Selection of trigger source/slope
Trigger level
Selects trigger conditionCenter level
Width
Selection of broadcasting type
Selection of field No./Line No.
Polarity selection
Trigger level
Selection of trigger source/slope/state
Trigger level
When activating a trigger by state pattern only
When activating a trigger in synchronization with the clock signal
Selection of trigger source/state
Trigger level
Select "X"
Selection of trigger condition
Selection of trigger source/state
Selection of trigger condition
Trigger level
Trigger level of clock channel
Selection of clock channelSelection of the trigger slope ofthe clock channel
Selection of trigger conditions
Pulse width
Selection of trigger source/state
Trigger level
Chapter 6 Activating a Trigger
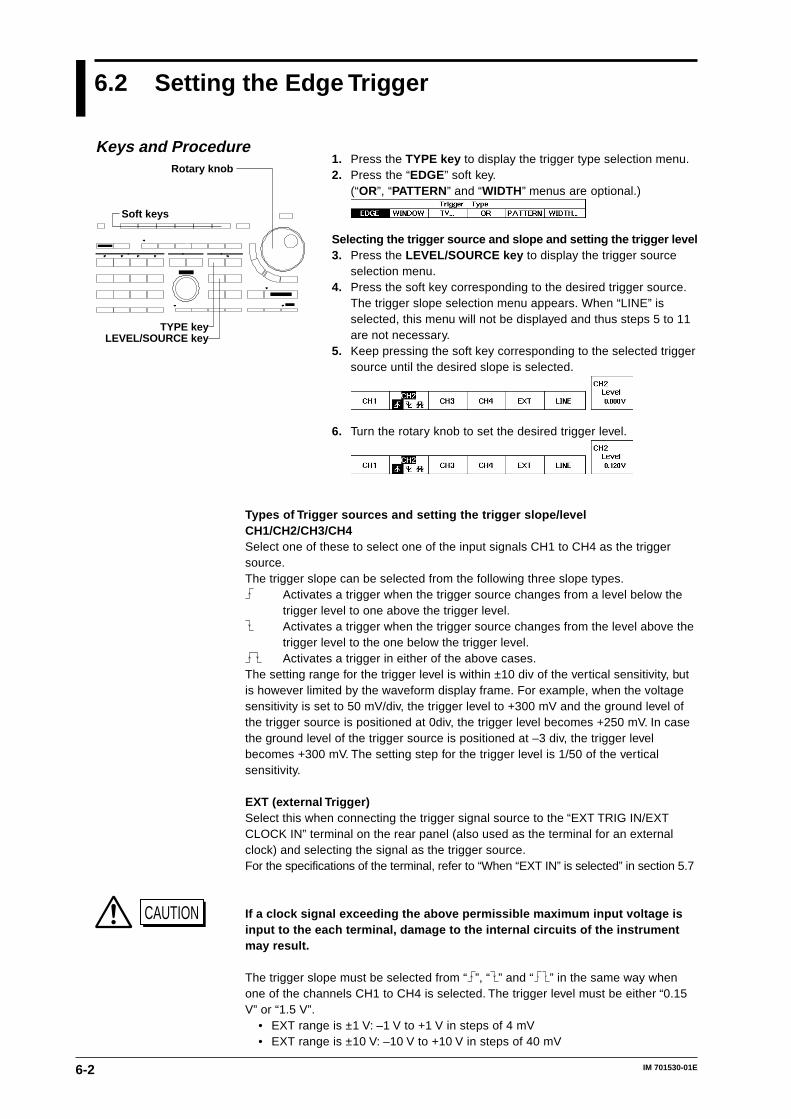
6-2 IM 701530-01E
6.2 Setting the Edge Trigger
1. Press the TYPE key to display the trigger type selection menu.2. Press the “EDGE” soft key.
(“OR”, “PATTERN” and “WIDTH” menus are optional.)
Selecting the trigger source and slope and setting the trigger level3. Press the LEVEL/SOURCE key to display the trigger source
selection menu.4. Press the soft key corresponding to the desired trigger source.
The trigger slope selection menu appears. When “LINE” isselected, this menu will not be displayed and thus steps 5 to 11are not necessary.
5. Keep pressing the soft key corresponding to the selected triggersource until the desired slope is selected.
6. Turn the rotary knob to set the desired trigger level.
Types of Trigger sources and setting the trigger slope/levelCH1/CH2/CH3/CH4Select one of these to select one of the input signals CH1 to CH4 as the triggersource.The trigger slope can be selected from the following three slope types.
Activates a trigger when the trigger source changes from a level below thetrigger level to one above the trigger level.Activates a trigger when the trigger source changes from the level above thetrigger level to the one below the trigger level.Activates a trigger in either of the above cases.
The setting range for the trigger level is within ±10 div of the vertical sensitivity, butis however limited by the waveform display frame. For example, when the voltagesensitivity is set to 50 mV/div, the trigger level to +300 mV and the ground level ofthe trigger source is positioned at 0div, the trigger level becomes +250 mV. In casethe ground level of the trigger source is positioned at –3 div, the trigger levelbecomes +300 mV. The setting step for the trigger level is 1/50 of the verticalsensitivity.
EXT (external Trigger)Select this when connecting the trigger signal source to the “EXT TRIG IN/EXTCLOCK IN” terminal on the rear panel (also used as the terminal for an externalclock) and selecting the signal as the trigger source.For the specifications of the terminal, refer to “When “EXT IN” is selected” in section 5.7
CAUTION If a clock signal exceeding the above permissible maximum input voltage isinput to the each terminal, damage to the internal circuits of the instrumentmay result.
The trigger slope must be selected from “ ”, “ ” and “ ” in the same way whenone of the channels CH1 to CH4 is selected. The trigger level must be either “0.15V” or “1.5 V”.
• EXT range is ±1 V: –1 V to +1 V in steps of 4 mV• EXT range is ±10 V: –10 V to +10 V in steps of 40 mV
Keys and Procedure
TYPE key
Rotary knob
Soft keys
LEVEL/SOURCE key

6-3IM 701530-01E
Activating a Trigger
6
LINE (Line trigger)Select this when the signal to be displayed is synchronized with the frequency ofthe commercial power source (50 Hz /60 Hz) and you want to select the commercialpower source voltage signal as the trigger source signal.
Points to note when setting the edge trigger• If the trigger type setting is changed, the edge trigger setting will be invalidated.
However, selecting the edge trigger will restore the previous edge trigger setting.• If the trigger mode is not auto-level mode, the trigger level will not change once it
has been set. Thus, changing the amplitude of the trigger signal or changing theoffset may invalidate the trigger level, thereby hindering activation of a trigger.Conversely, if the trigger mode is auto-level mode, the median of the amplitude ofthe trigger signal is detected and the trigger level is set to the median valueautomatically if the trigger level is invalidated. For a detailed description, refer to6.8 “Setting the Trigger Mode” (page 6-13).
NoteIf the trigger slope is set to “up/down ”, no trigger can be activated either at “rise ” or “fall ”.In this case, try to set an appropriate hold-off time. This may cause a trigger to be activated. Fora description of how to set the hold-off time, refer to page 6-20.
6.2 Setting the Edge Trigger
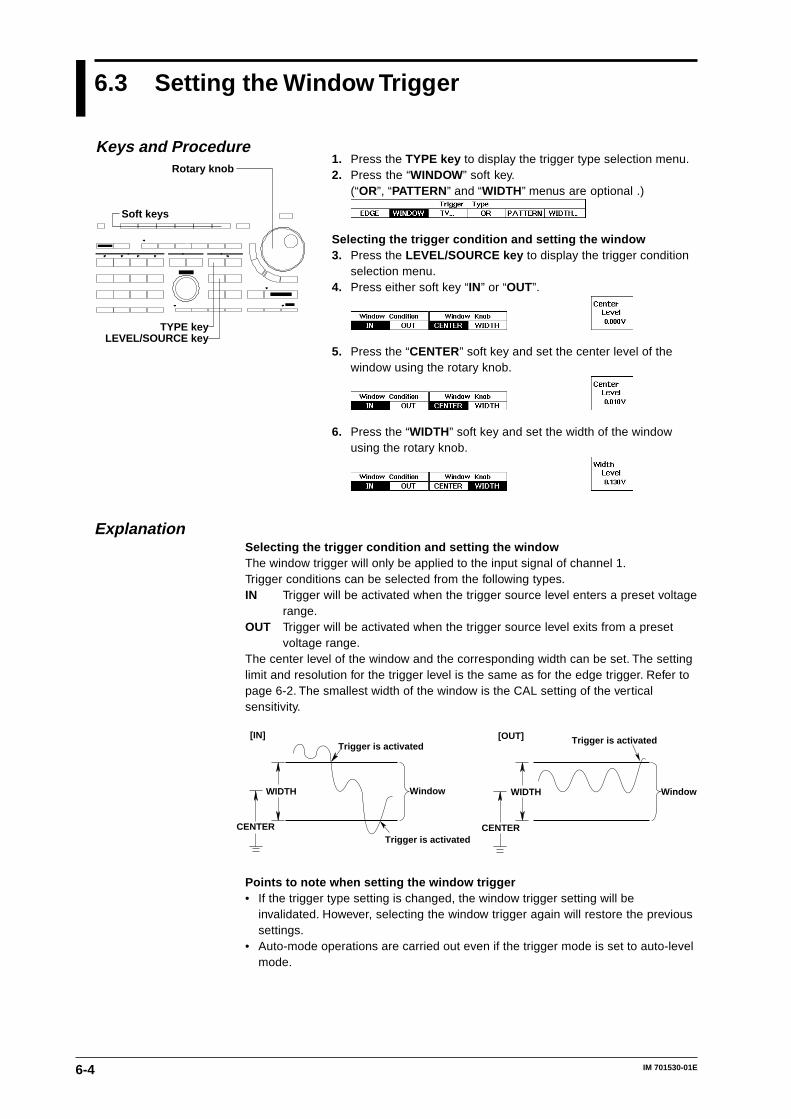
6-4 IM 701530-01E
6.3 Setting the Window Trigger
1. Press the TYPE key to display the trigger type selection menu.2. Press the “WINDOW” soft key.
(“OR”, “PATTERN” and “WIDTH” menus are optional .)
Selecting the trigger condition and setting the window3. Press the LEVEL/SOURCE key to display the trigger condition
selection menu.4. Press either soft key “IN” or “OUT”.
5. Press the “CENTER” soft key and set the center level of thewindow using the rotary knob.
6. Press the “WIDTH” soft key and set the width of the windowusing the rotary knob.
ExplanationSelecting the trigger condition and setting the windowThe window trigger will only be applied to the input signal of channel 1.Trigger conditions can be selected from the following types.IN Trigger will be activated when the trigger source level enters a preset voltage
range.OUT Trigger will be activated when the trigger source level exits from a preset
voltage range.The center level of the window and the corresponding width can be set. The settinglimit and resolution for the trigger level is the same as for the edge trigger. Refer topage 6-2. The smallest width of the window is the CAL setting of the verticalsensitivity.
WIDTH
Trigger is activated[OUT]Trigger is activated
[IN]
Window Window
Trigger is activatedCENTER
WIDTH
CENTER
Points to note when setting the window trigger• If the trigger type setting is changed, the window trigger setting will be
invalidated. However, selecting the window trigger again will restore the previoussettings.
• Auto-mode operations are carried out even if the trigger mode is set to auto-levelmode.
Keys and Procedure
TYPE key
Rotary knob
Soft keys
LEVEL/SOURCE key
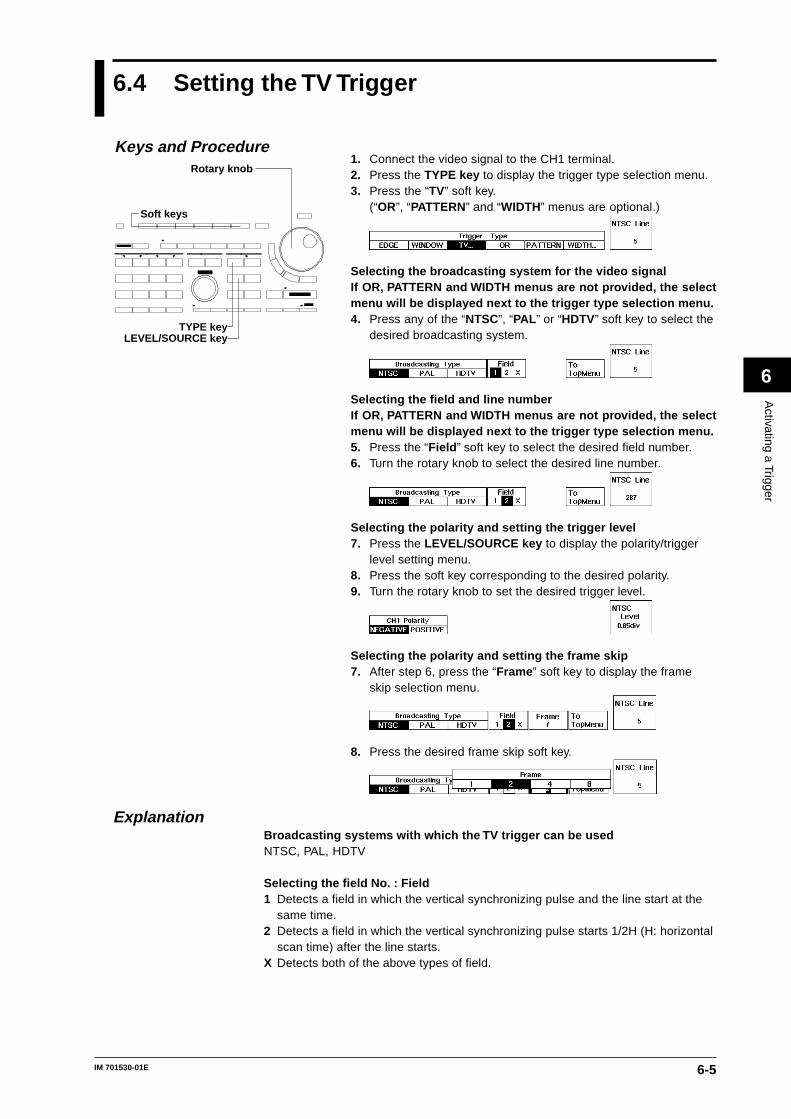
6-5IM 701530-01E
Activating a Trigger
6
6.4 Setting the TV Trigger
1. Connect the video signal to the CH1 terminal.2. Press the TYPE key to display the trigger type selection menu.3. Press the “TV” soft key.
(“OR”, “PATTERN” and “WIDTH” menus are optional.)
Selecting the broadcasting system for the video signalIf OR, PATTERN and WIDTH menus are not provided, the selectmenu will be displayed next to the trigger type selection menu.4. Press any of the “NTSC”, “PAL ” or “HDTV” soft key to select the
desired broadcasting system.
Selecting the field and line numberIf OR, PATTERN and WIDTH menus are not provided, the selectmenu will be displayed next to the trigger type selection menu.5. Press the “Field ” soft key to select the desired field number.6. Turn the rotary knob to select the desired line number.
Selecting the polarity and setting the trigger level7. Press the LEVEL/SOURCE key to display the polarity/trigger
level setting menu.8. Press the soft key corresponding to the desired polarity.9. Turn the rotary knob to set the desired trigger level.
Selecting the polarity and setting the frame skip7. After step 6, press the “Frame ” soft key to display the frame
skip selection menu.
8. Press the desired frame skip soft key.
ExplanationBroadcasting systems with which the TV trigger can be usedNTSC, PAL, HDTV
Selecting the field No. : Field1 Detects a field in which the vertical synchronizing pulse and the line start at the
same time.2 Detects a field in which the vertical synchronizing pulse starts 1/2H (H: horizontal
scan time) after the line starts.X Detects both of the above types of field.
Keys and Procedure
TYPE key
Rotary knob
Soft keys
LEVEL/SOURCE key
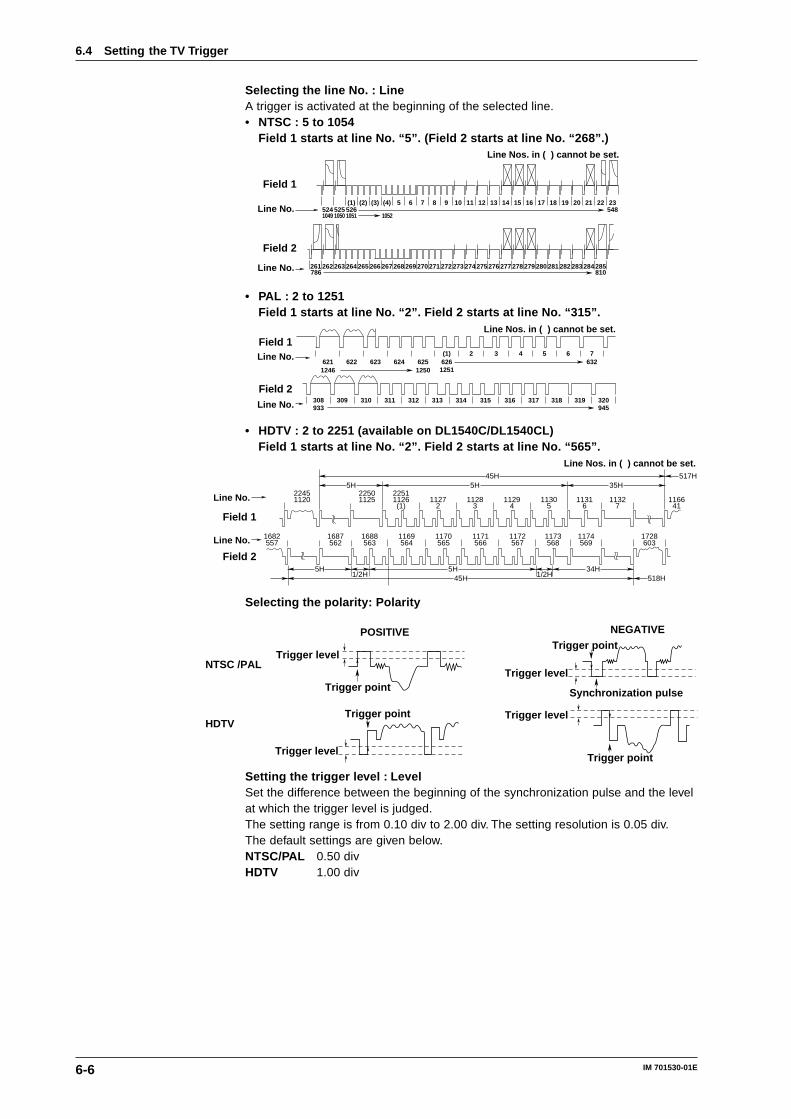
6-6 IM 701530-01E
Selecting the line No. : LineA trigger is activated at the beginning of the selected line.• NTSC : 5 to 1054
Field 1 starts at line No. “5”. (Field 2 starts at line No. “268”.)
524 525(1) (2) (3) (4) 5 6 7 8 9 10 11 12 13 14 15 16 17 18 19 20 21 22 23
Field 1
262 263 264 265 266 267 268 269 270 271 272 273 274 275 276 277 278 279 280 281 282 283 284 285
Field 2
261
Line No.
Line No.
1049 1050526 5481051 1052
786 810
Line Nos. in ( ) cannot be set.
• PAL : 2 to 1251Field 1 starts at line No. “2”. Field 2 starts at line No. “315”.
621 622 623 624 6252 3 4 5 6 7(1)
Field 1
308 309 310 311 312 313 315314 316 318317 320319
Field 2
Line No.1246 1250
6326261251
Line No. 933 945
Line Nos. in ( ) cannot be set.
• HDTV : 2 to 2251 (available on DL1540C/DL1540CL)Field 1 starts at line No. “2”. Field 2 starts at line No. “565”.
1120 1125(1) 2 3 4 5 6 7 41
5H 5H 35H517H45H
557 562 563 564 565 566 567 568 569 603
5H 5H 34H518H45H1/2H 1/2H
Field 1
Field 2
Line No. 2245 22501126 1127 1128 1129 1130 1131 1132 11662251
Line No. 1682 1687 1688 1169 1170 1171 1172 1173 1174 1728
Line Nos. in ( ) cannot be set.
Selecting the polarity: Polarity
Trigger point
Trigger levelNTSC /PAL
HDTV
Trigger point
Synchronization pulse
Trigger level
NEGATIVEPOSITIVE
Trigger point
Trigger levelTrigger point
Trigger level
Setting the trigger level : LevelSet the difference between the beginning of the synchronization pulse and the levelat which the trigger level is judged.The setting range is from 0.10 div to 2.00 div. The setting resolution is 0.05 div.The default settings are given below.NTSC/PAL 0.50 divHDTV 1.00 div
6.4 Setting the TV Trigger
6-7IM 701530-01E
Activating a Trigger
6
Setting frame skip: FrameThis is a function for skipping frames when the color burst is inverted on everyframe. You can select how many frames to skip from the following choices.Frame1 : Trigger every frame at the specified field.Frame2 : Trigger every two frames at the specified field.Frame4 : Trigger every four frames at the specified field.Frame8 : Trigger every eight frames at the specified field.However, the frame skip function can be used only for the following cases. For allother frame periods, set “HoldOff.”• NTSC with 60-Hz frame period• PAL with 50-Hz frame period• HDTV with 60-Hz frame period
Note• Frames will not be skipped, if you change the “HoldOff” setting after setting the frame skip
function. If you wish to trigger using the frame skip function, make the Frame selection again.• If you select Frame4 or Frame8, the trigger mode is automatically changed to normal mode.
However, if the “ACQ Hold” of the INPUT key is ON, the trigger mode is not changedautomatically. In this case, change the trigger mode to normal mode before using the frameskip function.
Points to note when activating a TV trigger• If the trigger type setting is changed, the TV trigger setting will be invalidated.
However, selecting the TV trigger again will restore the previous settings.• Only channel 1 can be used for the video signal. Other channels cannot be used.• For a TV trigger, the trigger coupling, HF rejection and trigger hysteresis settings
are ignored.
6.4 Setting the TV Trigger
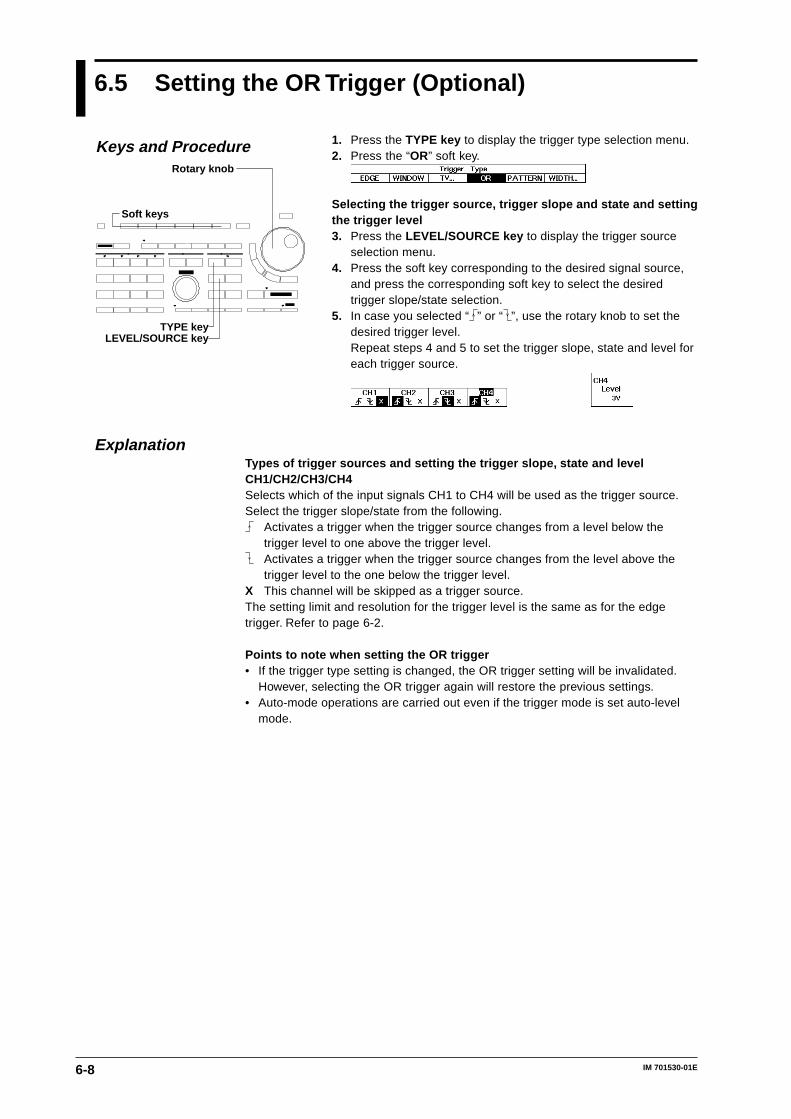
6-8 IM 701530-01E
6.5 Setting the OR Trigger (Optional)
1. Press the TYPE key to display the trigger type selection menu.2. Press the “OR” soft key.
Selecting the trigger source, trigger slope and state and settingthe trigger level3. Press the LEVEL/SOURCE key to display the trigger source
selection menu.4. Press the soft key corresponding to the desired signal source,
and press the corresponding soft key to select the desiredtrigger slope/state selection.
5. In case you selected “ ” or “ ”, use the rotary knob to set thedesired trigger level.Repeat steps 4 and 5 to set the trigger slope, state and level foreach trigger source.
ExplanationTypes of trigger sources and setting the trigger slope, state and levelCH1/CH2/CH3/CH4Selects which of the input signals CH1 to CH4 will be used as the trigger source.Select the trigger slope/state from the following.
Activates a trigger when the trigger source changes from a level below thetrigger level to one above the trigger level.Activates a trigger when the trigger source changes from the level above thetrigger level to the one below the trigger level.
X This channel will be skipped as a trigger source.The setting limit and resolution for the trigger level is the same as for the edgetrigger. Refer to page 6-2.
Points to note when setting the OR trigger• If the trigger type setting is changed, the OR trigger setting will be invalidated.
However, selecting the OR trigger again will restore the previous settings.• Auto-mode operations are carried out even if the trigger mode is set auto-level
mode.
Keys and Procedure
TYPE key
Rotary knob
Soft keys
LEVEL/SOURCE key
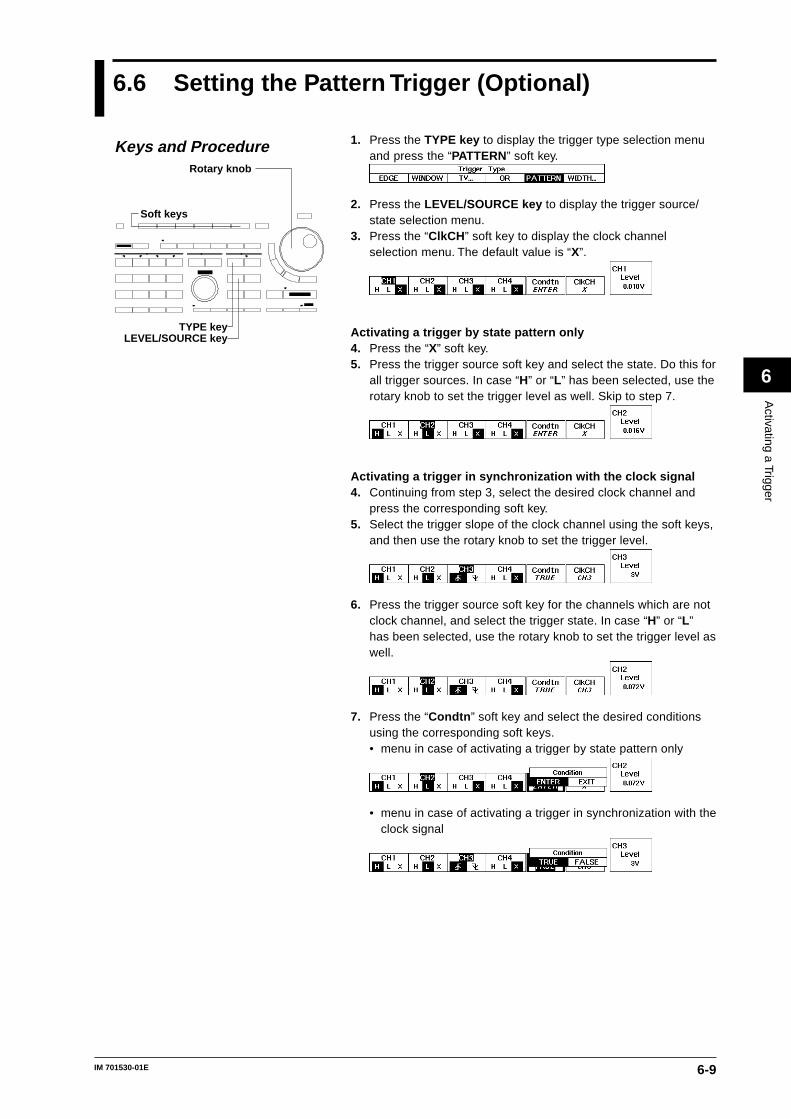
6-9IM 701530-01E
Activating a Trigger
6
6.6 Setting the Pattern Trigger (Optional)
1. Press the TYPE key to display the trigger type selection menuand press the “PATTERN” soft key.
2. Press the LEVEL/SOURCE key to display the trigger source/state selection menu.
3. Press the “ClkCH ” soft key to display the clock channelselection menu. The default value is “X”.
Activating a trigger by state pattern only4. Press the “X” soft key.5. Press the trigger source soft key and select the state. Do this for
all trigger sources. In case “H” or “L” has been selected, use therotary knob to set the trigger level as well. Skip to step 7.
Activating a trigger in synchronization with the clock signal4. Continuing from step 3, select the desired clock channel and
press the corresponding soft key.5. Select the trigger slope of the clock channel using the soft keys,
and then use the rotary knob to set the trigger level.
6. Press the trigger source soft key for the channels which are notclock channel, and select the trigger state. In case “H” or “L”has been selected, use the rotary knob to set the trigger level aswell.
7. Press the “Condtn ” soft key and select the desired conditionsusing the corresponding soft keys.• menu in case of activating a trigger by state pattern only
• menu in case of activating a trigger in synchronization with theclock signal
Keys and Procedure
TYPE key
Rotary knob
Soft keys
LEVEL/SOURCE key
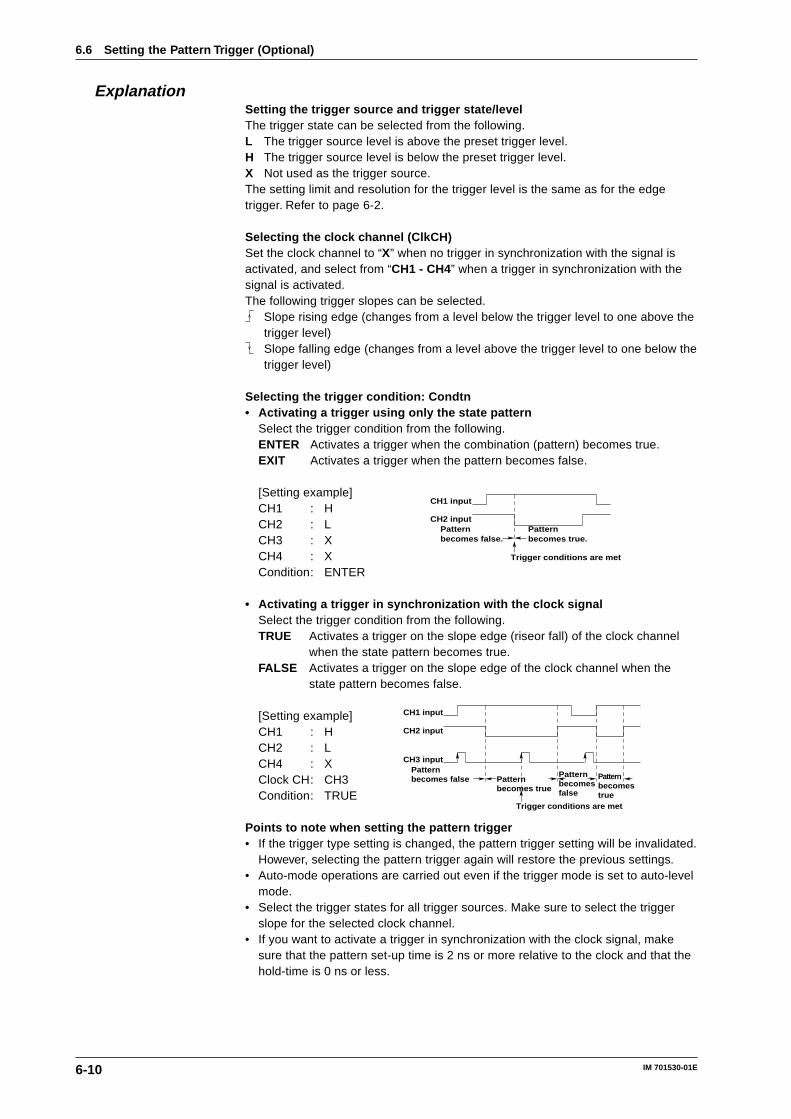
6-10 IM 701530-01E
ExplanationSetting the trigger source and trigger state/levelThe trigger state can be selected from the following.L The trigger source level is above the preset trigger level.H The trigger source level is below the preset trigger level.X Not used as the trigger source.The setting limit and resolution for the trigger level is the same as for the edgetrigger. Refer to page 6-2.
Selecting the clock channel (ClkCH)Set the clock channel to “X” when no trigger in synchronization with the signal isactivated, and select from “CH1 - CH4” when a trigger in synchronization with thesignal is activated.The following trigger slopes can be selected.
Slope rising edge (changes from a level below the trigger level to one above thetrigger level)Slope falling edge (changes from a level above the trigger level to one below thetrigger level)
Selecting the trigger condition: Condtn• Activating a trigger using only the state pattern
Select the trigger condition from the following.ENTER Activates a trigger when the combination (pattern) becomes true.EXIT Activates a trigger when the pattern becomes false.
[Setting example]CH1 : HCH2 : LCH3 : XCH4 : XCondition: ENTER
• Activating a trigger in synchronization with the clock signalSelect the trigger condition from the following.TRUE Activates a trigger on the slope edge (riseor fall) of the clock channel
when the state pattern becomes true.FALSE Activates a trigger on the slope edge of the clock channel when the
state pattern becomes false.
[Setting example]CH1 : HCH2 : LCH4 : XClock CH: CH3Condition: TRUE
Points to note when setting the pattern trigger• If the trigger type setting is changed, the pattern trigger setting will be invalidated.
However, selecting the pattern trigger again will restore the previous settings.• Auto-mode operations are carried out even if the trigger mode is set to auto-level
mode.• Select the trigger states for all trigger sources. Make sure to select the trigger
slope for the selected clock channel.• If you want to activate a trigger in synchronization with the clock signal, make
sure that the pattern set-up time is 2 ns or more relative to the clock and that thehold-time is 0 ns or less.
6.6 Setting the Pattern Trigger (Optional)
CH1 input
CH2 inputPatternbecomes false.
Patternbecomes true.
Trigger conditions are met
CH1 input
CH2 input
Patternbecomes false Pattern
becomes true
Trigger conditions are met
Patternbecomesfalse
Patternbecomes true
CH3 input
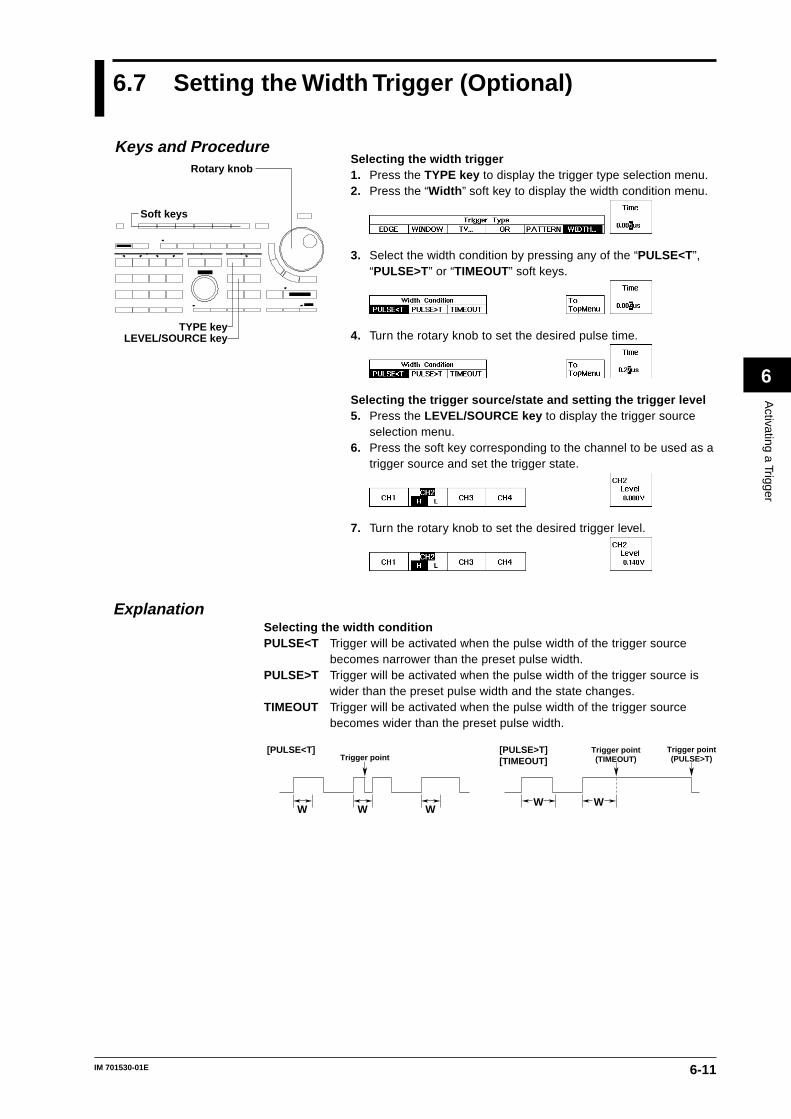
6-11IM 701530-01E
Activating a Trigger
6
6.7 Setting the Width Trigger (Optional)
Selecting the width trigger1. Press the TYPE key to display the trigger type selection menu.2. Press the “Width ” soft key to display the width condition menu.
3. Select the width condition by pressing any of the “PULSE<T”,“PULSE>T” or “TIMEOUT” soft keys.
4. Turn the rotary knob to set the desired pulse time.
Selecting the trigger source/state and setting the trigger level5. Press the LEVEL/SOURCE key to display the trigger source
selection menu.6. Press the soft key corresponding to the channel to be used as a
trigger source and set the trigger state.
7. Turn the rotary knob to set the desired trigger level.
ExplanationSelecting the width conditionPULSE<T Trigger will be activated when the pulse width of the trigger source
becomes narrower than the preset pulse width.PULSE>T Trigger will be activated when the pulse width of the trigger source is
wider than the preset pulse width and the state changes.TIMEOUT Trigger will be activated when the pulse width of the trigger source
becomes wider than the preset pulse width.
W
Trigger point
WW
Trigger point(PULSE>T)
W W
[PULSE>T][TIMEOUT]
[PULSE<T] Trigger point(TIMEOUT)
Keys and Procedure
TYPE key
Rotary knob
Soft keys
LEVEL/SOURCE key
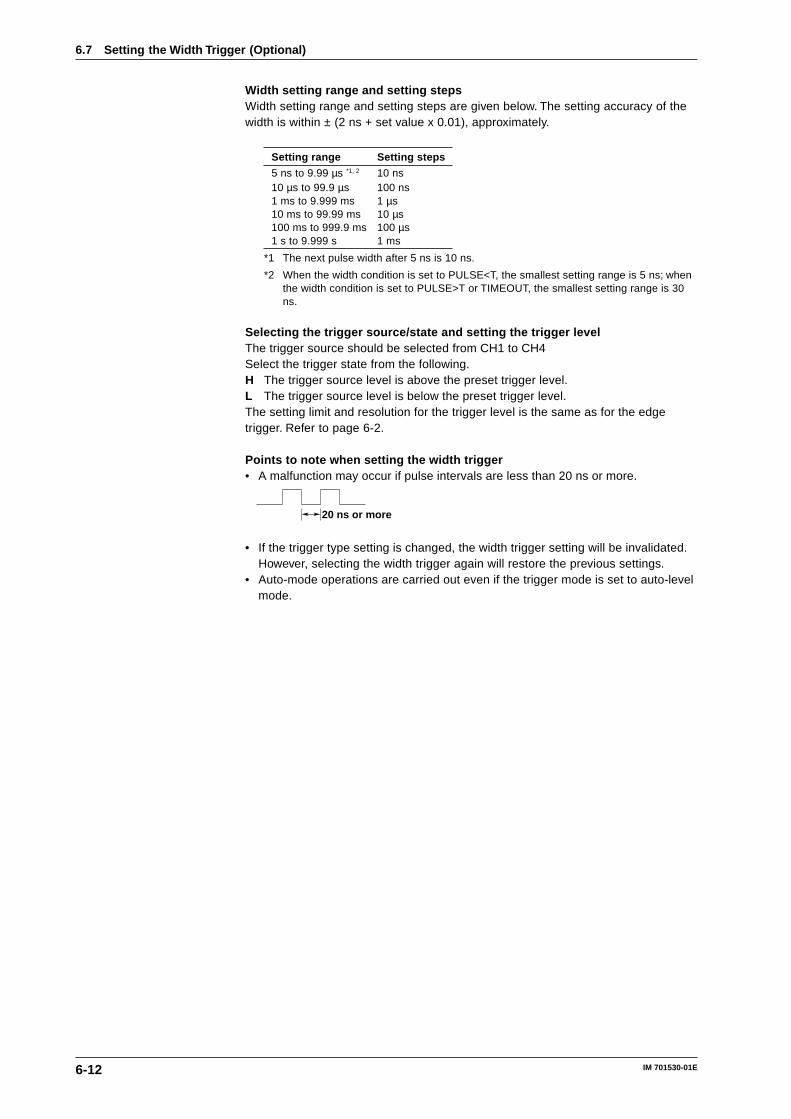
6-12 IM 701530-01E
Width setting range and setting stepsWidth setting range and setting steps are given below. The setting accuracy of thewidth is within ± (2 ns + set value x 0.01), approximately.
Setting range Setting steps
5 ns to 9.99 µs *1, 2 10 ns10 µs to 99.9 µs 100 ns1 ms to 9.999 ms 1 µs10 ms to 99.99 ms 10 µs100 ms to 999.9 ms 100 µs1 s to 9.999 s 1 ms
*1 The next pulse width after 5 ns is 10 ns.
*2 When the width condition is set to PULSE<T, the smallest setting range is 5 ns; whenthe width condition is set to PULSE>T or TIMEOUT, the smallest setting range is 30ns.
Selecting the trigger source/state and setting the trigger levelThe trigger source should be selected from CH1 to CH4Select the trigger state from the following.H The trigger source level is above the preset trigger level.L The trigger source level is below the preset trigger level.The setting limit and resolution for the trigger level is the same as for the edgetrigger. Refer to page 6-2.
Points to note when setting the width trigger• A malfunction may occur if pulse intervals are less than 20 ns or more.
20 ns or more
• If the trigger type setting is changed, the width trigger setting will be invalidated.However, selecting the width trigger again will restore the previous settings.
• Auto-mode operations are carried out even if the trigger mode is set to auto-levelmode.
6.7 Setting the Width Trigger (Optional)
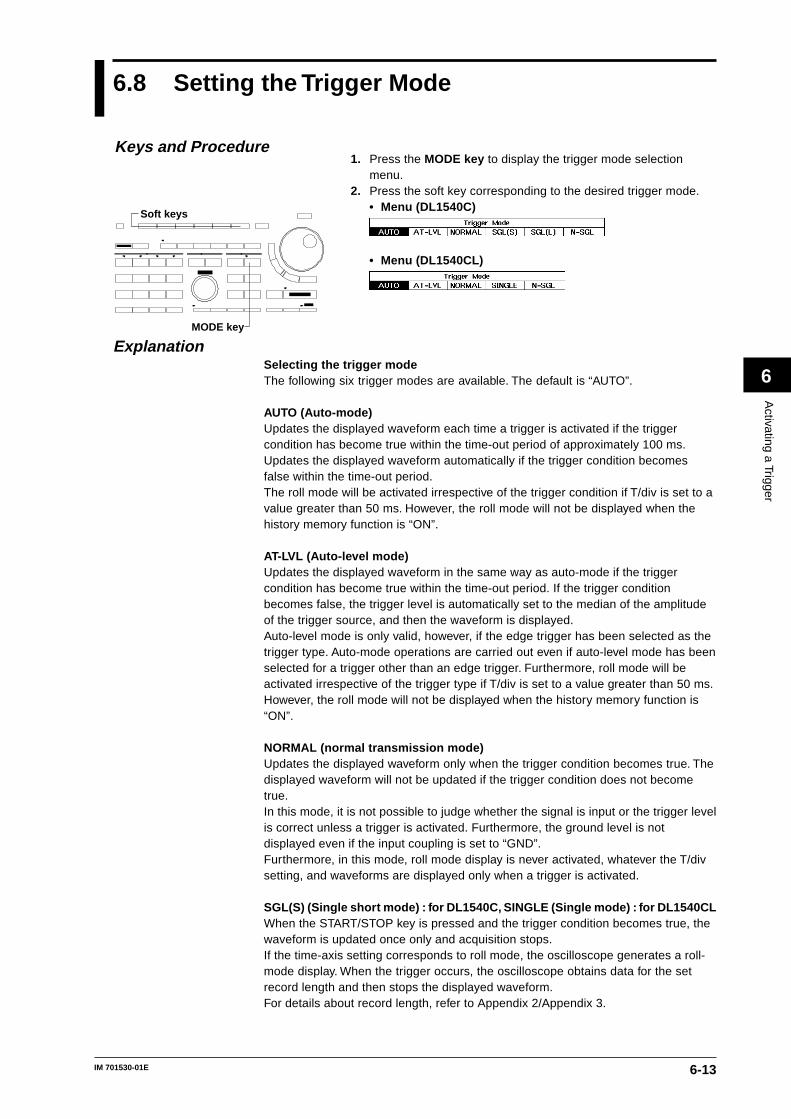
6-13IM 701530-01E
Activating a Trigger
6
6.8 Setting the Trigger Mode
1. Press the MODE key to display the trigger mode selectionmenu.
2. Press the soft key corresponding to the desired trigger mode.• Menu (DL1540C)
• Menu (DL1540CL)
ExplanationSelecting the trigger modeThe following six trigger modes are available. The default is “AUTO”.
AUTO (Auto-mode)Updates the displayed waveform each time a trigger is activated if the triggercondition has become true within the time-out period of approximately 100 ms.Updates the displayed waveform automatically if the trigger condition becomesfalse within the time-out period.The roll mode will be activated irrespective of the trigger condition if T/div is set to avalue greater than 50 ms. However, the roll mode will not be displayed when thehistory memory function is “ON”.
AT-LVL (Auto-level mode)Updates the displayed waveform in the same way as auto-mode if the triggercondition has become true within the time-out period. If the trigger conditionbecomes false, the trigger level is automatically set to the median of the amplitudeof the trigger source, and then the waveform is displayed.Auto-level mode is only valid, however, if the edge trigger has been selected as thetrigger type. Auto-mode operations are carried out even if auto-level mode has beenselected for a trigger other than an edge trigger. Furthermore, roll mode will beactivated irrespective of the trigger type if T/div is set to a value greater than 50 ms.However, the roll mode will not be displayed when the history memory function is“ON”.
NORMAL (normal transmission mode)Updates the displayed waveform only when the trigger condition becomes true. Thedisplayed waveform will not be updated if the trigger condition does not becometrue.In this mode, it is not possible to judge whether the signal is input or the trigger levelis correct unless a trigger is activated. Furthermore, the ground level is notdisplayed even if the input coupling is set to “GND”.Furthermore, in this mode, roll mode display is never activated, whatever the T/divsetting, and waveforms are displayed only when a trigger is activated.
SGL(S) (Single short mode) : for DL1540C, SINGLE (Single mode) : for DL1540CLWhen the START/STOP key is pressed and the trigger condition becomes true, thewaveform is updated once only and acquisition stops.If the time-axis setting corresponds to roll mode, the oscilloscope generates a roll-mode display. When the trigger occurs, the oscilloscope obtains data for the setrecord length and then stops the displayed waveform.For details about record length, refer to Appendix 2/Appendix 3.
Keys and Procedure
MODE key
Soft keys
6-14 IM 701530-01E
SGL(L) (Single long mode) : for DL1540CThis mode is the same as the aboved mentioned SGL(S) mode, except that therecord length here is longer. The maximum record length is 120 K words.For more details about the relation between time axis setting, sample rate andrecord length, refer to Appendix 2.
N-SGL (Single (N) mode)Each time the trigger condition becomes true after the START/STOP key has beenpressed, acquisition is performed the specified number of times. The waveforms willbe displayed after acquisition stops.If the START/STOP key is pressed again before acquisition has been completed thespecified number of times, acquisition stops immediately. In this case, all thewaveform data which has been acquired thus far is valid and can be displayed.This trigger mode can only be used in real time sampling mode.For setting the number of repetitions, refer to page 7-7.
Points to note when setting the trigger mode• If single short mode or single mode is selected with a T/div setting which enables
repetitive time sampling mode, acquisition will stop after it has been repeated thespecified number times.
• If trigger mode is changed while acquisition is stopped (i.e. while the STARTindicator is not lit), acquisition starts automatically.
• If acquisition is interrupted in single (N) mode, only the waveforms which havebeen acquired completely are displayed.
• If the history memory function is set ON or if the acquisition mode is set toaveraging, all single mode triggering cannot be done.
• If single long mode or single (N) mode is selected, repetitive sampling cannot bedone.
• When the record length (maximum displayable record length) is 400 K/1 MW/2MW for DL1540CL, single mode is the only mode available.
6.8 Setting the Trigger Mode
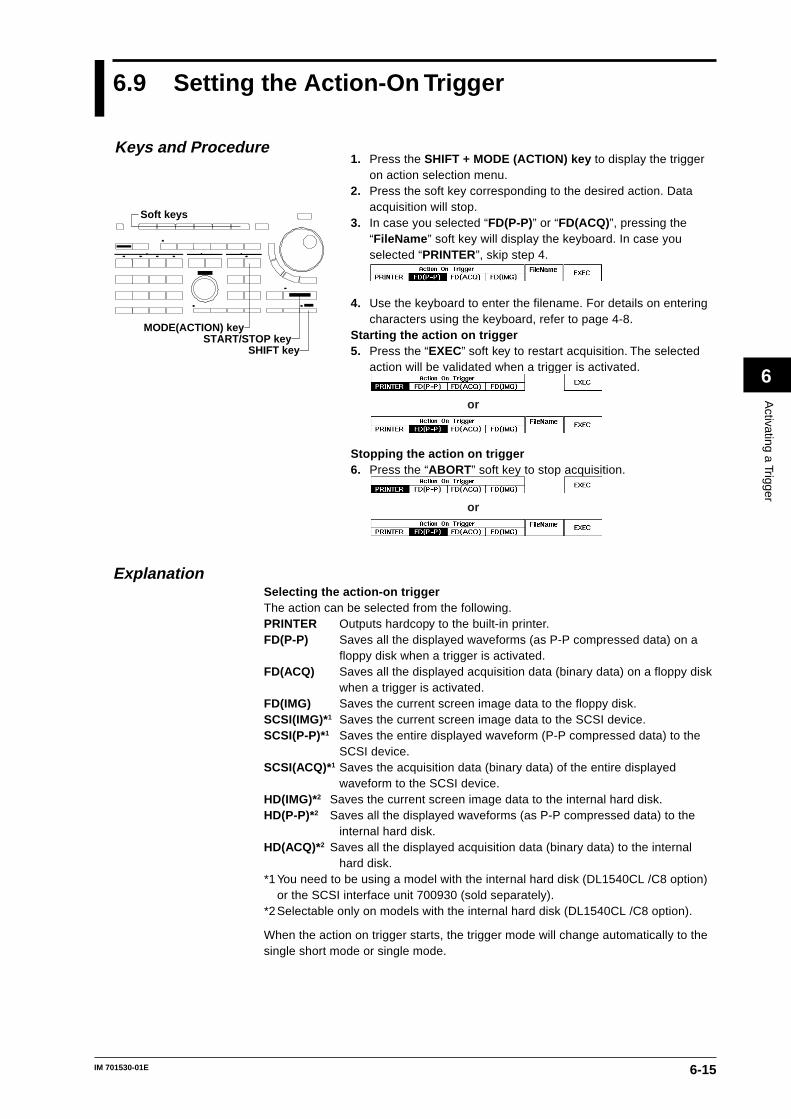
6-15IM 701530-01E
Activating a Trigger
6
6.9 Setting the Action-On Trigger
1. Press the SHIFT + MODE (ACTION) key to display the triggeron action selection menu.
2. Press the soft key corresponding to the desired action. Dataacquisition will stop.
3. In case you selected “FD(P-P)” or “FD(ACQ)”, pressing the“FileName ” soft key will display the keyboard. In case youselected “PRINTER”, skip step 4.
4. Use the keyboard to enter the filename. For details on enteringcharacters using the keyboard, refer to page 4-8.
Starting the action on trigger5. Press the “EXEC” soft key to restart acquisition. The selected
action will be validated when a trigger is activated.
or
Stopping the action on trigger6. Press the “ABORT ” soft key to stop acquisition.
or
ExplanationSelecting the action-on triggerThe action can be selected from the following.PRINTER Outputs hardcopy to the built-in printer.FD(P-P) Saves all the displayed waveforms (as P-P compressed data) on a
floppy disk when a trigger is activated.FD(ACQ) Saves all the displayed acquisition data (binary data) on a floppy disk
when a trigger is activated.FD(IMG) Saves the current screen image data to the floppy disk.SCSI(IMG)*1 Saves the current screen image data to the SCSI device.SCSI(P-P)*1 Saves the entire displayed waveform (P-P compressed data) to the
SCSI device.SCSI(ACQ)*1 Saves the acquisition data (binary data) of the entire displayed
waveform to the SCSI device.HD(IMG)*2 Saves the current screen image data to the internal hard disk.HD(P-P)*2 Saves all the displayed waveforms (as P-P compressed data) to the
internal hard disk.HD(ACQ)*2 Saves all the displayed acquisition data (binary data) to the internal
hard disk.*1You need to be using a model with the internal hard disk (DL1540CL /C8 option)
or the SCSI interface unit 700930 (sold separately).*2Selectable only on models with the internal hard disk (DL1540CL /C8 option).
When the action on trigger starts, the trigger mode will change automatically to thesingle short mode or single mode.
Keys and Procedure
MODE(ACTION) key
Soft keys
START/STOP keySHIFT key
6-16 IM 701530-01E
Specifying a file name when “FD(P-P)”, “FD(ACQ)”, “FD(IMG)”, “SCSI(P-P)”,“SCSI(ACQ)”, “SCSI(IMG)”, “HD(P-P),” “HD(ACQ),” or “HD(IMG)” has been selectedas the trigger actionA file No. (starting from “0001”) is assigned to each waveform data automaticallywhen the data is saved on a floppy disk, a SCSI device, or the internal hard disk.When saving the screen image data, set the image data format. You can set theformat at the hard copy selection menu that appears by pressing theSHIFT+COPY(MENU) key (see page 12-11).It is possible to insert a common file name (character string consisting of up to fourcharacters) before the assigned file No. (for instance, “TRGO0001”).The entered file name is reset when “ABORT” is selected.
Points to note when using the action on trigger• When you change the trigger mode to any other than the single short mode or
single mode, the trigger on action will be aborted.• It is not possible to perform auto set-up or GO/NO-GO determination while the
action on trigger is in progress.• When the action on trigger starts, the trigger mode will change automatically to
the single short mode or single mode. Even after canceling the action on trigger,the previous trigger mode will not be restored.
• When the action on trigger is restarted (“EXEC”) after first being aborted(“ABORT”), the automatically assigned file No. will start from 0001. Previoussaved data will therefore be overwritten.
• For DL1540CL, note that under “FD(ACQ)” action, ACQ-data record length mayin some cases be too long to be saved onto a single floppy disk. In this case thescreen will display an error message after saving data to the initial floppy disk.
6.9 Setting the Action-On Trigger
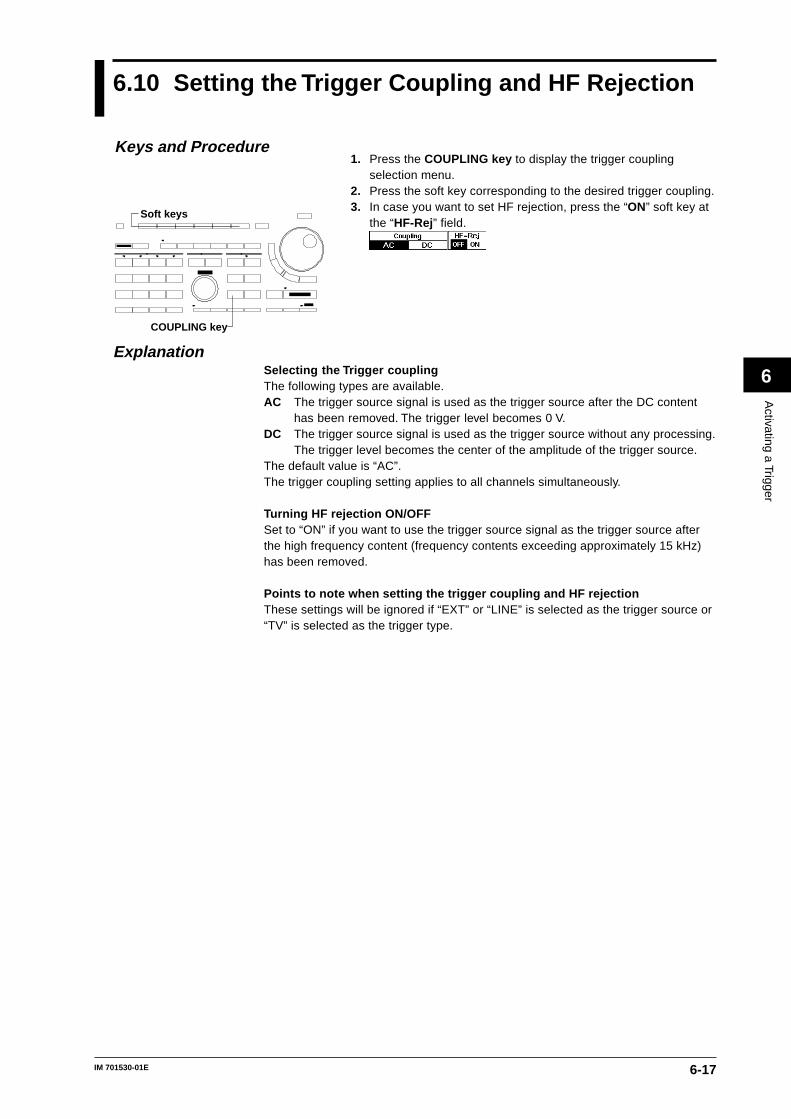
6-17IM 701530-01E
Activating a Trigger
6
6.10 Setting the Trigger Coupling and HF Rejection
1. Press the COUPLING key to display the trigger couplingselection menu.
2. Press the soft key corresponding to the desired trigger coupling.3. In case you want to set HF rejection, press the “ON” soft key at
the “HF-Rej” field.
ExplanationSelecting the Trigger couplingThe following types are available.AC The trigger source signal is used as the trigger source after the DC content
has been removed. The trigger level becomes 0 V.DC The trigger source signal is used as the trigger source without any processing.
The trigger level becomes the center of the amplitude of the trigger source.The default value is “AC”.The trigger coupling setting applies to all channels simultaneously.
Turning HF rejection ON/OFFSet to “ON” if you want to use the trigger source signal as the trigger source afterthe high frequency content (frequency contents exceeding approximately 15 kHz)has been removed.
Points to note when setting the trigger coupling and HF rejectionThese settings will be ignored if “EXT” or “LINE” is selected as the trigger source or“TV” is selected as the trigger type.
Keys and Procedure
COUPLING key
Soft keys
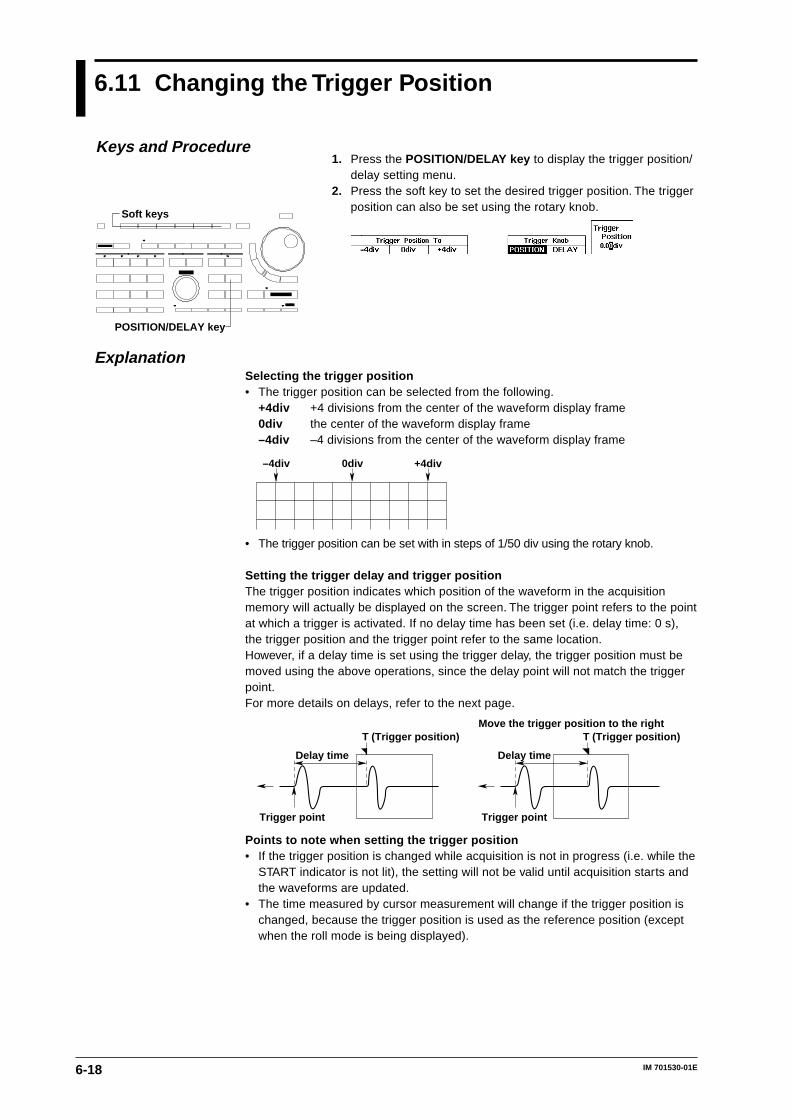
6-18 IM 701530-01E
6.11 Changing the Trigger Position
1. Press the POSITION/DELAY key to display the trigger position/delay setting menu.
2. Press the soft key to set the desired trigger position. The triggerposition can also be set using the rotary knob.
ExplanationSelecting the trigger position• The trigger position can be selected from the following.
+4div +4 divisions from the center of the waveform display frame0div the center of the waveform display frame–4div –4 divisions from the center of the waveform display frame
–4div 0div +4div
• The trigger position can be set with in steps of 1/50 div using the rotary knob.
Setting the trigger delay and trigger positionThe trigger position indicates which position of the waveform in the acquisitionmemory will actually be displayed on the screen. The trigger point refers to the pointat which a trigger is activated. If no delay time has been set (i.e. delay time: 0 s),the trigger position and the trigger point refer to the same location.However, if a delay time is set using the trigger delay, the trigger position must bemoved using the above operations, since the delay point will not match the triggerpoint.For more details on delays, refer to the next page.
Move the trigger position to the right
Delay time Delay time
Trigger point Trigger point
T (Trigger position) T (Trigger position)
Points to note when setting the trigger position• If the trigger position is changed while acquisition is not in progress (i.e. while the
START indicator is not lit), the setting will not be valid until acquisition starts andthe waveforms are updated.
• The time measured by cursor measurement will change if the trigger position ischanged, because the trigger position is used as the reference position (exceptwhen the roll mode is being displayed).
Keys and Procedure
POSITION/DELAY key
Soft keys
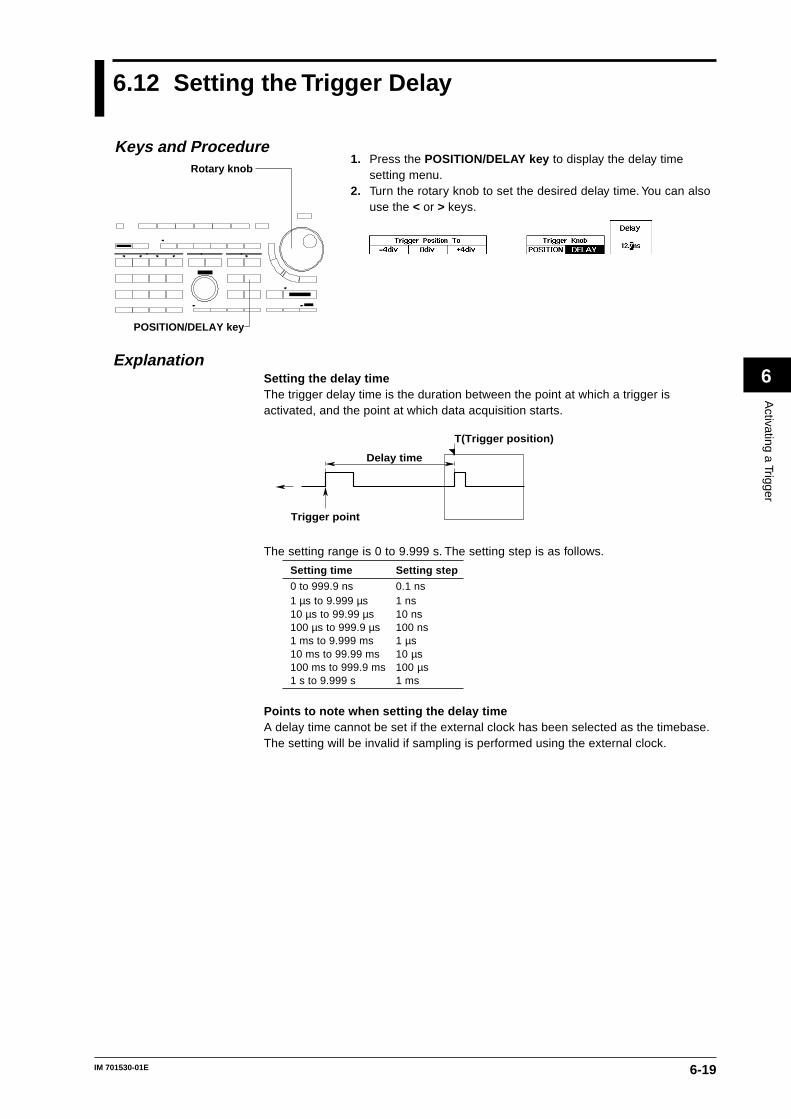
6-19IM 701530-01E
Activating a Trigger
6
6.12 Setting the Trigger Delay
1. Press the POSITION/DELAY key to display the delay timesetting menu.
2. Turn the rotary knob to set the desired delay time. You can alsouse the < or > keys.
ExplanationSetting the delay timeThe trigger delay time is the duration between the point at which a trigger isactivated, and the point at which data acquisition starts.
Delay time
Trigger point
T(Trigger position)
The setting range is 0 to 9.999 s. The setting step is as follows.
Setting time Setting step
0 to 999.9 ns 0.1 ns1 µs to 9.999 µs 1 ns10 µs to 99.99 µs 10 ns100 µs to 999.9 µs 100 ns1 ms to 9.999 ms 1 µs10 ms to 99.99 ms 10 µs100 ms to 999.9 ms 100 µs1 s to 9.999 s 1 ms
Points to note when setting the delay timeA delay time cannot be set if the external clock has been selected as the timebase.The setting will be invalid if sampling is performed using the external clock.
Keys and ProcedureRotary knob
POSITION/DELAY key
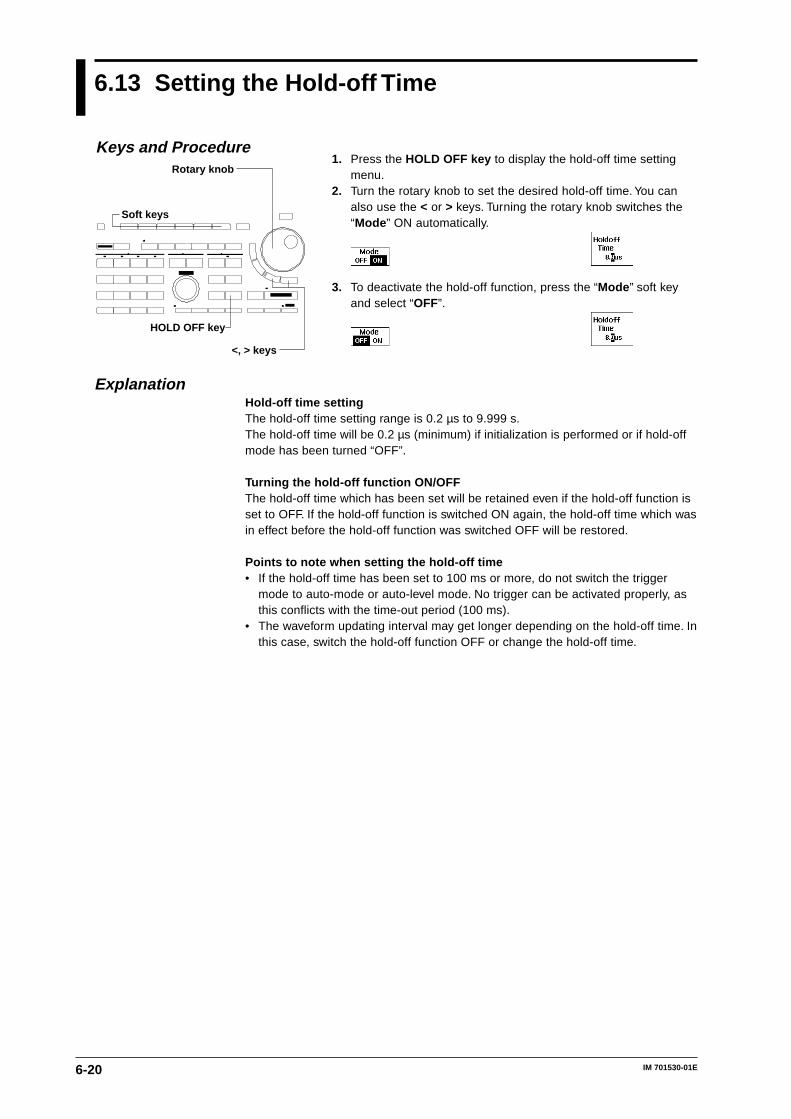
6-20 IM 701530-01E
6.13 Setting the Hold-off Time
1. Press the HOLD OFF key to display the hold-off time settingmenu.
2. Turn the rotary knob to set the desired hold-off time. You canalso use the < or > keys. Turning the rotary knob switches the“Mode ” ON automatically.
3. To deactivate the hold-off function, press the “Mode ” soft keyand select “OFF”.
ExplanationHold-off time settingThe hold-off time setting range is 0.2 µs to 9.999 s.The hold-off time will be 0.2 µs (minimum) if initialization is performed or if hold-offmode has been turned “OFF”.
Turning the hold-off function ON/OFFThe hold-off time which has been set will be retained even if the hold-off function isset to OFF. If the hold-off function is switched ON again, the hold-off time which wasin effect before the hold-off function was switched OFF will be restored.
Points to note when setting the hold-off time• If the hold-off time has been set to 100 ms or more, do not switch the trigger
mode to auto-mode or auto-level mode. No trigger can be activated properly, asthis conflicts with the time-out period (100 ms).
• The waveform updating interval may get longer depending on the hold-off time. Inthis case, switch the hold-off function OFF or change the hold-off time.
Keys and Procedure
HOLD OFF key
Rotary knob
Soft keys
<, > keys
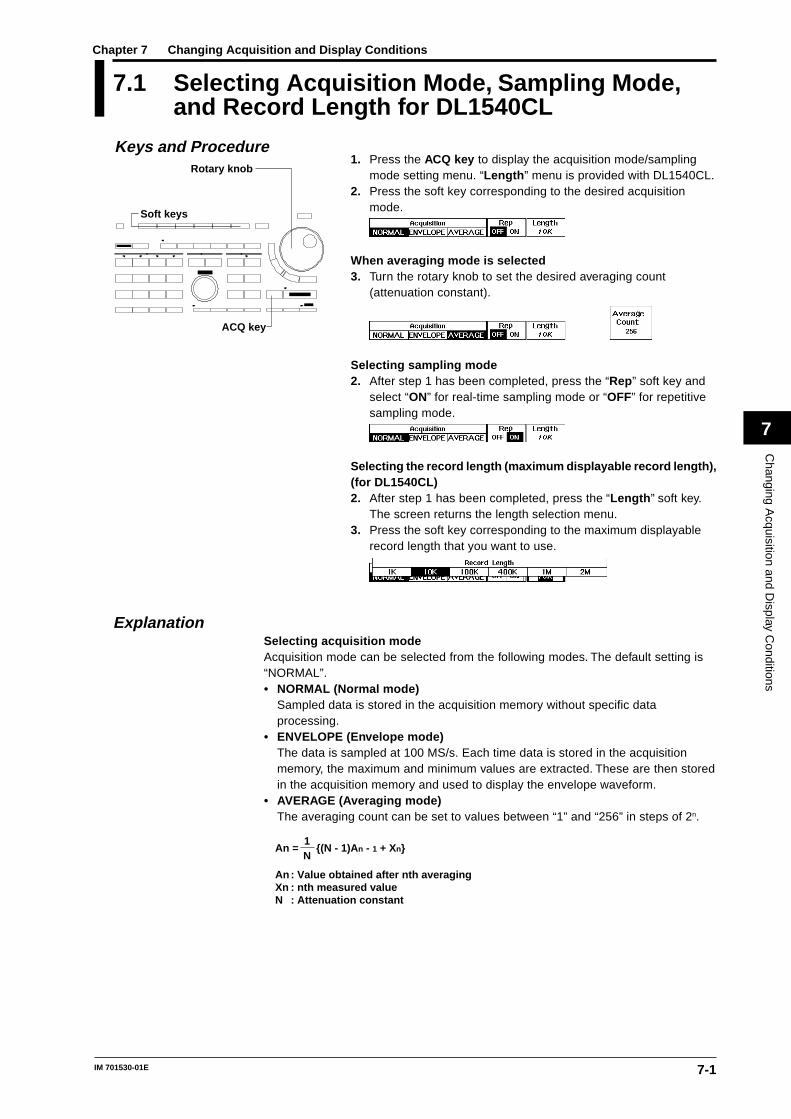
7-1IM 701530-01E
Changing A
cquisition and Display C
onditions
7
7.1 Selecting Acquisition Mode, Sampling Mode,and Record Length for DL1540CL
1. Press the ACQ key to display the acquisition mode/samplingmode setting menu. “Length ” menu is provided with DL1540CL.
2. Press the soft key corresponding to the desired acquisitionmode.
When averaging mode is selected3. Turn the rotary knob to set the desired averaging count
(attenuation constant).
Selecting sampling mode2. After step 1 has been completed, press the “Rep” soft key and
select “ON” for real-time sampling mode or “OFF” for repetitivesampling mode.
Selecting the record length (maximum displayable record length),(for DL1540CL)2. After step 1 has been completed, press the “Length ” soft key.
The screen returns the length selection menu.3. Press the soft key corresponding to the maximum displayable
record length that you want to use.
ExplanationSelecting acquisition modeAcquisition mode can be selected from the following modes. The default setting is“NORMAL”.• NORMAL (Normal mode)
Sampled data is stored in the acquisition memory without specific dataprocessing.
• ENVELOPE (Envelope mode)The data is sampled at 100 MS/s. Each time data is stored in the acquisitionmemory, the maximum and minimum values are extracted. These are then storedin the acquisition memory and used to display the envelope waveform.
• AVERAGE (Averaging mode)The averaging count can be set to values between “1” and “256” in steps of 2n.
An = (N - 1)An - 1 + Xn1N
AnXnN
: Value obtained after nth averaging: nth measured value: Attenuation constant
Keys and Procedure
ACQ key
Rotary knob
Soft keys
Chapter 7 Changing Acquisition and Display Conditions
7-2 IM 701530-01E
Selecting sampling mode: RepetitiveA sampling mode can be selected provided that the selected T/div setting allowssampling both in real-time and repetitive modes.However, the repetitive sampling mode is not effective when the trigger mode is setto single long mode. Furhermore, the repetitive sampling mode cannot be set incase of the single (N) trigger mode, when the history memory function is used, or incase FFT is used.T/div settings which enable the selection of the sampling mode are from 5 µs to 100ns/div.
Selecting the (maximum displayable) record length, for DL1540CLYou can set the maximum displayable record length to 1 KW, 10 KW, 100 KW, 400KW, 1 MW, or 2 MW. The default selection is 10 KW. The following restrictionsapply.• Time-axis settings from 50 ns to 5 ns cannot be used in combination with 400
KW, 1 MW, and 2 MW record lengths. If the time-axis value is already set withinthis range, the 400 KW, 1 MW, and 2 MW selections will not be available.
• If the selected record length is 400 KW or 2 MW, certain time-axis settings willproduce waveform display over eight divisions only, with no waveform appearingover the two rightmost time-axis divisions.
• Selection of 400 KW, 1 MW, and 2 MW record lengths is available only if triggermode is “single.”
• It is not possible to switch on Channel 3 or Channel 4 while record length is set to2 MW. It is not possible to select 2 MW as the record length while Channel 3 orChannel 4 is on.
• Refer to Appendix 3 for information about the relationship between time axes,sampling rates, and record lengths.
Points to note when making acquisition mode and sampling mode settings• Normal mode operations are carried out, even if envelope mode has been
selected.• It is not possible to select envelope mode if waveforms are sampled by the
external clock.• If each single mode has been selected as the trigger mode or if the history
memory function has been set to ON, averaging mode cannot be selected.• If auto-mode or auto-level mode has been selected as the trigger mode and T/div
has been set such that the display is in roll mode, averaging will not beperformed, even if averaging mode is selected. In this case, waveforms aredisplayed in roll mode.
• It is not possible to select envelope mode if input smoothing or FFT has been setto ON.
7.1 Selecting Acquisition Mode, Sampling Mode, and Record Length for DL1540CL
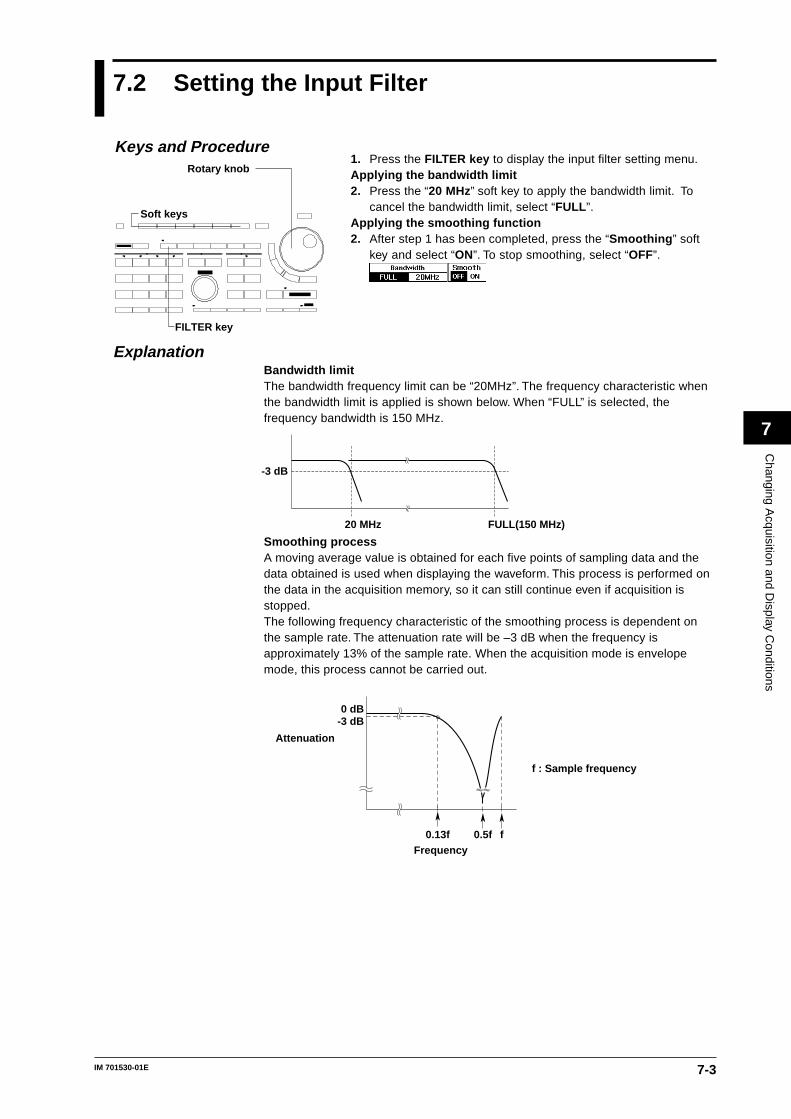
7-3IM 701530-01E
Changing A
cquisition and Display C
onditions
7
7.2 Setting the Input Filter
1. Press the FILTER key to display the input filter setting menu.Applying the bandwidth limit2. Press the “20 MHz” soft key to apply the bandwidth limit. To
cancel the bandwidth limit, select “FULL ”.Applying the smoothing function2. After step 1 has been completed, press the “Smoothing ” soft
key and select “ON”. To stop smoothing, select “OFF”.
ExplanationBandwidth limitThe bandwidth frequency limit can be “20MHz”. The frequency characteristic whenthe bandwidth limit is applied is shown below. When “FULL” is selected, thefrequency bandwidth is 150 MHz.
-3 dB
20 MHz FULL(150 MHz)
Smoothing processA moving average value is obtained for each five points of sampling data and thedata obtained is used when displaying the waveform. This process is performed onthe data in the acquisition memory, so it can still continue even if acquisition isstopped.The following frequency characteristic of the smoothing process is dependent onthe sample rate. The attenuation rate will be –3 dB when the frequency isapproximately 13% of the sample rate. When the acquisition mode is envelopemode, this process cannot be carried out.
f0.5f0.13fFrequency
0 dB-3 dB
f : Sample frequency
Attenuation
Keys and Procedure
FILTER key
Rotary knob
Soft keys
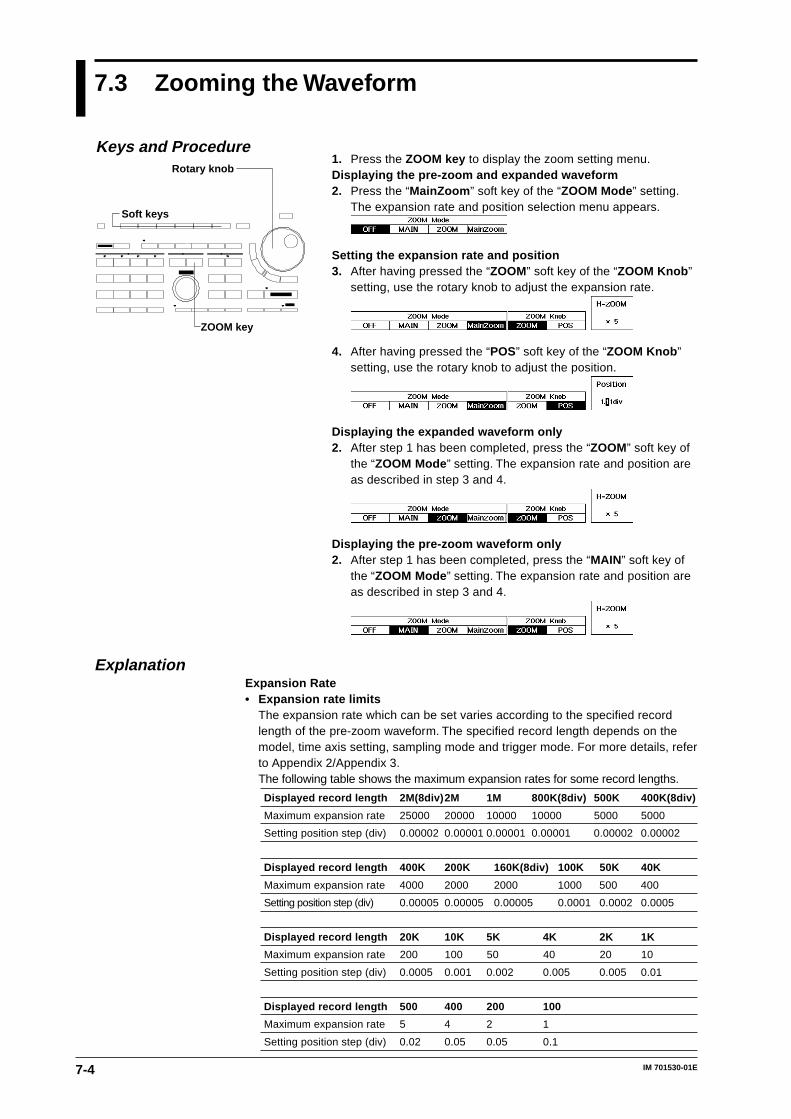
7-4 IM 701530-01E
7.3 Zooming the Waveform
1. Press the ZOOM key to display the zoom setting menu.Displaying the pre-zoom and expanded waveform2. Press the “MainZoom ” soft key of the “ZOOM Mode ” setting.
The expansion rate and position selection menu appears.
Setting the expansion rate and position3. After having pressed the “ZOOM” soft key of the “ZOOM Knob ”
setting, use the rotary knob to adjust the expansion rate.
4. After having pressed the “POS” soft key of the “ZOOM Knob ”setting, use the rotary knob to adjust the position.
Displaying the expanded waveform only2. After step 1 has been completed, press the “ZOOM” soft key of
the “ZOOM Mode ” setting. The expansion rate and position areas described in step 3 and 4.
Displaying the pre-zoom waveform only2. After step 1 has been completed, press the “MAIN” soft key of
the “ZOOM Mode ” setting. The expansion rate and position areas described in step 3 and 4.
ExplanationExpansion Rate• Expansion rate limits
The expansion rate which can be set varies according to the specified recordlength of the pre-zoom waveform. The specified record length depends on themodel, time axis setting, sampling mode and trigger mode. For more details, referto Appendix 2/Appendix 3.The following table shows the maximum expansion rates for some record lengths.
Displayed record length 2M(8div)2M 1M 800K(8div) 500K 400K(8div)
Maximum expansion rate 25000 20000 10000 10000 5000 5000
Setting position step (div) 0.00002 0.00001 0.00001 0.00001 0.00002 0.00002
Displayed record length 400K 200K 160K(8div) 100K 50K 40K
Maximum expansion rate 4000 2000 2000 1000 500 400
Setting position step (div) 0.00005 0.00005 0.00005 0.0001 0.0002 0.0005
Displayed record length 20K 10K 5K 4K 2K 1K
Maximum expansion rate 200 100 50 40 20 10
Setting position step (div) 0.0005 0.001 0.002 0.005 0.005 0.01
Displayed record length 500 400 200 100
Maximum expansion rate 5 4 2 1
Setting position step (div) 0.02 0.05 0.05 0.1
Keys and Procedure
ZOOM key
Rotary knob
Soft keys
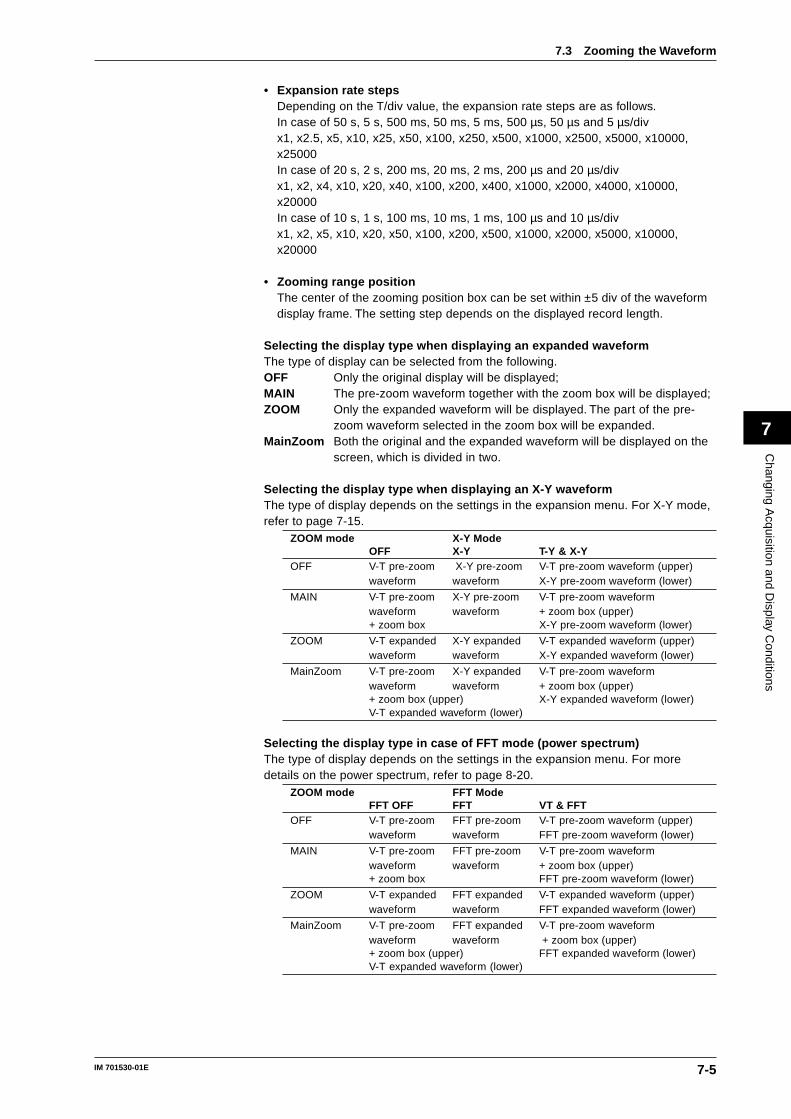
7-5IM 701530-01E
Changing A
cquisition and Display C
onditions
7
• Expansion rate stepsDepending on the T/div value, the expansion rate steps are as follows.In case of 50 s, 5 s, 500 ms, 50 ms, 5 ms, 500 µs, 50 µs and 5 µs/divx1, x2.5, x5, x10, x25, x50, x100, x250, x500, x1000, x2500, x5000, x10000,x25000In case of 20 s, 2 s, 200 ms, 20 ms, 2 ms, 200 µs and 20 µs/divx1, x2, x4, x10, x20, x40, x100, x200, x400, x1000, x2000, x4000, x10000,x20000In case of 10 s, 1 s, 100 ms, 10 ms, 1 ms, 100 µs and 10 µs/divx1, x2, x5, x10, x20, x50, x100, x200, x500, x1000, x2000, x5000, x10000,x20000
• Zooming range positionThe center of the zooming position box can be set within ±5 div of the waveformdisplay frame. The setting step depends on the displayed record length.
Selecting the display type when displaying an expanded waveformThe type of display can be selected from the following.OFF Only the original display will be displayed;MAIN The pre-zoom waveform together with the zoom box will be displayed;ZOOM Only the expanded waveform will be displayed. The part of the pre-
zoom waveform selected in the zoom box will be expanded.MainZoom Both the original and the expanded waveform will be displayed on the
screen, which is divided in two.
Selecting the display type when displaying an X-Y waveformThe type of display depends on the settings in the expansion menu. For X-Y mode,refer to page 7-15.
ZOOM mode X-Y ModeOFF X-Y T-Y & X-Y
OFF V-T pre-zoom X-Y pre-zoom V-T pre-zoom waveform (upper)waveform waveform X-Y pre-zoom waveform (lower)
MAIN V-T pre-zoom X-Y pre-zoom V-T pre-zoom waveformwaveform waveform + zoom box (upper)+ zoom box X-Y pre-zoom waveform (lower)
ZOOM V-T expanded X-Y expanded V-T expanded waveform (upper)waveform waveform X-Y expanded waveform (lower)
MainZoom V-T pre-zoom X-Y expanded V-T pre-zoom waveformwaveform waveform + zoom box (upper)+ zoom box (upper) X-Y expanded waveform (lower)V-T expanded waveform (lower)
Selecting the display type in case of FFT mode (power spectrum)The type of display depends on the settings in the expansion menu. For moredetails on the power spectrum, refer to page 8-20.
ZOOM mode FFT ModeFFT OFF FFT VT & FFT
OFF V-T pre-zoom FFT pre-zoom V-T pre-zoom waveform (upper)waveform waveform FFT pre-zoom waveform (lower)
MAIN V-T pre-zoom FFT pre-zoom V-T pre-zoom waveformwaveform waveform + zoom box (upper)+ zoom box FFT pre-zoom waveform (lower)
ZOOM V-T expanded FFT expanded V-T expanded waveform (upper)waveform waveform FFT expanded waveform (lower)
MainZoom V-T pre-zoom FFT expanded V-T pre-zoom waveformwaveform waveform + zoom box (upper)+ zoom box (upper) FFT expanded waveform (lower)V-T expanded waveform (lower)
7.3 Zooming the Waveform

7-6 IM 701530-01E
Points to note when displaying an expanded waveform• The waveform zone cannot be edited during GO/NO-GO if both pre-zoom
waveform and its expanded waveform are displayed at the same time.• If you press the ZOOM Mode soft key while accumulated waveform display is in
progress, accumulated waveform display will be reset.• If you press the ZOOM Mode soft key while a snapshot waveform display is being
displayed, the snapshot waveform will disappear.
7.3 Zooming the Waveform
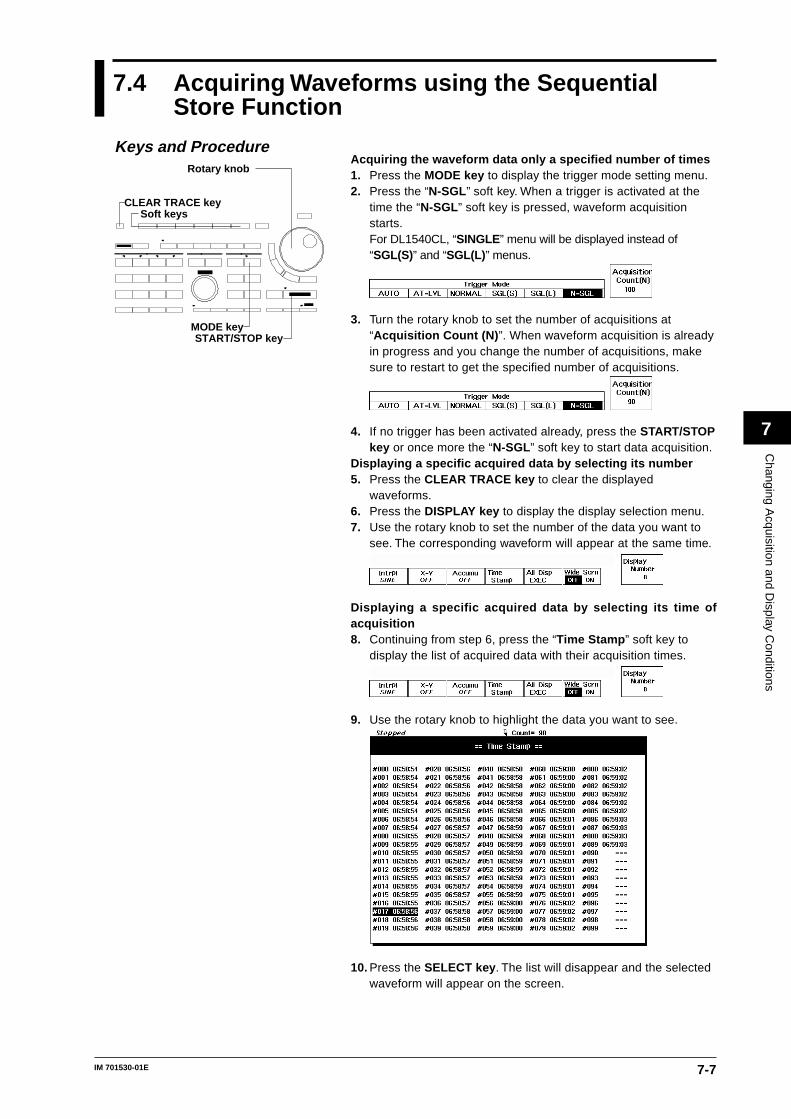
7-7IM 701530-01E
Changing A
cquisition and Display C
onditions
7
7.4 Acquiring Waveforms using the SequentialStore Function
Acquiring the waveform data only a specified number of times1. Press the MODE key to display the trigger mode setting menu.2. Press the “N-SGL” soft key. When a trigger is activated at the
time the “N-SGL” soft key is pressed, waveform acquisitionstarts.For DL1540CL, “SINGLE” menu will be displayed instead of“SGL(S)” and “SGL(L) ” menus.
3. Turn the rotary knob to set the number of acquisitions at“Acquisition Count (N) ”. When waveform acquisition is alreadyin progress and you change the number of acquisitions, makesure to restart to get the specified number of acquisitions.
4. If no trigger has been activated already, press the START/STOPkey or once more the “N-SGL” soft key to start data acquisition.
Displaying a specific acquired data by selecting its number5. Press the CLEAR TRACE key to clear the displayed
waveforms.6. Press the DISPLAY key to display the display selection menu.7. Use the rotary knob to set the number of the data you want to
see. The corresponding waveform will appear at the same time.
Displaying a specific acquired data by selecting its time ofacquisition8. Continuing from step 6, press the “Time Stamp ” soft key to
display the list of acquired data with their acquisition times.
9. Use the rotary knob to highlight the data you want to see.
10. Press the SELECT key . The list will disappear and the selectedwaveform will appear on the screen.
Keys and Procedure
MODE key
Rotary knob
Soft keys
START/STOP key
CLEAR TRACE key
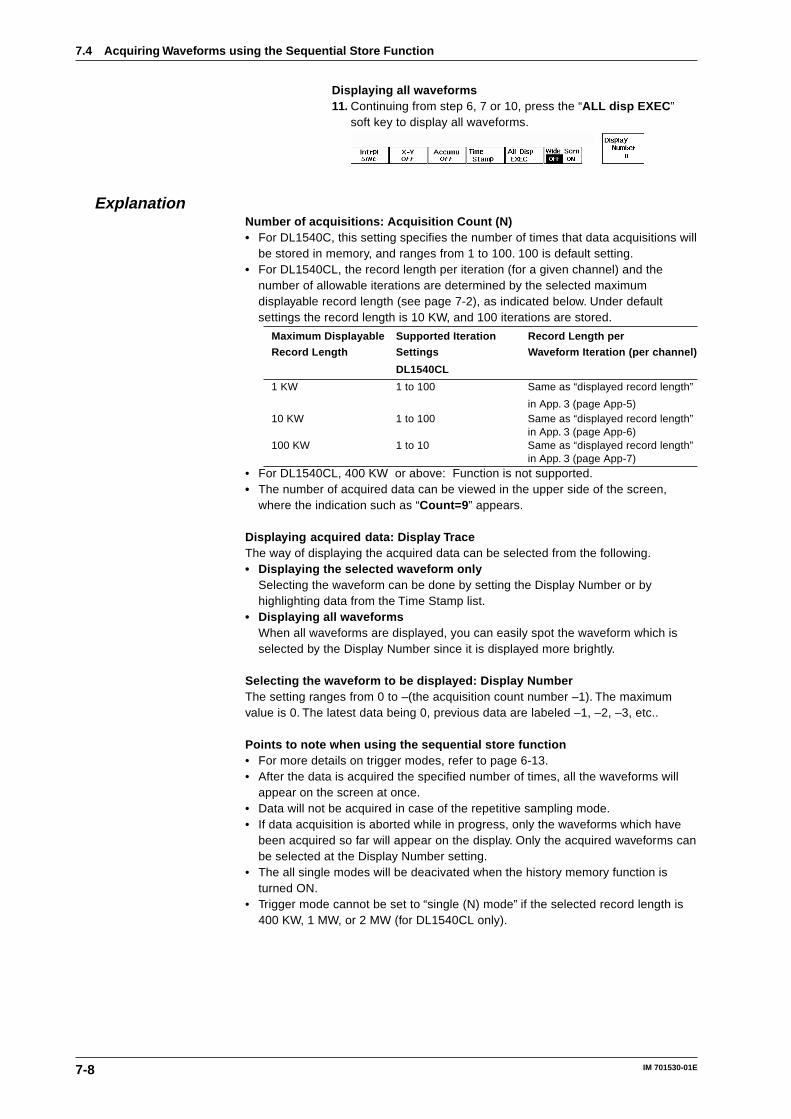
7-8 IM 701530-01E
Displaying all waveforms11. Continuing from step 6, 7 or 10, press the “ALL disp EXEC ”
soft key to display all waveforms.
ExplanationNumber of acquisitions: Acquisition Count (N)• For DL1540C, this setting specifies the number of times that data acquisitions will
be stored in memory, and ranges from 1 to 100. 100 is default setting.• For DL1540CL, the record length per iteration (for a given channel) and the
number of allowable iterations are determined by the selected maximumdisplayable record length (see page 7-2), as indicated below. Under defaultsettings the record length is 10 KW, and 100 iterations are stored.
Maximum Displayable Supported Iteration Record Length per
Record Length Settings Waveform Iteration (per channel)
DL1540CL
1 KW 1 to 100 Same as “displayed record length”
in App. 3 (page App-5)10 KW 1 to 100 Same as “displayed record length”
in App. 3 (page App-6)100 KW 1 to 10 Same as “displayed record length”
in App. 3 (page App-7)• For DL1540CL, 400 KW or above: Function is not supported.• The number of acquired data can be viewed in the upper side of the screen,
where the indication such as “Count=9 ” appears.
Displaying acquired data: Display TraceThe way of displaying the acquired data can be selected from the following.• Displaying the selected waveform only
Selecting the waveform can be done by setting the Display Number or byhighlighting data from the Time Stamp list.
• Displaying all waveformsWhen all waveforms are displayed, you can easily spot the waveform which isselected by the Display Number since it is displayed more brightly.
Selecting the waveform to be displayed: Display NumberThe setting ranges from 0 to –(the acquisition count number –1). The maximumvalue is 0. The latest data being 0, previous data are labeled –1, –2, –3, etc..
Points to note when using the sequential store function• For more details on trigger modes, refer to page 6-13.• After the data is acquired the specified number of times, all the waveforms will
appear on the screen at once.• Data will not be acquired in case of the repetitive sampling mode.• If data acquisition is aborted while in progress, only the waveforms which have
been acquired so far will appear on the display. Only the acquired waveforms canbe selected at the Display Number setting.
• The all single modes will be deacivated when the history memory function isturned ON.
• Trigger mode cannot be set to “single (N) mode” if the selected record length is400 KW, 1 MW, or 2 MW (for DL1540CL only).
7.4 Acquiring Waveforms using the Sequential Store Function
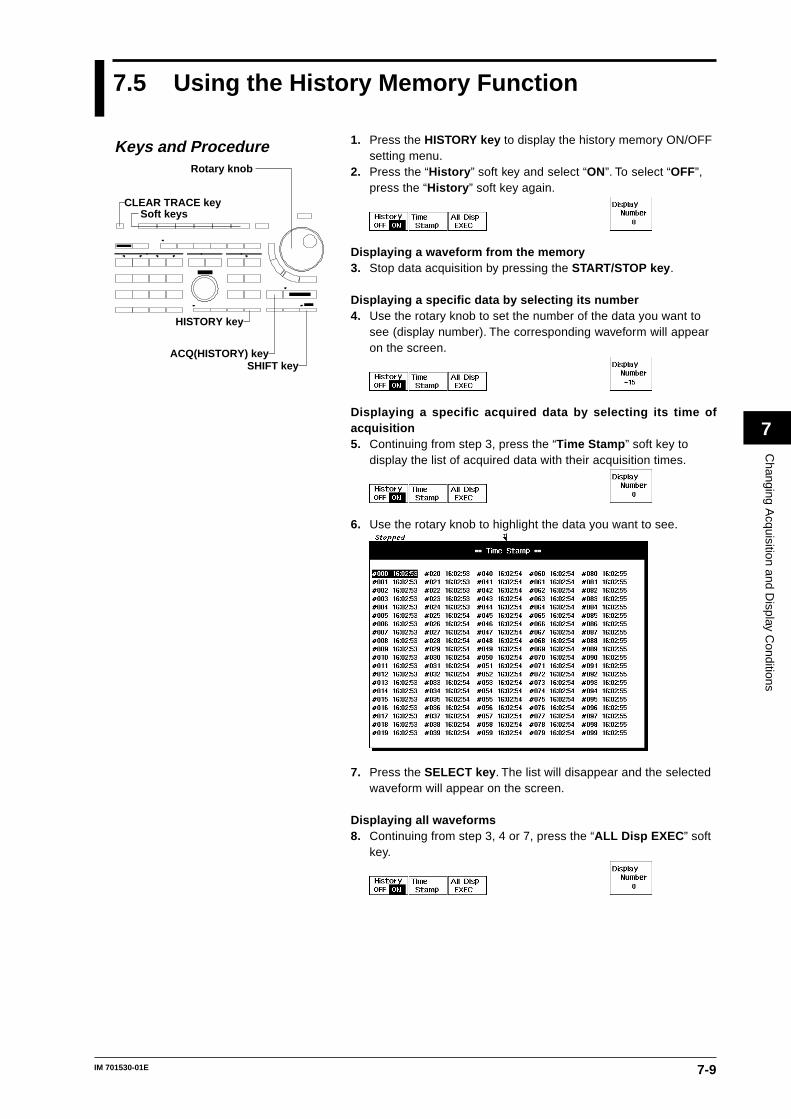
7-9IM 701530-01E
Changing A
cquisition and Display C
onditions
7
7.5 Using the History Memory Function
1. Press the HISTORY key to display the history memory ON/OFFsetting menu.
2. Press the “History ” soft key and select “ON”. To select “OFF”,press the “History ” soft key again.
Displaying a waveform from the memory3. Stop data acquisition by pressing the START/STOP key .
Displaying a specific data by selecting its number4. Use the rotary knob to set the number of the data you want to
see (display number). The corresponding waveform will appearon the screen.
Displaying a specific acquired data by selecting its time ofacquisition5. Continuing from step 3, press the “Time Stamp ” soft key to
display the list of acquired data with their acquisition times.
6. Use the rotary knob to highlight the data you want to see.
7. Press the SELECT key . The list will disappear and the selectedwaveform will appear on the screen.
Displaying all waveforms8. Continuing from step 3, 4 or 7, press the “ALL Disp EXEC ” soft
key.
Keys and Procedure
HISTORY key
Rotary knob
Soft keysCLEAR TRACE key
SHIFT keyACQ(HISTORY) key
7-10 IM 701530-01E
ExplanationNumber of waveforms in the history memory• Acquisition memory retains waveforms for the last N triggers, where N is
equivalent to the maximum number of iterations that can be stored undersequential-store operation.The record length per waveform (on a given channel)is the same as that for sequential-store mode. For details, refer to page 7-8.
• Once the history has become full (the number of triggers has exceeded N), eachnew waveform acquisition deletes the oldest waveform in the history.
Displaying acquired dataRefer to page 7-8.
Selecting the waveform to be displayed: Display NumberThe setting ranges from 0 to 99. The latest data being 0, previous data are beinglabeled –1, –2, –3, etc..
Acquisition periodYou can extend the acquisition period by setting the hold-off time, which temporarilyhalts the trigger detection. This feature makes it possible to obtain a history of aperiodically occurring waveform.
Points to note when using the history memory function• Data will not be acquired in case of the repetitive sampling mode.• If data acquisition is aborted while in progress, only the waveforms which have
been acquired so far will appear on the display. Only the acquired waveforms canbe selected at the Display Number setting.
• The history memory function cannot be turned ON when the acquisition mode isset to average, or when the trigger mode is set to SINGLE, SGL(S), SGL(L), orN-SGL.
• When the history memory function is set to ON, the display cannot be in the rollmode.
• The previously acquired waveforms will not appear on the screen whileacquisition is in progress.
• Waveforms will be acquired in the memory even if the display of the input signalshas been turned OFF. To display the acquired waveforms however, the display ofthe input signals should be set to ON. Refer to page 5-1.
• When the conditions of waveform acquisition are changed, the history memoryfunction will be reset and previous waveform data will be lost.
• The history-memory function cannot be switched on if the selected record lengthis 400 KW, 1 MW, or 2 MW (for DL1540CL only).
7.5 Using the History Memory Function
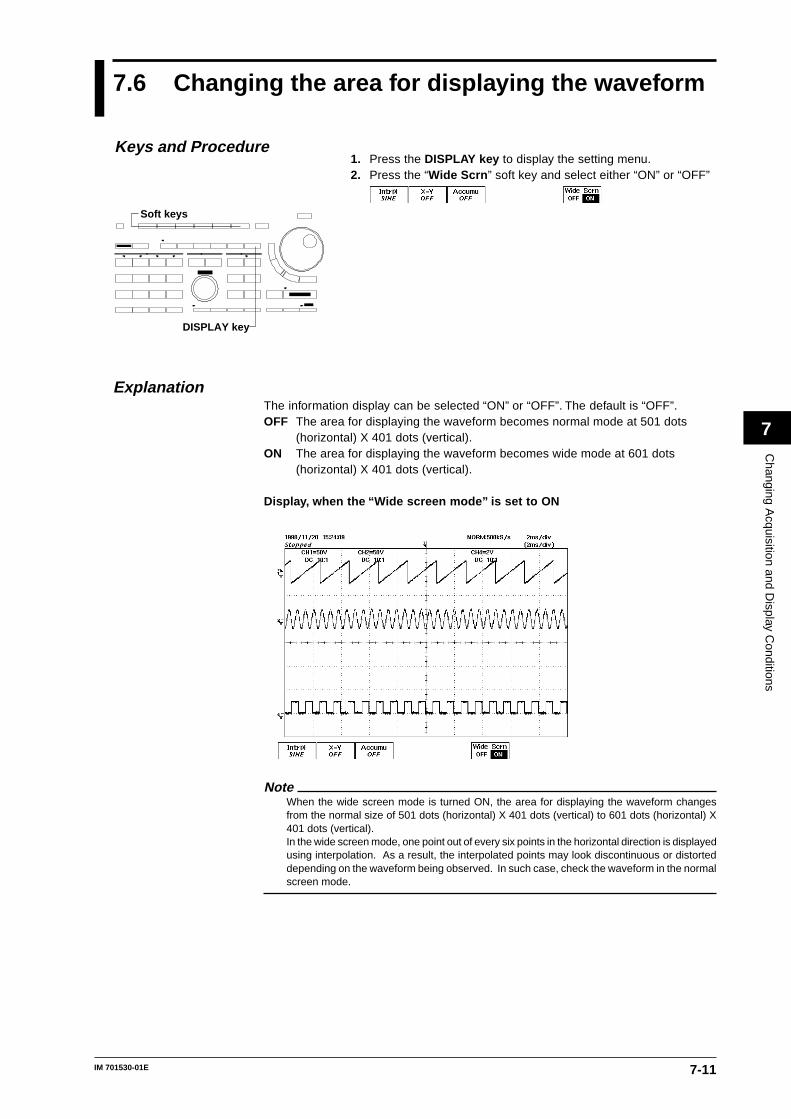
7-11IM 701530-01E
Changing A
cquisition and Display C
onditions
7
7.6 Changing the area for displaying the waveform
1. Press the DISPLAY key to display the setting menu.2. Press the “Wide Scrn ” soft key and select either “ON” or “OFF”
ExplanationThe information display can be selected “ON” or “OFF”. The default is “OFF”.OFF The area for displaying the waveform becomes normal mode at 501 dots
(horizontal) X 401 dots (vertical).ON The area for displaying the waveform becomes wide mode at 601 dots
(horizontal) X 401 dots (vertical).
Display, when the “Wide screen mode” is set to ON
NoteWhen the wide screen mode is turned ON, the area for displaying the waveform changesfrom the normal size of 501 dots (horizontal) X 401 dots (vertical) to 601 dots (horizontal) X401 dots (vertical).In the wide screen mode, one point out of every six points in the horizontal direction is displayedusing interpolation. As a result, the interpolated points may look discontinuous or distorteddepending on the waveform being observed. In such case, check the waveform in the normalscreen mode.
Keys and Procedure
DISPLAY key
Soft keys
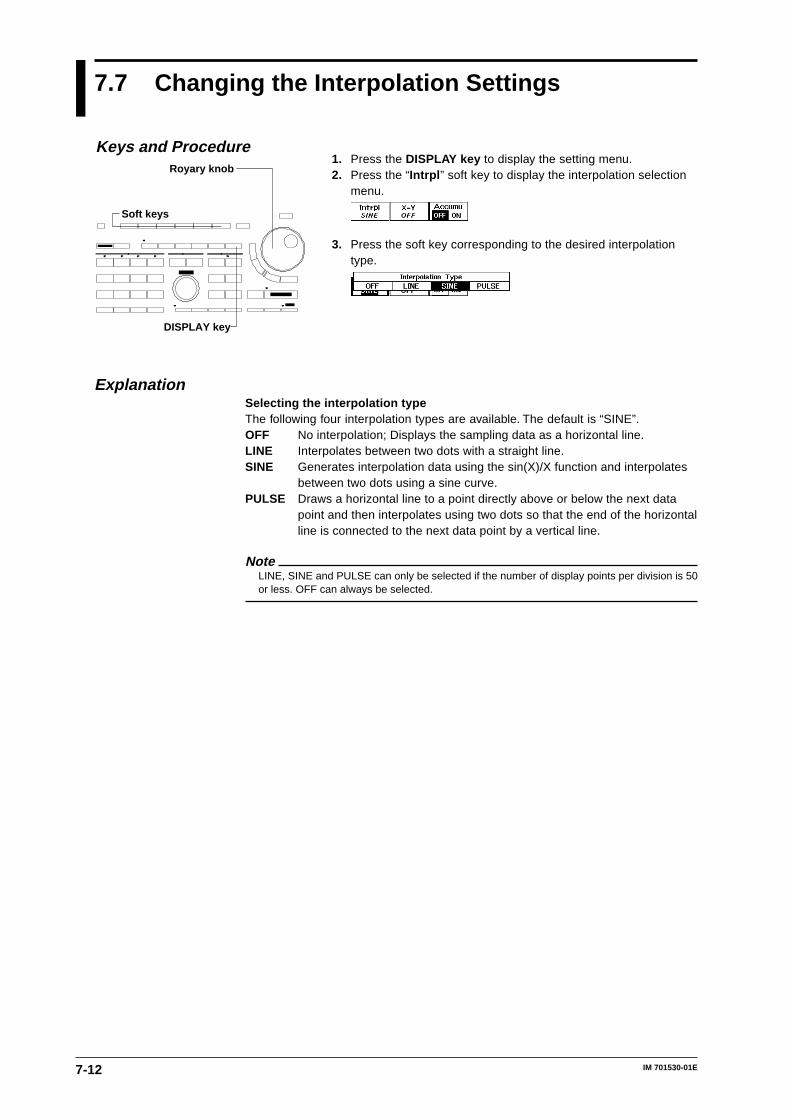
7-12 IM 701530-01E
7.7 Changing the Interpolation Settings
1. Press the DISPLAY key to display the setting menu.2. Press the “Intrpl ” soft key to display the interpolation selection
menu.
3. Press the soft key corresponding to the desired interpolationtype.
ExplanationSelecting the interpolation typeThe following four interpolation types are available. The default is “SINE”.OFF No interpolation; Displays the sampling data as a horizontal line.LINE Interpolates between two dots with a straight line.SINE Generates interpolation data using the sin(X)/X function and interpolates
between two dots using a sine curve.PULSE Draws a horizontal line to a point directly above or below the next data
point and then interpolates using two dots so that the end of the horizontalline is connected to the next data point by a vertical line.
NoteLINE, SINE and PULSE can only be selected if the number of display points per division is 50or less. OFF can always be selected.
Keys and Procedure
DISPLAY key
Royary knob
Soft keys
7-13IM 701530-01E
Changing A
cquisition and Display C
onditions
7
7.8 Displaying an Accumulated Waveform
1. Press the DISPLAY key to display the setting menu.2. Press the “Accumu ” soft key to display the accumulated
waveform selection menu.Accumulation3. After step 2 has been completed, press the “Persist ” soft key.4. Turn the rotary knob to set the desired accumulation time.
Accumulation with colored waveform3. After step 2 has been completed, press the “Color ” soft key.
4. Turn the rotary knob to set the desired grade width.
Cancel the accumulation5. Press the “Accumu ” soft key and select “OFF”.
ExplanationAccumulation modesPersist mode : Allows overlapping display of waveforms in a single color. The
most recent waveform is bright and old waveforms(accumulated waveforms) are dark.
Color grade mode : Allows overlapping display of waveforms in eight colorsaccording to the frequency of occurrence of th edata values.
Accumulation time (for the persist mode)When “Persisit” has been selected at the accumulation mode, the following can beselected. The default settings is “100ms”.100ms, 200ms, 300ms, 400ms, 500ms, 600ms, 700ms, 800ms, 900ms, 1s, 2s,3s, 4s, 5s, 6s, 7s, 8s, 9s, 10s, 20s, 30s, 40s, 50s, 60s, INFINITE
Grade width (for color grade mode)When “Color” has been selected at the accumulation mode, select the color gradewidth. The frequency of data value occurrence is indicated in eight colors asillustrated below. The grade width can be set within the range given below. Thedefault setting is 8. Overlapping display is performed indefinitely in color grademode.
When grade width = 4 When grade width = 32
red
magenta
yellow
white
cyan
green
blue
black
192 to
160 to 191
128 to 159
96 to 127
64 to 95
32 to 63
1 to 31
0
red
magenta
yellow
white
cyan
green
blue
black
24 to
20 to 23
16 to 19
12 to 15
8 to 11
4 to 7
1 to 3
0
Higher frequency
For example, a dot which has appeared on the screen 100 times is display in red ifthe grade width is 4, or in white if the grade width is 32.
Keys and Procedure
DISPLAY key
Rotary knob
Soft keys
7-14 IM 701530-01E
Clearing the accumulated waveformPressing the CLEAR TRACE key clears all accumulated waveforms except themost recent one.
Points to note• The following operations apply only to the latest waveform’s data if they are
performed using accumulated waveform display.-Cursor measurements and automated measurements-Saving the waveform data
• If you want to stop accumulation, press the START/STOP key to stopmeasurement. Pressing the START/STOP key again to restart measurement willclear the previously displayed waveforms and the accumulation time will be reset.
• Waveforms which can be accumulated are Pre-zoom waveforms, expandedwaveforms and X-Y waveforms.
• The currently accumulated waveforms will be cleared and accumulation willrestart, if the following operations are carried out.When the display type (ZOOM Mode setting) is changed during zoom or X-Ydisplay.When the area for displaying the waveform (Wide Screen setting) is changed.
7.8 Displaying an Accumulated Waveform
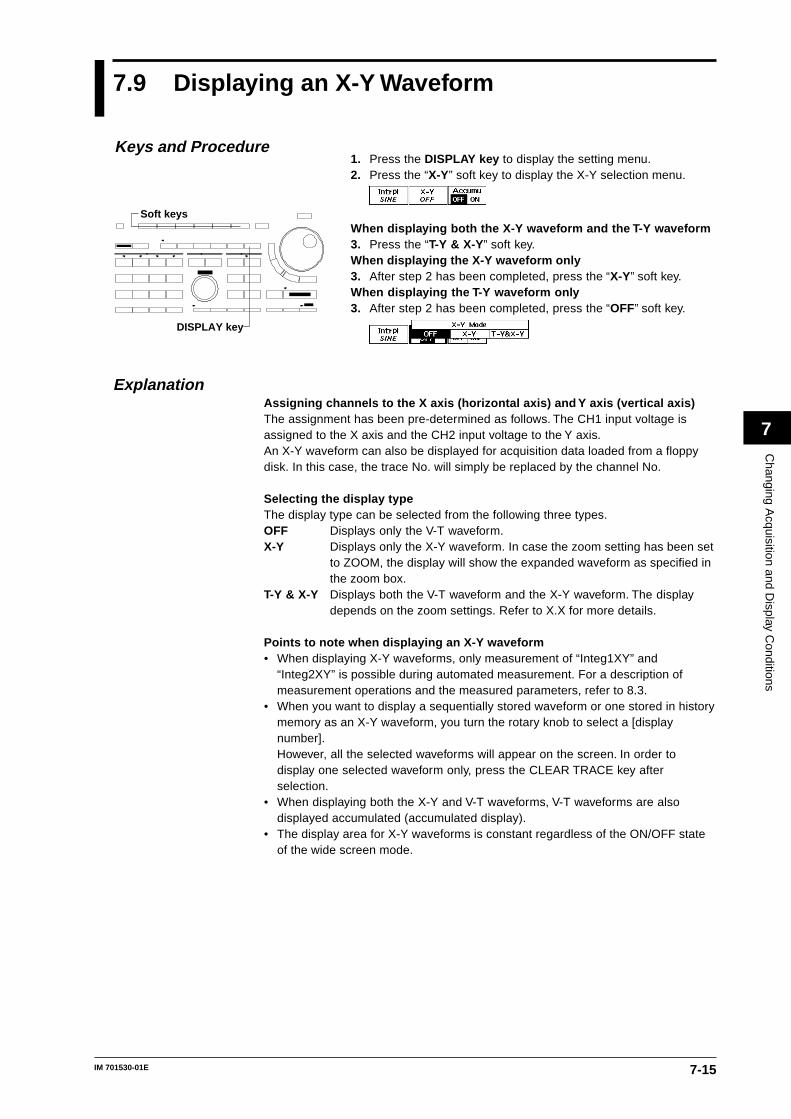
7-15IM 701530-01E
Changing A
cquisition and Display C
onditions
7
7.9 Displaying an X-Y Waveform
1. Press the DISPLAY key to display the setting menu.2. Press the “X-Y” soft key to display the X-Y selection menu.
When displaying both the X-Y waveform and the T-Y waveform3. Press the “T-Y & X-Y” soft key.When displaying the X-Y waveform only3. After step 2 has been completed, press the “X-Y” soft key.When displaying the T-Y waveform only3. After step 2 has been completed, press the “OFF” soft key.
ExplanationAssigning channels to the X axis (horizontal axis) and Y axis (vertical axis)The assignment has been pre-determined as follows. The CH1 input voltage isassigned to the X axis and the CH2 input voltage to the Y axis.An X-Y waveform can also be displayed for acquisition data loaded from a floppydisk. In this case, the trace No. will simply be replaced by the channel No.
Selecting the display typeThe display type can be selected from the following three types.OFF Displays only the V-T waveform.X-Y Displays only the X-Y waveform. In case the zoom setting has been set
to ZOOM, the display will show the expanded waveform as specified inthe zoom box.
T-Y & X-Y Displays both the V-T waveform and the X-Y waveform. The displaydepends on the zoom settings. Refer to X.X for more details.
Points to note when displaying an X-Y waveform• When displaying X-Y waveforms, only measurement of “Integ1XY” and
“Integ2XY” is possible during automated measurement. For a description ofmeasurement operations and the measured parameters, refer to 8.3.
• When you want to display a sequentially stored waveform or one stored in historymemory as an X-Y waveform, you turn the rotary knob to select a [displaynumber].However, all the selected waveforms will appear on the screen. In order todisplay one selected waveform only, press the CLEAR TRACE key afterselection.
• When displaying both the X-Y and V-T waveforms, V-T waveforms are alsodisplayed accumulated (accumulated display).
• The display area for X-Y waveforms is constant regardless of the ON/OFF stateof the wide screen mode.
Keys and Procedure
DISPLAY key
Soft keys
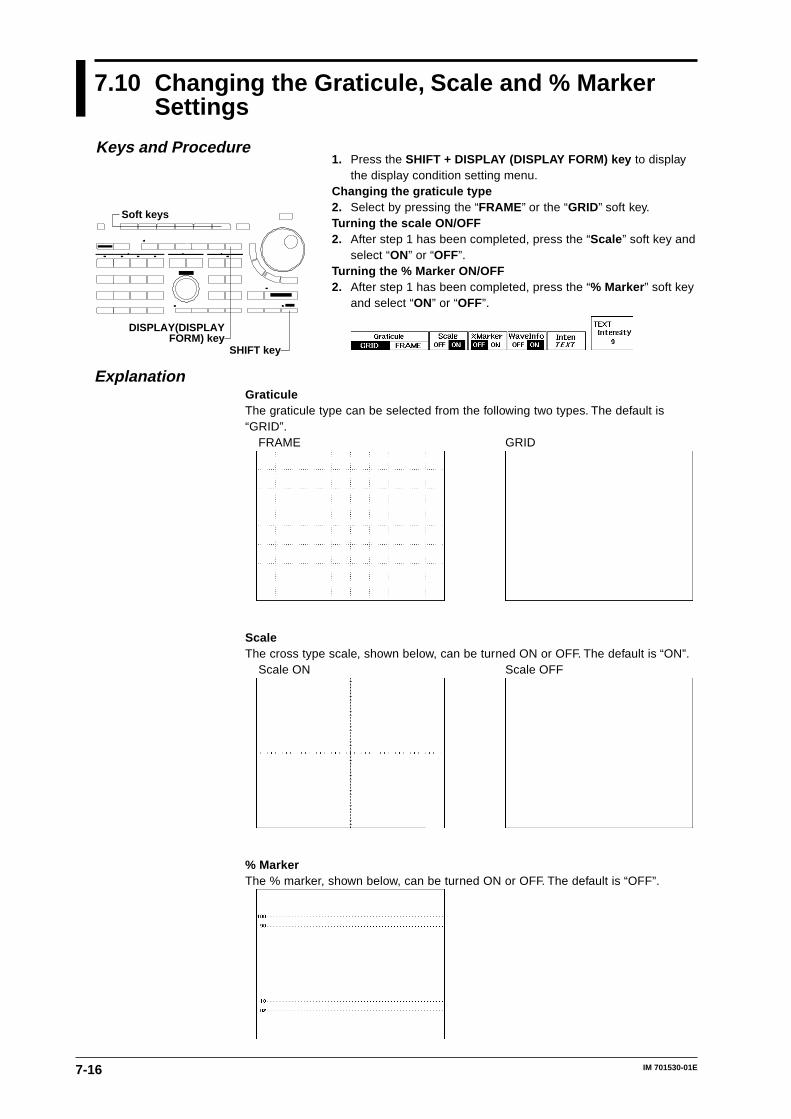
7-16 IM 701530-01E
7.10 Changing the Graticule, Scale and % MarkerSettings
1. Press the SHIFT + DISPLAY (DISPLAY FORM) key to displaythe display condition setting menu.
Changing the graticule type2. Select by pressing the “FRAME” or the “GRID” soft key.Turning the scale ON/OFF2. After step 1 has been completed, press the “Scale ” soft key and
select “ON” or “OFF”.Turning the % Marker ON/OFF2. After step 1 has been completed, press the “% Marker ” soft key
and select “ON” or “OFF”.
ExplanationGraticuleThe graticule type can be selected from the following two types. The default is“GRID”.
FRAME GRID
ScaleThe cross type scale, shown below, can be turned ON or OFF. The default is “ON”.
Scale ON Scale OFF
% MarkerThe % marker, shown below, can be turned ON or OFF. The default is “OFF”.
Keys and Procedure
DISPLAY(DISPLAY FORM) key
Soft keys
SHIFT key
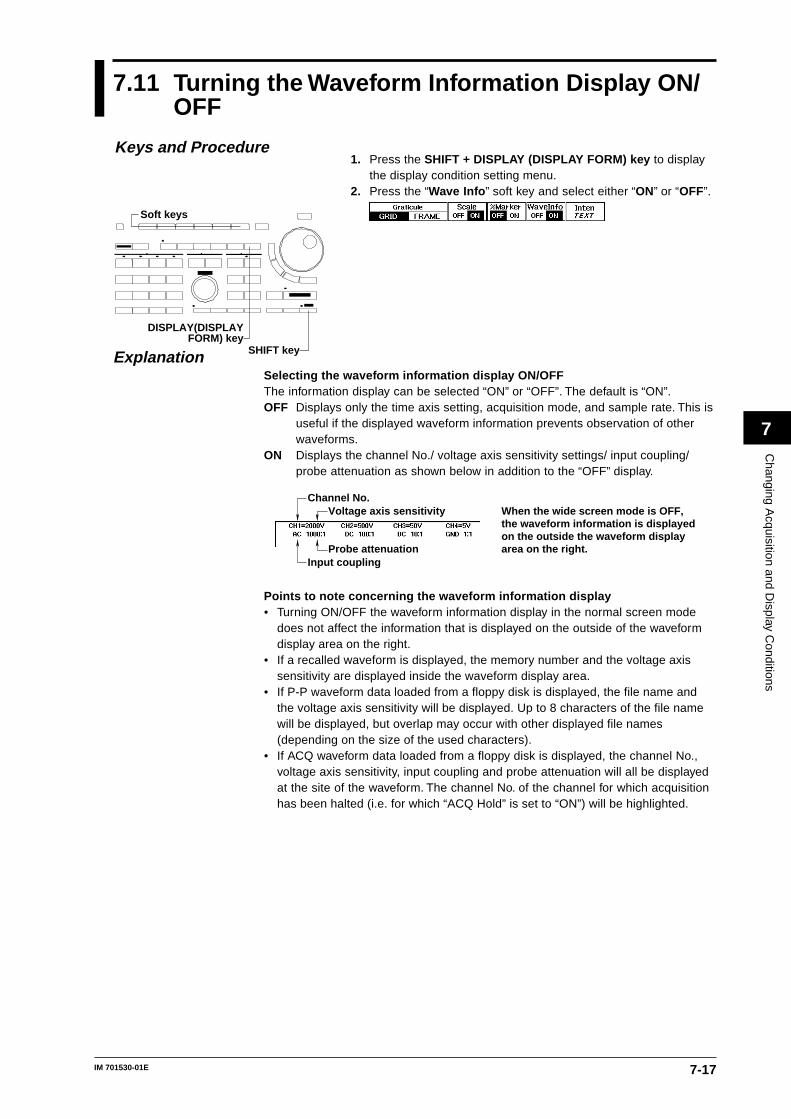
7-17IM 701530-01E
Changing A
cquisition and Display C
onditions
7
7.11 Turning the Waveform Information Display ON/OFF
1. Press the SHIFT + DISPLAY (DISPLAY FORM) key to displaythe display condition setting menu.
2. Press the “Wave Info ” soft key and select either “ON” or “OFF”.
ExplanationSelecting the waveform information display ON/OFFThe information display can be selected “ON” or “OFF”. The default is “ON”.OFF Displays only the time axis setting, acquisition mode, and sample rate. This is
useful if the displayed waveform information prevents observation of otherwaveforms.
ON Displays the channel No./ voltage axis sensitivity settings/ input coupling/probe attenuation as shown below in addition to the “OFF” display.
Voltage axis sensitivityChannel No.
Probe attenuationInput coupling
When the wide screen mode is OFF, the waveform information is displayed on the outside the waveform display area on the right.
Points to note concerning the waveform information display• Turning ON/OFF the waveform information display in the normal screen mode
does not affect the information that is displayed on the outside of the waveformdisplay area on the right.
• If a recalled waveform is displayed, the memory number and the voltage axissensitivity are displayed inside the waveform display area.
• If P-P waveform data loaded from a floppy disk is displayed, the file name andthe voltage axis sensitivity will be displayed. Up to 8 characters of the file namewill be displayed, but overlap may occur with other displayed file names(depending on the size of the used characters).
• If ACQ waveform data loaded from a floppy disk is displayed, the channel No.,voltage axis sensitivity, input coupling and probe attenuation will all be displayedat the site of the waveform. The channel No. of the channel for which acquisitionhas been halted (i.e. for which “ACQ Hold” is set to “ON”) will be highlighted.
Keys and Procedure
DISPLAY(DISPLAY FORM) key
Soft keys
SHIFT key
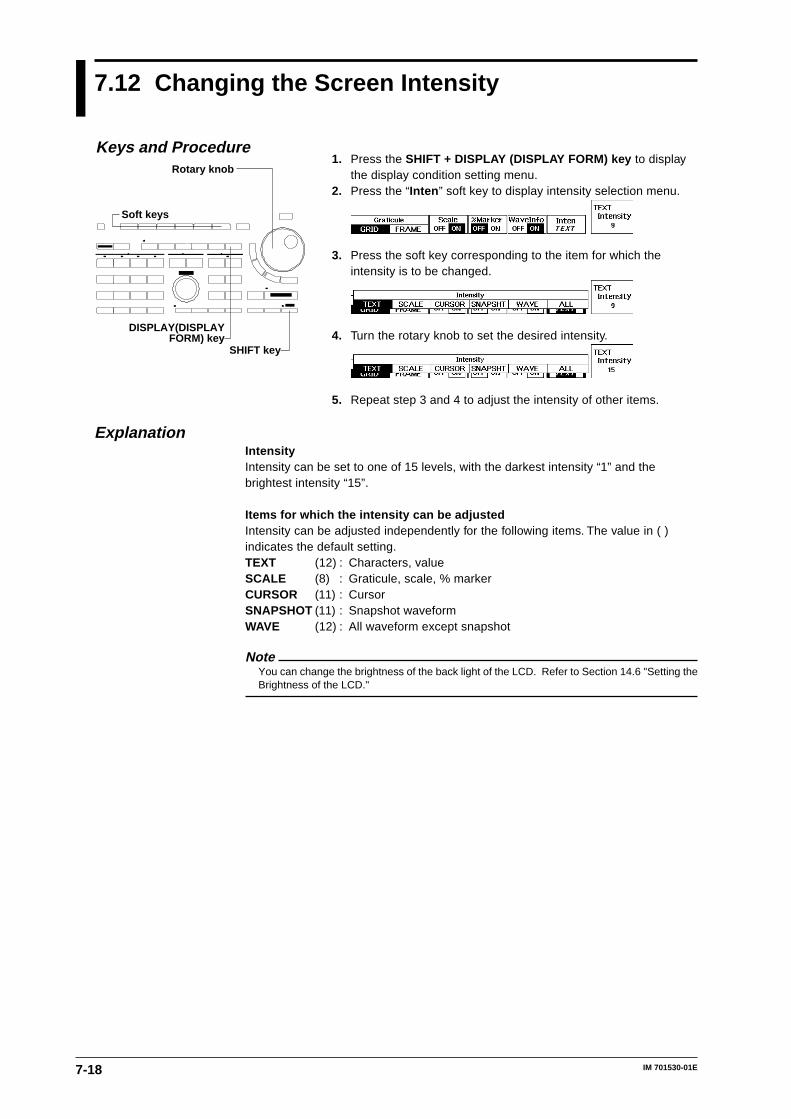
7-18 IM 701530-01E
7.12 Changing the Screen Intensity
1. Press the SHIFT + DISPLAY (DISPLAY FORM) key to displaythe display condition setting menu.
2. Press the “Inten ” soft key to display intensity selection menu.
3. Press the soft key corresponding to the item for which theintensity is to be changed.
4. Turn the rotary knob to set the desired intensity.
5. Repeat step 3 and 4 to adjust the intensity of other items.
ExplanationIntensityIntensity can be set to one of 15 levels, with the darkest intensity “1” and thebrightest intensity “15”.
Items for which the intensity can be adjustedIntensity can be adjusted independently for the following items. The value in ( )indicates the default setting.TEXT (12) : Characters, valueSCALE (8) : Graticule, scale, % markerCURSOR (11) : CursorSNAPSHOT (11) : Snapshot waveformWAVE (12) : All waveform except snapshot
NoteYou can change the brightness of the back light of the LCD. Refer to Section 14.6 "Setting theBrightness of the LCD."
Keys and Procedure
DISPLAY(DISPLAY FORM) key
Soft keys
SHIFT key
Rotary knob
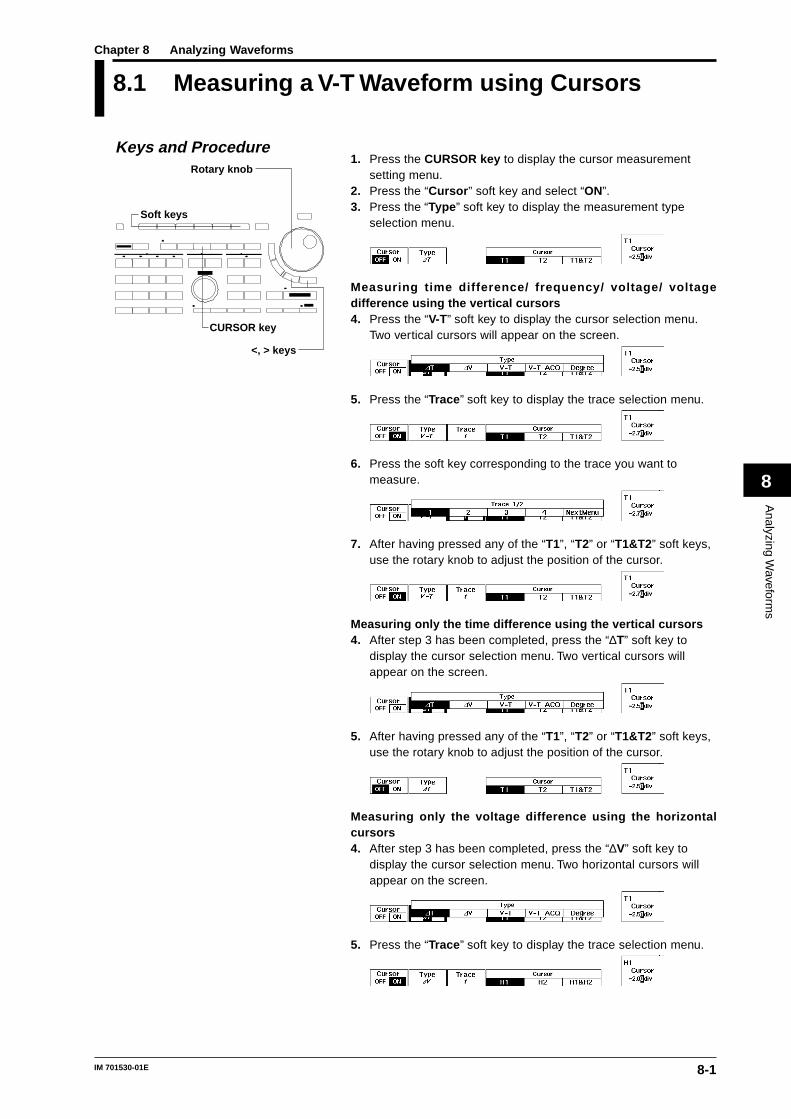
8-1IM 701530-01E
Analyzing W
aveforms
8
8.1 Measuring a V-T Waveform using Cursors
1. Press the CURSOR key to display the cursor measurementsetting menu.
2. Press the “Cursor ” soft key and select “ON”.3. Press the “Type ” soft key to display the measurement type
selection menu.
Measuring time difference/ frequency/ voltage/ voltagedifference using the vertical cursors4. Press the “V-T” soft key to display the cursor selection menu.
Two vertical cursors will appear on the screen.
5. Press the “Trace ” soft key to display the trace selection menu.
6. Press the soft key corresponding to the trace you want tomeasure.
7. After having pressed any of the “T1”, “T2” or “T1&T2” soft keys,use the rotary knob to adjust the position of the cursor.
Measuring only the time difference using the vertical cursors4. After step 3 has been completed, press the “∆T” soft key to
display the cursor selection menu. Two vertical cursors willappear on the screen.
5. After having pressed any of the “T1”, “T2” or “T1&T2” soft keys,use the rotary knob to adjust the position of the cursor.
Measuring only the voltage difference using the horizontalcursors4. After step 3 has been completed, press the “∆V” soft key to
display the cursor selection menu. Two horizontal cursors willappear on the screen.
5. Press the “Trace ” soft key to display the trace selection menu.
Keys and Procedure
CURSOR key
Rotary knob
Soft keys
<, > keys
Chapter 8 Analyzing Waveforms
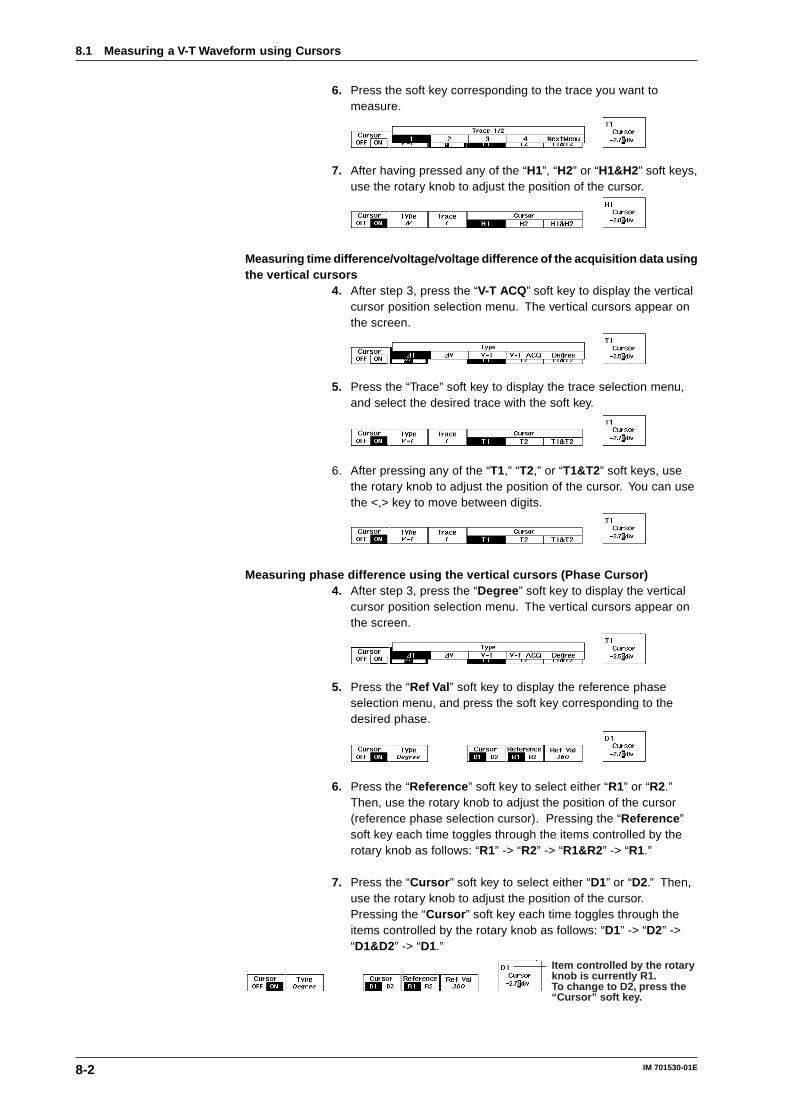
8-2 IM 701530-01E
6. Press the soft key corresponding to the trace you want tomeasure.
7. After having pressed any of the “H1”, “H2” or “H1&H2” soft keys,use the rotary knob to adjust the position of the cursor.
Measuring time difference/voltage/voltage difference of the acquisition data usingthe vertical cursors
4. After step 3, press the “V-T ACQ” soft key to display the verticalcursor position selection menu. The vertical cursors appear onthe screen.
5. Press the “Trace” soft key to display the trace selection menu,and select the desired trace with the soft key.
6. After pressing any of the “T1,” “T2,” or “T1&T2” soft keys, usethe rotary knob to adjust the position of the cursor. You can usethe <,> key to move between digits.
Measuring phase difference using the vertical cursors (Phase Cursor)4. After step 3, press the “Degree ” soft key to display the vertical
cursor position selection menu. The vertical cursors appear onthe screen.
5. Press the “Ref Val ” soft key to display the reference phaseselection menu, and press the soft key corresponding to thedesired phase.
6. Press the “Reference ” soft key to select either “R1” or “R2.”Then, use the rotary knob to adjust the position of the cursor(reference phase selection cursor). Pressing the “Reference ”soft key each time toggles through the items controlled by therotary knob as follows: “R1” -> “R2” -> “R1&R2” -> “R1.”
7. Press the “Cursor ” soft key to select either “D1” or “D2.” Then,use the rotary knob to adjust the position of the cursor.Pressing the “Cursor ” soft key each time toggles through theitems controlled by the rotary knob as follows: “D1” -> “D2” ->“D1&D2” -> “D1.”
Item controlled by the rotary knob is currently R1.To change to D2, press the “Cursor” soft key.
8.1 Measuring a V-T Waveform using Cursors
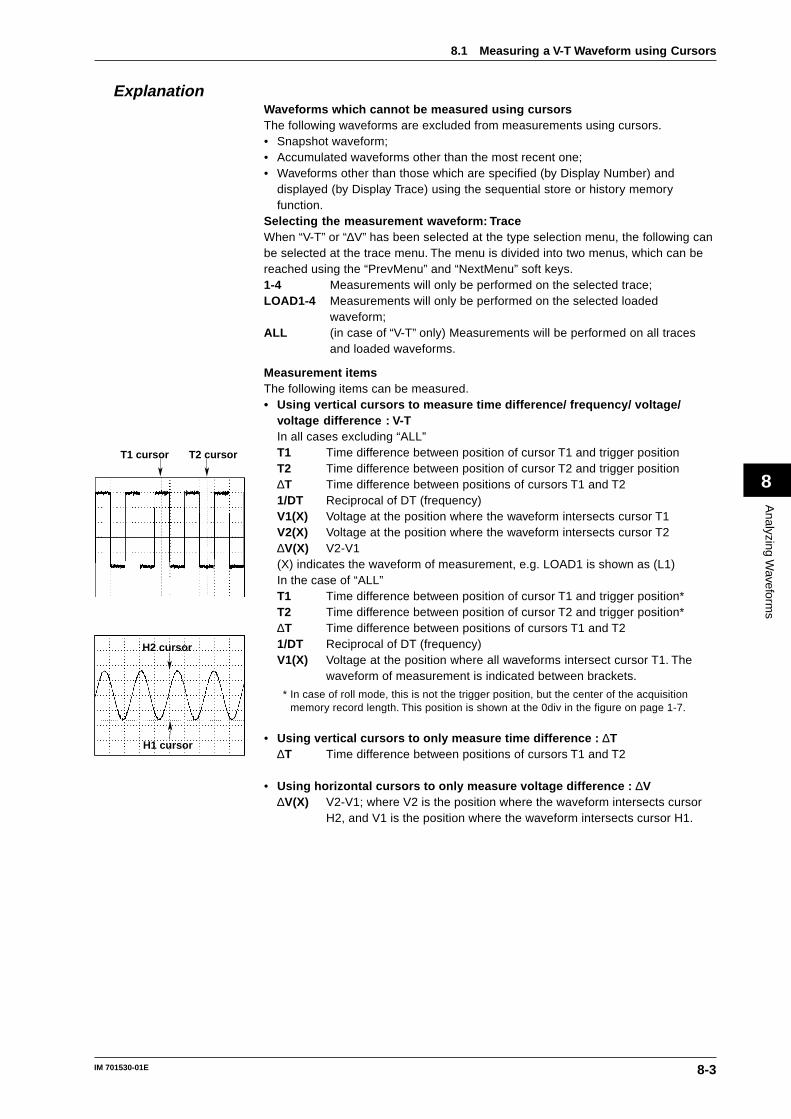
8-3IM 701530-01E
Analyzing W
aveforms
8
ExplanationWaveforms which cannot be measured using cursorsThe following waveforms are excluded from measurements using cursors.• Snapshot waveform;• Accumulated waveforms other than the most recent one;• Waveforms other than those which are specified (by Display Number) and
displayed (by Display Trace) using the sequential store or history memoryfunction.
Selecting the measurement waveform: TraceWhen “V-T” or “∆V” has been selected at the type selection menu, the following canbe selected at the trace menu. The menu is divided into two menus, which can bereached using the “PrevMenu” and “NextMenu” soft keys.1-4 Measurements will only be performed on the selected trace;LOAD1-4 Measurements will only be performed on the selected loaded
waveform;ALL (in case of “V-T” only) Measurements will be performed on all traces
and loaded waveforms.
Measurement itemsThe following items can be measured.• Using vertical cursors to measure time difference/ frequency/ voltage/
voltage difference : V-TIn all cases excluding “ALL”T1 Time difference between position of cursor T1 and trigger positionT2 Time difference between position of cursor T2 and trigger position∆T Time difference between positions of cursors T1 and T21/DT Reciprocal of DT (frequency)V1(X) Voltage at the position where the waveform intersects cursor T1V2(X) Voltage at the position where the waveform intersects cursor T2∆V(X) V2-V1(X) indicates the waveform of measurement, e.g. LOAD1 is shown as (L1)In the case of “ALL”T1 Time difference between position of cursor T1 and trigger position*T2 Time difference between position of cursor T2 and trigger position*∆T Time difference between positions of cursors T1 and T21/DT Reciprocal of DT (frequency)V1(X) Voltage at the position where all waveforms intersect cursor T1. The
waveform of measurement is indicated between brackets.
* In case of roll mode, this is not the trigger position, but the center of the acquisitionmemory record length. This position is shown at the 0div in the figure on page 1-7.
• Using vertical cursors to only measure time difference : ∆T∆T Time difference between positions of cursors T1 and T2
• Using horizontal cursors to only measure voltage difference : ∆V∆V(X) V2-V1; where V2 is the position where the waveform intersects cursor
H2, and V1 is the position where the waveform intersects cursor H1.
8.1 Measuring a V-T Waveform using Cursors
T1 cursor T2 cursor
H2 cursor
H1 cursor

8-4 IM 701530-01E
• Using vertical cursors to measure time difference/voltage/voltagedifference of the acquisition data : V-T ACQIn contrast to V-T cursor which measures the data on the screen, V-T ACQ cursormakes measurements on the actual data acquired in the acquisition memory.Furthermore, since the vertical cursor is on the actual data, moving the horizontalposition moves the cursor along with the waveform.Specified resolution = sample rate.T1 Time difference between the position of cursor T1 and the trigger position*.T2 Time difference between the position of cursor T2 and the trigger position*.∆T Time difference between the positions of cursors T1 and T2.1/∆T Reciprocal of DT (frequency).V1(X) Voltage at the position where the waveform intersects cursor T1.V2(X) Voltage at the position where the waveform intersects cursor T2.∆V(X) V2 - V1.(X) indicates the waveform under measurement. For example, trace 1 is shownas (1). Loaded waveforms cannot be measured using V-T ACQ measurement.
• Using vertical cursors (phase cursor) to measure the phase difference:Degree
D1 Phase angle of cursor D1 with respect to cursor R1.D2 Phase angle of cursor D2 with respect to cursor R1.∆D Phase difference between the positions of cursors
D1 and D2.R1 Cursor indicating phase angle of 0˚.R2 Cursor position indicating the phase angle defined
with Base Val*.* You can select from 180˚, 360˚, 540˚, or 720˚.
Cursor movement methodThe cursors can be selected as follows.• Time measurement cursor (vertical)
T1 Moves cursor T1 only.T2 Moves cursor T2 only.T1&T2 Moves both cursors T1 and T2 simultaneously without changing the
distance between them.• Voltage measurement cursor (horizontal)
H1 Moves cursor H1 only.H2 Moves cursor H2 only.H1&H2 Move both cursors H1 and H2 simultaneously without changing the
distance between them.• Vertical (phase measurement) cursor
D1 Move cursor D1 only.D2 Move cursor D2 only.D1&D2 Move cursors D1 and D2 simultaneously without changing the distance
between them.• Vertical (Reference phase selection) cursor
R1 Move cursor R1 only.R2 Move cursor R2 only.R1&R2 Move cursors R1 and R2 simultaneously without changing the distance
between them.
Cursor movement range• Vertical cursor
Movement range : Each vertical cursor can bemoved to 1002 differentpositions from the left edge (–5.00 div) to the right edge (5.00div) of the waveform displayframe. One time position is usedfor the P-P value of thedisplayed waveform, and twopoints (maximum and minimum)are measured at this position.
The default setting : –2.50 div for T1, 2.50 div for T2
8.1 Measuring a V-T Waveform using Cursors
0 500 1001
D2 cursor
D1 cursor
R2 cursor(Phase angle defined by Base Val,|R1-R2| = Base Val)
R1 cursor (0˚)
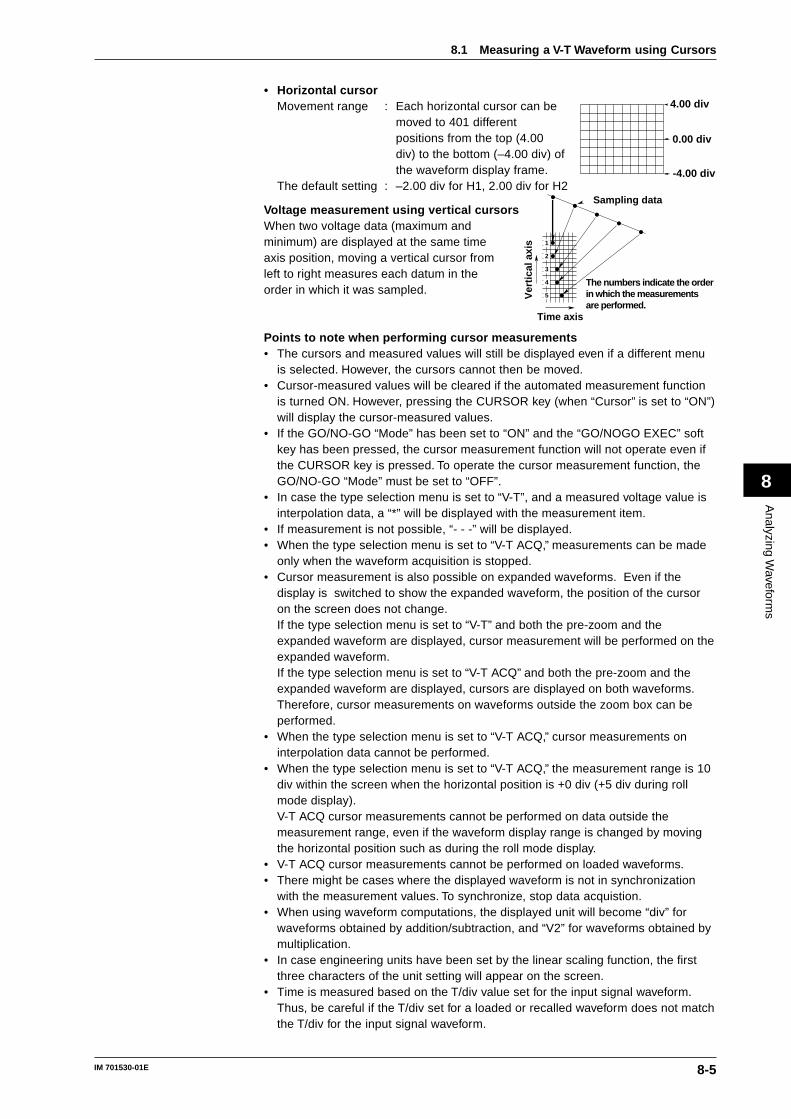
8-5IM 701530-01E
Analyzing W
aveforms
8
• Horizontal cursorMovement range : Each horizontal cursor can be
moved to 401 differentpositions from the top (4.00div) to the bottom (–4.00 div) ofthe waveform display frame.
The default setting : –2.00 div for H1, 2.00 div for H2
Voltage measurement using vertical cursorsWhen two voltage data (maximum andminimum) are displayed at the same timeaxis position, moving a vertical cursor fromleft to right measures each datum in theorder in which it was sampled.
Points to note when performing cursor measurements• The cursors and measured values will still be displayed even if a different menu
is selected. However, the cursors cannot then be moved.• Cursor-measured values will be cleared if the automated measurement function
is turned ON. However, pressing the CURSOR key (when “Cursor” is set to “ON”)will display the cursor-measured values.
• If the GO/NO-GO “Mode” has been set to “ON” and the “GO/NOGO EXEC” softkey has been pressed, the cursor measurement function will not operate even ifthe CURSOR key is pressed. To operate the cursor measurement function, theGO/NO-GO “Mode” must be set to “OFF”.
• In case the type selection menu is set to “V-T”, and a measured voltage value isinterpolation data, a “*” will be displayed with the measurement item.
• If measurement is not possible, “- - -” will be displayed.• When the type selection menu is set to “V-T ACQ,” measurements can be made
only when the waveform acquisition is stopped.• Cursor measurement is also possible on expanded waveforms. Even if the
display is switched to show the expanded waveform, the position of the cursoron the screen does not change.If the type selection menu is set to “V-T” and both the pre-zoom and theexpanded waveform are displayed, cursor measurement will be performed on theexpanded waveform.If the type selection menu is set to “V-T ACQ” and both the pre-zoom and theexpanded waveform are displayed, cursors are displayed on both waveforms.Therefore, cursor measurements on waveforms outside the zoom box can beperformed.
• When the type selection menu is set to “V-T ACQ,” cursor measurements oninterpolation data cannot be performed.
• When the type selection menu is set to “V-T ACQ,” the measurement range is 10div within the screen when the horizontal position is +0 div (+5 div during rollmode display).V-T ACQ cursor measurements cannot be performed on data outside themeasurement range, even if the waveform display range is changed by movingthe horizontal position such as during the roll mode display.
• V-T ACQ cursor measurements cannot be performed on loaded waveforms.• There might be cases where the displayed waveform is not in synchronization
with the measurement values. To synchronize, stop data acquistion.• When using waveform computations, the displayed unit will become “div” for
waveforms obtained by addition/subtraction, and “V2” for waveforms obtained bymultiplication.
• In case engineering units have been set by the linear scaling function, the firstthree characters of the unit setting will appear on the screen.
• Time is measured based on the T/div value set for the input signal waveform.Thus, be careful if the T/div set for a loaded or recalled waveform does not matchthe T/div for the input signal waveform.
8.1 Measuring a V-T Waveform using Cursors
Sampling data
Time axis
Ver
tica
l axi
s
The numbers indicate the order in which the measurements are performed.
1
2
3
4
5
4.00 div
0.00 div
-4.00 div
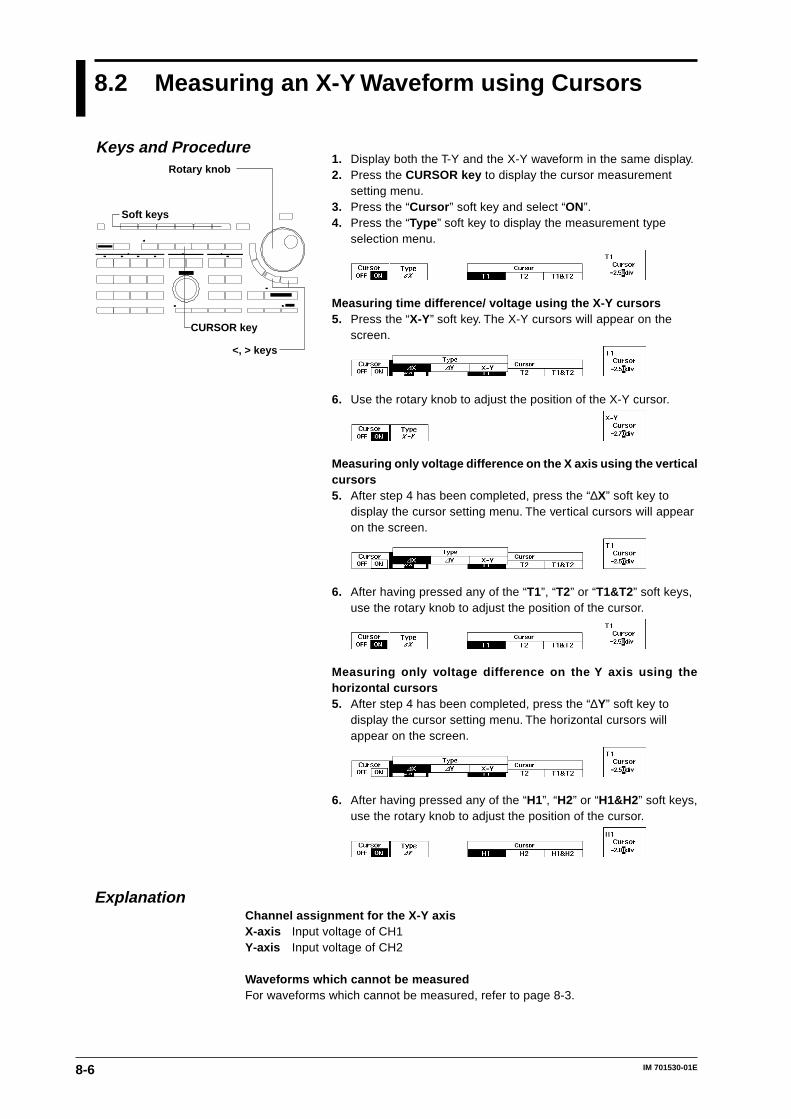
8-6 IM 701530-01E
8.2 Measuring an X-Y Waveform using Cursors
1. Display both the T-Y and the X-Y waveform in the same display.2. Press the CURSOR key to display the cursor measurement
setting menu.3. Press the “Cursor ” soft key and select “ON”.4. Press the “Type ” soft key to display the measurement type
selection menu.
Measuring time difference/ voltage using the X-Y cursors5. Press the “X-Y” soft key. The X-Y cursors will appear on the
screen.
6. Use the rotary knob to adjust the position of the X-Y cursor.
Measuring only voltage difference on the X axis using the verticalcursors5. After step 4 has been completed, press the “∆X” soft key to
display the cursor setting menu. The vertical cursors will appearon the screen.
6. After having pressed any of the “T1”, “T2” or “T1&T2” soft keys,use the rotary knob to adjust the position of the cursor.
Measuring only voltage difference on the Y axis using thehorizontal cursors5. After step 4 has been completed, press the “∆Y” soft key to
display the cursor setting menu. The horizontal cursors willappear on the screen.
6. After having pressed any of the “H1”, “H2” or “H1&H2” soft keys,use the rotary knob to adjust the position of the cursor.
ExplanationChannel assignment for the X-Y axisX-axis Input voltage of CH1Y-axis Input voltage of CH2
Waveforms which cannot be measuredFor waveforms which cannot be measured, refer to page 8-3.
Keys and Procedure
CURSOR key
Rotary knob
Soft keys
<, > keys
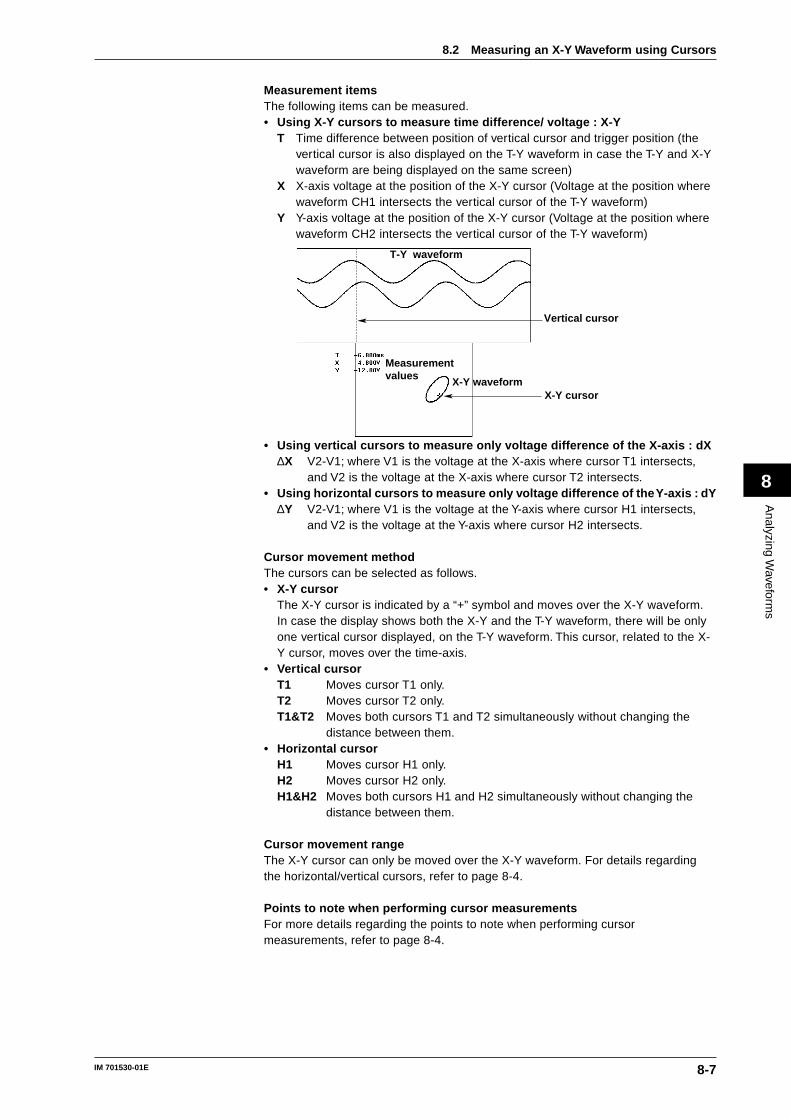
8-7IM 701530-01E
Analyzing W
aveforms
8
Measurement itemsThe following items can be measured.• Using X-Y cursors to measure time difference/ voltage : X-Y
T Time difference between position of vertical cursor and trigger position (thevertical cursor is also displayed on the T-Y waveform in case the T-Y and X-Ywaveform are being displayed on the same screen)
X X-axis voltage at the position of the X-Y cursor (Voltage at the position wherewaveform CH1 intersects the vertical cursor of the T-Y waveform)
Y Y-axis voltage at the position of the X-Y cursor (Voltage at the position wherewaveform CH2 intersects the vertical cursor of the T-Y waveform)
T-Y waveform
X-Y waveform
Measurementvalues
Vertical cursor
X-Y cursor
• Using vertical cursors to measure only voltage difference of the X-axis : dX∆X V2-V1; where V1 is the voltage at the X-axis where cursor T1 intersects,
and V2 is the voltage at the X-axis where cursor T2 intersects.• Using horizontal cursors to measure only voltage difference of the Y-axis : dY
∆Y V2-V1; where V1 is the voltage at the Y-axis where cursor H1 intersects,and V2 is the voltage at the Y-axis where cursor H2 intersects.
Cursor movement methodThe cursors can be selected as follows.• X-Y cursor
The X-Y cursor is indicated by a “+” symbol and moves over the X-Y waveform.In case the display shows both the X-Y and the T-Y waveform, there will be onlyone vertical cursor displayed, on the T-Y waveform. This cursor, related to the X-Y cursor, moves over the time-axis.
• Vertical cursorT1 Moves cursor T1 only.T2 Moves cursor T2 only.T1&T2 Moves both cursors T1 and T2 simultaneously without changing the
distance between them.• Horizontal cursor
H1 Moves cursor H1 only.H2 Moves cursor H2 only.H1&H2 Moves both cursors H1 and H2 simultaneously without changing the
distance between them.
Cursor movement rangeThe X-Y cursor can only be moved over the X-Y waveform. For details regardingthe horizontal/vertical cursors, refer to page 8-4.
Points to note when performing cursor measurementsFor more details regarding the points to note when performing cursormeasurements, refer to page 8-4.
8.2 Measuring an X-Y Waveform using Cursors
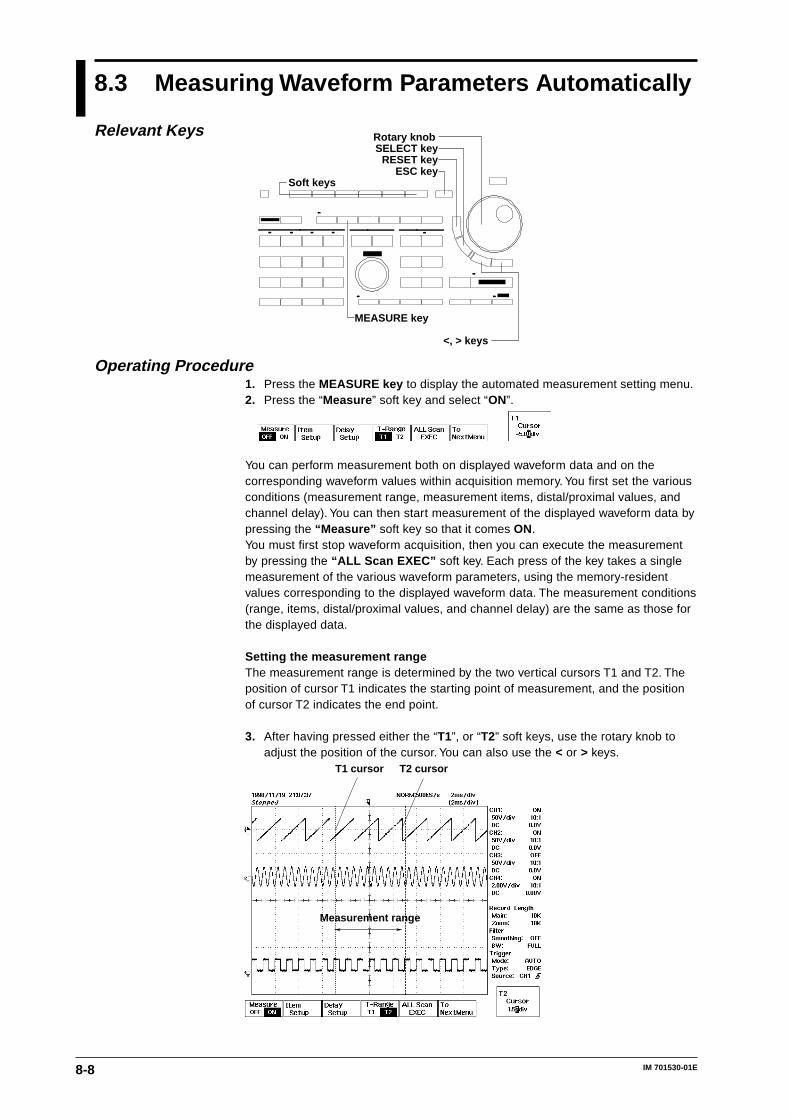
8-8 IM 701530-01E
8.3 Measuring Waveform Parameters Automatically
Operating Procedure1. Press the MEASURE key to display the automated measurement setting menu.2. Press the “Measure ” soft key and select “ON”.
You can perform measurement both on displayed waveform data and on thecorresponding waveform values within acquisition memory. You first set the variousconditions (measurement range, measurement items, distal/proximal values, andchannel delay). You can then start measurement of the displayed waveform data bypressing the “Measure” soft key so that it comes ON.You must first stop waveform acquisition, then you can execute the measurementby pressing the “ALL Scan EXEC” soft key. Each press of the key takes a singlemeasurement of the various waveform parameters, using the memory-residentvalues corresponding to the displayed waveform data. The measurement conditions(range, items, distal/proximal values, and channel delay) are the same as those forthe displayed data.
Setting the measurement rangeThe measurement range is determined by the two vertical cursors T1 and T2. Theposition of cursor T1 indicates the starting point of measurement, and the positionof cursor T2 indicates the end point.
3. After having pressed either the “T1”, or “T2” soft keys, use the rotary knob toadjust the position of the cursor. You can also use the < or > keys.
T1 cursor T2 cursor
Measurement range
Relevant Keys Rotary knob
Soft keys
SELECT key
ESC keyRESET key
<, > keys
MEASURE key
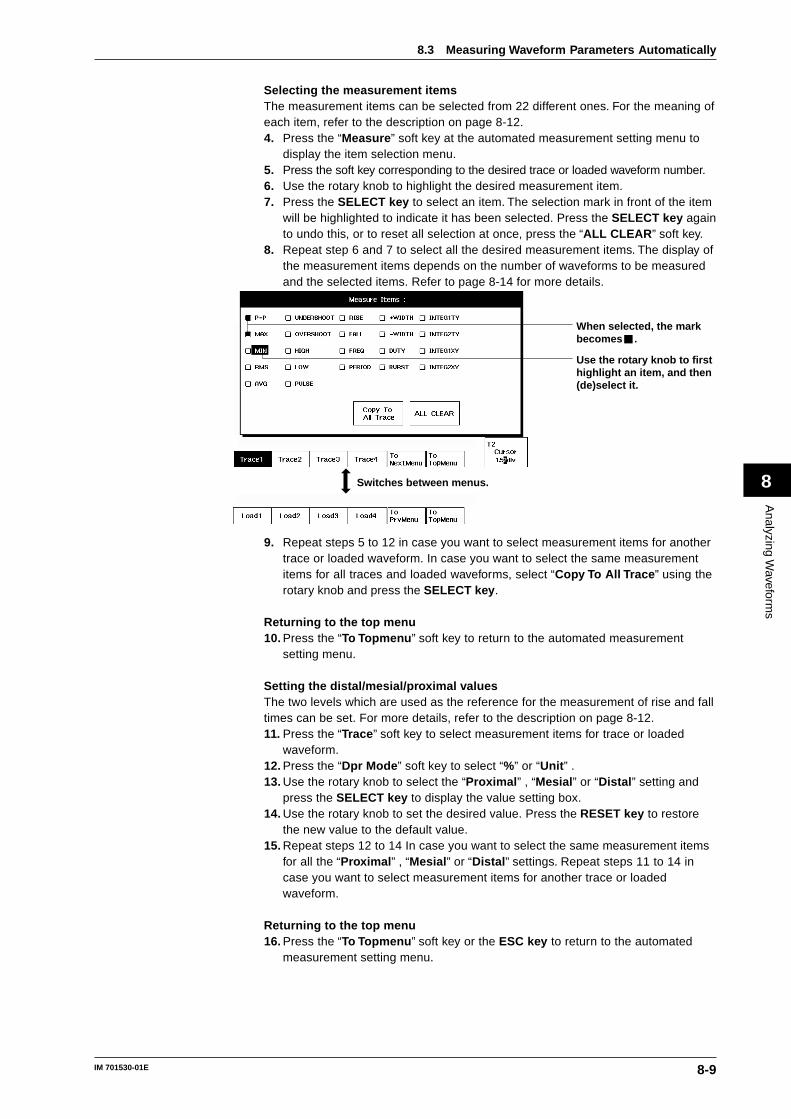
8-9IM 701530-01E
Analyzing W
aveforms
8
Selecting the measurement itemsThe measurement items can be selected from 22 different ones. For the meaning ofeach item, refer to the description on page 8-12.4. Press the “Measure ” soft key at the automated measurement setting menu to
display the item selection menu.5. Press the soft key corresponding to the desired trace or loaded waveform number.6. Use the rotary knob to highlight the desired measurement item.7. Press the SELECT key to select an item. The selection mark in front of the item
will be highlighted to indicate it has been selected. Press the SELECT key againto undo this, or to reset all selection at once, press the “ALL CLEAR ” soft key.
8. Repeat step 6 and 7 to select all the desired measurement items. The display ofthe measurement items depends on the number of waveforms to be measuredand the selected items. Refer to page 8-14 for more details.
When selected, the mark becomes .
Use the rotary knob to first highlight an item, and then (de)select it.
Switches between menus.
9. Repeat steps 5 to 12 in case you want to select measurement items for anothertrace or loaded waveform. In case you want to select the same measurementitems for all traces and loaded waveforms, select “Copy To All Trace ” using therotary knob and press the SELECT key .
Returning to the top menu10. Press the “To Topmenu ” soft key to return to the automated measurement
setting menu.
Setting the distal/mesial/proximal valuesThe two levels which are used as the reference for the measurement of rise and falltimes can be set. For more details, refer to the description on page 8-12.11. Press the “Trace ” soft key to select measurement items for trace or loaded
waveform.12. Press the “Dpr Mode ” soft key to select “%” or “Unit ” .13. Use the rotary knob to select the “Proximal ” , “Mesial ” or “Distal ” setting and
press the SELECT key to display the value setting box.14. Use the rotary knob to set the desired value. Press the RESET key to restore
the new value to the default value.15. Repeat steps 12 to 14 In case you want to select the same measurement items
for all the “Proximal ” , “Mesial ” or “Distal ” settings. Repeat steps 11 to 14 incase you want to select measurement items for another trace or loadedwaveform.
Returning to the top menu16. Press the “To Topmenu ” soft key or the ESC key to return to the automated
measurement setting menu.
8.3 Measuring Waveform Parameters Automatically
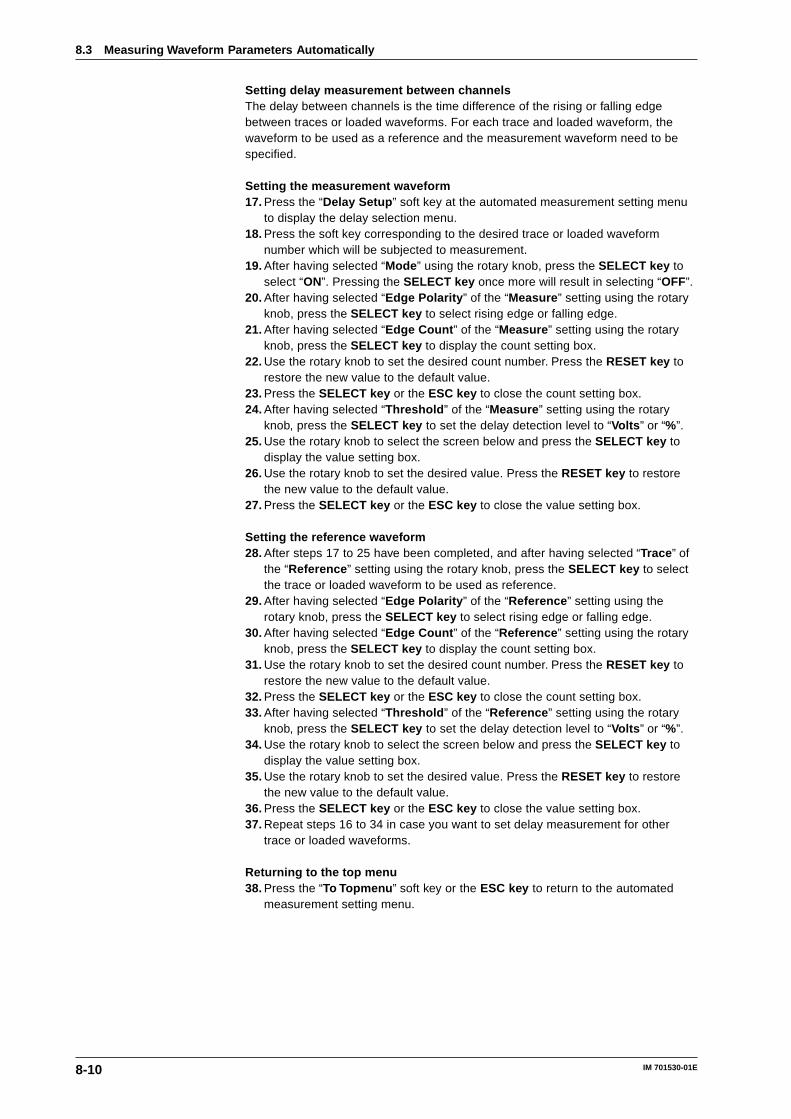
8-10 IM 701530-01E
Setting delay measurement between channelsThe delay between channels is the time difference of the rising or falling edgebetween traces or loaded waveforms. For each trace and loaded waveform, thewaveform to be used as a reference and the measurement waveform need to bespecified.
Setting the measurement waveform17. Press the “Delay Setup ” soft key at the automated measurement setting menu
to display the delay selection menu.18. Press the soft key corresponding to the desired trace or loaded waveform
number which will be subjected to measurement.19. After having selected “Mode ” using the rotary knob, press the SELECT key to
select “ON”. Pressing the SELECT key once more will result in selecting “OFF”.20. After having selected “Edge Polarity ” of the “Measure ” setting using the rotary
knob, press the SELECT key to select rising edge or falling edge.21. After having selected “Edge Count ” of the “Measure ” setting using the rotary
knob, press the SELECT key to display the count setting box.22. Use the rotary knob to set the desired count number. Press the RESET key to
restore the new value to the default value.23. Press the SELECT key or the ESC key to close the count setting box.24. After having selected “Threshold ” of the “Measure ” setting using the rotary
knob, press the SELECT key to set the delay detection level to “Volts ” or “%”.25. Use the rotary knob to select the screen below and press the SELECT key to
display the value setting box.26. Use the rotary knob to set the desired value. Press the RESET key to restore
the new value to the default value.27. Press the SELECT key or the ESC key to close the value setting box.
Setting the reference waveform28. After steps 17 to 25 have been completed, and after having selected “Trace ” of
the “Reference ” setting using the rotary knob, press the SELECT key to selectthe trace or loaded waveform to be used as reference.
29. After having selected “Edge Polarity ” of the “Reference ” setting using therotary knob, press the SELECT key to select rising edge or falling edge.
30. After having selected “Edge Count ” of the “Reference ” setting using the rotaryknob, press the SELECT key to display the count setting box.
31. Use the rotary knob to set the desired count number. Press the RESET key torestore the new value to the default value.
32. Press the SELECT key or the ESC key to close the count setting box.33. After having selected “Threshold ” of the “Reference ” setting using the rotary
knob, press the SELECT key to set the delay detection level to “Volts ” or “%”.34. Use the rotary knob to select the screen below and press the SELECT key to
display the value setting box.35. Use the rotary knob to set the desired value. Press the RESET key to restore
the new value to the default value.36. Press the SELECT key or the ESC key to close the value setting box.37. Repeat steps 16 to 34 in case you want to set delay measurement for other
trace or loaded waveforms.
Returning to the top menu38. Press the “To Topmenu ” soft key or the ESC key to return to the automated
measurement setting menu.
8.3 Measuring Waveform Parameters Automatically
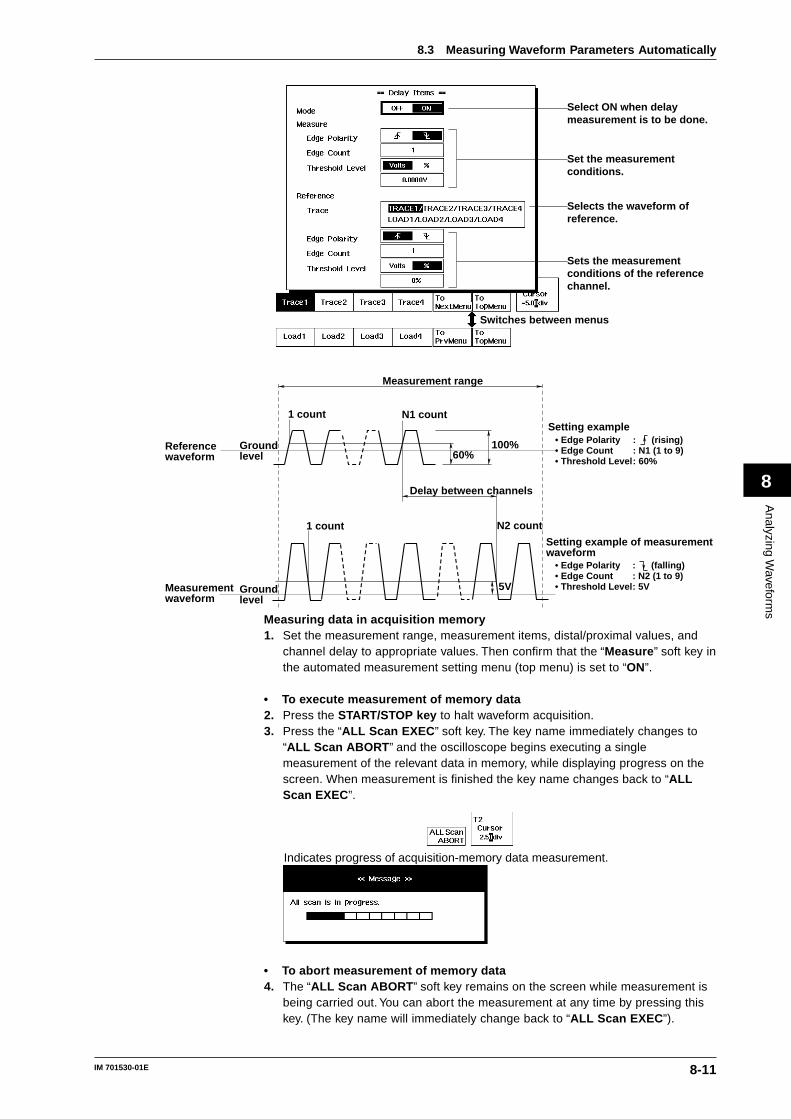
8-11IM 701530-01E
Analyzing W
aveforms
8
Switches between menus
Select ON when delay measurement is to be done.
Set the measurement conditions.
Sets the measurement conditions of the reference channel.
Selects the waveform of reference.
Reference waveform
Measurementwaveform
Groundlevel
Ground level
1 count N1 count
1 count N2 count
Delay between channels
100%60%
5V
• Edge Polarity• Edge Count• Threshold Level
Setting example
Setting example of measurement waveform
Measurement range
: (rising): N1 (1 to 9): 60%
• Edge Polarity• Edge Count• Threshold Level
: (falling): N2 (1 to 9): 5V
Measuring data in acquisition memory1. Set the measurement range, measurement items, distal/proximal values, and
channel delay to appropriate values. Then confirm that the “Measure ” soft key inthe automated measurement setting menu (top menu) is set to “ON”.
• To execute measurement of memory data2. Press the START/STOP key to halt waveform acquisition.3. Press the “ALL Scan EXEC ” soft key. The key name immediately changes to
“ALL Scan ABORT ” and the oscilloscope begins executing a singlemeasurement of the relevant data in memory, while displaying progress on thescreen. When measurement is finished the key name changes back to “ALLScan EXEC ”.
Indicates progress of acquisition-memory data measurement.
• To abort measurement of memory data4. The “ALL Scan ABORT ” soft key remains on the screen while measurement is
being carried out. You can abort the measurement at any time by pressing thiskey. (The key name will immediately change back to “ALL Scan EXEC ”).
8.3 Measuring Waveform Parameters Automatically
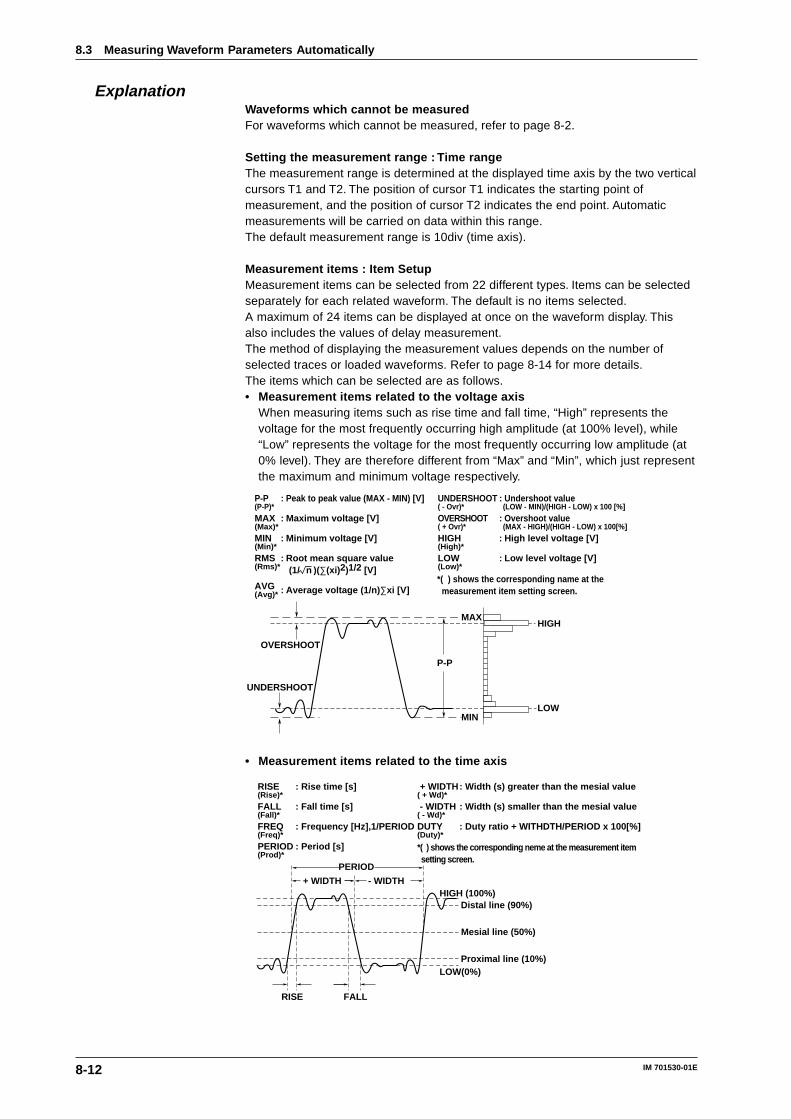
8-12 IM 701530-01E
ExplanationWaveforms which cannot be measuredFor waveforms which cannot be measured, refer to page 8-2.
Setting the measurement range : Time rangeThe measurement range is determined at the displayed time axis by the two verticalcursors T1 and T2. The position of cursor T1 indicates the starting point ofmeasurement, and the position of cursor T2 indicates the end point. Automaticmeasurements will be carried on data within this range.The default measurement range is 10div (time axis).
Measurement items : Item SetupMeasurement items can be selected from 22 different types. Items can be selectedseparately for each related waveform. The default is no items selected.A maximum of 24 items can be displayed at once on the waveform display. Thisalso includes the values of delay measurement.The method of displaying the measurement values depends on the number ofselected traces or loaded waveforms. Refer to page 8-14 for more details.The items which can be selected are as follows.• Measurement items related to the voltage axis
When measuring items such as rise time and fall time, “High” represents thevoltage for the most frequently occurring high amplitude (at 100% level), while“Low” represents the voltage for the most frequently occurring low amplitude (at0% level). They are therefore different from “Max” and “Min”, which just representthe maximum and minimum voltage respectively.
P-P
MAX
MIN
HIGH
LOW
OVERSHOOT
UNDERSHOOT
P-P(P-P)*
MAX(Max)*
MIN(Min)*
RMS(Rms)*
AVG(Avg)*
: Peak to peak value (MAX - MIN) [V]
: Maximum voltage [V]
: Minimum voltage [V]
: Root mean square value (1/ n )(∑(xi)2)1/2 [V]
: Average voltage (1/n)∑xi [V]
UNDERSHOOT( - Ovr)*
OVERSHOOT( + Ovr)*
HIGH(High)*
LOW(Low)*
: Undershoot value (LOW - MIN)/(HIGH - LOW) x 100 [%]
: Overshoot value (MAX - HIGH)/(HIGH - LOW) x 100[%]
: High level voltage [V]
: Low level voltage [V]
*( ) shows the corresponding name at the measurement item setting screen.
• Measurement items related to the time axis
+ WIDTH - WIDTH
PERIOD
Distal line (90%)
Mesial line (50%)
Proximal line (10%)
RISE FALL
HIGH (100%)
LOW(0%)
RISE(Rise)*
FALL(Fall)*
FREQ(Freq)*
PERIOD(Prod)*
: Rise time [s]
: Fall time [s]
: Frequency [Hz],1/PERIOD
: Period [s]
+ WIDTH( + Wd)*
- WIDTH( - Wd)*
DUTY(Duty)*
: Width (s) greater than the mesial value
: Width (s) smaller than the mesial value
: Duty ratio + WITHDTH/PERIOD x 100[%]
*( ) shows the corresponding neme at the measurement item setting screen.
8.3 Measuring Waveform Parameters Automatically
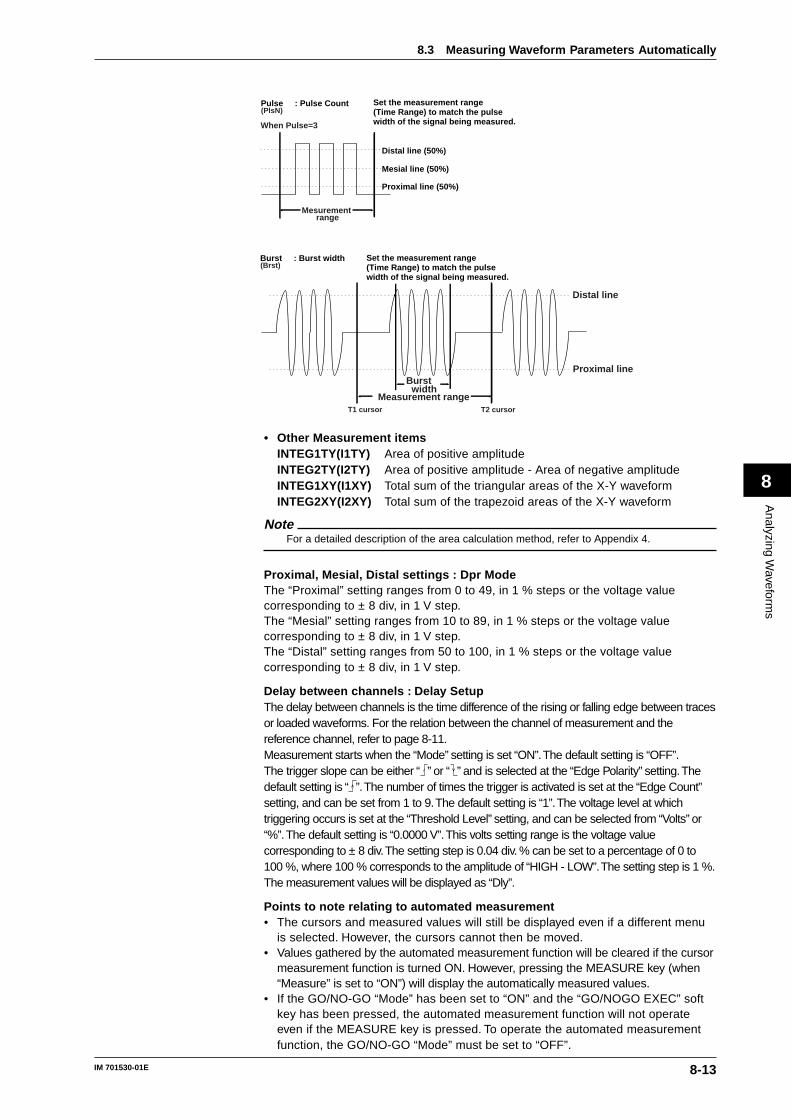
8-13IM 701530-01E
Analyzing W
aveforms
8
Mesurement range
Pulse : Pulse Count
Mesial line (50%)
When Pulse=3
Set the measurement range (Time Range) to match the pulse width of the signal being measured.
(PlsN)
Distal line (50%)
Proximal line (50%)
Burst width
Distal line
Proximal line
Measurement range
Set the measurement range (Time Range) to match the pulse width of the signal being measured.
Burst : Burst width(Brst)
T1 cursor T2 cursor
• Other Measurement itemsINTEG1TY(I1TY) Area of positive amplitudeINTEG2TY(I2TY) Area of positive amplitude - Area of negative amplitudeINTEG1XY(I1XY) Total sum of the triangular areas of the X-Y waveformINTEG2XY(I2XY) Total sum of the trapezoid areas of the X-Y waveform
NoteFor a detailed description of the area calculation method, refer to Appendix 4.
Proximal, Mesial, Distal settings : Dpr ModeThe “Proximal” setting ranges from 0 to 49, in 1 % steps or the voltage valuecorresponding to ± 8 div, in 1 V step.The “Mesial” setting ranges from 10 to 89, in 1 % steps or the voltage valuecorresponding to ± 8 div, in 1 V step.The “Distal” setting ranges from 50 to 100, in 1 % steps or the voltage valuecorresponding to ± 8 div, in 1 V step.
Delay between channels : Delay SetupThe delay between channels is the time difference of the rising or falling edge between tracesor loaded waveforms. For the relation between the channel of measurement and thereference channel, refer to page 8-11.Measurement starts when the “Mode” setting is set “ON”. The default setting is “OFF”.The trigger slope can be either “ ” or “ ” and is selected at the “Edge Polarity” setting. Thedefault setting is “ ”. The number of times the trigger is activated is set at the “Edge Count”setting, and can be set from 1 to 9. The default setting is “1”. The voltage level at whichtriggering occurs is set at the “Threshold Level” setting, and can be selected from “Volts” or“%”. The default setting is “0.0000 V”. This volts setting range is the voltage valuecorresponding to ± 8 div. The setting step is 0.04 div. % can be set to a percentage of 0 to100 %, where 100 % corresponds to the amplitude of “HIGH - LOW”. The setting step is 1 %.The measurement values will be displayed as “Dly”.
Points to note relating to automated measurement• The cursors and measured values will still be displayed even if a different menu
is selected. However, the cursors cannot then be moved.• Values gathered by the automated measurement function will be cleared if the cursor
measurement function is turned ON. However, pressing the MEASURE key (when“Measure” is set to “ON”) will display the automatically measured values.
• If the GO/NO-GO “Mode” has been set to “ON” and the “GO/NOGO EXEC” softkey has been pressed, the automated measurement function will not operateeven if the MEASURE key is pressed. To operate the automated measurementfunction, the GO/NO-GO “Mode” must be set to “OFF”.
8.3 Measuring Waveform Parameters Automatically
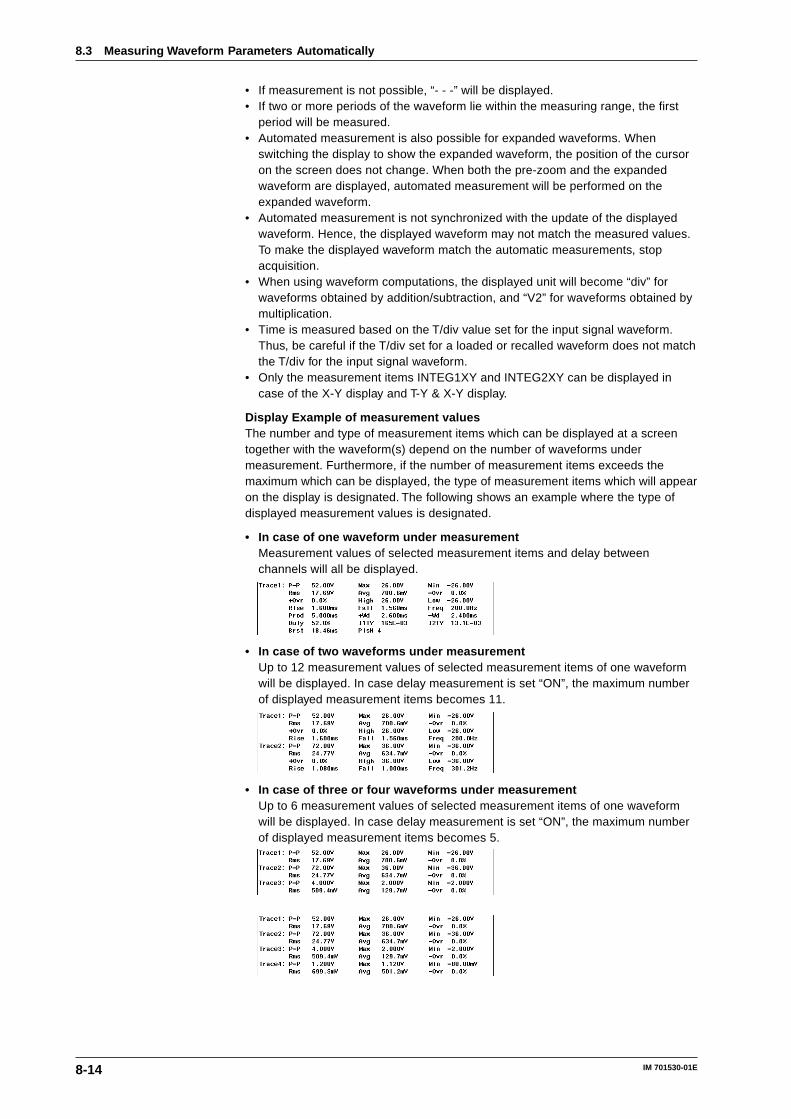
8-14 IM 701530-01E
• If measurement is not possible, “- - -” will be displayed.• If two or more periods of the waveform lie within the measuring range, the first
period will be measured.• Automated measurement is also possible for expanded waveforms. When
switching the display to show the expanded waveform, the position of the cursoron the screen does not change. When both the pre-zoom and the expandedwaveform are displayed, automated measurement will be performed on theexpanded waveform.
• Automated measurement is not synchronized with the update of the displayedwaveform. Hence, the displayed waveform may not match the measured values.To make the displayed waveform match the automatic measurements, stopacquisition.
• When using waveform computations, the displayed unit will become “div” forwaveforms obtained by addition/subtraction, and “V2” for waveforms obtained bymultiplication.
• Time is measured based on the T/div value set for the input signal waveform.Thus, be careful if the T/div set for a loaded or recalled waveform does not matchthe T/div for the input signal waveform.
• Only the measurement items INTEG1XY and INTEG2XY can be displayed incase of the X-Y display and T-Y & X-Y display.
Display Example of measurement valuesThe number and type of measurement items which can be displayed at a screentogether with the waveform(s) depend on the number of waveforms undermeasurement. Furthermore, if the number of measurement items exceeds themaximum which can be displayed, the type of measurement items which will appearon the display is designated. The following shows an example where the type ofdisplayed measurement values is designated.
• In case of one waveform under measurementMeasurement values of selected measurement items and delay betweenchannels will all be displayed.
• In case of two waveforms under measurementUp to 12 measurement values of selected measurement items of one waveformwill be displayed. In case delay measurement is set “ON”, the maximum numberof displayed measurement items becomes 11.
• In case of three or four waveforms under measurementUp to 6 measurement values of selected measurement items of one waveformwill be displayed. In case delay measurement is set “ON”, the maximum numberof displayed measurement items becomes 5.
8.3 Measuring Waveform Parameters Automatically
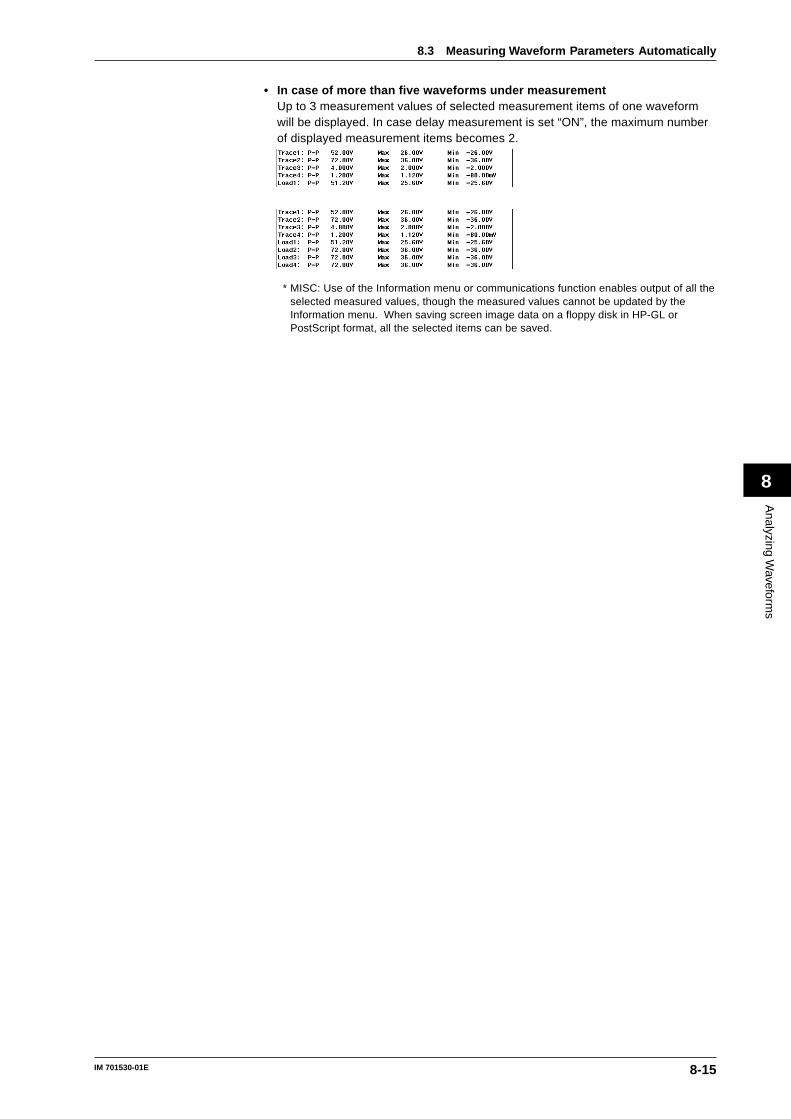
8-15IM 701530-01E
Analyzing W
aveforms
8
• In case of more than five waveforms under measurementUp to 3 measurement values of selected measurement items of one waveformwill be displayed. In case delay measurement is set “ON”, the maximum numberof displayed measurement items becomes 2.
* MISC: Use of the Information menu or communications function enables output of all theselected measured values, though the measured values cannot be updated by theInformation menu. When saving screen image data on a floppy disk in HP-GL orPostScript format, all the selected items can be saved.
8.3 Measuring Waveform Parameters Automatically
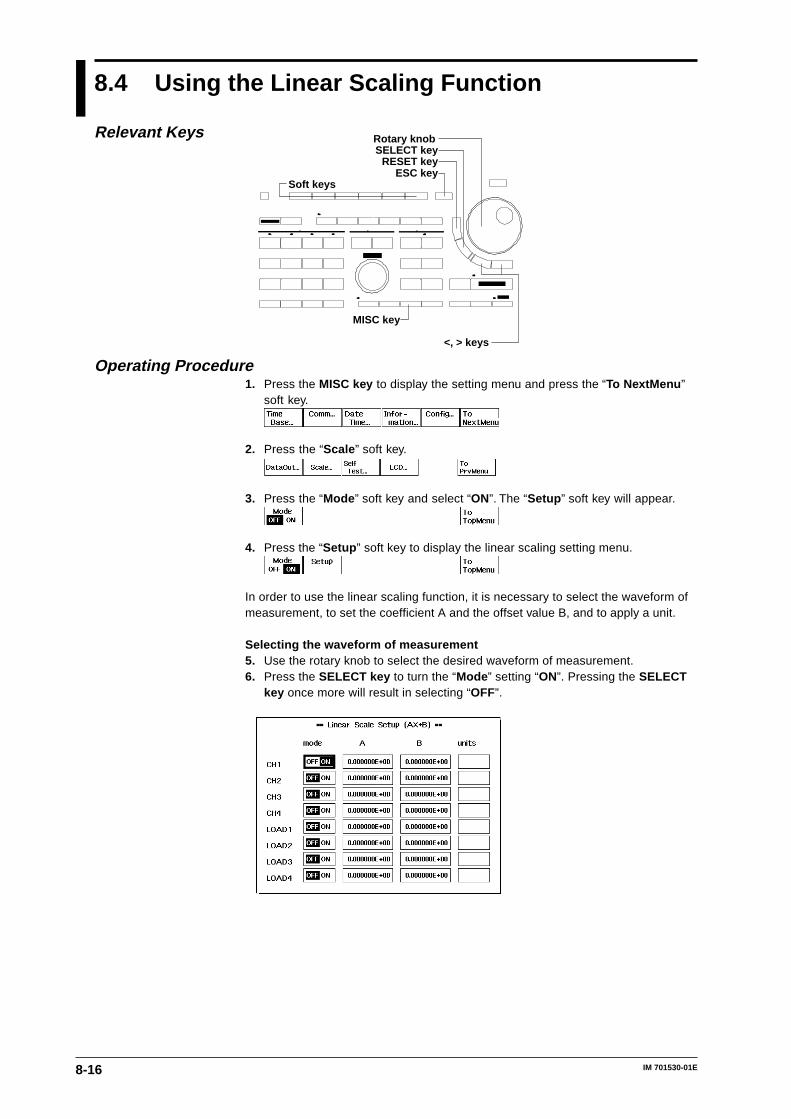
8-16 IM 701530-01E
8.4 Using the Linear Scaling Function
Operating Procedure1. Press the MISC key to display the setting menu and press the “To NextMenu ”
soft key.
2. Press the “Scale ” soft key.
3. Press the “Mode ” soft key and select “ON”. The “Setup ” soft key will appear.
4. Press the “Setup ” soft key to display the linear scaling setting menu.
In order to use the linear scaling function, it is necessary to select the waveform ofmeasurement, to set the coefficient A and the offset value B, and to apply a unit.
Selecting the waveform of measurement5. Use the rotary knob to select the desired waveform of measurement.6. Press the SELECT key to turn the “Mode ” setting “ON”. Pressing the SELECT
key once more will result in selecting “OFF”.
Relevant Keys Rotary knob
Soft keys
SELECT key
ESC keyRESET key
<, > keys
MISC key
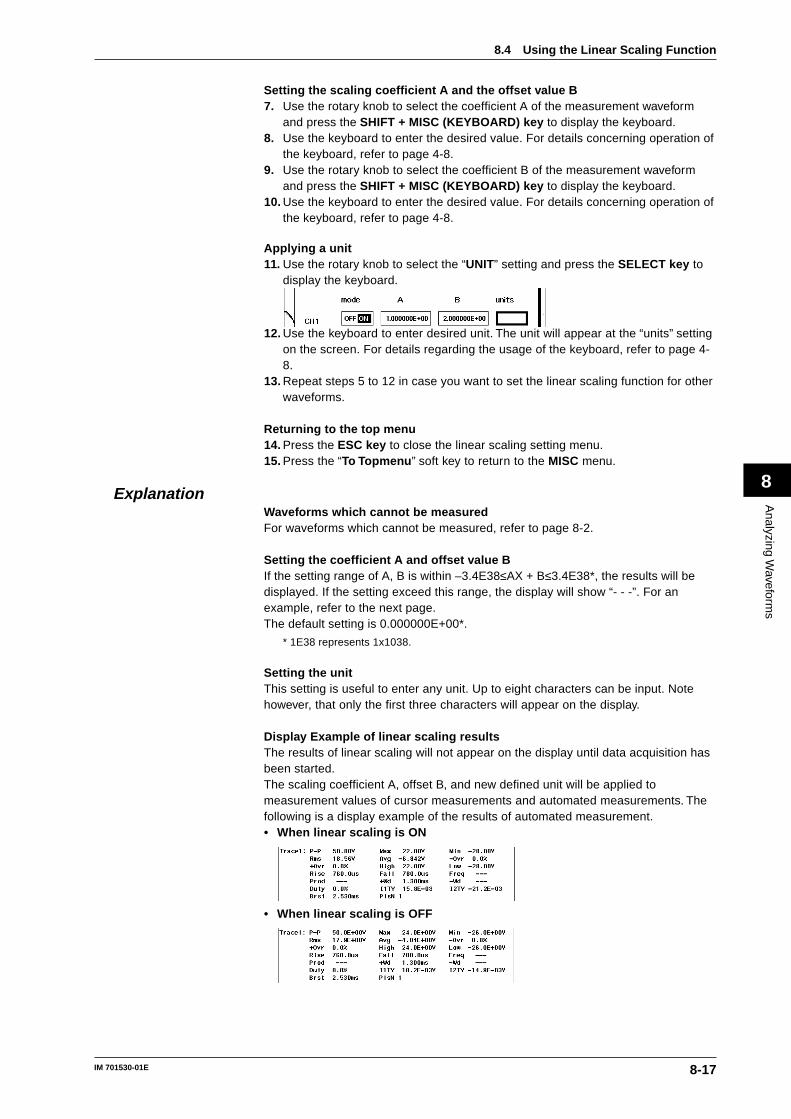
8-17IM 701530-01E
Analyzing W
aveforms
8
Setting the scaling coefficient A and the offset value B7. Use the rotary knob to select the coefficient A of the measurement waveform
and press the SHIFT + MISC (KEYBOARD) key to display the keyboard.8. Use the keyboard to enter the desired value. For details concerning operation of
the keyboard, refer to page 4-8.9. Use the rotary knob to select the coefficient B of the measurement waveform
and press the SHIFT + MISC (KEYBOARD) key to display the keyboard.10. Use the keyboard to enter the desired value. For details concerning operation of
the keyboard, refer to page 4-8.
Applying a unit11. Use the rotary knob to select the “UNIT” setting and press the SELECT key to
display the keyboard.
12. Use the keyboard to enter desired unit. The unit will appear at the “units” settingon the screen. For details regarding the usage of the keyboard, refer to page 4-8.
13. Repeat steps 5 to 12 in case you want to set the linear scaling function for otherwaveforms.
Returning to the top menu14. Press the ESC key to close the linear scaling setting menu.15. Press the “To Topmenu ” soft key to return to the MISC menu.
ExplanationWaveforms which cannot be measuredFor waveforms which cannot be measured, refer to page 8-2.
Setting the coefficient A and offset value BIf the setting range of A, B is within –3.4E38≤AX + B≤3.4E38*, the results will bedisplayed. If the setting exceed this range, the display will show “- - -”. For anexample, refer to the next page.The default setting is 0.000000E+00*.
* 1E38 represents 1x1038.
Setting the unitThis setting is useful to enter any unit. Up to eight characters can be input. Notehowever, that only the first three characters will appear on the display.
Display Example of linear scaling resultsThe results of linear scaling will not appear on the display until data acquisition hasbeen started.The scaling coefficient A, offset B, and new defined unit will be applied tomeasurement values of cursor measurements and automated measurements. Thefollowing is a display example of the results of automated measurement.• When linear scaling is ON
• When linear scaling is OFF
8.4 Using the Linear Scaling Function
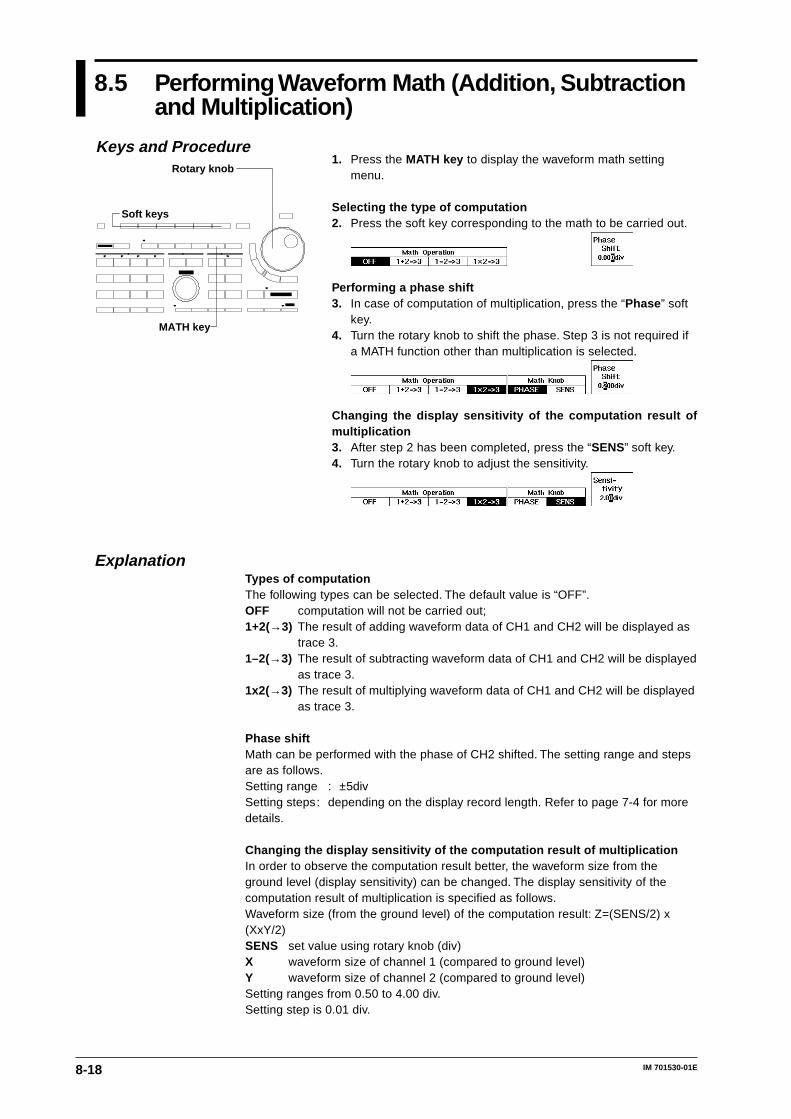
8-18 IM 701530-01E
8.5 Performing Waveform Math (Addition, Subtractionand Multiplication)
1. Press the MATH key to display the waveform math settingmenu.
Selecting the type of computation2. Press the soft key corresponding to the math to be carried out.
Performing a phase shift3. In case of computation of multiplication, press the “Phase ” soft
key.4. Turn the rotary knob to shift the phase. Step 3 is not required if
a MATH function other than multiplication is selected.
Changing the display sensitivity of the computation result ofmultiplication3. After step 2 has been completed, press the “SENS” soft key.4. Turn the rotary knob to adjust the sensitivity.
ExplanationTypes of computationThe following types can be selected. The default value is “OFF”.OFF computation will not be carried out;1+2(→3) The result of adding waveform data of CH1 and CH2 will be displayed as
trace 3.1–2(→3) The result of subtracting waveform data of CH1 and CH2 will be displayed
as trace 3.1x2(→3) The result of multiplying waveform data of CH1 and CH2 will be displayed
as trace 3.
Phase shiftMath can be performed with the phase of CH2 shifted. The setting range and stepsare as follows.Setting range : ±5divSetting steps: depending on the display record length. Refer to page 7-4 for moredetails.
Changing the display sensitivity of the computation result of multiplicationIn order to observe the computation result better, the waveform size from theground level (display sensitivity) can be changed. The display sensitivity of thecomputation result of multiplication is specified as follows.Waveform size (from the ground level) of the computation result: Z=(SENS/2) x(XxY/2)SENS set value using rotary knob (div)X waveform size of channel 1 (compared to ground level)Y waveform size of channel 2 (compared to ground level)Setting ranges from 0.50 to 4.00 div.Setting step is 0.01 div.
Keys and Procedure
MATH key
Soft keys
Rotary knob
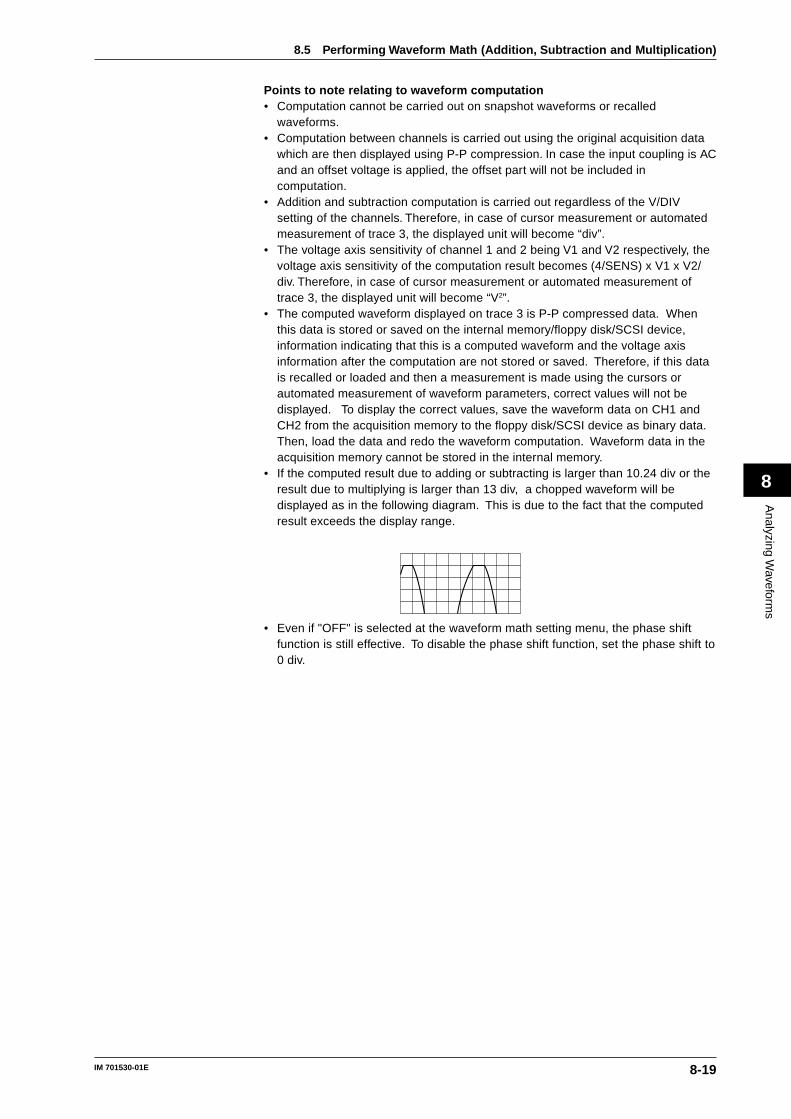
8-19IM 701530-01E
Analyzing W
aveforms
8
Points to note relating to waveform computation• Computation cannot be carried out on snapshot waveforms or recalled
waveforms.• Computation between channels is carried out using the original acquisition data
which are then displayed using P-P compression. In case the input coupling is ACand an offset voltage is applied, the offset part will not be included incomputation.
• Addition and subtraction computation is carried out regardless of the V/DIVsetting of the channels. Therefore, in case of cursor measurement or automatedmeasurement of trace 3, the displayed unit will become “div”.
• The voltage axis sensitivity of channel 1 and 2 being V1 and V2 respectively, thevoltage axis sensitivity of the computation result becomes (4/SENS) x V1 x V2/div. Therefore, in case of cursor measurement or automated measurement oftrace 3, the displayed unit will become “V2”.
• The computed waveform displayed on trace 3 is P-P compressed data. Whenthis data is stored or saved on the internal memory/floppy disk/SCSI device,information indicating that this is a computed waveform and the voltage axisinformation after the computation are not stored or saved. Therefore, if this datais recalled or loaded and then a measurement is made using the cursors orautomated measurement of waveform parameters, correct values will not bedisplayed. To display the correct values, save the waveform data on CH1 andCH2 from the acquisition memory to the floppy disk/SCSI device as binary data.Then, load the data and redo the waveform computation. Waveform data in theacquisition memory cannot be stored in the internal memory.
• If the computed result due to adding or subtracting is larger than 10.24 div or theresult due to multiplying is larger than 13 div, a chopped waveform will bedisplayed as in the following diagram. This is due to the fact that the computedresult exceeds the display range.
• Even if "OFF" is selected at the waveform math setting menu, the phase shiftfunction is still effective. To disable the phase shift function, set the phase shift to0 div.
8.5 Performing Waveform Math (Addition, Subtraction and Multiplication)
8-20 IM 701530-01E
8.6 Displaying the Power Spectrum (PerformingFFT Computation)
1. Press the SHIFT + MATH (FFT) key to display the FFTcomputation setting menu.
2. Press the “FFT” soft key and select “ON”.
Selecting the waveform of measurement3. Press the “Trace ” soft key to display the trace selection menu.4. Press the soft key corresponding to the trace you want to
measure.
Selecting the time window3. After step 2 has been completed, press the “RECT” or the
“HANNING” soft key to select the time window.
Selecting the display format3. After step 2 has been completed, press the “VT&FFT” or the
“FFT” soft key to select the display format.
ExplanationWaveforms on which FFT computation can be performedFFT computation can be performed on any one trace selectable from trace 1 totrace 4.
Selecting the time windowThe time window can be selected from the following window types.RECT (rectangular window)
Useful for transient signals which attenuate completely within the timewindow
HANNING Useful for signals which are continuous and not periodical
FFT frequency bandMaximum 50 MHz
Display formatThe display format depends on the expansion settings. Refer to page 7-5 for moredetails.
Points to note relating to displaying the power spectrum• FFT computation is not possible in repetitive sampling mode or when the
acquisition mode is envelope mode.• FFT computation is not possible when the Waveform’s Horizontal Position set
except to 0div.• The unit of the voltage axis is [dBV].• In case the waveform is expanded, FFT computation will be carried out on the
expanded range.• FFT computation is not possible when the wide screen mode is turned ON.
Turning ON the FFT while the wide screen mode is ON automatically turns OFFthe wide screen mode.
Keys and Procedure
MATH(FFT) key
Soft keys
SHIFT key
Upper-limitvalue
Lower-limitvalue
The upper and lower limits ofthe power spectrum displaytake on fixed values dependingon the vertical sensitivity(V/div) as shown in the figurebelow. They are not displayedon the screen.
V/div
5000 V2000 V1000 V500 V200 V100 V50 V20 V10 V5 V2 V1 V500 mV200 mV100 mV50 mV20 mV10 mV5 mV2 mV1 mV
Upper-limitvalue(dBV)1009080807060605040403020201000–10–20–20–30–40
Lower-limitvalue(dBV)201000–10–20–20–30–40–40–50–60–60–70–80–80–90–100–100–110–120
8-21IM 701530-01E
Analyzing W
aveforms
8
8.7 Measuring the Power Spectrum using Cursors
1. Display the power spectrum. For details, refer to the previouspage.
2. Press the CURSOR key to display the cursor measurementsetting menu.
3. Press the “Cursor ” soft key and select “ON”.4. After having pressed any of the “F1”, “F2” or “F1&F2” soft keys,
use the rotary knob to adjust the position of the vertical cursor.You may also use the < or > key.
ExplanationWaveforms which can be measuredWaveforms which can be measured are the same on which FFT computation canbe performed. Refer to the previous page for more details.Measurement itemsThe following items can be measured.
F1(X) Frequency at the position of cursor F1.F2(X) Frequency at the position of cursor F2.DF(X) F2–F1P1(X) Frequency level at the position of cursor F1.P2(X) Frequency level at the position of cursor F2.DP(X) P2–P1(X) indicates the waveform of measurement.
Cursor movement methodThe cursors can be selected as follows.
F1 Moves cursor F1 only.F2 Moves cursor F2 only.F1&F2 Moves both cursors F1 and F2 simultaneously without changing the
distance between them.Cursor movement rangeEach vertical cursor can be moved to 501 different positions from the left edge (–5.00 div) to the right edge (5.00 div) of the waveform display frame. However, thereis no data at the 501 position of the rigth edge. Thus, when you move the cursor tothis position, the display will show “- - -”The default setting is –2.50 div for T1 and 2.50 div for T2.Points to note when performing cursor measurements• The cursors and measured values will still be displayed even if a different menu
is selected. However, the cursors cannot then be moved.• Cursor-measured values will be cleared if the automated measurement function
is turned ON. However, pressing the CURSOR key (when “Cursor” is set to “ON”)will display the cursor-measured values.
• If the GO/NO-GO “Mode” has been set to “ON” and the “GO/NOGO EXEC” softkey has been pressed, the cursor measurement function will not operate even ifthe CURSOR key is pressed. To operate the cursor measurement function, theGO/NO-GO “Mode” must be set to “OFF”.
• If measurement is not possible, “- - -” will be displayed.• Cursor measurement is also possible for expanded waveforms. When switching
the display to show the expanded waveform, the position of the cursor on thescreen does not change. When both the pre-zoom and the expanded waveformare displayed, cursor measurement will be performed on the expandedwaveform.
• There might be cases where the displayed waveform is not in synchronizationwith the measurement values. To synchronize, stop data acquistion.
Keys and Procedure
CURSOR key
Rotary knob
Soft keys
<, > keys
F1 cursor F2 cursor
9-1IM 701530-01E
Perform
ing a GO
/NO
-GO
Action
9
9.1 Judging using a Waveform Zone
Operating Procedure1. Press the GO/NO-GO key to display the GO/NO-GO setting menu.2. Press the “Mode ” soft key and select “ON”. The GO/NO-GO top menu appears.3. Press the “ZONE” soft key. The default setting is “ZONE”.
When using the GO/NO-GO determination funtion, the following settings/selectionscan be specified.• Creating the determination zone (refer to page 9-1, 9-2);• Saving the determination zone (refer to page 9-3);• Redrawing/editing the saved determination zone (refer to page 9-3);• Setting up the determination conditions (refer to page 9-4, 9-5);
trace conditions, determination logic, determination sequence, action afterdetermination
• Executing and aborting the determination function (refer to page 9-5).
Note• The determination waveforms are saved in the internal memory. Old determination waveforms
which are already present in the internal memory, will be overwritten when new ones will besaved. An error message will not appear. Therefore, verify before saving whether or notdetermination waveforms already exist in the internal memory. Refer to steps 18 to 20.
• Only below buttons can be operated, when a zone waveform is being created:Soft keys, SELECT key, RESET key, <, > keys, Rotary knobIf any other button is being pushed the following message will appear:"This key cannot be operated when the zone wave edit mode is in progress."
Creating the Waveform4. Press the “Edit... ” soft key of the GO/NO-GO top menu. The zone creation
menu will appear.
5. Press the “NEW...” soft key and the base trace menu will appear.
6. Press the soft key corresponding to the desired base trace. To edit the entirewaveform, continue with step 7; to edit a part of the waveform, continue withstep 10.
Relevant Keys Rotary knob
Soft keys
SELECT key
ESC key
<, > keys
GO/NO-GO key
Chapter 9 Performing a GO/NO-GO Action
9-2 IM 701530-01E
Editing the whole waveform7. Press the “WHOLE” soft key to display the editing menu. The default setting is
“WHOLE”.8. After having pressed the “Move ” soft key to select the editing direction, use the
rotary knob to edit the zone. You may also use the < or > keys.
Example in case “ ” is set at the “MOVE” setting.
Example in case “ ” is set at the “MOVE” setting, following the previousexample.
Example in case “ ” is set at the “MOVE” setting, following the previousexample.
Example in case “ ” is set at the “MOVE” setting, following the previousexample.
9. Repeat step 8 until editing the waveform has been completed. To edit a part ofthe waveform, continue with step 10; if editing has been completed, continuewith step 14.
Editing a part of the waveform10. After having completed step 6 or step 9, press the “PART” soft key to display the
editing menu.11. After having pressed the “T-Range ” soft key, select either “T1” or “T2” to set
either boudary of the setting range. Then use the rotary knob to edit theboundary position. You may also use the < or > keys. Do this for both the left(T1) and right side boundary (T2).
12. After having pressed the “Zone ” soft key to select the editing direction, use therotary knob to edit the zone. You may also use the < or > keys.
Example in case “ ” is set at the “ZONE” setting, following the previous zoneediting example.
Example in case “ ” is set at the “ZONE” setting, following the previousexample.
13. Repeat steps 11 and 12 until partial editing of the waveform has beencompleted.
Completing editing the waveform14. After having completed editing the waveform, press the “DONE” soft key to
display the saving menu.
9.1 Judging using a Waveform Zone
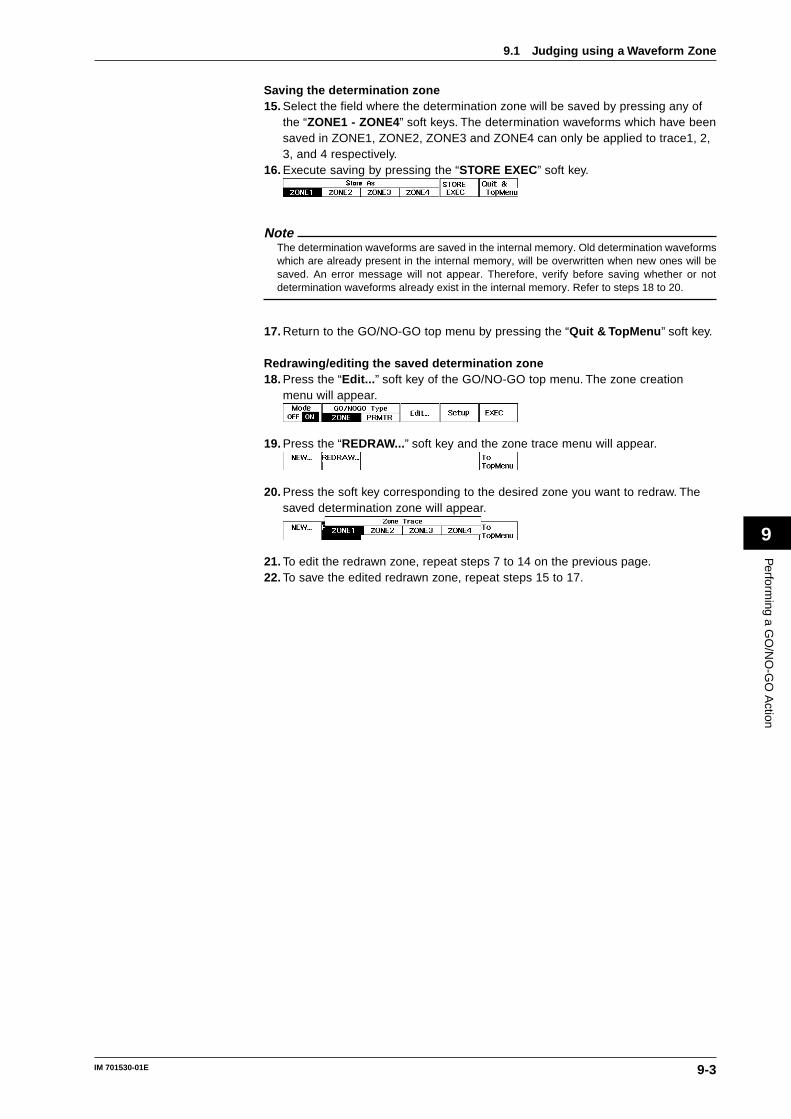
9-3IM 701530-01E
Perform
ing a GO
/NO
-GO
Action
9
Saving the determination zone15. Select the field where the determination zone will be saved by pressing any of
the “ZONE1 - ZONE4” soft keys. The determination waveforms which have beensaved in ZONE1, ZONE2, ZONE3 and ZONE4 can only be applied to trace1, 2,3, and 4 respectively.
16. Execute saving by pressing the “STORE EXEC” soft key.
NoteThe determination waveforms are saved in the internal memory. Old determination waveformswhich are already present in the internal memory, will be overwritten when new ones will besaved. An error message will not appear. Therefore, verify before saving whether or notdetermination waveforms already exist in the internal memory. Refer to steps 18 to 20.
17. Return to the GO/NO-GO top menu by pressing the “Quit & TopMenu ” soft key.
Redrawing/editing the saved determination zone18. Press the “Edit... ” soft key of the GO/NO-GO top menu. The zone creation
menu will appear.
19. Press the “REDRAW...” soft key and the zone trace menu will appear.
20. Press the soft key corresponding to the desired zone you want to redraw. Thesaved determination zone will appear.
21. To edit the redrawn zone, repeat steps 7 to 14 on the previous page.22. To save the edited redrawn zone, repeat steps 15 to 17.
9.1 Judging using a Waveform Zone
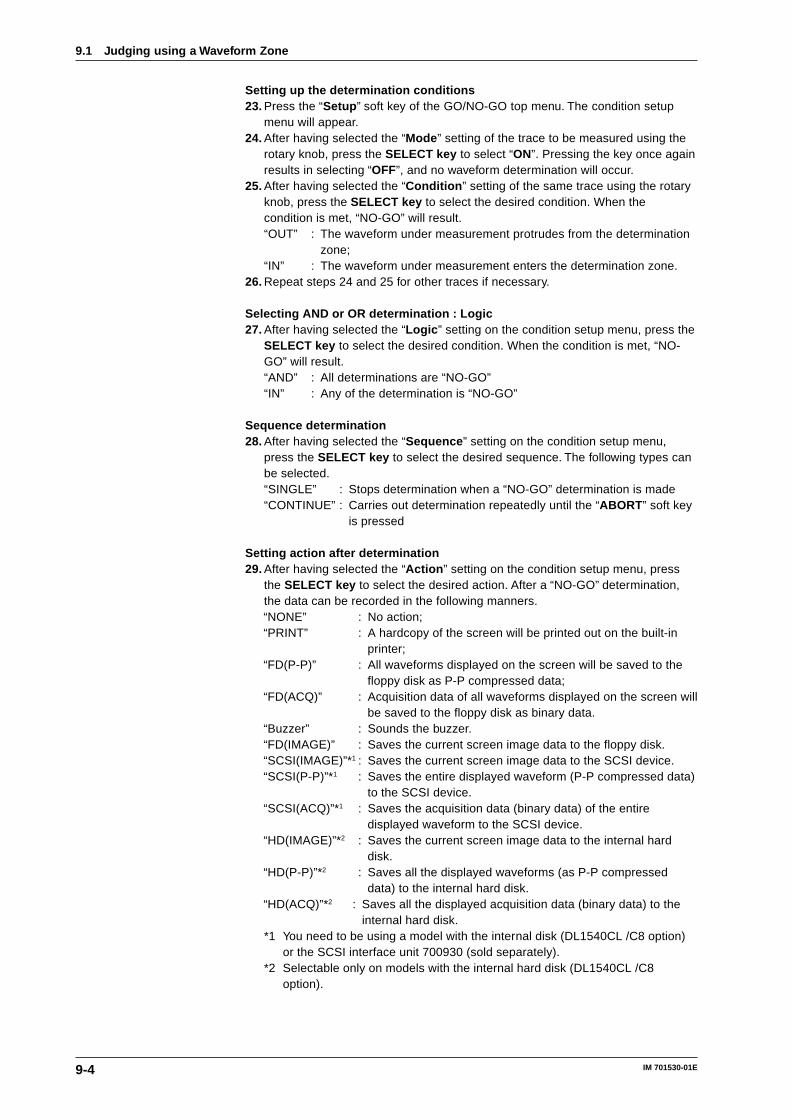
9-4 IM 701530-01E
Setting up the determination conditions23. Press the “Setup ” soft key of the GO/NO-GO top menu. The condition setup
menu will appear.24. After having selected the “Mode ” setting of the trace to be measured using the
rotary knob, press the SELECT key to select “ON”. Pressing the key once againresults in selecting “OFF”, and no waveform determination will occur.
25. After having selected the “Condition ” setting of the same trace using the rotaryknob, press the SELECT key to select the desired condition. When thecondition is met, “NO-GO” will result.“OUT” : The waveform under measurement protrudes from the determination
zone;“IN” : The waveform under measurement enters the determination zone.
26. Repeat steps 24 and 25 for other traces if necessary.
Selecting AND or OR determination : Logic27. After having selected the “Logic ” setting on the condition setup menu, press the
SELECT key to select the desired condition. When the condition is met, “NO-GO” will result.“AND” : All determinations are “NO-GO”“IN” : Any of the determination is “NO-GO”
Sequence determination28. After having selected the “Sequence ” setting on the condition setup menu,
press the SELECT key to select the desired sequence. The following types canbe selected.“SINGLE” : Stops determination when a “NO-GO” determination is made“CONTINUE” : Carries out determination repeatedly until the “ABORT ” soft key
is pressed
Setting action after determination29. After having selected the “Action ” setting on the condition setup menu, press
the SELECT key to select the desired action. After a “NO-GO” determination,the data can be recorded in the following manners.“NONE” : No action;“PRINT” : A hardcopy of the screen will be printed out on the built-in
printer;“FD(P-P)” : All waveforms displayed on the screen will be saved to the
floppy disk as P-P compressed data;“FD(ACQ)” : Acquisition data of all waveforms displayed on the screen will
be saved to the floppy disk as binary data.“Buzzer” : Sounds the buzzer.“FD(IMAGE)” : Saves the current screen image data to the floppy disk.“SCSI(IMAGE)”*1 : Saves the current screen image data to the SCSI device.“SCSI(P-P)”*1 : Saves the entire displayed waveform (P-P compressed data)
to the SCSI device.“SCSI(ACQ)”*1 : Saves the acquisition data (binary data) of the entire
displayed waveform to the SCSI device.“HD(IMAGE)”*2 : Saves the current screen image data to the internal hard
disk.“HD(P-P)”*2 : Saves all the displayed waveforms (as P-P compressed
data) to the internal hard disk.“HD(ACQ)”*2 : Saves all the displayed acquisition data (binary data) to the
internal hard disk.*1 You need to be using a model with the internal disk (DL1540CL /C8 option)
or the SCSI interface unit 700930 (sold separately).*2 Selectable only on models with the internal hard disk (DL1540CL /C8
option).
9.1 Judging using a Waveform Zone
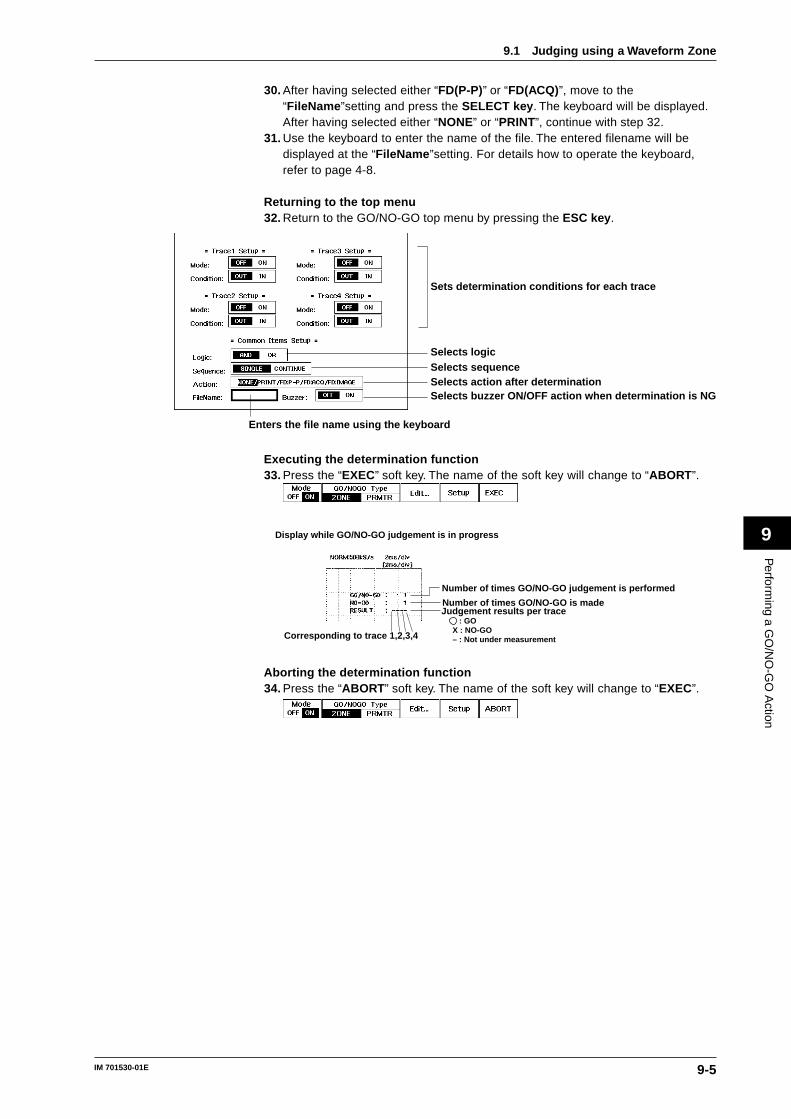
9-5IM 701530-01E
Perform
ing a GO
/NO
-GO
Action
9
30. After having selected either “FD(P-P)” or “FD(ACQ)”, move to the“FileName ”setting and press the SELECT key . The keyboard will be displayed.After having selected either “NONE” or “PRINT”, continue with step 32.
31. Use the keyboard to enter the name of the file. The entered filename will bedisplayed at the “FileName ”setting. For details how to operate the keyboard,refer to page 4-8.
Returning to the top menu32. Return to the GO/NO-GO top menu by pressing the ESC key .
Sets determination conditions for each trace
Selects logicSelects sequenceSelects action after determinationSelects buzzer ON/OFF action when determination is NG
Enters the file name using the keyboard
Executing the determination function33. Press the “EXEC” soft key. The name of the soft key will change to “ABORT ”.
Judgement results per trace : GO X : NO-GO – : Not under measurement
Number of times GO/NO-GO judgement is performed
Number of times GO/NO-GO is made
Display while GO/NO-GO judgement is in progress
Corresponding to trace 1,2,3,4
Aborting the determination function34. Press the “ABORT ” soft key. The name of the soft key will change to “EXEC”.
9.1 Judging using a Waveform Zone
9-6 IM 701530-01E
ExplanationSelecting the reference waveform: Base TraceSelects the waveform on which the determination range is to be based. Thereference waveform can be selected from the following four types which can bedisplayed asTRACE.• Input signal waveform;• ACQ waveform data (BIN data) loaded from a floppy disk;• Computed waveform.
Editing the determination zoneUp to four determination zones can be set. The determination zone can be specifiedby expanding the reference waveform vertically and horizontally as follows.• Setting range in the vertical direction ( , )
±8div from the reference waveform, setting step is 0.02div.• Setting range in the horizontal direction ( , )
±5div from the center of the display, setting step is 0.02div.
Specifying a file name when “FD(P-P),” “FD(ACQ),” “FD(IMAGE),” “SCSI(P-P),”“SCSI(ACQ),” “SCSI(IMAGE),” “HD(P-P),” “HD(ACQ),” or “HD(IMAGE)” has beenselected as the trigger action• Specifying the file name: File Name
A file No. (starting from “0001”) is assigned to each waveform data automaticallywhen the data is saved on a floppy disk, a SCSI device, or the internal harddisk. It is possible to insert a common file name (character string consisting ofup to four characters) before the assigned file number (for instance“NOGO0000”).The entered file name is will be reset when the action becomes “NONE” or whenGO/NOGO determination is set to “OFF”.The file name will be reset if the GO/NOGO determination is executed/abortedusing EXEC and ABORT soft keys.When saving the screen image data, set the image data format. You can set theformat at the hard copy selection menu that appears by pressing theSHIFT+COPY(MENU) key (see page 12-11).
Example of data formatAfter GO/NO-GO determination has been completed, the NO-GO counts, the date,time, and the results for each trace will be saved automatically in the DL-MISCdirectory at the floppy disc. The extension is “.GNG”. These files cannot be openedusing this instrument; use a personal computer for this purpose.
JudgeCnt NoGoCnt Date Time Trace1 Trace2 Trace3 Trace4
3 1 95/03/03 10:10:10 Go NoGo Go G
5 2 95/03/03 10:10:12 NoGo Go NoGo Go
10 3 95/03/03 10:10:15 Go NoGo NoGo NoGo• • • • • • • •• • • • • • • •• • • • • • • •• • • • • • • •100 100 95/03/03 10:23:10 Go NoGo NoGo Go
Forcing determination to stop and clearing the zone waveformTo force determination to stop, press the “ABORT” soft key or set “Mode” (at theGO/NO-GO top menu) to “OFF”. To clear the displayed zone waveform, switch“Mode” (at the GO/NO-GO top menu) to “OFF”.
9.1 Judging using a Waveform Zone
9-7IM 701530-01E
Perform
ing a GO
/NO
-GO
Action
9
Points to note relating to zone determination• Trigger mode is automatically switched to single short mode/single mode
irrespective of the selected trigger mode during GO/NO-GO determination.However, determination will be repeated if the determination sequence has beenset to “CONTINUE”. Even in case the GO/NO-GO mode (at the GO/NO-GO topmenu) is changed to OFF again, the setting at the trigger mode selection will notbecome valid again.
• It is not possible to perform zone determination while both pre-zoom waveformand its expanded waveform are displayed at the same time or while an FFT or X-Y waveform is displayed. Neither is it possible to a display zone waveform. Toperform GO/NO-GO determination using a zone waveform, make sure that theexpanded waveform alone is displayed before “Mode” is set to “ON” (at the GO/NO-GO top menu).
• The following operations are not possible after having pressed the “EXEC” softkey. In order to perform these operations, it is necessary to set “Mode” (at theGO/NO-GO top menu) to “OFF”, after having pressed the “ABORT” soft key.• Initialization of the settings • Automated measurements• Auto set-up • Changing of expansion settings• Cursor measurements • Display of an X-Y waveform• Action on trigger
• A zone waveform is not displayed if the following conditions are not satisfied afterthe zone waveform has been created.• “Mode” at the GO NO-GO top menu : ON• “GO/NO-GO Type” : ZONE• “Mode” for selected trace : ON• Display for selected trace : ON (corresponding LED is lit)
• During the time in which an action is being executed after GO/NO-GOdetermination, no waveform data will be acquired.
NoteThe zone waveform generated can be retained by saving the set-up data on a floppy disk.However, “Mode” (at the GO NO-GO top menu) must be set to “ON” and “GO/NO-GO Type” to“ZONE”. For a description of how to save set-up data on a floppy disk, refer to 12.4 “Saving andLoading Set-up Data” (page 12-7).
9.1 Judging using a Waveform Zone
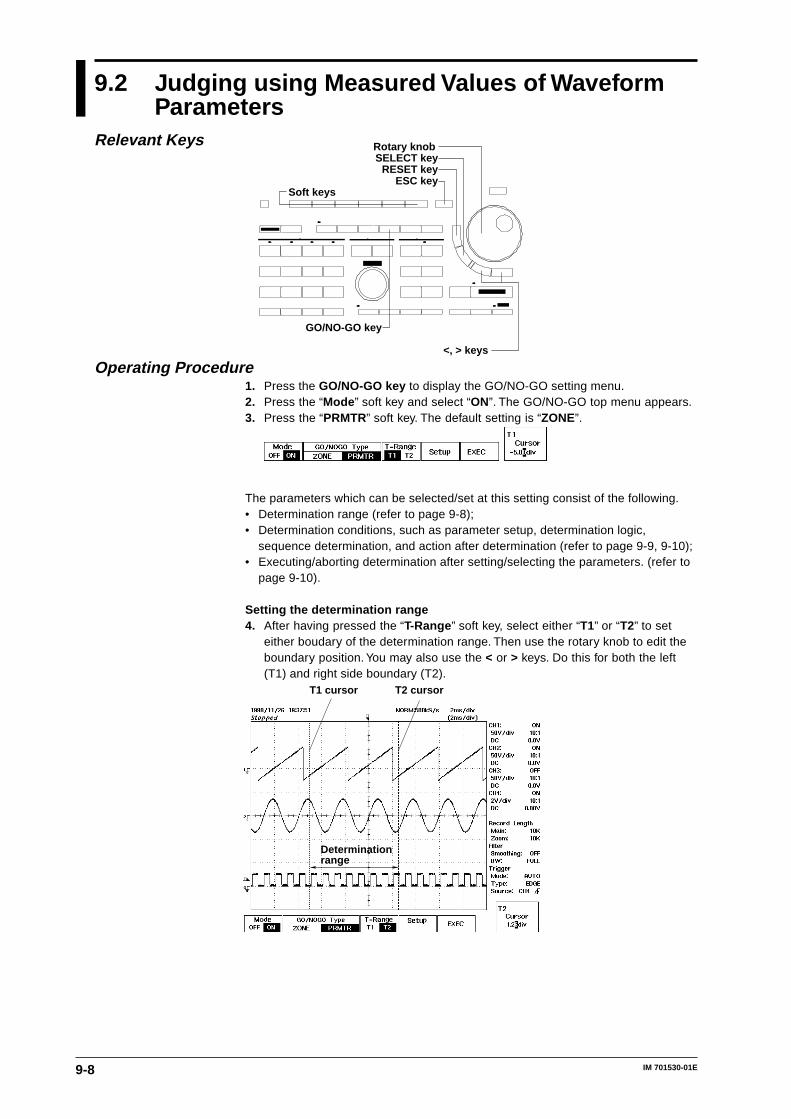
9-8 IM 701530-01E
9.2 Judging using Measured Values of WaveformParameters
Operating Procedure1. Press the GO/NO-GO key to display the GO/NO-GO setting menu.2. Press the “Mode ” soft key and select “ON”. The GO/NO-GO top menu appears.3. Press the “PRMTR” soft key. The default setting is “ZONE”.
The parameters which can be selected/set at this setting consist of the following.• Determination range (refer to page 9-8);• Determination conditions, such as parameter setup, determination logic,
sequence determination, and action after determination (refer to page 9-9, 9-10);• Executing/aborting determination after setting/selecting the parameters. (refer to
page 9-10).
Setting the determination range4. After having pressed the “T-Range ” soft key, select either “T1” or “T2” to set
either boudary of the determination range. Then use the rotary knob to edit theboundary position. You may also use the < or > keys. Do this for both the left(T1) and right side boundary (T2).
T1 cursor T2 cursor
Determination range
Relevant Keys Rotary knob
Soft keys
SELECT key
ESC key
<, > keys
GO/NO-GO key
RESET key
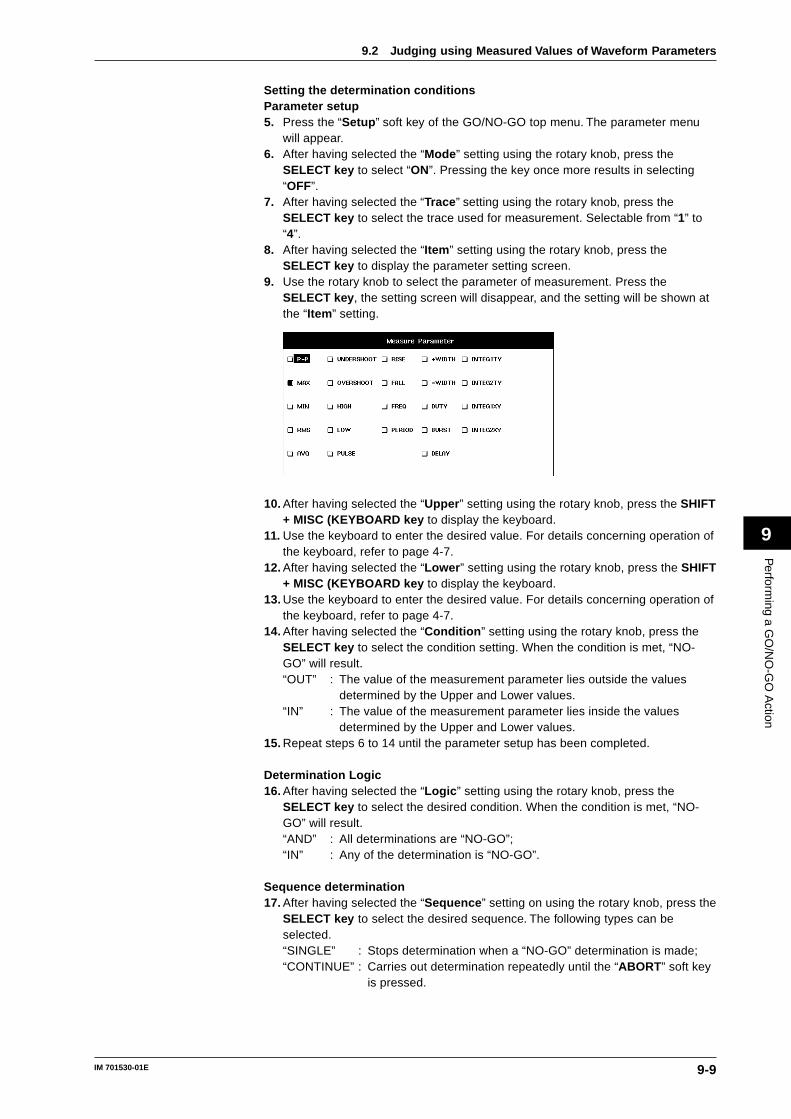
9-9IM 701530-01E
Perform
ing a GO
/NO
-GO
Action
9
Setting the determination conditionsParameter setup5. Press the “Setup ” soft key of the GO/NO-GO top menu. The parameter menu
will appear.6. After having selected the “Mode ” setting using the rotary knob, press the
SELECT key to select “ON”. Pressing the key once more results in selecting“OFF”.
7. After having selected the “Trace ” setting using the rotary knob, press theSELECT key to select the trace used for measurement. Selectable from “1” to“4”.
8. After having selected the “Item ” setting using the rotary knob, press theSELECT key to display the parameter setting screen.
9. Use the rotary knob to select the parameter of measurement. Press theSELECT key , the setting screen will disappear, and the setting will be shown atthe “Item ” setting.
10. After having selected the “Upper ” setting using the rotary knob, press the SHIFT+ MISC (KEYBOARD key to display the keyboard.
11. Use the keyboard to enter the desired value. For details concerning operation ofthe keyboard, refer to page 4-7.
12. After having selected the “Lower ” setting using the rotary knob, press the SHIFT+ MISC (KEYBOARD key to display the keyboard.
13. Use the keyboard to enter the desired value. For details concerning operation ofthe keyboard, refer to page 4-7.
14. After having selected the “Condition ” setting using the rotary knob, press theSELECT key to select the condition setting. When the condition is met, “NO-GO” will result.“OUT” : The value of the measurement parameter lies outside the values
determined by the Upper and Lower values.“IN” : The value of the measurement parameter lies inside the values
determined by the Upper and Lower values.15. Repeat steps 6 to 14 until the parameter setup has been completed.
Determination Logic16. After having selected the “Logic ” setting using the rotary knob, press the
SELECT key to select the desired condition. When the condition is met, “NO-GO” will result.“AND” : All determinations are “NO-GO”;“IN” : Any of the determination is “NO-GO”.
Sequence determination17. After having selected the “Sequence ” setting on using the rotary knob, press the
SELECT key to select the desired sequence. The following types can beselected.“SINGLE” : Stops determination when a “NO-GO” determination is made;“CONTINUE” : Carries out determination repeatedly until the “ABORT ” soft key
is pressed.
9.2 Judging using Measured Values of Waveform Parameters
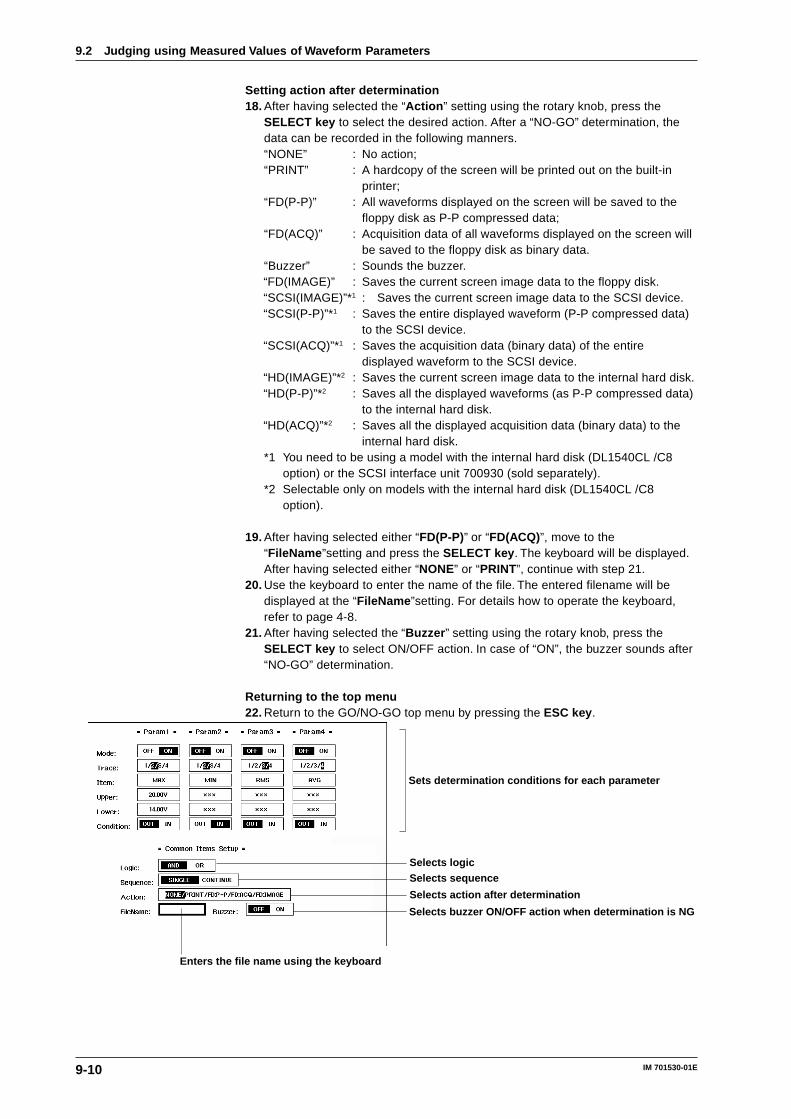
9-10 IM 701530-01E
Setting action after determination18. After having selected the “Action ” setting using the rotary knob, press the
SELECT key to select the desired action. After a “NO-GO” determination, thedata can be recorded in the following manners.“NONE” : No action;“PRINT” : A hardcopy of the screen will be printed out on the built-in
printer;“FD(P-P)” : All waveforms displayed on the screen will be saved to the
floppy disk as P-P compressed data;“FD(ACQ)” : Acquisition data of all waveforms displayed on the screen will
be saved to the floppy disk as binary data.“Buzzer” : Sounds the buzzer.“FD(IMAGE)” : Saves the current screen image data to the floppy disk.“SCSI(IMAGE)”*1 : Saves the current screen image data to the SCSI device.“SCSI(P-P)”*1 : Saves the entire displayed waveform (P-P compressed data)
to the SCSI device.“SCSI(ACQ)”*1 : Saves the acquisition data (binary data) of the entire
displayed waveform to the SCSI device.“HD(IMAGE)”*2 : Saves the current screen image data to the internal hard disk.“HD(P-P)”*2 : Saves all the displayed waveforms (as P-P compressed data)
to the internal hard disk.“HD(ACQ)”*2 : Saves all the displayed acquisition data (binary data) to the
internal hard disk.*1 You need to be using a model with the internal hard disk (DL1540CL /C8
option) or the SCSI interface unit 700930 (sold separately).*2 Selectable only on models with the internal hard disk (DL1540CL /C8
option).
19. After having selected either “FD(P-P)” or “FD(ACQ)”, move to the“FileName ”setting and press the SELECT key . The keyboard will be displayed.After having selected either “NONE” or “PRINT”, continue with step 21.
20. Use the keyboard to enter the name of the file. The entered filename will bedisplayed at the “FileName ”setting. For details how to operate the keyboard,refer to page 4-8.
21. After having selected the “Buzzer ” setting using the rotary knob, press theSELECT key to select ON/OFF action. In case of “ON”, the buzzer sounds after“NO-GO” determination.
Returning to the top menu22. Return to the GO/NO-GO top menu by pressing the ESC key .
Sets determination conditions for each parameter
Selects logicSelects sequence
Selects action after determination
Enters the file name using the keyboard
Selects buzzer ON/OFF action when determination is NG
9.2 Judging using Measured Values of Waveform Parameters
9-11IM 701530-01E
Perform
ing a GO
/NO
-GO
Action
9
Executing the determination function23. Press the “EXEC” soft key. The name of the soft key will change to “ABORT ”.
For the display which appears during measurement, refer to page 9-5.
Aborting the determination function24. Press the “ABORT ” soft key. The name of the soft key will change to “EXEC”.
ExplanationSelecting the waveforms to be judgedInput signal waveforms which are displayed as trace Nos. 1 to 4 can be judged.Computed waveforms can also be judged. Acquisition-memory data is not available.
Setting the determination range: T-RangeThe range of determination is set by the two cursors T1 and T2. The setting lieswithin –5.00 div at the left side to +5.00 div at the right side measured from thecenter of the display.Note that this range is different from the one used for automated measurements.
Selecting waveform parameters and setting the range: Item, Upper, LowerUp to four waveform parameters can be selected from the following items. If you donot know the upper-limit or lower-limit, set the +side of the setting range, or (whenthe keyboard shows this settings) select “NAN” (Ignore). In the latter case, thedisplay will show “XXX” at the corresponding setting.For the meaning of each item, refer to page 8-12.Each parameter can be set within the range given in the table below.
Measurement item Upper-/lower-limit setting range Setting step
Max, Min, High, LowP-P, AVG, RMS ± 8 div 0.04 div
+Overshoot, -Overshoot 0 to 200 % 1 %
+Duty, -Duty 0 to 100 % 1 %
Freq * 0.02 to 10 div –
Period, Rise, Fall+Width, -Width 0 to 10 div 0.01 div
Delay , Delay –10 to 10 div 0.01 div
INTEG1TY, INTEG2TY ±3.4x1038 –INTEG1XY, INTEG2XY
* The setting step is not constant since the frequency is the reciprocal of the period.
Specifying a file name when “FD(P-P),” “FD(ACQ),” “FD(IMAGE),” “SCSI(P-P),”“SCSI(ACQ),” “SCSI(IMAGE),” “HD(P-P),” “HD(ACQ),” or “HD(IMAGE)” has beenselected as the trigger action• Specifying the file name: File Name
A file No. (starting from “0001”) is assigned to each waveform data automaticallywhen the data is saved on a floppy disk, a SCSI device, or the internal harddisk. It is possible to insert a common file name (character string consisting ofup to four characters) before the assigned file number (for instance“NOGO0001”).The entered file name will be reset when the action becomes “NONE” or whenGO/NOGO determination is set to “OFF”.The file name will not be reset if the GO/NOGO determination is executed/aborted using EXEC and ABORT soft keys.When saving the screen image data, set the image data format. You can set theformat at the hard copy selection menu that appears by pressing theSHIFT+COPY(MENU) key (see page 12-11).
9.2 Judging using Measured Values of Waveform Parameters
9-12 IM 701530-01E
Example of data formatIn case of NO-GO determination, the measurement values will appear. For the othercontents, refer to page 9-6.
JudgeCnt NoGoCnt Date Time Param1(T1/P-P) Param2(T2/Max) · · ·
3 1 95/03/03 10:10:10 Go 2.000e+02V · · ·
5 2 95/03/03 10:10:12 1.000e+02V Go · · ·10 3 95/03/03 10:10:15 Go 1.500e+02V · · ·• • • • • • · · ·• • • • • • · · ·• • • • • • · · ·• • • • • • · · ·100 100 95/03/03 10:23:10 Go 1.950e+02V · · ·
Forcing determination to stopTo force determination to stop, press the “ABORT” soft key or set “Mode” (at theGO/NO-GO top menu) to “OFF”.
Points to note relating to parameter determination• Trigger mode is automatically switched to single mode irrespective of the
selected trigger mode during GO/NO-GO determination. However, determinationwill be repeated if the determination sequence has been set to “CONTINUE”.Even in case the GO/NO-GO mode (at the GO/NO-GO top menu) is changed toOFF again, the setting at the trigger mode selection will not become valid again.
• While both pre-zoom waveform and its expanded waveform are displayed at thesame time, the expanded waveform will become the object of determination.
• The following operations are not possible after having pressed the “EXEC” softkey. In order to perform these operations, it is necessary to set “Mode” (at theGO/NO-GO top menu) to “OFF”, after having pressed the “ABORT” soft key.• Initialization of the settings • Automated measurements• Auto set-up • Changing of expansion settings• Cursor measurements • Display of an X-Y waveform• Action-on trigger
• During an action is being executed after GO/NO-GO determination, no waveformdata will be acquired.
• In case the linear scaling function has been set to ON, you can enter linearscaled values at the GO/NO-GO parameter setting menu.
• Only waveforms displayed on screen are available for judgment. Acquisition-memory data is not available.
9.2 Judging using Measured Values of Waveform Parameters
9-13IM 701530-01E
Perform
ing a GO
/NO
-GO
Action
9
9.3 Using the GO/NO-GO Signal Output Function
Output SignalNO-GO OUT signalThe output signal level (TTL level) changes from high to low (L) temporarily when a“NO-GO” determination is made.
GO OUT signalThe output signal level (TTL level) changes from high to low (L) temporarily when a“GO” determination is made.
Signal output circuit diagram
51 Ω
LS062.2 kΩ
5 V 5 V
Output Connector
125
2650
2
27
3
28
24
49
23
48
Pin configuration
Pin No.
Pin No.
1
2
26
27
Signal name
NO-GO OUT
GND
GO OUT
GND
OPTION
* Only use pin No. 1, 2, 26, and 27. Other pins are used for other communication purposes.
For DL1540CL models with the /C8 optionThe output connector on DL1540CL with the /C8 option is as follows:• Format
The connector uses a modular jack (RJ11). Use the optional accessory 366973(sold separately) for the cable. If you are using a commercially sold cable (4contact modular cable for telephone circuits), wire the pins according to thefollowing figure.
• Pin arrangement
16
1Pin No. Signal Name Logic
23456
NC (no connection)NC (no connection)GO OUT
GO/NO-GO
NOGO OUT
DL side connector
Negative logicNegative logic
GNDNC (no connection)
9-14 IM 701530-01E
Output Timing
Output timingEXEC
10msor more
Acquisition Acquisition
Determination Determination
Result ResultNOGO OUT
GO OUT
Remains 'Low' until the system is ready for the next judgement (or for longer if the data is to be output to the built-in printer or to a floppy disk).
Connecting to Another Instrument
CAUTION • Never apply an external voltage to the NO-GO OUT and GO OUT terminals,otherwise damage to the instrument may result.
• When connecting the GO/NO-GO signal output externally, make sure not toconnect other signal pins by mistake. Errors in connection may causedamage to this instrument or to the other connected instrument.
For models other than the DL1540CL with the /C8 optionUse the dedicated half-pitch interface cable (B9920TA) to connect each terminal tothe terminals of another instrument.A DC voltage of 5 V is always present on the output terminals. Thus, take carewhen you connect to another instrument or when you touch the “NO-GO OUT”terminal.
For DL1540CL models with the /C8 optionTo connect the DL1540CL to external equipment, use the GO/NOGO cable(366973, sold separately).Do not use the GO/NOGO cable (366973, sold separately) for any other purposethan for carrying out GO/NO-GO determination on the DL1540CL model with the /C8 option.
• About the GO/NOGO cable (366973, sold separately)
1
6
Approx. 1.5 m
RJ11 connector
To the DL1540CL/C8
Wires are separated. Modify them to suit your needs.
Pin No. Signal Name Logic345
GO OUTNOGO OUT
NegativeNegative
GND
ColorWhiteGreenBlue
9.3 Using the GO/NO-GO Signal Output Function
10-1IM 701530-01E
Outputting D
isplayed Waveform
s andS
etting Param
eters to the Printer/P
lotter
10
10.1 Loading a Chart in the Optional Built-in Printer
Printer Roll ChartsUse only YOKOGAWA’s roll charts (the same type as the one supplied with theinstrument) with the built-in printer.
When Roll Charts have Run outWhen your roll charts have run out, purchase more from your dealer orYOKOGAWA sales representatives as listed on the back cover of this manual. Priceinformation can be obtained from them.
Part No. : B9850NXSpecification : Thermo-sensible, 30 mMinimum quantity : 5 rolls
Handling the Roll ChartThermo-sensible roll charts generate color using a thermal reaction, therefore thefollowing precautions must be taken.
Storage precautionsThe roll chart begins to develop color at approximately 70 °C. It is very sensitive toheat, damp, light and chemicals both before and after use.• Keep roll charts in a dry, cool and dark place.• Once the package is opened, use the roll chart as soon as possible.• If the roll chart is left in contact with plastic films containing plasticizer (for
instance, vinyl chloride film, cellophane tape etc.) for a long period of time,discoloration will occur on the recording area of the chart due to the plasticizer. Ifyou are going to keep the roll chart in a holder, for instance, use a polypropyleneholder.
• When you use adhesive on the roll chart, never use adhesive which contains anorganic solvent such as alcohol or ether, otherwise color may develop on thechart.
• When you are going to store recorded roll charts for a long period of time, wesuggest you make a copy of the charts since discoloration of the originals mayoccur.
Usage precautions• Use only YOKOGAWA’s genuine roll charts.• Do not touch the roll chart with sweaty hands.• Do not rub the surface of the roll chart hard with a solid object: color development
may occur due to frictional heat.• Do not allow chemicals or oil to come into contact with the roll chart, otherwise
color development or loss of information may result.• The chart paper might show some discoloration due to friction after the
instrument is moved with the roll paper installed. Therefore it is recommended toremove and re-install the chart paper before moving.
Chapter 10 Outputting Displayed Waveforms and Setting Parameters to the Printer/Plotter
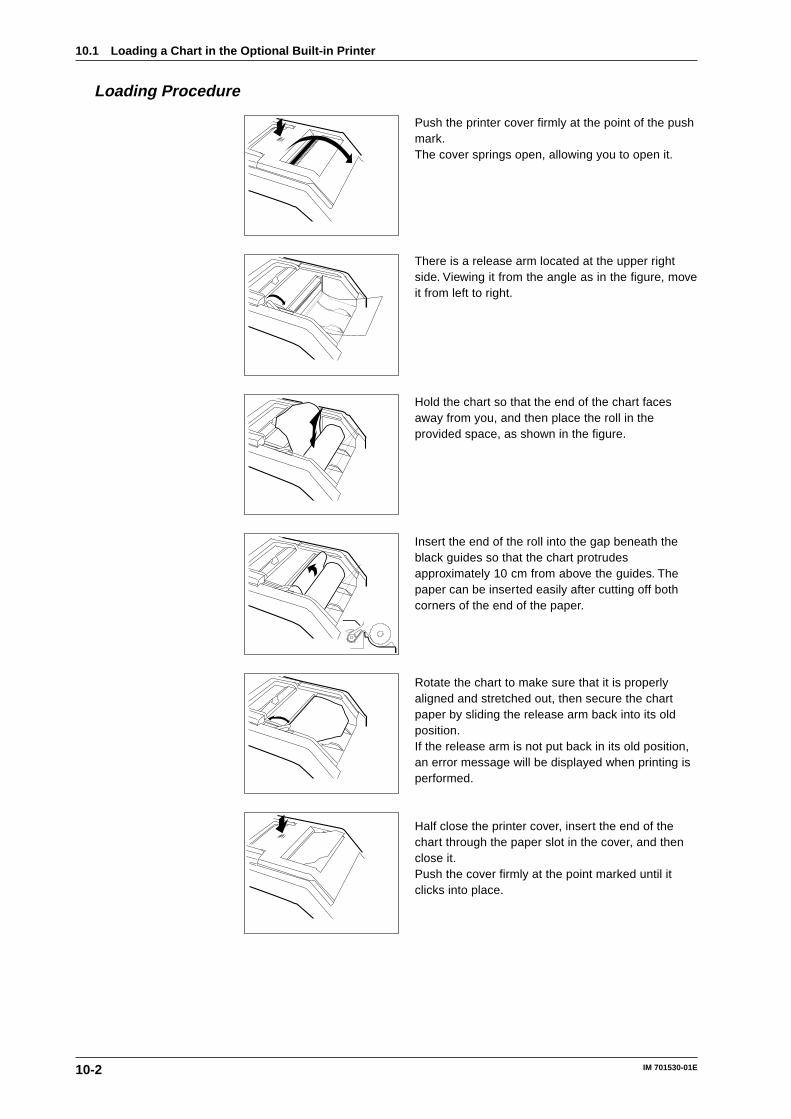
10-2 IM 701530-01E
Loading Procedure
Push the printer cover firmly at the point of the pushmark.The cover springs open, allowing you to open it.
There is a release arm located at the upper rightside. Viewing it from the angle as in the figure, moveit from left to right.
Hold the chart so that the end of the chart facesaway from you, and then place the roll in theprovided space, as shown in the figure.
Insert the end of the roll into the gap beneath theblack guides so that the chart protrudesapproximately 10 cm from above the guides. Thepaper can be inserted easily after cutting off bothcorners of the end of the paper.
Rotate the chart to make sure that it is properlyaligned and stretched out, then secure the chartpaper by sliding the release arm back into its oldposition.If the release arm is not put back in its old position,an error message will be displayed when printing isperformed.
Half close the printer cover, insert the end of thechart through the paper slot in the cover, and thenclose it.Push the cover firmly at the point marked until itclicks into place.
10.1 Loading a Chart in the Optional Built-in Printer
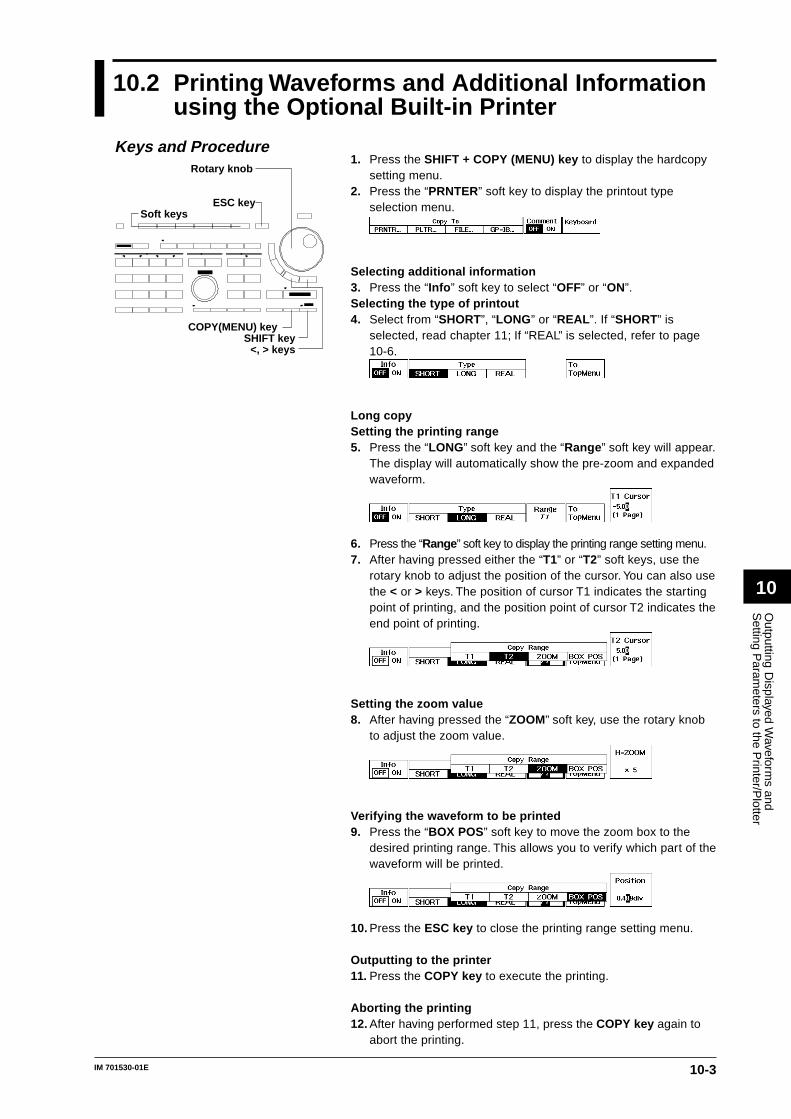
10-3IM 701530-01E
Outputting D
isplayed Waveform
s andS
etting Param
eters to the Printer/P
lotter
10
10.2 Printing Waveforms and Additional Informationusing the Optional Built-in Printer
1. Press the SHIFT + COPY (MENU) key to display the hardcopysetting menu.
2. Press the “PRNTER” soft key to display the printout typeselection menu.
Selecting additional information3. Press the “Info ” soft key to select “OFF” or “ON”.Selecting the type of printout4. Select from “SHORT”, “LONG” or “REAL ”. If “SHORT” is
selected, read chapter 11; If “REAL” is selected, refer to page10-6.
Long copySetting the printing range5. Press the “LONG” soft key and the “Range ” soft key will appear.
The display will automatically show the pre-zoom and expandedwaveform.
6. Press the “Range” soft key to display the printing range setting menu.7. After having pressed either the “T1” or “T2” soft keys, use the
rotary knob to adjust the position of the cursor. You can also usethe < or > keys. The position of cursor T1 indicates the startingpoint of printing, and the position point of cursor T2 indicates theend point of printing.
Setting the zoom value8. After having pressed the “ZOOM” soft key, use the rotary knob
to adjust the zoom value.
Verifying the waveform to be printed9. Press the “BOX POS” soft key to move the zoom box to the
desired printing range. This allows you to verify which part of thewaveform will be printed.
10. Press the ESC key to close the printing range setting menu.
Outputting to the printer11. Press the COPY key to execute the printing.
Aborting the printing12. After having performed step 11, press the COPY key again to
abort the printing.
Keys and Procedure
COPY(MENU) key
Rotary knob
ESC key
SHIFT key<, > keys
Soft keys
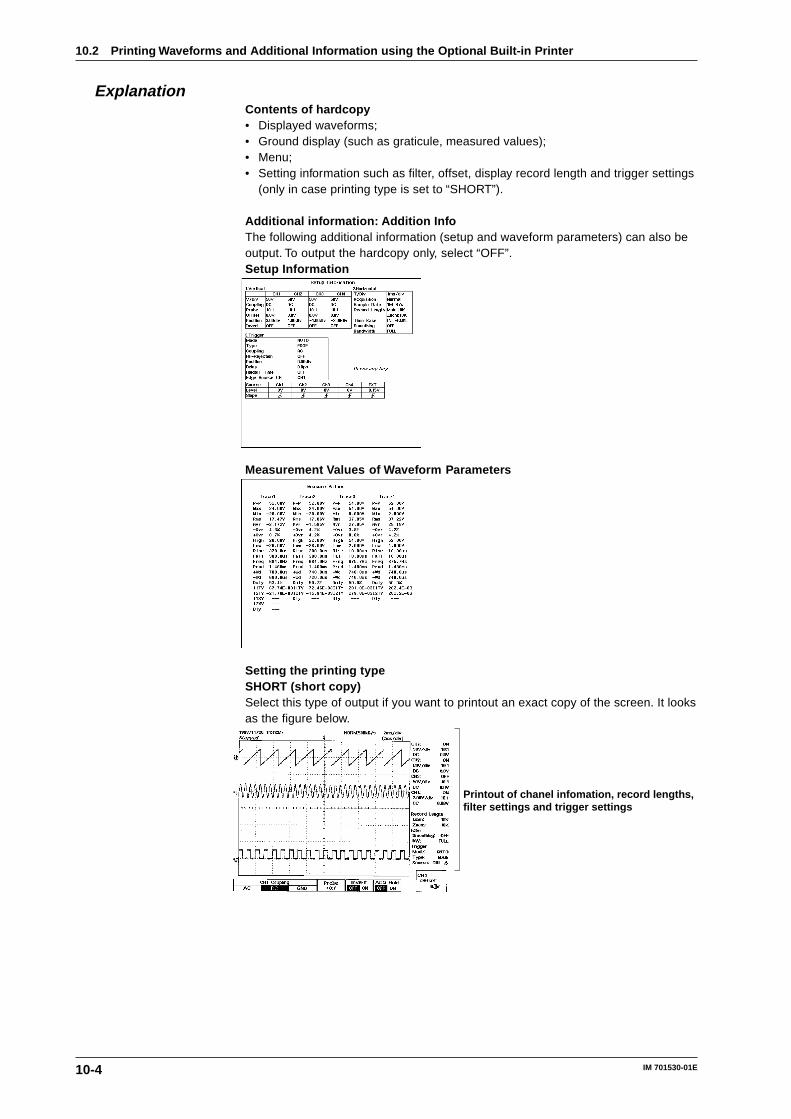
10-4 IM 701530-01E
ExplanationContents of hardcopy• Displayed waveforms;• Ground display (such as graticule, measured values);• Menu;• Setting information such as filter, offset, display record length and trigger settings
(only in case printing type is set to “SHORT”).
Additional information: Addition InfoThe following additional information (setup and waveform parameters) can also beoutput. To output the hardcopy only, select “OFF”.Setup Information
Measurement Values of Waveform Parameters
Setting the printing typeSHORT (short copy)Select this type of output if you want to printout an exact copy of the screen. It looksas the figure below.
Printout of chanel infomation, record lengths, filter settings and trigger settings
10.2 Printing Waveforms and Additional Information using the Optional Built-in Printer
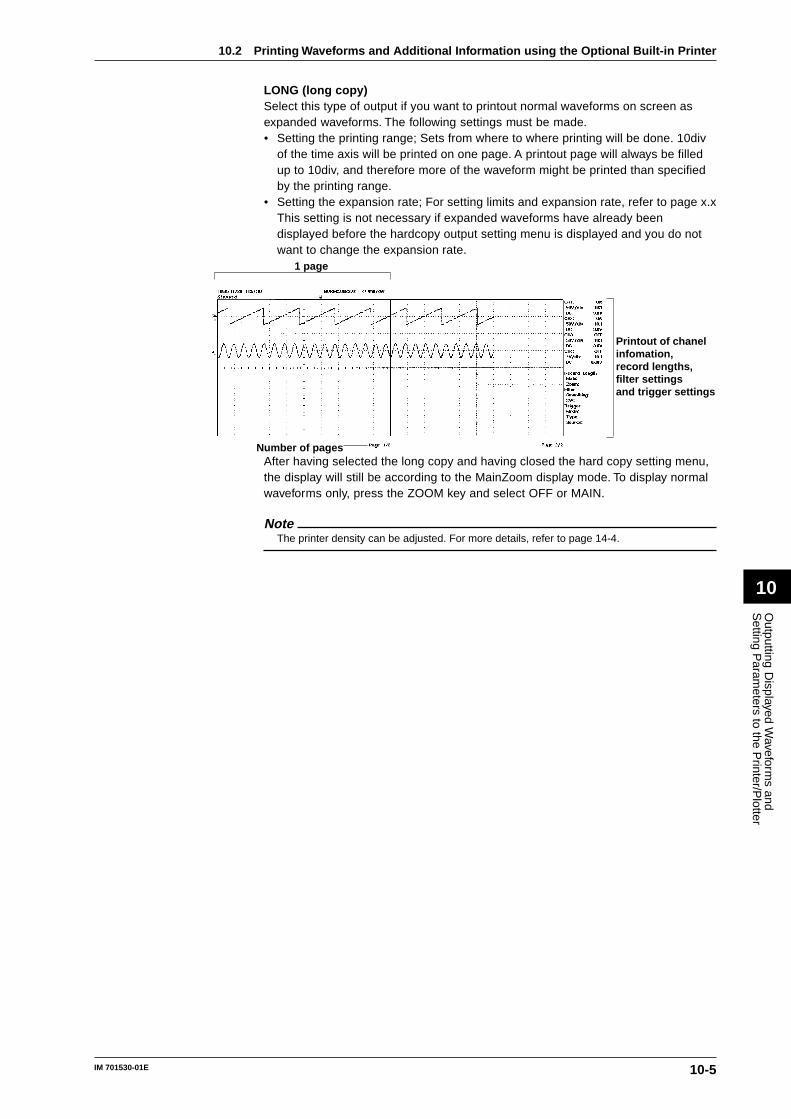
10-5IM 701530-01E
Outputting D
isplayed Waveform
s andS
etting Param
eters to the Printer/P
lotter
10
LONG (long copy)Select this type of output if you want to printout normal waveforms on screen asexpanded waveforms. The following settings must be made.• Setting the printing range; Sets from where to where printing will be done. 10div
of the time axis will be printed on one page. A printout page will always be filledup to 10div, and therefore more of the waveform might be printed than specifiedby the printing range.
• Setting the expansion rate; For setting limits and expansion rate, refer to page x.xThis setting is not necessary if expanded waveforms have already beendisplayed before the hardcopy output setting menu is displayed and you do notwant to change the expansion rate.
1 page
Number of pages
Printout of chanel infomation, record lengths, filter settings and trigger settings
After having selected the long copy and having closed the hard copy setting menu,the display will still be according to the MainZoom display mode. To display normalwaveforms only, press the ZOOM key and select OFF or MAIN.
NoteThe printer density can be adjusted. For more details, refer to page 14-4.
10.2 Printing Waveforms and Additional Information using the Optional Built-in Printer
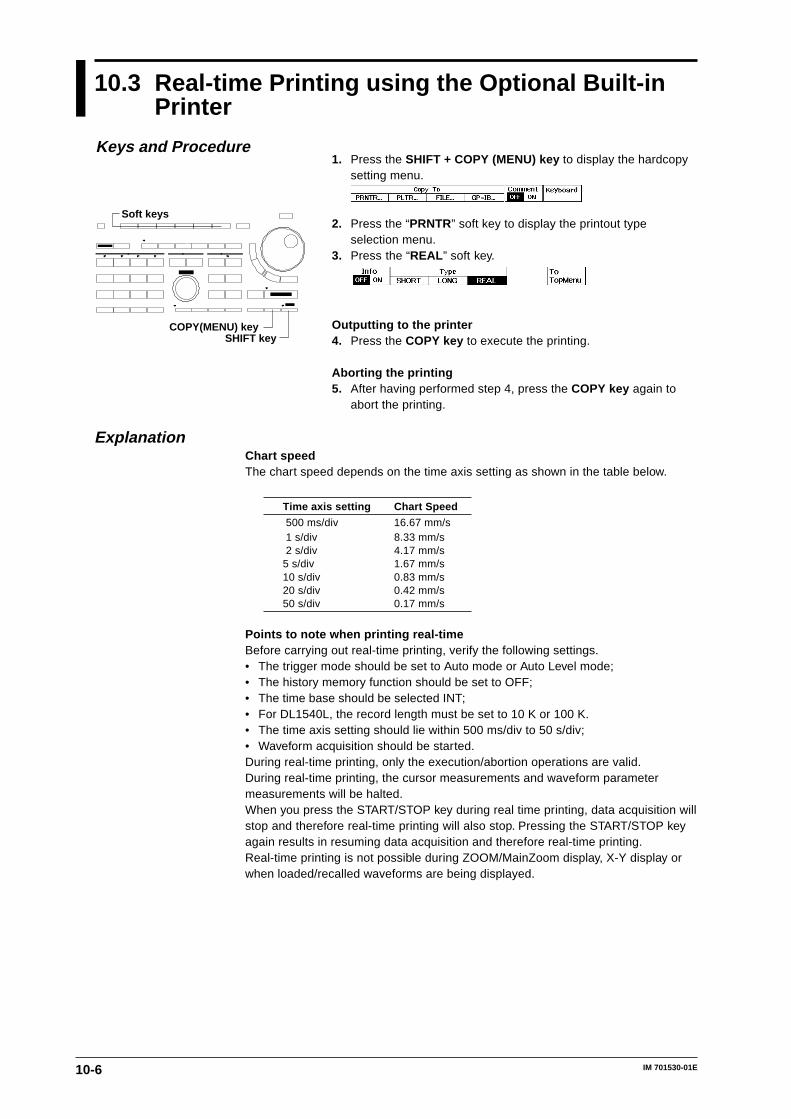
10-6 IM 701530-01E
10.3 Real-time Printing using the Optional Built-inPrinter
1. Press the SHIFT + COPY (MENU) key to display the hardcopysetting menu.
2. Press the “PRNTR” soft key to display the printout typeselection menu.
3. Press the “REAL ” soft key.
Outputting to the printer4. Press the COPY key to execute the printing.
Aborting the printing5. After having performed step 4, press the COPY key again to
abort the printing.
ExplanationChart speedThe chart speed depends on the time axis setting as shown in the table below.
Time axis setting Chart Speed
500 ms/div 16.67 mm/s 1 s/div 8.33 mm/s 2 s/div 4.17 mm/s5 s/div 1.67 mm/s10 s/div 0.83 mm/s20 s/div 0.42 mm/s50 s/div 0.17 mm/s
Points to note when printing real-timeBefore carrying out real-time printing, verify the following settings.• The trigger mode should be set to Auto mode or Auto Level mode;• The history memory function should be set to OFF;• The time base should be selected INT;• For DL1540L, the record length must be set to 10 K or 100 K.• The time axis setting should lie within 500 ms/div to 50 s/div;• Waveform acquisition should be started.During real-time printing, only the execution/abortion operations are valid.During real-time printing, the cursor measurements and waveform parametermeasurements will be halted.When you press the START/STOP key during real time printing, data acquisition willstop and therefore real-time printing will also stop. Pressing the START/STOP keyagain results in resuming data acquisition and therefore real-time printing.Real-time printing is not possible during ZOOM/MainZoom display, X-Y display orwhen loaded/recalled waveforms are being displayed.
Keys and Procedure
COPY(MENU) keySHIFT key
Soft keys
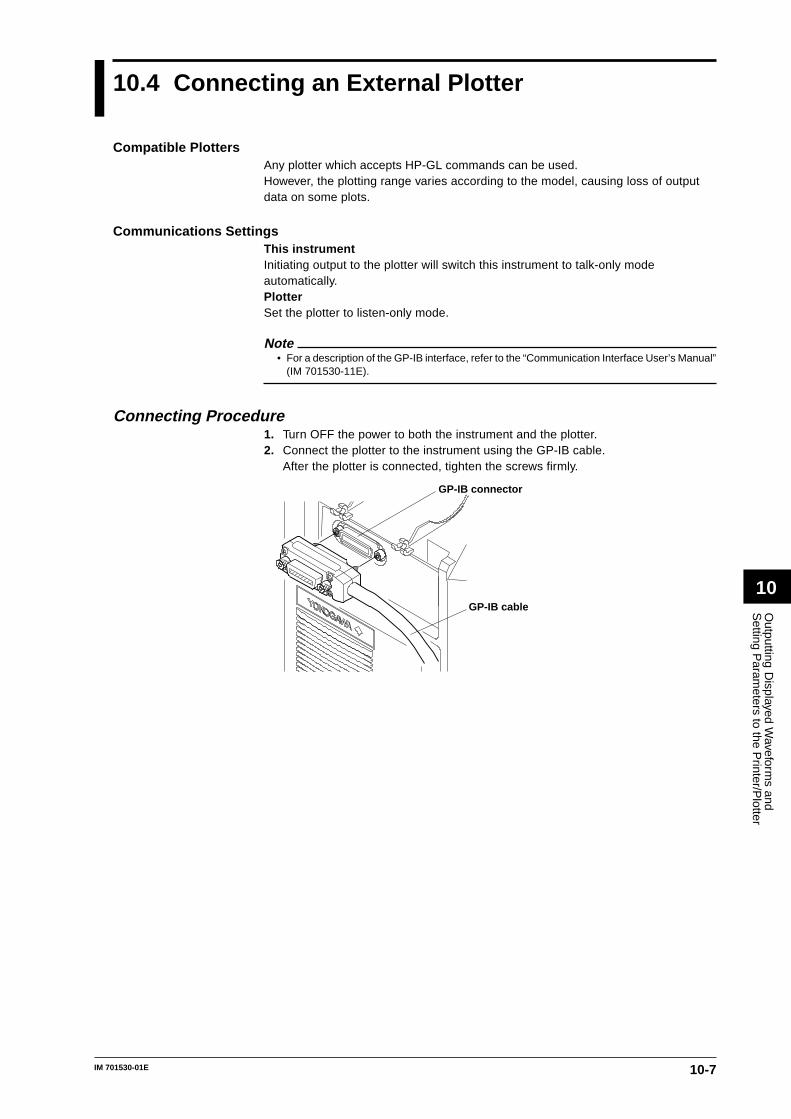
10-7IM 701530-01E
Outputting D
isplayed Waveform
s andS
etting Param
eters to the Printer/P
lotter
10
10.4 Connecting an External Plotter
Compatible PlottersAny plotter which accepts HP-GL commands can be used.However, the plotting range varies according to the model, causing loss of outputdata on some plots.
Communications SettingsThis instrumentInitiating output to the plotter will switch this instrument to talk-only modeautomatically.PlotterSet the plotter to listen-only mode.
Note• For a description of the GP-IB interface, refer to the “Communication Interface User’s Manual”
(IM 701530-11E).
Connecting Procedure1. Turn OFF the power to both the instrument and the plotter.2. Connect the plotter to the instrument using the GP-IB cable.
After the plotter is connected, tighten the screws firmly.
GP-IB connector
GP-IB cable
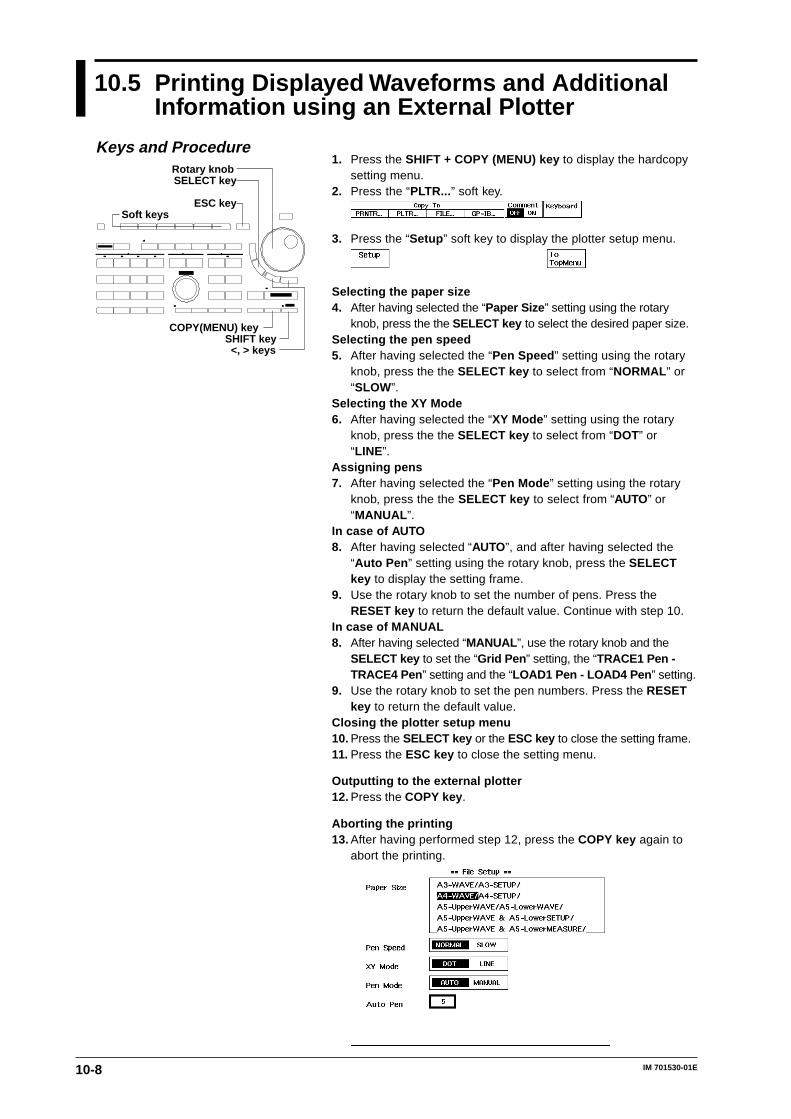
10-8 IM 701530-01E
10.5 Printing Displayed Waveforms and AdditionalInformation using an External Plotter
1. Press the SHIFT + COPY (MENU) key to display the hardcopysetting menu.
2. Press the “PLTR...” soft key.
3. Press the “Setup ” soft key to display the plotter setup menu.
Selecting the paper size4. After having selected the “Paper Size ” setting using the rotary
knob, press the the SELECT key to select the desired paper size.Selecting the pen speed5. After having selected the “Pen Speed ” setting using the rotary
knob, press the the SELECT key to select from “NORMAL ” or“SLOW”.
Selecting the XY Mode6. After having selected the “XY Mode ” setting using the rotary
knob, press the the SELECT key to select from “DOT” or“LINE”.
Assigning pens7. After having selected the “Pen Mode ” setting using the rotary
knob, press the the SELECT key to select from “AUTO” or“MANUAL ”.
In case of AUTO8. After having selected “AUTO”, and after having selected the
“Auto Pen ” setting using the rotary knob, press the SELECTkey to display the setting frame.
9. Use the rotary knob to set the number of pens. Press theRESET key to return the default value. Continue with step 10.
In case of MANUAL8. After having selected “MANUAL ”, use the rotary knob and the
SELECT key to set the “Grid Pen ” setting, the “TRACE1 Pen -TRACE4 Pen ” setting and the “LOAD1 Pen - LOAD4 Pen ” setting.
9. Use the rotary knob to set the pen numbers. Press the RESETkey to return the default value.
Closing the plotter setup menu10. Press the SELECT key or the ESC key to close the setting frame.11. Press the ESC key to close the setting menu.
Outputting to the external plotter12. Press the COPY key .
Aborting the printing13. After having performed step 12, press the COPY key again to
abort the printing.
Keys and Procedure
COPY(MENU) key
Rotary knob
ESC key
SHIFT key<, > keys
Soft keys
SELECT key
10-9IM 701530-01E
Outputting D
isplayed Waveform
s andS
etting Param
eters to the Printer/P
lotter
10
ExplanationSelecting the paper sizeThe contents of printing, printing size and printing location can be selected from thefollowing eight types. However, only one type of output can be selected at a time.“A5-Upper WAVE” and “A5-Lower WAVE” allow output of two A5-sized screens ofinformation on a sheet of A4 paper.
Setting Output item Output size Output location
A3-WAVE Screen hardcopy A3 Middle
A3-SETUP Set-up parameters A3 Middle
A4-WAVE Screen hardcopy A4 Middle
A4-SETUP Set-up parameters A4 Middle
A5-Upper WAVE Screen hardcopy A5 Upper half
A5-Lower WAVE Screen hardcopy A5 Lower half
A5-Upper WAVE & Screen hardcopy A5 Upper halfA5-Lower SETUP Set-up parameters A5 Lower half
A5-Upper WAVE & Screen hardcopy A5 Upper halfA5-Lower MEASURE waveform measurement data A5 Lower half
Selecting the pen speedThe pen speed can be selected from the following two speeds.NORM Plots at the default speed setting.SLOW Plots at a speed of 10 cm/s.
Selecting the pen assignment method: Pen ModeThe pens can be assigned according to the following two methods.AUTO Assigns pens automatically, as shown in the table below, according to the
number of pens.
Number of GRID TRACE LOADinstalled pens 1 2 3 4 1 2 3 4
1 1 1 1 1 1 1 1 1 1 2 1 2 1 1 2 2 1 1 2 3 1 2 3 1 2 2 3 1 2 4 1 2 3 4 1 2 3 4 1 5 1 2 3 4 5 2 3 4 5
MANUAL A particular pen can be assigned to the graticule, to TRACE1 to 4 and toLOAD 1 to 4. The pen numbers that can be assigned are 0 to 12. If “0”is selected, no plotting is performed for the corresponding item.
Assignment of pens to the grid, trace and loadThe grid, TRACE1 to TRACE4 and LOAD 1 to LOAD4 can have pens assigned tothem as follows.
Setting Assignment for hardcopy
Grid Graticule, all cursors, trigger position mark, date and time, comments,
setupinformation list, measurement values
TRACE1 Trace1 waveform, ground level, trigger level mark, voltage axis conditions,input coupling, probe attenuation
TRACE2 to 4 Same as Trace1LOAD1 to 4
10.5 Printing Displayed Waveforms and Additional Information using an External Plotter
10-10 IM 701530-01E
10.6 Entering a Comment
1. Press the SHIFT + COPY (MENU) key to display the hardcopysetting menu.
Entering comments2. Press the “Keyboard ” soft key to display the keyboard.
3. Use the keyboard to enter the comment. For details regardingthe usage of the keyboard, refer to page x.x.
Displaying comments4. Press the “Comment ” soft key to select “ON”. Pressing the soft
key once again results in “OFF”.and therefore comments will notbe displayed.
ExplanationNumber of characters which can be enteredUp to 25 characters may be entered.
Displaying a commentThe comment will appear above the waveform display frame, as shown in the figurebelow.
Comment
Clearing the commentPress the “EXEC” soft key in the hardcopy setting menu or display another menu.The comment will be cleared.
Points to note when entering a commentThe displayed comment may overlap the messages which occur during waveformacquisition. When you want to display the comment in such a case, turn off dataacquisition, and set the “Comment” setting on the hardcopy setting menu to “ON”once again.
Keys and Procedure
COPY(MENU) keySHIFT key
Soft keys
10-11IM 701530-01E
Outputting D
isplayed Waveform
s andS
etting Param
eters to the Printer/P
lotter
10
10.7 Printing the Screen Image to an ExternalPrinter
1. Press the SHIFT + COPY (MENU) key to display the hardcopysetting menu.
2. Press the “GP-IB” soft key to display the external output settingmenu.
Selecting the external printer3. After step 2 has been completed, press the “Format ” soft key to
display the external printer selection menu.
4. Press the soft key corresponding to the external printer to beselected.
Selecting the resolution5. If you selected “BJ ” in step 4, press the “Resolution ” soft key to
display the resolution selection menu.6. Press the “180dpi ,” “300dpi ,” or “360dpi ” soft key.
Selecting the print type7. After step 2 has been completed, press the “Color ” soft key to
select “OFF” or “ON”.
Outputting to the external printer8. Press the COPY key .
Aborting the printing9. After having performed step6, press the COPY key again to
abort the printing.
ExplanationCentronics interface
Centronics interface is a typical interface used to transfer print data and isemployed in many printers. DL1540C/DL1540CL can print screen image to aprinter which supports the following print formats. If you need the information ofthe GP-IB/Centronics converter, contact your nearest YOKOGAWArepresentative.
External printer type: FormatSelect from ESC/P, ESC/P2, BJ, PCL5, LIPS or PR201.
Print typeSelect from the following.ON : Print using the same colors as the screen (except grid, scale, etc. are in
black and no background)OFF : Prints just like the “SHORT (short copy)” printing type described on page
10-4.
Keys and Procedure
COPY(MENU) keySHIFT key
Soft keys
10-12 IM 701530-01E
Points to note when printing the screen image to an external printer• With some printers, the screen image cannot be printed properly. If this problem
continues to occur, even when the printer has been adjusted, contact the printer’smanufacturer.
• It is possible to print the screen image to a printer connected to a personalcomputer. Save the screen image data to a floppy disk as described in Section12.5, “Saving Screen Image Data”, then open the data using the computer andprint it.
NoteDL1540C/DL1540CL doesn’t be recognizable errors (example, the chart end) of external printer.In case of occuring the errors, if DL1540C/DL1540CL is executed to output to the externalprinter, aborting the printing by pressing the COPY key.
Print example• ESC/P: Printed by Canon Buble Jet BJC-440J
• BJ: Printed by Canon Bubble Jet BJC-440J
10.7 Printing the Screen Image to an External Printer
10-13IM 701530-01E
Outputting D
isplayed Waveform
s andS
etting Param
eters to the Printer/P
lotter
10
• PCL5: Printed by HEWLETT PACKARD Desk Jet 880C
• LIPS: Printed by Canon Laser Shot A404F
• PR201: Printed by Canon Laser Shot A404F
10.7 Printing the Screen Image to an External Printer
11-1IM 701530-01E
Storing and R
ecalling Data from
the Internal Mem
ory
11
11.1 Storing and Recalling Displayed Waveforms
1. Press the STORE/RECALL key to display the data typeselection menu.
2. Press the “Wave” soft key to display the store/recall settingmenu.
Storing a waveform3. Press the “STORE” soft key to display the waveform store
setting menu. The default setting is “STORE”.
4. Press the “Source ” soft key to display the source selectionmenu.
5. Press the soft key corresponding to the trace No. to be stored.
6. Press the “Destn ” soft key to display the memory selectionmenu.
7. Press the soft key corresponding to the memory in which thewaveform is to be stored.
8. Press the “EXEC” soft key to execute waveform storing.
Recalling a waveform3. After step 2 has been completed, press the “RECALL ” soft key
to display the waveform recalling menu.
4. Press the “Source ” soft key to display the recall memoryselection menu.
5. Press the soft key corresponding to the memory No. from whichthe waveform is to be recalled.
6. Press the “Destn ” soft key to display the trace No. selectionmenu.
7. Press the soft key corresponding to the trace No. to be recalled.
8. Press the “EXEC” soft key to execute waveform recalling.
Moving a recalled waveform9. Press the POSITION key of the channel corresponding to the
number of the recalled waveform. The vertical position settingmenu appears.
10. Press the “Knob ” soft key to select “MEM”.11. Press the soft key corresponding to the desired position.12. Use the rotary knob to fine adjust the position.
Keys and ProcedureRotary knob
Soft keys
STORE/RECALL keyPOSITION keyCH key
Chapter 11 Storing and Recalling Data from the Internal Memory
11-2 IM 701530-01E
Canceling the display of the recalled waveform13. Press the CH key of the channel corresponding to the number
of the recalled waveform. The recall waveform ON/OFF menuappears. Note that by alternately pressing the CH key theacquisition waveform also (dis)appears.
14. Press the “MEM” soft key to select “OFF” and the recalledwaveform will be canceled. Selecting “ON” results in displayingthe recalled waveform.
ExplanationSelecting the waveform to be stored: SourceThe waveform to be stored can be selected from any displayed waveform (eitherinput signal waveforms or computed waveforms) at Trace 1 to 4. X-Y waveformscannot be stored.
Selecting the destination memory: DestnThe destination memory can be selected from the four internal memories “MEM #1”to “MEM #4”. Be aware that when storing the data, previous data will be overwrittenand thus lost.
Selecting the waveform to be recalled: SourceWaveforms can be recalled from the internal memories “MEM #1” to “MEM #4”.
Selecting the display destination for recalled waveforms: DestnWaveforms destination can be selected from the four traces “LOAD1” to “LOAD4” .The waveforms will be displayed at the 0div location on the voltage axis.
Moving waveformsYou can move the position of input signal waveforms and recalled waveformsseperately. When displaying recalled waveforms, press the POSITION keycorresponding to the recalled waveform and select which waveform (either the inputsignal or the recalled one) should be moved.When you want to move the input signal waveform, press the “Knob” soft key andselect “CH”.When you want to move the recalled waveform, press the “Knob” soft key andselect “MEM”.
Restrictions on the recalled waveformsIt is not possible to change either the voltage axis or the time axis sensitivity of therecalled waveforms. The conditions when the waveform was stored, are kept.It is also not possible to perform computation and expansion on the recalledwaveforms.However, it is possible to move the recalled waveforms using the POSITION keyand to perform cursor measurements and waveform parameter measurements.
Points to note when storing and recalling• The waveform that is stored is the P-P data displayed on the screen, not the
acquisition data.• Waveform data located within ±5.12 div of the center of the waveform display
frame is stored. Thus, if the stored waveform exceeds this range vertically, thepart exceeding the range will not be displayed if the waveform is recalled andmoved vertically.
NoteInitializing does not result in loss of stored waveforms.
11.1 Storing and Recalling Displayed Waveforms
11-3IM 701530-01E
Storing and R
ecalling Data from
the Internal Mem
ory
11
11.2 Storing and Recalling Setting Parameters
1. Press the STORE/RECALL key to display the data typeselection menu.
2. Press the “SETUP...” soft key to display the store/recall settingmenu.
Storing setting parameters3. Press the “STORE” soft key to display the setting parameters
storing menu. The default setting is “STORE”.
4. Press the “Destn ” soft key to display the memory selectionmenu.
5. Press the soft key corresponding to the memory in which thesetting parameters are to be stored.
6. Press the “EXEC” soft key to execute storing.
Recalling setting parameters3. After step 2 has been completed, press the “RECALL ” soft key
to display the setting parameters recalling menu.
4. Press the “Source ” soft key to display the recall memoryselection menu.
5. Press the soft key corresponding to the memory No. from whichthe setting parameters are to be recalled.
6. Press the “EXEC” soft key to execute recalling.
ExplanationParameters that are storedSettings made using the soft key menu and rotary knob as well as the acquisitionSTART/STOP state and channel ON/OFF state are stored.
Selecting the destination memory: DestnThe destination memory can be selected from the four internal memories “MEM #1”to “MEM #4”. Be aware that when storing the data, previous data will be overwrittenand thus lost. Note that the internal memory where the waveforms are stored is adifferent memory.
Selecting the setting parameters to be recalled: SourceSetting parameters can only be recalled from the internal memories “MEM #1” to“MEM #4” in which setting parameters are present.
NoteInitializing does not result in loss of stored setting parameters.
Keys and Procedure
Soft keys
STORE/RECALL key
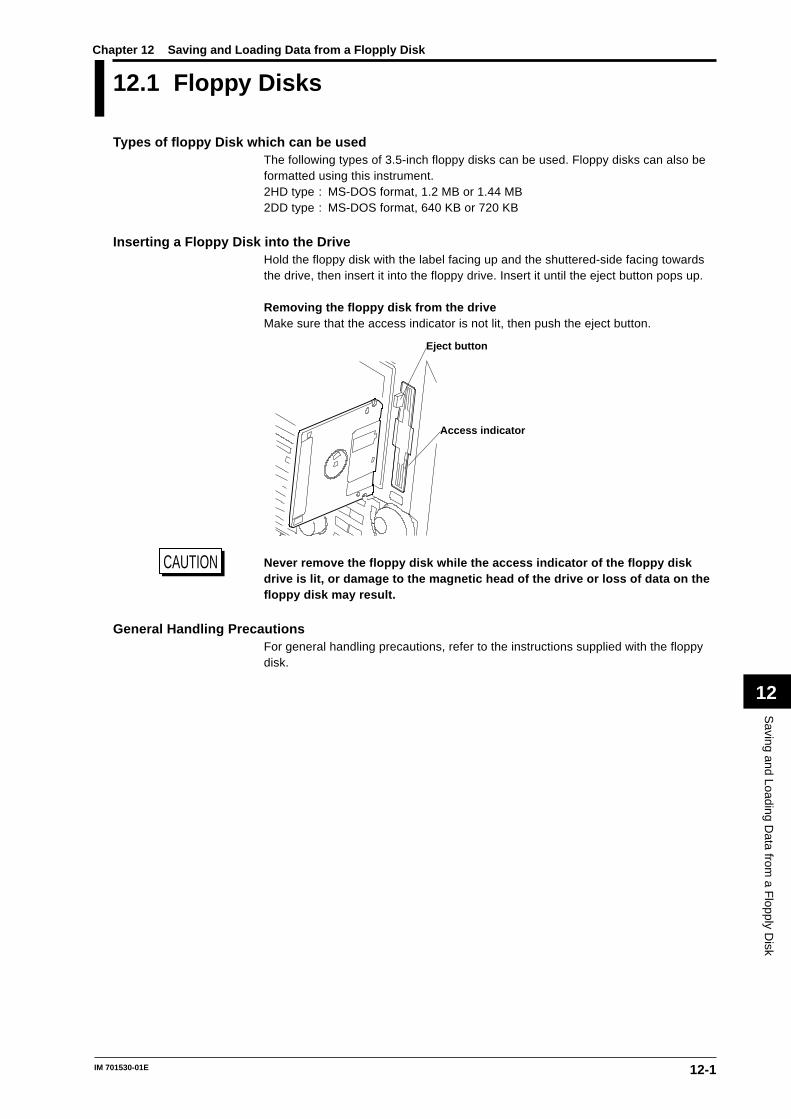
12-1IM 701530-01E
Saving and Loading D
ata from a F
lopply Disk
12
12.1 Floppy Disks
Types of floppy Disk which can be usedThe following types of 3.5-inch floppy disks can be used. Floppy disks can also beformatted using this instrument.2HD type : MS-DOS format, 1.2 MB or 1.44 MB2DD type : MS-DOS format, 640 KB or 720 KB
Inserting a Floppy Disk into the DriveHold the floppy disk with the label facing up and the shuttered-side facing towardsthe drive, then insert it into the floppy drive. Insert it until the eject button pops up.
Removing the floppy disk from the driveMake sure that the access indicator is not lit, then push the eject button.
Eject button
Access indicator
CAUTION Never remove the floppy disk while the access indicator of the floppy diskdrive is lit, or damage to the magnetic head of the drive or loss of data on thefloppy disk may result.
General Handling PrecautionsFor general handling precautions, refer to the instructions supplied with the floppydisk.
Chapter 12 Saving and Loading Data from a Flopply Disk
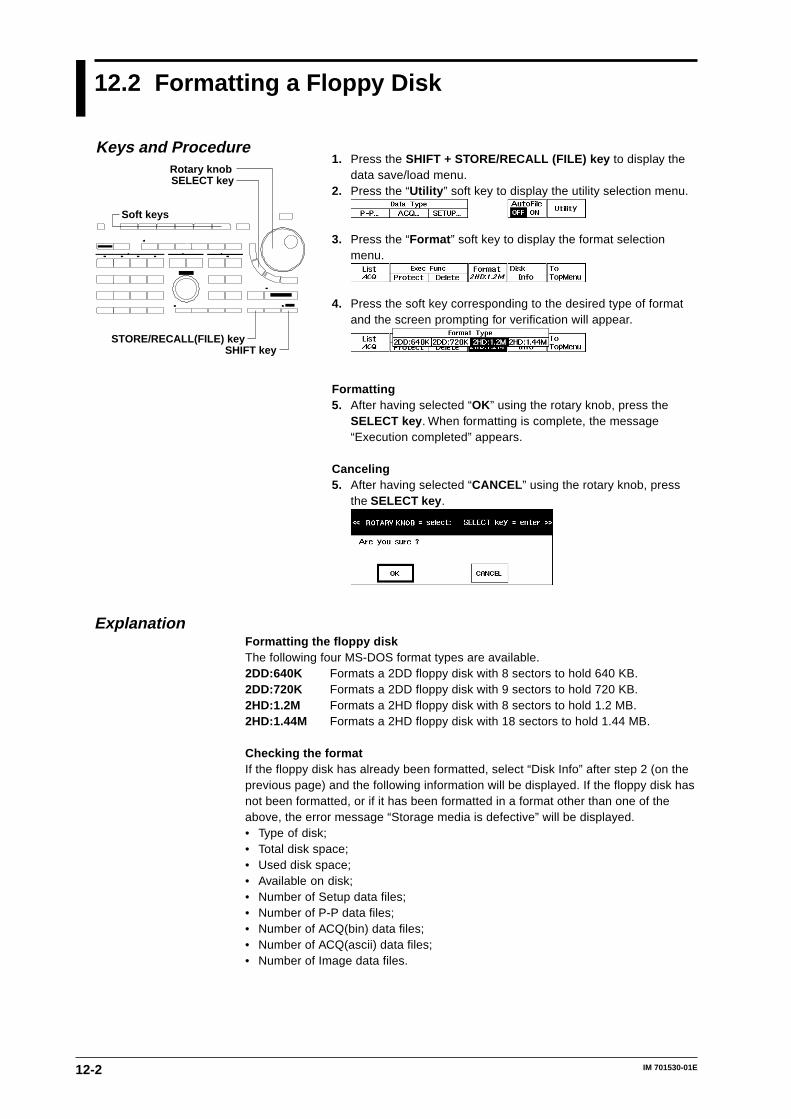
12-2 IM 701530-01E
12.2 Formatting a Floppy Disk
1. Press the SHIFT + STORE/RECALL (FILE) key to display thedata save/load menu.
2. Press the “Utility ” soft key to display the utility selection menu.
3. Press the “Format ” soft key to display the format selectionmenu.
4. Press the soft key corresponding to the desired type of formatand the screen prompting for verification will appear.
Formatting5. After having selected “OK” using the rotary knob, press the
SELECT key . When formatting is complete, the message“Execution completed” appears.
Canceling5. After having selected “CANCEL ” using the rotary knob, press
the SELECT key .
ExplanationFormatting the floppy diskThe following four MS-DOS format types are available.2DD:640K Formats a 2DD floppy disk with 8 sectors to hold 640 KB.2DD:720K Formats a 2DD floppy disk with 9 sectors to hold 720 KB.2HD:1.2M Formats a 2HD floppy disk with 8 sectors to hold 1.2 MB.2HD:1.44M Formats a 2HD floppy disk with 18 sectors to hold 1.44 MB.
Checking the formatIf the floppy disk has already been formatted, select “Disk Info” after step 2 (on theprevious page) and the following information will be displayed. If the floppy disk hasnot been formatted, or if it has been formatted in a format other than one of theabove, the error message “Storage media is defective” will be displayed.• Type of disk;• Total disk space;• Used disk space;• Available on disk;• Number of Setup data files;• Number of P-P data files;• Number of ACQ(bin) data files;• Number of ACQ(ascii) data files;• Number of Image data files.
Keys and ProcedureRotary knob
Soft keys
STORE/RECALL(FILE) keySHIFT key
SELECT key
12-3IM 701530-01E
Saving and Loading D
ata from a F
lopply Disk
12
Points to note concerning formatting• The following three directories are created automatically when a floppy disk is
formatted using this instrument.DL_WAVE Directory for “BIN” (binary) waveform dataDL_SETUP Directory for “SETUP” (setting parameters)DL_MISC Directory for “P-P” and “ASCII” waveform data, as well as “HP-GL”,
“PS” (Postscript), “TIFF” and “BMP” screen image data• Floppy disks formatted in a format other than those specified on the previous
page cannot be used.• If an error message appears when formatting has been completed, the floppy
disk may be damaged.• Formatting the floppy disk will erase all data on the disk. Be careful.
CAUTION Never remove the floppy disk while the access indicator of the floppy diskdrive is lit, or damage to the magnetic head of the drive or loss of data on thefloppy disk may result.
12.2 Formatting a Floppy Disk
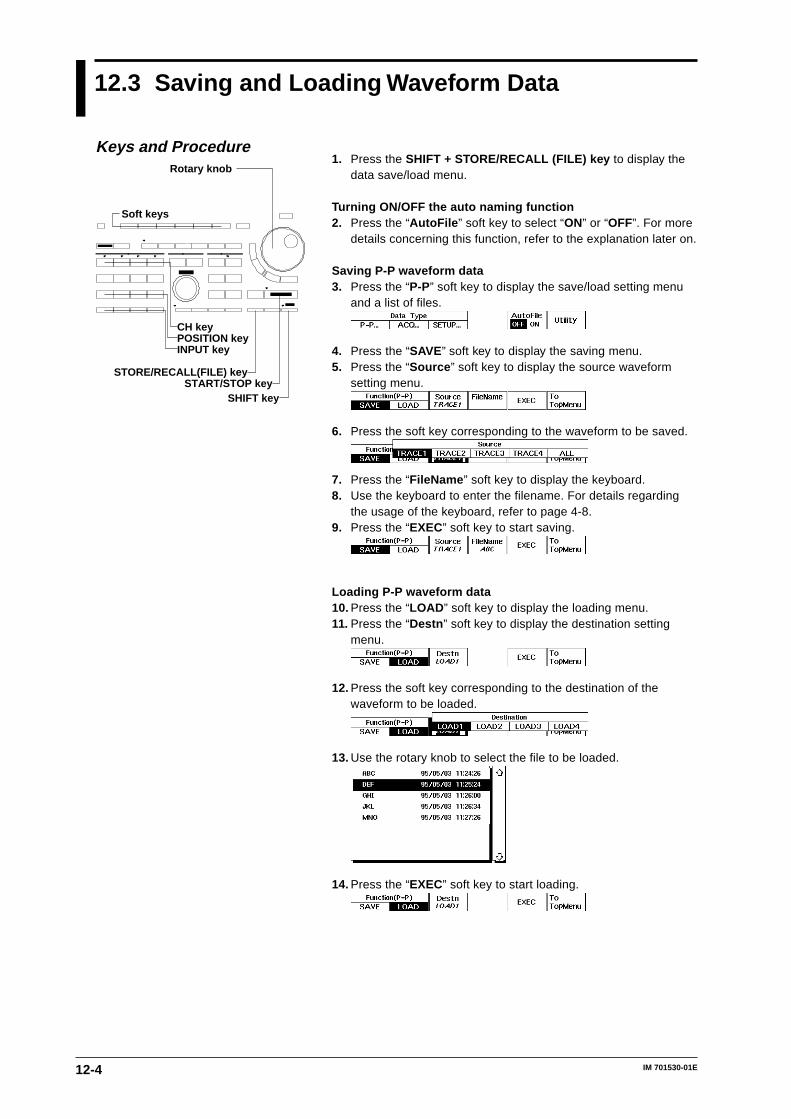
12-4 IM 701530-01E
12.3 Saving and Loading Waveform Data
1. Press the SHIFT + STORE/RECALL (FILE) key to display thedata save/load menu.
Turning ON/OFF the auto naming function2. Press the “AutoFile ” soft key to select “ON” or “OFF”. For more
details concerning this function, refer to the explanation later on.
Saving P-P waveform data3. Press the “P-P” soft key to display the save/load setting menu
and a list of files.
4. Press the “SAVE” soft key to display the saving menu.5. Press the “Source ” soft key to display the source waveform
setting menu.
6. Press the soft key corresponding to the waveform to be saved.
7. Press the “FileName ” soft key to display the keyboard.8. Use the keyboard to enter the filename. For details regarding
the usage of the keyboard, refer to page 4-8.9. Press the “EXEC” soft key to start saving.
Loading P-P waveform data10. Press the “LOAD ” soft key to display the loading menu.11. Press the “Destn ” soft key to display the destination setting
menu.
12. Press the soft key corresponding to the destination of thewaveform to be loaded.
13. Use the rotary knob to select the file to be loaded.
14. Press the “EXEC” soft key to start loading.
Keys and ProcedureRotary knob
Soft keys
STORE/RECALL(FILE) key
SHIFT keySTART/STOP key
CH keyPOSITION keyINPUT key
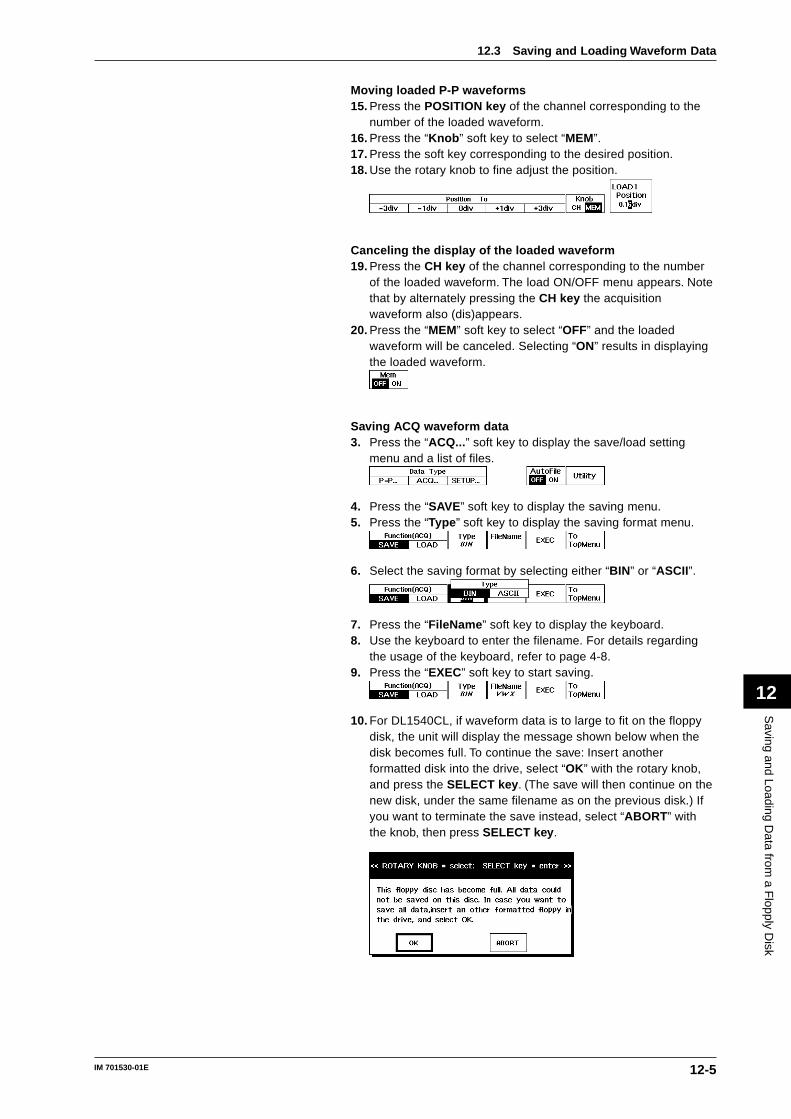
12-5IM 701530-01E
Saving and Loading D
ata from a F
lopply Disk
12
Moving loaded P-P waveforms15. Press the POSITION key of the channel corresponding to the
number of the loaded waveform.16. Press the “Knob ” soft key to select “MEM”.17. Press the soft key corresponding to the desired position.18. Use the rotary knob to fine adjust the position.
Canceling the display of the loaded waveform19. Press the CH key of the channel corresponding to the number
of the loaded waveform. The load ON/OFF menu appears. Notethat by alternately pressing the CH key the acquisitionwaveform also (dis)appears.
20. Press the “MEM” soft key to select “OFF” and the loadedwaveform will be canceled. Selecting “ON” results in displayingthe loaded waveform.
Saving ACQ waveform data3. Press the “ACQ...” soft key to display the save/load setting
menu and a list of files.
4. Press the “SAVE” soft key to display the saving menu.5. Press the “Type ” soft key to display the saving format menu.
6. Select the saving format by selecting either “BIN” or “ASCII”.
7. Press the “FileName ” soft key to display the keyboard.8. Use the keyboard to enter the filename. For details regarding
the usage of the keyboard, refer to page 4-8.9. Press the “EXEC” soft key to start saving.
10. For DL1540CL, if waveform data is to large to fit on the floppydisk, the unit will display the message shown below when thedisk becomes full. To continue the save: Insert anotherformatted disk into the drive, select “OK” with the rotary knob,and press the SELECT key . (The save will then continue on thenew disk, under the same filename as on the previous disk.) Ifyou want to terminate the save instead, select “ABORT ” withthe knob, then press SELECT key .
12.3 Saving and Loading Waveform Data

12-6 IM 701530-01E
Loading ACQ waveform dataNote that only BIN data can be loaded.11. Press the “LOAD ” soft key to display the loading menu.
12. Use the rotary knob to select the file to be loaded.
13. Press the “EXEC” soft key to start loading.
For DL1540L, if you have saved ACQ data to multiple floppydisks, you can opt to load all of this data or only part of it (forexample, data from one disk only). If you do a partial load, thewaveform display will not appear over the entire time axis, butonly over a portion of it. If you want to display waveforms overthe full span of the time axis, insert the floppy disk(s) with theremaining ACQ data and repeat Steps 11 to 13 as necessary(repeating the same filename at Step 5).
Moving loaded ACQ waveforms14. The way to move these waveforms is exactly the same as for
input signal waveforms. For details, refer to page 5-7.
Canceling/holding the display of the loaded waveform15. Press the INPUT key of the channel corresponding to the
number of the loaded waveform. The acquisition hold menuappears.
16. Press the “ACQ Hold ” soft key to select “OFF”. Then when youpress the START/STOP key to start data acquisition, the loadedACQ waveform will be canceled. When you select “ON”, theloaded ACQ waveform will not be canceled, even when youstart data acquisition. In this case, the channel display appearsin the left upper side of the screen.
17. The way to display the ACQ waveforms and cancel them isexactly the same as for input signal waveforms. For details,refer to page 5-1.
12.3 Saving and Loading Waveform Data
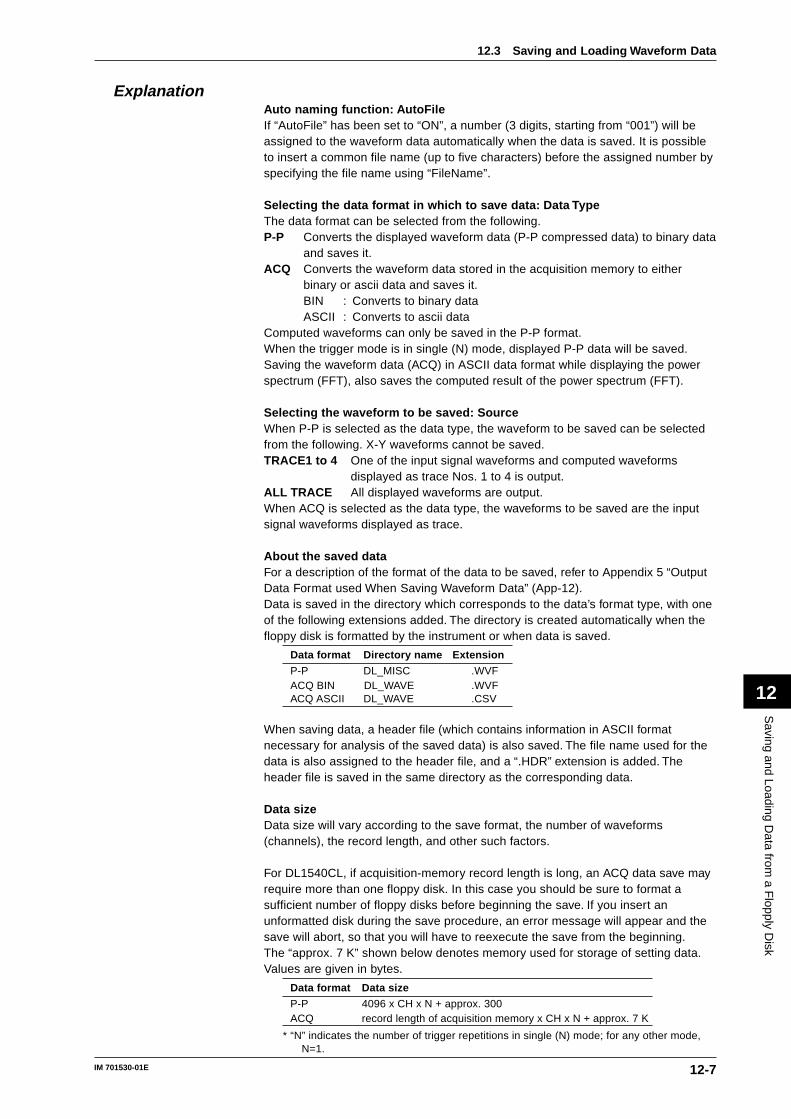
12-7IM 701530-01E
Saving and Loading D
ata from a F
lopply Disk
12
ExplanationAuto naming function: AutoFileIf “AutoFile” has been set to “ON”, a number (3 digits, starting from “001”) will beassigned to the waveform data automatically when the data is saved. It is possibleto insert a common file name (up to five characters) before the assigned number byspecifying the file name using “FileName”.
Selecting the data format in which to save data: Data TypeThe data format can be selected from the following.P-P Converts the displayed waveform data (P-P compressed data) to binary data
and saves it.ACQ Converts the waveform data stored in the acquisition memory to either
binary or ascii data and saves it.BIN : Converts to binary dataASCII : Converts to ascii data
Computed waveforms can only be saved in the P-P format.When the trigger mode is in single (N) mode, displayed P-P data will be saved.Saving the waveform data (ACQ) in ASCII data format while displaying the powerspectrum (FFT), also saves the computed result of the power spectrum (FFT).
Selecting the waveform to be saved: SourceWhen P-P is selected as the data type, the waveform to be saved can be selectedfrom the following. X-Y waveforms cannot be saved.TRACE1 to 4 One of the input signal waveforms and computed waveforms
displayed as trace Nos. 1 to 4 is output.ALL TRACE All displayed waveforms are output.When ACQ is selected as the data type, the waveforms to be saved are the inputsignal waveforms displayed as trace.
About the saved dataFor a description of the format of the data to be saved, refer to Appendix 5 “OutputData Format used When Saving Waveform Data” (App-12).Data is saved in the directory which corresponds to the data’s format type, with oneof the following extensions added. The directory is created automatically when thefloppy disk is formatted by the instrument or when data is saved.
Data format Directory name Extension
P-P DL_MISC .WVFACQ BIN DL_WAVE .WVFACQ ASCII DL_WAVE .CSV
When saving data, a header file (which contains information in ASCII formatnecessary for analysis of the saved data) is also saved. The file name used for thedata is also assigned to the header file, and a “.HDR” extension is added. Theheader file is saved in the same directory as the corresponding data.
Data sizeData size will vary according to the save format, the number of waveforms(channels), the record length, and other such factors.
For DL1540CL, if acquisition-memory record length is long, an ACQ data save mayrequire more than one floppy disk. In this case you should be sure to format asufficient number of floppy disks before beginning the save. If you insert anunformatted disk during the save procedure, an error message will appear and thesave will abort, so that you will have to reexecute the save from the beginning.The “approx. 7 K” shown below denotes memory used for storage of setting data.Values are given in bytes.
Data format Data size
P-P 4096 x CH x N + approx. 300ACQ record length of acquisition memory x CH x N + approx. 7 K
* “N” indicates the number of trigger repetitions in single (N) mode; for any other mode,N=1.
12.3 Saving and Loading Waveform Data
12-8 IM 701530-01E
Checking the free space on a floppy diskRefer to page 12-3 for a description of this procedure.
Moving loaded P-P waveformsPressing the POSITION key of the channel corresponding to the number of theloaded waveform prompts you to select whether you want to move the input signalwaveform or the loaded waveform.“CH” at the “Knob” setting selects to move input signal waveforms;“MEM” at the “Knob” setting selects to move loaded P-P waveforms.
Entering a file nameThe following points must be kept in mind when entering a file name.• A file name must always be specified;• Up to eight characters can be entered. However, in case of GO/NO-GO or
acquisition-on-trigger only the first four will be valid;• For details regarding the characters which can be used, refer to page 4-8;• The same name cannot be assigned to different data files of the same data type.
(Overwrite inhibit). However, restarting the GO/NO-GO determination oracquisition-on-trigger function will result in overwriting the old files.
Points to note when saving/loading waveform data• Acquisition stops when saving or loading is started;• Only waveform data located within ±5.12 div of the center of the waveform
display frame is saved. Thus, if the saved waveform exceeds this range vertically,the part exceeding this range will not be displayed if the waveform issubsequently loaded and scrolled vertically;
• For DL1540CL, floppy disks having less than 20 K free capacity cannot be usedfor ACQ-waveform data saves.
• When “ACQ” data is loaded, the setting parameters will change to their values atthe time of saving;
• If “P-P” data is loaded, expansion of the waveform and waveform computationare not possible.
• If the extension of the waveform data file is changed using a personal computer,it will be impossible to load the data.
• As for “ACQ” data, only “BIN” data will be loaded.• For more details regarding the display of the waveform information while
displaying loaded P-P waveform or ACQ waveform data, refer to page 7-17.• When you load waveform data (ACQ and P-P), be aware of the restrictions of
some models;•DL1540C : Can only load waveform data saved by the DL1540C.•DL1540CL : Can load waveform data saved by theDL1540C and DL1540CL.
CAUTION Never remove the floppy disk while the access indicator of the floppy diskdrive is lit, or damage to the magnetic head of the drive or loss of data on thefloppy disk may result.
12.3 Saving and Loading Waveform Data
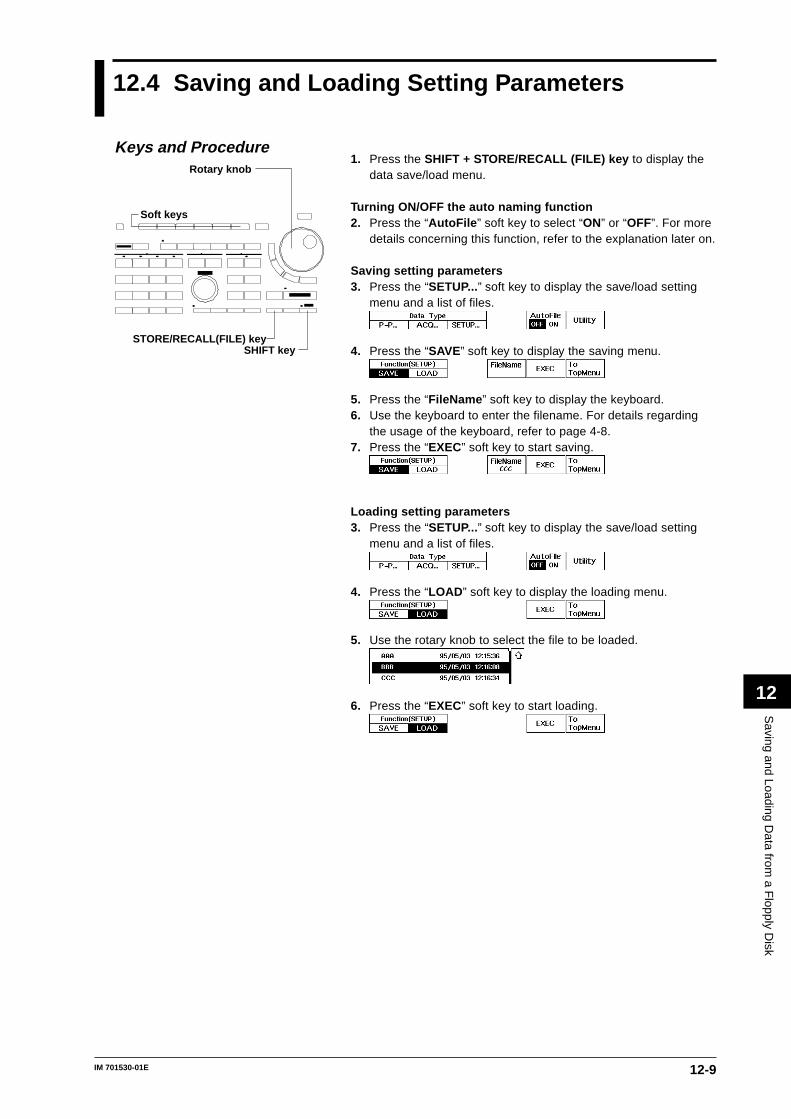
12-9IM 701530-01E
Saving and Loading D
ata from a F
lopply Disk
12
12.4 Saving and Loading Setting Parameters
1. Press the SHIFT + STORE/RECALL (FILE) key to display thedata save/load menu.
Turning ON/OFF the auto naming function2. Press the “AutoFile ” soft key to select “ON” or “OFF”. For more
details concerning this function, refer to the explanation later on.
Saving setting parameters3. Press the “SETUP...” soft key to display the save/load setting
menu and a list of files.
4. Press the “SAVE” soft key to display the saving menu.
5. Press the “FileName ” soft key to display the keyboard.6. Use the keyboard to enter the filename. For details regarding
the usage of the keyboard, refer to page 4-8.7. Press the “EXEC” soft key to start saving.
Loading setting parameters3. Press the “SETUP...” soft key to display the save/load setting
menu and a list of files.
4. Press the “LOAD ” soft key to display the loading menu.
5. Use the rotary knob to select the file to be loaded.
6. Press the “EXEC” soft key to start loading.
Keys and ProcedureRotary knob
Soft keys
STORE/RECALL(FILE) keySHIFT key
12-10 IM 701530-01E
ExplanationAuto naming function: AutoFileIf “AutoFile” has been set to “ON”, a file name No. (3 digits, starting from “001”) willbe assigned to the data automatically when the data is saved. It is possible to inserta common file name (up to five characters) before the assigned file name No. byspecifying the file name using “FileName”.
Setting parameters which can be savedSettings made using the soft key menu and rotary knob, as well as the START/STOP state and the channel’s ON/OFF state are saved. If a zone waveform hasbeen registered in GO/NO-GO and the following settings have been made, the zonewaveform will also be saved.Mode : ONType : ZONE
About saved setting parametersWhen setting parameters are saved, the extension “SET” is automatically added,the “DL_SETUP” directory is created automatically, and the data is saved into thisdirectory.
Data sizeApproximately 10 K bytes are used for each set of setting parameters. However, ifGO/NO-GO zone waveforms are included, approximately 4 K bytes extra arerequired for each zone waveform.
Checking the free space on a floppy diskRefer to page 12-3 for a description of this procedure.
Entering a file nameThe following points must be kept in mind when entering a file name.• A file name must always be specified;• Up to eight characters can be entered.• All the characters on the keyboard can be used. However, the following file
names cannot be used due to MS-DOS restrictions;AUX, CON, PRN, NUL, CLOCK
• The same name cannot be assigned to different data files of the same data type.(Overwrite inhibit).
Points to note when saving/loading setting parameters• Setting parameters can be saved even if acquisition is in progress (i.e. while the
START indicator is lit).• Once the loaded setting parameters have been canceled, the original setting
parameters cannot be restored.• If the extension of the setting parameter file is changed using a personal
computer, it will be impossible to load the data.
CAUTION Never remove the floppy disk while the access indicator of the floppy diskdrive is lit, or damage to the magnetic head of the drive or loss of data on thefloppy disk may result.
12.4 Saving and Loading Setting Parameters

12-11IM 701530-01E
Saving and Loading D
ata from a F
lopply Disk
12
12.5 Saving Screen Image Data
1. Press the SHIFT + COPY (MENU) key to display the hard copysetting menu.
2. Press the “FILE...” soft key to display the image setting menu.
Turning ON/OFF the auto naming function3. Press the “AutoFile ” soft key to select “ON” or “OFF”. For more
details concerning this function, refer to the explanation later on.
Saving screen image data4. Press the “Format ” soft key to display the image data setting
menu.
5. Press the soft key corresponding to the desired format. In caseyou selected “HPGL” or “PS”, continue with step 6. In case youselected “TIFF” or “BMP”, continue with step 19.
6. Press the “Setup ” soft key to display the output setting menu.
Selecting the paper size7. After having selected the “Paper Size ” setting using the rotary
knob, press the the SELECT key to select the desired papersize. In case you selected “PS” at step 5, there is no need touse the rotary knob and you may continue with step 18.
Selecting the pen speed8. After having selected the “Pen Speed ” setting using the rotary
knob, press the the SELECT key to select from “NORMAL ” or“SLOW”.
Selecting the XY Mode9. After having selected the “XY Mode ” setting using the rotary knob,
press the the SELECT key to select from “DOT” or “LINE”.Assigning pens10. After having selected the “Pen Mode ” setting using the rotary knob,
press the the SELECT key to select from “AUTO” or “MANUAL ”.In case you selected “MANUAL ”, continue with step 14.
11. After having selected “AUTO”, and after having selected the“Auto Pen ” setting using the rotary knob, press the SELECTkey to display the setting frame.
12. Use the rotary knob to set the number of pens. Press theRESET key to return the default value.
13. Press the SELECT key or the ESC key to close the settingframe. Continue with step 18.
14. After having selected “MANUAL ”, use the rotary knob and theSELECT key to select the “Grid Pen ” setting, the “TRACE1Pen - TRACE4 Pen ” setting and the “LOAD1 Pen - LOAD4Pen” setting.
15. Use the rotary knob to set the pen numbers. Press the RESETkey to return the default value.
16. Press the SELECT key or the ESC key to close the settingframe.
17. Repeat steps 14 to 16 to set other items of the “MANUAL ”setting.
18. Press the ESC key to close the setting menu.
Keys and Procedure
COPY(MENU) key
Rotary knob
ESC key
SHIFT key
Soft keys
SELECT keyRESET key
Output setting menu in case "PS" is selected
Output setting menu in case "HPGL" is selected
12-12 IM 701530-01E
Selecting the image color (with TIFF or BMP only)19. Press the “Color ” soft key to display the image color selection
menu.
20. Press the soft key corresponding to the desired image color.For details regarding the explanation of the image color.
Data compression (with TIFF or BMP only)21. Press the “Compression ” soft key to set compression “ON” or
“OFF”.
Entering the filename22. Press the “FileName ” soft key to display the keyboard.23. Use the keyboard to enter the filename. For details regarding
the usage of the keyboard, refer to page 4-8.
Outputting24. Press the COPY key .
ExplanationAuto naming function: AutoFileIf “AutoFile” has been set to “ON”, a number (3 digits, starting from “001”) will beassigned to the data automatically when the data is saved. It is possible to insert acommon file name (up to five characters) before the assigned number by specifyingthe file name using “FileName”.
Selecting the data output format: FormatThe data output format can be selected from the following formats.HP-GL Saves image data in HP-GL format.PS Saves image data in PostScript format.TIFF Saves image data in TIFF format.BMP Saves image data in BMP format.
About saved image dataWhen saving image data, extensions are automatically added. The “DL_MISC”directory is created automatically, and the data is saved into this directory. Theextensions are as follows.HPGL “.HGL” TIFF “.TIF”PS “.PS” BMP “.BMP”
Selecting the paper sizeThese “Setup” settings are necessary for printing out image data from a PC or suchto a plotter. The contents of printing, paper size, printing size and printing locationdepend on the format of the data and can be selected from the following types. Alsorefer to page 10-4.For HPGL format:
Setting Output item Output size Output location
A3-WAVE Screen hardcopy A3 Middle
A3-SETUP Set-up parameters A3 Middle
A4-WAVE Screen hardcopy A4 Middle
A4-SETUP Set-up parameters A4 Middle
A5-Upper WAVE Screen hardcopy A5 Upper half
A5-Lower WAVE Screen hardcopy A5 Lower half
A5-Upper WAVE & Screen hardcopy A5 Upper halfA5-Lower SETUP Set-up parameters A5 Lower half
A5-Upper WAVE & Screen hardcopy A5 Upper halfA5-Lower MEASURE waveform measurement data A5 Lower half
12.5 Saving Screen Image Data
12-13IM 701530-01E
Saving and Loading D
ata from a F
lopply Disk
12
For PS format:
Setting Output item Output size Output location
A4-WAVE Screen hardcopy A4 Middle
A4-SETUP Set-up parameters A4 Middle
A5-Upper WAVE Screen hardcopy A5 Upper half
A5-Lower WAVE Screen hardcopy A5 Lower half
A5-Upper WAVE & Screen hardcopy A5 Upper halfA5-Lower SETUP Set-up parameters A5 Lower half
A5-Upper WAVE & Screen hardcopy A5 Upper halfA5-Lower MEASURE waveform measurement data A5 Lower half
For TIFF/BMP format:No selections are possible; the output size is approx. 12 x 8 cm.Contents to be savedIn the HP-GL and PS format, the following types of screen image data are notsaved.• Snapshot waveforms• Soft key menu and rotary knob menu• Messages (except “Stopped” and “RUNNING)In the TIFF and BMP format, data will be saved exactly as in case of the short copy.Refer to page 10-4 for more details.
Data size when savingIn case of saving a V-T Waveform, with two waveforms and grid displayed:HPGL : approx. 25 Kbyte TIFF : approx. 300 KbytePS : approx. 70 Kbyte BMP : approx. 300 Kbyte
Checking the free space on a floppy diskRefer to page 12-3 for a description of this procedure.
Image color type (with TIFF or BMP only)OFF : Same image as the "SHORT" (Short copy)" printing type described on page 10-4.GRAY: 4-bit gray scale image.HALF : Image using the same colors as the screen (except grid, scale, etc. are in
black and no background).FULL : Image using the same colors as the screen.
Data compression (with TIFF or BMP only)Data of TIFF and BMP formats can be output by compression, using respectivelyLZW and RLE.
Entering a file nameThe following points must be kept in mind when entering a file name.• A file name must always be specified;• Up to eight characters can be entered;• All the characters on the keyboard can be used. However, the following file
names cannot be used due to MS-DOS restrictions;AUX, CON, PRN, NUL, CLOCK
• The same name cannot be assigned to different data files of the same data type.(Overwrite inhibit).
Points to not when using data saved in Post Script formatThere is no problem printing out data saved in PostScript format on a PostScriptprinter. However, if the PostScript data is used in a file created by DTP applicationsoftware, the waveform image will probably not appear on the computer’s screen.Instead a gray box indicating the size of the image will probably appear.
CAUTION Never remove the floppy disk while the access indicator of the floppy diskdrive is lit, or damage to the magnetic head of the drive or loss of data on thefloppy disk may result.
12.5 Saving Screen Image Data
12-14 IM 701530-01E
12.6 Deleting and Protecting Saved Data
1. Press the SHIFT + STORE/RECALL (FILE) key to display thedata save/load menu.
2. Press the “Utility ” soft key to display the utility selection menu.
3. Press the “List ” soft key to display the list selection menu.
4. Press the soft key corresponding to the desired list.
5. Use the rotary knob to select the file to protect/save.
Deleting6. Press the “Delete ” soft key.
Protecting6. Press the “Protect ” soft key. A “ ” symbol will be added before
the file name of the protected file.
Canceling protection7. After step 4 has been performed, use the rotary knob to select
the file at the beginning of which a “ ” symbol is added.
8. Press the “Protect ” soft key and the protection will be canceled.The “ ” symbol before the file name will be deleted.
ExplanationDeleting dataWaveform data and setting parameters saved on a floppy disk can be deleted onefile at a time.
Protecting dataA protection function is used to protect saved data from being deleted by mistake. Ifan attempt is made to delete protected data, an error message will be displayedand the data will not be deleted.A “ ” symbol is displayed before the names of protected files to distinguish themfrom un-protected files.
Keys and ProcedureRotary knob
Soft keys
STORE/RECALL(FILE) keySHIFT key
12-15IM 701530-01E
Saving and Loading D
ata from a F
lopply Disk
12
Selecting the data list: Change Data ListFile lists are displayed by data type and data format and are grouped as follows.P-P Displayed waveform data (P-P compressed);ACQ Data being saved in the acquisition memory;SETUP Setting parameters.
Points to note when protecting or deleting data• Protection setting cannot be performed if the floppy disk is write-protected. An
error message will appear if an attempt is made to protect or delete files.• It is not possible to delete more than one file at once.• This protection setting is effective against deletion of data, but not against
initialization (formatting). Take care not to accidentally delete files by reformattinga floppy file.
CAUTION Never remove the floppy disk while the access indicator of the floppy diskdrive is lit, or damage to the magnetic head of the drive or loss of data on thefloppy disk may result.
12.6 Deleting and Protecting Saved Data
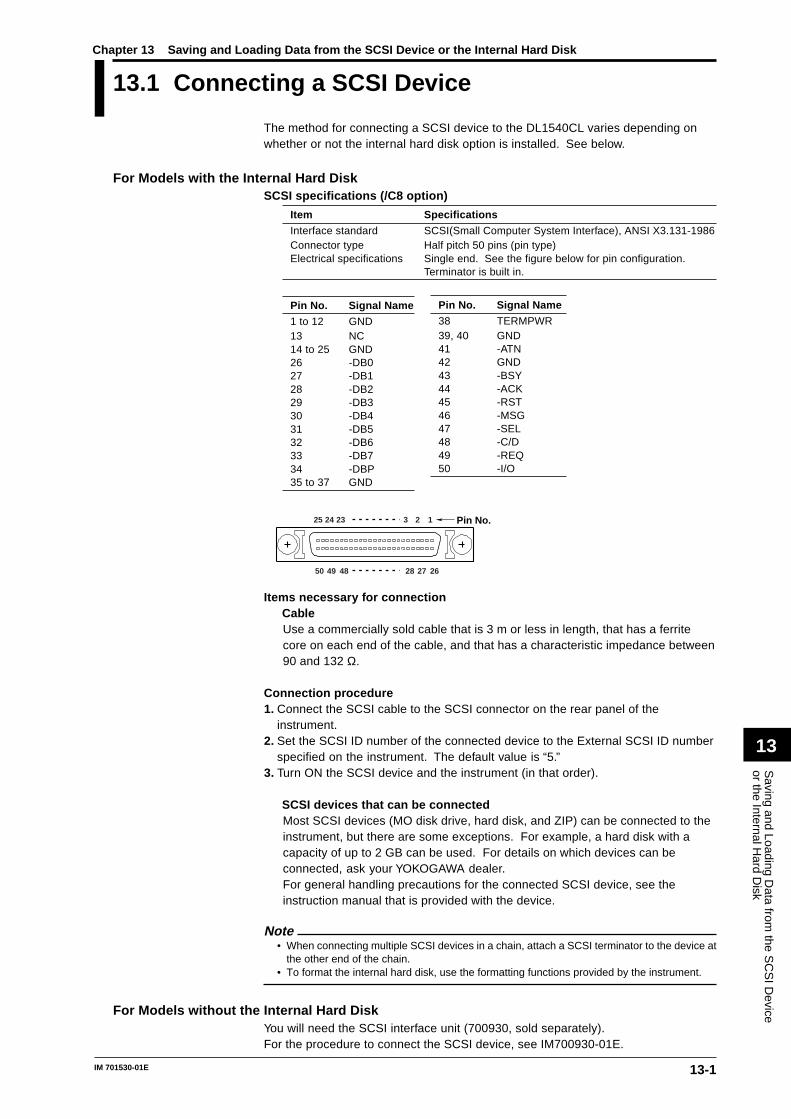
13-1
Saving and Loading D
ata from the S
CS
I Device
or the Internal Hard D
isk
13
IM 701530-01E
Chapter 13 Saving and Loading Data from the SCSI Device or the Internal Hard Disk
13.1 Connecting a SCSI Device
The method for connecting a SCSI device to the DL1540CL varies depending onwhether or not the internal hard disk option is installed. See below.
For Models with the Internal Hard DiskSCSI specifications (/C8 option)
Item Specifications
Interface standard SCSI(Small Computer System Interface), ANSI X3.131-1986Connector type Half pitch 50 pins (pin type)Electrical specifications Single end. See the figure below for pin configuration.
Terminator is built in.
Pin No. Signal Name
1 to 12 GND13 NC14 to 25 GND26 -DB027 -DB128 -DB229 -DB330 -DB431 -DB532 -DB633 -DB734 -DBP35 to 37 GND
Pin No.24 2325 3 2 1
28 27 2650 49 48
Items necessary for connectionCableUse a commercially sold cable that is 3 m or less in length, that has a ferritecore on each end of the cable, and that has a characteristic impedance between90 and 132 Ω.
Connection procedure1. Connect the SCSI cable to the SCSI connector on the rear panel of the
instrument.2. Set the SCSI ID number of the connected device to the External SCSI ID number
specified on the instrument. The default value is “5.”3. Turn ON the SCSI device and the instrument (in that order).
SCSI devices that can be connectedMost SCSI devices (MO disk drive, hard disk, and ZIP) can be connected to theinstrument, but there are some exceptions. For example, a hard disk with acapacity of up to 2 GB can be used. For details on which devices can beconnected, ask your YOKOGAWA dealer.For general handling precautions for the connected SCSI device, see theinstruction manual that is provided with the device.
Note• When connecting multiple SCSI devices in a chain, attach a SCSI terminator to the device at
the other end of the chain.• To format the internal hard disk, use the formatting functions provided by the instrument.
For Models without the Internal Hard DiskYou will need the SCSI interface unit (700930, sold separately).For the procedure to connect the SCSI device, see IM700930-01E.
Pin No. Signal Name
38 TERMPWR39, 40 GND41 -ATN42 GND43 -BSY44 -ACK45 -RST46 -MSG47 -SEL48 -C/D49 -REQ50 -I/O
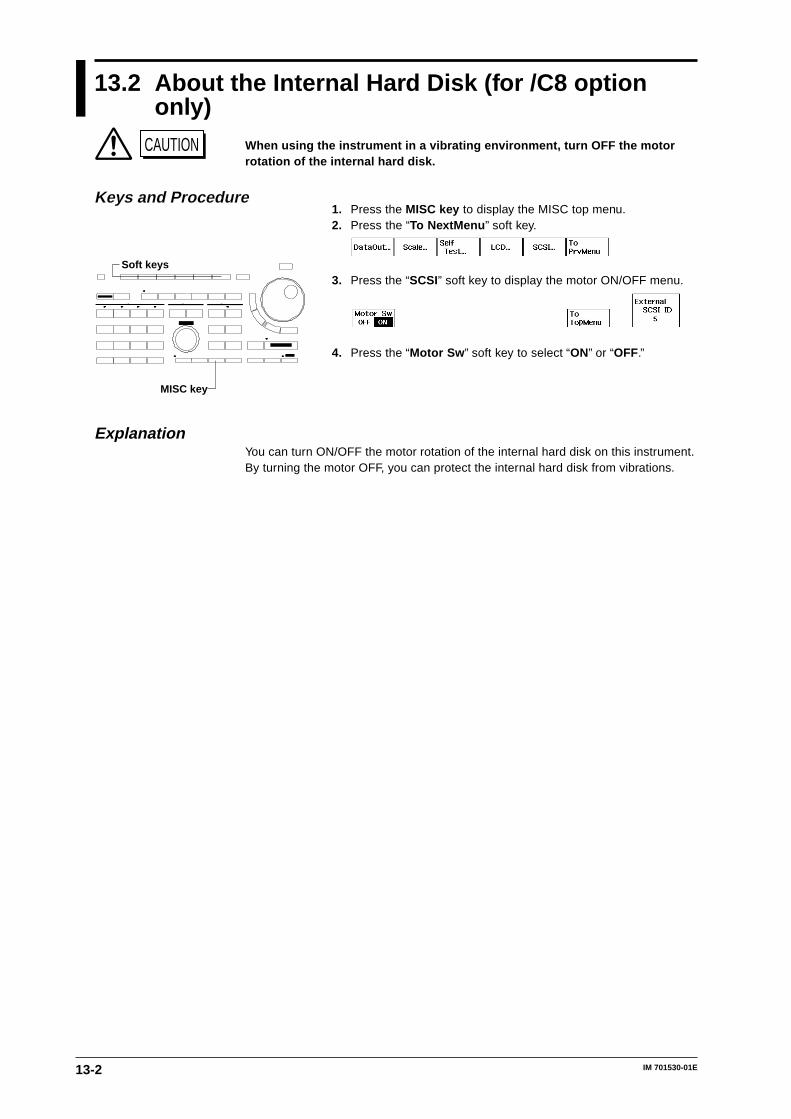
13-2 IM 701530-01E
13.2 About the Internal Hard Disk (for /C8 optiononly)
CAUTION When using the instrument in a vibrating environment, turn OFF the motorrotation of the internal hard disk.
1. Press the MISC key to display the MISC top menu.2. Press the “To NextMenu ” soft key.
3. Press the “SCSI” soft key to display the motor ON/OFF menu.
4. Press the “Motor Sw ” soft key to select “ON” or “OFF.”
ExplanationYou can turn ON/OFF the motor rotation of the internal hard disk on this instrument.By turning the motor OFF, you can protect the internal hard disk from vibrations.
Keys and Procedure
Soft keys
MISC key
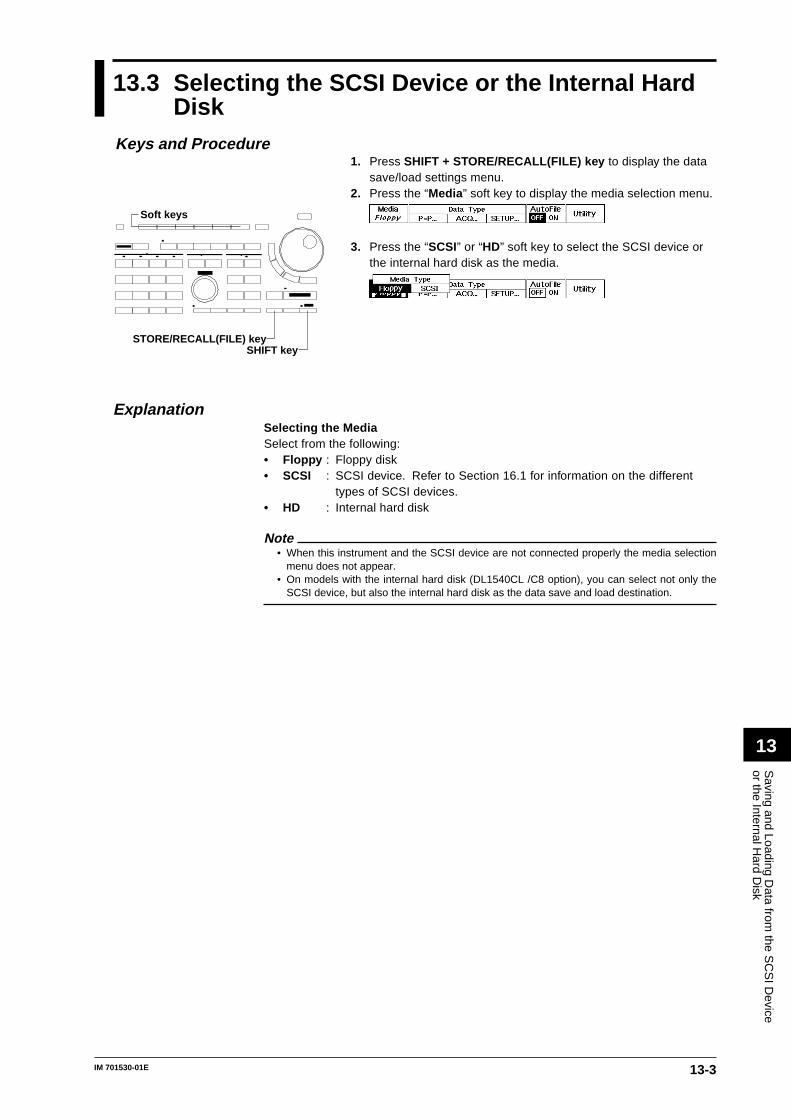
13-3
Saving and Loading D
ata from the S
CS
I Device
or the Internal Hard D
isk
13
IM 701530-01E
13.3 Selecting the SCSI Device or the Internal HardDisk
1. Press SHIFT + STORE/RECALL(FILE) key to display the datasave/load settings menu.
2. Press the “Media ” soft key to display the media selection menu.
3. Press the “SCSI” or “HD” soft key to select the SCSI device orthe internal hard disk as the media.
ExplanationSelecting the MediaSelect from the following:• Floppy : Floppy disk• SCSI : SCSI device. Refer to Section 16.1 for information on the different
types of SCSI devices.• HD : Internal hard disk
Note• When this instrument and the SCSI device are not connected properly the media selection
menu does not appear.• On models with the internal hard disk (DL1540CL /C8 option), you can select not only the
SCSI device, but also the internal hard disk as the data save and load destination.
Soft keys
STORE/RECALL(FILE) keySHIFT key
Keys and Procedure
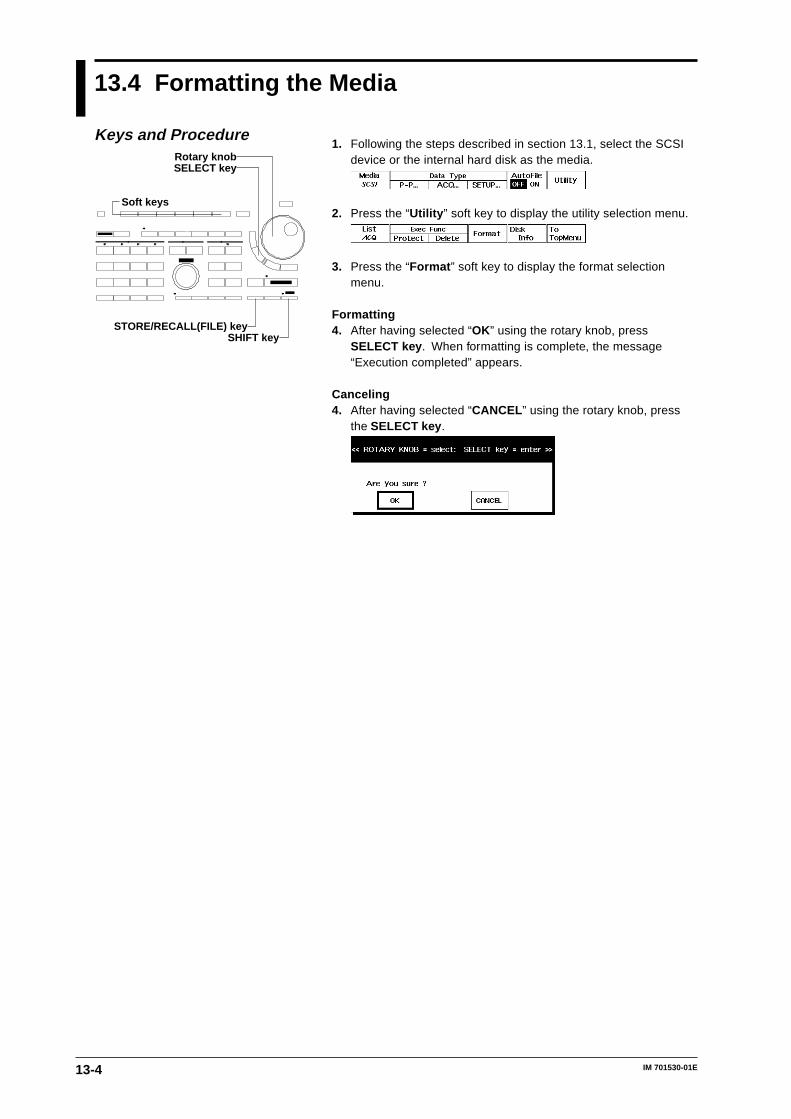
13-4 IM 701530-01E
13.4 Formatting the Media
1. Following the steps described in section 13.1, select the SCSIdevice or the internal hard disk as the media.
2. Press the “Utility ” soft key to display the utility selection menu.
3. Press the “Format ” soft key to display the format selectionmenu.
Formatting4. After having selected “OK” using the rotary knob, press
SELECT key . When formatting is complete, the message“Execution completed” appears.
Canceling4. After having selected “CANCEL ” using the rotary knob, press
the SELECT key .
Keys and ProcedureRotary knob
Soft keys
STORE/RECALL(FILE) keySHIFT key
SELECT key
13-5
Saving and Loading D
ata from the S
CS
I Device
or the Internal Hard D
isk
13
IM 701530-01E
13.4 Formatting the Media
ExplanationChecking the formatIf the media has already been formatted, select “Disk Info” after step 2 (on theprevious page) and the following information will be displayed. If the media has notbeen formatted, or if it has been formatted in uncorrect format, the error message“Storage media is defective” will be displayed.• Type of disk;• Total disk space;• Used disk space;• Available on disk;• Number of Setup data files;• Number of P-P data files;• Number of ACQ(bin) data files;• Number of ACQ(ascii) data files;• Number of Image data files.
Points to note concerning formatting• The following three directories are created automatically when a medium is
formattedusing this instrument.DL_WAVE Directory for “BIN” (binary) waveform dataDL_SETUP Directory for “SETUP” (setting parameters)DL_MISC Directory for “P-P” and “ASCII” waveform data, as well as “HP-GL”,
“PS” (Postscript), “TIFF” and “BMP” screen image data• There are cases when a medium which has been formatted with another
equipment such as a PC can not be used.• If an error message appears when formatting has been completed, the medium
may be damaged.• Formatting the medium will erase all data on the disk. Be careful.
CAUTION Never turn OFF the SCSI device or remove the disk (media) such as a MO or aPD while the access indicator of the SCSI device is lit. Otherwise, damage tothe SCSI device or the disk may result.
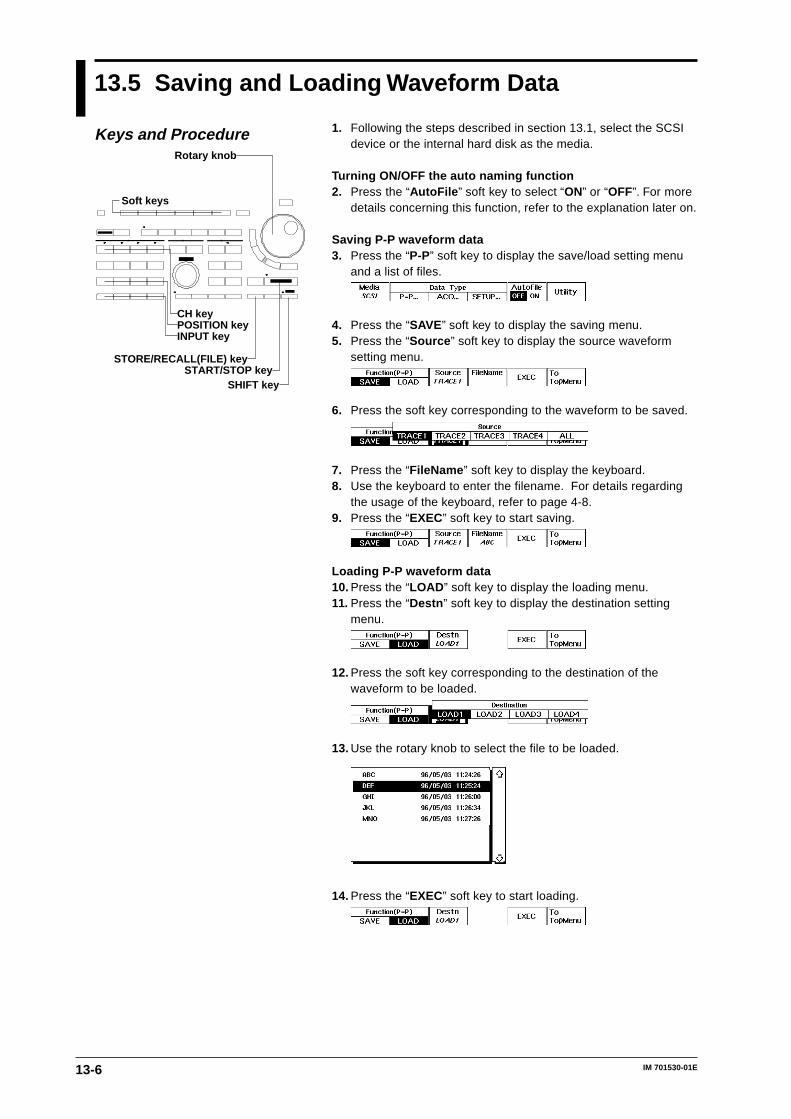
13-6 IM 701530-01E
13.5 Saving and Loading Waveform Data
1. Following the steps described in section 13.1, select the SCSIdevice or the internal hard disk as the media.
Turning ON/OFF the auto naming function2. Press the “AutoFile ” soft key to select “ON” or “OFF”. For more
details concerning this function, refer to the explanation later on.
Saving P-P waveform data3. Press the “P-P” soft key to display the save/load setting menu
and a list of files.
4. Press the “SAVE” soft key to display the saving menu.5. Press the “Source ” soft key to display the source waveform
setting menu.
6. Press the soft key corresponding to the waveform to be saved.
7. Press the “FileName ” soft key to display the keyboard.8. Use the keyboard to enter the filename. For details regarding
the usage of the keyboard, refer to page 4-8.9. Press the “EXEC” soft key to start saving.
Loading P-P waveform data10. Press the “LOAD ” soft key to display the loading menu.11. Press the “Destn ” soft key to display the destination setting
menu.
12. Press the soft key corresponding to the destination of thewaveform to be loaded.
13. Use the rotary knob to select the file to be loaded.
14. Press the “EXEC” soft key to start loading.
Rotary knob
Soft keys
STORE/RECALL(FILE) key
SHIFT keySTART/STOP key
CH keyPOSITION keyINPUT key
Keys and Procedure
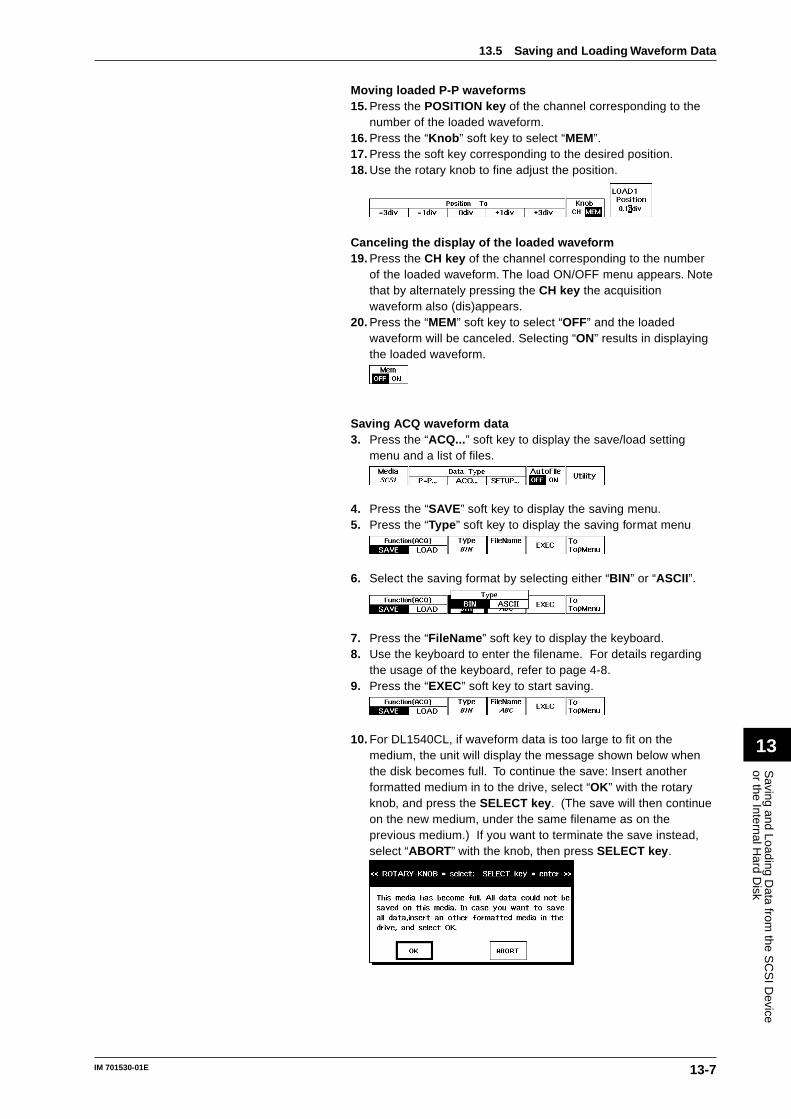
13-7
Saving and Loading D
ata from the S
CS
I Device
or the Internal Hard D
isk
13
IM 701530-01E
13.5 Saving and Loading Waveform Data
Moving loaded P-P waveforms15. Press the POSITION key of the channel corresponding to the
number of the loaded waveform.16. Press the “Knob ” soft key to select “MEM”.17. Press the soft key corresponding to the desired position.18. Use the rotary knob to fine adjust the position.
Canceling the display of the loaded waveform19. Press the CH key of the channel corresponding to the number
of the loaded waveform. The load ON/OFF menu appears. Notethat by alternately pressing the CH key the acquisitionwaveform also (dis)appears.
20. Press the “MEM” soft key to select “OFF” and the loadedwaveform will be canceled. Selecting “ON” results in displayingthe loaded waveform.
Saving ACQ waveform data3. Press the “ACQ...” soft key to display the save/load setting
menu and a list of files.
4. Press the “SAVE” soft key to display the saving menu.5. Press the “Type ” soft key to display the saving format menu
6. Select the saving format by selecting either “BIN” or “ASCII”.
7. Press the “FileName ” soft key to display the keyboard.8. Use the keyboard to enter the filename. For details regarding
the usage of the keyboard, refer to page 4-8.9. Press the “EXEC” soft key to start saving.
10. For DL1540CL, if waveform data is too large to fit on themedium, the unit will display the message shown below whenthe disk becomes full. To continue the save: Insert anotherformatted medium in to the drive, select “OK” with the rotaryknob, and press the SELECT key . (The save will then continueon the new medium, under the same filename as on theprevious medium.) If you want to terminate the save instead,select “ABORT ” with the knob, then press SELECT key .
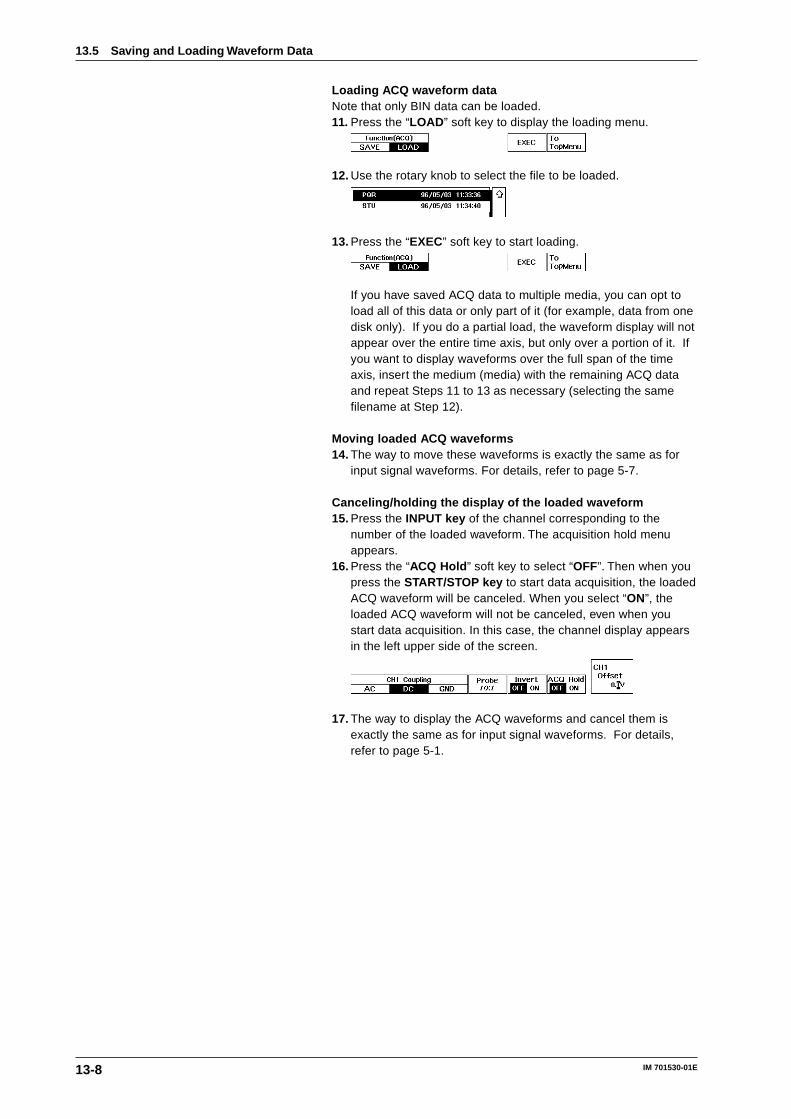
13-8 IM 701530-01E
13.5 Saving and Loading Waveform Data
Loading ACQ waveform dataNote that only BIN data can be loaded.11. Press the “LOAD ” soft key to display the loading menu.
12. Use the rotary knob to select the file to be loaded.
13. Press the “EXEC” soft key to start loading.
If you have saved ACQ data to multiple media, you can opt toload all of this data or only part of it (for example, data from onedisk only). If you do a partial load, the waveform display will notappear over the entire time axis, but only over a portion of it. Ifyou want to display waveforms over the full span of the timeaxis, insert the medium (media) with the remaining ACQ dataand repeat Steps 11 to 13 as necessary (selecting the samefilename at Step 12).
Moving loaded ACQ waveforms14. The way to move these waveforms is exactly the same as for
input signal waveforms. For details, refer to page 5-7.
Canceling/holding the display of the loaded waveform15. Press the INPUT key of the channel corresponding to the
number of the loaded waveform. The acquisition hold menuappears.
16. Press the “ACQ Hold ” soft key to select “OFF”. Then when youpress the START/STOP key to start data acquisition, the loadedACQ waveform will be canceled. When you select “ON”, theloaded ACQ waveform will not be canceled, even when youstart data acquisition. In this case, the channel display appearsin the left upper side of the screen.
17. The way to display the ACQ waveforms and cancel them isexactly the same as for input signal waveforms. For details,refer to page 5-1.
13-9
Saving and Loading D
ata from the S
CS
I Device
or the Internal Hard D
isk
13
IM 701530-01E
13.5 Saving and Loading Waveform Data
ExplanationAuto naming function: AutoFileIf “AutoFile” has been set to “ON”, a number (3 digits, starting from “001”) will beassigned to the waveform data automatically when the data is saved. It is possibleto insert a common file name (up to five characters) before the assigned number byspecifying the file name using “FileName”.
Selecting the data format in which to save data: Data TypeThe data format can be selected from the following.P-P Converts the displayed waveform data (P-P compressed data) to binary
data and saves it.ACQ Converts the waveform data stored in the acquisition memory to either
binary or ascii data and saves it.BIN : Converts to binary dataASCII : Converts to ascii data
Computed waveforms can only be saved in the P-P format.When in single (N) mode, displayed P-P data will be saved.Saving the waveform data (ACQ) in ASCII data format while displaying the powerspectrum (FFT), also saves the computed result of the power spectrum (FFT).
Selecting the waveform to be saved: SourceWhen P-P is selected as the data type, the waveform to be saved can be selectedfrom the following. X-Y waveforms cannot be saved.
TRACE1 to 4 One of the input signal waveforms and computed waveformsdisplayed as trace Nos. 1 to 4 is output.
ALL TRACE All displayed waveforms are output.When ACQ is selected as the data type, the waveforms to besaved are the input signal waveforms displayed as trace.
About the saved dataFor a description of the format of the data to be saved, refer to Appendix 5 “OutputData Format used When Saving Waveform Data” (App-12).Data is saved in the directory which corresponds to the data’s format type, with oneof the following extensions added. The directory is created automatically when themedium is formatted by the instrument or when data is saved.
Data format Directory name Extension
P-P DL_MISC .WVFACQ BIN DL_WAVE .WVFACQ ASCII DL_MISC .CSV
When saving data, a header file (which contains information in ASCII formatnecessary for analysis of the saved data) is also saved. The file name used for thedata is also assigned to the header file, and a “.HDR” extension is added. Theheader file is saved in the same directory as the corresponding data.
Data sizeData size will vary according to the save format, the number of waveforms(channels), the record length, and other such factors.For DL1540CL, if acquisition-memory record length is long, an ACQ data save mayrequire more than one medium. In this case you should be sure to format anothermedium before beginning the save. If you insert an unformatted disk during thesave procedure, an error message will appear and the save will abort, so that youwill have to reexecute the save from the beginning.The “approx. 7K” shown below denotes memory used for storage of setting data.Values are given in bytes.
Data format Data size
P-P 4096 x CH x N + approx. 300ACQ record length of acquisition memory x CH x N + approx. 7K
* “N” indicates the number of trigger repetitions in single (N) mode; for any other mode,N=1.
13-10 IM 701530-01E
13.5 Saving and Loading Waveform Data
Checking the free space on a mediumRefer to page 13-5 for a description of this procedure.
Moving loaded P-P waveformsPressing the POSITION key of the channel corresponding to the number of theloaded waveform prompts you to select whether you want to move the input signalwaveform or the loaded waveform.
“CH” at the “Knob” setting selects to move input signal waveforms;“MEM” at the “Knob” setting selects to move loaded P-P waveforms.
Entering a file nameThe following points must be kept in mind when entering a file name.• A file name must always be specified;• Up to eight characters can be entered. However, in case of GO/NO-GO or
acquisition-on- trigger only the first four will be valid;• For details regarding the characters which can be used, refer to page 4-8;• The same name cannot be assigned to different data files of the same data type.
(Overwrite inhibit). However, restarting the GO/NO-GO determination oracquisition-on- trigger function will result in overwriting the old files.
Points to note when saving/loading waveform data• Acquisition stops when saving or loading is started;• Only waveform data located within ±5.12 div of the center of the waveform
display frame is saved. Thus, if the saved waveform exceeds this rangevertically, the part exceeding this range will not be displayed if the waveform issubsequently loaded and scrolled vertically;
• For DL1540CL, medias having less than 20K free capacity cannot be used forACQ-waveform data saves.
• When “ACQ” data is loaded, the setting parameters will change to their values atthe timeof saving;
• If “P-P” data is loaded, expansion of the waveform and waveform computationare not possible.
• If the extension of the waveform data file is changed using a personal computer,it will be impossible to load the data.
• As for “ACQ” data, only “BIN” data will be loaded.• For more details regarding the display of the waveform information while
displaying loaded P-P waveform or ACQ waveform data, refer to page 7-15.
CAUTION Never turn OFF the SCSI device or remove the disk (media) such as a MO or aPD while the access indicator of the SCSI device is lit. Otherwise, damage tothe SCSI device or the disk may result.
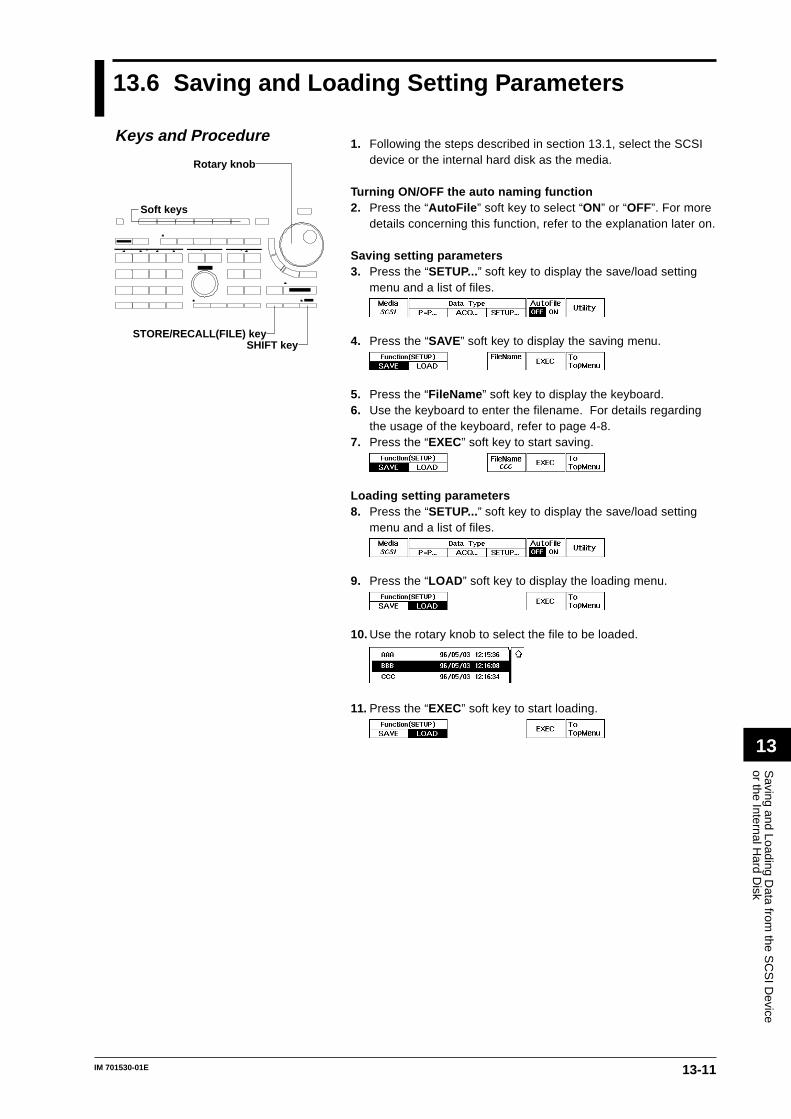
13-11
Saving and Loading D
ata from the S
CS
I Device
or the Internal Hard D
isk
13
IM 701530-01E
13.6 Saving and Loading Setting Parameters
1. Following the steps described in section 13.1, select the SCSIdevice or the internal hard disk as the media.
Turning ON/OFF the auto naming function2. Press the “AutoFile ” soft key to select “ON” or “OFF”. For more
details concerning this function, refer to the explanation later on.
Saving setting parameters3. Press the “SETUP...” soft key to display the save/load setting
menu and a list of files.
4. Press the “SAVE” soft key to display the saving menu.
5. Press the “FileName ” soft key to display the keyboard.6. Use the keyboard to enter the filename. For details regarding
the usage of the keyboard, refer to page 4-8.7. Press the “EXEC” soft key to start saving.
Loading setting parameters8. Press the “SETUP...” soft key to display the save/load setting
menu and a list of files.
9. Press the “LOAD ” soft key to display the loading menu.
10. Use the rotary knob to select the file to be loaded.
11. Press the “EXEC” soft key to start loading.
Rotary knob
Soft keys
STORE/RECALL(FILE) keySHIFT key
Keys and Procedure
13-12 IM 701530-01E
13.6 Saving and Loading Setting Parameters
ExplanationAuto naming function: AutoFileIf “AutoFile” has been set to “ON”, a file name No. (3 digits, starting from “001”) willbe assigned to the data automatically when the data is saved. It is possible to inserta common file name (up to five characters) before the assigned file name No. byspecifying the file name using “FileName”.
Setting parameters which can be savedSettings made using the soft key menu and rotary knob, as well as the START/STOP state and the channel’s ON/OFF state are saved. If a zone waveform hasbeen registered in GO/NO-GO and the following settings have been made, the zonewaveform will also be saved.Mode : ONType : ZONE
About saved setting parametersWhen setting parameters are saved, the extension “SET” is automatically added,the “DL_SETUP” directory is created automatically, and the data is saved into thisdirectory.
Data sizeApproximately 10 K bytes are used for each set of setting parameters. However, ifGO/NO-GO zone waveforms are included, approximately 4 K bytes extra arerequired for each zone waveform.
Checking the free space on a mediumRefer to page 13-5 for a description of this procedure.
Entering a file nameThe following points must be kept in mind when entering a file name.• A file name must always be specified;• Up to eight characters can be entered.• All the characters on the keyboard can be used. However, the following file
names cannot be used due to MS-DOS restrictions;AUX, CON, PRN, NUL, CLOCK
• The same name cannot be assigned to different data files of the same data type.(Overwrite inhibit).
Points to note when saving/loading setting parameters• Setting parameters can be saved even if acquisition is in progress (i.e. while the
START indicator is lit).• Once the loaded setting parameters have been canceled, the original setting
parameters cannot be restored.• If the extension of the setting parameter file is changed using a personal
computer, it will be impossible to load the data.
CAUTION Never turn OFF the SCSI device or remove the disk (media) such as a MO or aPD while the access indicator of the SCSI device is lit. Otherwise, damage tothe SCSI device or the disk may result.
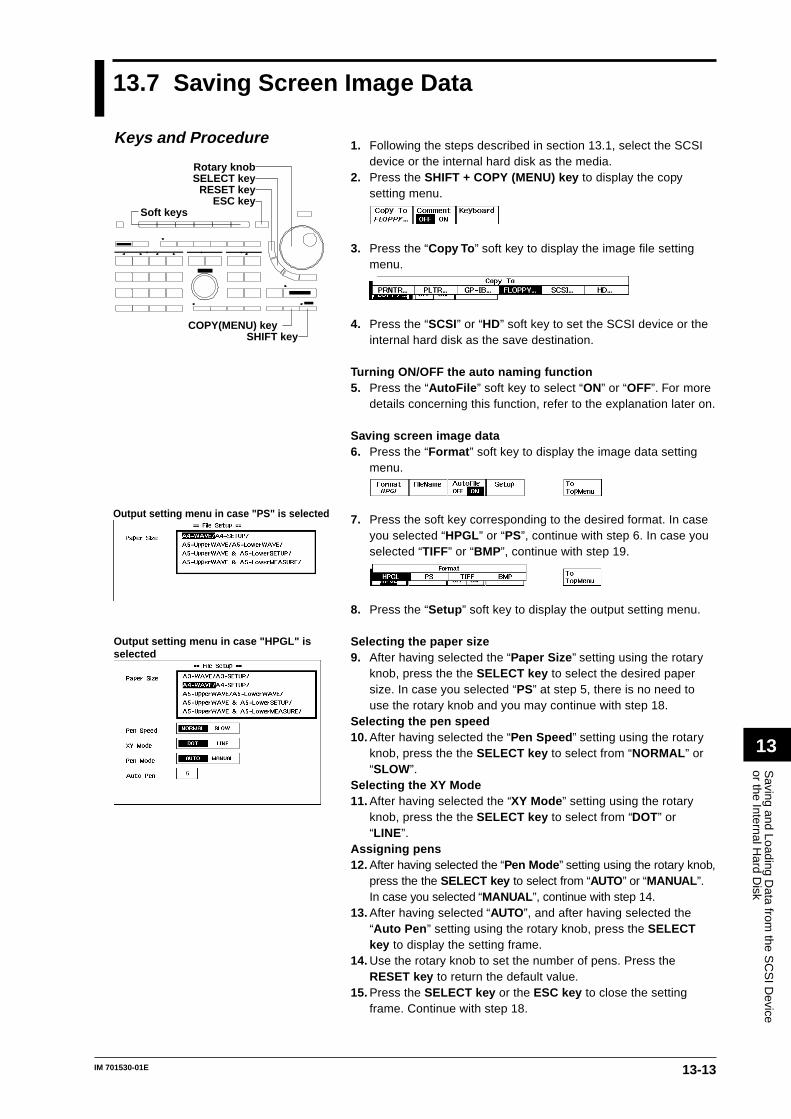
13-13
Saving and Loading D
ata from the S
CS
I Device
or the Internal Hard D
isk
13
IM 701530-01E
13.7 Saving Screen Image Data
1. Following the steps described in section 13.1, select the SCSIdevice or the internal hard disk as the media.
2. Press the SHIFT + COPY (MENU) key to display the copysetting menu.
3. Press the “Copy To ” soft key to display the image file settingmenu.
4. Press the “SCSI” or “HD” soft key to set the SCSI device or theinternal hard disk as the save destination.
Turning ON/OFF the auto naming function5. Press the “AutoFile ” soft key to select “ON” or “OFF”. For more
details concerning this function, refer to the explanation later on.
Saving screen image data6. Press the “Format ” soft key to display the image data setting
menu.
7. Press the soft key corresponding to the desired format. In caseyou selected “HPGL” or “PS”, continue with step 6. In case youselected “TIFF” or “BMP”, continue with step 19.
8. Press the “Setup ” soft key to display the output setting menu.
Selecting the paper size9. After having selected the “Paper Size ” setting using the rotary
knob, press the the SELECT key to select the desired papersize. In case you selected “PS” at step 5, there is no need touse the rotary knob and you may continue with step 18.
Selecting the pen speed10. After having selected the “Pen Speed ” setting using the rotary
knob, press the the SELECT key to select from “NORMAL ” or“SLOW”.
Selecting the XY Mode11. After having selected the “XY Mode ” setting using the rotary
knob, press the the SELECT key to select from “DOT” or“LINE”.
Assigning pens12. After having selected the “Pen Mode ” setting using the rotary knob,
press the the SELECT key to select from “AUTO” or “MANUAL ”.In case you selected “MANUAL ”, continue with step 14.
13. After having selected “AUTO”, and after having selected the“Auto Pen ” setting using the rotary knob, press the SELECTkey to display the setting frame.
14. Use the rotary knob to set the number of pens. Press theRESET key to return the default value.
15. Press the SELECT key or the ESC key to close the settingframe. Continue with step 18.
COPY(MENU) key
Rotary knob
ESC key
SHIFT key
Soft keys
SELECT keyRESET key
Keys and Procedure
Output setting menu in case "PS" is selected
Output setting menu in case "HPGL" is selected
13-14 IM 701530-01E
13.7 Saving Screen Image Data
16. After having selected “MANUAL ”, use the rotary knob and theSELECT key to select the “Grid Pen ” setting, the “TRACE1Pen - TRACE4 Pen ” setting and the “LOAD1 Pen - LOAD4Pen” setting.
17. Use the rotary knob to set the pen numbers. Press the RESETkey to return the default value.
18. Press the SELECT key or the ESC key to close the settingframe.
19. Repeat steps 16 to 18 to set other items of the “MANUAL ”setting.
20. Press the ESC key to close the setting menu.
Selecting the image color (with TIFF or BMP only)20. Press the “Color ” soft key to display the image color selection
menu.
21. Press the soft key corresponding to the desired image color.For details regarding the explanation of the image color.
Data compression (with TIFF or BMP only)22. Press the “Compression ” soft key to set compression “ON” or
“OFF”.
Entering the filename22. Press the “FileName ” soft key to display the keyboard.23. Use the keyboard to enter the filename. For details regarding
the usage of the keyboard, refer to page 4-8.
Outputting24. Press the COPY key .
ExplanationAuto naming function: AutoFileIf “AutoFile” has been set to “ON”, a number (3 digits, starting from “001”) will beassigned to the data automatically when the data is saved. It is possible to insert acommon file name (up to five characters) before the assigned number by specifyingthe file name using “FileName”.
Selecting the data output format: FormatThe data output format can be selected from the following formats.HP-GL Saves image data in HP-GL format.PS Saves image data in PostScript format.TIFF Saves image data in TIFF format.BMP Saves image data in BMP format.
About saved image dataWhen saving image data, extensions are automatically added. The “DL_MISC”directory is created automatically, and the data is saved into this directory. Theextensions are as follows.HPGL “.HGL” TIFF “.TIF”PS “.PS” BMP “.BMP”
13-15
Saving and Loading D
ata from the S
CS
I Device
or the Internal Hard D
isk
13
IM 701530-01E
13.7 Saving Screen Image Data
Selecting the paper sizeThese “Setup” settings are necessary for printing out image data from a PC or suchto a plotter. The contents of printing, paper size, printing size and printing locationdepend on the format of the data and can be selected from the following types. Alsorefer to page 10-4.For HPGL format:
Setting Output item Output size Output location
A3-WAVE Screen hardcopy A3 Middle
A3-SETUP Set-up parameters A3 Middle
A4-WAVE Screen hardcopy A4 Middle
A4-SETUP Set-up parameters A4 Middle
A5-Upper WAVE Screen hardcopy A5 Upper half
A5-Lower WAVE Screen hardcopy A5 Lower half
A5-UpperWAVE & Screen hardcopy A5 Upper half
A5-LowerSETUP Set-up parameters A5 Lower half
A5-UpperWAVE & Screen hardcopy A5 Upper half
A5-LowerMEASURE waveform measurement data A5 Lower half
For PS format:
Setting Output item Output size Output location
A4-WAVE Screen hardcopy A4 Middle
A4-SETUP Set-up parameters A4 Middle
A5-Upper WAVE Screen hardcopy A5 Upper half
A5-Lower WAVE Screen hardcopy A5 Lower half
A5-UpperWAVE & Screen hardcopy A5 Upper half
A5-LowerSETUP Set-up parameters A5 Lower half
A5-UpperWAVE & Screen hardcopy A5 Upper half
A5-LowerMEASURE waveform measurement data A5 Lower half
For TIFF/BMP format:No selections are possible; the output size is approx. 12 x 8 cm.
Contents to be savedIn the HP-GL and PS format, the following types of screen image data are notsaved.• Snapshot waveforms• Soft key menu and rotary knob menu• Messages (except “Stopped” and “RUNNING)In the TIFF and BMP format, data will be saved exactly as in case of the short copy.Refer to page 10-4 for more details.
Data size when savingIn case of saving a V-T Waveform, with two waveforms and grid displayed:HPGL : approx. 25Kbyte TIFF : approx. 300KbytePS : approx. 70Kbyte BMP : approx. 300Kbyte
Checking the free space on a mediumRefer to page 13-5 for a description of this procedure.
Image color type (with TIFF or BMP only)OFF : Same image as the “SHORT (short copy)” printing type described on page 10-4.GRAY: 4-bit gray scale image.HALF : Image using the same colors as the screen (except grid, scale, etc. are in
black and no background).FULL : Image using the same colors as the screen.
Data compression (with TIFF or BMP only)Data of TIFF and BMP formats can be output by compression, using respectivelyLZW and RLE.
13-16 IM 701530-01E
Entering a file nameThe following points must be kept in mind when entering a file name.• A file name must always be specified;• Up to eight characters can be entered;• All the characters on the keyboard can be used. However, the following file
names cannot be used due to MS-DOS restrictions;AUX, CON, PRN, NUL, CLOCK
• The same name cannot be assigned to different data files of the same data type.(Overwrite inhibit).
Points to not when using data saved in Post Script formatThere is no problem printing out data saved in PostScript format on a PostScriptprinter. However, if the PostScript data is used in a file created by DTP applicationsoftware, the waveform image will probably not appear on the computer’s screen.Instead a gray box indicating the size of the image will probably appear.
CAUTION Never turn OFF the SCSI device or remove the disk (media) such as a MO or aPD while the access indicator of the SCSI device is lit. Otherwise, damage tothe SCSI device or the disk may result.
13.7 Saving Screen Image Data
13-17
Saving and Loading D
ata from the S
CS
I Device
or the Internal Hard D
isk
13
IM 701530-01E
Rotary knob
Soft keys
STORE/RECALL(FILE) keySHIFT key
Keys and Procedure
13.8 Deleting and Protecting Saved Data
1. Following the steps described in section 13.1, select the SCSIdevice or the internal hard disk as the media.
2. Press the “Utility ” soft key to display the utility selection menu.
3. Press the “List ” soft key to display the list selection menu.
4. Press the soft key corresponding to the desired list.
5. Use the rotary knob to select the file to protect/save.
Deleting6. Press the “Delete ” soft key.
Protecting6. Press the “Protect ” soft key. A “ ” symbol will be added before
the file name of the protected file.
Canceling protection7. After step 4 has been performed, use the rotary knob to select
the file at the beginning of which a “ ” symbol is added.
8. Press the “Protect” soft key and the protection will be canceled.The “ ” symbol before the file name will be deleted.
ExplanationDeleting dataWaveform data and setting parameters saved on a medium can be deleted one fileat a time.
Protecting dataA protection function is used to protect saved data from being deleted by mistake. Ifan attempt is made to delete protected data, an error message will be displayedand the data will not be deleted.A “ ” symbol is displayed before the names of protected files to distinguish themfrom un-protected files.
13-18 IM 701530-01E
13.8 Deleting and Protecting Saved Data
Selecting the data list: Change Data ListFile lists are displayed by data type and data format and are grouped as follows.P-P Displayed waveform data (P-P compressed).ACQ Binary data being saved in the acquisition memory.ACQ(ASC) ASCII data of the data residing in the acquisition memory.I2C Data consisting of the I2C-bus analysis results.HPGL Screen image data saved using the HP-GL command.PS Screen image data saved in PS format.TIFF Screen image data saved in TIFF format.BMP Screen image data saved in BMP format.SETUP Setting parameters.
Points to note when protecting or deleting data• Protection setting cannot be performed if the medium is write-protected. An error
message will appear if an attempt is made to protect or delete files.• It is not possible to delete more than one file at once.• This protection setting is effective against deletion of data, but not against
initialization (formatting). Take care not to accidentally delete files by reformattinga medium file.
CAUTION Never turn OFF the SCSI device or remove the disk (media) such as a MO or aPD while the access indicator of the SCSI device is lit. Otherwise, damage tothe SCSI device or the disk may result.
13-19
Saving and Loading D
ata from the S
CS
I Device
or the Internal Hard D
isk
13
IM 701530-01E
13.9 Changing the SCSI ID Number (on Models withthe Internal Hard Disk)
1. Press the MISC key to display the MISC top menu.2. Press the “To NextMenu ” soft key.
3. Press the “SCSI” soft key to display the ID number settingmenu.
4. Turn the rotary knob to change the ID number.
ExplanationThe SCSI ID number is used to distinguish between the various devices connectedto the SCSI chain.Make sure not to use duplicate ID numbers on any of the connected devices.The default values are as follows:DL1540CL /C8 : 6SCSI device (External SCSI ID) : 5Built-in hard disk : 4* The ID numbers of the DL1540CL and built-in hard disk cannot be changed.
Range of SCSI ID numbers0, 1, 2, 3, and 5.
TerminatorThe terminator is always turned ON. It cannot be changed.
Notes when setting the ID number• The SCSI ID numbers of external SCSI devices cannot be set to the same
numbers as the instrument or the internal hard disk.• Various data are saved or loaded from the SCSI device that has the same ID
number as the “External SCSI ID.” Set the ID number of the device to which youwish to save or load various data.
• If you change the External SCSI ID, also change the SCSI ID on the device. Forthe procedure used to change the SCSI ID on the external device, see theinstruction manual that is provided with the device.
Rotary knob
Soft keys
MISC key
Keys and Procedure
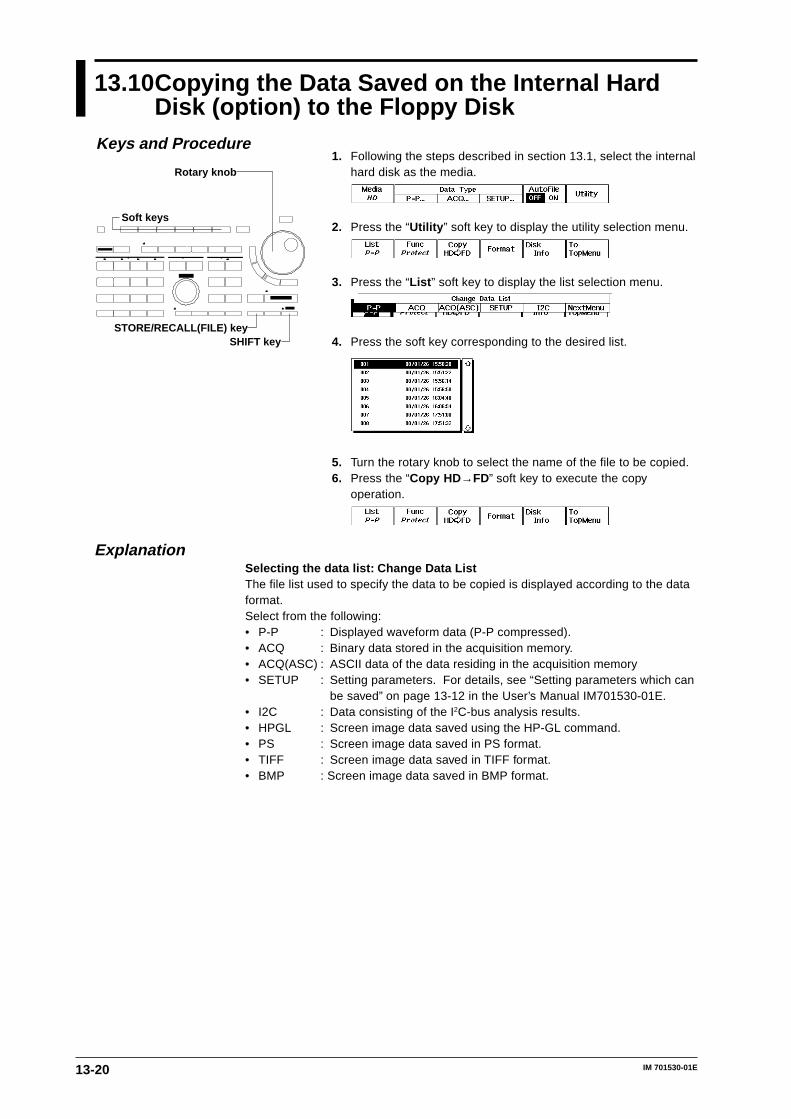
13-20 IM 701530-01E
13.10Copying the Data Saved on the Internal HardDisk (option) to the Floppy Disk
1. Following the steps described in section 13.1, select the internalhard disk as the media.
2. Press the “Utility ” soft key to display the utility selection menu.
3. Press the “List ” soft key to display the list selection menu.
4. Press the soft key corresponding to the desired list.
5. Turn the rotary knob to select the name of the file to be copied.6. Press the “Copy HD →FD” soft key to execute the copy
operation.
ExplanationSelecting the data list: Change Data ListThe file list used to specify the data to be copied is displayed according to the dataformat.Select from the following:• P-P : Displayed waveform data (P-P compressed).• ACQ : Binary data stored in the acquisition memory.• ACQ(ASC) : ASCII data of the data residing in the acquisition memory• SETUP : Setting parameters. For details, see “Setting parameters which can
be saved” on page 13-12 in the User’s Manual IM701530-01E.• I2C : Data consisting of the I2C-bus analysis results.• HPGL : Screen image data saved using the HP-GL command.• PS : Screen image data saved in PS format.• TIFF : Screen image data saved in TIFF format.• BMP : Screen image data saved in BMP format.
Rotary knob
Soft keys
SHIFT keySTORE/RECALL(FILE) key
Keys and Procedure
13-21
Saving and Loading D
ata from the S
CS
I Device
or the Internal Hard D
isk
13
IM 701530-01E
13.11Connecting a PC to the DL1540CL /C8
A PC can be connected to the SCSI interface connector (/C8 option), allowing thePC to access the internal hard disk (/C8 option).
Items necessary for connectionCable (SCSI cable: half pitch 50 pins, pin type)Use a commercially sold cable that is 3 m or less in length, that has a ferrite core oneach end of the cable, and that has a characteristic impedance between 90 and 132Ω.
CAUTION Make sure to follow the connection procedures below (“Connecting theDL1540CL and the PC”). Otherwise, media of other SCSI devices connectedto the PC can be damaged.
Connecting the DL1540CL and the PC1. Turn OFF the DL1540CL and the PC.2. Connect the DL1540CL and the PC with the SCSI cable.3. Turn ON the DL1540CL first.4. Turn ON the PC.
Precautions to be taken while the devices are connected• Newly created file during connection
Sometimes the PC will not recognize a new file that is created on the DL1540CLwhile the DL1540CL and the PC are connected.In such case, reconnect the devices according to the procedures given in“Connecting the DL1540CL and the PC.”The files will be recognized by taking the following steps, if the PC is runningWindows 95/98.1. On Windows 95/98, open the “Settings” tab in the properties dialog box for
the connected drive, and check the Removable* box.2. Reboot the PC.3. After creating a new file on the DL1540CL, select “Refresh” in the file list
window (Explorer, for example).* Select “My Computer → Control Panel → System → Device Manager →
Disk Drive” and select the relevant drive from the drive list. The“Removable” check box is located in the “Properties” dialog box under the“Settings” tab. You can check the drive number under “Current Drive.”
• Drive letterIf the PC connected to the DL1540CL has two or more hard disks or if the harddisk is partitioned into multiple drives, the drive letters (D:, E:, etc.) may changewhen the DL1540CL is connected. For details, see the instruction manual thatcame with the PC or the drive.The drive letter for the DL1540CL cannot be changed.Examples• The PC uses one hard disk as a single drive
Before connection C:(HDD)After connection C:(HDD)
D: (DL1540CL /C8)• The PC uses one hard disk as two drives (partitions)
Before connection C:(HDD)D:(HDD)
After connection C:(HDD)D: (DL1540CL /C8)E:(HDD)
In the actual case, this will vary depending on how the hard disk is partitionedand the type of interface (IDE, SCSI, etc) and drive.
Note• The DL1540CL can only be connected at the end of the SCSI chain. The internal hard disk
has a built-in terminator.• Do not format the internal hard disk using the PC.
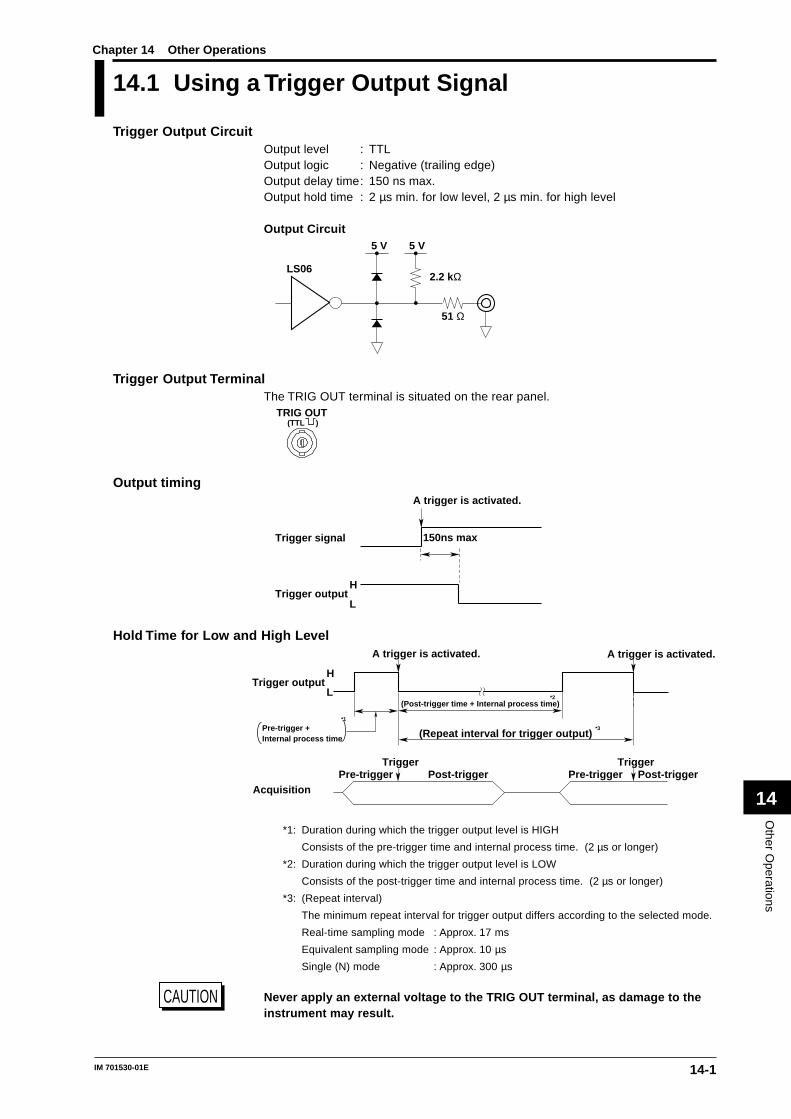
14-1
Other O
perations
14
IM 701530-01E
14.1 Using a Trigger Output Signal
Trigger Output CircuitOutput level : TTLOutput logic : Negative (trailing edge)Output delay time: 150 ns max.Output hold time : 2 µs min. for low level, 2 µs min. for high level
Output Circuit
51 Ω
LS062.2 kΩ
5 V 5 V
Trigger Output TerminalThe TRIG OUT terminal is situated on the rear panel.
TRIG OUT (TTL )
Output timingA trigger is activated.
150ns max
H
LTrigger output
Trigger signal
Hold Time for Low and High Level
H
LTrigger output
(Post-trigger time + Internal process time)
A trigger is activated.A trigger is activated.
Pre-trigger
(Repeat interval for trigger output)
Trigger TriggerPost-triggerPost-trigger Pre-trigger
Acquisition
Pre-trigger + Internal process time
*2
*3
*1
*1: Duration during which the trigger output level is HIGH
Consists of the pre-trigger time and internal process time. (2 µs or longer)
*2: Duration during which the trigger output level is LOW
Consists of the post-trigger time and internal process time. (2 µs or longer)
*3: (Repeat interval)
The minimum repeat interval for trigger output differs according to the selected mode.
Real-time sampling mode : Approx. 17 ms
Equivalent sampling mode : Approx. 10 µs
Single (N) mode : Approx. 300 µs
CAUTION Never apply an external voltage to the TRIG OUT terminal, as damage to theinstrument may result.
Chapter 14 Other Operations
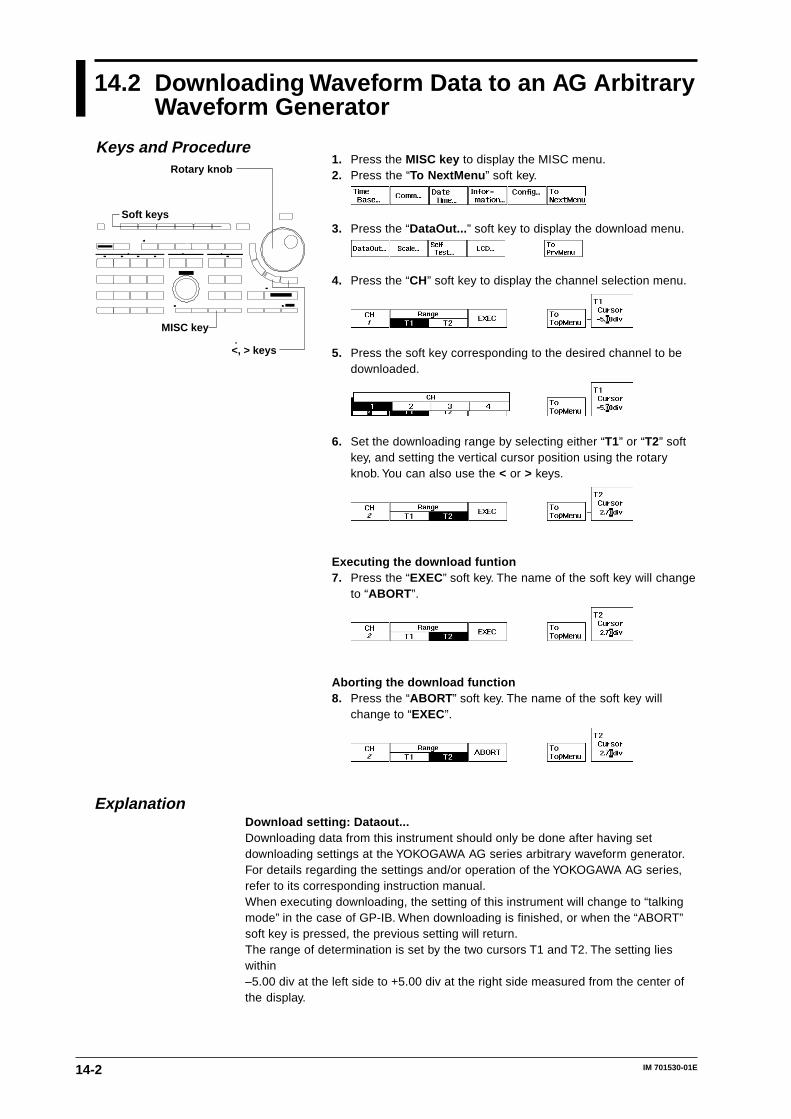
14-2 IM 701530-01E
14.2 Downloading Waveform Data to an AG ArbitraryWaveform Generator
1. Press the MISC key to display the MISC menu.2. Press the “To NextMenu ” soft key.
3. Press the “DataOut... ” soft key to display the download menu.
4. Press the “CH” soft key to display the channel selection menu.
5. Press the soft key corresponding to the desired channel to bedownloaded.
6. Set the downloading range by selecting either “T1” or “T2” softkey, and setting the vertical cursor position using the rotaryknob. You can also use the < or > keys.
Executing the download funtion7. Press the “EXEC” soft key. The name of the soft key will change
to “ABORT ”.
Aborting the download function8. Press the “ABORT ” soft key. The name of the soft key will
change to “EXEC”.
ExplanationDownload setting: Dataout...Downloading data from this instrument should only be done after having setdownloading settings at the YOKOGAWA AG series arbitrary waveform generator.For details regarding the settings and/or operation of the YOKOGAWA AG series,refer to its corresponding instruction manual.When executing downloading, the setting of this instrument will change to “talkingmode” in the case of GP-IB. When downloading is finished, or when the “ABORT”soft key is pressed, the previous setting will return.The range of determination is set by the two cursors T1 and T2. The setting lieswithin–5.00 div at the left side to +5.00 div at the right side measured from the center ofthe display.
Keys and Procedure
MISC key
Rotary knob
Soft keys
<, > keys
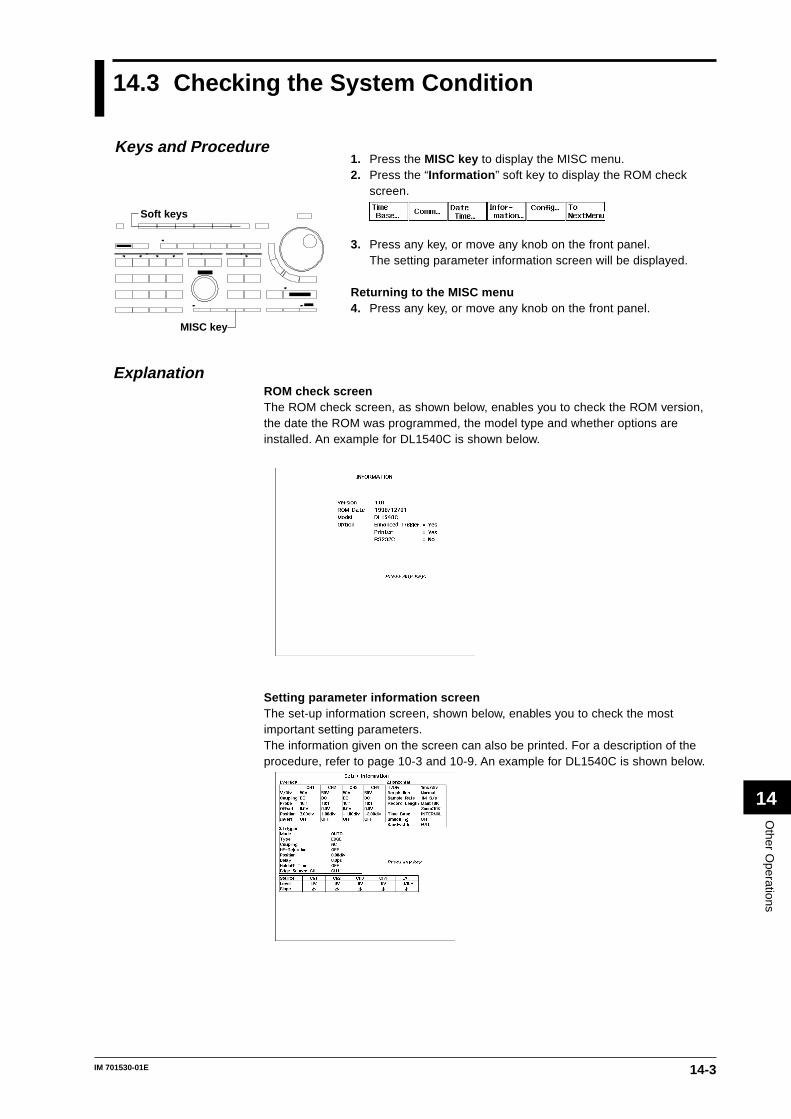
14-3
Other O
perations
14
IM 701530-01E
14.3 Checking the System Condition
1. Press the MISC key to display the MISC menu.2. Press the “Information ” soft key to display the ROM check
screen.
3. Press any key, or move any knob on the front panel.The setting parameter information screen will be displayed.
Returning to the MISC menu4. Press any key, or move any knob on the front panel.
ExplanationROM check screenThe ROM check screen, as shown below, enables you to check the ROM version,the date the ROM was programmed, the model type and whether options areinstalled. An example for DL1540C is shown below.
Setting parameter information screenThe set-up information screen, shown below, enables you to check the mostimportant setting parameters.The information given on the screen can also be printed. For a description of theprocedure, refer to page 10-3 and 10-9. An example for DL1540C is shown below.
Keys and Procedure
MISC key
Soft keys
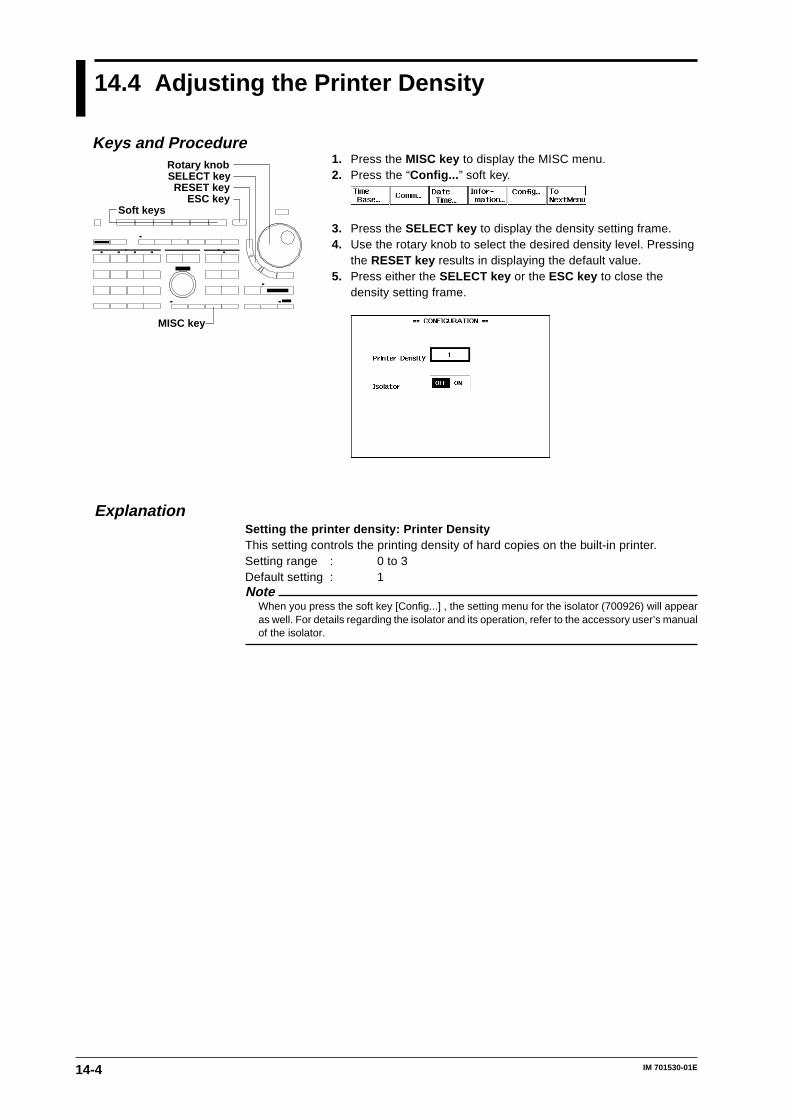
14-4 IM 701530-01E
14.4 Adjusting the Printer Density
1. Press the MISC key to display the MISC menu.2. Press the “Config... ” soft key.
3. Press the SELECT key to display the density setting frame.4. Use the rotary knob to select the desired density level. Pressing
the RESET key results in displaying the default value.5. Press either the SELECT key or the ESC key to close the
density setting frame.
ExplanationSetting the printer density: Printer DensityThis setting controls the printing density of hard copies on the built-in printer.Setting range : 0 to 3Default setting : 1Note
When you press the soft key [Config...] , the setting menu for the isolator (700926) will appearas well. For details regarding the isolator and its operation, refer to the accessory user’s manualof the isolator.
Keys and Procedure
MISC key
Soft keys
Rotary knob
ESC key
SELECT keyRESET key
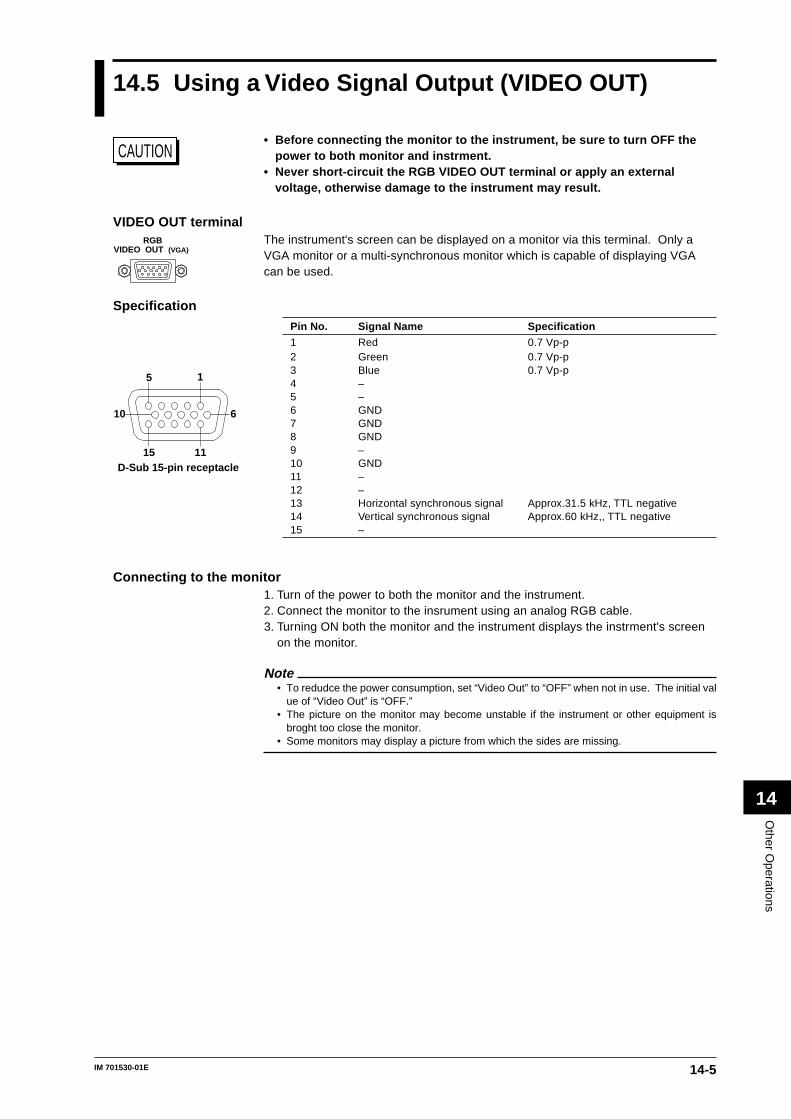
14-5
Other O
perations
14
IM 701530-01E
14.5 Using a Video Signal Output (VIDEO OUT)
CAUTION• Before connecting the monitor to the instrument, be sure to turn OFF the
power to both monitor and instrment.• Never short-circuit the RGB VIDEO OUT terminal or apply an external
voltage, otherwise damage to the instrument may result.
VIDEO OUT terminalThe instrument's screen can be displayed on a monitor via this terminal. Only aVGA monitor or a multi-synchronous monitor which is capable of displaying VGAcan be used.
Specification
Pin No. Signal Name Specification
1 Red 0.7 Vp-p2 Green 0.7 Vp-p3 Blue 0.7 Vp-p4 –5 –6 GND7 GND8 GND9 –10 GND11 –12 –13 Horizontal synchronous signal Approx.31.5 kHz, TTL negative14 Vertical synchronous signal Approx.60 kHz,, TTL negative15 –
Connecting to the monitor1. Turn of the power to both the monitor and the instrument.2. Connect the monitor to the insrument using an analog RGB cable.3. Turning ON both the monitor and the instrument displays the instrment's screen
on the monitor.
Note• To redudce the power consumption, set “Video Out” to “OFF” when not in use. The initial val
ue of “Video Out” is “OFF.”• The picture on the monitor may become unstable if the instrument or other equipment is
broght too close the monitor.• Some monitors may display a picture from which the sides are missing.
RGBVIDEO OUT (VGA)
6
11
15
15
10
D-Sub 15-pin receptacle
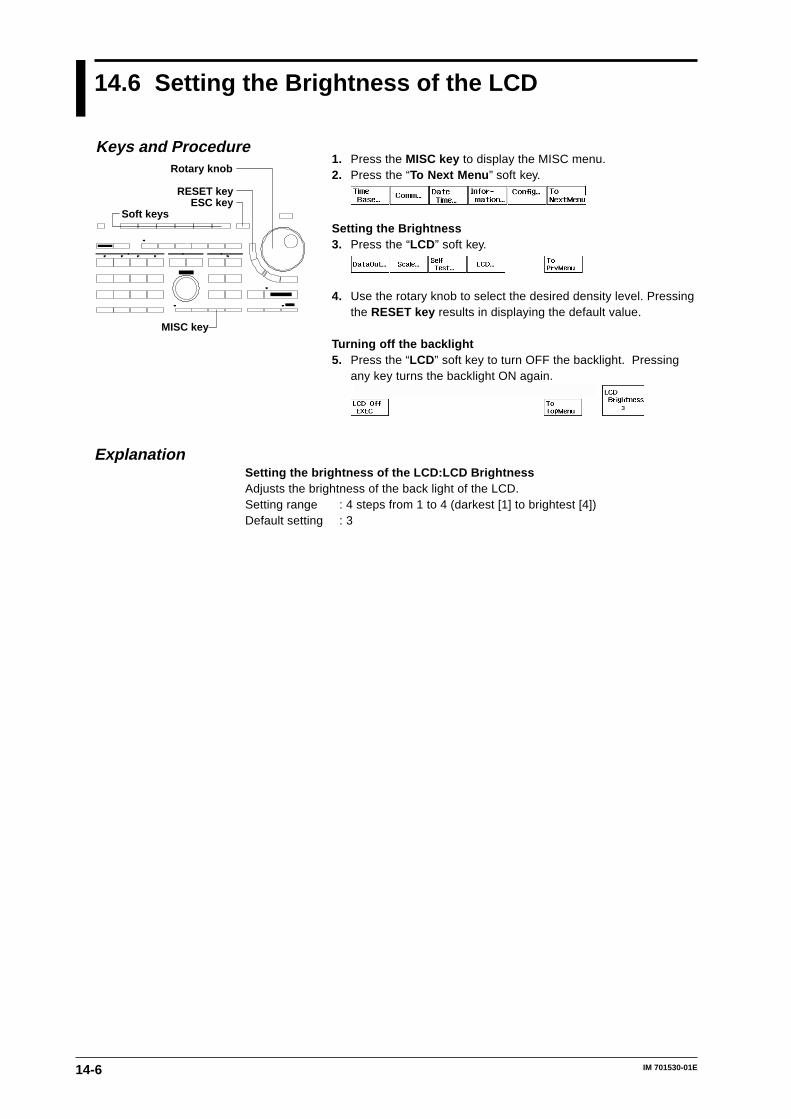
14-6 IM 701530-01E
14.6 Setting the Brightness of the LCD
1. Press the MISC key to display the MISC menu.2. Press the “To Next Menu ” soft key.
Setting the Brightness3. Press the “LCD” soft key.
4. Use the rotary knob to select the desired density level. Pressingthe RESET key results in displaying the default value.
Turning off the backlight5. Press the “LCD” soft key to turn OFF the backlight. Pressing
any key turns the backlight ON again.
ExplanationSetting the brightness of the LCD:LCD BrightnessAdjusts the brightness of the back light of the LCD.Setting range : 4 steps from 1 to 4 (darkest [1] to brightest [4])Default setting : 3
Keys and Procedure
MISC key
Soft keys
Rotary knob
ESC keyRESET key
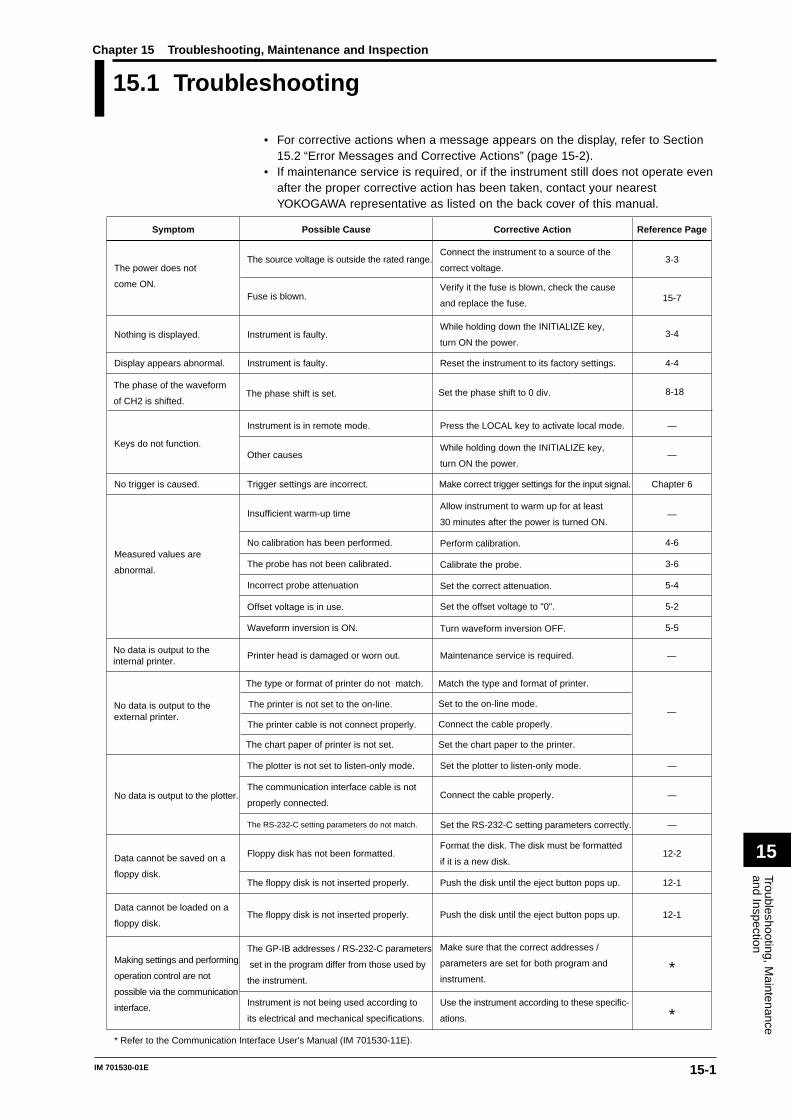
15-1
Troubleshooting, Maintenance
and Inspection
15
IM 701530-01E
15.1 Troubleshooting
• For corrective actions when a message appears on the display, refer to Section15.2 “Error Messages and Corrective Actions” (page 15-2).
• If maintenance service is required, or if the instrument still does not operate evenafter the proper corrective action has been taken, contact your nearestYOKOGAWA representative as listed on the back cover of this manual.
Use the instrument according to these specific-
ations.
Instrument is not being used according to
its electrical and mechanical specifications.
Make sure that the correct addresses /
parameters are set for both program and
instrument.
The floppy disk is not inserted properly. Push the disk until the eject button pops up.Data cannot be loaded on a
floppy disk.
The GP-IB addresses / RS-232-C parameters
set in the program differ from those used by
the instrument.
Making settings and performing
operation control are not
possible via the communication
interface.
* Refer to the Communication Interface User's Manual (IM 701530-11E).
12-1
*
*
While holding down the INITIALIZE key,
turn ON the power.
The power does not
come ON.
The source voltage is outside the rated range.Connect the instrument to a source of the
correct voltage.
Symptom Possible Cause Corrective Action Reference Page
3-3
Printer head is damaged or worn out.
Fuse is blown.Verify it the fuse is blown, check the cause
and replace the fuse.
Instrument is faulty.Nothing is displayed.
Reset the instrument to its factory settings.Display appears abnormal. Instrument is faulty.
Keys do not function.
Instrument is in remote mode. Press the LOCAL key to activate local mode.
Other causes
Make correct trigger settings for the input signal.Trigger settings are incorrect.No trigger is caused.
Insufficient warm-up timeAllow instrument to warm up for at least
30 minutes after the power is turned ON.
No calibration has been performed. Perform calibration.
The probe has not been calibrated. Calibrate the probe.Measured values are
abnormal.
Incorrect probe attenuation Set the correct attenuation.
Offset voltage is in use. Set the offset voltage to "0".
Waveform inversion is ON. Turn waveform inversion OFF.
The floppy disk is not inserted properly.
Floppy disk has not been formatted.
Set the plotter to listen-only mode.
Maintenance service is required.No data is output to the internal printer.
The plotter is not set to listen-only mode.
No data is output to the plotter.
Format the disk. The disk must be formatted
if it is a new disk.
Push the disk until the eject button pops up.
Data cannot be saved on a
floppy disk.
15-7
3-4
4-4
—
—
Chapter 6
—
4-6
3-6
5-4
5-2
5-5
—
—
12-1
12-2
While holding down the INITIALIZE key,
turn ON the power.
The communication interface cable is not
properly connected.Connect the cable properly. —
The RS-232-C setting parameters do not match. Set the RS-232-C setting parameters correctly. —
No data is output to the external printer.
The type or format of printer do not match.
The printer is not set to the on-line.
The printer cable is not connect properly.
The chart paper of printer is not set.
Match the type and format of printer.
Set to the on-line mode.
Connect the cable properly.
Set the chart paper to the printer.
—
The phase of the waveform
of CH2 is shifted.The phase shift is set. Set the phase shift to 0 div. 8-18
Chapter 15 Troubleshooting, Maintenance and Inspection
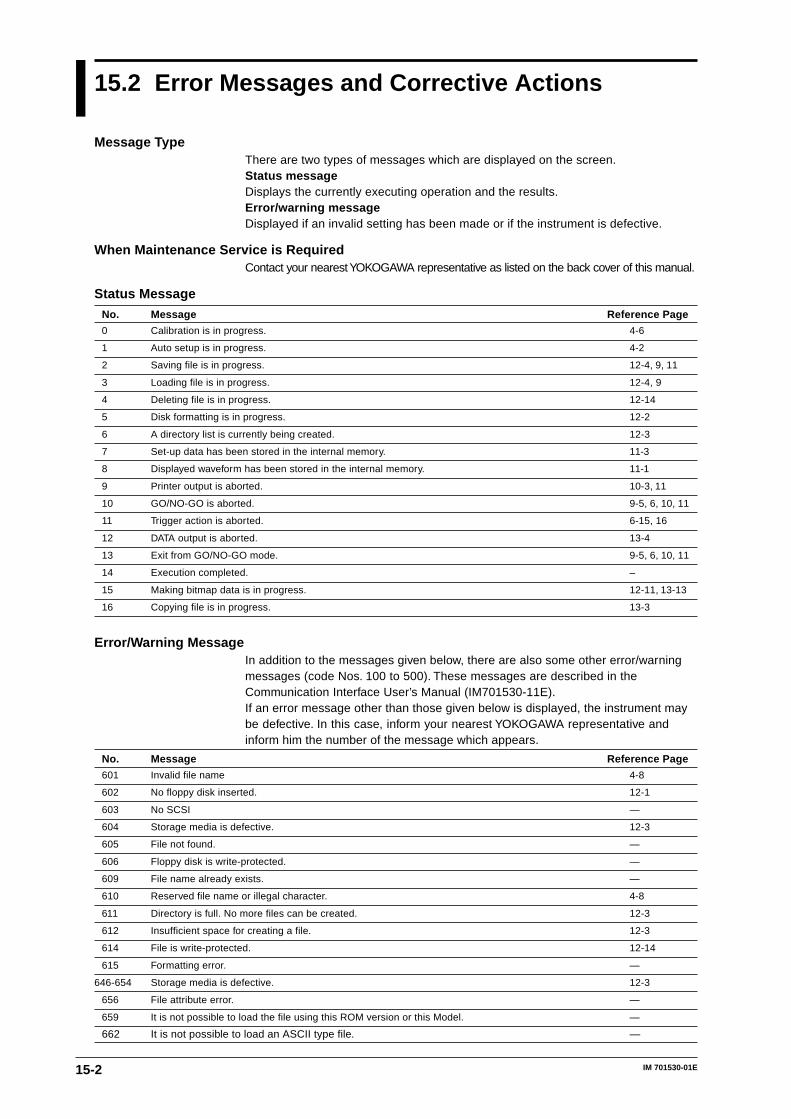
15-2 IM 701530-01E
15.2 Error Messages and Corrective Actions
Message TypeThere are two types of messages which are displayed on the screen.Status messageDisplays the currently executing operation and the results.Error/warning messageDisplayed if an invalid setting has been made or if the instrument is defective.
When Maintenance Service is RequiredContact your nearest YOKOGAWA representative as listed on the back cover of this manual.
Status Message
No. Message Reference Page
0 Calibration is in progress. 4-6
1 Auto setup is in progress. 4-2
2 Saving file is in progress. 12-4, 9, 11
3 Loading file is in progress. 12-4, 9
4 Deleting file is in progress. 12-14
5 Disk formatting is in progress. 12-2
6 A directory list is currently being created. 12-3
7 Set-up data has been stored in the internal memory. 11-3
8 Displayed waveform has been stored in the internal memory. 11-1
9 Printer output is aborted. 10-3, 11
10 GO/NO-GO is aborted. 9-5, 6, 10, 11
11 Trigger action is aborted. 6-15, 16
12 DATA output is aborted. 13-4
13 Exit from GO/NO-GO mode. 9-5, 6, 10, 11
14 Execution completed. –
15 Making bitmap data is in progress. 12-11, 13-13
16 Copying file is in progress. 13-3
Error/Warning MessageIn addition to the messages given below, there are also some other error/warningmessages (code Nos. 100 to 500). These messages are described in theCommunication Interface User’s Manual (IM701530-11E).If an error message other than those given below is displayed, the instrument maybe defective. In this case, inform your nearest YOKOGAWA representative andinform him the number of the message which appears.
No. Message Reference Page
601 Invalid file name 4-8
602 No floppy disk inserted. 12-1
603 No SCSI —
604 Storage media is defective. 12-3
605 File not found. —
606 Floppy disk is write-protected. —
609 File name already exists. —
610 Reserved file name or illegal character. 4-8
611 Directory is full. No more files can be created. 12-3
612 Insufficient space for creating a file. 12-3
614 File is write-protected. 12-14
615 Formatting error. —
646-654 Storage media is defective. 12-3
656 File attribute error. —
659 It is not possible to load the file using this ROM version or this Model. —
662 It is not possible to load an ASCII type file. —
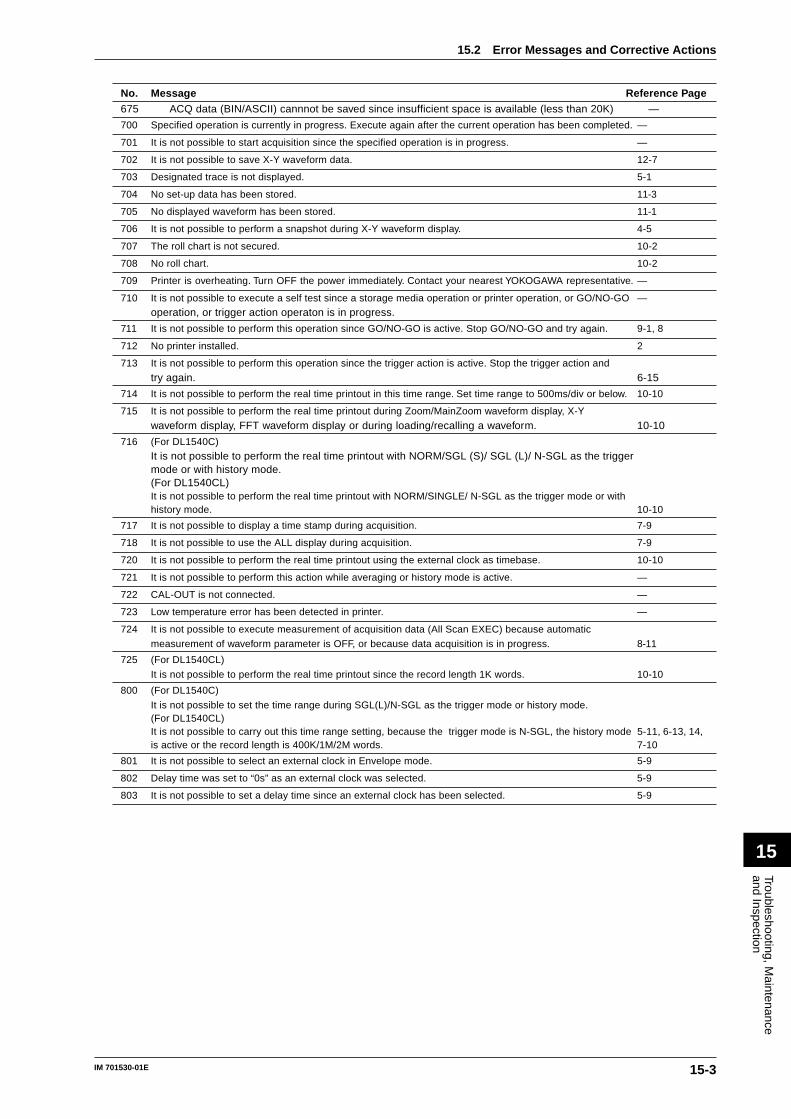
15-3
Troubleshooting, Maintenance
and Inspection
15
IM 701530-01E
No. Message Reference Page675 ACQ data (BIN/ASCII) cannnot be saved since insufficient space is available (less than 20K) —
700 Specified operation is currently in progress. Execute again after the current operation has been completed. —
701 It is not possible to start acquisition since the specified operation is in progress. —
702 It is not possible to save X-Y waveform data. 12-7
703 Designated trace is not displayed. 5-1
704 No set-up data has been stored. 11-3
705 No displayed waveform has been stored. 11-1
706 It is not possible to perform a snapshot during X-Y waveform display. 4-5
707 The roll chart is not secured. 10-2
708 No roll chart. 10-2
709 Printer is overheating. Turn OFF the power immediately. Contact your nearest YOKOGAWA representative. —
710 It is not possible to execute a self test since a storage media operation or printer operation, or GO/NO-GO —
operation, or trigger action operaton is in progress.
711 It is not possible to perform this operation since GO/NO-GO is active. Stop GO/NO-GO and try again. 9-1, 8
712 No printer installed. 2
713 It is not possible to perform this operation since the trigger action is active. Stop the trigger action and
try again. 6-15
714 It is not possible to perform the real time printout in this time range. Set time range to 500ms/div or below. 10-10
715 It is not possible to perform the real time printout during Zoom/MainZoom waveform display, X-Y
waveform display, FFT waveform display or during loading/recalling a waveform. 10-10
716 (For DL1540C)
It is not possible to perform the real time printout with NORM/SGL (S)/ SGL (L)/ N-SGL as the triggermode or with history mode.(For DL1540CL)It is not possible to perform the real time printout with NORM/SINGLE/ N-SGL as the trigger mode or withhistory mode. 10-10
717 It is not possible to display a time stamp during acquisition. 7-9
718 It is not possible to use the ALL display during acquisition. 7-9
720 It is not possible to perform the real time printout using the external clock as timebase. 10-10
721 It is not possible to perform this action while averaging or history mode is active. —
722 CAL-OUT is not connected. —
723 Low temperature error has been detected in printer. —
724 It is not possible to execute measurement of acquisition data (All Scan EXEC) because automatic
measurement of waveform parameter is OFF, or because data acquisition is in progress. 8-11
725 (For DL1540CL)
It is not possible to perform the real time printout since the record length 1K words. 10-10
800 (For DL1540C)
It is not possible to set the time range during SGL(L)/N-SGL as the trigger mode or history mode.(For DL1540CL)It is not possible to carry out this time range setting, because the trigger mode is N-SGL, the history mode 5-11, 6-13, 14,is active or the record length is 400K/1M/2M words. 7-10
801 It is not possible to select an external clock in Envelope mode. 5-9
802 Delay time was set to “0s” as an external clock was selected. 5-9
803 It is not possible to set a delay time since an external clock has been selected. 5-9
15.2 Error Messages and Corrective Actions
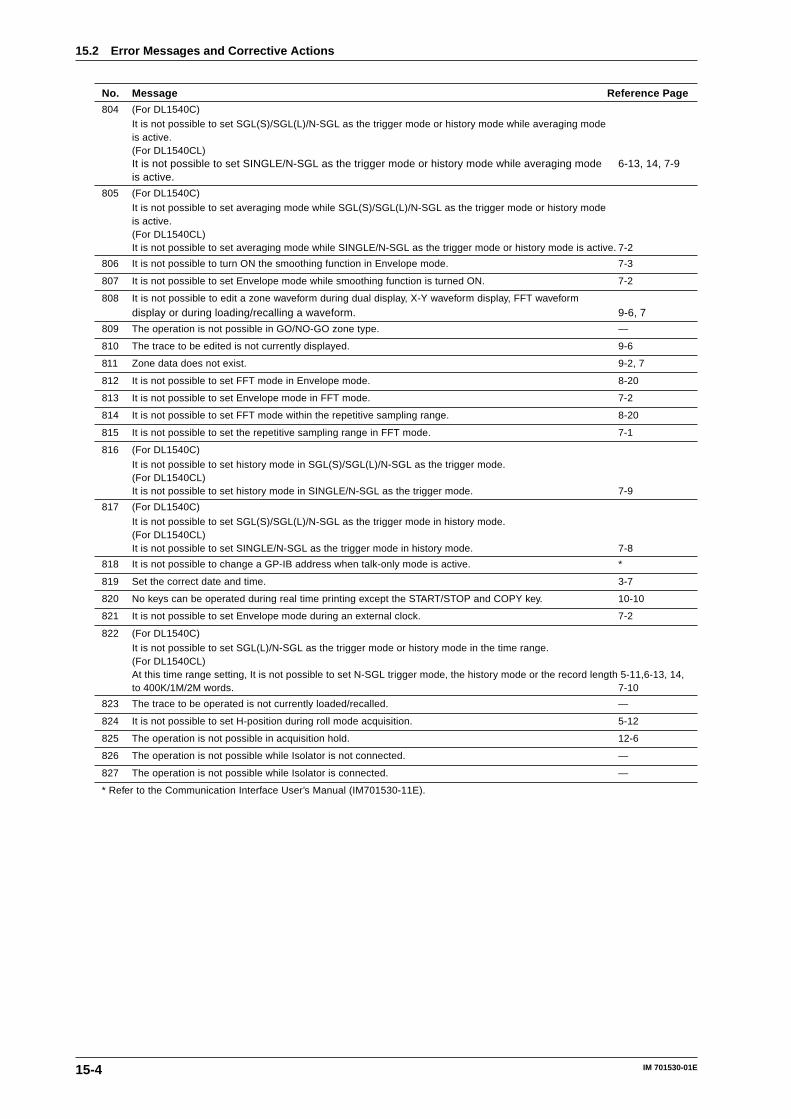
15-4 IM 701530-01E
No. Message Reference Page
804 (For DL1540C)
It is not possible to set SGL(S)/SGL(L)/N-SGL as the trigger mode or history mode while averaging modeis active.(For DL1540CL)It is not possible to set SINGLE/N-SGL as the trigger mode or history mode while averaging mode 6-13, 14, 7-9is active.
805 (For DL1540C)
It is not possible to set averaging mode while SGL(S)/SGL(L)/N-SGL as the trigger mode or history modeis active.(For DL1540CL)It is not possible to set averaging mode while SINGLE/N-SGL as the trigger mode or history mode is active. 7-2
806 It is not possible to turn ON the smoothing function in Envelope mode. 7-3
807 It is not possible to set Envelope mode while smoothing function is turned ON. 7-2
808 It is not possible to edit a zone waveform during dual display, X-Y waveform display, FFT waveform
display or during loading/recalling a waveform. 9-6, 7
809 The operation is not possible in GO/NO-GO zone type. —
810 The trace to be edited is not currently displayed. 9-6
811 Zone data does not exist. 9-2, 7
812 It is not possible to set FFT mode in Envelope mode. 8-20
813 It is not possible to set Envelope mode in FFT mode. 7-2
814 It is not possible to set FFT mode within the repetitive sampling range. 8-20
815 It is not possible to set the repetitive sampling range in FFT mode. 7-1
816 (For DL1540C)
It is not possible to set history mode in SGL(S)/SGL(L)/N-SGL as the trigger mode.(For DL1540CL)It is not possible to set history mode in SINGLE/N-SGL as the trigger mode. 7-9
817 (For DL1540C)
It is not possible to set SGL(S)/SGL(L)/N-SGL as the trigger mode in history mode.(For DL1540CL)It is not possible to set SINGLE/N-SGL as the trigger mode in history mode. 7-8
818 It is not possible to change a GP-IB address when talk-only mode is active. *
819 Set the correct date and time. 3-7
820 No keys can be operated during real time printing except the START/STOP and COPY key. 10-10
821 It is not possible to set Envelope mode during an external clock. 7-2
822 (For DL1540C)
It is not possible to set SGL(L)/N-SGL as the trigger mode or history mode in the time range.(For DL1540CL)At this time range setting, It is not possible to set N-SGL trigger mode, the history mode or the record length 5-11,6-13, 14,to 400K/1M/2M words. 7-10
823 The trace to be operated is not currently loaded/recalled. —
824 It is not possible to set H-position during roll mode acquisition. 5-12
825 The operation is not possible in acquisition hold. 12-6
826 The operation is not possible while Isolator is not connected. —
827 The operation is not possible while Isolator is connected. —
* Refer to the Communication Interface User’s Manual (IM701530-11E).
15.2 Error Messages and Corrective Actions
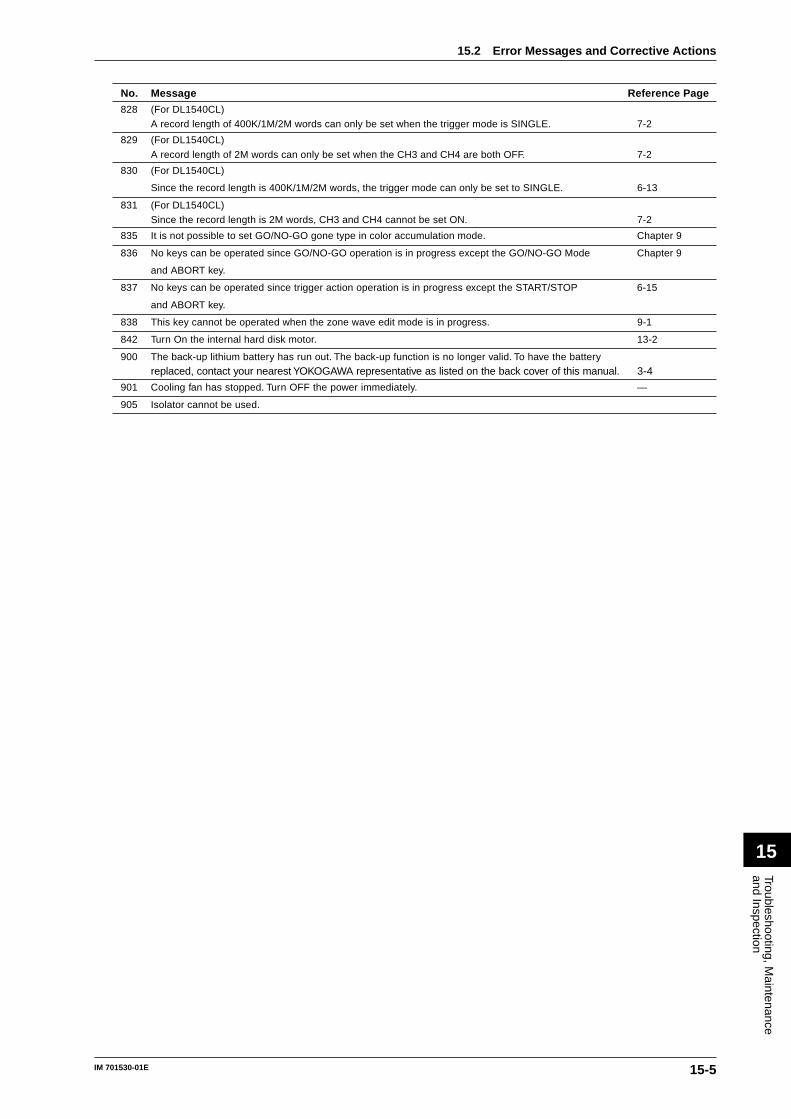
15-5
Troubleshooting, Maintenance
and Inspection
15
IM 701530-01E
No. Message Reference Page
828 (For DL1540CL)
A record length of 400K/1M/2M words can only be set when the trigger mode is SINGLE. 7-2
829 (For DL1540CL)
A record length of 2M words can only be set when the CH3 and CH4 are both OFF. 7-2
830 (For DL1540CL)
Since the record length is 400K/1M/2M words, the trigger mode can only be set to SINGLE. 6-13
831 (For DL1540CL)
Since the record length is 2M words, CH3 and CH4 cannot be set ON. 7-2
835 It is not possible to set GO/NO-GO gone type in color accumulation mode. Chapter 9
836 No keys can be operated since GO/NO-GO operation is in progress except the GO/NO-GO Mode Chapter 9
and ABORT key.
837 No keys can be operated since trigger action operation is in progress except the START/STOP 6-15
and ABORT key.
838 This key cannot be operated when the zone wave edit mode is in progress. 9-1
842 Turn On the internal hard disk motor. 13-2
900 The back-up lithium battery has run out. The back-up function is no longer valid. To have the battery
replaced, contact your nearest YOKOGAWA representative as listed on the back cover of this manual. 3-4
901 Cooling fan has stopped. Turn OFF the power immediately. —
905 Isolator cannot be used.
15.2 Error Messages and Corrective Actions
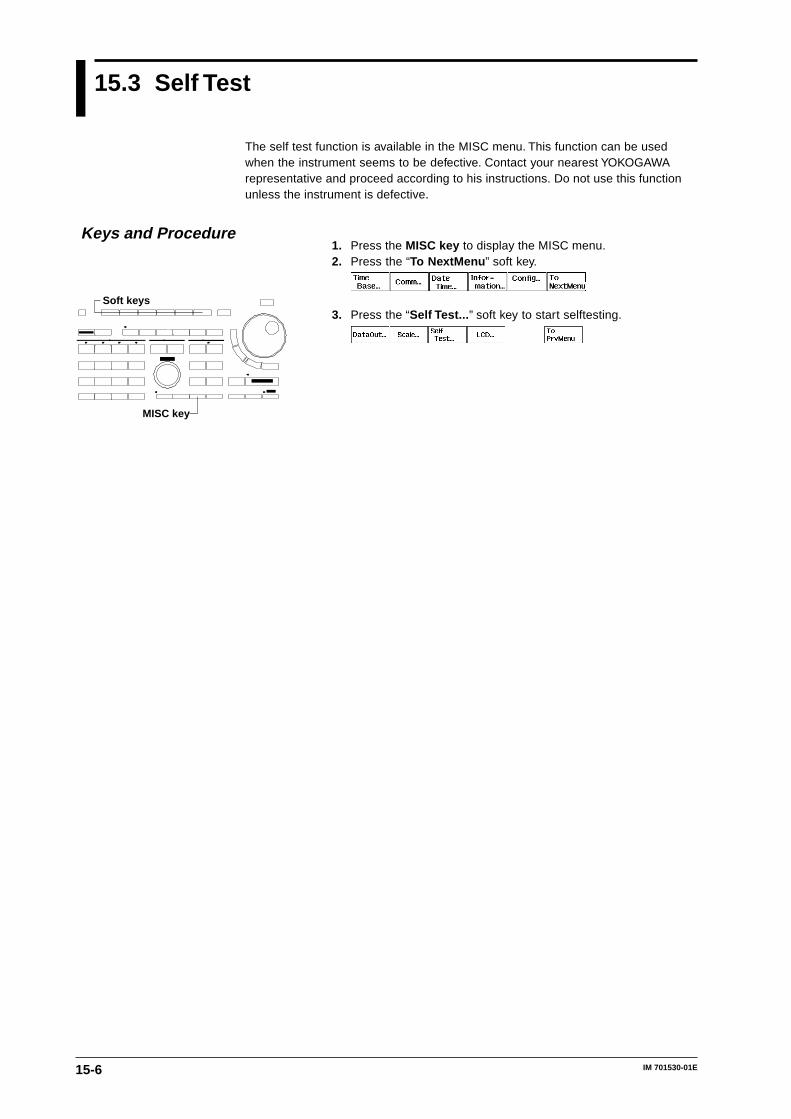
15-6 IM 701530-01E
15.3 Self Test
The self test function is available in the MISC menu. This function can be usedwhen the instrument seems to be defective. Contact your nearest YOKOGAWArepresentative and proceed according to his instructions. Do not use this functionunless the instrument is defective.
1. Press the MISC key to display the MISC menu.2. Press the “To NextMenu ” soft key.
3. Press the “Self Test... ” soft key to start selftesting.
Keys and Procedure
MISC key
Soft keys
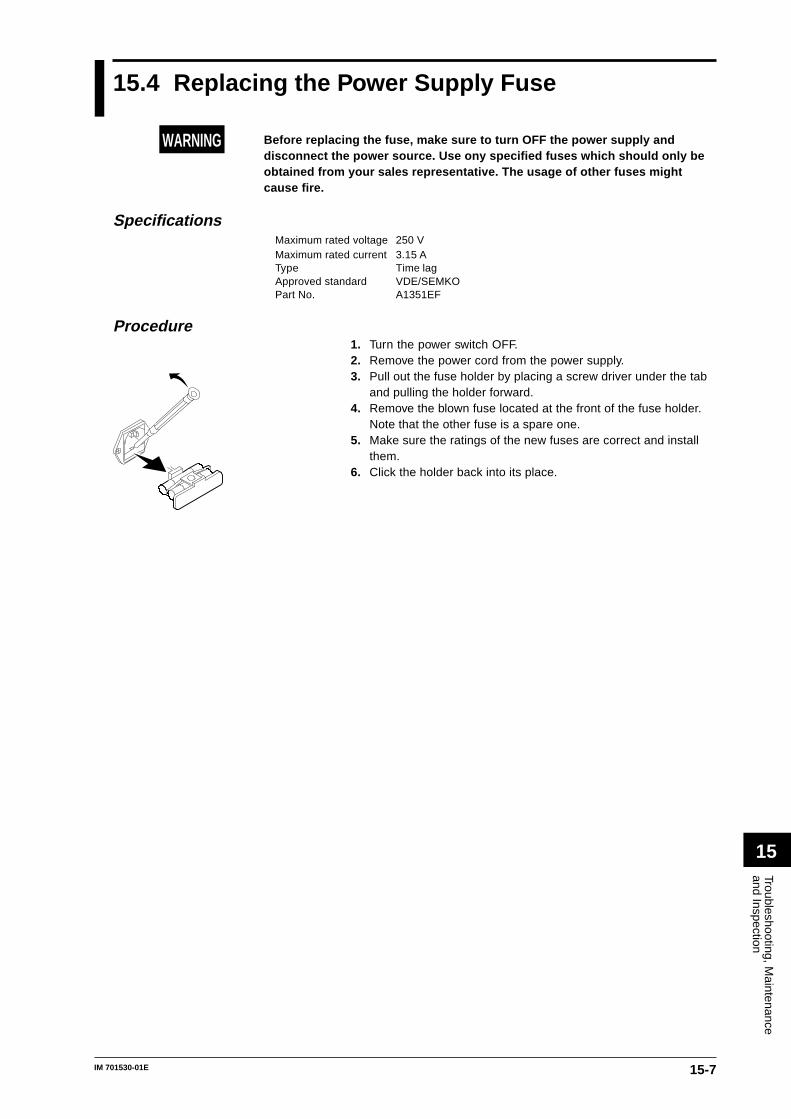
15-7
Troubleshooting, Maintenance
and Inspection
15
IM 701530-01E
15.4 Replacing the Power Supply Fuse
WARNING Before replacing the fuse, make sure to turn OFF the power supply anddisconnect the power source. Use ony specified fuses which should only beobtained from your sales representative. The usage of other fuses mightcause fire.
SpecificationsMaximum rated voltage 250 VMaximum rated current 3.15 AType Time lagApproved standard VDE/SEMKOPart No. A1351EF
Procedure1. Turn the power switch OFF.2. Remove the power cord from the power supply.3. Pull out the fuse holder by placing a screw driver under the tab
and pulling the holder forward.4. Remove the blown fuse located at the front of the fuse holder.
Note that the other fuse is a spare one.5. Make sure the ratings of the new fuses are correct and install
them.6. Click the holder back into its place.
15-8 IM 701530-01E
15.5 Recommended Parts for Replacement
The 3-year warranty applies only to the main unit of this instrument (starting fromthe day of delivery) and doesn’t cover any other items nor expendable items (itemswhich wear out). In order to use the instrument over a prolonged period of time, werecommend periodic replacement. Contact your nearest Yokogawa salesrepresentative for replacement parts. Addresses may be found on the back cover ofthis manual.
Parts name Replacement interval
Built-in printer after printing 120 rolls (parts No. B9850NX) continuously
LCD back light Approx. 2500 hours when used continuously
Parts Name Warranty Period
Internal hard disk One year after purchase (data are excluded)
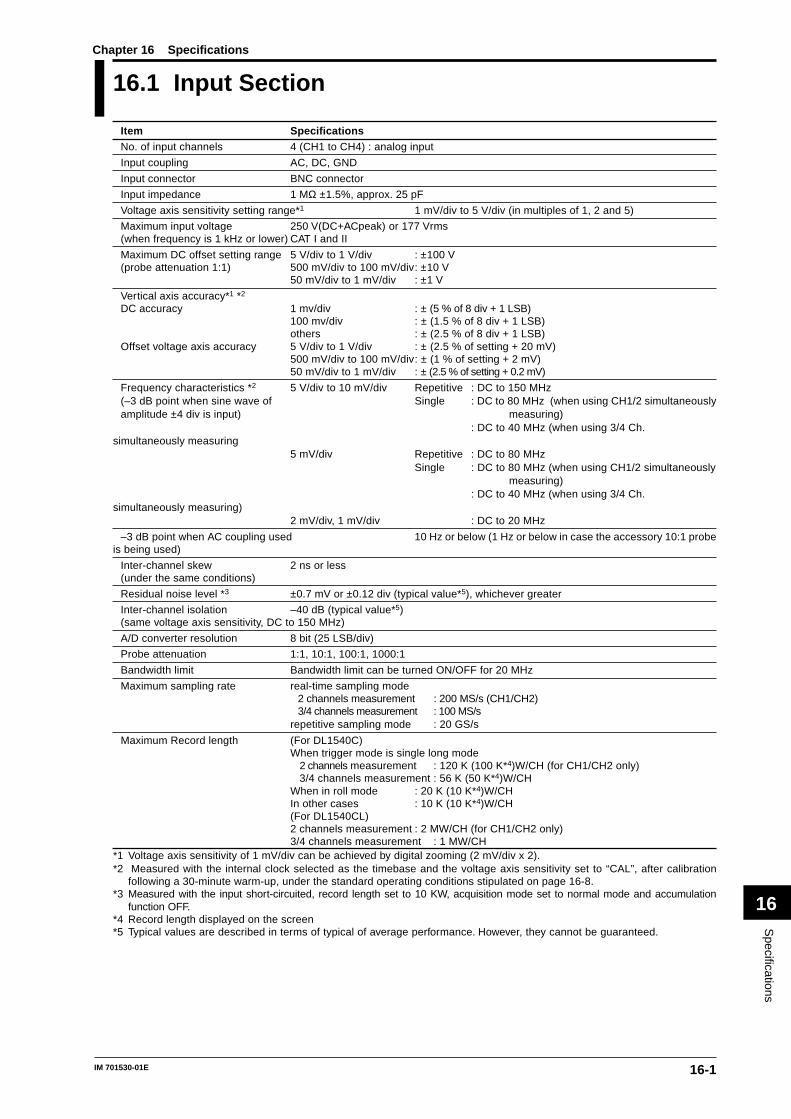
16-1
Specifications
16
IM 701530-01E
16.1 Input Section
Item SpecificationsNo. of input channels 4 (CH1 to CH4) : analog input
Input coupling AC, DC, GND
Input connector BNC connector
Input impedance 1 MΩ ±1.5%, approx. 25 pF
Voltage axis sensitivity setting range*1 1 mV/div to 5 V/div (in multiples of 1, 2 and 5)
Maximum input voltage 250 V(DC+ACpeak) or 177 Vrms(when frequency is 1 kHz or lower) CAT I and II
Maximum DC offset setting range 5 V/div to 1 V/div : ±100 V(probe attenuation 1:1) 500 mV/div to 100 mV/div: ±10 V
50 mV/div to 1 mV/div : ±1 V
Vertical axis accuracy*1 *2
DC accuracy 1 mv/div : ± (5 % of 8 div + 1 LSB)100 mv/div : ± (1.5 % of 8 div + 1 LSB)others : ± (2.5 % of 8 div + 1 LSB)
Offset voltage axis accuracy 5 V/div to 1 V/div : ± (2.5 % of setting + 20 mV)500 mV/div to 100 mV/div: ± (1 % of setting + 2 mV)50 mV/div to 1 mV/div : ± (2.5 % of setting + 0.2 mV)
Frequency characteristics *2 5 V/div to 10 mV/div Repetitive : DC to 150 MHz(–3 dB point when sine wave of Single : DC to 80 MHz (when using CH1/2 simultaneouslyamplitude ±4 div is input) measuring)
: DC to 40 MHz (when using 3/4 Ch.simultaneously measuring
5 mV/div Repetitive : DC to 80 MHzSingle : DC to 80 MHz (when using CH1/2 simultaneously
measuring): DC to 40 MHz (when using 3/4 Ch.
simultaneously measuring)2 mV/div, 1 mV/div : DC to 20 MHz
–3 dB point when AC coupling used 10 Hz or below (1 Hz or below in case the accessory 10:1 probeis being used)
Inter-channel skew 2 ns or less(under the same conditions)
Residual noise level *3 ±0.7 mV or ±0.12 div (typical value*5), whichever greater
Inter-channel isolation –40 dB (typical value*5)(same voltage axis sensitivity, DC to 150 MHz)
A/D converter resolution 8 bit (25 LSB/div)
Probe attenuation 1:1, 10:1, 100:1, 1000:1
Bandwidth limit Bandwidth limit can be turned ON/OFF for 20 MHz
Maximum sampling rate real-time sampling mode2 channels measurement : 200 MS/s (CH1/CH2)3/4 channels measurement : 100 MS/s
repetitive sampling mode : 20 GS/s
Maximum Record length (For DL1540C)When trigger mode is single long mode 2 channels measurement : 120 K (100 K*4)W/CH (for CH1/CH2 only) 3/4 channels measurement : 56 K (50 K*4)W/CHWhen in roll mode : 20 K (10 K*4)W/CHIn other cases : 10 K (10 K*4)W/CH(For DL1540CL)2 channels measurement : 2 MW/CH (for CH1/CH2 only)3/4 channels measurement : 1 MW/CH
*1 Voltage axis sensitivity of 1 mV/div can be achieved by digital zooming (2 mV/div x 2).*2 Measured with the internal clock selected as the timebase and the voltage axis sensitivity set to “CAL”, after calibration
following a 30-minute warm-up, under the standard operating conditions stipulated on page 16-8.*3 Measured with the input short-circuited, record length set to 10 KW, acquisition mode set to normal mode and accumulation
function OFF.*4 Record length displayed on the screen*5 Typical values are described in terms of typical of average performance. However, they cannot be guaranteed.
Chapter 16 Specifications
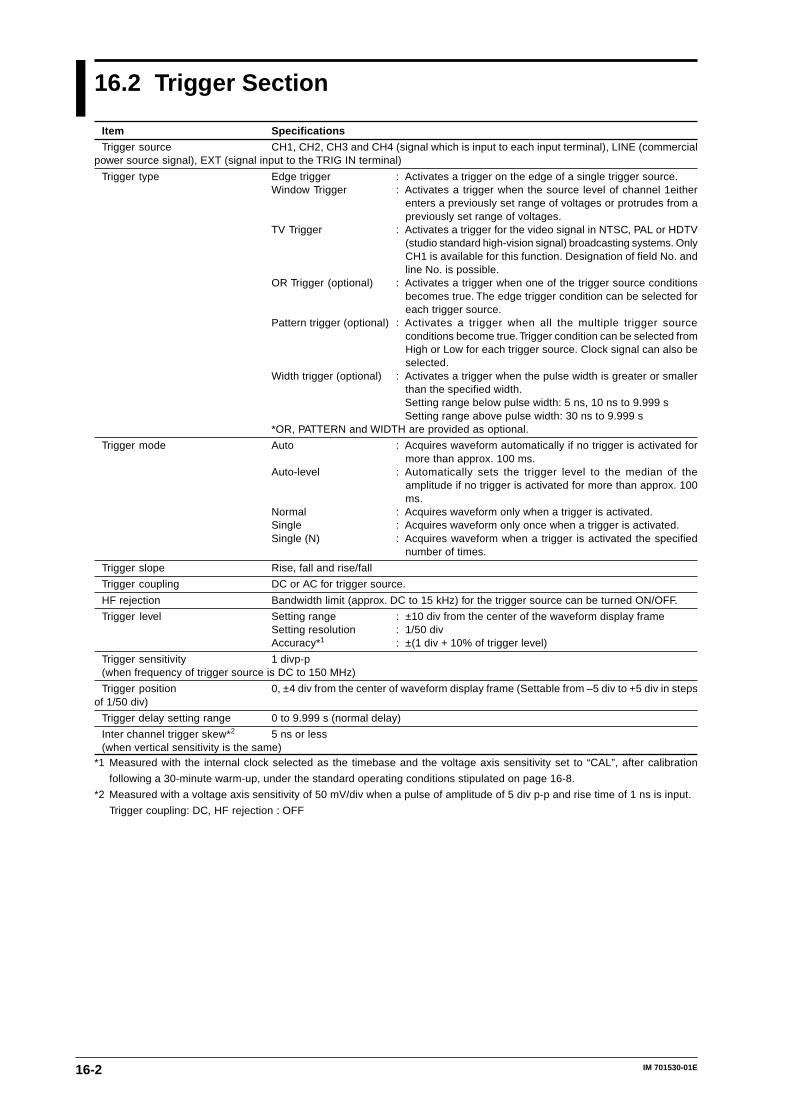
16-2 IM 701530-01E
16.2 Trigger Section
Item Specifications
Trigger source CH1, CH2, CH3 and CH4 (signal which is input to each input terminal), LINE (commercialpower source signal), EXT (signal input to the TRIG IN terminal)
Trigger type Edge trigger : Activates a trigger on the edge of a single trigger source.Window Trigger : Activates a trigger when the source level of channel 1either
enters a previously set range of voltages or protrudes from apreviously set range of voltages.
TV Trigger : Activates a trigger for the video signal in NTSC, PAL or HDTV(studio standard high-vision signal) broadcasting systems. OnlyCH1 is available for this function. Designation of field No. andline No. is possible.
OR Trigger (optional) : Activates a trigger when one of the trigger source conditionsbecomes true. The edge trigger condition can be selected foreach trigger source.
Pattern trigger (optional) : Activates a trigger when all the multiple trigger sourceconditions become true. Trigger condition can be selected fromHigh or Low for each trigger source. Clock signal can also beselected.
Width trigger (optional) : Activates a trigger when the pulse width is greater or smallerthan the specified width.Setting range below pulse width: 5 ns, 10 ns to 9.999 sSetting range above pulse width: 30 ns to 9.999 s
*OR, PATTERN and WIDTH are provided as optional.
Trigger mode Auto : Acquires waveform automatically if no trigger is activated formore than approx. 100 ms.
Auto-level : Automatically sets the trigger level to the median of theamplitude if no trigger is activated for more than approx. 100ms.
Normal : Acquires waveform only when a trigger is activated.Single : Acquires waveform only once when a trigger is activated.Single (N) : Acquires waveform when a trigger is activated the specified
number of times.
Trigger slope Rise, fall and rise/fall
Trigger coupling DC or AC for trigger source.
HF rejection Bandwidth limit (approx. DC to 15 kHz) for the trigger source can be turned ON/OFF.
Trigger level Setting range : ±10 div from the center of the waveform display frameSetting resolution : 1/50 divAccuracy*1 : ±(1 div + 10% of trigger level)
Trigger sensitivity 1 divp-p(when frequency of trigger source is DC to 150 MHz)
Trigger position 0, ±4 div from the center of waveform display frame (Settable from –5 div to +5 div in stepsof 1/50 div)
Trigger delay setting range 0 to 9.999 s (normal delay)
Inter channel trigger skew*2 5 ns or less(when vertical sensitivity is the same)
*1 Measured with the internal clock selected as the timebase and the voltage axis sensitivity set to “CAL”, after calibration
following a 30-minute warm-up, under the standard operating conditions stipulated on page 16-8.
*2 Measured with a voltage axis sensitivity of 50 mV/div when a pulse of amplitude of 5 div p-p and rise time of 1 ns is input.
Trigger coupling: DC, HF rejection : OFF
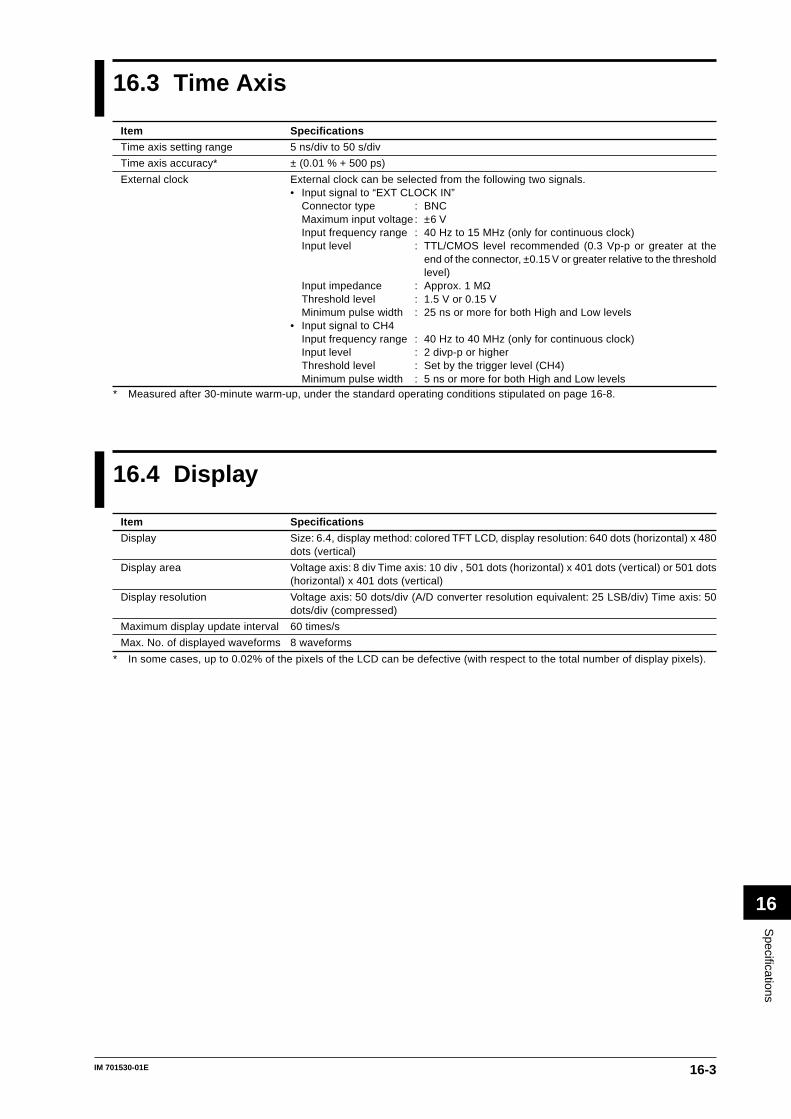
16-3
Specifications
16
IM 701530-01E
16.3 Time Axis
Item Specifications
Time axis setting range 5 ns/div to 50 s/div
Time axis accuracy* ± (0.01 % + 500 ps)
External clock External clock can be selected from the following two signals.• Input signal to “EXT CLOCK IN”
Connector type : BNCMaximum input voltage : ±6 VInput frequency range : 40 Hz to 15 MHz (only for continuous clock)Input level : TTL/CMOS level recommended (0.3 Vp-p or greater at the
end of the connector, ±0.15 V or greater relative to the thresholdlevel)
Input impedance : Approx. 1 MΩThreshold level : 1.5 V or 0.15 VMinimum pulse width : 25 ns or more for both High and Low levels
• Input signal to CH4Input frequency range : 40 Hz to 40 MHz (only for continuous clock)Input level : 2 divp-p or higherThreshold level : Set by the trigger level (CH4)Minimum pulse width : 5 ns or more for both High and Low levels
* Measured after 30-minute warm-up, under the standard operating conditions stipulated on page 16-8.
16.4 Display
Item Specifications
Display Size: 6.4, display method: colored TFT LCD, display resolution: 640 dots (horizontal) x 480dots (vertical)
Display area Voltage axis: 8 div Time axis: 10 div , 501 dots (horizontal) x 401 dots (vertical) or 501 dots(horizontal) x 401 dots (vertical)
Display resolution Voltage axis: 50 dots/div (A/D converter resolution equivalent: 25 LSB/div) Time axis: 50dots/div (compressed)
Maximum display update interval 60 times/s
Max. No. of displayed waveforms 8 waveforms
* In some cases, up to 0.02% of the pixels of the LCD can be defective (with respect to the total number of display pixels).
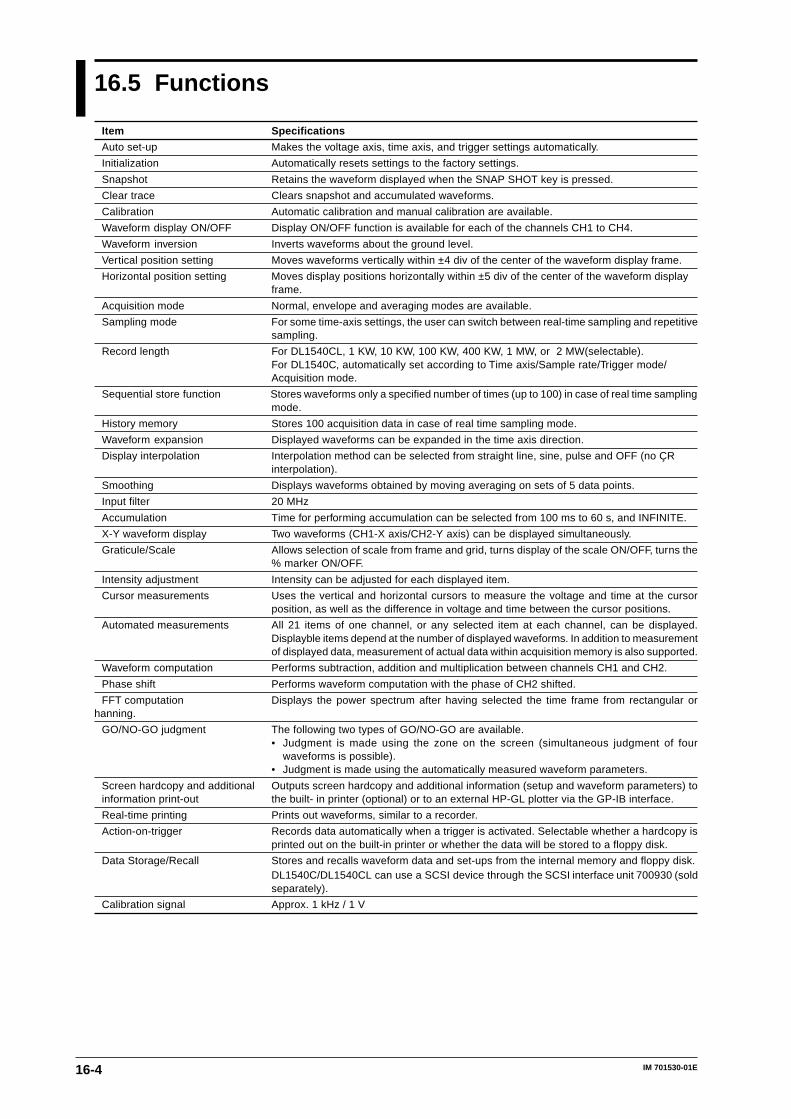
16-4 IM 701530-01E
16.5 Functions
Item Specifications
Auto set-up Makes the voltage axis, time axis, and trigger settings automatically.
Initialization Automatically resets settings to the factory settings.
Snapshot Retains the waveform displayed when the SNAP SHOT key is pressed.
Clear trace Clears snapshot and accumulated waveforms.
Calibration Automatic calibration and manual calibration are available.
Waveform display ON/OFF Display ON/OFF function is available for each of the channels CH1 to CH4.
Waveform inversion Inverts waveforms about the ground level.
Vertical position setting Moves waveforms vertically within ±4 div of the center of the waveform display frame.
Horizontal position setting Moves display positions horizontally within ±5 div of the center of the waveform displayframe.
Acquisition mode Normal, envelope and averaging modes are available.
Sampling mode For some time-axis settings, the user can switch between real-time sampling and repetitivesampling.
Record length For DL1540CL, 1 KW, 10 KW, 100 KW, 400 KW, 1 MW, or 2 MW(selectable).For DL1540C, automatically set according to Time axis/Sample rate/Trigger mode/Acquisition mode.
Sequential store function Stores waveforms only a specified number of times (up to 100) in case of real time samplingmode.
History memory Stores 100 acquisition data in case of real time sampling mode.
Waveform expansion Displayed waveforms can be expanded in the time axis direction.
Display interpolation Interpolation method can be selected from straight line, sine, pulse and OFF (no ÇRinterpolation).
Smoothing Displays waveforms obtained by moving averaging on sets of 5 data points.
Input filter 20 MHz
Accumulation Time for performing accumulation can be selected from 100 ms to 60 s, and INFINITE.
X-Y waveform display Two waveforms (CH1-X axis/CH2-Y axis) can be displayed simultaneously.
Graticule/Scale Allows selection of scale from frame and grid, turns display of the scale ON/OFF, turns the% marker ON/OFF.
Intensity adjustment Intensity can be adjusted for each displayed item.
Cursor measurements Uses the vertical and horizontal cursors to measure the voltage and time at the cursorposition, as well as the difference in voltage and time between the cursor positions.
Automated measurements All 21 items of one channel, or any selected item at each channel, can be displayed.Displayble items depend at the number of displayed waveforms. In addition to measurementof displayed data, measurement of actual data within acquisition memory is also supported.
Waveform computation Performs subtraction, addition and multiplication between channels CH1 and CH2.
Phase shift Performs waveform computation with the phase of CH2 shifted.
FFT computation Displays the power spectrum after having selected the time frame from rectangular orhanning.
GO/NO-GO judgment The following two types of GO/NO-GO are available.• Judgment is made using the zone on the screen (simultaneous judgment of four
waveforms is possible).• Judgment is made using the automatically measured waveform parameters.
Screen hardcopy and additional Outputs screen hardcopy and additional information (setup and waveform parameters) toinformation print-out the built- in printer (optional) or to an external HP-GL plotter via the GP-IB interface.
Real-time printing Prints out waveforms, similar to a recorder.
Action-on-trigger Records data automatically when a trigger is activated. Selectable whether a hardcopy isprinted out on the built-in printer or whether the data will be stored to a floppy disk.
Data Storage/Recall Stores and recalls waveform data and set-ups from the internal memory and floppy disk.DL1540C/DL1540CL can use a SCSI device through the SCSI interface unit 700930 (soldseparately).
Calibration signal Approx. 1 kHz / 1 V
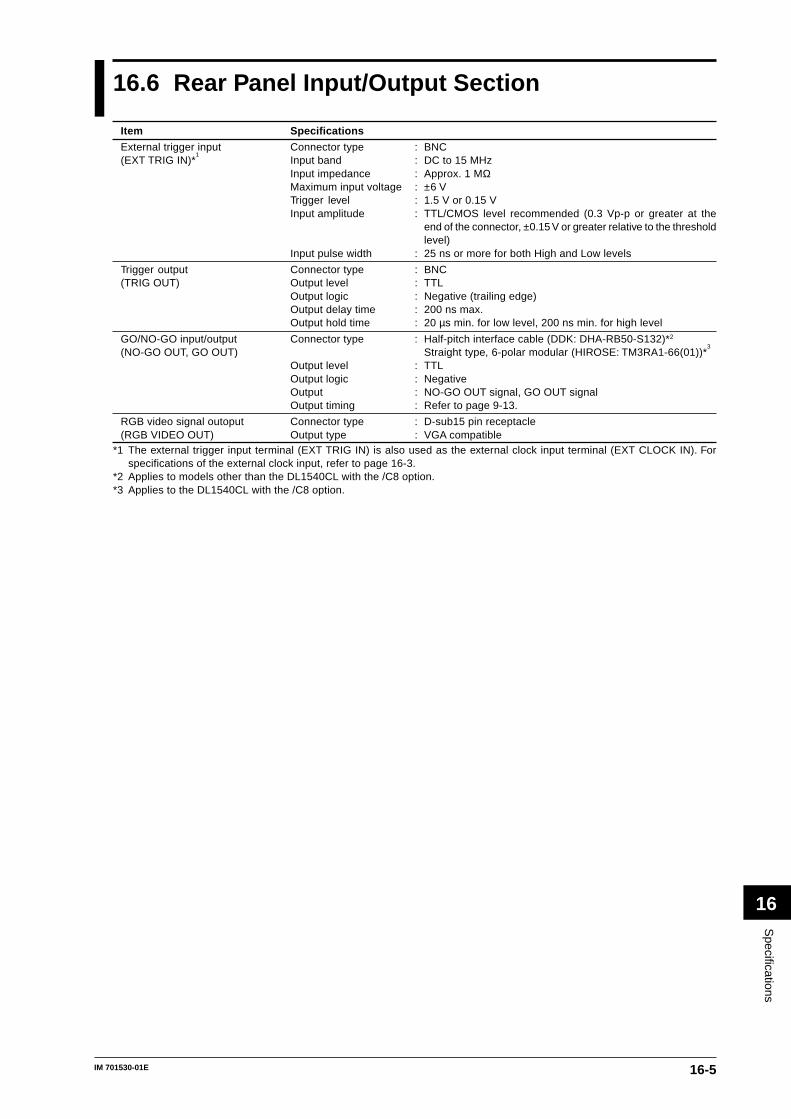
16-5
Specifications
16
IM 701530-01E
16.6 Rear Panel Input/Output Section
Item Specifications
External trigger input Connector type : BNC(EXT TRIG IN)*
1Input band : DC to 15 MHzInput impedance : Approx. 1 MΩMaximum input voltage : ±6 VTrigger level : 1.5 V or 0.15 VInput amplitude : TTL/CMOS level recommended (0.3 Vp-p or greater at the
end of the connector, ±0.15 V or greater relative to the thresholdlevel)
Input pulse width : 25 ns or more for both High and Low levels
Trigger output Connector type : BNC(TRIG OUT) Output level : TTL
Output logic : Negative (trailing edge)Output delay time : 200 ns max.Output hold time : 20 µs min. for low level, 200 ns min. for high level
GO/NO-GO input/output Connector type : Half-pitch interface cable (DDK: DHA-RB50-S132)*2
(NO-GO OUT, GO OUT) Straight type, 6-polar modular (HIROSE: TM3RA1-66(01))*3
Output level : TTLOutput logic : NegativeOutput : NO-GO OUT signal, GO OUT signalOutput timing : Refer to page 9-13.
RGB video signal outoput Connector type : D-sub15 pin receptacle(RGB VIDEO OUT) Output type : VGA compatible
*1 The external trigger input terminal (EXT TRIG IN) is also used as the external clock input terminal (EXT CLOCK IN). Forspecifications of the external clock input, refer to page 16-3.
*2 Applies to models other than the DL1540CL with the /C8 option.*3 Applies to the DL1540CL with the /C8 option.
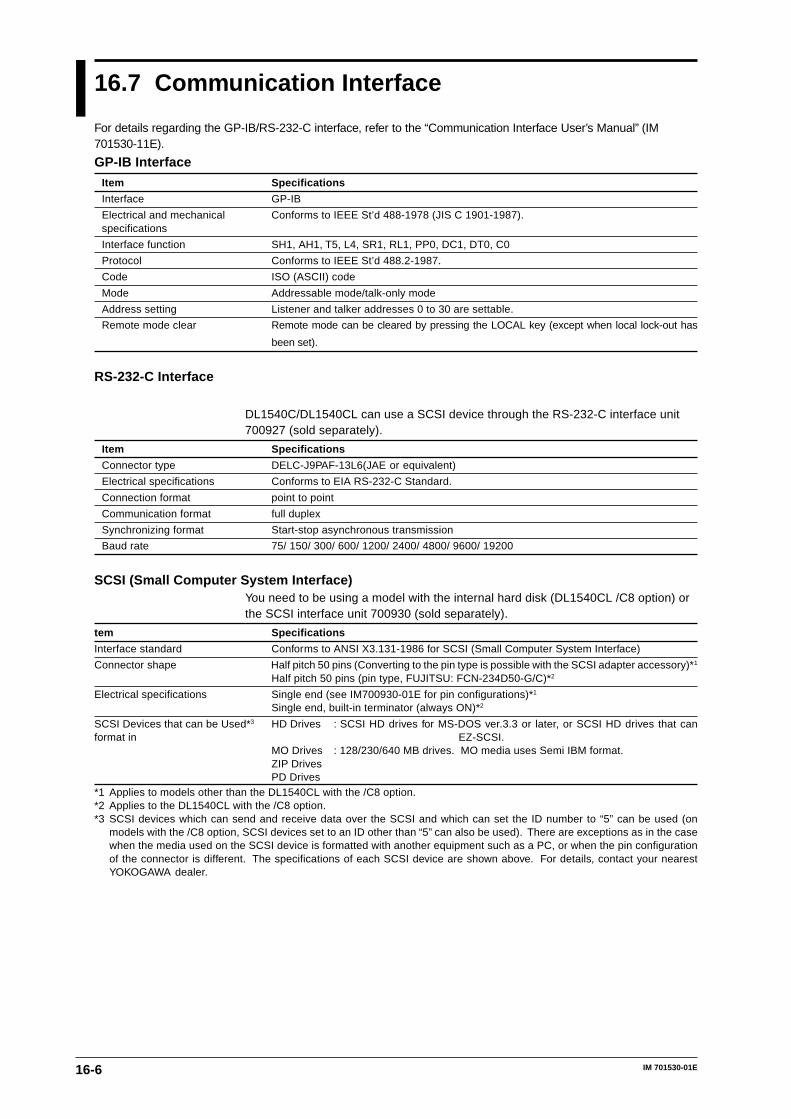
16-6 IM 701530-01E
16.7 Communication Interface
For details regarding the GP-IB/RS-232-C interface, refer to the “Communication Interface User’s Manual” (IM701530-11E).
GP-IB Interface
Item Specifications
Interface GP-IB
Electrical and mechanical Conforms to IEEE St’d 488-1978 (JIS C 1901-1987).specifications
Interface function SH1, AH1, T5, L4, SR1, RL1, PP0, DC1, DT0, C0
Protocol Conforms to IEEE St’d 488.2-1987.
Code ISO (ASCII) code
Mode Addressable mode/talk-only mode
Address setting Listener and talker addresses 0 to 30 are settable.
Remote mode clear Remote mode can be cleared by pressing the LOCAL key (except when local lock-out has
been set).
RS-232-C Interface
DL1540C/DL1540CL can use a SCSI device through the RS-232-C interface unit700927 (sold separately).
Item Specifications
Connector type DELC-J9PAF-13L6(JAE or equivalent)
Electrical specifications Conforms to EIA RS-232-C Standard.
Connection format point to point
Communication format full duplex
Synchronizing format Start-stop asynchronous transmission
Baud rate 75/ 150/ 300/ 600/ 1200/ 2400/ 4800/ 9600/ 19200
SCSI (Small Computer System Interface)You need to be using a model with the internal hard disk (DL1540CL /C8 option) orthe SCSI interface unit 700930 (sold separately).
tem Specifications
Interface standard Conforms to ANSI X3.131-1986 for SCSI (Small Computer System Interface)
Connector shape Half pitch 50 pins (Converting to the pin type is possible with the SCSI adapter accessory)*1
Half pitch 50 pins (pin type, FUJITSU: FCN-234D50-G/C)*2
Electrical specifications Single end (see IM700930-01E for pin configurations)*1
Single end, built-in terminator (always ON)*2
SCSI Devices that can be Used*3 HD Drives : SCSI HD drives for MS-DOS ver.3.3 or later, or SCSI HD drives that canformat in EZ-SCSI.
MO Drives : 128/230/640 MB drives. MO media uses Semi IBM format.ZIP DrivesPD Drives
*1 Applies to models other than the DL1540CL with the /C8 option.*2 Applies to the DL1540CL with the /C8 option.*3 SCSI devices which can send and receive data over the SCSI and which can set the ID number to “5” can be used (on
models with the /C8 option, SCSI devices set to an ID other than “5” can also be used). There are exceptions as in the casewhen the media used on the SCSI device is formatted with another equipment such as a PC, or when the pin configurationof the connector is different. The specifications of each SCSI device are shown above. For details, contact your nearestYOKOGAWA dealer.
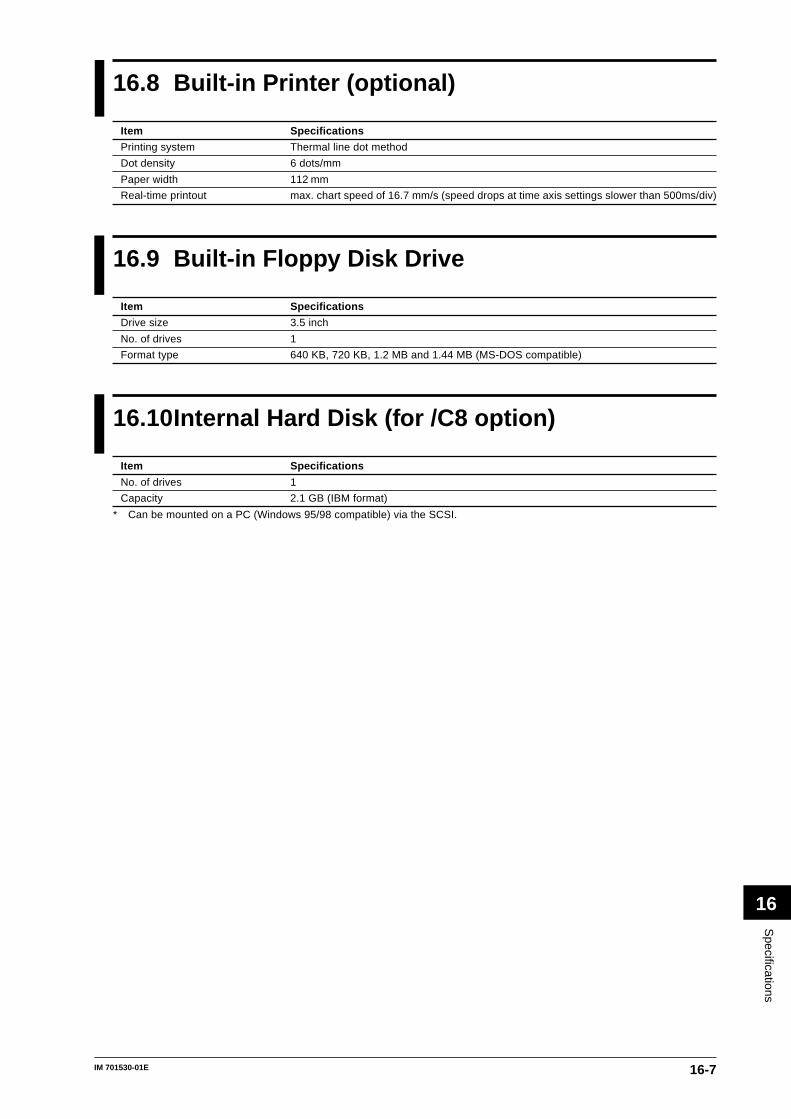
16-7
Specifications
16
IM 701530-01E
16.8 Built-in Printer (optional)
Item Specifications
Printing system Thermal line dot method
Dot density 6 dots/mm
Paper width 112 mm
Real-time printout max. chart speed of 16.7 mm/s (speed drops at time axis settings slower than 500ms/div)
16.9 Built-in Floppy Disk Drive
Item Specifications
Drive size 3.5 inch
No. of drives 1
Format type 640 KB, 720 KB, 1.2 MB and 1.44 MB (MS-DOS compatible)
16.10Internal Hard Disk (for /C8 option)
Item Specifications
No. of drives 1
Capacity 2.1 GB (IBM format)
* Can be mounted on a PC (Windows 95/98 compatible) via the SCSI.
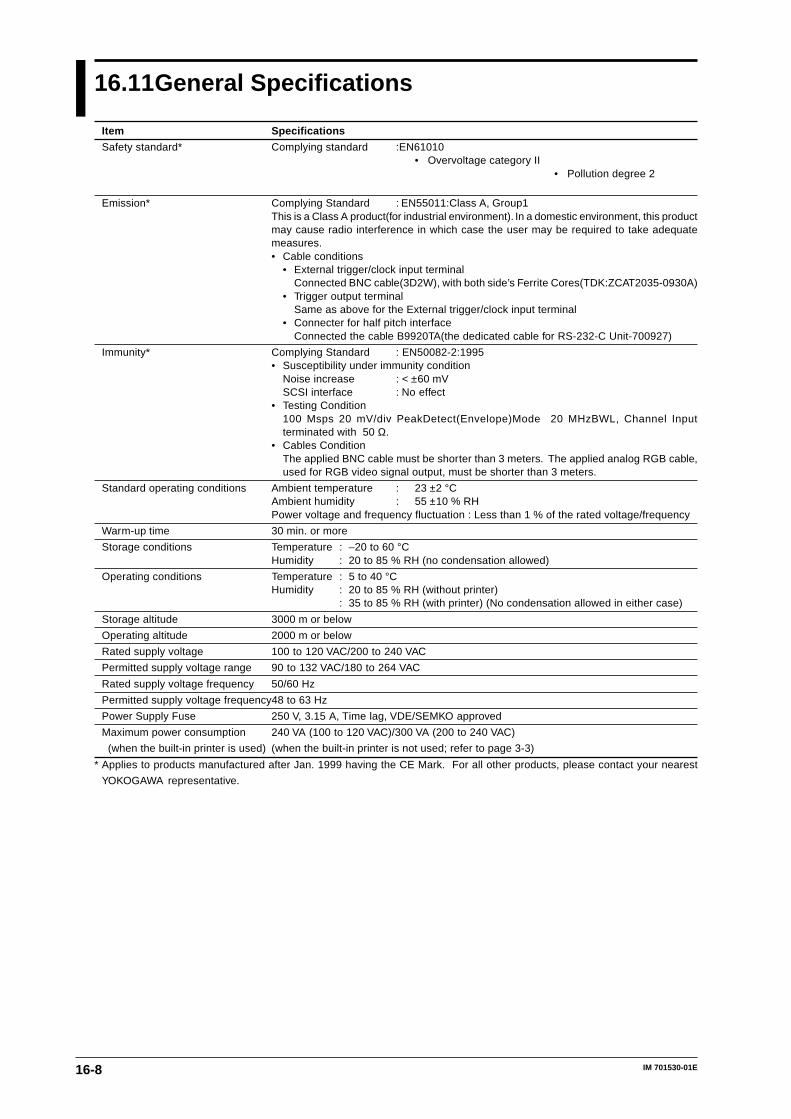
16-8 IM 701530-01E
16.11General Specifications
Item Specifications
Safety standard* Complying standard :EN61010• Overvoltage category II
• Pollution degree 2
Emission* Complying Standard : EN55011:Class A, Group1This is a Class A product(for industrial environment). In a domestic environment, this productmay cause radio interference in which case the user may be required to take adequatemeasures.• Cable conditions
• External trigger/clock input terminalConnected BNC cable(3D2W), with both side’s Ferrite Cores(TDK:ZCAT2035-0930A)
• Trigger output terminalSame as above for the External trigger/clock input terminal
• Connecter for half pitch interfaceConnected the cable B9920TA(the dedicated cable for RS-232-C Unit-700927)
Immunity* Complying Standard : EN50082-2:1995• Susceptibility under immunity condition
Noise increase : < ±60 mVSCSI interface : No effect
• Testing Condition100 Msps 20 mV/div PeakDetect(Envelope)Mode 20 MHzBWL, Channel Inputterminated with 50 Ω.
• Cables ConditionThe applied BNC cable must be shorter than 3 meters. The applied analog RGB cable,used for RGB video signal output, must be shorter than 3 meters.
Standard operating conditions Ambient temperature : 23 ±2 °CAmbient humidity : 55 ±10 % RHPower voltage and frequency fluctuation : Less than 1 % of the rated voltage/frequency
Warm-up time 30 min. or more
Storage conditions Temperature : –20 to 60 °CHumidity : 20 to 85 % RH (no condensation allowed)
Operating conditions Temperature : 5 to 40 °CHumidity : 20 to 85 % RH (without printer)
: 35 to 85 % RH (with printer) (No condensation allowed in either case)
Storage altitude 3000 m or below
Operating altitude 2000 m or below
Rated supply voltage 100 to 120 VAC/200 to 240 VAC
Permitted supply voltage range 90 to 132 VAC/180 to 264 VAC
Rated supply voltage frequency 50/60 Hz
Permitted supply voltage frequency48 to 63 Hz
Power Supply Fuse 250 V, 3.15 A, Time lag, VDE/SEMKO approved
Maximum power consumption 240 VA (100 to 120 VAC)/300 VA (200 to 240 VAC)
(when the built-in printer is used) (when the built-in printer is not used; refer to page 3-3)
* Applies to products manufactured after Jan. 1999 having the CE Mark. For all other products, please contact your nearest
YOKOGAWA representative.
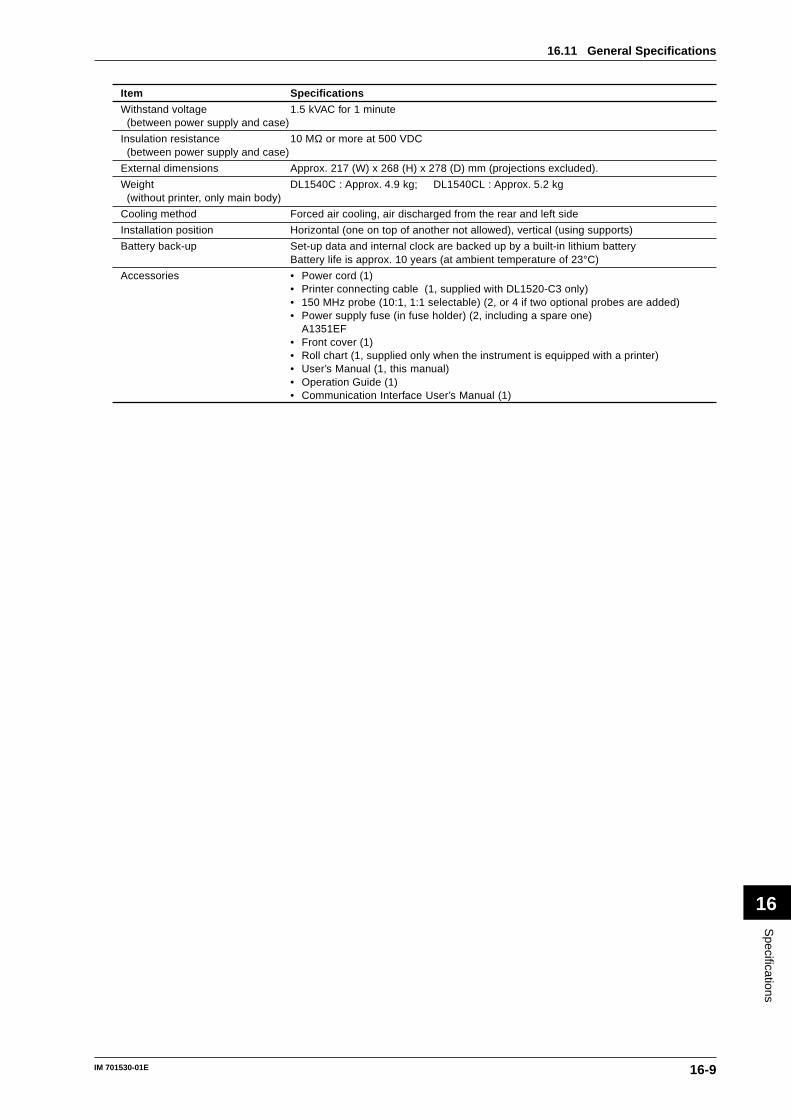
16-9
Specifications
16
IM 701530-01E
Item Specifications
Withstand voltage 1.5 kVAC for 1 minute (between power supply and case)
Insulation resistance 10 MΩ or more at 500 VDC (between power supply and case)
External dimensions Approx. 217 (W) x 268 (H) x 278 (D) mm (projections excluded).
Weight DL1540C : Approx. 4.9 kg; DL1540CL : Approx. 5.2 kg (without printer, only main body)
Cooling method Forced air cooling, air discharged from the rear and left side
Installation position Horizontal (one on top of another not allowed), vertical (using supports)
Battery back-up Set-up data and internal clock are backed up by a built-in lithium batteryBattery life is approx. 10 years (at ambient temperature of 23°C)
Accessories • Power cord (1)• Printer connecting cable (1, supplied with DL1520-C3 only)• 150 MHz probe (10:1, 1:1 selectable) (2, or 4 if two optional probes are added)• Power supply fuse (in fuse holder) (2, including a spare one)
A1351EF• Front cover (1)• Roll chart (1, supplied only when the instrument is equipped with a printer)• User’s Manual (1, this manual)• Operation Guide (1)• Communication Interface User’s Manual (1)
16.11 General Specifications
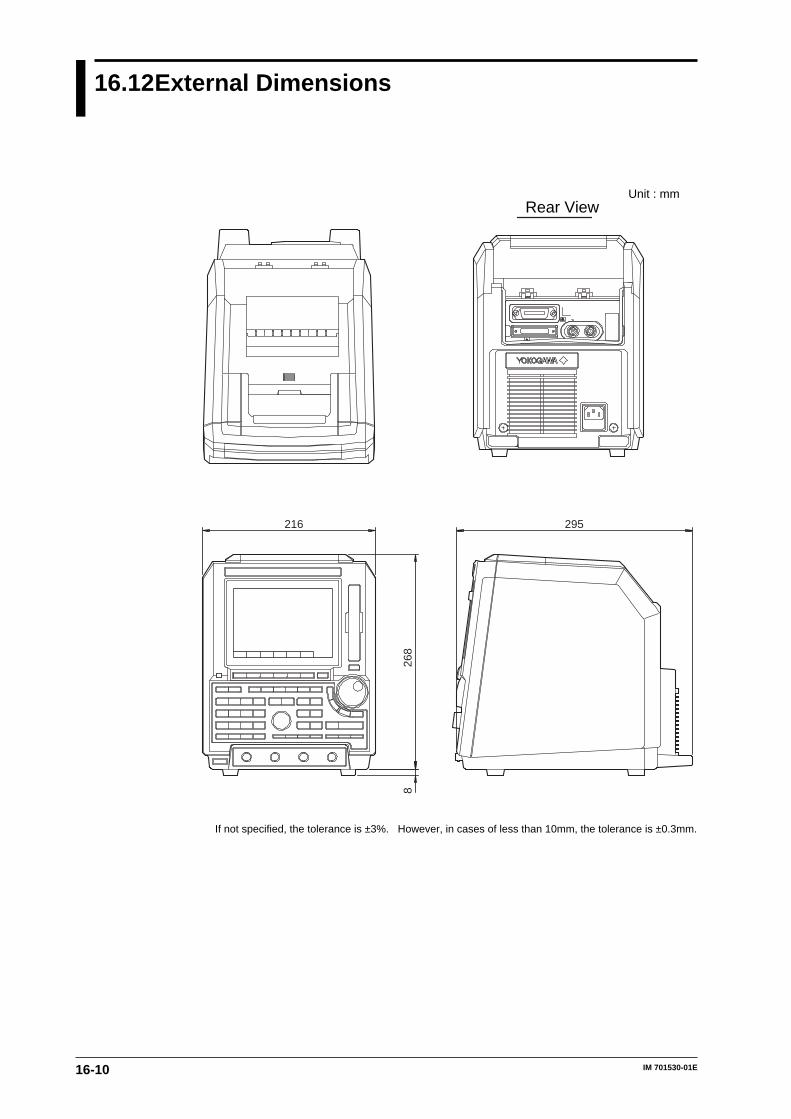
16-10 IM 701530-01E
16.12External Dimensions
216 295
268
8
Rear ViewUnit : mm
If not specified, the tolerance is ±3%. However, in cases of less than 10mm, the tolerance is ±0.3mm.
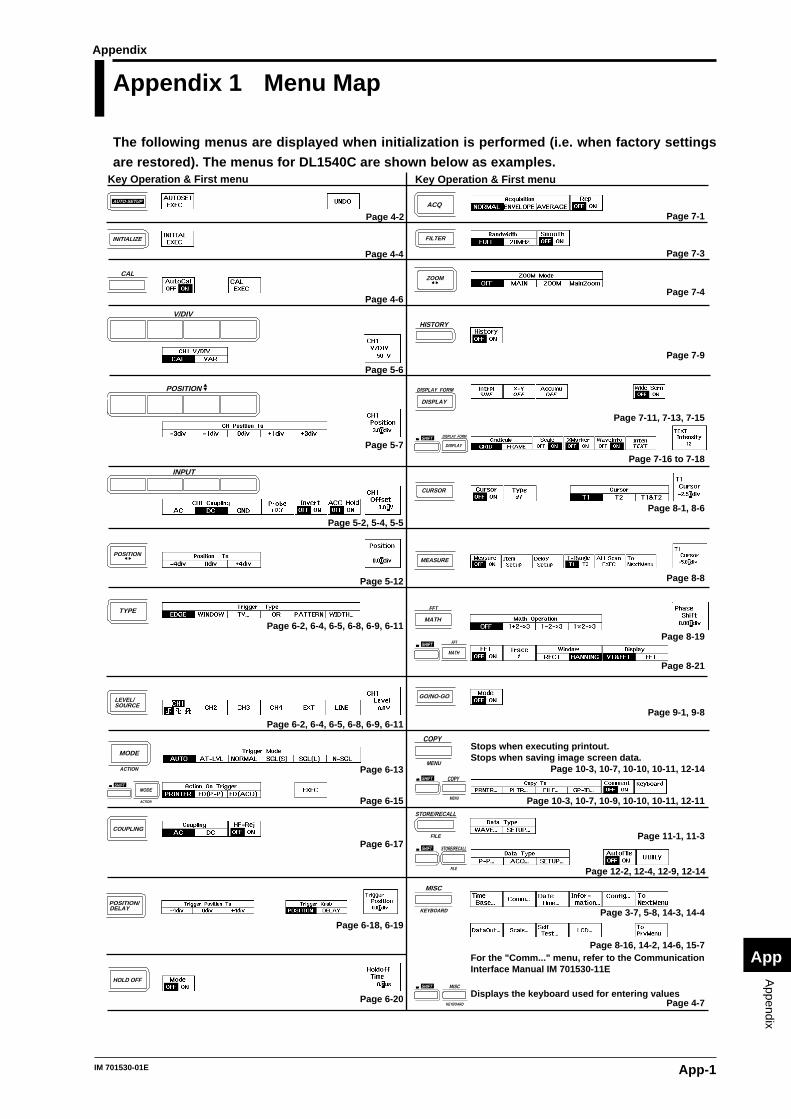
App-1IM 701530-01E
Appendix
App
Appendix 1 Menu Map
The following menus are displayed when initialization is performed (i.e. when factory settings
are restored). The menus for DL1540C are shown below as examples.
V/DIV
POSITION
INPUT
POSITION
TYPE
SOURCELEVEL/
MODE
ACTION
COUPLING
POSITION/ DELAY
HOLD OFF
ACQ
FILTER
ZOOM
HISTORY
AUTO-SETUP
INITIALIZE
CAL
DISPLAY
DISPLAY FORM
CURSOR
MEASURE
MATH
FFT
GO/NO-GO
COPY
MENU
STORE/RECALL
FILE
Key Operation & First menu Key Operation & First menu
Page 4-2
Page 4-4
Page 4-6
Page 5-6
Page 5-7
Page 5-2, 5-4, 5-5
Page 8-16, 14-2, 14-6, 15-7
Page 5-12
Page 6-2, 6-4, 6-5, 6-8, 6-9, 6-11
Page 6-2, 6-4, 6-5, 6-8, 6-9, 6-11
Page 6-13
Page 6-15
Page 6-17
Page 6-18, 6-19
Page 6-20
Page 7-1
Page 7-3
Page 7-4
Page 7-9
Page 7-11, 7-13, 7-15
Page 7-16 to 7-18
Page 8-1, 8-6
Page 8-8
Page 8-19
Page 8-21
Page 9-1, 9-8
Page 10-3, 10-7, 10-9, 10-10, 10-11, 12-11
Page 11-1, 11-3
Page 12-2, 12-4, 12-9, 12-14
Page 3-7, 5-8, 14-3, 14-4
For the "Comm..." menu, refer to the CommunicationInterface Manual IM 701530-11E
Stops when executing printout.Stops when saving image screen data.
SHIFTMODE
ACTION
SHIFT
DISPLAY
DISPLAY FORM
SHIFT
SHIFT
MATH
FFT
SHIFT
COPY
MENU
STORE/RECALL
FILE
SHIFT
MISC
KEYBOARD
MISC
KEYBOARD
Displays the keyboard used for entering valuesPage 4-7
Page 10-3, 10-7, 10-10, 10-11, 12-14
Appendix
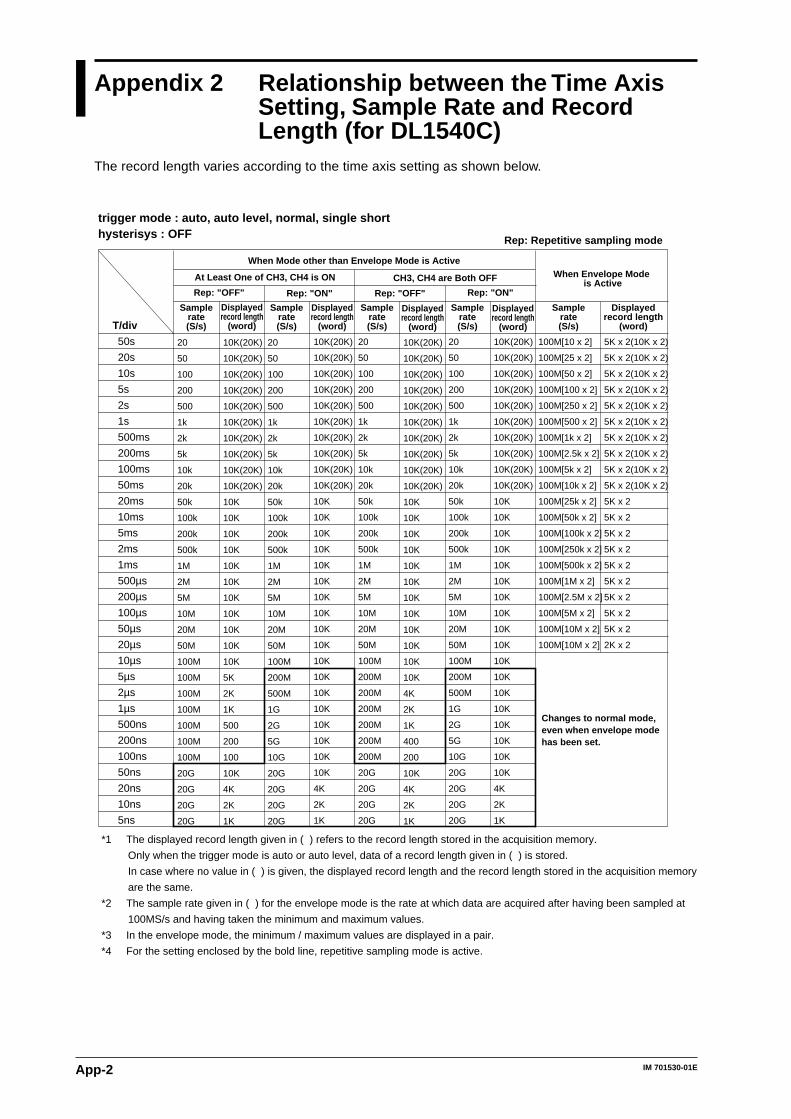
App-2 IM 701530-01E
Appendix 2 Relationship between the Time AxisSetting, Sample Rate and RecordLength (for DL1540C)
The record length varies according to the time axis setting as shown below.
20
50
100
200
500
1k
2k
5k
10k
20k
50k
100k
200k
500k
1M
2M
5M
10M
20M
50M
100M
100M
100M
100M
100M
100M
100M
20G
20G
20G
20G
10K(20K)
10K(20K)
10K(20K)
10K(20K)
10K(20K)
10K(20K)
10K(20K)
10K(20K)
10K(20K)
10K(20K)
10K
10K
10K
10K
10K
10K
10K
10K
10K
10K
10K
5K
2K
1K
500
200
100
10K
4K
2K
1K
20
50
100
200
500
1k
2k
5k
10k
20k
50k
100k
200k
500k
1M
2M
5M
10M
20M
50M
100M
200M
500M
1G
2G
5G
10G
20G
20G
20G
20G
10K(20K)
10K(20K)
10K(20K)
10K(20K)
10K(20K)
10K(20K)
10K(20K)
10K(20K)
10K(20K)
10K(20K)
10K
10K
10K
10K
10K
10K
10K
10K
10K
10K
10K
10K
10K
10K
10K
10K
10K
10K
4K
2K
1K
20
50
100
200
500
1k
2k
5k
10k
20k
50k
100k
200k
500k
1M
2M
5M
10M
20M
50M
100M
200M
200M
200M
200M
200M
200M
20G
20G
20G
20G
10K(20K)
10K(20K)
10K(20K)
10K(20K)
10K(20K)
10K(20K)
10K(20K)
10K(20K)
10K(20K)
10K(20K)
10K
10K
10K
10K
10K
10K
10K
10K
10K
10K
10K
10K
4K
2K
1K
400
200
10K
4K
2K
1K
20
50
100
200
500
1k
2k
5k
10k
20k
50k
100k
200k
500k
1M
2M
5M
10M
20M
50M
100M
200M
500M
1G
2G
5G
10G
20G
20G
20G
20G
10K(20K)
10K(20K)
10K(20K)
10K(20K)
10K(20K)
10K(20K)
10K(20K)
10K(20K)
10K(20K)
10K(20K)
10K
10K
10K
10K
10K
10K
10K
10K
10K
10K
10K
10K
10K
10K
10K
10K
10K
10K
4K
2K
1K
100M[10 x 2]
100M[25 x 2]
100M[50 x 2]
100M[100 x 2]
100M[250 x 2]
100M[500 x 2]
100M[1k x 2]
100M[2.5k x 2]
100M[5k x 2]
100M[10k x 2]
100M[25k x 2]
100M[50k x 2]
100M[100k x 2]
100M[250k x 2]
100M[500k x 2]
100M[1M x 2]
100M[2.5M x 2]
100M[5M x 2]
100M[10M x 2]
100M[10M x 2]
5K x 2(10K x 2)
5K x 2(10K x 2)
5K x 2(10K x 2)
5K x 2(10K x 2)
5K x 2(10K x 2)
5K x 2(10K x 2)
5K x 2(10K x 2)
5K x 2(10K x 2)
5K x 2(10K x 2)
5K x 2(10K x 2)
5K x 2
5K x 2
5K x 2
5K x 2
5K x 2
5K x 2
5K x 2
5K x 2
5K x 2
2K x 2
T/div
50s
20s
10s
5s
2s
1s
500ms
200ms
100ms
50ms
20ms
10ms
5ms
2ms
1ms
500µs
200µs
100µs
50µs
20µs
10µs
5µs
2µs
1µs
500ns
200ns
100ns
50ns
20ns
10ns
5ns
At Least One of CH3, CH4 is ON
Rep: "ON"Rep: "OFF"Rep: "ON"Rep: "OFF"
*1 The displayed record length given in ( ) refers to the record length stored in the acquisition memory.
Only when the trigger mode is auto or auto level, data of a record length given in ( ) is stored.
In case where no value in ( ) is given, the displayed record length and the record length stored in the acquisition memory
are the same.
*2 The sample rate given in ( ) for the envelope mode is the rate at which data are acquired after having been sampled at
100MS/s and having taken the minimum and maximum values.
*3 In the envelope mode, the minimum / maximum values are displayed in a pair.
*4 For the setting enclosed by the bold line, repetitive sampling mode is active.
Rep: Repetitive sampling mode
CH3, CH4 are Both OFF
When Mode other than Envelope Mode is ActiveWhen Envelope Mode
is Active
trigger mode : auto, auto level, normal, single shorthysterisys : OFF
Changes to normal mode,even when envelope modehas been set.
Samplerate(S/s)
Displayedrecord length
(word)
Samplerate(S/s)
Samplerate(S/s)
Samplerate(S/s)
Samplerate(S/s)
Displayedrecord length
(word)
Displayedrecord length
(word)
Displayedrecord length
(word)
Displayedrecord length
(word)
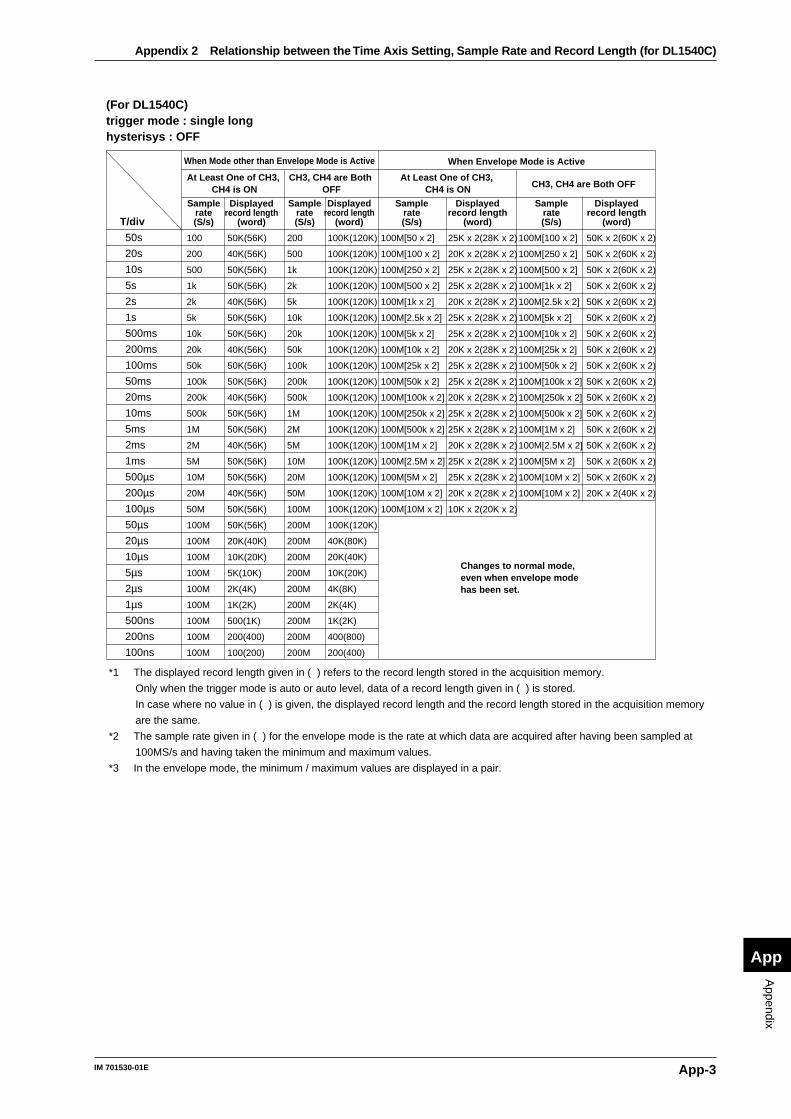
App-3IM 701530-01E
Appendix
App
100
200
500
1k
2k
5k
10k
20k
50k
100k
200k
500k
1M
2M
5M
10M
20M
50M
100M
100M
100M
100M
100M
100M
100M
100M
100M
200
500
1k
2k
5k
10k
20k
50k
100k
200k
500k
1M
2M
5M
10M
20M
50M
100M
200M
200M
200M
200M
200M
200M
200M
200M
200M
100K(120K)
100K(120K)
100K(120K)
100K(120K)
100K(120K)
100K(120K)
100K(120K)
100K(120K)
100K(120K)
100K(120K)
100K(120K)
100K(120K)
100K(120K)
100K(120K)
100K(120K)
100K(120K)
100K(120K)
100K(120K)
100K(120K)
40K(80K)
20K(40K)
10K(20K)
4K(8K)
2K(4K)
1K(2K)
400(800)
200(400)
100M[50 x 2]
100M[100 x 2]
100M[250 x 2]
100M[500 x 2]
100M[1k x 2]
100M[2.5k x 2]
100M[5k x 2]
100M[10k x 2]
100M[25k x 2]
100M[50k x 2]
100M[100k x 2]
100M[250k x 2]
100M[500k x 2]
100M[1M x 2]
100M[2.5M x 2]
100M[5M x 2]
100M[10M x 2]
100M[10M x 2]
25K x 2(28K x 2)
20K x 2(28K x 2)
25K x 2(28K x 2)
25K x 2(28K x 2)
20K x 2(28K x 2)
25K x 2(28K x 2)
25K x 2(28K x 2)
20K x 2(28K x 2)
25K x 2(28K x 2)
25K x 2(28K x 2)
20K x 2(28K x 2)
25K x 2(28K x 2)
25K x 2(28K x 2)
20K x 2(28K x 2)
25K x 2(28K x 2)
25K x 2(28K x 2)
20K x 2(28K x 2)
10K x 2(20K x 2)
T/div
50s
20s
10s
5s
2s
1s
500ms
200ms
100ms
50ms
20ms
10ms
5ms
2ms
1ms
500µs
200µs
100µs
50µs
20µs
10µs
5µs
2µs
1µs
500ns
200ns
100ns
At Least One of CH3, CH4 is ON
*1 The displayed record length given in ( ) refers to the record length stored in the acquisition memory.
Only when the trigger mode is auto or auto level, data of a record length given in ( ) is stored.
In case where no value in ( ) is given, the displayed record length and the record length stored in the acquisition memory
are the same.
*2 The sample rate given in ( ) for the envelope mode is the rate at which data are acquired after having been sampled at
100MS/s and having taken the minimum and maximum values.
*3 In the envelope mode, the minimum / maximum values are displayed in a pair.
When Mode other than Envelope Mode is Active When Envelope Mode is Active
(For DL1540C)trigger mode : single longhysterisys : OFF
Changes to normal mode, even when envelope modehas been set.
50K(56K)
40K(56K)
50K(56K)
50K(56K)
40K(56K)
50K(56K)
50K(56K)
40K(56K)
50K(56K)
50K(56K)
40K(56K)
50K(56K)
50K(56K)
40K(56K)
50K(56K)
50K(56K)
40K(56K)
50K(56K)
50K(56K)
20K(40K)
10K(20K)
5K(10K)
2K(4K)
1K(2K)
500(1K)
200(400)
100(200)
50K x 2(60K x 2)
50K x 2(60K x 2)
50K x 2(60K x 2)
50K x 2(60K x 2)
50K x 2(60K x 2)
50K x 2(60K x 2)
50K x 2(60K x 2)
50K x 2(60K x 2)
50K x 2(60K x 2)
50K x 2(60K x 2)
50K x 2(60K x 2)
50K x 2(60K x 2)
50K x 2(60K x 2)
50K x 2(60K x 2)
50K x 2(60K x 2)
50K x 2(60K x 2)
20K x 2(40K x 2)
100M[100 x 2]
100M[250 x 2]
100M[500 x 2]
100M[1k x 2]
100M[2.5k x 2]
100M[5k x 2]
100M[10k x 2]
100M[25k x 2]
100M[50k x 2]
100M[100k x 2]
100M[250k x 2]
100M[500k x 2]
100M[1M x 2]
100M[2.5M x 2]
100M[5M x 2]
100M[10M x 2]
100M[10M x 2]
CH3, CH4 are Both OFFAt Least One of CH3,
CH4 is ONCH3, CH4 are Both
OFF
Samplerate(S/s)
Displayedrecord length
(word)
Samplerate(S/s)
Samplerate(S/s)
Samplerate(S/s)
Displayedrecord length
(word)
Displayedrecord length
(word)
Displayedrecord length
(word)
Appendix 2 Relationship between the Time Axis Setting, Sample Rate and Record Length (for DL1540C)
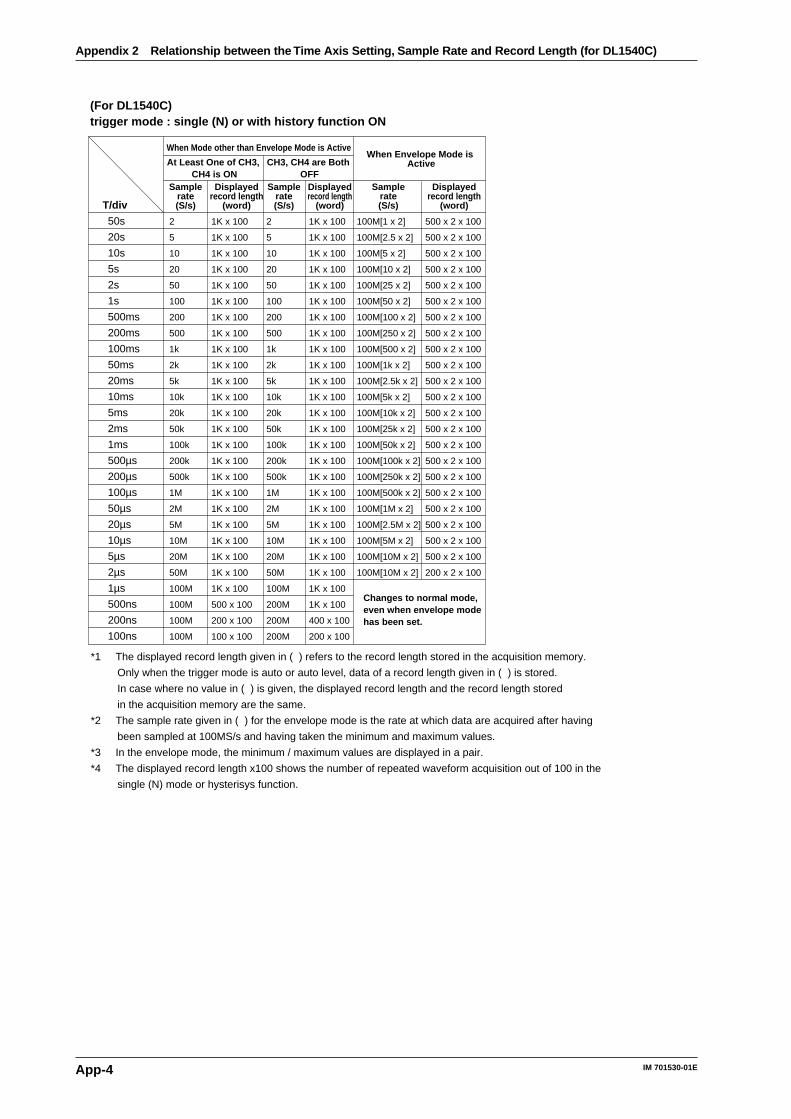
App-4 IM 701530-01E
2
5
10
20
50
100
200
500
1k
2k
5k
10k
20k
50k
100k
200k
500k
1M
2M
5M
10M
20M
50M
100M
100M
100M
100M
2
5
10
20
50
100
200
500
1k
2k
5k
10k
20k
50k
100k
200k
500k
1M
2M
5M
10M
20M
50M
100M
200M
200M
200M
1K x 100
1K x 100
1K x 100
1K x 100
1K x 100
1K x 100
1K x 100
1K x 100
1K x 100
1K x 100
1K x 100
1K x 100
1K x 100
1K x 100
1K x 100
1K x 100
1K x 100
1K x 100
1K x 100
1K x 100
1K x 100
1K x 100
1K x 100
1K x 100
1K x 100
400 x 100
200 x 100
100M[1 x 2]
100M[2.5 x 2]
100M[5 x 2]
100M[10 x 2]
100M[25 x 2]
100M[50 x 2]
100M[100 x 2]
100M[250 x 2]
100M[500 x 2]
100M[1k x 2]
100M[2.5k x 2]
100M[5k x 2]
100M[10k x 2]
100M[25k x 2]
100M[50k x 2]
100M[100k x 2]
100M[250k x 2]
100M[500k x 2]
100M[1M x 2]
100M[2.5M x 2]
100M[5M x 2]
100M[10M x 2]
100M[10M x 2]
500 x 2 x 100
500 x 2 x 100
500 x 2 x 100
500 x 2 x 100
500 x 2 x 100
500 x 2 x 100
500 x 2 x 100
500 x 2 x 100
500 x 2 x 100
500 x 2 x 100
500 x 2 x 100
500 x 2 x 100
500 x 2 x 100
500 x 2 x 100
500 x 2 x 100
500 x 2 x 100
500 x 2 x 100
500 x 2 x 100
500 x 2 x 100
500 x 2 x 100
500 x 2 x 100
500 x 2 x 100
200 x 2 x 100
T/div
50s
20s
10s
5s
2s
1s
500ms
200ms
100ms
50ms
20ms
10ms
5ms
2ms
1ms
500µs
200µs
100µs
50µs
20µs
10µs
5µs
2µs
1µs
500ns
200ns
100ns
At Least One of CH3, CH4 is ON
*1 The displayed record length given in ( ) refers to the record length stored in the acquisition memory.
Only when the trigger mode is auto or auto level, data of a record length given in ( ) is stored.
In case where no value in ( ) is given, the displayed record length and the record length stored
in the acquisition memory are the same.
*2 The sample rate given in ( ) for the envelope mode is the rate at which data are acquired after having
been sampled at 100MS/s and having taken the minimum and maximum values.
*3 In the envelope mode, the minimum / maximum values are displayed in a pair.
*4 The displayed record length x100 shows the number of repeated waveform acquisition out of 100 in the
single (N) mode or hysterisys function.
CH3, CH4 are Both OFF
When Mode other than Envelope Mode is ActiveWhen Envelope Mode is
Active
(For DL1540C)trigger mode : single (N) or with history function ON
Changes to normal mode,even when envelope modehas been set.
1K x 100
1K x 100
1K x 100
1K x 100
1K x 100
1K x 100
1K x 100
1K x 100
1K x 100
1K x 100
1K x 100
1K x 100
1K x 100
1K x 100
1K x 100
1K x 100
1K x 100
1K x 100
1K x 100
1K x 100
1K x 100
1K x 100
1K x 100
1K x 100
500 x 100
200 x 100
100 x 100
Samplerate(S/s)
Displayedrecord length
(word)
Samplerate(S/s)
Samplerate(S/s)
Displayedrecord length
(word)
Displayedrecord length
(word)
Appendix 2 Relationship between the Time Axis Setting, Sample Rate and Record Length (for DL1540C)
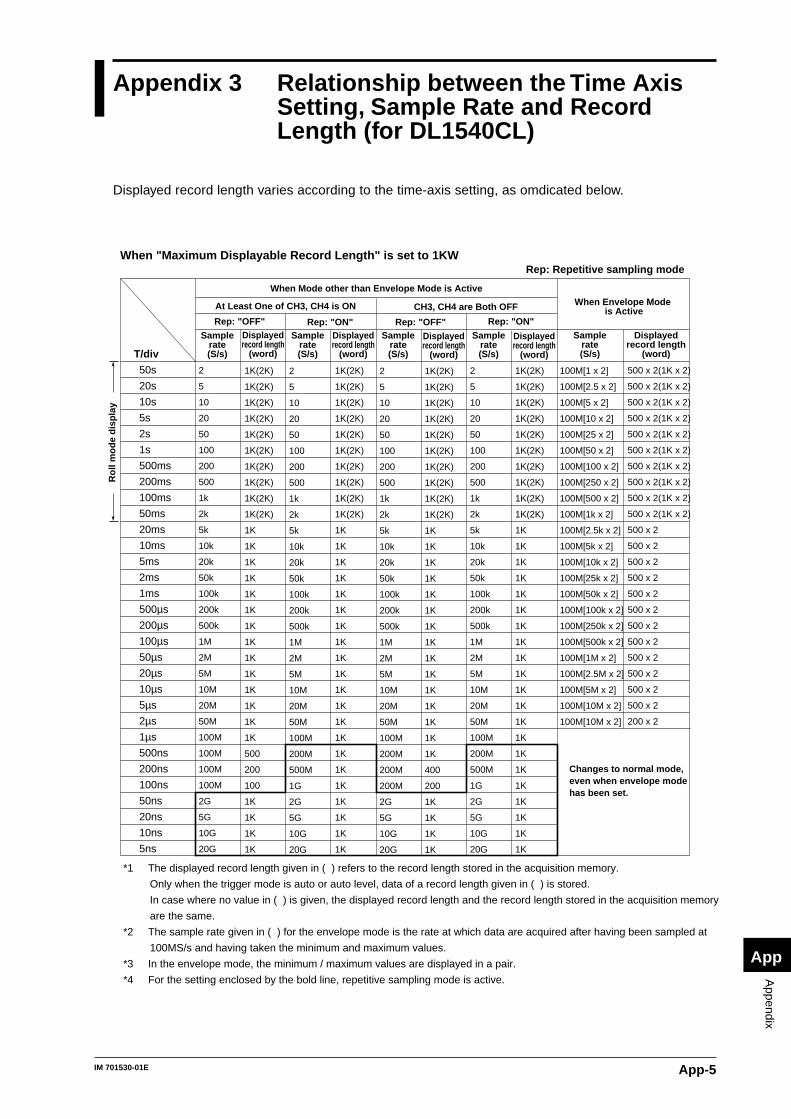
App-5IM 701530-01E
Appendix
App
Appendix 3 Relationship between the Time AxisSetting, Sample Rate and RecordLength (for DL1540CL)
Displayed record length varies according to the time-axis setting, as omdicated below.
2
5
10
20
50
100
200
500
1k
2k
5k
10k
20k
50k
100k
200k
500k
1M
2M
5M
10M
20M
50M
100M
100M
100M
100M
2G
5G
10G
20G
1K(2K)
1K(2K)
1K(2K)
1K(2K)
1K(2K)
1K(2K)
1K(2K)
1K(2K)
1K(2K)
1K(2K)
1K
1K
1K
1K
1K
1K
1K
1K
1K
1K
1K
1K
1K
1K
500
200
100
1K
1K
1K
1K
2
5
10
20
50
100
200
500
1k
2k
5k
10k
20k
50k
100k
200k
500k
1M
2M
5M
10M
20M
50M
100M
200M
500M
1G
2G
5G
10G
20G
1K(2K)
1K(2K)
1K(2K)
1K(2K)
1K(2K)
1K(2K)
1K(2K)
1K(2K)
1K(2K)
1K(2K)
1K
1K
1K
1K
1K
1K
1K
1K
1K
1K
1K
1K
1K
1K
1K
1K
1K
1K
1K
1K
1K
2
5
10
20
50
100
200
500
1k
2k
5k
10k
20k
50k
100k
200k
500k
1M
2M
5M
10M
20M
50M
100M
200M
200M
200M
2G
5G
10G
20G
1K(2K)
1K(2K)
1K(2K)
1K(2K)
1K(2K)
1K(2K)
1K(2K)
1K(2K)
1K(2K)
1K(2K)
1K
1K
1K
1K
1K
1K
1K
1K
1K
1K
1K
1K
1K
1K
1K
400
200
1K
1K
1K
1K
2
5
10
20
50
100
200
500
1k
2k
5k
10k
20k
50k
100k
200k
500k
1M
2M
5M
10M
20M
50M
100M
200M
500M
1G
2G
5G
10G
20G
1K(2K)
1K(2K)
1K(2K)
1K(2K)
1K(2K)
1K(2K)
1K(2K)
1K(2K)
1K(2K)
1K(2K)
1K
1K
1K
1K
1K
1K
1K
1K
1K
1K
1K
1K
1K
1K
1K
1K
1K
1K
1K
1K
1K
100M[1 x 2]
100M[2.5 x 2]
100M[5 x 2]
100M[10 x 2]
100M[25 x 2]
100M[50 x 2]
100M[100 x 2]
100M[250 x 2]
100M[500 x 2]
100M[1k x 2]
100M[2.5k x 2]
100M[5k x 2]
100M[10k x 2]
100M[25k x 2]
100M[50k x 2]
100M[100k x 2]
100M[250k x 2]
100M[500k x 2]
100M[1M x 2]
100M[2.5M x 2]
100M[5M x 2]
100M[10M x 2]
100M[10M x 2]
500 x 2(1K x 2)
500 x 2(1K x 2)
500 x 2(1K x 2)
500 x 2(1K x 2)
500 x 2(1K x 2)
500 x 2(1K x 2)
500 x 2(1K x 2)
500 x 2(1K x 2)
500 x 2(1K x 2)
500 x 2(1K x 2)
500 x 2
500 x 2
500 x 2
500 x 2
500 x 2
500 x 2
500 x 2
500 x 2
500 x 2
500 x 2
500 x 2
500 x 2
200 x 2
T/div
50s
20s
10s
5s
2s
1s
500ms
200ms
100ms
50ms
20ms
10ms
5ms
2ms
1ms
500µs
200µs
100µs
50µs
20µs
10µs
5µs
2µs
1µs
500ns
200ns
100ns
50ns
20ns
10ns
5ns
When "Maximum Displayable Record Length" is set to 1KWRep: Repetitive sampling mode
When Mode other than Envelope Mode is Active
At Least One of CH3, CH4 is ON
Rep: "ON"Rep: "OFF"Rep: "ON"Rep: "OFF"
CH3, CH4 are Both OFF
Samplerate(S/s)
Displayedrecord length
(word)
Samplerate(S/s)
Samplerate(S/s)
Samplerate(S/s)
Displayedrecord length
(word)
Displayedrecord length
(word)
Displayedrecord length
(word)
When Envelope Mode is Active
Samplerate(S/s)
Displayedrecord length
(word)
Changes to normal mode,even when envelope modehas been set.
*1 The displayed record length given in ( ) refers to the record length stored in the acquisition memory.
Only when the trigger mode is auto or auto level, data of a record length given in ( ) is stored.
In case where no value in ( ) is given, the displayed record length and the record length stored in the acquisition memory
are the same.
*2 The sample rate given in ( ) for the envelope mode is the rate at which data are acquired after having been sampled at
100MS/s and having taken the minimum and maximum values.
*3 In the envelope mode, the minimum / maximum values are displayed in a pair.
*4 For the setting enclosed by the bold line, repetitive sampling mode is active.
Ro
ll m
od
e d
isp
lay
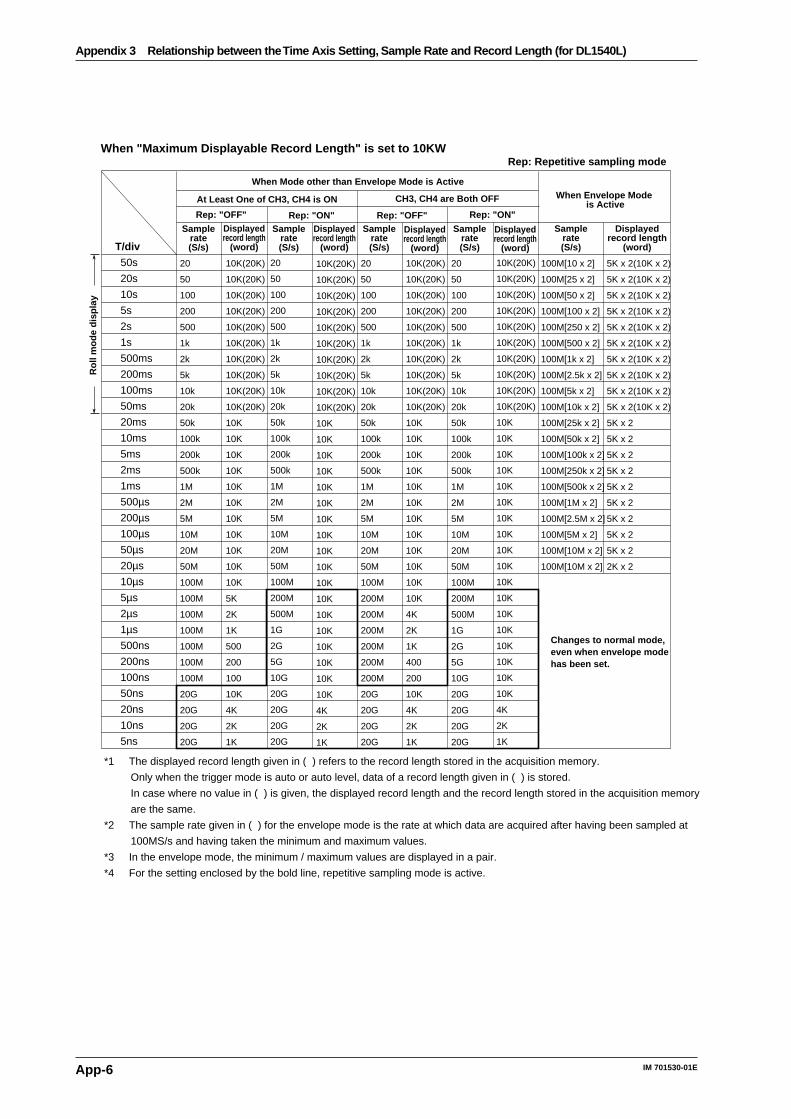
App-6 IM 701530-01E
Appendix 3 Relationship between the Time Axis Setting, Sample Rate and Record Length (for DL1540L)
20
50
100
200
500
1k
2k
5k
10k
20k
50k
100k
200k
500k
1M
2M
5M
10M
20M
50M
100M
100M
100M
100M
100M
100M
100M
20G
20G
20G
20G
10K(20K)
10K(20K)
10K(20K)
10K(20K)
10K(20K)
10K(20K)
10K(20K)
10K(20K)
10K(20K)
10K(20K)
10K
10K
10K
10K
10K
10K
10K
10K
10K
10K
10K
5K
2K
1K
500
200
100
10K
4K
2K
1K
20
50
100
200
500
1k
2k
5k
10k
20k
50k
100k
200k
500k
1M
2M
5M
10M
20M
50M
100M
200M
500M
1G
2G
5G
10G
20G
20G
20G
20G
10K(20K)
10K(20K)
10K(20K)
10K(20K)
10K(20K)
10K(20K)
10K(20K)
10K(20K)
10K(20K)
10K(20K)
10K
10K
10K
10K
10K
10K
10K
10K
10K
10K
10K
10K
10K
10K
10K
10K
10K
10K
4K
2K
1K
20
50
100
200
500
1k
2k
5k
10k
20k
50k
100k
200k
500k
1M
2M
5M
10M
20M
50M
100M
200M
200M
200M
200M
200M
200M
20G
20G
20G
20G
10K(20K)
10K(20K)
10K(20K)
10K(20K)
10K(20K)
10K(20K)
10K(20K)
10K(20K)
10K(20K)
10K(20K)
10K
10K
10K
10K
10K
10K
10K
10K
10K
10K
10K
10K
4K
2K
1K
400
200
10K
4K
2K
1K
20
50
100
200
500
1k
2k
5k
10k
20k
50k
100k
200k
500k
1M
2M
5M
10M
20M
50M
100M
200M
500M
1G
2G
5G
10G
20G
20G
20G
20G
10K(20K)
10K(20K)
10K(20K)
10K(20K)
10K(20K)
10K(20K)
10K(20K)
10K(20K)
10K(20K)
10K(20K)
10K
10K
10K
10K
10K
10K
10K
10K
10K
10K
10K
10K
10K
10K
10K
10K
10K
10K
4K
2K
1K
100M[10 x 2]
100M[25 x 2]
100M[50 x 2]
100M[100 x 2]
100M[250 x 2]
100M[500 x 2]
100M[1k x 2]
100M[2.5k x 2]
100M[5k x 2]
100M[10k x 2]
100M[25k x 2]
100M[50k x 2]
100M[100k x 2]
100M[250k x 2]
100M[500k x 2]
100M[1M x 2]
100M[2.5M x 2]
100M[5M x 2]
100M[10M x 2]
100M[10M x 2]
5K x 2(10K x 2)
5K x 2(10K x 2)
5K x 2(10K x 2)
5K x 2(10K x 2)
5K x 2(10K x 2)
5K x 2(10K x 2)
5K x 2(10K x 2)
5K x 2(10K x 2)
5K x 2(10K x 2)
5K x 2(10K x 2)
5K x 2
5K x 2
5K x 2
5K x 2
5K x 2
5K x 2
5K x 2
5K x 2
5K x 2
2K x 2
T/div
50s
20s
10s
5s
2s
1s
500ms
200ms
100ms
50ms
20ms
10ms
5ms
2ms
1ms
500µs
200µs
100µs
50µs
20µs
10µs
5µs
2µs
1µs
500ns
200ns
100ns
50ns
20ns
10ns
5ns
Rep: Repetitive sampling modeWhen "Maximum Displayable Record Length" is set to 10KW
When Mode other than Envelope Mode is Active
At Least One of CH3, CH4 is ON
Rep: "ON"Rep: "OFF"Rep: "ON"Rep: "OFF"
CH3, CH4 are Both OFF When Envelope Mode is Active
Samplerate(S/s)
Displayedrecord length
(word)
Samplerate(S/s)
Samplerate(S/s)
Samplerate(S/s)
Displayedrecord length
(word)
Displayedrecord length
(word)
Displayedrecord length
(word)
Samplerate(S/s)
Displayedrecord length
(word)
Changes to normal mode,even when envelope modehas been set.
*1 The displayed record length given in ( ) refers to the record length stored in the acquisition memory.
Only when the trigger mode is auto or auto level, data of a record length given in ( ) is stored.
In case where no value in ( ) is given, the displayed record length and the record length stored in the acquisition memory
are the same.
*2 The sample rate given in ( ) for the envelope mode is the rate at which data are acquired after having been sampled at
100MS/s and having taken the minimum and maximum values.
*3 In the envelope mode, the minimum / maximum values are displayed in a pair.
*4 For the setting enclosed by the bold line, repetitive sampling mode is active.
Ro
ll m
od
e d
isp
lay
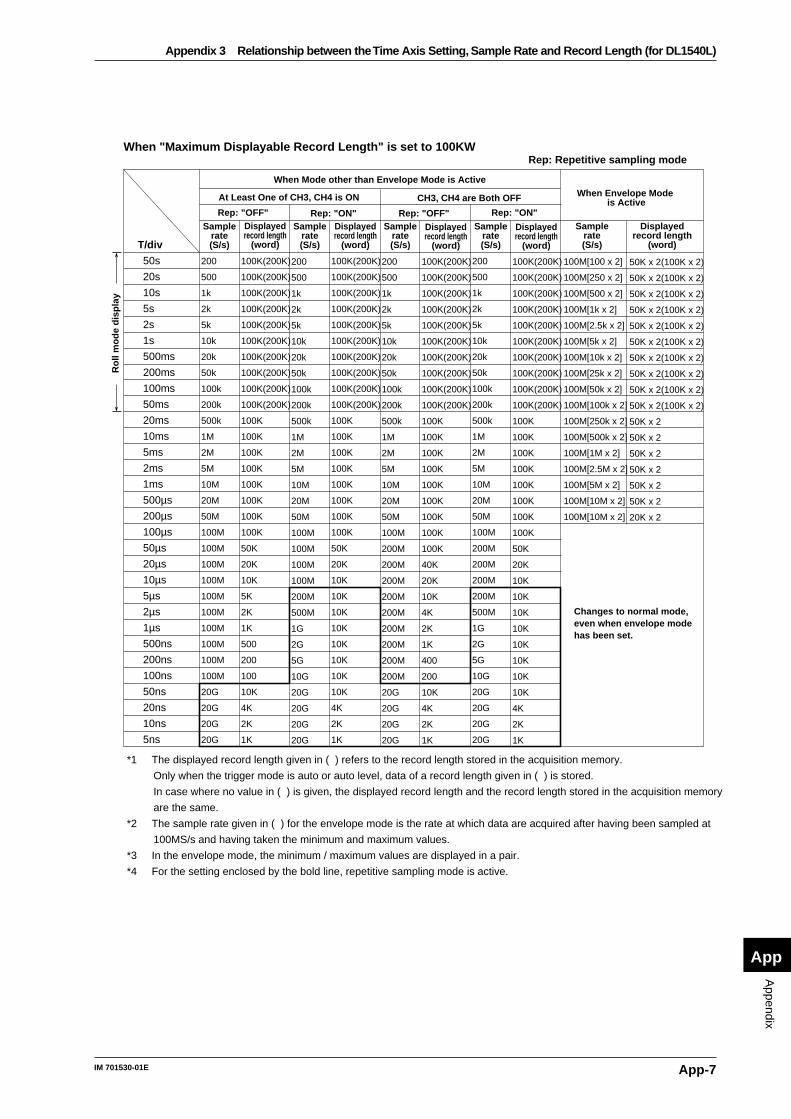
App-7IM 701530-01E
Appendix
App
Appendix 3 Relationship between the Time Axis Setting, Sample Rate and Record Length (for DL1540L)
200
500
1k
2k
5k
10k
20k
50k
100k
200k
500k
1M
2M
5M
10M
20M
50M
100M
100M
100M
100M
100M
100M
100M
100M
100M
100M
20G
20G
20G
20G
100K(200K)
100K(200K)
100K(200K)
100K(200K)
100K(200K)
100K(200K)
100K(200K)
100K(200K)
100K(200K)
100K(200K)
100K
100K
100K
100K
100K
100K
100K
100K
50K
20K
10K
5K
2K
1K
500
200
100
10K
4K
2K
1K
200
500
1k
2k
5k
10k
20k
50k
100k
200k
500k
1M
2M
5M
10M
20M
50M
100M
100M
100M
100M
200M
500M
1G
2G
5G
10G
20G
20G
20G
20G
100K(200K)
100K(200K)
100K(200K)
100K(200K)
100K(200K)
100K(200K)
100K(200K)
100K(200K)
100K(200K)
100K(200K)
100K
100K
100K
100K
100K
100K
100K
100K
50K
20K
10K
10K
10K
10K
10K
10K
10K
10K
4K
2K
1K
200
500
1k
2k
5k
10k
20k
50k
100k
200k
500k
1M
2M
5M
10M
20M
50M
100M
200M
200M
200M
200M
200M
200M
200M
200M
200M
20G
20G
20G
20G
100K(200K)
100K(200K)
100K(200K)
100K(200K)
100K(200K)
100K(200K)
100K(200K)
100K(200K)
100K(200K)
100K(200K)
100K
100K
100K
100K
100K
100K
100K
100K
100K
40K
20K
10K
4K
2K
1K
400
200
10K
4K
2K
1K
200
500
1k
2k
5k
10k
20k
50k
100k
200k
500k
1M
2M
5M
10M
20M
50M
100M
200M
200M
200M
200M
500M
1G
2G
5G
10G
20G
20G
20G
20G
100K(200K)
100K(200K)
100K(200K)
100K(200K)
100K(200K)
100K(200K)
100K(200K)
100K(200K)
100K(200K)
100K(200K)
100K
100K
100K
100K
100K
100K
100K
100K
50K
20K
10K
10K
10K
10K
10K
10K
10K
10K
4K
2K
1K
100M[100 x 2]
100M[250 x 2]
100M[500 x 2]
100M[1k x 2]
100M[2.5k x 2]
100M[5k x 2]
100M[10k x 2]
100M[25k x 2]
100M[50k x 2]
100M[100k x 2]
100M[250k x 2]
100M[500k x 2]
100M[1M x 2]
100M[2.5M x 2]
100M[5M x 2]
100M[10M x 2]
100M[10M x 2]
50K x 2(100K x 2)
50K x 2(100K x 2)
50K x 2(100K x 2)
50K x 2(100K x 2)
50K x 2(100K x 2)
50K x 2(100K x 2)
50K x 2(100K x 2)
50K x 2(100K x 2)
50K x 2(100K x 2)
50K x 2(100K x 2)
50K x 2
50K x 2
50K x 2
50K x 2
50K x 2
50K x 2
20K x 2
T/div
50s
20s
10s
5s
2s
1s
500ms
200ms
100ms
50ms
20ms
10ms
5ms
2ms
1ms
500µs
200µs
100µs
50µs
20µs
10µs
5µs
2µs
1µs
500ns
200ns
100ns
50ns
20ns
10ns
5ns
When "Maximum Displayable Record Length" is set to 100KWRep: Repetitive sampling mode
When Mode other than Envelope Mode is Active
At Least One of CH3, CH4 is ON
Rep: "ON"Rep: "OFF"Rep: "ON"Rep: "OFF"
CH3, CH4 are Both OFF When Envelope Mode is Active
Samplerate(S/s)
Displayedrecord length
(word)
Samplerate(S/s)
Samplerate(S/s)
Samplerate(S/s)
Displayedrecord length
(word)
Displayedrecord length
(word)
Displayedrecord length
(word)
Samplerate(S/s)
Displayedrecord length
(word)
Changes to normal mode,even when envelope modehas been set.
*1 The displayed record length given in ( ) refers to the record length stored in the acquisition memory.
Only when the trigger mode is auto or auto level, data of a record length given in ( ) is stored.
In case where no value in ( ) is given, the displayed record length and the record length stored in the acquisition memory
are the same.
*2 The sample rate given in ( ) for the envelope mode is the rate at which data are acquired after having been sampled at
100MS/s and having taken the minimum and maximum values.
*3 In the envelope mode, the minimum / maximum values are displayed in a pair.
*4 For the setting enclosed by the bold line, repetitive sampling mode is active.
Ro
ll m
od
e d
isp
lay
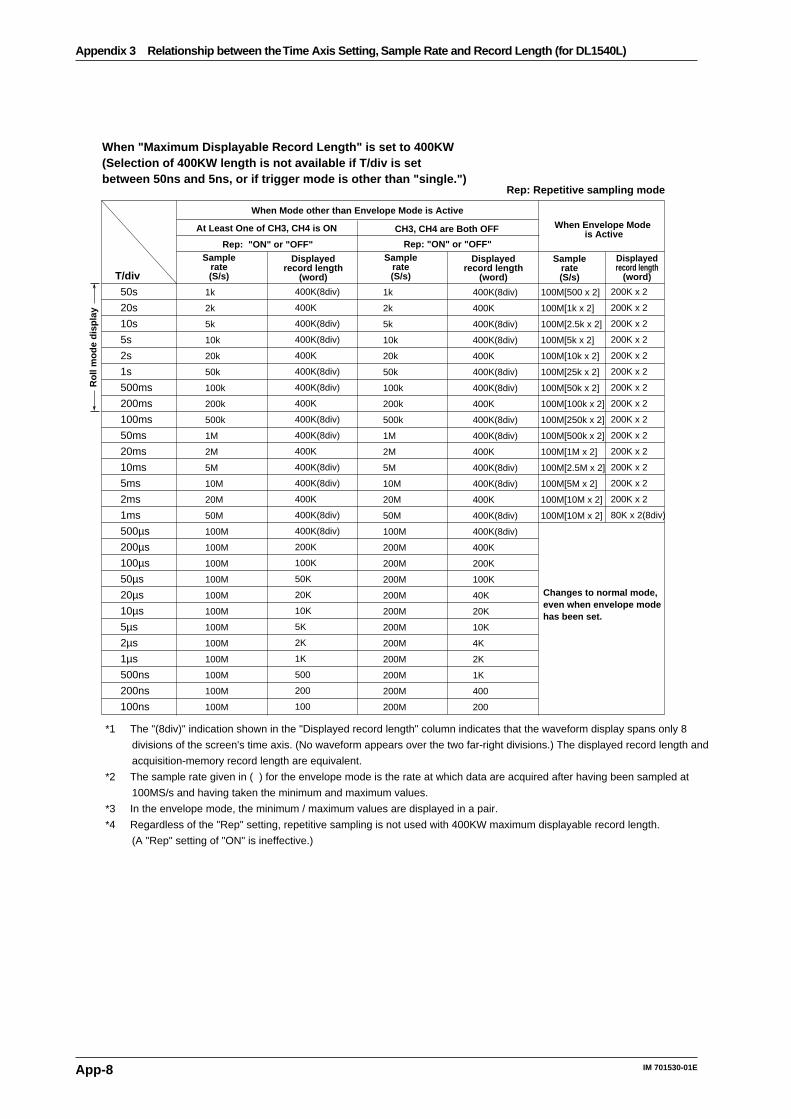
App-8 IM 701530-01E
1k
2k
5k
10k
20k
50k
100k
200k
500k
1M
2M
5M
10M
20M
50M
100M
100M
100M
100M
100M
100M
100M
100M
100M
100M
100M
100M
400K(8div)
400K
400K(8div)
400K(8div)
400K
400K(8div)
400K(8div)
400K
400K(8div)
400K(8div)
400K
400K(8div)
400K(8div)
400K
400K(8div)
400K(8div)
200K
100K
50K
20K
10K
5K
2K
1K
500
200
100
1k
2k
5k
10k
20k
50k
100k
200k
500k
1M
2M
5M
10M
20M
50M
100M
200M
200M
200M
200M
200M
200M
200M
200M
200M
200M
200M
400K(8div)
400K
400K(8div)
400K(8div)
400K
400K(8div)
400K(8div)
400K
400K(8div)
400K(8div)
400K
400K(8div)
400K(8div)
400K
400K(8div)
400K(8div)
400K
200K
100K
40K
20K
10K
4K
2K
1K
400
200
100M[500 x 2]
100M[1k x 2]
100M[2.5k x 2]
100M[5k x 2]
100M[10k x 2]
100M[25k x 2]
100M[50k x 2]
100M[100k x 2]
100M[250k x 2]
100M[500k x 2]
100M[1M x 2]
100M[2.5M x 2]
100M[5M x 2]
100M[10M x 2]
100M[10M x 2]
200K x 2
200K x 2
200K x 2
200K x 2
200K x 2
200K x 2
200K x 2
200K x 2
200K x 2
200K x 2
200K x 2
200K x 2
200K x 2
200K x 2
80K x 2(8div)
T/div
50s
20s
10s
5s
2s
1s
500ms
200ms
100ms
50ms
20ms
10ms
5ms
2ms
1ms
500µs
200µs
100µs
50µs
20µs
10µs
5µs
2µs
1µs
500ns
200ns
100ns
When "Maximum Displayable Record Length" is set to 400KW(Selection of 400KW length is not available if T/div is set between 50ns and 5ns, or if trigger mode is other than "single.")
Rep: Repetitive sampling mode
When Mode other than Envelope Mode is Active
At Least One of CH3, CH4 is ON
Rep: "ON" or "OFF"Rep: "ON" or "OFF"
CH3, CH4 are Both OFF When Envelope Mode is Active
Samplerate(S/s)
Displayedrecord length
(word)
Samplerate(S/s)
Samplerate(S/s)
Displayedrecord length
(word)
Displayedrecord length
(word)
Changes to normal mode,even when envelope modehas been set.
*1 The "(8div)" indication shown in the "Displayed record length" column indicates that the waveform display spans only 8
divisions of the screen's time axis. (No waveform appears over the two far-right divisions.) The displayed record length and
acquisition-memory record length are equivalent.
*2 The sample rate given in ( ) for the envelope mode is the rate at which data are acquired after having been sampled at
100MS/s and having taken the minimum and maximum values.
*3 In the envelope mode, the minimum / maximum values are displayed in a pair.
*4 Regardless of the "Rep" setting, repetitive sampling is not used with 400KW maximum displayable record length.
(A "Rep" setting of "ON" is ineffective.)
Ro
ll m
od
e d
isp
lay
Appendix 3 Relationship between the Time Axis Setting, Sample Rate and Record Length (for DL1540L)
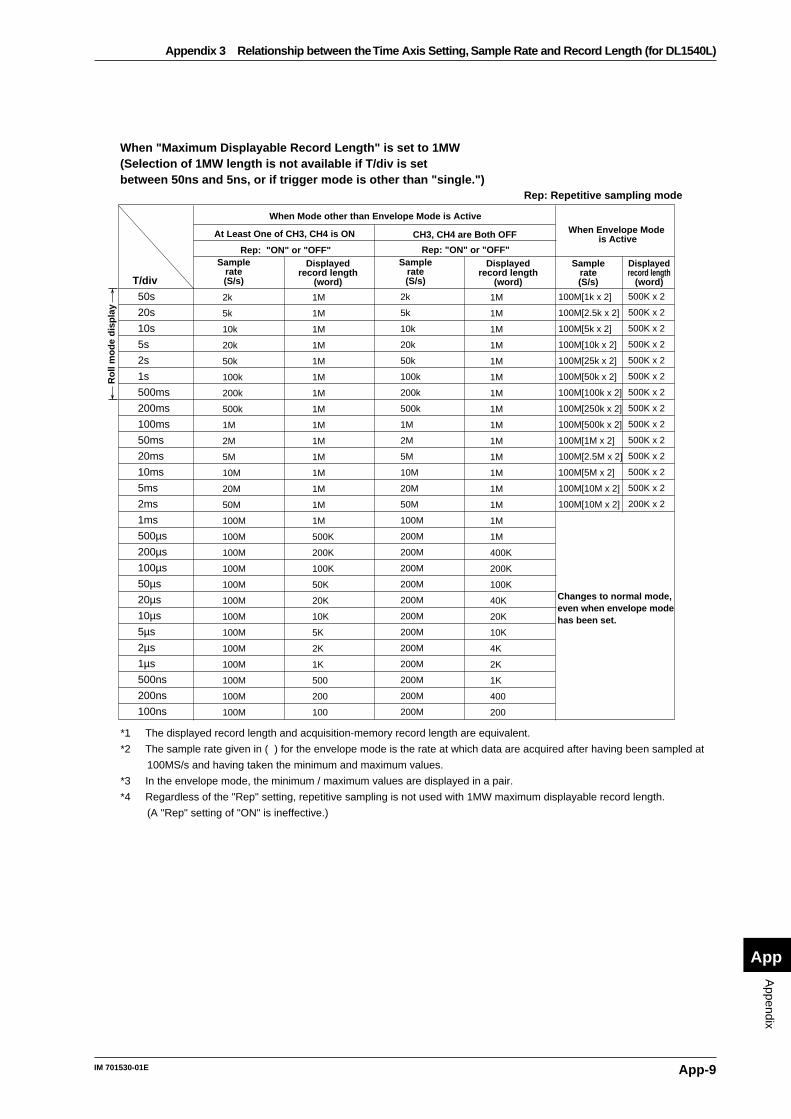
App-9IM 701530-01E
Appendix
App
Appendix 3 Relationship between the Time Axis Setting, Sample Rate and Record Length (for DL1540L)
2k
5k
10k
20k
50k
100k
200k
500k
1M
2M
5M
10M
20M
50M
100M
100M
100M
100M
100M
100M
100M
100M
100M
100M
100M
100M
100M
1M
1M
1M
1M
1M
1M
1M
1M
1M
1M
1M
1M
1M
1M
1M
500K
200K
100K
50K
20K
10K
5K
2K
1K
500
200
100
2k
5k
10k
20k
50k
100k
200k
500k
1M
2M
5M
10M
20M
50M
100M
200M
200M
200M
200M
200M
200M
200M
200M
200M
200M
200M
200M
1M
1M
1M
1M
1M
1M
1M
1M
1M
1M
1M
1M
1M
1M
1M
1M
400K
200K
100K
40K
20K
10K
4K
2K
1K
400
200
100M[1k x 2]
100M[2.5k x 2]
100M[5k x 2]
100M[10k x 2]
100M[25k x 2]
100M[50k x 2]
100M[100k x 2]
100M[250k x 2]
100M[500k x 2]
100M[1M x 2]
100M[2.5M x 2]
100M[5M x 2]
100M[10M x 2]
100M[10M x 2]
500K x 2
500K x 2
500K x 2
500K x 2
500K x 2
500K x 2
500K x 2
500K x 2
500K x 2
500K x 2
500K x 2
500K x 2
500K x 2
200K x 2
T/div
50s
20s
10s
5s
2s
1s
500ms
200ms
100ms
50ms
20ms
10ms
5ms
2ms
1ms
500µs
200µs
100µs
50µs
20µs
10µs
5µs
2µs
1µs
500ns
200ns
100ns
When "Maximum Displayable Record Length" is set to 1MW(Selection of 1MW length is not available if T/div is set between 50ns and 5ns, or if trigger mode is other than "single.")
Rep: Repetitive sampling mode
When Mode other than Envelope Mode is Active
At Least One of CH3, CH4 is ON
Rep: "ON" or "OFF"Rep: "ON" or "OFF"
CH3, CH4 are Both OFF When Envelope Mode is Active
Samplerate(S/s)
Displayedrecord length
(word)
Samplerate(S/s)
Samplerate(S/s)
Displayedrecord length
(word)
Displayedrecord length
(word)
Changes to normal mode,even when envelope modehas been set.
*1 The displayed record length and acquisition-memory record length are equivalent.
*2 The sample rate given in ( ) for the envelope mode is the rate at which data are acquired after having been sampled at
100MS/s and having taken the minimum and maximum values.
*3 In the envelope mode, the minimum / maximum values are displayed in a pair.
*4 Regardless of the "Rep" setting, repetitive sampling is not used with 1MW maximum displayable record length.
(A "Rep" setting of "ON" is ineffective.)
Ro
ll m
od
e d
isp
lay
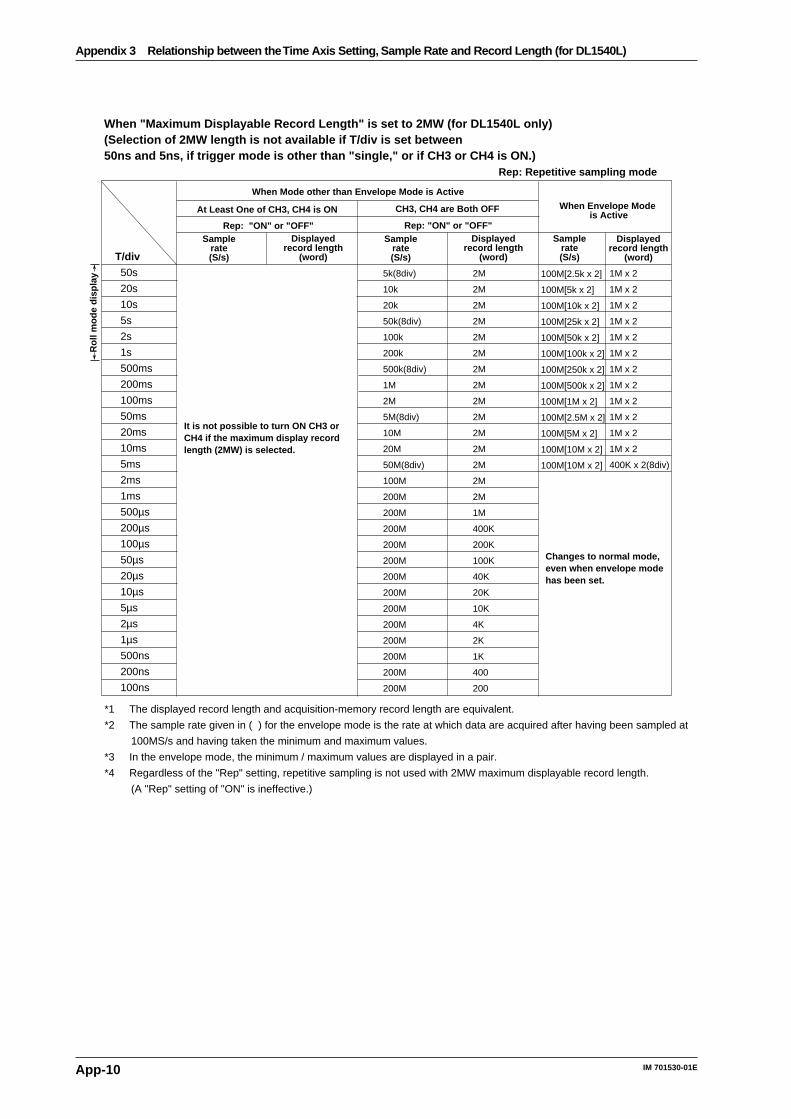
App-10 IM 701530-01E
Appendix 3 Relationship between the Time Axis Setting, Sample Rate and Record Length (for DL1540L)
5k(8div)
10k
20k
50k(8div)
100k
200k
500k(8div)
1M
2M
5M(8div)
10M
20M
50M(8div)
100M
200M
200M
200M
200M
200M
200M
200M
200M
200M
200M
200M
200M
200M
2M
2M
2M
2M
2M
2M
2M
2M
2M
2M
2M
2M
2M
2M
2M
1M
400K
200K
100K
40K
20K
10K
4K
2K
1K
400
200
100M[2.5k x 2]
100M[5k x 2]
100M[10k x 2]
100M[25k x 2]
100M[50k x 2]
100M[100k x 2]
100M[250k x 2]
100M[500k x 2]
100M[1M x 2]
100M[2.5M x 2]
100M[5M x 2]
100M[10M x 2]
100M[10M x 2]
1M x 2
1M x 2
1M x 2
1M x 2
1M x 2
1M x 2
1M x 2
1M x 2
1M x 2
1M x 2
1M x 2
1M x 2
400K x 2(8div)
T/div
50s
20s
10s
5s
2s
1s
500ms
200ms
100ms
50ms
20ms
10ms
5ms
2ms
1ms
500µs
200µs
100µs
50µs
20µs
10µs
5µs
2µs
1µs
500ns
200ns
100ns
When "Maximum Displayable Record Length" is set to 2MW (for DL1540L only)(Selection of 2MW length is not available if T/div is set between 50ns and 5ns, if trigger mode is other than "single," or if CH3 or CH4 is ON.)
Rep: Repetitive sampling mode
When Mode other than Envelope Mode is Active
At Least One of CH3, CH4 is ON
Rep: "ON" or "OFF"Rep: "ON" or "OFF"
CH3, CH4 are Both OFF
Samplerate(S/s)
Samplerate(S/s)
Samplerate(S/s)
Displayedrecord length
(word)
Displayedrecord length
(word)
Displayedrecord length
(word)
When Envelope Mode is Active
Changes to normal mode,even when envelope modehas been set.
*1 The displayed record length and acquisition-memory record length are equivalent.
*2 The sample rate given in ( ) for the envelope mode is the rate at which data are acquired after having been sampled at
100MS/s and having taken the minimum and maximum values.
*3 In the envelope mode, the minimum / maximum values are displayed in a pair.
*4 Regardless of the "Rep" setting, repetitive sampling is not used with 2MW maximum displayable record length.
(A "Rep" setting of "ON" is ineffective.)
It is not possible to turn ON CH3 orCH4 if the maximum display recordlength (2MW) is selected.
Ro
ll m
od
e d
isp
lay
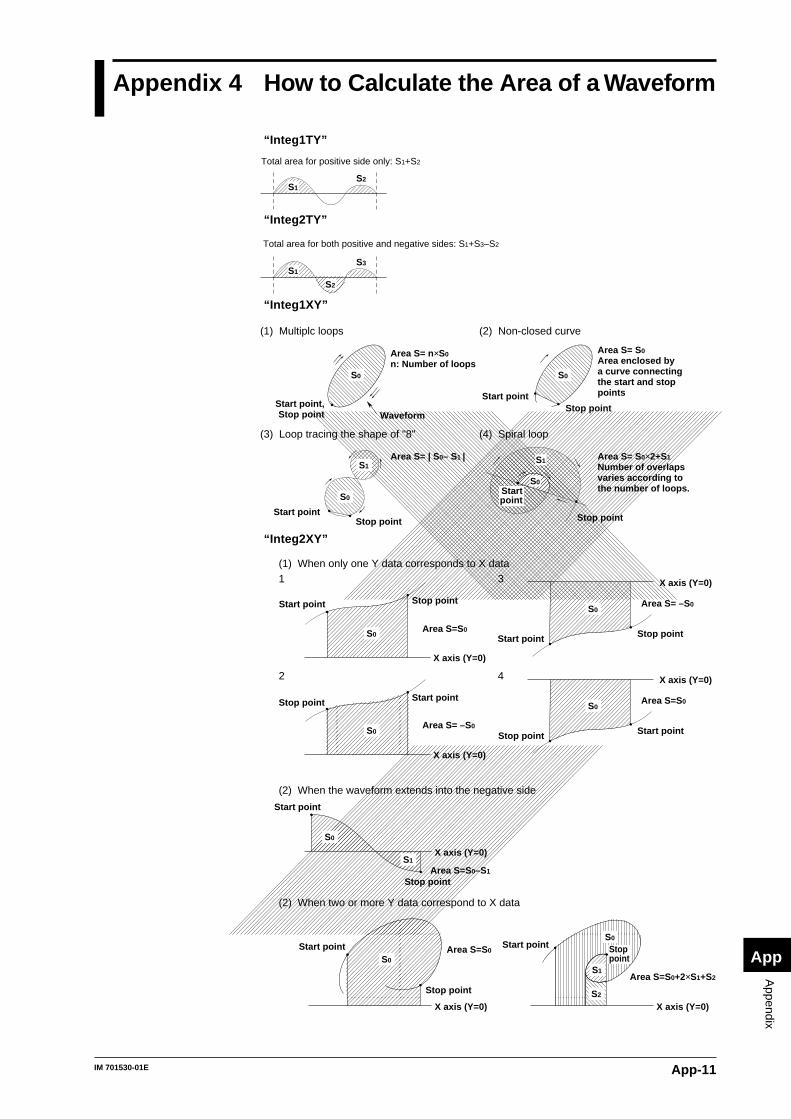
App-11IM 701530-01E
Appendix
App
Appendix 4 How to Calculate the Area of a Waveform
“Integ1TY”
Total area for positive side only: S1+S2
S1S2
“Integ2TY”
Total area for both positive and negative sides: S1+S3–S2
S1S3
S2
“Integ1XY”
(1) Multiplc loops
S0
Start point,Stop point
Area S= n×S0
n: Number of loops
(2) Non-closed curve
S0
Start point
Area S= S0
Area enclosed by a curve connecting the start and stop points
Stop point
(3) Loop tracing the shape of "8"
Area S= | S0– S1 |
(4) Spiral loop
Area S= S0×2+S1
Number of overlaps varies according to the number of loops.
Stop point
S0
S1
Start pointStop point
Startpoint
S0
Waveform
S1
“Integ2XY”
(1) When only one Y data corresponds to X data1 3
Start point
Stop point
S0Area S=S0
X axis (Y=0)
X axis (Y=0)
Area S= –S0
Stop pointStart point
S0
2 4
Stop point Start point
S0
Area S=S0–S1
X axis (Y=0)
X axis (Y=0)
Area S=S0
Start pointStop point
S0
(2) When the waveform extends into the negative side
X axis (Y=0)
S0
S1
Start point
Stop point
(2) When two or more Y data correspond to X data
X axis (Y=0)
S0
Start point
Stop point
Area S=S0
X axis (Y=0)
S0
Stoppoint
Start point
Area S=S0+2×S1+S2S1
S2
Area S= –S0
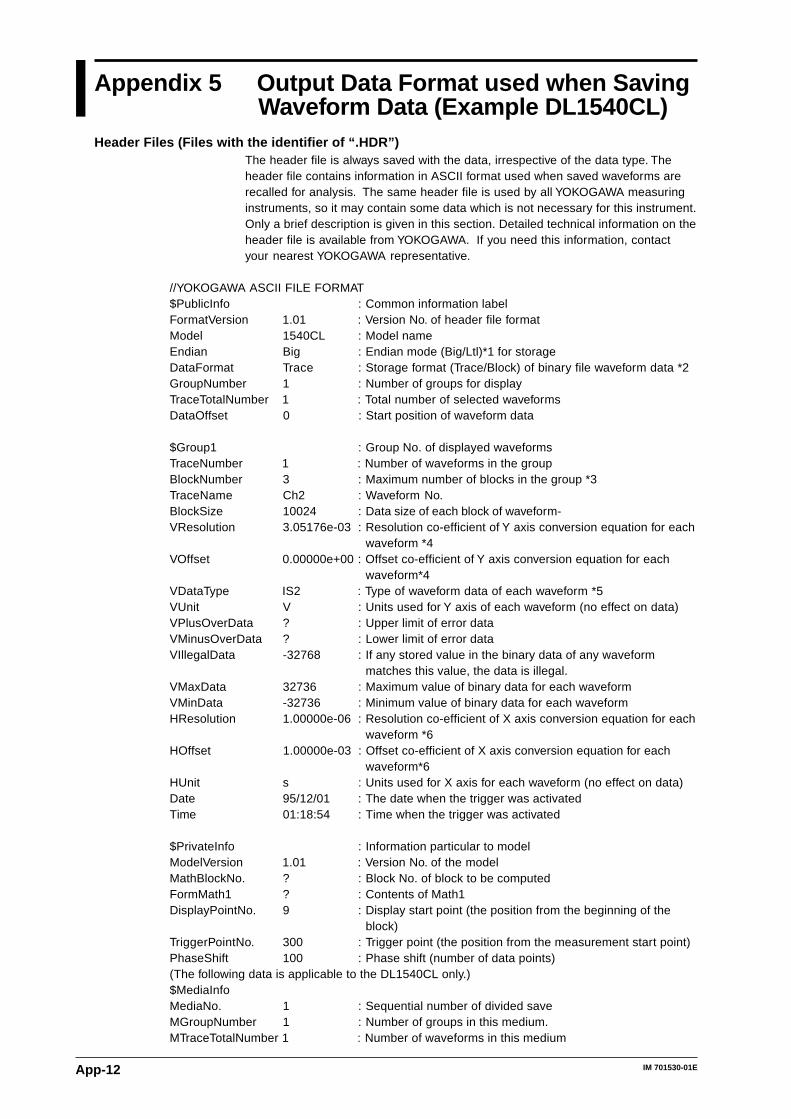
App-12 IM 701530-01E
Appendix 5 Output Data Format used when SavingWaveform Data (Example DL1540CL)
Header Files (Files with the identifier of “.HDR”)The header file is always saved with the data, irrespective of the data type. Theheader file contains information in ASCII format used when saved waveforms arerecalled for analysis. The same header file is used by all YOKOGAWA measuringinstruments, so it may contain some data which is not necessary for this instrument.Only a brief description is given in this section. Detailed technical information on theheader file is available from YOKOGAWA. If you need this information, contactyour nearest YOKOGAWA representative.
//YOKOGAWA ASCII FILE FORMAT$PublicInfo : Common information labelFormatVersion 1.01 : Version No. of header file formatModel 1540CL : Model nameEndian Big : Endian mode (Big/Ltl)*1 for storageDataFormat Trace : Storage format (Trace/Block) of binary file waveform data *2GroupNumber 1 : Number of groups for displayTraceTotalNumber 1 : Total number of selected waveformsDataOffset 0 : Start position of waveform data
$Group1 : Group No. of displayed waveformsTraceNumber 1 : Number of waveforms in the groupBlockNumber 3 : Maximum number of blocks in the group *3TraceName Ch2 : Waveform No.BlockSize 10024 : Data size of each block of waveform-VResolution 3.05176e-03 : Resolution co-efficient of Y axis conversion equation for each
waveform *4VOffset 0.00000e+00 : Offset co-efficient of Y axis conversion equation for each
waveform*4VDataType IS2 : Type of waveform data of each waveform *5VUnit V : Units used for Y axis of each waveform (no effect on data)VPlusOverData ? : Upper limit of error dataVMinusOverData ? : Lower limit of error dataVIllegalData -32768 : If any stored value in the binary data of any waveform
matches this value, the data is illegal.VMaxData 32736 : Maximum value of binary data for each waveformVMinData -32736 : Minimum value of binary data for each waveformHResolution 1.00000e-06 : Resolution co-efficient of X axis conversion equation for each
waveform *6HOffset 1.00000e-03 : Offset co-efficient of X axis conversion equation for each
waveform*6HUnit s : Units used for X axis for each waveform (no effect on data)Date 95/12/01 : The date when the trigger was activatedTime 01:18:54 : Time when the trigger was activated
$PrivateInfo : Information particular to modelModelVersion 1.01 : Version No. of the modelMathBlockNo. ? : Block No. of block to be computedFormMath1 ? : Contents of Math1DisplayPointNo. 9 : Display start point (the position from the beginning of the
block)TriggerPointNo. 300 : Trigger point (the position from the measurement start point)PhaseShift 100 : Phase shift (number of data points)(The following data is applicable to the DL1540CL only.)$MediaInfoMediaNo. 1 : Sequential number of divided saveMGroupNumber 1 : Number of groups in this medium.MTraceTotalNumber 1 : Number of waveforms in this medium
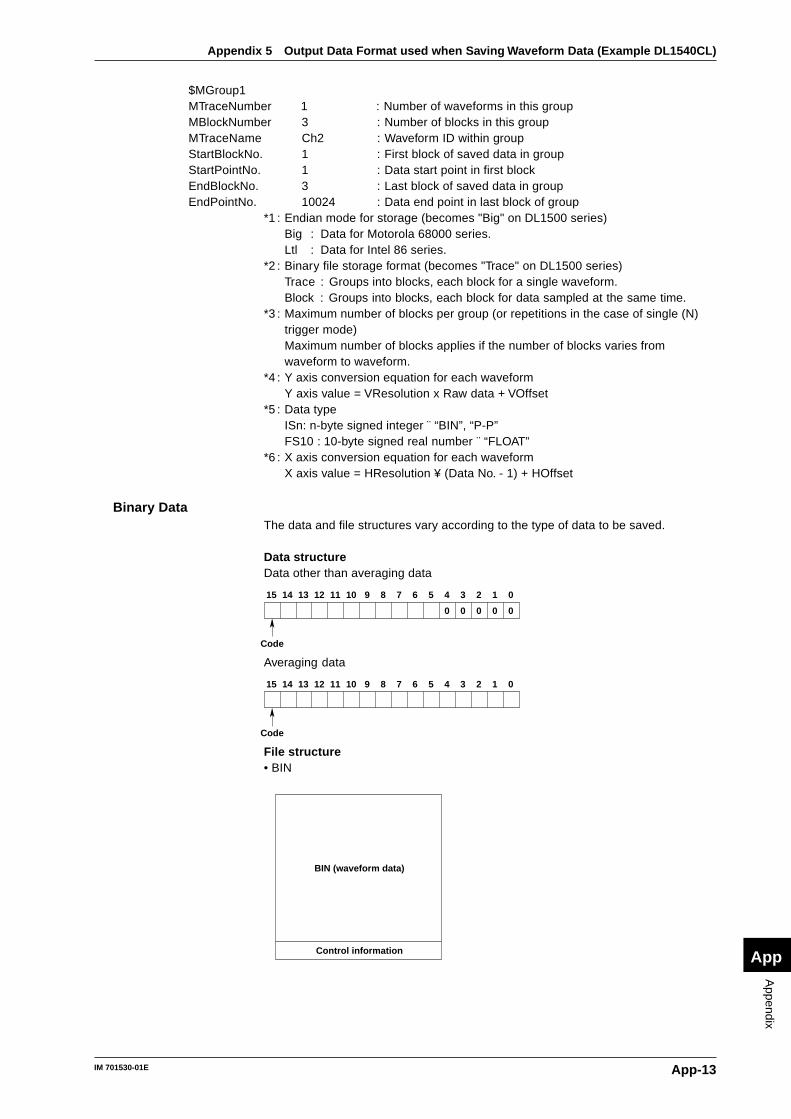
App-13IM 701530-01E
Appendix
App
$MGroup1MTraceNumber 1 : Number of waveforms in this groupMBlockNumber 3 : Number of blocks in this groupMTraceName Ch2 : Waveform ID within groupStartBlockNo. 1 : First block of saved data in groupStartPointNo. 1 : Data start point in first blockEndBlockNo. 3 : Last block of saved data in groupEndPointNo. 10024 : Data end point in last block of group
*1 : Endian mode for storage (becomes "Big" on DL1500 series)Big : Data for Motorola 68000 series.Ltl : Data for Intel 86 series.
*2 : Binary file storage format (becomes "Trace" on DL1500 series)Trace : Groups into blocks, each block for a single waveform.Block : Groups into blocks, each block for data sampled at the same time.
*3 : Maximum number of blocks per group (or repetitions in the case of single (N)trigger mode)Maximum number of blocks applies if the number of blocks varies fromwaveform to waveform.
*4 : Y axis conversion equation for each waveformY axis value = VResolution x Raw data + VOffset
*5 : Data typeISn: n-byte signed integer ¨ “BIN”, “P-P”FS10 : 10-byte signed real number ¨ “FLOAT”
*6 : X axis conversion equation for each waveformX axis value = HResolution ¥ (Data No. - 1) + HOffset
Binary DataThe data and file structures vary according to the type of data to be saved.
Data structureData other than averaging data
15 14 13 12 11 10 9 8 7 6 5 4
0
3
0
2
0
1
0
0
0
Code
Averaging data
15 14 13 12 11 10 9 8 7 6 5 4 3 2 1 0
Code
File structure• BIN
BIN (waveform data)
Control information
Appendix 5 Output Data Format used when Saving Waveform Data (Example DL1540CL)
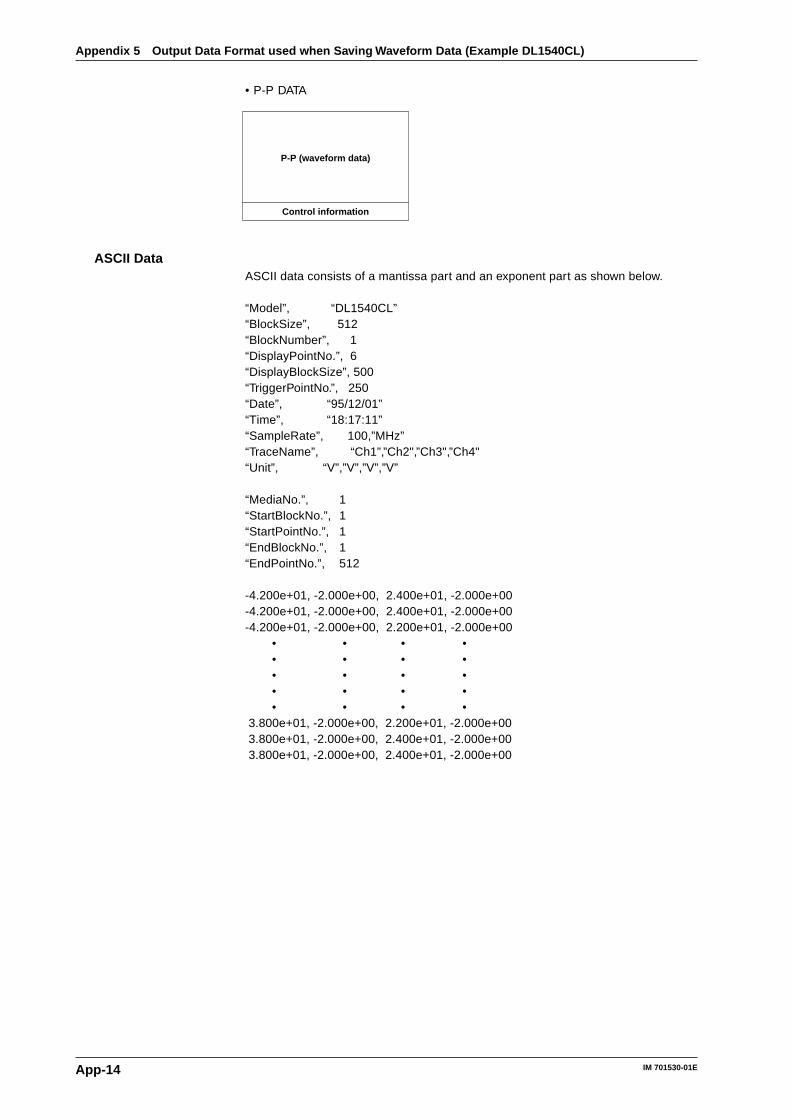
App-14 IM 701530-01E
Appendix 5 Output Data Format used when Saving Waveform Data (Example DL1540CL)
• P-P DATA
P-P (waveform data)
Control information
ASCII DataASCII data consists of a mantissa part and an exponent part as shown below.
“Model”, “DL1540CL”“BlockSize”, 512“BlockNumber”, 1“DisplayPointNo.”, 6“DisplayBlockSize”, 500“TriggerPointNo.”, 250“Date”, “95/12/01”“Time”, “18:17:11”“SampleRate”, 100,”MHz”“TraceName”, “Ch1”,”Ch2",”Ch3",”Ch4"“Unit”, “V”,”V”,”V”,”V”
“MediaNo.”, 1“StartBlockNo.”, 1“StartPointNo.”, 1“EndBlockNo.”, 1“EndPointNo.”, 512
-4.200e+01, -2.000e+00, 2.400e+01, -2.000e+00-4.200e+01, -2.000e+00, 2.400e+01, -2.000e+00-4.200e+01, -2.000e+00, 2.200e+01, -2.000e+00
• • • • • • • • • • • • • • • • • • • •
3.800e+01, -2.000e+00, 2.200e+01, -2.000e+00 3.800e+01, -2.000e+00, 2.400e+01, -2.000e+00 3.800e+01, -2.000e+00, 2.400e+01, -2.000e+00
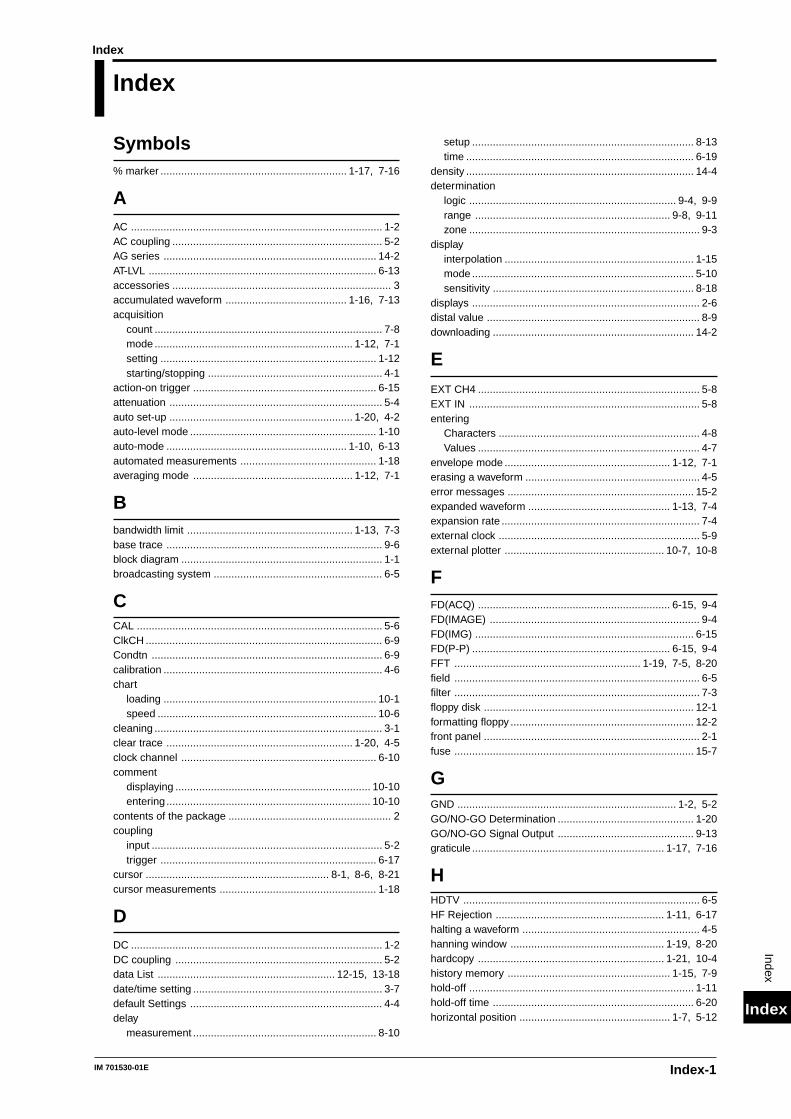
Index-1IM 701530-01E
Index
Index
Index
Index
Symbols% marker ............................................................... 1-17, 7-16
AAC ..................................................................................... 1-2AC coupling ....................................................................... 5-2AG series ........................................................................ 14-2AT-LVL ............................................................................. 6-13accessories .......................................................................... 3accumulated waveform ......................................... 1-16, 7-13acquisition
count ............................................................................. 7-8mode ................................................................... 1-12, 7-1setting ......................................................................... 1-12starting/stopping ........................................................... 4-1
action-on trigger .............................................................. 6-15attenuation ........................................................................ 5-4auto set-up .............................................................. 1-20, 4-2auto-level mode ............................................................... 1-10auto-mode ............................................................. 1-10, 6-13automated measurements .............................................. 1-18averaging mode ...................................................... 1-12, 7-1
Bbandwidth limit ........................................................ 1-13, 7-3base trace ......................................................................... 9-6block diagram .................................................................... 1-1broadcasting system ......................................................... 6-5
CCAL ................................................................................... 5-6ClkCH ................................................................................ 6-9Condtn .............................................................................. 6-9calibration .......................................................................... 4-6chart
loading ........................................................................ 10-1speed .......................................................................... 10-6
cleaning ............................................................................. 3-1clear trace ............................................................... 1-20, 4-5clock channel .................................................................. 6-10comment
displaying .................................................................. 10-10entering ..................................................................... 10-10
contents of the package ....................................................... 2coupling
input .............................................................................. 5-2trigger ......................................................................... 6-17
cursor .............................................................. 8-1, 8-6, 8-21cursor measurements ..................................................... 1-18
DDC ..................................................................................... 1-2DC coupling ...................................................................... 5-2data List ............................................................ 12-15, 13-18date/time setting ................................................................ 3-7default Settings ................................................................. 4-4delay
measurement .............................................................. 8-10
setup ........................................................................... 8-13time ............................................................................. 6-19
density ............................................................................. 14-4determination
logic ...................................................................... 9-4, 9-9range .................................................................. 9-8, 9-11zone .............................................................................. 9-3
displayinterpolation ................................................................ 1-15mode ........................................................................... 5-10sensitivity .................................................................... 8-18
displays ............................................................................. 2-6distal value ........................................................................ 8-9downloading .................................................................... 14-2
EEXT CH4 ........................................................................... 5-8EXT IN .............................................................................. 5-8entering
Characters .................................................................... 4-8Values ........................................................................... 4-7
envelope mode ........................................................ 1-12, 7-1erasing a waveform ........................................................... 4-5error messages ............................................................... 15-2expanded waveform ................................................ 1-13, 7-4expansion rate ................................................................... 7-4external clock .................................................................... 5-9external plotter ...................................................... 10-7, 10-8
FFD(ACQ) ................................................................. 6-15, 9-4FD(IMAGE) ....................................................................... 9-4FD(IMG) .......................................................................... 6-15FD(P-P) ................................................................... 6-15, 9-4FFT ............................................................... 1-19, 7-5, 8-20field ................................................................................... 6-5filter ................................................................................... 7-3floppy disk ....................................................................... 12-1formatting floppy .............................................................. 12-2front panel ......................................................................... 2-1fuse ................................................................................. 15-7
GGND .......................................................................... 1-2, 5-2GO/NO-GO Determination .............................................. 1-20GO/NO-GO Signal Output .............................................. 9-13graticule ................................................................. 1-17, 7-16
HHDTV ................................................................................ 6-5HF Rejection ......................................................... 1-11, 6-17halting a waveform ............................................................ 4-5hanning window .................................................... 1-19, 8-20hardcopy ............................................................... 1-21, 10-4history memory ....................................................... 1-15, 7-9hold-off ............................................................................ 1-11hold-off time .................................................................... 6-20horizontal position ................................................... 1-7, 5-12
Index-2 IM 701530-01E
Index
IINT .................................................................................... 5-8image data ........................................................ 12-11, 13-13information .................................................. 7-17, 10-4, 14-3initialization ............................................................. 1-20, 4-4input coupling ............................................................ 1-2, 5-2input filter ................................................................ 1-13, 7-3installation ......................................................................... 3-2intensity ................................................................. 1-17, 7-18interpolation .......................................................... 1-15, 7-12inverted waveform ..................................................... 1-3, 5-5
Kkeyboard ........................................................................... 4-8
LLINE ................................................................................ 7-12linear scaling ......................................................... 1-18, 8-16loading
setting parameters .......................................... 12-9, 13-11waveform data .................................................. 12-4, 13-6
long copy ......................................................................... 10-5
MMODEL ................................................................................ 2MainZoom display ................................................... 1-14, 7-4math ...................................................................... 1-19, 8-18measurement
automated ........................................................... 1-18, 8-8cursor .................................................................. 1-18, 8-1
menu map .................................................................... App-1mesial value ...................................................................... 8-9moving range .......................................................... 5-7, 5-12
N
N-SGL ............................................................................. 6-14NTSC ................................................................................ 6-5normal mode ................................................. 1-10, 6-13, 7-1
O
OR Trigger ......................................................................... 6-8offset voltage ..................................................................... 5-2options ................................................................................. 2output signal .................................................................... 14-1
PPAL .................................................................................... 6-5PULSE ............................................................................ 7-12paper size ............................................... 10-9, 12-12, 13-15pen
mode ........................................................................... 10-9speed .......................................................................... 10-9
phase correction ............................................................... 3-6phase shift ....................................................................... 8-18plotter .............................................................................. 10-7polarity .............................................................................. 6-5power cord
connecting .................................................................... 3-3suffix code ....................................................................... 2
power spectrum .......................................... 1-19, 8-20, 8-21power switch ..................................................................... 3-4
precautions ....................................................................... 3-1printer .................................................................. 10-1, 10-11printer density ................................................................. 14-4printing
real-time ............................................................ 1-21, 10-6waveforms ........................................................ 10-3, 10-8
probeattenuation .................................................... 1-2, 3-5, 5-4connecting .................................................................... 3-5phase correction ........................................................... 3-6
protecting .......................................................... 12-14, 13-17proximal value ................................................................... 8-9
RROM version ................................................................... 14-3real-time printing ................................................... 1-21, 10-6real-time sampling mode ................................................... 1-6rear panel .................................................................. 2-1, 2-2recalling
setting parameters ............................................ 1-21, 11-3waveforms ........................................................ 1-21, 11-1
record length ................................................................... 5-11reference waveform ......................................................... 8-10rejection HF ........................................................... 1-11, 6-17repetitive ............................................................................ 7-2repetitive sampling mode .................................................. 1-6resolution ................................................................ 5-7, 5-12roll mode ......................................................................... 5-12
SSINE ................................................................................ 7-12safety precautions ................................................................ 5sample rate ...................................................... App-2, App-5sampling mode .............................................. 1-12, 5-10, 7-1sampling point ................................................................... 1-6saving
screen image data ........................................ 12-11, 13-13setting parameters .......................................... 12-9, 13-11waveform data .................................................. 12-4, 13-6
scale ...................................................................... 1-17, 7-16screen intensity ............................................................... 7-18self test ............................................................................ 15-6sequential store ....................................................... 1-14, 7-7setting parameters .......................................................... 11-3setting values .................................................................... 4-7short copy ....................................................................... 10-4signal flow ......................................................................... 1-1single (N) mode ..................................................... 1-10, 6-14single (short) mode ............................................... 1-10, 6-13single long mode ................................................... 1-10, 6-14smoothing ............................................................... 1-13, 7-3snapshot ................................................................. 1-20, 4-5source ............................................................................. 11-1spare parts ........................................................................... 4storing
setting parameters ............................................ 1-21, 11-3waveforms ........................................................ 1-21, 11-1
suffix code ............................................................................ 2system condition ............................................................. 14-3system configuration ......................................................... 1-1
TT/div ................................................................................ 5-10TIMEOUT ........................................................................ 6-11
Index-3IM 701530-01E
Index
Index
Index
test .................................................................................. 15-6threshold level ................................................................... 5-8time axis .................................................................. 1-4, 5-10time stamp ................................................................ 7-7, 7-9timebase ................................................................... 1-4, 5-8trigger
action-on ........................................................... 1-10, 6-15coupling ............................................................ 1-10, 6-17delay ....................................................... 1-11, 6-18, 6-19EXT ............................................................................... 6-2edge ...................................................................... 1-8, 6-2hold-off ........................................................................ 1-11LINE .............................................................................. 6-3level ...................................................................... 1-8, 6-1mode ................................................................. 1-10, 6-13OR ........................................................................ 1-9, 6-8output signal ............................................................... 14-1pattern .................................................................. 1-9, 6-9point ............................................................................ 6-18position ............................................................. 1-11, 6-18setting ........................................................................... 1-8source ................................................................... 1-8, 6-1TV ......................................................................... 1-8, 6-5type ....................................................................... 1-8, 6-1width ................................................................... 1-9, 6-11window .................................................................. 1-8, 6-4
troubleshooting ................................................................ 15-1type name ............................................................................ 2
Uunit
conventions ...................................................................... 8of linear scaling ........................................................... 8-17
V
VAR ................................................................................... 5-6variable .............................................................................. 5-6version ............................................................................. 14-3vertical position ......................................................... 1-4, 5-7vertical sensitivity .............................................. 1-3, 5-2, 5-6
WWide Scrn ....................................................................... 7-11waveform
accumulation .............................................................. 7-13Computation ............................................................... 8-20computation ................................................................ 8-18display ON/OFF ............................................................ 5-1erasing .......................................................................... 4-5expansion ........................................................... 1-13, 7-4halting ........................................................................... 4-5information ........................................................ 7-17, 10-3inversion ............................................................... 1-3, 5-5loading .............................................................. 12-4, 13-6math .................................................................. 1-19, 8-18Printing ....................................................................... 10-3parameters ................................................................... 8-8recalling ...................................................................... 11-1saving ............................................................... 12-4, 13-6storing ......................................................................... 11-1X-Y .............................................................................. 7-15
zone .............................................................................. 9-1zooming ........................................................................ 7-4
wide screen ..................................................................... 7-11
X
X-Y waveform display ............................................ 1-16, 7-15X-Y waveform measurement ............................................. 8-6
ZZOOM display ................................................................. 1-14zooming waveforms .......................................................... 7-4