district accountability update may 2006 - february 2007
TRANSCRIPT


District Accountability Update
May 2006 - February 2007
District Accountability Results
Districts provided three sets of accountability resultsDistrict Performance Score (DPS) –
calculated in same manner as a School Performance Score
District Responsibility Indicators – three separate indicators
District Subgroup Component – used to determine if the district’s subgroups made Adequate Yearly Progress (AYP)
Bulletin 111, Chapter 43
District Performance Scores
Bulletin 111, Section 4317
♦ Calculated in the same manner as School Performance Scores
♦ Do not include assessment results for students displaced by the hurricanes
♦ Include one year of assessment data (2005-06) and one year of attendance and dropout data (2004-05)
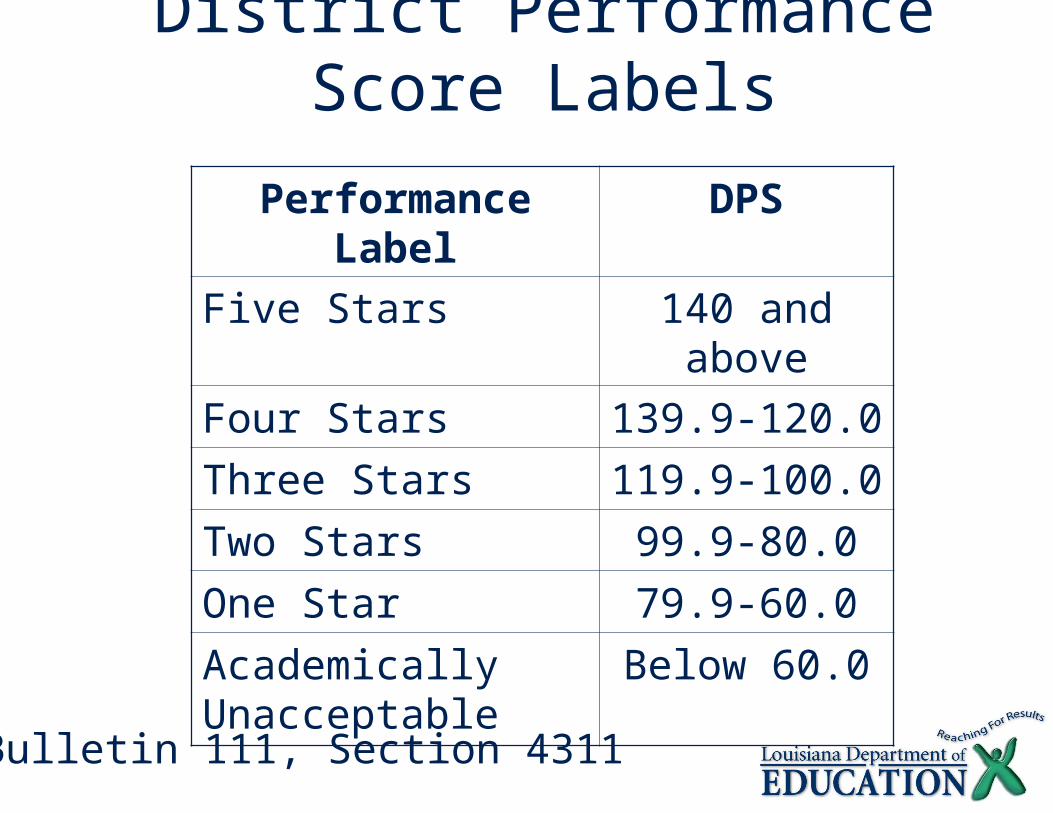
District Performance Score Labels
Performance Label
DPS
Five Stars 140 and above
Four Stars 139.9-120.0
Three Stars 119.9-100.0
Two Stars 99.9-80.0
One Star 79.9-60.0
Academically Unacceptable
Below 60.0
Bulletin 111, Section 4311

District Responsibility Indicators
For the 2006 District Accountability results, the District Responsibility Index (DRI) and the labels associated with it have been eliminated
Three separate District Responsibility Indicators have been added
•Teacher Certification Indicator
•8th Grade Persistence Indicator
•Financial Risk IndicatorBulletin 111, Sections 4301
Teacher Certification Indicator
Based on the percentage of state core classes taught by three categories of teachers
•Standard Teaching Certificate for area of assignment
•Non-Standard Teaching Certificate – Out of Field or Temporary Authority (OFAT, TAT, TEP)
•No Authority to Teach (No Certification)
Bulletin 111, Section 4302
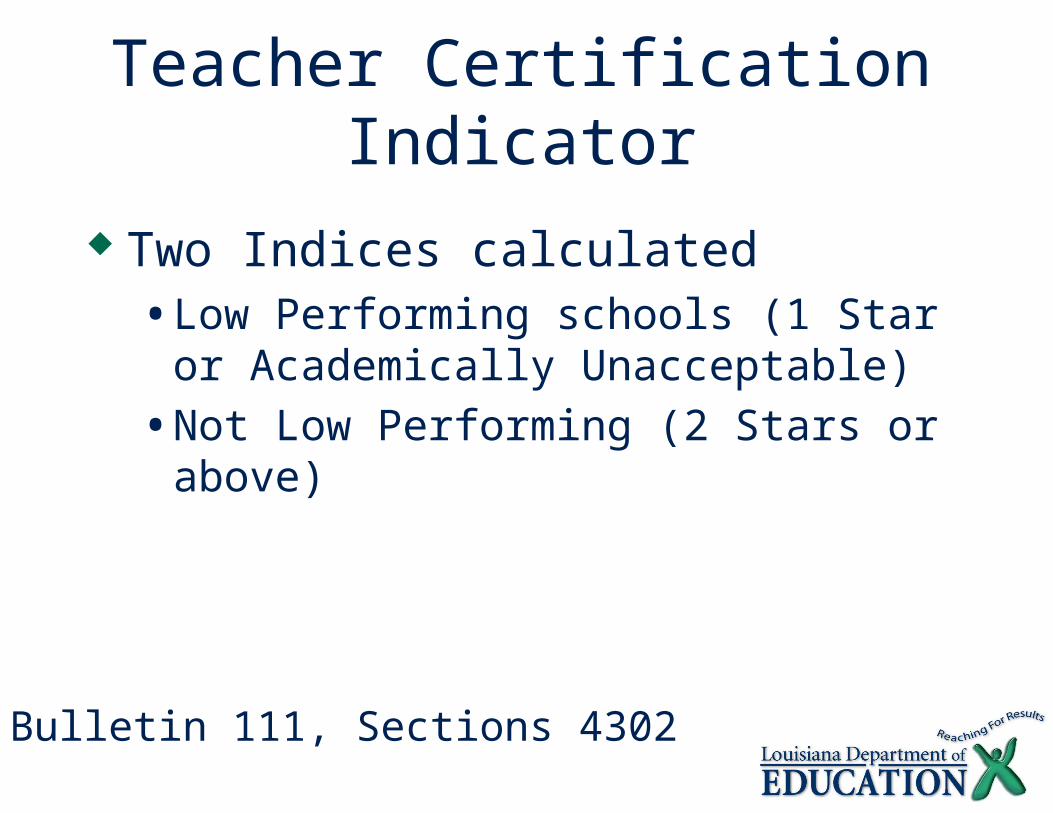
Teacher Certification Indicator
Two Indices calculated•Low Performing schools (1 Star or
Academically Unacceptable)•Not Low Performing (2 Stars or
above)
Bulletin 111, Sections 4302
Teacher Certification Indicator
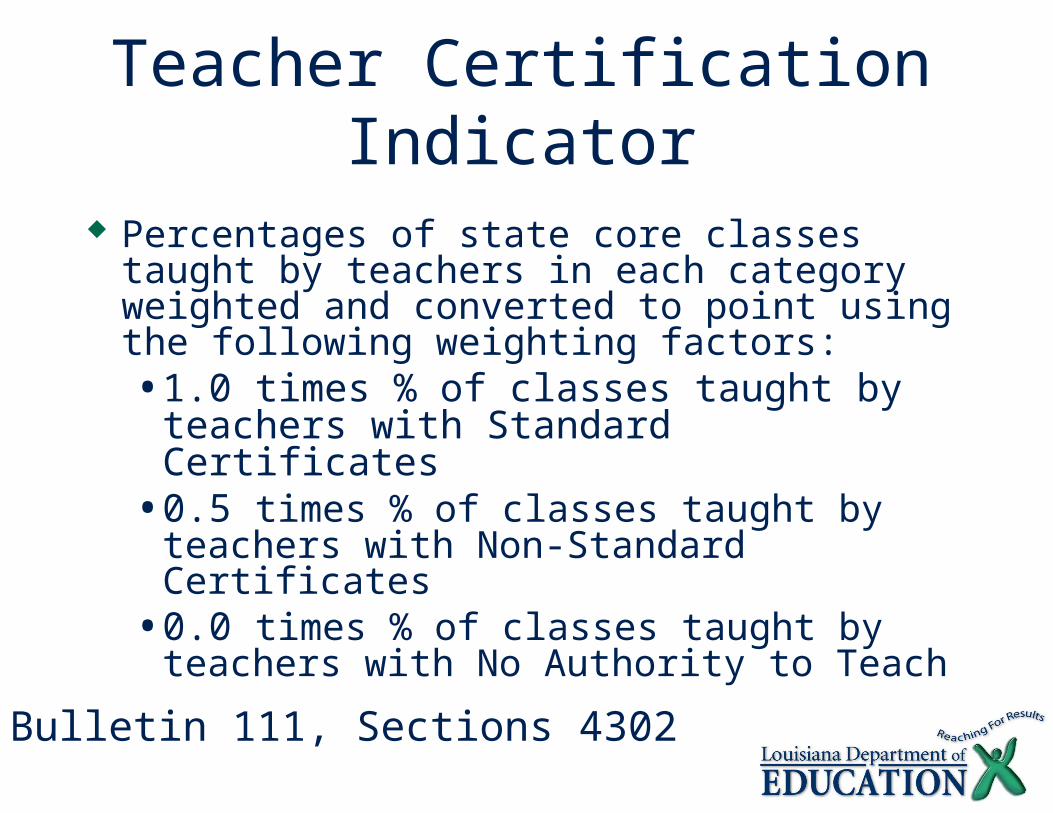
Percentages of state core classes taught by teachers in each category weighted and converted to point using the following weighting factors:•1.0 times % of classes taught by
teachers with Standard Certificates•0.5 times % of classes taught by
teachers with Non-Standard Certificates
•0.0 times % of classes taught by teachers with No Authority to Teach
Bulletin 111, Sections 4302

Teacher Certification Indicator
Weighted points are summed for Low Performing schools and again for Non-Low Performing schools
Total points for Low Performing schools are weighted by 75%
Total points for Non-Low Performing schools are weighted by 25%
Indicator value is the sum of the weighted total points for Low and Non-Low Performing schools
Bulletin 111, Sections 4302
Teacher Certification Indicator
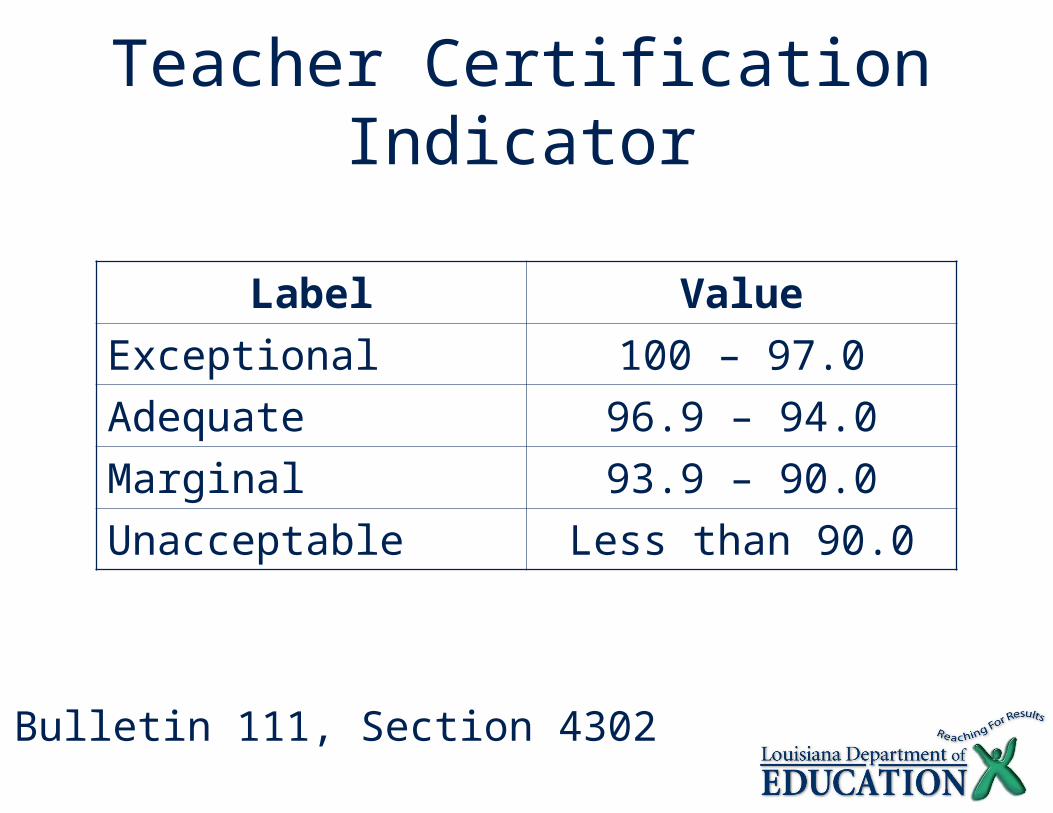
Label Value
Exceptional 100 – 97.0
Adequate 96.9 – 94.0
Marginal 93.9 – 90.0
Unacceptable Less than 90.0
Bulletin 111, Section 4302

8th Grade Persistence Indicator
Based upon a district’s success in keeping 8th grade students enrolled (not drop out)
Uses two years of data (2006 results are based on data from the years 2003-04 and 2004-05)
Bulletin 111, Sections 4302
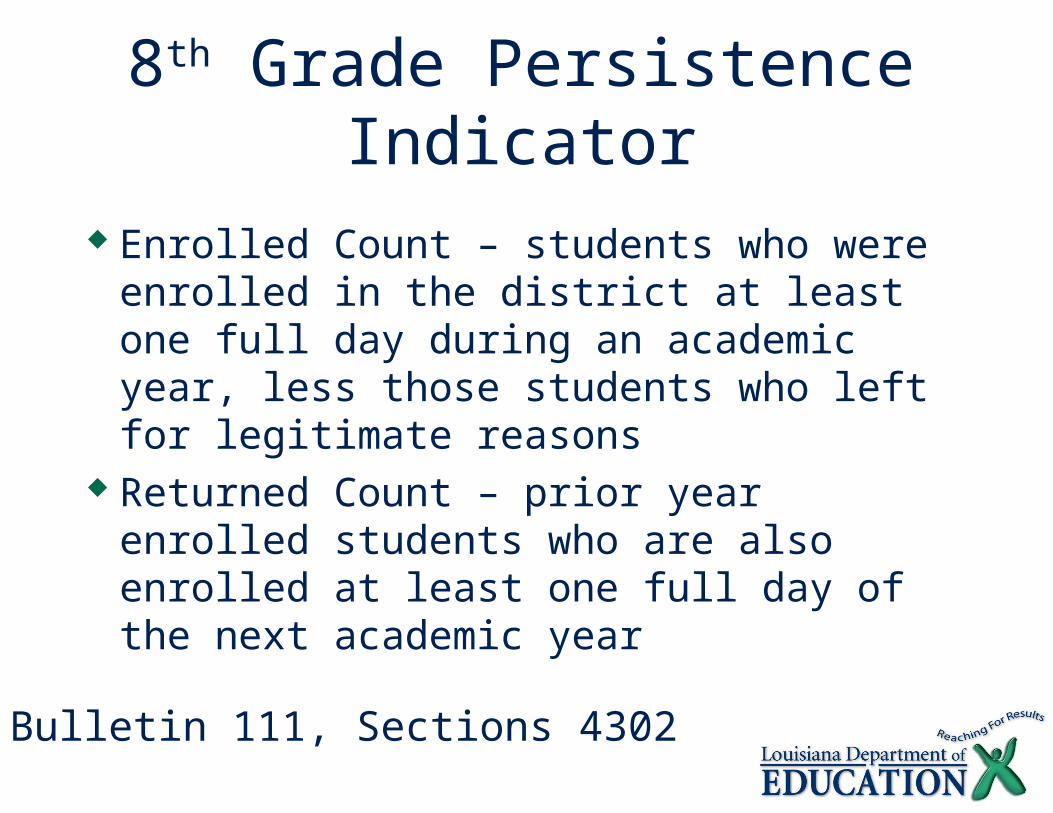
8th Grade Persistence Indicator
Enrolled Count – students who were enrolled in the district at least one full day during an academic year, less those students who left for legitimate reasons
Returned Count – prior year enrolled students who are also enrolled at least one full day of the next academic yearBulletin 111, Sections 4302
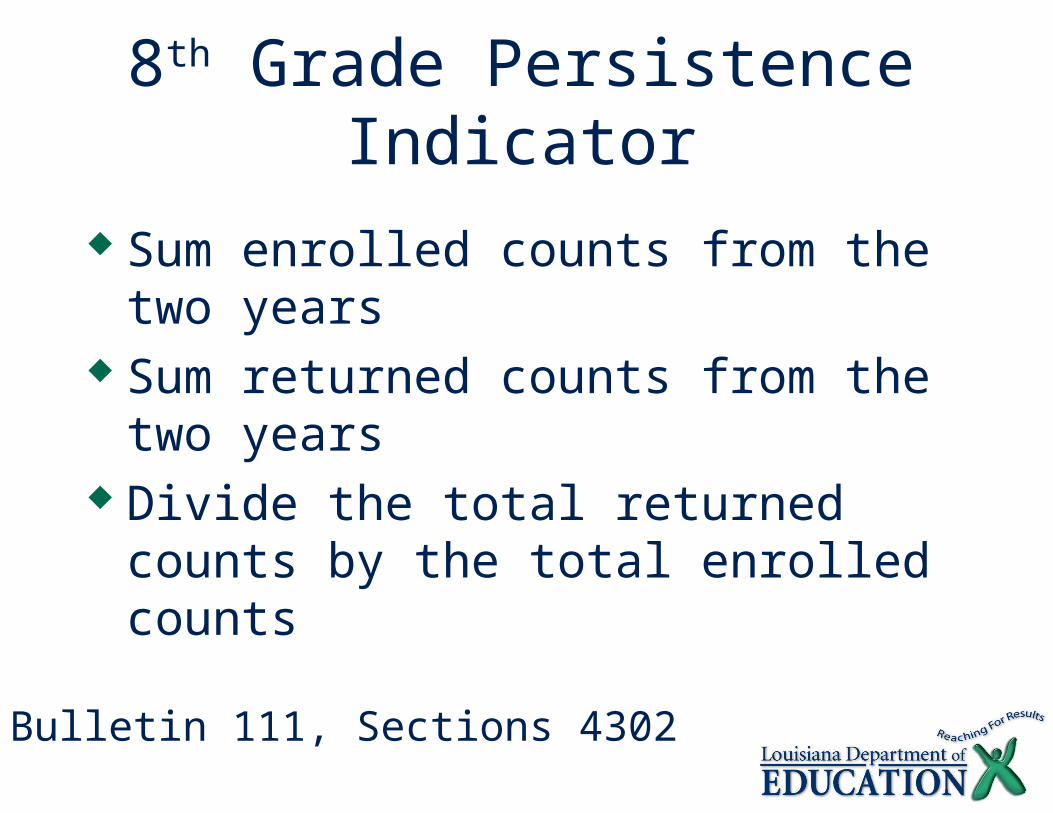
8th Grade Persistence Indicator
Sum enrolled counts from the two years
Sum returned counts from the two years
Divide the total returned counts by the total enrolled counts
Bulletin 111, Sections 4302
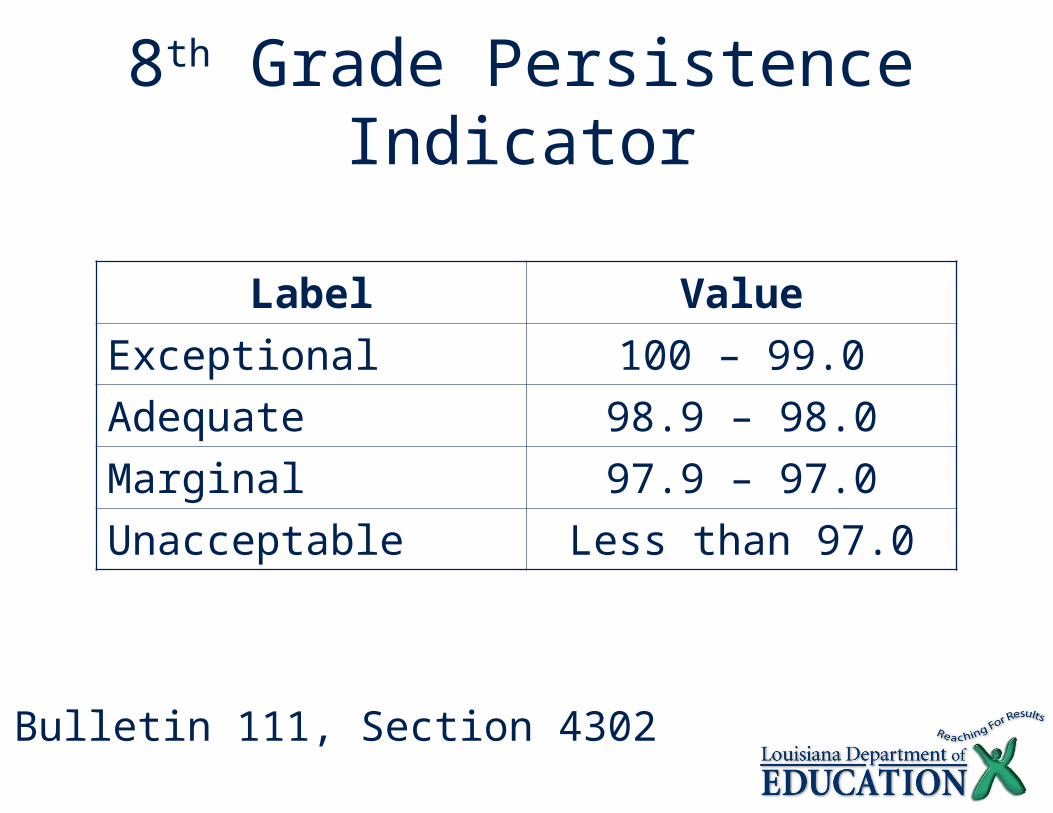
8th Grade Persistence Indicator
Label Value
Exceptional 100 – 99.0
Adequate 98.9 – 98.0
Marginal 97.9 – 97.0
Unacceptable Less than 97.0
Bulletin 111, Section 4302
Financial Risk Indicator Created by Education Finance in
2004-05 to quantify a district’s financial risk
Currently being revised by BESE Will be used in subsequent years
once revisions are complete
Bulletin 111, Sections 4302

District Subgroup Component AYP
For the Annual Measurable Objectives (AMO) percent proficiency analysis, ELA and math assessments from grades 3-8 and 10 are included
For the “Safe Harbor” percent proficiency improvement comparison, only 4th, 8th and 10th grade ELA and math results are usedBulletin 111, Section 4310
District Subgroup Component AYP
Students displaced by the hurricane were placed in a separate subgroup and removed from all other subgroups
The Displaced Students subgroup were only evaluated on their Participation•If the Displaced Students subgroup
failed the Participation evaluation for a particular grade cluster, the district failed Subgroup Component AYPBulletin 111, Section 4310

District Consequences Since DRI labels have been
eliminated from District Accountability, district consequences only apply to failure to achieve Adequate Yearly Progress (AYP) in the Subgroup Component for all three Grade-Clusters in the same subject,
Bulletin 111, Section 4313
Districts Exiting District Improvement
Districts exit District Improvement if they pass the Subgroup Component AYP in the same subject for which they entered District Improvement in the same cluster for 2 consecutive years.
Bulletin 111, Sections 4313

Districts Exiting District Improvement Example:
•District fails Subgroup Component AYP in ELA for all three grade clusters two consecutive years and is placed in District Improvement
•District then passes the Elementary Cluster for ELA for two consecutive years
•District is no longer in District Improvement
Bulletin 111, Sections 4313

District Academically in Crisis District is labeled Academically in
Crisis if•More than 30 schools in the district
are Academically Unacceptable OR
•More than 50% of the district’s enrollment attends Academically Unacceptable schools
Bulletin 111, Sections 4901

District Accountability Hurricane Considerations
Districts are considered “Severe Impact” districts and receive a one-year waiver from accountability labels and decisions if, due to a disaster:• Closed for 18 or more consecutive school
days
•Gained or lost 25% of testing population before Oct. 1
•Have 25% or more of their schools granted a one-year waiver or classified as new schools
Bulletin 111, Section 4503

