distribution system reconfiguration based on fwa and dlf ... · distribution system reconfiguration...
TRANSCRIPT
Distribution System Reconfiguration Based on FWA and DLF with DGs
LIANBIAO SUN School of electrical engineering
Beijing Jiaotong University Haidian District Shangyuan Village No. 3
Beijing, CHINA [email protected]
ZHENSHENG WU School of electrical engineering
Beijing Jiaotong University Haidian District Shangyuan Village No. 3
Beijing, CHINA [email protected]
Abstract: - Feeder reconfiguration for minimum power losses and power quality improvement considering different distribution generations (DGs) based on fireworks algorithm (FWA) is presented in this paper. Various DGs are classified into PV, PI and PQ(V) types. Power flow based on BIBC (bus injection to branch current) and BCBV (branch current to bus voltage) matrix is employed for distribution power system. And voltage stability index (SI) is developed to evaluate the performance of the feasible topology. FWA is proposed to optimize the combination of switches in distribution power system which is a new swarm intelligence optimization algorithm using the fireworks explosion process of searching for the best location of sparks. The method had been tested on IEEE 33-bus and IEEE 69-bus radial distribution systems with DGs and without DGs. The result shows the effectiveness and robustness of the proposed method by comparing with binary particle swarm optimization algorithm (BPSO). Key-Words: - Feeder reconfiguration, fireworks algorithm, voltage stability index, distribution generation 1 Introduction Distribution system reconfiguration (DSR) is defined as optimizing the structure of distribution network by changing the open/close status of the line switches so as to maintain minimization of power loss, load balance and voltage stability. Distribution network reconfiguration is a complicated combinatorial, non-differentiable constrained optimization problem due to the complexity of the distribution network which contains many candidate-switching combinations [2]. In [3]-[4], techniques based on branch exchange are applied to optimize network topology. [3] proposes a distribution system reconfiguration method based on linear programming power distribution system reconfiguration. The improved simplex method is used to find the optimal combination of switches. Das [11] proposed a multi objective method which combines the optimization algorithm with heuristic rules and fuzzy logic. The results are encouraging but there is no criteria to select a membership function. Many other artificial intelligence algorithms have been proposed such as expert system [12], refined genetic algorithm [13], adaptive genetic algorithm [14] and ant colony search [15] to handle distribution system reconfiguration. Distributed Generation(DGs) like Wind turbine and Photovoltaic (PV) can satisfy the expanding energy demand, reduce the environment pollution and
promote the coordinated development of environment and economy. As penetration level of DGs connected to utility grid increasing, there are various issues needed to be considered concerning with DGs [8]. Meantime the rapid growth of various types of distributed generations(DGs), connected at the lower voltage supply, has also created many challenges to this structure [7]. Due to the complexity and diversity of the topology of the distribution network, the requirements of the distributed power supply to the operation and control of the distribution power system have exigent with the wider integration of DGs. Installing DG at optimal placement and sizing will reduce the system losses and improve the voltage quality greatly [16]. [17] proposed an optimization method to determine the location of DGs. An improved Honey Bee Mating optimization algorithm is employed to determine the location and sizing of DGs to minimum the power loss and emission. PSO algorithm has been used to optimize the location of different types of DGs to decrease the power loss [18]. In this paper, fireworks algorithm is employed to find optimal combination of switches considering various models of DGs which are divided into three types of models (PV, PQ(V) and PI) on the basis of their actual operation modes and control characteristics. Voltage stability index and power loss are calculated as fitness function. In order to reduce the computational burden, a direct power
WSEAS TRANSACTIONS on SYSTEMS and CONTROL Lianbiao Sun, Zhensheng Wu
E-ISSN: 2224-2856 232 Volume 13, 2018
flow method based on topology matrix is developed. This paper is organized as below: Power loss and voltage stability index are presented in Section 2 and different types of models are discussed in Section 3. The proposed reconfiguration technique based on FWA and power flow based on BIBC and BCBV matrix is fully described in Section 4. Then, the results of simulation are described in Section 5. The conclusion is showed in Section 6. 2 Problem Formulation 2.1 Power Loss DSR is used to minimize the loss of line and improve power quality by changing the status of switches, which needs to satisfy the constraints such as of the upper and lower limits of the load flow equation and bus voltage [9]. It can be formulated as below:
Ploss = Ri(Pi
2 +Qi2 )
Vi2
i=1
Nk
∑ .................................................... (1)
Vi,min ≤Vi ≤Vi,maxIi,min ≤ Ii ≤ Ii,max
.................................................... (2)
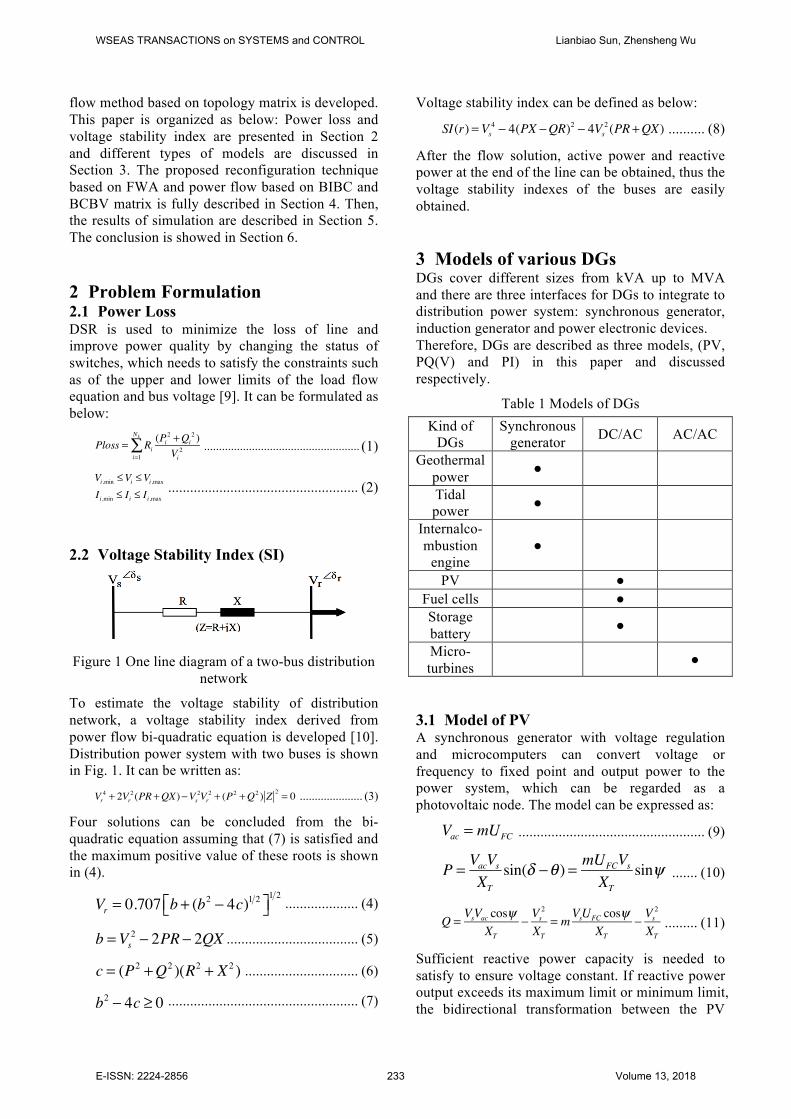
2.2 Voltage Stability Index (SI)
Figure 1 One line diagram of a two-bus distribution
network
To estimate the voltage stability of distribution network, a voltage stability index derived from power flow bi-quadratic equation is developed [10]. Distribution power system with two buses is shown in Fig. 1. It can be written as:
Vr4 + 2Vr
2 (PR +QX)−Vs2Vr
2 + (P2 +Q2 ) Z 2 = 0 ..................... (3)
Four solutions can be concluded from the bi-quadratic equation assuming that (7) is satisfied and the maximum positive value of these roots is shown in (4).
Vr = 0.707 b + (b2 − 4c)1 2⎡⎣ ⎤⎦1 2
.................... (4)
b =Vs2 − 2PR − 2QX .................................... (5)
c = (P2 +Q2 )(R2 + X 2 ) ............................... (6)
b2 − 4c ≥ 0 .................................................... (7)
Voltage stability index can be defined as below:
SI(r) =Vs4 − 4(PX −QR)2 − 4Vs
2 (PR +QX) .......... (8)
After the flow solution, active power and reactive power at the end of the line can be obtained, thus the voltage stability indexes of the buses are easily obtained. 3 Models of various DGs DGs cover different sizes from kVA up to MVA and there are three interfaces for DGs to integrate to distribution power system: synchronous generator, induction generator and power electronic devices. Therefore, DGs are described as three models, (PV, PQ(V) and PI) in this paper and discussed respectively.
Table 1 Models of DGs Kind of
DGsSynchronous
generator DC/AC AC/AC
Geothermal power ●
Tidal power ●
Internalco-mbustion
engine●
PV ● Fuel cells ● Storage battery ●
Micro-turbines ●
3.1 Model of PV A synchronous generator with voltage regulation and microcomputers can convert voltage or frequency to fixed point and output power to the power system, which can be regarded as a photovoltaic node. The model can be expressed as:
Vac = mUFC ................................................... (9)
P = VacVsXT
sin(δ −θ ) = mUFCVsXT
sinψ ....... (10)
Q = VsVac cosψXT
− Vs2
XT
= mVsUFC cosψXT
− Vs2
XT ......... (11)
Sufficient reactive power capacity is needed to satisfy to ensure voltage constant. If reactive power output exceeds its maximum limit or minimum limit, the bidirectional transformation between the PV
WSEAS TRANSACTIONS on SYSTEMS and CONTROL Lianbiao Sun, Zhensheng Wu
E-ISSN: 2224-2856 233 Volume 13, 2018
node and the PQ node can be completed and the output reactive power of PQ is equal to the critical value [12]. 3.2 Model of PI PV connects into Grid by voltage source inverter (AC/DC or DC/AC). The battery can be considered as a kind of power source or load. The photovoltaic system and the battery only output the active power. When the inverter can quickly adjust the power angle and keep active power output and current output constant, it can be considered as the PI node. The model can be described as:
Q = I 2 U 2 − P2 ..................................... (12)
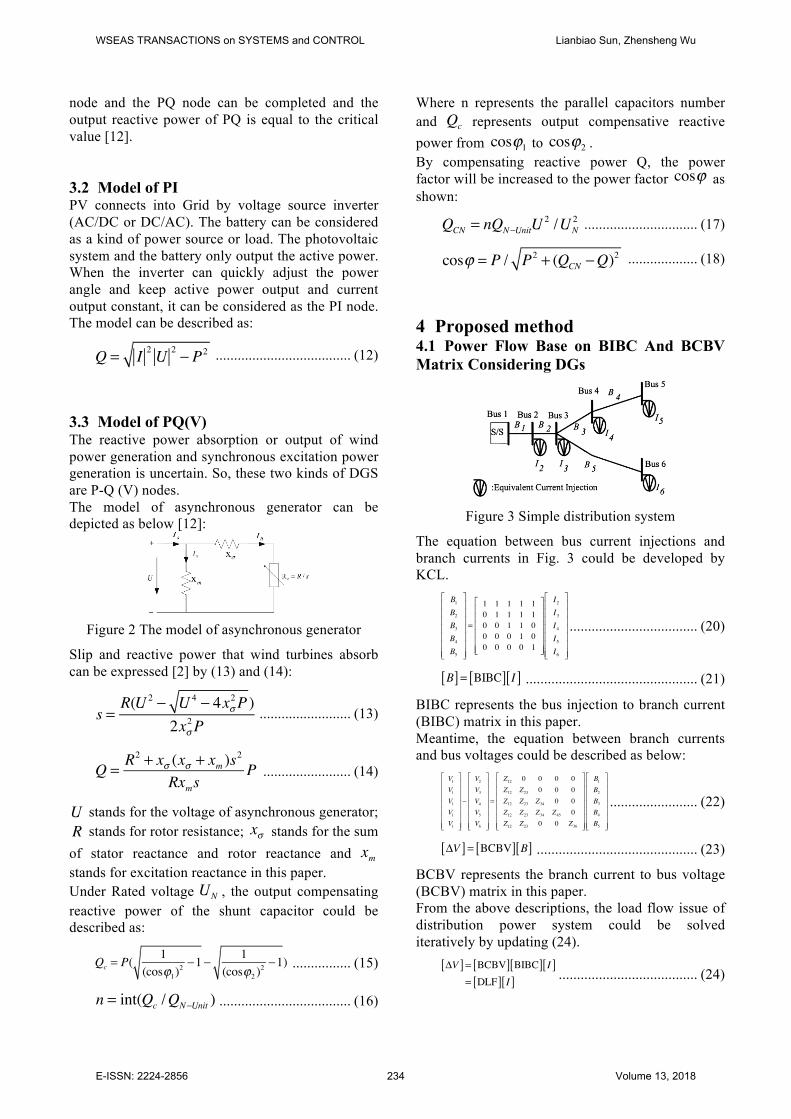
3.3 Model of PQ(V) The reactive power absorption or output of wind power generation and synchronous excitation power generation is uncertain. So, these two kinds of DGS are P-Q (V) nodes. The model of asynchronous generator can be depicted as below [12]:
Figure 2 The model of asynchronous generator
Slip and reactive power that wind turbines absorb can be expressed [2] by (13) and (14):
s =R(U 2 − U 4 − 4xσ
2P )2xσ
2P ......................... (13)
Q = R2 + xσ (xσ + xm )s2
RxmsP ........................ (14)
U stands for the voltage of asynchronous generator; R stands for rotor resistance; xσ stands for the sum of stator reactance and rotor reactance and xm stands for excitation reactance in this paper. Under Rated voltage UN , the output compensating reactive power of the shunt capacitor could be described as:
Qc = P(1
(cosϕ1)2 −1 −
1(cosϕ2 )
2 −1) ................ (15)
n = int(Qc /QN−Unit ) .................................... (16)
Where n represents the parallel capacitors number and Qc represents output compensative reactive power from cosϕ1 to cosϕ2 . By compensating reactive power Q, the power factor will be increased to the power factor cosϕ as shown:
QCN = nQN−UnitU2 /UN
2 ............................... (17)
cosϕ = P / P2 + (QCN −Q)2 ................... (18)
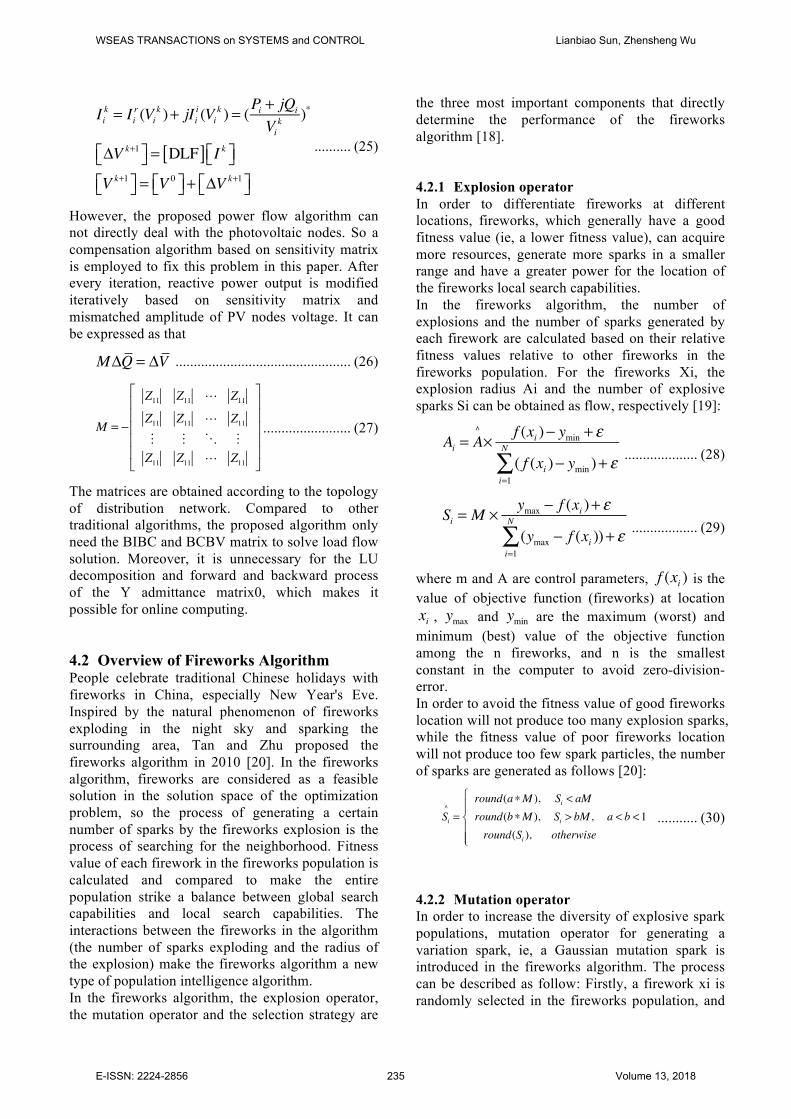
4 Proposed method 4.1 Power Flow Base on BIBC And BCBV Matrix Considering DGs
Figure 3 Simple distribution system
The equation between bus current injections and branch currents in Fig. 3 could be developed by KCL.
B1B2B3B4B5
⎡
⎣
⎢⎢⎢⎢⎢⎢⎢
⎤
⎦
⎥⎥⎥⎥⎥⎥⎥
=
1 1 1 1 10 1 1 1 10 0 1 1 00 0 0 1 00 0 0 0 1
⎡
⎣
⎢⎢⎢⎢⎢⎢
⎤
⎦
⎥⎥⎥⎥⎥⎥
I2I3I4I5I6
⎡
⎣
⎢⎢⎢⎢⎢⎢⎢
⎤
⎦
⎥⎥⎥⎥⎥⎥⎥
................................... (20)
B[ ]= BIBC[ ] I[ ] ............................................... (21)
BIBC represents the bus injection to branch current (BIBC) matrix in this paper. Meantime, the equation between branch currents and bus voltages could be described as below:
V1V1V1V1V1
⎡
⎣
⎢⎢⎢⎢⎢⎢⎢
⎤
⎦
⎥⎥⎥⎥⎥⎥⎥
−
V2V3V4V5V6
⎡
⎣
⎢⎢⎢⎢⎢⎢⎢
⎤
⎦
⎥⎥⎥⎥⎥⎥⎥
=
Z12 0 0 0 0Z12 Z23 0 0 0Z12 Z23 Z34 0 0Z12 Z23 Z34 Z45 0Z12 Z23 0 0 Z36
⎡
⎣
⎢⎢⎢⎢⎢⎢⎢
⎤
⎦
⎥⎥⎥⎥⎥⎥⎥
B1B2B3B4B5
⎡
⎣
⎢⎢⎢⎢⎢⎢⎢
⎤
⎦
⎥⎥⎥⎥⎥⎥⎥
........................ (22)
ΔV[ ]= BCBV[ ] B[ ] ............................................ (23)
BCBV represents the branch current to bus voltage (BCBV) matrix in this paper. From the above descriptions, the load flow issue of distribution power system could be solved iteratively by updating (24).
ΔV[ ]= BCBV[ ] BIBC[ ] I[ ]= DLF[ ] I[ ] ...................................... (24)
WSEAS TRANSACTIONS on SYSTEMS and CONTROL Lianbiao Sun, Zhensheng Wu
E-ISSN: 2224-2856 234 Volume 13, 2018
Iik = Ii
r (Vik )+ jIi
i (Vik ) = (Pi + jQi
Vik )*
ΔV k+1⎡⎣ ⎤⎦ = DLF[ ] I k⎡⎣ ⎤⎦V k+1⎡⎣ ⎤⎦ = V 0⎡⎣ ⎤⎦ + ΔV k+1⎡⎣ ⎤⎦
.......... (25)
However, the proposed power flow algorithm can not directly deal with the photovoltaic nodes. So a compensation algorithm based on sensitivity matrix is employed to fix this problem in this paper. After every iteration, reactive power output is modified iteratively based on sensitivity matrix and mismatched amplitude of PV nodes voltage. It can be expressed as that
MΔQ = ΔV ................................................ (26)
M = −
Z11 Z11 ! Z11Z11 Z11 ! Z11! ! " !Z11 Z11 ! Z11
⎡
⎣
⎢⎢⎢⎢⎢
⎤
⎦
⎥⎥⎥⎥⎥
........................ (27)
The matrices are obtained according to the topology of distribution network. Compared to other traditional algorithms, the proposed algorithm only need the BIBC and BCBV matrix to solve load flow solution. Moreover, it is unnecessary for the LU decomposition and forward and backward process of the Y admittance matrix0, which makes it possible for online computing. 4.2 Overview of Fireworks Algorithm People celebrate traditional Chinese holidays with fireworks in China, especially New Year's Eve. Inspired by the natural phenomenon of fireworks exploding in the night sky and sparking the surrounding area, Tan and Zhu proposed the fireworks algorithm in 2010 [20]. In the fireworks algorithm, fireworks are considered as a feasible solution in the solution space of the optimization problem, so the process of generating a certain number of sparks by the fireworks explosion is the process of searching for the neighborhood. Fitness value of each firework in the fireworks population is calculated and compared to make the entire population strike a balance between global search capabilities and local search capabilities. The interactions between the fireworks in the algorithm (the number of sparks exploding and the radius of the explosion) make the fireworks algorithm a new type of population intelligence algorithm. In the fireworks algorithm, the explosion operator, the mutation operator and the selection strategy are
the three most important components that directly determine the performance of the fireworks algorithm [18]. 4.2.1 Explosion operator In order to differentiate fireworks at different locations, fireworks, which generally have a good fitness value (ie, a lower fitness value), can acquire more resources, generate more sparks in a smaller range and have a greater power for the location of the fireworks local search capabilities. In the fireworks algorithm, the number of explosions and the number of sparks generated by each firework are calculated based on their relative fitness values relative to other fireworks in the fireworks population. For the fireworks Xi, the explosion radius Ai and the number of explosive sparks Si can be obtained as flow, respectively [19]:
Ai = A^× f (xi )− ymin + ε
( f (xi )− ymin )+ εi=1
N
∑ .................... (28)
Si = M × ymax − f (xi )+ ε
(ymax − f (xi ))+ εi=1
N
∑ .................. (29)
where m and A are control parameters, f (xi ) is the value of objective function (fireworks) at location xi , ymax and ymin are the maximum (worst) and minimum (best) value of the objective function among the n fireworks, and n is the smallest constant in the computer to avoid zero-division-error. In order to avoid the fitness value of good fireworks location will not produce too many explosion sparks, while the fitness value of poor fireworks location will not produce too few spark particles, the number of sparks are generated as follows [20]:
Si^=
round(a∗M ), Si < aMround(b∗M ), Si > bM , a < b <1round(Si ), otherwise
⎧
⎨⎪
⎩⎪⎪
........... (30)
4.2.2 Mutation operator In order to increase the diversity of explosive spark populations, mutation operator for generating a variation spark, ie, a Gaussian mutation spark is introduced in the fireworks algorithm. The process can be described as follow: Firstly, a firework xi is randomly selected in the fireworks population, and
WSEAS TRANSACTIONS on SYSTEMS and CONTROL Lianbiao Sun, Zhensheng Wu
E-ISSN: 2224-2856 235 Volume 13, 2018

then a certain number of dimensions of the firework are selected randomly for Gaussian mutation operation [17]. It can be shown as
xik^= xik × e .................................................. (31)
In the process of explosion and Gaussian mutation sparks, a new position will be obtained when the spark xi exceeds the boundary on the dimension k.
xik^= xLB,k + xik
^%(xUB,k − xLB,k ) ................. (32)
4.2.3 Selection strategy At each iteration of FWA, among all the current sparks and fire-works, the best location is always kept for the next explosion generation. After, n-1 fireworks are selected with some probabilities proportional to their distances to other locations [20]. The selection probability of a location is defined by the following equations:
p(xi ) =R(xi )
x jx j∈K∑ ............................................. (33)
R(xi ) = d(xi − x j )x j∈K∑ = xi − x j
x j∈K∑ ........ (34)
4.3 Application of FWA for Distribution System Reconfiguration Based on the previous description, the implementation of the fireworks algorithm for optimizing the topology of distribution power system with DG can be described as below: 1) Initialization of the FWA parameters and DPS data. 2) Randomly select n locations of sparks for fireworks as follows:
x =
SW11 SW2
1 SW31 SW4
1 SW51
SW12 SW2
2 SW32 SW4
2 SW52
. . . . .
. . . . .SW1
n SW2n SW3
n SW4n SW5
n
⎡
⎣
⎢⎢⎢⎢⎢⎢⎢
⎤
⎦
⎥⎥⎥⎥⎥⎥⎥
............... (36)
The structure of above solution vector x for radial distribution network optimization is expressed by SW.No.(i) for each switch i. Only the open switch position is numbered to improve the efficiency for large distribution networks to solve network reconfiguration problem with DGs. 3) For selected fireworks, objective function F( xi ) is calculated by the proposed power flow method. 4) Si and xi is calculated according to (30) and (36). 5) Randomly select a firework x j and generate a specific spark for the firework using Gaussian explosion method as in (31) and (32). 6) Evaluate the quality of all the above locations and select the best location that gives minimum F and keep it for the next explosion generation. 5 Simulation and results In this paper, the voltage stability index and the power system loss are calculated as the evaluation indexes of the distribution system reconfiguration. The FWA algorithm is employed to search for the ideal combination status of sectionalizing switches and loop switches to maximize the voltage stability index and minimize the loss of power system. The proposed method of distribution power system has been tested on radial distribution power system with 33 buses in Fig.4 which has five tie lines. The load data, line details and the topology of RDS are given in [2]. In addition, basic voltage value is 12.66 kV and basic capacity is 10 MVA.
2 3 4 5 6 7 8 9 10 11 12 13 14 15 16 17
19 20 21
22
23 24
2526 27 28 29 30 31 32
34
33
35
37
36
Figure 4 A 33-bus distribution power system
Table 2 Comparison Results before and after reconfiguration without DGs
WSEAS TRANSACTIONS on SYSTEMS and CONTROL Lianbiao Sun, Zhensheng Wu
E-ISSN: 2224-2856 236 Volume 13, 2018
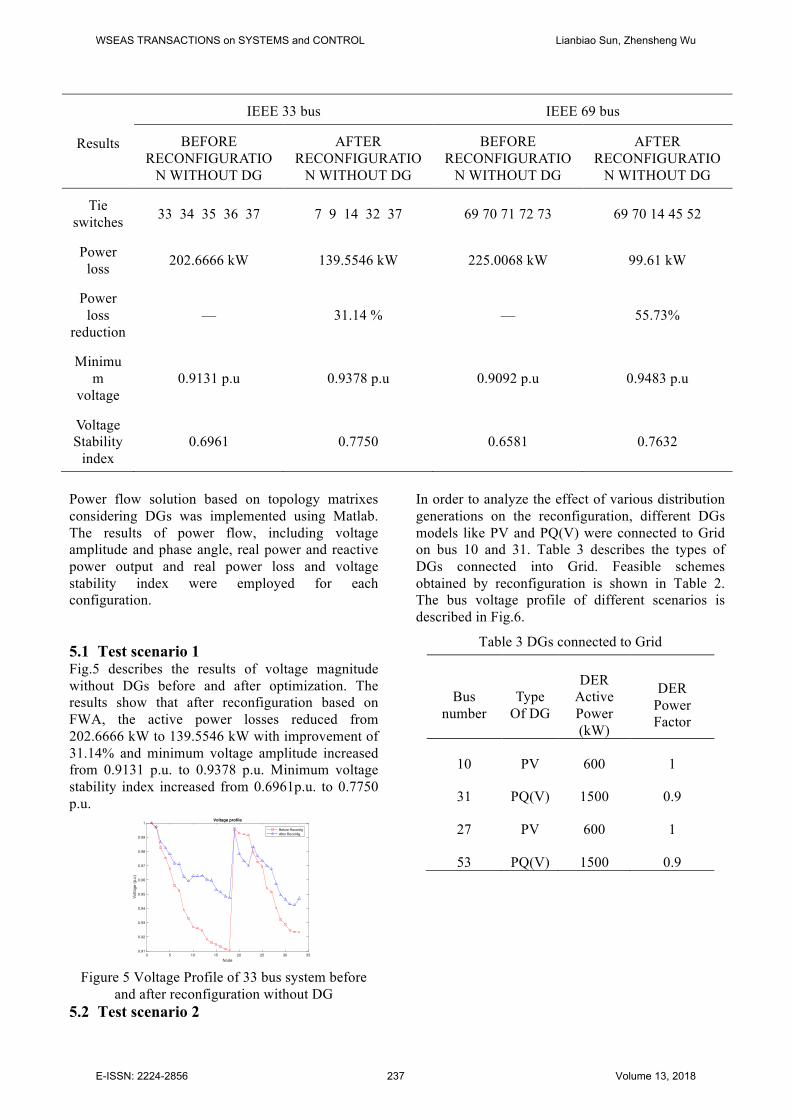
Results
IEEE 33 bus IEEE 69 bus
BEFORE RECONFIGURATIO
N WITHOUT DG
AFTER RECONFIGURATIO
N WITHOUT DG
BEFORE RECONFIGURATIO
N WITHOUT DG
AFTER RECONFIGURATIO
N WITHOUT DG
Tie switches 33 34 35 36 37 7 9 14 32 37 69 70 71 72 73 69 70 14 45 52
Power loss 202.6666 kW 139.5546 kW 225.0068 kW 99.61 kW
Power loss
reduction— 31.14 % — 55.73%
Minimum
voltage0.9131 p.u 0.9378 p.u 0.9092 p.u 0.9483 p.u
Voltage Stability
index0.6961 0.7750 0.6581 0.7632
Power flow solution based on topology matrixes considering DGs was implemented using Matlab. The results of power flow, including voltage amplitude and phase angle, real power and reactive power output and real power loss and voltage stability index were employed for each configuration. 5.1 Test scenario 1 Fig.5 describes the results of voltage magnitude without DGs before and after optimization. The results show that after reconfiguration based on FWA, the active power losses reduced from 202.6666 kW to 139.5546 kW with improvement of 31.14% and minimum voltage amplitude increased from 0.9131 p.u. to 0.9378 p.u. Minimum voltage stability index increased from 0.6961p.u. to 0.7750 p.u.
0 5 10 15 20 25 30 35Node
0.91
0.92
0.93
0.94
0.95
0.96
0.97
0.98
0.99
1
Volta
ge (p
.u)
Voltage profile
Before ReconfigAfter Reconfig
Figure 5 Voltage Profile of 33 bus system before
and after reconfiguration without DG 5.2 Test scenario 2
In order to analyze the effect of various distribution generations on the reconfiguration, different DGs models like PV and PQ(V) were connected to Grid on bus 10 and 31. Table 3 describes the types of DGs connected into Grid. Feasible schemes obtained by reconfiguration is shown in Table 2. The bus voltage profile of different scenarios is described in Fig.6.
Table 3 DGs connected to Grid
Bus number
Type Of DG
DER Active Power (kW)
DER Power Factor
10 PV 600 1
31 PQ(V) 1500 0.9
27 PV 600 1
53 PQ(V) 1500 0.9
WSEAS TRANSACTIONS on SYSTEMS and CONTROL Lianbiao Sun, Zhensheng Wu
E-ISSN: 2224-2856 237 Volume 13, 2018
0 5 10 15 20 25 30 35Node
0.955
0.96
0.965
0.97
0.975
0.98
0.985
0.99
0.995
1
Volta
ge (p
.u)
Voltage profile
Before Reconfig with DGAfter Reconfig with DG
Figure 6 Voltage Profile of 33 bus system before and
after reconfiguration with DG
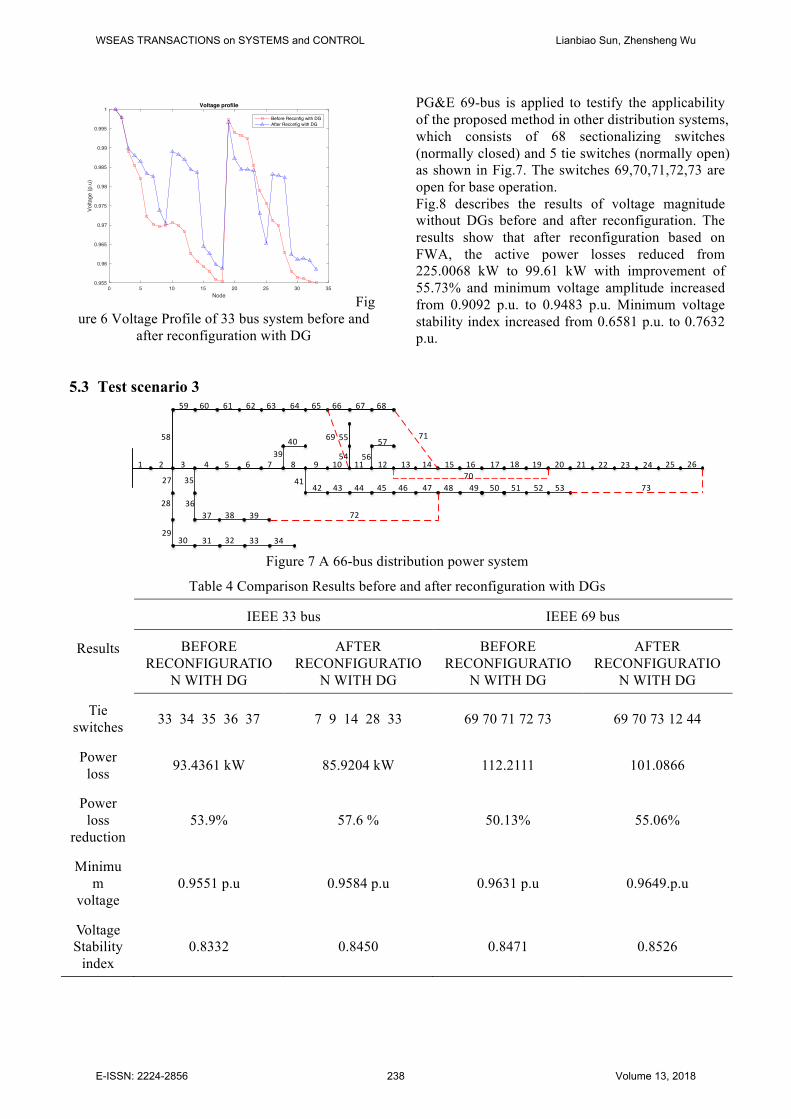
5.3 Test scenario 3
PG&E 69-bus is applied to testify the applicability of the proposed method in other distribution systems, which consists of 68 sectionalizing switches (normally closed) and 5 tie switches (normally open) as shown in Fig.7. The switches 69,70,71,72,73 are open for base operation. Fig.8 describes the results of voltage magnitude without DGs before and after reconfiguration. The results show that after reconfiguration based on FWA, the active power losses reduced from 225.0068 kW to 99.61 kW with improvement of 55.73% and minimum voltage amplitude increased from 0.9092 p.u. to 0.9483 p.u. Minimum voltage stability index increased from 0.6581 p.u. to 0.7632 p.u.
1 2 3 4 5 6 7 8 9 10 11 12 13 14 15 16 17
58
59 60 61
4142 43 44 45 46 47 48
18 19 20 21 22 23 24 25 26
27
28
2930 31 32 33 34
35
3637 38 39
3940
49 50 51 52 53
54
55
56
57
62 63 64 65 66 67 68
69
70
71
72
73
Figure 7 A 66-bus distribution power system Table 4 Comparison Results before and after reconfiguration with DGs
Results
IEEE 33 bus IEEE 69 bus
BEFORE RECONFIGURATIO
N WITH DG
AFTER RECONFIGURATIO
N WITH DG
BEFORE RECONFIGURATIO
N WITH DG
AFTER RECONFIGURATIO
N WITH DG
Tie switches 33 34 35 36 37 7 9 14 28 33 69 70 71 72 73 69 70 73 12 44
Power loss 93.4361 kW 85.9204 kW 112.2111 101.0866
Power loss
reduction 53.9% 57.6 % 50.13% 55.06%
Minimum
voltage 0.9551 p.u 0.9584 p.u 0.9631 p.u 0.9649.p.u
Voltage Stability
index 0.8332 0.8450 0.8471 0.8526
WSEAS TRANSACTIONS on SYSTEMS and CONTROL Lianbiao Sun, Zhensheng Wu
E-ISSN: 2224-2856 238 Volume 13, 2018
0 10 20 30 40 50 60 700.9
0.91
0.92
0.93
0.94
0.95
0.96
0.97
0.98
0.99
1
Before Reconfig without DGAfter Reconfig without DG
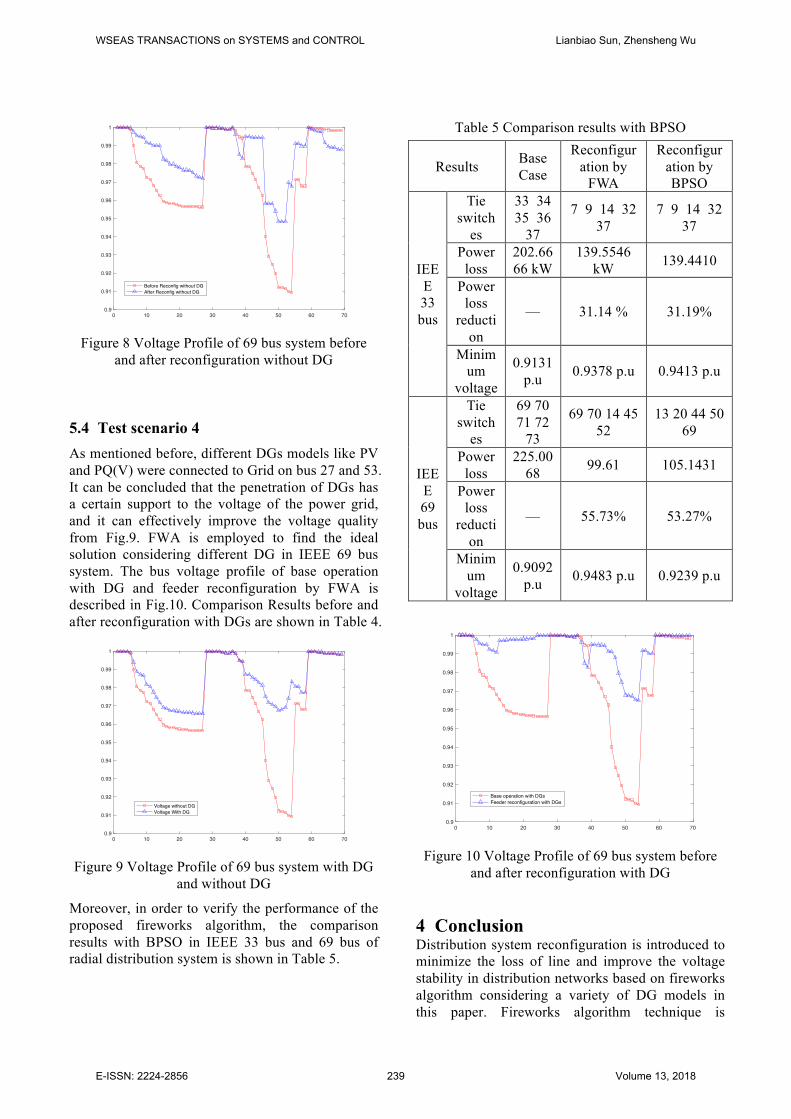
Figure 8 Voltage Profile of 69 bus system before
and after reconfiguration without DG 5.4 Test scenario 4 As mentioned before, different DGs models like PV and PQ(V) were connected to Grid on bus 27 and 53. It can be concluded that the penetration of DGs has a certain support to the voltage of the power grid, and it can effectively improve the voltage quality from Fig.9. FWA is employed to find the ideal solution considering different DG in IEEE 69 bus system. The bus voltage profile of base operation with DG and feeder reconfiguration by FWA is described in Fig.10. Comparison Results before and after reconfiguration with DGs are shown in Table 4.
0 10 20 30 40 50 60 700.9
0.91
0.92
0.93
0.94
0.95
0.96
0.97
0.98
0.99
1
Voltage without DGVoltage With DG
Figure 9 Voltage Profile of 69 bus system with DG
and without DG
Moreover, in order to verify the performance of the proposed fireworks algorithm, the comparison results with BPSO in IEEE 33 bus and 69 bus of radial distribution system is shown in Table 5.
Table 5 Comparison results with BPSO
Results Base Case
Reconfiguration by
FWA
Reconfiguration by BPSO
IEEE 33 bus
Tie switch
es
33 34 35 36
37
7 9 14 32 37
7 9 14 32 37
Power loss
202.6666 kW
139.5546 kW 139.4410
Power loss
reduction
— 31.14 % 31.19%
Minimum
voltage
0.9131 p.u 0.9378 p.u 0.9413 p.u
IEEE 69 bus
Tie switch
es
69 70 71 72
73
69 70 14 45 52
13 20 44 50 69
Power loss
225.0068 99.61 105.1431
Power loss
reduction
— 55.73% 53.27%
Minimum
voltage
0.9092 p.u 0.9483 p.u 0.9239 p.u
0 10 20 30 40 50 60 700.9
0.91
0.92
0.93
0.94
0.95
0.96
0.97
0.98
0.99
1
Base operation with DGsFeeder reconfiguration with DGs
Figure 10 Voltage Profile of 69 bus system before
and after reconfiguration with DG 4 Conclusion Distribution system reconfiguration is introduced to minimize the loss of line and improve the voltage stability in distribution networks based on fireworks algorithm considering a variety of DG models in this paper. Fireworks algorithm technique is
WSEAS TRANSACTIONS on SYSTEMS and CONTROL Lianbiao Sun, Zhensheng Wu
E-ISSN: 2224-2856 239 Volume 13, 2018

employed to find the ideal combination of the open/close status of the switches. Two matrices (BIBC and BCBV), which are derived from the structure of radial distribution power systems, are employed to complete the power flow. Time-consuming procedures are not necessary which ensure robustness and efficiency of the proposed method. It was tested on IEEE 33-bus and 69-bus distribution system with DGs and without DGs. The result shows that the installation of DGs will have an influence on voltage amplitude of distribution power system. Distribution network reconfiguration with the presence of DGs based on proposed method can obviously improve power quality and enhance the distribution system performance. References: [1] Hu, Shao Qiang, and S. M. Li. "Unbalanced
Load Flow for Weakly Meshed Distribution Systems with Distributed Generation," International Conference on Electrical and Control Engineering IEEE Computer Society, pp. 4513-4517,2010.
[2] Guan, Wanlin, et al. "Distribution system feeder reconfiguration considering different model of DG sources." International Journal of Electrical Power & Energy Systems, Vol. 68, pp. 210-221, 2015.
[3] Amanulla, S. Chakrabarti, and S. N. Singh, “Reconfiguration of power distribution systems considering reliability and power loss,” IEEE Transactions on Power Delivery, Vol. 27, No. 2, pp. 918–926, 2012.
[4] Hoseini, Pourya, and M. G. Shayesteh. "Hybrid Ant Colony Optimization, Genetic Algorithm, and Simulated Annealing for image contrast enhancement." Evolutionary Computation IEEE, pp. 1-6, 2010.
[5] Jaswanti, and T. Thakur. "Minimum Loss Configuration of Power Distribution System," International Conference on Power Electronics, Drives and Energy Systems IEEE, pp. 1-6,2007.
[6] Hardiansyah. "A Novel Hybrid PSO-GSA Method for Non-convex Economic Dispatch Problems," International Journal of Information Engineering & Electronic Business, Vol. 5, 2013.
[7] M. A. Kashem, G. B. Jasmon, and V. Ganapathy, “A new approach of distribution system reconfiguration for loss minimization,” Electric Power & Energy Systems, Vol.22, pp. 269-276, 2000.
[8] Abur, “A modified linear programming method for distribution system reconfiguration,” Electric Power & Energy Systems, Vol.18, No. 7, pp. 469-474, 1996.
[9] M. k. K. Nara, A.Shiose, and T.Ishihara, “Implementation of genetic algorithm for distribution systems loss minimum reconfiguration,” IEEE Trans. Power Systems, Vol.7, pp. 1044-1051, August 1992.
[10] Y. J. Jeon, J. O. Kim, J. R. Shin, and K. Y. Lee, “An efficient simulated annealing algorithm for network reconfiguration in large-scale distribution systems,” IEEE Trans. Power Delivery, Vol. 17, No. 4, pp. 1070-1078, 2002.
[11] Das, “A fuzzy multi objective approach for network reconfiguration of distribution systems,” IEEE Trans. Power Delivery, Vol. 21, No.1, pp. 202-209, 2006.
[12] C. C. Liu, S. J. Jee, S. S, and Venkata, “An expert system operational aid for restoration and loss allocation of distributed system,” IEEE Trans. Power Syst, Vol. 3, pp. 619-629, 1988.
[13] Z. Zhu, “Optimal reconfiguration of electrical distributed network using redifined genetic algorithm,” Electr. Power Syst, Vol.62, pp. 37- 42, 2002.
[14] A.Swarnkar,N.Gupta,andK.R.Niazi,“Minimallossconfigurationfor large scale distribution system using adaptive genetic algorithm,” 16th National Power System Conference, 2010.
[15] Wu Yaun-Kang, Lee Ching-Yin, Liu Le Chang, and Tsai Shao-Hong, “Study of reconfiguration for the distribution system with distributed generators,” IEEE Trans. Power Del, Vol. 25, No.3, 2010.
[16] Al Abri RS, El-Saadany EF, Atwa YM. “Optimal placement and sizing method to improve the voltage stability margin in a distribution system using distributed generation,” IEEE Trans Power Syst, Vol. 28, No. 1, pp. 326-334, 2013.
[17] Caisheng W, Nehrir MH. “Analytical approaches for optimal placement of distributed generation sources in power systems,” IEEE Trans Power System, Vol. 19, pp. 2068-2076, 2004.
[18] Choi JH, Kim JC. “Network reconfiguration at the power distribution system with dispersed generations for loss reduction,” Power Eng Soc Winter Meet, IEEE Vol. 4, pp. 2363-2367, 2000.
[19] Imran, A. Mohamed, M. Kowsalya, and D. P. Kothari. "A novel integration technique for optimal network reconfiguration and
WSEAS TRANSACTIONS on SYSTEMS and CONTROL Lianbiao Sun, Zhensheng Wu
E-ISSN: 2224-2856 240 Volume 13, 2018
distributed generation placement power distribution networks," International Journal of Electrical Power & Energy Systems, Vol 63, pp. 461-472, 2014.
[20] Tan, Ying, and Y. Zhu. "Fireworks Algorithm for Optimization," International Conference on Advances in Swarm Intelligence Springer-Verlag, pp. 355-364, 2010.
[21] J. S. Savier and D. Das, “Impact of network reconfiguration on loss allocation of radial distribution systems,” IEEE Trans. Power Delivery, Vol. 22, No. 4, pp. 2473-2480, 2007.
[22] S. Chen, C. H. lin, H. J. Chuang, C. S. Li, M. Y. Huang, and C. W. Huang, “Optimal placement of line switches for distribution automation systems using immune algorithm,” IEEE Trans. Power Systems, Vol. 21, No. 3, pp. 1209-1217, 2006.
[23] Moradi and M. F. Firuzabad, “Optimal switch placement in distribution systems using trinary particle swarm optimization algorithm,” IEEE Trans. Power delivery, Vol. 23, No. 1, pp. 271-279, 2008.
WSEAS TRANSACTIONS on SYSTEMS and CONTROL Lianbiao Sun, Zhensheng Wu
E-ISSN: 2224-2856 241 Volume 13, 2018