dissipative particle dynamics simulations for biological ... · dissipative particle dynamics...
TRANSCRIPT
This content has been downloaded from IOPscience. Please scroll down to see the full text.
Download details:
IP Address: 195.176.111.91
This content was downloaded on 06/08/2014 at 13:35
Please note that terms and conditions apply.
Dissipative particle dynamics simulations for biological tissues: rheology and competition
View the table of contents for this issue, or go to the journal homepage for more
2011 Phys. Biol. 8 026014
(http://iopscience.iop.org/1478-3975/8/2/026014)
Home Search Collections Journals About Contact us My IOPscience
IOP PUBLISHING PHYSICAL BIOLOGY
Phys. Biol. 8 (2011) 026014 (13pp) doi:10.1088/1478-3975/8/2/026014
Dissipative particle dynamics simulationsfor biological tissues: rheology andcompetitionMarkus Basan1, Jacques Prost1,2, Jean-Francois Joanny1 and Jens Elgeti1
1 Laboratoire Physico-Chimie Curie Institut Curie Centre de Recherche, CNRS-UMR 168,UPMC Paris VI, 26 rue d’Ulm, F-75248 Paris Cedex 05, France2 ESPCI ParisTech, 10 rue Vauquelin, F-75231 Paris Cedex 05, France
E-mail: [email protected] and [email protected]
Received 29 September 2010Accepted for publication 4 March 2011Published 1 April 2011Online at stacks.iop.org/PhysBio/8/026014
AbstractIn this work, we model biological tissues using a simple, mechanistic simulation based ondissipative particle dynamics. We investigate the continuum behavior of the simulated tissueand determine its dependence on the properties of the individual cell. Cells in our simulationadhere to each other, expand in volume, divide after reaching a specific size checkpoint andundergo apoptosis at a constant rate, leading to a steady-state homeostatic pressure in thetissue. We measure the dependence of the homeostatic state on the microscopic parameters ofour model and show that homeostatic pressure, rather than the unconfined rate of cell division,determines the outcome of tissue competitions. Simulated cell aggregates are cohesive andround up due to the effect of tissue surface tension, which we measure for different tissues.Furthermore, mixtures of different cells unmix according to their adhesive properties. Using avariety of shear and creep simulations, we study tissue rheology by measuring yield stresses,shear viscosities, complex viscosities as well as the loss tangents as a function of modelparameters. We find that cell division and apoptosis lead to a vanishing yield stress andfluid-like tissues. The effects of different adhesion strengths and levels of noise on the rheologyof the tissue are also measured. In addition, we find that the level of cell division and apoptosisdrives the diffusion of cells in the tissue. Finally, we present a method for measuring thecompressibility of the tissue and its response to external stress via cell division and apoptosis.
S Online supplementary data available from stacks.iop.org/PhysBio/8/026014/mmedia
1. Introduction
The development of tissues is an essential property thatdistinguishes complex multicellular species from culturesof unicellular organisms. In vertebrate tissue, single cellssacrifice the optimization of their individual growth rate for thewell-being of the entire organism, by performing specializedbeneficial functions.
Understanding the collective behavior of eukaryotic cellsconstituting a tissue is therefore of central importance fora variety of biological fields from embryogenesis to tumorprogression. In studies of tissues, emphasis has often beenput on signalling pathways. However, it has recently become
clear that mechanical effects play an important role in thegrowth and development of biological tissues. At the singlecell level, mechanical stresses couple to the orientation ofthe mitotic spindle during cell division [1]. Pressure has alsobeen shown to strongly influence the expression of some genesfor example during drosophila development or in tumors [2].Finally, there is now a large body of evidence suggesting thatcell differentiation depends on the mechanical properties ofthe substrate, in particular the value of its elastic modulus [3].
A macroscopic description of the mechanical orrheological properties of tissues requires a constitutiveequation which relates the local stress in the tissue to thestrain or the strain rate. An intuitive approach is to consider
1478-3975/11/026014+13$33.00 1 © 2011 IOP Publishing Ltd Printed in the UK

Phys. Biol. 8 (2011) 026014 M Basan et al
a tissue as an elastic solid, for which the stress only dependson the local strain at a given time, in general in a nonlinearway. The nonlinear elastic description of tissues has beenvery successful, for example, in explaining growth instabilitiesof plant tissues. In a completely opposite limit, followingthe seminal works of Steinberg and coworkers [4–6], it hasbeen argued that during early development, many tissuesshould be considered as liquids with a finite viscosity andan isotropic surface tension. Between these two regimes, anyintermediate complex fluid behavior is of course possible andin certain situations, tissues have been described as visco-elastic or plastic materials. The precise mechanical descriptionof tissues is still a matter of debate and it is therefore interestingto further investigate the rheological response of tissues toexternal forces [7, 8].
In an earlier work [9], we followed this line of thoughtand argued that tissues can effectively be treated as viscousfluids on the timescales of growth. We used these ideas tosuggest that mechanical competition due to the homeostaticgrowth pressure is an important part of tumor growth. Thehomeostatic state is defined as the steady state reached bya tissue when it is allowed to grow in a finite volume withno restriction on nutrients and growth factors. Using acontinuum hydrodynamic description of tissues, we studiedseveral biological questions including the origin of metastaticinefficiency [9] and fingering instabilities frequently observedat the stromal–epithelial interface [10]. More recently, weinvestigated the effect of cell division and apoptosis on tissuerheology [11]. While several studies show that many tissuessuch as embryonic epithelial tissues behave as viscous fluids[4–6], we argue that tissues, which are completely elastic atshort times, undergo fluidization due to coupling betweenstress and the cell division-apoptosis rate, which relaxesresidual stress and leads to a visco-elastic behavior with arelaxation time of the order of the inverse rate of cell turnover.
In this paper, we use a particle-based tissue simulationtechnique based on a few intuitive assumptions about single-cell behavior to study the macroscopic properties of tissuessuch as their rheology. Our simulation leads to a well-definedhomeostatic state and naturally gives rise to pressure-basedtissue competition. We also discuss the role of cell divisionand apoptosis on tissue fluidization as introduced in our earlierwork [11] and present additional data on this effect.
Particle-based simulations have been extensively used tostudy complex fluids such as colloidal suspensions or polymermelts. They have also already been implemented to studythe dynamics of biological tissues taking into account celldivision, apoptosis, and active forces. In most of the particle-based tissue simulations, Langevin dynamics models wereemployed, for example, we refer to the numerous works bythe group of Drasdo [12–21].
Early particle-based tissue simulations were conceivedfor understanding simple in vitro experiments with two-dimensional cell populations spreading on a substrate. Thegrowth curves in these experiments were extensively studiedby Bru et al [22, 23]. In these simulations, the cells takethe form of dumbbells during cell division and the orientationof the division axis is in the direction of the maximum force
exerted on the cell. The adhesive interactions between cells aredescribed by a pair potential based on the Johnson–Kendall–Roberts (JKR) approximation, which gives the interactionforce between two adhesive spheres. The Langevin equationsof motion are obtained by balancing the friction forcesarising from the interaction with the substrate with externalcompression forces, adhesion forces and random forces due tocellular movement.
The growth of three-dimensional cell aggregates has alsobeen investigated extensively using particle-based models[15, 16, 24]. Experimental results on the growth of tumorspheroids limited in size by nutrients such as oxygen andglucose have largely been reproduced in these simulations[25, 26]. In a somewhat different approach, more biologicaldetails of individual cells have been incorporated by modelinga cell as a multi-particle structure [27, 28]. For example,Sandersius and Newman investigate tissue rheology with avariety of computer experiments.
In the following, we use a similar idea and describeeach cell as two repelling particles. We first introduce oursimulation model in section 2. Then, we discuss growthand homeostatic state in section 3. Tissue surface tensionsand cell sorting are discussed in section 4. The last twosections are devoted to the diffusion of cells inside the tissue(section 5) and the rheological properties of the simulatedtissues (section 6). The paper ends with a summary and adiscussion of our main results.
2. Tissue simulations
In this work, we use a minimalist approach to model cells andtissue growth. By this, we mean that we use a simple modelthat fulfills a certain set of requirements for the tissue. Inparticular, our simulated cells should
• readily adhere to each other,• maintain volume exclusion,• exert an active growth pressure on their surrounding,• expand in size until reaching a size checkpoint,• divide when reaching this size checkpoint,• undergo apoptosis,• exert random forces on neighboring cells,• regulate to their homeostatic state via cell division and
apoptosis in a confined volume,• give rise to tissue surface tension,• comply with force balance and momentum conservation.
The model that we present here—though simple andpurely mechanical—fulfills all of the above requirements.
2.1. Individual cells
Based on experimental evidence [29], we assume that a givencell type has a particular size checkpoint, which it mustovercome in order to enter mitosis. To describe cell growth,we use a model in which each cell consists of two particlesi and j interacting via a repulsive growth force �FG
ij . Thedistance between the two particles, constituting the same cell,represents the cell’s size. When the distance between the cell
2
Phys. Biol. 8 (2011) 026014 M Basan et al
particles exceeds a size threshold Rc, the cell divides. To createthe new cell, particles must be inserted. After the division,each of the original particles belongs to a different cell. Thenew particles are then placed randomly within a short distancerc from the particles of the original cell. In some simulations,we impose vanishing cell division by setting �FG
ij = 0 and Rc
large. While cell division is implemented in this deterministicmanner, apoptosis (and other forms of cell death) is includedby removing cells randomly at a constant rate ka. For theinteraction between cells (adhesion and volume exclusion),forces are defined between the cell particles i and j that donot belong to the same cell. These interact via a short rangerepulsive force �FCC
ij and a constant attractive force �Faij if they
are within a certain range of each other.The total conservative force �Fi acting on particle i is thus
Fi = FGic +
∑j
( �FCCij + �Fa
ij
)(1)
where the sum runs over all particles j except for the particlebelonging to the same cell c.
2.2. Energy dissipation
Energy is dissipated by using a dissipative particle dynamics(DPD) type thermostat [30] on the particles. DPD is a widelyused simulation technique to study hydrodynamics of complexfluids. Details about implementing DPD are readily availablein the literature [30]. Here, we just note some features thatare of particular importance for our simulations: the DPDalgorithm introduces viscous dissipation between cells, whilepreserving momentum balance. The dissipative force reads
FDi = −γω(ri,j )((vj − vi)rij ) ˆrij (2)
where �rij = �rj − �ri is the vector between the particles i and j
located at �ri and �rj , respectively. The modulus and directionof �rij are denoted by rij and rij , respectively. A similarnotation holds for the velocity �vi . ω is a weight function (formore details, see [30]). Since cells consist of two particlesin our model, the dissipation constants between particlesof different cells γt and between the particles constitutingthe same cell γc can be chosen independently. We alsoimplement a background dissipation γb to model the effectof an extracellular matrix. Because we are mainly interestedin studying tissues without bulk extracellular matrix such asepithelia, we typically set this dissipation coefficient to verylow values (about three orders of magnitude smaller than γc
3)in our simulations.
At the cost of higher numerical complexity, the majoradvantage of DPD versus Langevin simulations is that DPDdoes not assume the background dissipation to be the dominantmode of dissipation. Indeed, in epithelial tissues, where theextracellular matrix is typically absent, dissipative forces aretransferred to neighboring cells and not to the background. Inour simulation, a random force is added in addition, whichmimics motility forces from the cytoskeleton. The noiseamplitude kBTn is associated with an effective temperature and
3 Cell division and apoptosis break momentum balance. In simulationswhere momentum cannot be dissipated to the boundaries, a small backgrounddissipation is thus needed.
for equilibrium systems fulfills the Stokes–Einstein relation.Regarding weight functions and integrators, we follow method3.1 of [30].
2.3. Interaction forces
To reduce the number of parameters, we use simple centralforces. The force FG
ij felt by particle i due to particle j
belonging to the same cell and driving the expansion of thatcell is proportional to the growth coefficient B. FG
ij is given by
FGij = B
(rji + r0)2rj i . (3)
For adhesion and volume exclusion between cells, equivalentforces are defined between cell particles. Volume exclusion ofcells is modeled by a repulsive force on particles constitutingdifferent cells of the form
FCCij =
{f0
(R5
pp
/r−5ji − 1
)rj i if rji � Rpp
0 if rji > Rpp.(4)
Finally, adhesion is implemented via a constant force �Faij =
−f1rj i between particles of different cells within a rangerij � Rpp, with f 0 and f 1 the repulsive and attractive cell–cellpotential coefficients, respectively.
We find that tissue behavior on large scales does notdepend on the details of the interaction forces, consistent withresults by Drasdo et al [19]. With these three forces and ourbasic division and apoptosis rules, we arrive at a minimalistictissue model. Although interactions in real tissues are muchmore complex, we argue that some fundamental and universalproperties of tissues are captured with this approach.
2.4. Standard tissue and units
To facilitate the comparison of different simulations, we definea standard tissue (see table 1) which we use as a starting point toexplore parameter space. Well-defined, measurable propertiesof the standard tissue are chosen to rescale data and parametersfor comparison with experiments. All values and numericalfigures presented in this work without further comments aregiven in terms of these units. Values can be converted toSI units using table 2. An asterisk ∗ denotes quantitiesnormalized by the corresponding value in the standard tissue(e.g. B∗ = B/Bref).
As a unit of time tref , we use the inverse growth rateof the unconfined standard tissue. The unit length lref isdefined by the effective cell diameter lref := 2(3/(4πρ)1/3
in the standard tissue at its homeostatic state. The cellnumber density ρ for this definition is measured in periodicboundary conditions with box lengths 5.59. Finally, we use thehomeostatic pressure of the standard tissue grown in a doubleplate compartment as the unit stress pref .
3. Growth, competition and homeostatic state
3.1. Tissue growth
When unconfined by compartment walls or lack of nutrients,the tissue grows exponentially forming a spheroid (see
3
Phys. Biol. 8 (2011) 026014 M Basan et al
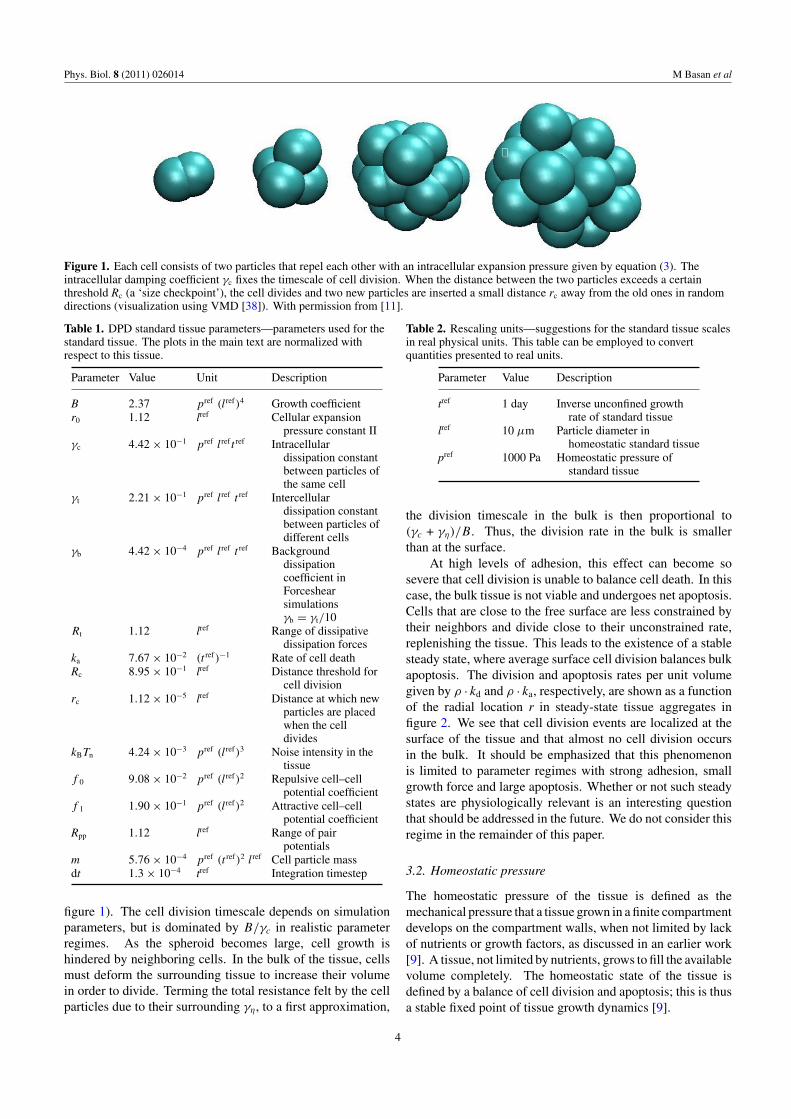
Figure 1. Each cell consists of two particles that repel each other with an intracellular expansion pressure given by equation (3). Theintracellular damping coefficient γc fixes the timescale of cell division. When the distance between the two particles exceeds a certainthreshold Rc (a ‘size checkpoint’), the cell divides and two new particles are inserted a small distance rc away from the old ones in randomdirections (visualization using VMD [38]). With permission from [11].
Table 1. DPD standard tissue parameters—parameters used for thestandard tissue. The plots in the main text are normalized withrespect to this tissue.
Parameter Value Unit Description
B 2.37 pref (lref)4 Growth coefficientr0 1.12 lref Cellular expansion
pressure constant IIγc 4.42 × 10⁻¹ pref lref t ref Intracellular
dissipation constantbetween particles ofthe same cell
γt 2.21 × 10⁻¹ pref lref t ref Intercellulardissipation constantbetween particles ofdifferent cells
γb 4.42 × 10⁻⁴ pref lref t ref Backgrounddissipationcoefficient inForceshearsimulationsγb = γt/10
Rt 1.12 lref Range of dissipativedissipation forces
ka 7.67 × 10⁻² (t ref)−1 Rate of cell deathRc 8.95 × 10⁻¹ lref Distance threshold for
cell divisionrc 1.12 × 10⁻⁵ lref Distance at which new
particles are placedwhen the celldivides
kBTn 4.24 × 10⁻³ pref (lref)3 Noise intensity in thetissue
f 0 9.08 × 10⁻² pref (lref)2 Repulsive cell–cellpotential coefficient
f 1 1.90 × 10⁻¹ pref (lref)2 Attractive cell–cellpotential coefficient
Rpp 1.12 lref Range of pairpotentials
m 5.76 × 10⁻⁴ pref (t ref)2 lref Cell particle massdt 1.3 × 10⁻⁴ tref Integration timestep
figure 1). The cell division timescale depends on simulationparameters, but is dominated by B/γc in realistic parameterregimes. As the spheroid becomes large, cell growth ishindered by neighboring cells. In the bulk of the tissue, cellsmust deform the surrounding tissue to increase their volumein order to divide. Terming the total resistance felt by the cellparticles due to their surrounding γη, to a first approximation,
Table 2. Rescaling units—suggestions for the standard tissue scalesin real physical units. This table can be employed to convertquantities presented to real units.
Parameter Value Description
tref 1 day Inverse unconfined growthrate of standard tissue
lref 10 μm Particle diameter inhomeostatic standard tissue
pref 1000 Pa Homeostatic pressure ofstandard tissue
the division timescale in the bulk is then proportional to(γc + γη)/B. Thus, the division rate in the bulk is smallerthan at the surface.
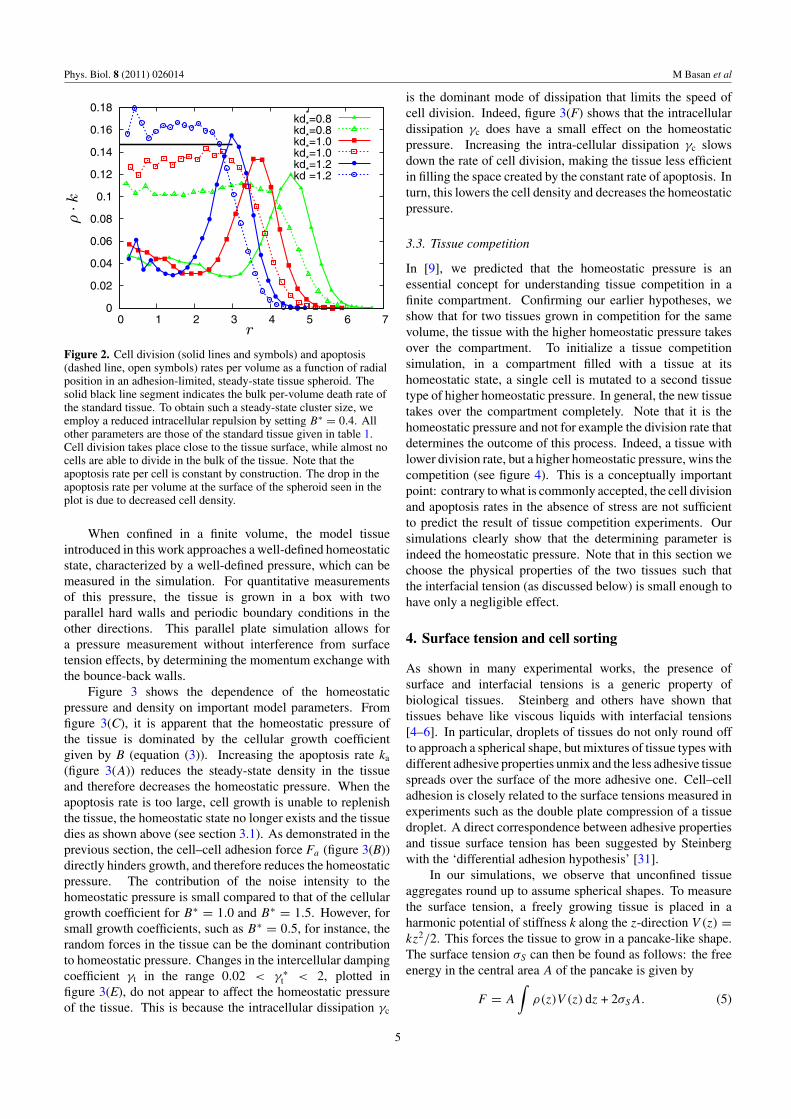
At high levels of adhesion, this effect can become sosevere that cell division is unable to balance cell death. In thiscase, the bulk tissue is not viable and undergoes net apoptosis.Cells that are close to the free surface are less constrained bytheir neighbors and divide close to their unconstrained rate,replenishing the tissue. This leads to the existence of a stablesteady state, where average surface cell division balances bulkapoptosis. The division and apoptosis rates per unit volumegiven by ρ · kd and ρ · ka, respectively, are shown as a functionof the radial location r in steady-state tissue aggregates infigure 2. We see that cell division events are localized at thesurface of the tissue and that almost no cell division occursin the bulk. It should be emphasized that this phenomenonis limited to parameter regimes with strong adhesion, smallgrowth force and large apoptosis. Whether or not such steadystates are physiologically relevant is an interesting questionthat should be addressed in the future. We do not consider thisregime in the remainder of this paper.
3.2. Homeostatic pressure
The homeostatic pressure of the tissue is defined as themechanical pressure that a tissue grown in a finite compartmentdevelops on the compartment walls, when not limited by lackof nutrients or growth factors, as discussed in an earlier work[9]. A tissue, not limited by nutrients, grows to fill the availablevolume completely. The homeostatic state of the tissue isdefined by a balance of cell division and apoptosis; this is thusa stable fixed point of tissue growth dynamics [9].
4
Phys. Biol. 8 (2011) 026014 M Basan et al
0
0.02
0.04
0.06
0.08
0.1
0.12
0.14
0.16
0.18
0 1 2 3 4 5 6 7
kd*=0.8kd*=0.8kd*=1.0kd*=1.0kd*=1.2kd*=1.2
r
ρ·k
Figure 2. Cell division (solid lines and symbols) and apoptosis(dashed line, open symbols) rates per volume as a function of radialposition in an adhesion-limited, steady-state tissue spheroid. Thesolid black line segment indicates the bulk per-volume death rate ofthe standard tissue. To obtain such a steady-state cluster size, weemploy a reduced intracellular repulsion by setting B∗ = 0.4. Allother parameters are those of the standard tissue given in table 1.Cell division takes place close to the tissue surface, while almost nocells are able to divide in the bulk of the tissue. Note that theapoptosis rate per cell is constant by construction. The drop in theapoptosis rate per volume at the surface of the spheroid seen in theplot is due to decreased cell density.
When confined in a finite volume, the model tissueintroduced in this work approaches a well-defined homeostaticstate, characterized by a well-defined pressure, which can bemeasured in the simulation. For quantitative measurementsof this pressure, the tissue is grown in a box with twoparallel hard walls and periodic boundary conditions in theother directions. This parallel plate simulation allows fora pressure measurement without interference from surfacetension effects, by determining the momentum exchange withthe bounce-back walls.
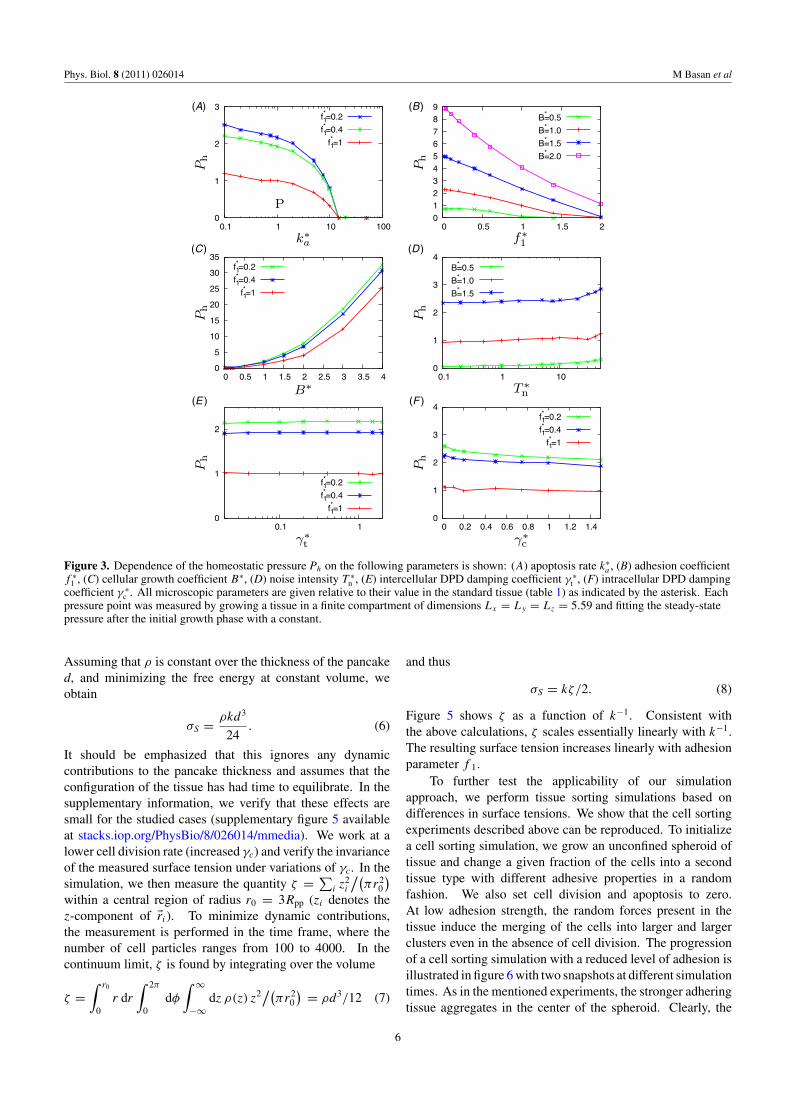
Figure 3 shows the dependence of the homeostaticpressure and density on important model parameters. Fromfigure 3(C), it is apparent that the homeostatic pressure ofthe tissue is dominated by the cellular growth coefficientgiven by B (equation (3)). Increasing the apoptosis rate ka
(figure 3(A)) reduces the steady-state density in the tissueand therefore decreases the homeostatic pressure. When theapoptosis rate is too large, cell growth is unable to replenishthe tissue, the homeostatic state no longer exists and the tissuedies as shown above (see section 3.1). As demonstrated in theprevious section, the cell–cell adhesion force Fa (figure 3(B))directly hinders growth, and therefore reduces the homeostaticpressure. The contribution of the noise intensity to thehomeostatic pressure is small compared to that of the cellulargrowth coefficient for B∗ = 1.0 and B∗ = 1.5. However, forsmall growth coefficients, such as B∗ = 0.5, for instance, therandom forces in the tissue can be the dominant contributionto homeostatic pressure. Changes in the intercellular dampingcoefficient γt in the range 0.02 < γ ∗
t < 2, plotted infigure 3(E), do not appear to affect the homeostatic pressureof the tissue. This is because the intracellular dissipation γc
is the dominant mode of dissipation that limits the speed ofcell division. Indeed, figure 3(F) shows that the intracellulardissipation γc does have a small effect on the homeostaticpressure. Increasing the intra-cellular dissipation γc slowsdown the rate of cell division, making the tissue less efficientin filling the space created by the constant rate of apoptosis. Inturn, this lowers the cell density and decreases the homeostaticpressure.
3.3. Tissue competition
In [9], we predicted that the homeostatic pressure is anessential concept for understanding tissue competition in afinite compartment. Confirming our earlier hypotheses, weshow that for two tissues grown in competition for the samevolume, the tissue with the higher homeostatic pressure takesover the compartment. To initialize a tissue competitionsimulation, in a compartment filled with a tissue at itshomeostatic state, a single cell is mutated to a second tissuetype of higher homeostatic pressure. In general, the new tissuetakes over the compartment completely. Note that it is thehomeostatic pressure and not for example the division rate thatdetermines the outcome of this process. Indeed, a tissue withlower division rate, but a higher homeostatic pressure, wins thecompetition (see figure 4). This is a conceptually importantpoint: contrary to what is commonly accepted, the cell divisionand apoptosis rates in the absence of stress are not sufficientto predict the result of tissue competition experiments. Oursimulations clearly show that the determining parameter isindeed the homeostatic pressure. Note that in this section wechoose the physical properties of the two tissues such thatthe interfacial tension (as discussed below) is small enough tohave only a negligible effect.
4. Surface tension and cell sorting
As shown in many experimental works, the presence ofsurface and interfacial tensions is a generic property ofbiological tissues. Steinberg and others have shown thattissues behave like viscous liquids with interfacial tensions[4–6]. In particular, droplets of tissues do not only round offto approach a spherical shape, but mixtures of tissue types withdifferent adhesive properties unmix and the less adhesive tissuespreads over the surface of the more adhesive one. Cell–celladhesion is closely related to the surface tensions measured inexperiments such as the double plate compression of a tissuedroplet. A direct correspondence between adhesive propertiesand tissue surface tension has been suggested by Steinbergwith the ‘differential adhesion hypothesis’ [31].
In our simulations, we observe that unconfined tissueaggregates round up to assume spherical shapes. To measurethe surface tension, a freely growing tissue is placed in aharmonic potential of stiffness k along the z-direction V (z) =kz2/2. This forces the tissue to grow in a pancake-like shape.The surface tension σS can then be found as follows: the freeenergy in the central area A of the pancake is given by
F = A
∫ρ(z)V (z) dz + 2σSA. (5)
5
Phys. Biol. 8 (2011) 026014 M Basan et al
k∗a
Ph
P
f∗1
Ph
B∗
Ph
T ∗n
Ph
γ∗t
Ph
γ∗c
Ph
(A) (B)
(C) (D )
(E ) (F )
Figure 3. Dependence of the homeostatic pressure Ph on the following parameters is shown: (A) apoptosis rate k∗a , (B) adhesion coefficient
f ∗1 , (C) cellular growth coefficient B∗, (D) noise intensity T ∗
n , (E) intercellular DPD damping coefficient γ ∗t , (F) intracellular DPD damping
coefficient γ ∗c . All microscopic parameters are given relative to their value in the standard tissue (table 1) as indicated by the asterisk. Each
pressure point was measured by growing a tissue in a finite compartment of dimensions Lx = Ly = Lz = 5.59 and fitting the steady-statepressure after the initial growth phase with a constant.
Assuming that ρ is constant over the thickness of the pancaked, and minimizing the free energy at constant volume, weobtain
σS = ρkd3
24. (6)
It should be emphasized that this ignores any dynamiccontributions to the pancake thickness and assumes that theconfiguration of the tissue has had time to equilibrate. In thesupplementary information, we verify that these effects aresmall for the studied cases (supplementary figure 5 availableat stacks.iop.org/PhysBio/8/026014/mmedia). We work at alower cell division rate (increased γc) and verify the invarianceof the measured surface tension under variations of γc. In thesimulation, we then measure the quantity ζ = ∑
i z2i
/(πr2
0
)within a central region of radius r0 = 3Rpp (zi denotes thez-component of �ri). To minimize dynamic contributions,the measurement is performed in the time frame, where thenumber of cell particles ranges from 100 to 4000. In thecontinuum limit, ζ is found by integrating over the volume
ζ =∫ r0
0r dr
∫ 2π
0dφ
∫ ∞
−∞dz ρ(z) z2
/(πr2
0
) = ρd3/12 (7)
and thus
σS = kζ/2. (8)
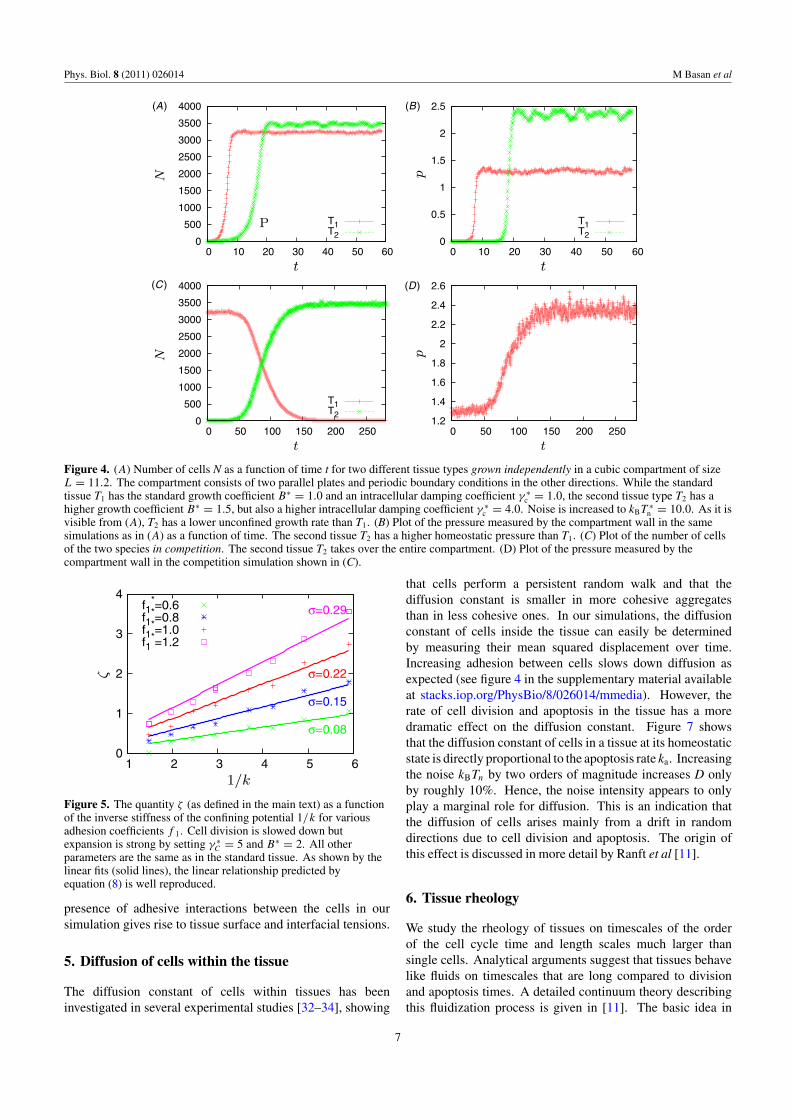
Figure 5 shows ζ as a function of k−1. Consistent withthe above calculations, ζ scales essentially linearly with k−1.The resulting surface tension increases linearly with adhesionparameter f 1.
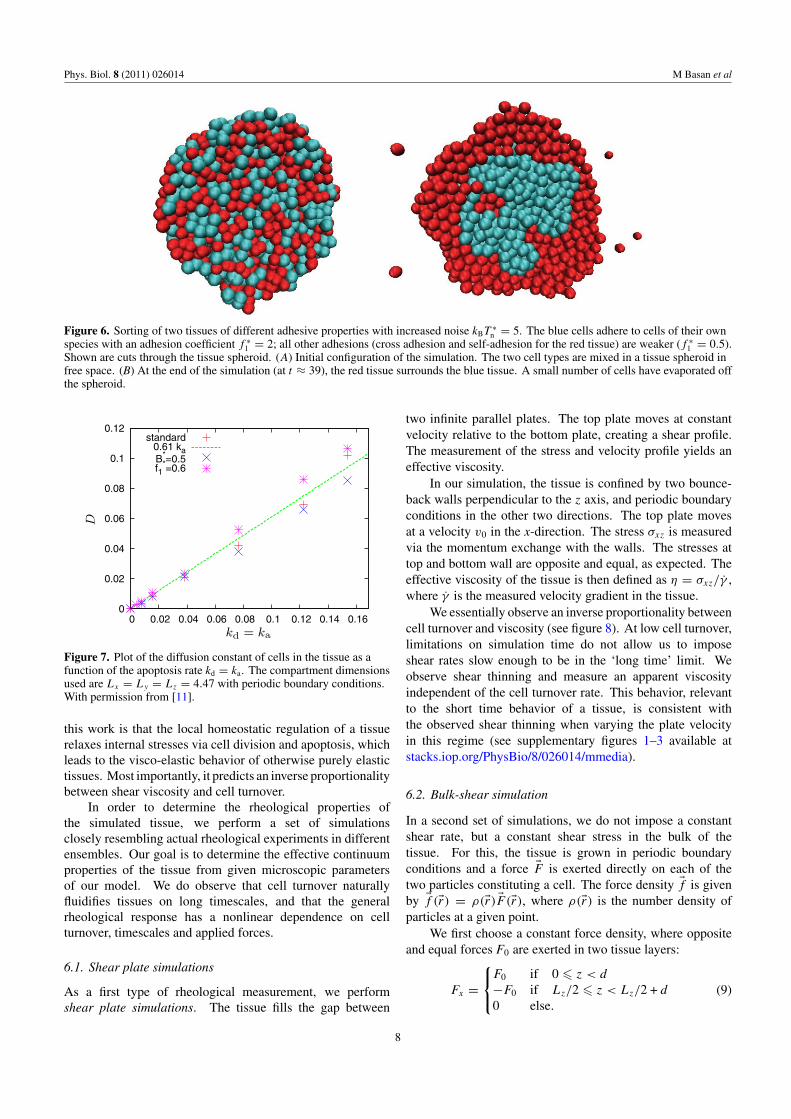
To further test the applicability of our simulationapproach, we perform tissue sorting simulations based ondifferences in surface tensions. We show that the cell sortingexperiments described above can be reproduced. To initializea cell sorting simulation, we grow an unconfined spheroid oftissue and change a given fraction of the cells into a secondtissue type with different adhesive properties in a randomfashion. We also set cell division and apoptosis to zero.At low adhesion strength, the random forces present in thetissue induce the merging of the cells into larger and largerclusters even in the absence of cell division. The progressionof a cell sorting simulation with a reduced level of adhesion isillustrated in figure 6 with two snapshots at different simulationtimes. As in the mentioned experiments, the stronger adheringtissue aggregates in the center of the spheroid. Clearly, the
6
Phys. Biol. 8 (2011) 026014 M Basan et al
t
N
P
t
p
t
N
t
p
(A) (B )
(C ) (D)
Figure 4. (A) Number of cells N as a function of time t for two different tissue types grown independently in a cubic compartment of sizeL = 11.2. The compartment consists of two parallel plates and periodic boundary conditions in the other directions. While the standardtissue T1 has the standard growth coefficient B∗ = 1.0 and an intracellular damping coefficient γ ∗
c = 1.0, the second tissue type T2 has ahigher growth coefficient B∗ = 1.5, but also a higher intracellular damping coefficient γ ∗
c = 4.0. Noise is increased to kBT ∗n = 10.0. As it is
visible from (A), T2 has a lower unconfined growth rate than T1. (B) Plot of the pressure measured by the compartment wall in the samesimulations as in (A) as a function of time. The second tissue T2 has a higher homeostatic pressure than T1. (C) Plot of the number of cellsof the two species in competition. The second tissue T2 takes over the entire compartment. (D) Plot of the pressure measured by thecompartment wall in the competition simulation shown in (C).
0
1
2
3
4
1 2 3 4 5 6
σ=0.22
σ=0.08
σ=0.15
σ=0.29f1*=0.6
f1*=0.8
f1*=1.0
f1*=1.2
ζ
1/k
Figure 5. The quantity ζ (as defined in the main text) as a functionof the inverse stiffness of the confining potential 1/k for variousadhesion coefficients f 1. Cell division is slowed down butexpansion is strong by setting γ ∗
C = 5 and B∗ = 2. All otherparameters are the same as in the standard tissue. As shown by thelinear fits (solid lines), the linear relationship predicted byequation (8) is well reproduced.
presence of adhesive interactions between the cells in oursimulation gives rise to tissue surface and interfacial tensions.
5. Diffusion of cells within the tissue
The diffusion constant of cells within tissues has beeninvestigated in several experimental studies [32–34], showing
that cells perform a persistent random walk and that thediffusion constant is smaller in more cohesive aggregatesthan in less cohesive ones. In our simulations, the diffusionconstant of cells inside the tissue can easily be determinedby measuring their mean squared displacement over time.Increasing adhesion between cells slows down diffusion asexpected (see figure 4 in the supplementary material availableat stacks.iop.org/PhysBio/8/026014/mmedia). However, therate of cell division and apoptosis in the tissue has a moredramatic effect on the diffusion constant. Figure 7 showsthat the diffusion constant of cells in a tissue at its homeostaticstate is directly proportional to the apoptosis rate ka. Increasingthe noise kBTn by two orders of magnitude increases D onlyby roughly 10%. Hence, the noise intensity appears to onlyplay a marginal role for diffusion. This is an indication thatthe diffusion of cells arises mainly from a drift in randomdirections due to cell division and apoptosis. The origin ofthis effect is discussed in more detail by Ranft et al [11].
6. Tissue rheology
We study the rheology of tissues on timescales of the orderof the cell cycle time and length scales much larger thansingle cells. Analytical arguments suggest that tissues behavelike fluids on timescales that are long compared to divisionand apoptosis times. A detailed continuum theory describingthis fluidization process is given in [11]. The basic idea in
7
Phys. Biol. 8 (2011) 026014 M Basan et al
Figure 6. Sorting of two tissues of different adhesive properties with increased noise kBT ∗n = 5. The blue cells adhere to cells of their own
species with an adhesion coefficient f ∗1 = 2; all other adhesions (cross adhesion and self-adhesion for the red tissue) are weaker (f ∗
1 = 0.5).Shown are cuts through the tissue spheroid. (A) Initial configuration of the simulation. The two cell types are mixed in a tissue spheroid infree space. (B) At the end of the simulation (at t ≈ 39), the red tissue surrounds the blue tissue. A small number of cells have evaporated offthe spheroid.
0
0.02
0.04
0.06
0.08
0.1
0.12
0 0.02 0.04 0.06 0.08 0.1 0.12 0.14 0.16
standard0.61 kaB*=0.5f1
*=0.6
D
kd = ka
Figure 7. Plot of the diffusion constant of cells in the tissue as afunction of the apoptosis rate kd = ka. The compartment dimensionsused are Lx = Ly = Lz = 4.47 with periodic boundary conditions.With permission from [11].
this work is that the local homeostatic regulation of a tissuerelaxes internal stresses via cell division and apoptosis, whichleads to the visco-elastic behavior of otherwise purely elastictissues. Most importantly, it predicts an inverse proportionalitybetween shear viscosity and cell turnover.
In order to determine the rheological properties ofthe simulated tissue, we perform a set of simulationsclosely resembling actual rheological experiments in differentensembles. Our goal is to determine the effective continuumproperties of the tissue from given microscopic parametersof our model. We do observe that cell turnover naturallyfluidifies tissues on long timescales, and that the generalrheological response has a nonlinear dependence on cellturnover, timescales and applied forces.
6.1. Shear plate simulations
As a first type of rheological measurement, we performshear plate simulations. The tissue fills the gap between
two infinite parallel plates. The top plate moves at constantvelocity relative to the bottom plate, creating a shear profile.The measurement of the stress and velocity profile yields aneffective viscosity.
In our simulation, the tissue is confined by two bounce-back walls perpendicular to the z axis, and periodic boundaryconditions in the other two directions. The top plate movesat a velocity v0 in the x-direction. The stress σxz is measuredvia the momentum exchange with the walls. The stresses attop and bottom wall are opposite and equal, as expected. Theeffective viscosity of the tissue is then defined as η = σxz/γ ,where γ is the measured velocity gradient in the tissue.
We essentially observe an inverse proportionality betweencell turnover and viscosity (see figure 8). At low cell turnover,limitations on simulation time do not allow us to imposeshear rates slow enough to be in the ‘long time’ limit. Weobserve shear thinning and measure an apparent viscosityindependent of the cell turnover rate. This behavior, relevantto the short time behavior of a tissue, is consistent withthe observed shear thinning when varying the plate velocityin this regime (see supplementary figures 1–3 available atstacks.iop.org/PhysBio/8/026014/mmedia).
6.2. Bulk-shear simulation
In a second set of simulations, we do not impose a constantshear rate, but a constant shear stress in the bulk of thetissue. For this, the tissue is grown in periodic boundaryconditions and a force �F is exerted directly on each of thetwo particles constituting a cell. The force density �f is givenby �f (�r) = ρ(�r) �F(�r), where ρ(�r) is the number density ofparticles at a given point.
We first choose a constant force density, where oppositeand equal forces F0 are exerted in two tissue layers:
Fx =⎧⎨⎩
F0 if 0 � z < d
−F0 if Lz/2 � z < Lz/2 + d
0 else.(9)
8
Phys. Biol. 8 (2011) 026014 M Basan et al
0.1
1
10
100
0.001 0.01 0.1 1
standard
kd-1.19
B*=0.5, γ*=0.5f1
*=0.6
kBTn*=0.1
kd = ka
σ/γ
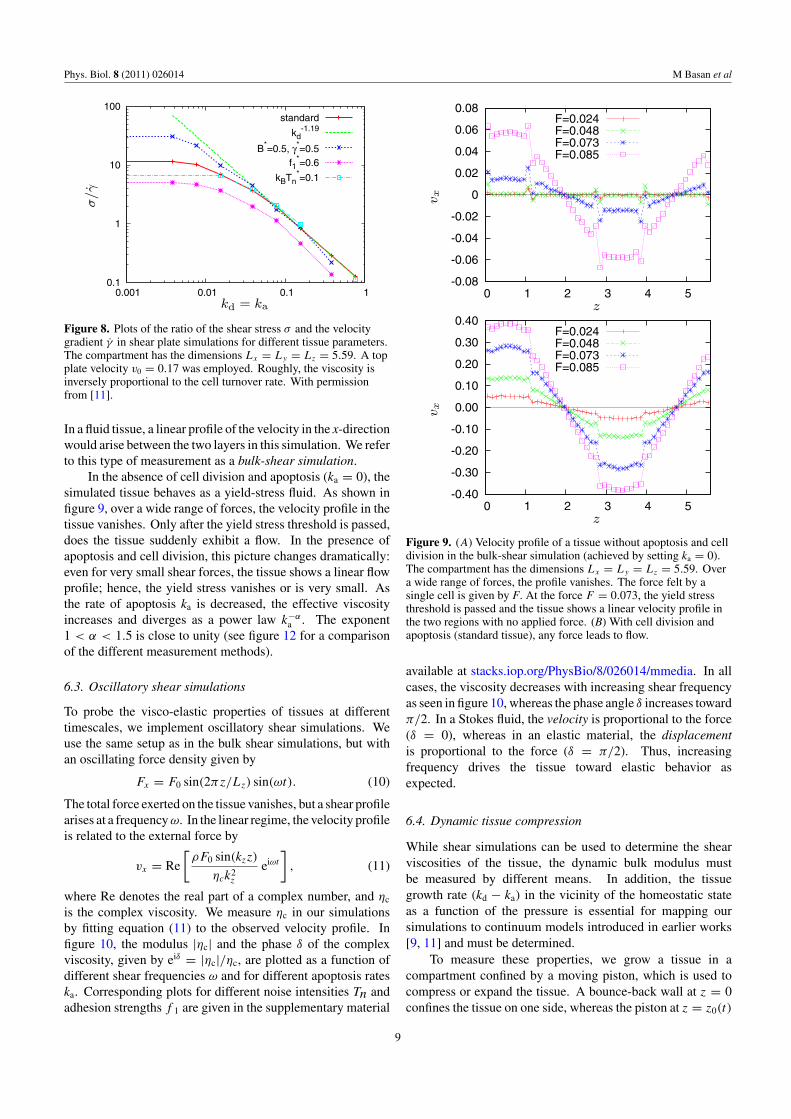
Figure 8. Plots of the ratio of the shear stress σ and the velocitygradient γ in shear plate simulations for different tissue parameters.The compartment has the dimensions Lx = Ly = Lz = 5.59. A topplate velocity v0 = 0.17 was employed. Roughly, the viscosity isinversely proportional to the cell turnover rate. With permissionfrom [11].
In a fluid tissue, a linear profile of the velocity in the x-directionwould arise between the two layers in this simulation. We referto this type of measurement as a bulk-shear simulation.
In the absence of cell division and apoptosis (ka = 0), thesimulated tissue behaves as a yield-stress fluid. As shown infigure 9, over a wide range of forces, the velocity profile in thetissue vanishes. Only after the yield stress threshold is passed,does the tissue suddenly exhibit a flow. In the presence ofapoptosis and cell division, this picture changes dramatically:even for very small shear forces, the tissue shows a linear flowprofile; hence, the yield stress vanishes or is very small. Asthe rate of apoptosis ka is decreased, the effective viscosityincreases and diverges as a power law k−α
a . The exponent1 < α < 1.5 is close to unity (see figure 12 for a comparisonof the different measurement methods).
6.3. Oscillatory shear simulations
To probe the visco-elastic properties of tissues at differenttimescales, we implement oscillatory shear simulations. Weuse the same setup as in the bulk shear simulations, but withan oscillating force density given by
Fx = F0 sin(2πz/Lz) sin(ωt). (10)
The total force exerted on the tissue vanishes, but a shear profilearises at a frequency ω. In the linear regime, the velocity profileis related to the external force by
vx = Re
[ρF0 sin(kzz)
ηck2z
eiωt
], (11)
where Re denotes the real part of a complex number, and ηc
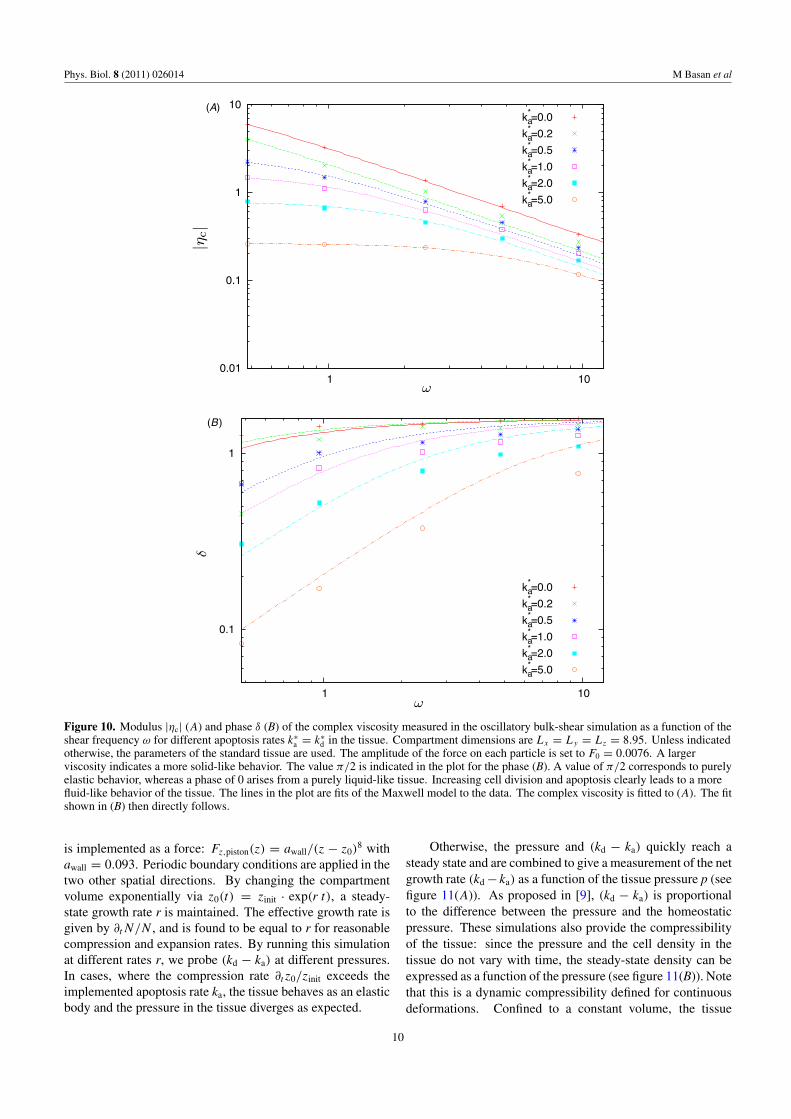
is the complex viscosity. We measure ηc in our simulationsby fitting equation (11) to the observed velocity profile. Infigure 10, the modulus |ηc| and the phase δ of the complexviscosity, given by eiδ = |ηc|/ηc, are plotted as a function ofdifferent shear frequencies ω and for different apoptosis rateska. Corresponding plots for different noise intensities Tn andadhesion strengths f 1 are given in the supplementary material
-0.08
-0.06
-0.04
-0.02
0
0.02
0.04
0.06
0.08
0 1 2 3 4 5
F=0.024F=0.048F=0.073F=0.085
z
vx
-0.40
-0.30
-0.20
-0.10
0.00
0.10
0.20
0.30
0.40
0 1 2 3 4 5
F=0.024F=0.048F=0.073F=0.085
z
vx
Figure 9. (A) Velocity profile of a tissue without apoptosis and celldivision in the bulk-shear simulation (achieved by setting ka = 0).The compartment has the dimensions Lx = Ly = Lz = 5.59. Overa wide range of forces, the profile vanishes. The force felt by asingle cell is given by F. At the force F = 0.073, the yield stressthreshold is passed and the tissue shows a linear velocity profile inthe two regions with no applied force. (B) With cell division andapoptosis (standard tissue), any force leads to flow.
available at stacks.iop.org/PhysBio/8/026014/mmedia. In allcases, the viscosity decreases with increasing shear frequencyas seen in figure 10, whereas the phase angle δ increases towardπ/2. In a Stokes fluid, the velocity is proportional to the force(δ = 0), whereas in an elastic material, the displacementis proportional to the force (δ = π/2). Thus, increasingfrequency drives the tissue toward elastic behavior asexpected.
6.4. Dynamic tissue compression
While shear simulations can be used to determine the shearviscosities of the tissue, the dynamic bulk modulus mustbe measured by different means. In addition, the tissuegrowth rate (kd − ka) in the vicinity of the homeostatic stateas a function of the pressure is essential for mapping oursimulations to continuum models introduced in earlier works[9, 11] and must be determined.
To measure these properties, we grow a tissue in acompartment confined by a moving piston, which is used tocompress or expand the tissue. A bounce-back wall at z = 0confines the tissue on one side, whereas the piston at z = z0(t)
9
Phys. Biol. 8 (2011) 026014 M Basan et al
|η c|
ω
δ
ω
(A)
(B )
Figure 10. Modulus |ηc| (A) and phase δ (B) of the complex viscosity measured in the oscillatory bulk-shear simulation as a function of theshear frequency ω for different apoptosis rates k∗
a = k∗d in the tissue. Compartment dimensions are Lx = Ly = Lz = 8.95. Unless indicated
otherwise, the parameters of the standard tissue are used. The amplitude of the force on each particle is set to F0 = 0.0076. A largerviscosity indicates a more solid-like behavior. The value π/2 is indicated in the plot for the phase (B). A value of π/2 corresponds to purelyelastic behavior, whereas a phase of 0 arises from a purely liquid-like tissue. Increasing cell division and apoptosis clearly leads to a morefluid-like behavior of the tissue. The lines in the plot are fits of the Maxwell model to the data. The complex viscosity is fitted to (A). The fitshown in (B) then directly follows.
is implemented as a force: Fz,piston(z) = awall/(z − z0)8 with
awall = 0.093. Periodic boundary conditions are applied in thetwo other spatial directions. By changing the compartmentvolume exponentially via z0(t) = zinit · exp(r t), a steady-state growth rate r is maintained. The effective growth rate isgiven by ∂tN/N , and is found to be equal to r for reasonablecompression and expansion rates. By running this simulationat different rates r, we probe (kd − ka) at different pressures.In cases, where the compression rate ∂tz0/zinit exceeds theimplemented apoptosis rate ka, the tissue behaves as an elasticbody and the pressure in the tissue diverges as expected.
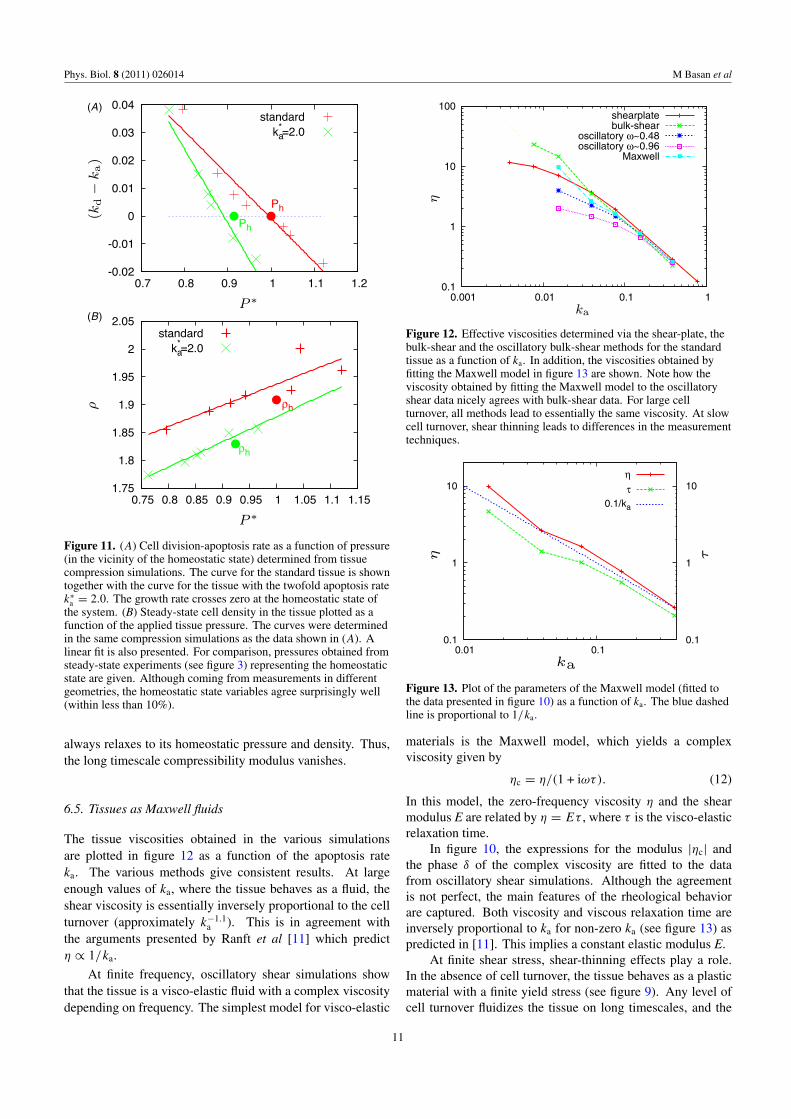
Otherwise, the pressure and (kd − ka) quickly reach asteady state and are combined to give a measurement of the netgrowth rate (kd − ka) as a function of the tissue pressure p (seefigure 11(A)). As proposed in [9], (kd − ka) is proportionalto the difference between the pressure and the homeostaticpressure. These simulations also provide the compressibilityof the tissue: since the pressure and the cell density in thetissue do not vary with time, the steady-state density can beexpressed as a function of the pressure (see figure 11(B)). Notethat this is a dynamic compressibility defined for continuousdeformations. Confined to a constant volume, the tissue
10
Phys. Biol. 8 (2011) 026014 M Basan et al
P ∗
(kd−
ka)
ρ
ρ
P ∗
ρ(A)
(B)
Figure 11. (A) Cell division-apoptosis rate as a function of pressure(in the vicinity of the homeostatic state) determined from tissuecompression simulations. The curve for the standard tissue is showntogether with the curve for the tissue with the twofold apoptosis ratek∗
a = 2.0. The growth rate crosses zero at the homeostatic state ofthe system. (B) Steady-state cell density in the tissue plotted as afunction of the applied tissue pressure. The curves were determinedin the same compression simulations as the data shown in (A). Alinear fit is also presented. For comparison, pressures obtained fromsteady-state experiments (see figure 3) representing the homeostaticstate are given. Although coming from measurements in differentgeometries, the homeostatic state variables agree surprisingly well(within less than 10%).
always relaxes to its homeostatic pressure and density. Thus,the long timescale compressibility modulus vanishes.
6.5. Tissues as Maxwell fluids
The tissue viscosities obtained in the various simulationsare plotted in figure 12 as a function of the apoptosis rateka. The various methods give consistent results. At largeenough values of ka, where the tissue behaves as a fluid, theshear viscosity is essentially inversely proportional to the cellturnover (approximately k−1.1
a ). This is in agreement withthe arguments presented by Ranft et al [11] which predictη ∝ 1/ka.
At finite frequency, oscillatory shear simulations showthat the tissue is a visco-elastic fluid with a complex viscositydepending on frequency. The simplest model for visco-elastic
0.1
1
10
100
0.001 0.01 0.1 1
shearplatebulk-shear
oscillatory ω~0.48oscillatory ω~0.96
Maxwell
η
ka
Figure 12. Effective viscosities determined via the shear-plate, thebulk-shear and the oscillatory bulk-shear methods for the standardtissue as a function of ka. In addition, the viscosities obtained byfitting the Maxwell model in figure 13 are shown. Note how theviscosity obtained by fitting the Maxwell model to the oscillatoryshear data nicely agrees with bulk-shear data. For large cellturnover, all methods lead to essentially the same viscosity. At slowcell turnover, shear thinning leads to differences in the measurementtechniques.
0.1
1
10
0.01 0.1 0.1
1
10ητ
0.1/ka
ka
η τFigure 13. Plot of the parameters of the Maxwell model (fitted tothe data presented in figure 10) as a function of ka. The blue dashedline is proportional to 1/ka.
materials is the Maxwell model, which yields a complexviscosity given by
ηc = η/(1 + iωτ). (12)
In this model, the zero-frequency viscosity η and the shearmodulus E are related by η = Eτ , where τ is the visco-elasticrelaxation time.
In figure 10, the expressions for the modulus |ηc| andthe phase δ of the complex viscosity are fitted to the datafrom oscillatory shear simulations. Although the agreementis not perfect, the main features of the rheological behaviorare captured. Both viscosity and viscous relaxation time areinversely proportional to ka for non-zero ka (see figure 13) aspredicted in [11]. This implies a constant elastic modulus E.
At finite shear stress, shear-thinning effects play a role.In the absence of cell turnover, the tissue behaves as a plasticmaterial with a finite yield stress (see figure 9). Any level ofcell turnover fluidizes the tissue on long timescales, and the
11
Phys. Biol. 8 (2011) 026014 M Basan et al
yield stress vanishes. The tissue is a non-Newtonian fluid witha viscosity varying with shear rate. Fitting this non-Newtonianbehavior with the corotational generalization of the Maxwellmodel [35, 36], which predicts shear thinning, agreement isonly found at low shear rates.
On short timescales, the tissue behaves like a solid, aslong as the level of stress in the tissue is below the yield stressthreshold. To a first approximation, the timescale, on whichthe transition between these two regimes takes place, is onthe order of the inverse rate of cell division and apoptosis.Note that the rheology at the timescales that we study is amacroscopic property of the tissue. It is dominated by cellturnover, and thus contrary to single-cell experiments wherethe rheology is dominated by the cytoskeleton [39–41], nopower-law dependence of G′ and G′′ is found.
7. Concluding remarks
In this work, we introduce a simple particle-based model forsimulating tissues. Each cell consists of two particles that repeleach other, giving cells the tendency to increase their volume.Cells divide deterministically when reaching a specific sizecheckpoint. The particles of different cells interact via apair potential that is repulsive at short distances to modelvolume exclusion and attractive at intermediate distances torepresent cell–cell adhesion. We show that tissues given bythis model behave in a realistic manner in many situations and,in particular, possess a well-defined homeostatic state. Thehomeostatic pressure and density are measured as functions ofthe model parameters. An important result is that when tissuesof different homeostatic pressures undergo a competition infinite volumes, the tissue with the higher homeostatic pressurewins by taking over the compartment. Indeed, we demonstratethat even if the tissue with the lower homeostatic pressure has amuch larger unconfined division rate, the tissue with the higherpressure wins the competition. We also show how a highernoise in the tissue—corresponding to a higher cellular mobilityfor example due to the loss of contact inhibition [37]—leads to an increased homeostatic pressure that could resultin neoplastic behavior. Furthermore, adhesive interactionsbetween cells are at the origin of tissue surface tension thatcause tissue aggregates to round up. Similarly, interfacialtensions which are responsible for the sorting of mixtures ofdifferent cells exist. We measure tissue surface tensions in oursimulation as a function of cell–cell adhesion strength.
Using a number of rheological simulations, we measurethe visco-elastic properties of the tissue and their dependenceon model parameters. The shear viscosity is measured both ina standard shear plate geometry and in a creep configurationin which an external force on the cells is imposed. To furtherprobe the rheology of the tissue, we use an oscillatory shearexperiment with a time-dependent external force. Using thistechnique, we measured the complex viscosity and the losstangent of the tissue. All three techniques lead to compatibleresults. In particular, we investigate the dependence of therheological properties on the strength of cell–cell adhesion f 1,the level of noise Tn and the rate of apoptosis ka in the tissue.Both the lower levels of cell–cell adhesion and the higher
levels of noise lead to more fluid-like behavior of the tissue;the shear viscosity η, the modulus of the complex viscosities|ηc|, as well as the phase shift δ decreases. The apoptosisrate in the tissue has an even more dramatic effect on tissuerheology: for a vanishing apoptosis rate, the tissue has a finiteyield stress and exhibits typical plastic behavior, while for anon-zero rate of apoptosis, the yield stress vanishes. Hence,cell division and apoptosis lead to fluidization of the tissue.We find that the shear viscosity decreases with the apoptosisrate with a power law close to 1/ka.
We also study the diffusion of cells within the tissue:in parameter regimes where the fluidization of the tissue iscaused by cell division and apoptosis, the diffusion constantin the tissue is directly proportional to the rate of cell divisionand apoptosis, while most other tissue parameters do not seemto affect it significantly. Finally, we present a number ofsimulations, in which we compress the tissue dynamically ina controlled manner. Using these simulations, we determineboth its dynamical compressibility and its response to imposedpressure via cell division and apoptosis. In our simulations,we therefore measure all the continuum properties of the tissuerequired for applying the coarse-grained models introduced inearlier works [9].
In further research, we would like to use these simulationsto study more complex tissue architectures such as multi-layered epithelia. In particular, the internal organizationof these tissues with respect to populations of stem cellsand differentiation should be investigated. The developmentof spatial organization within tissues such as the finger-like protrusions occurring in the epidermis could also bestudied. The stability of these structures under perturbationsis an important question, for example, how do differentsubpopulations of cells coexist in these tissues and what is theorigin of fingering instabilities, which are observed at manytissue interfaces in malignant and premalignant epithelia.Finally, the survival of mutated cells and the dynamics oftissue competition should be studied in tissues with a morecomplex structure like epithelia and nutrient-limited tumors.
References
[1] Thery M, Jimenez-Dalmaroni A, Racine V, Bornens Mand Julicher F 2007 Experimental and theoretical study ofmitotic spindle orientation Nature 447 493–6
[2] Whitehead J, Vignjevic D, Futterer C, Beaurepaire E,Robine S and Farge E 2008 Mechanical factors activateβ-catenin-dependent oncogene expression in APC1638N/+mouse colon HFSP J. 2 286
[3] Engler A J, Sen S, Sweeney H L and Discher D E 2006 Matrixelasticity directs stem cell lineage specification Cell126 677–89
[4] Foty R A, Forgacs G, Pfleger C M and Steinberg M S 1994Liquid properties of embryonic tissues: measurement ofinterfacial tensions Phys. Rev. Lett. 72 2298–301
[5] Foty R A, Pfleger C M, Forgacs G and Steinberg M S 1996Surface tensions of embryonic tissues predict their mutualenvelopment behavior Development 122 1611–20
[6] Duguay D, Foty R A and Steinberg M S 2003Cadherin-mediated cell adhesion and tissue segregation:qualitative and quantitative determinants Dev. Biol.253 309–23
12
Phys. Biol. 8 (2011) 026014 M Basan et al
[7] Fung Y C 1993 Biomechanics: Mechanical Properties ofLiving Tissues (Berlin: Springer)
[8] Guevorkian K, Colbert M J, Durth M, Dufour Sand Brochard-Wyart F 2010 Aspiration of biologicalviscoelastic drops Phys. Rev. Lett. 104 218101
[9] Basan M, Risler T, Joanny J F, Sastre-Garau X and Prost J2009 Homeostatic competition drives tumor growth andmetastasis nucleation HFSP J. 3 265–72
[10] Basan M, Joanny J F, Prost J and Risler T 2011 Undulationinstability of epithelial tissues Phys. Rev. Lett. accepted
[11] Ranft J, Elgeti J, Basan M, Joanny J F, Prost J and Julicher F2010 Fluidization of tissues by cell division and apoptosisProc. Natl Acad. Sci. 107 20863–8
[12] Drasdo D, Kree R and McCaskill J S 1995 Monte Carloapproach to tissue-cell populations Phys. Rev. E 52 6635–57
[13] Drasdo D 2000 Buckling instabilities of one-layered growingtissues Phys. Rev. Lett. 84 4244–7
[14] Drasdo D and Loeffler M 2001 Individual-based models togrowth and folding in one-layered tissues: intestinal cryptsand early development Nonlinear Anal., Theory MethodsAppl. 47 245–56
[15] Drasdo D and Hohme S 2003 Individual-based approaches tobirth and death in avascu1ar tumors Math. Comput. Model.37 1163–76
[16] Drasdo D and Hohme S 2005 A single-cell-based model oftumor growth in vitro: monolayers and spheroids Phys.Biol. 2 133–47
[17] Galle J, Loeffler M and Drasdo D 2005 Modeling the effect ofderegulated proliferation and apoptosis on the growthdynamics of epithelial cell populations in vitro Biophys. J.88 62–75
[18] Galle J, Aust G, Schaller G, Beyer T and Drasdo D 2006Individual cell-based models of the spatio-temporalorganisation of multicellular systems-achievements andlimitations Cytometry 69 704–10
[19] Drasdo D, Hoehme S and Block M 2007 On the role ofphysics in the growth and pattern formation ofmulti-cellular systems: What can we learn fromindividual-cell based models? J. Stat. Phys. 128 287–345
[20] Hengstler J G, Drasdo D and Gebhardt R 2007 Liverregeneration after intoxication with CCl4: spatial-temporalmathematical modelling in triple transgenic mice Toxicol.Lett. 172 46
[21] Hohme S, Hengstler J G, Brulport M, Schafer M, Bauer A,Gebhardt R and Drasdo D 2007 Mathematical modelling ofliver regeneration after intoxication with CCl4 Chem. Biol.Interact. 168 74–93
[22] Bru A, Pastor J M, Fernaud I, Bru I, Melle S and Berenguer C1998 Super-rough dynamics on tumor growth Phys. Rev.Lett. 81 4008–11
[23] Bru A, Albertos S, Subiza J Luis, Garcıa-Asenjo J L and Bru I2003 The universal dynamics of tumor growth Biophys. J.85 2948–61
[24] Schaller G and Meyer-Hermann M 2005 Multicellular tumorspheroid in an off-lattice Voronoi–Delaunay cell modelPhys. Rev. E 71 51910
[25] Freyer J P and Sutherland R M 1985 A reduction in the in siturates of oxygen and glucose consumption of cells in EMT6/Ro spheroids during growth J. Cell. Physiol. 124 516–24
[26] Freyer J P and Sutherland R M 1986 Regulation of growthsaturation and development of necrosis in EMT6/Romulticellular spheroids by the glucose and oxygen supplyCancer Res. 46 3504
[27] Sandersius S A and Newman T J 2008 Modeling cell rheologywith the Subcellular Element Model Phys. Biol. 5 015002
[28] Pathmanathan P, Cooper J, Fletcher A, Mirams G, Murray P,Osborne J, Pitt-Francis J, Walter A and Chapman SJ 2009 Acomputational study of discrete mechanical tissue modelsPhys. Biol. 6 036001
[29] Wells W A 2002 Does size matter? J. Cell Biol. 158 1156[30] Nikunen P, Karttunen M and Vattulainen I 2003 How would
you integrate the equations of motion in dissipative particledynamics simulations? Comput. Phys. Commun.153 407–23
[31] Foty R A and Steinberg M S 2005 The differential adhesionhypothesis: a direct evaluation Dev. Biol. 278 255–63
[32] Rieu J P, Kataoka N and Sawada Y 1998 Quantitative analysisof cell motion during sorting in two-dimensional aggregatesof dissociated hydra cells Phys. Rev. E 57 924–31
[33] Rieu J P, Upadhyaya A, Glazier J A, Ouchi N B and Sawada Y2000 Diffusion and deformations of single hydra cells incellular aggregates Biophys. J. 79 1903–14
[34] Upadhyaya A, Rieu J P, Glazier J A and Sawada Y 2001Anomalous diffusion and non-Gaussian velocitydistribution of Hydra cells in cellular aggregates Physica A293 549–58
[35] Larson R G 1988 Constitutive Equations for Polymer Meltsand Solutions (Boston, MA: Butterworths)
[36] Kruse K, Joanny J F, Julicher F, Prost J and Sekimoto K 2005Generic theory of active polar gels: a paradigm forcytoskeletal dynamics Eur. Phys. J. E 16 5–16
[37] Basan M, Idema T, Lenz M, Joanny J F and Risler T 2010 Areaction-diffusion model of the cadherin–catenin system: apossible mechanism for contact inhibition and implicationsfor tumorigenesis Biophys. J. 98 2770–9
[38] Humphrey William, Dalke Andrew and Schulten Klaus 1996VMD—visual molecular dynamics J. Mol. Graph. 14 33–8
[39] Hoffman B, Massiera G, Citters K Van and Crocker J C 2006The consensus mechanics of cultured mammalian cellsProc. Natl Acad. Sci. 103 10259–64
[40] Fabry B, Maksym G N, Butler J P, Glogauer M, Navajas Dand Fredberg J J 2001 Scaling the microrheology of livingcells Phys. Rev. Lett. 87 148102
[41] Stamenovic D, Suki B, Fabry B, Wang N and Fredberg J J 2004Rheology of airway smooth muscle cells is associated withcytoskeletal contractile stress J. Appl. Physiol. 96 1600–5
13