displacement of the abomasum in dairy cows -risk factors ... · displacement of the abomasum in...
TRANSCRIPT
1
Displacement of the abomasum in dairy cows
-risk factors and pre-clinical alterations-
Steven van Winden
Utrecht, 2002

2
Van Winden, Stefanus Cornelis Leonardus Displacement of the abomasum in dairy cows -risk factors and pre-clinical alterations- 2002 Dissertation Utrecht University, Faculty of Veterinary Medicine -with summary in Dutch ISBN 90-393-3180-4 Cover: Henk Halsema and Steven van Winden Print: Addix, Wijk bij Duurstede, the Netherlands
3
Displacement of the abomasum in dairy cows
-risk factors and pre-clinical alterations-
Lebmaagverplaatsing bij melkkoeien
-risicofactoren en preklinische veranderingen-
(met samenvatting in het Nederlands)
Proefschrift
ter verkrijging van de graad van doctor aan de Universiteit Utrecht op gezag van Rector Magnificus, Prof. dr. W. H. Gispen,
ingevolge het besluit van College voor Promoties in het openbaar te verdedigen
op donderdag 14 november 2002 des namiddags te 4.15 uur
door Stefanus Cornelis Leonardus van Winden
geboren op 4 december 1970 te Pijnacker

4
Promotoren: Prof. dr. J. P. T. M. Noordhuizen Department of Farm Animal Health Faculty of Veterinary Medicine
Utrecht University, the Netherlands
Prof. dr. ir. A. C. Beynen Department of Nutrition Faculty of Veterinary Medicine Utrecht University, the Netherlands
Co-promotoren: Dr. K. E. Müller
Department of Farm Animal Health Faculty of Veterinary Medicine
Utrecht University, the Netherlands Dr. ing. J. Th. Schonewille Department of Nutrition Faculty of Veterinary Medicine Utrecht University, the Netherlands

5

6
De druk van dit proefschrift is financieel mede mogelijk gemaakt door: AUV dierenartsen coöperatie, Cuijk, www.auv.nl De Heus Brokking Koudijs B.V., Ede, www.deheusbrokkingkoudijs.nl Dopharma B.V., Raamsdonksveer, www.dopharma.nl
7
Contents Chapter One General introduction
9
Chapter Two Left displacement of the abomasum in dairy cattle; recent developments in epidemiological and etiological aspects
15
Chapter Three Risk indicators for displaced abomasum on herd level
31
Chapter Four The position of the abomasum in dairy cows during the first six weeks after calving
43
Chapter Five Changes in feed intake, pH and osmolality of rumen fluid, and position of the abomasum, prior to diet-induced left-displaced abomasum in dairy cows
55
Chapter Six Feed intake, milk yield, and metabolic parameters prior to left displaced abomasum in dairy cows
69
Chapter Seven Studies on the pH value of abomasal contents in dairy cows during the first three weeks after calving
83
Chapter Eight General discussion
93
Nederlandse samenvatting
103
Dankwoord en Curriculum Vitae 107

8
9
Chapter One
General introduction

10
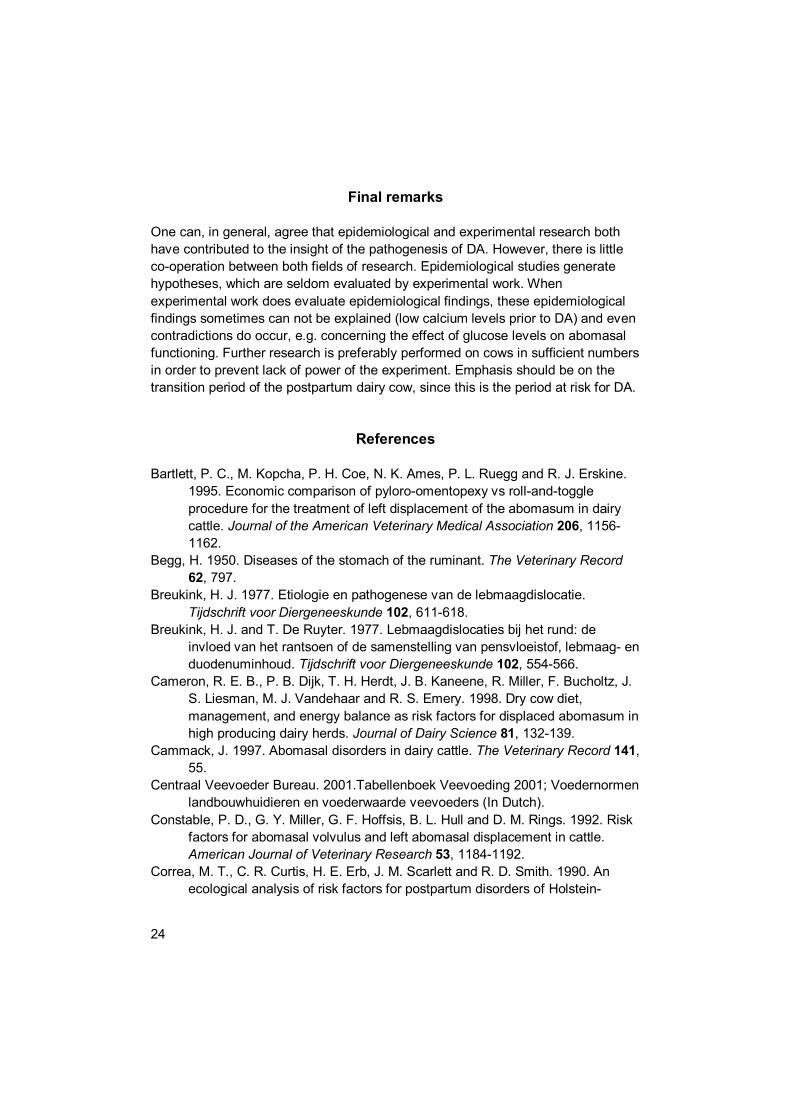
Introduction After the age of one week, young calves will develop into ruminants. During the transition from monogastric animal to ruminant the role of the abomasum changes. The function of the abomasum in the neonatal calf is to clot ingested milk. In the new-born calf, the abomasum forms the largest part of the gastrointestinal tract, whereas its size is less predominant after the calf starts ruminating. The abomasum forms a barrier between the bacteria-rich rumen and the intestinal tract. The acid producing parietal cells decrease the pH of the abomasal contents and entering bacteria are killed (Russell and Rychlik, 2001 and Wolffram, 1996). In the adult cow the abomasum is located on the bottom of the abdominal cavity. The body of the abomasum expands to the left part of the abdominal cavity (Figure 1). The pyloric part of the abomasum is positioned at the right flank and ends in the duodenum. Figure 1. Left view of the abdominal cavity of a healthy cow (Modified after Dyce and Wensing, 1971)
In the high producing postpartum dairy cow several changes occur that may affect the physiology of the abomasum. This in some cases results in displacement of the abomasum (DA, Figure 2). DA occurs to the left (95 percent of the cases), or the right side. DA occurs most often in the postpartum cow and therefore the first four weeks after calving is considered an important risk period. A major influence on the development of postpartum disorders, of which DA is one, is the preceding dry cow management.
Small intestine
Rumen
Greater omentum Reticulum Abomasum
Spleen
13th rib
6th rib
11
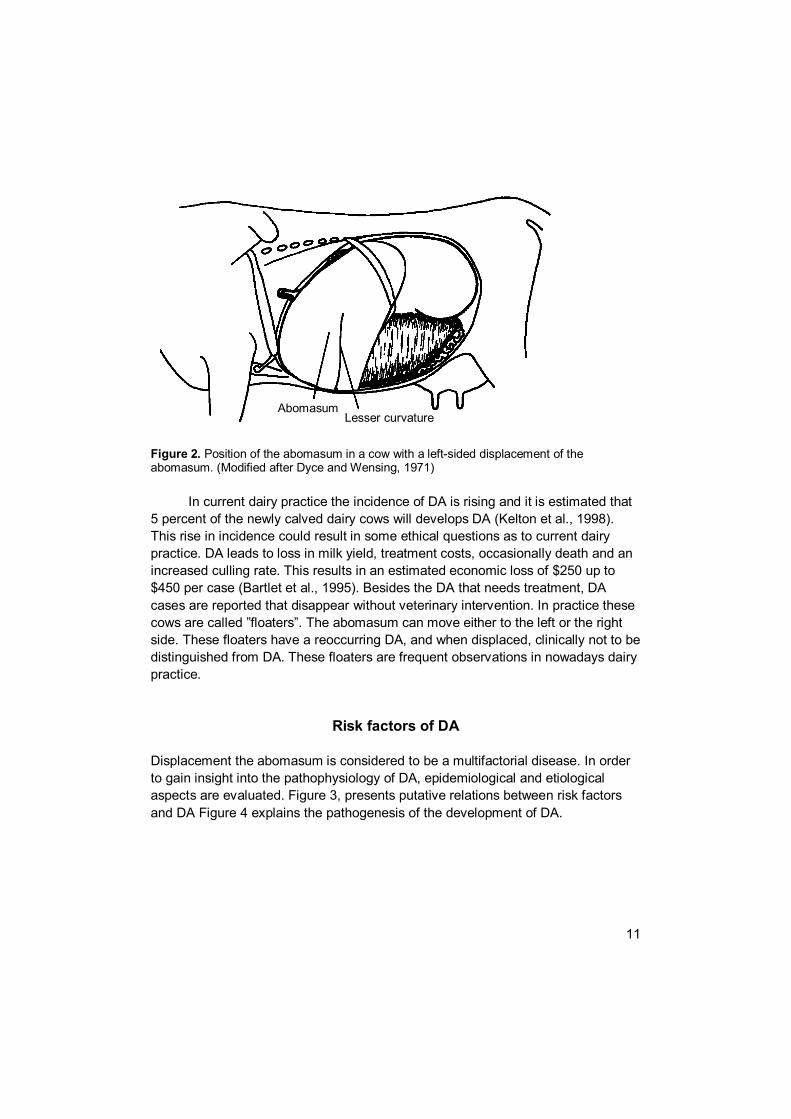
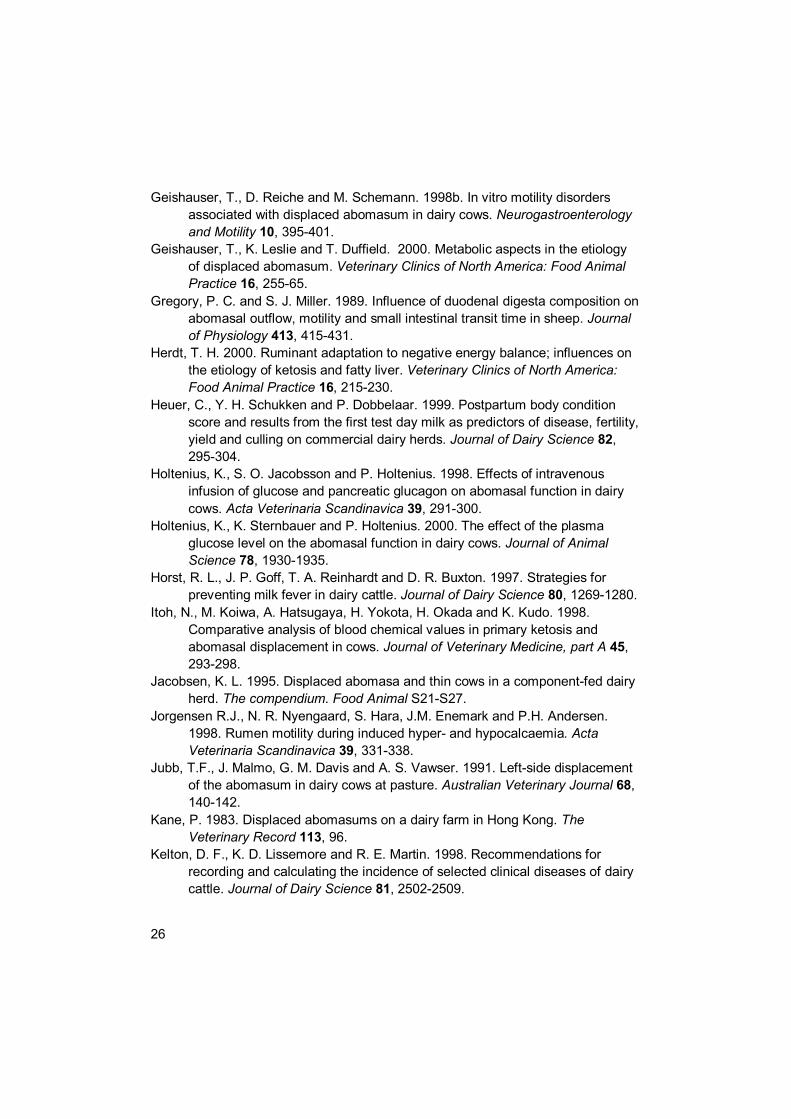
Figure 2. Position of the abomasum in a cow with a left-sided displacement of the abomasum. (Modified after Dyce and Wensing, 1971)
In current dairy practice the incidence of DA is rising and it is estimated that
5 percent of the newly calved dairy cows will develops DA (Kelton et al., 1998). This rise in incidence could result in some ethical questions as to current dairy practice. DA leads to loss in milk yield, treatment costs, occasionally death and an increased culling rate. This results in an estimated economic loss of $250 up to $450 per case (Bartlet et al., 1995). Besides the DA that needs treatment, DA cases are reported that disappear without veterinary intervention. In practice these cows are called ”floaters”. The abomasum can move either to the left or the right side. These floaters have a reoccurring DA, and when displaced, clinically not to be distinguished from DA. These floaters are frequent observations in nowadays dairy practice.
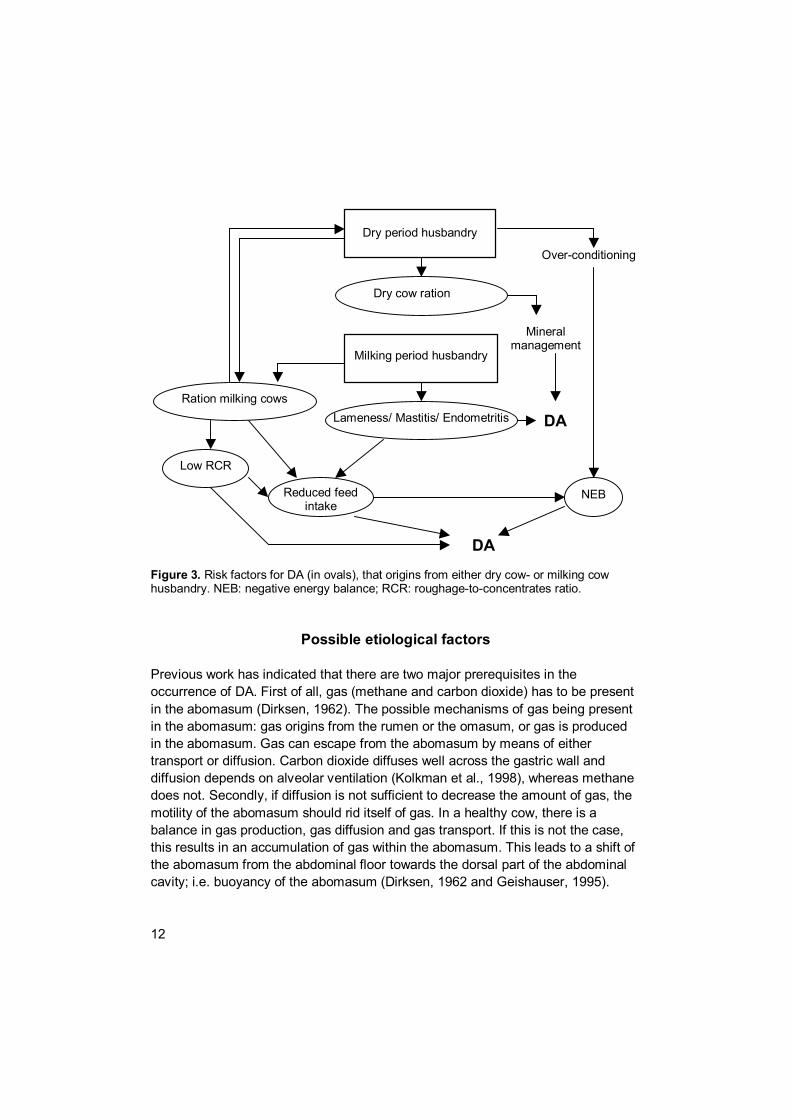
Risk factors of DA Displacement the abomasum is considered to be a multifactorial disease. In order to gain insight into the pathophysiology of DA, epidemiological and etiological aspects are evaluated. Figure 3, presents putative relations between risk factors and DA Figure 4 explains the pathogenesis of the development of DA.
Abomasum Lesser curvature
12
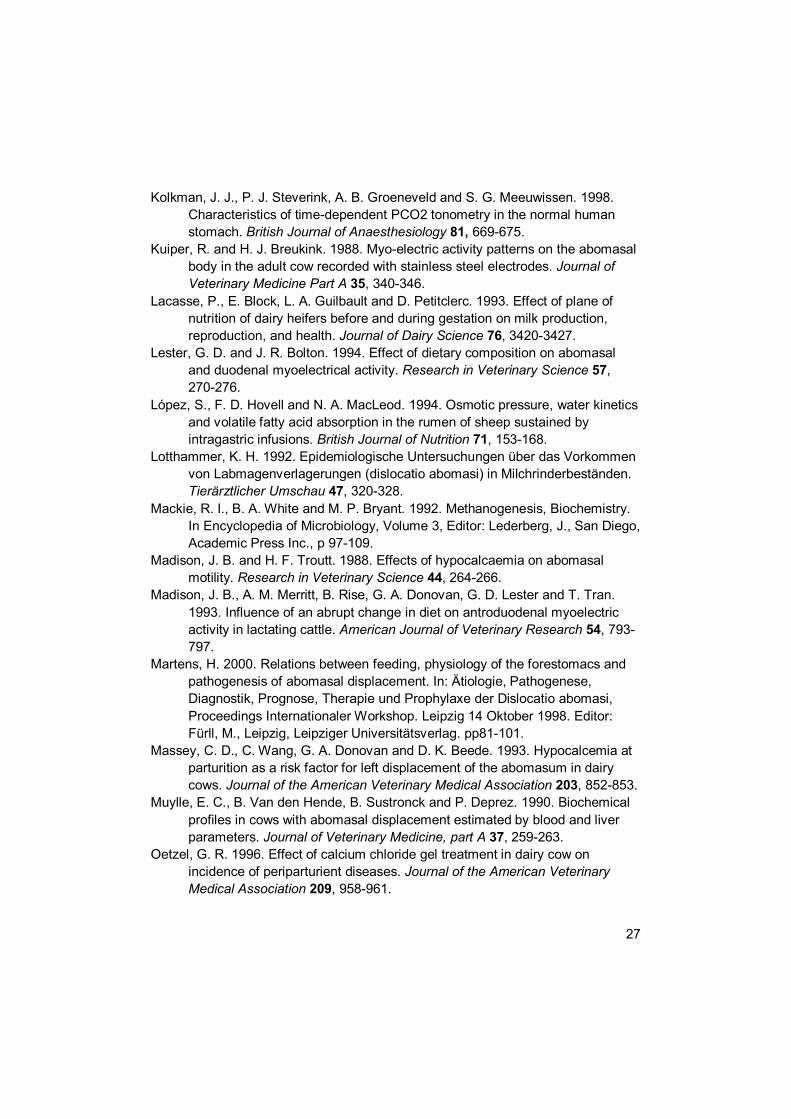
Figure 3. Risk factors for DA (in ovals), that origins from either dry cow- or milking cow husbandry. NEB: negative energy balance; RCR: roughage-to-concentrates ratio.
Possible etiological factors
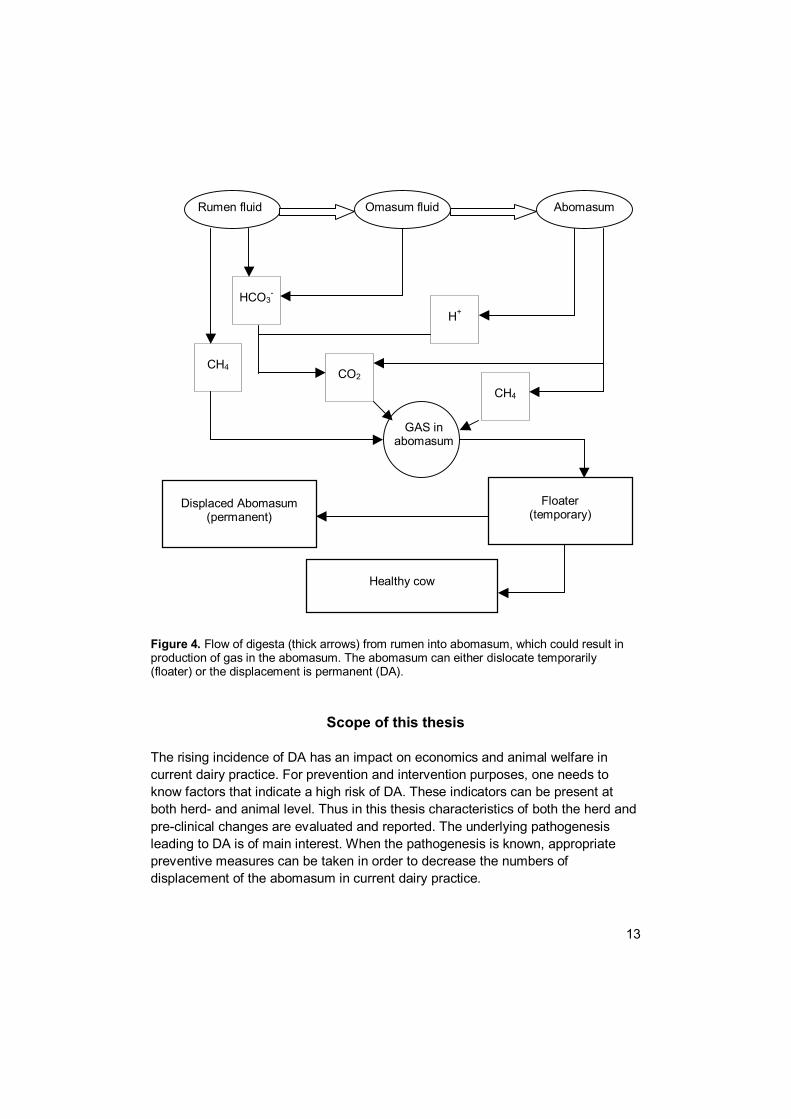
Previous work has indicated that there are two major prerequisites in the occurrence of DA. First of all, gas (methane and carbon dioxide) has to be present in the abomasum (Dirksen, 1962). The possible mechanisms of gas being present in the abomasum: gas origins from the rumen or the omasum, or gas is produced in the abomasum. Gas can escape from the abomasum by means of either transport or diffusion. Carbon dioxide diffuses well across the gastric wall and diffusion depends on alveolar ventilation (Kolkman et al., 1998), whereas methane does not. Secondly, if diffusion is not sufficient to decrease the amount of gas, the motility of the abomasum should rid itself of gas. In a healthy cow, there is a balance in gas production, gas diffusion and gas transport. If this is not the case, this results in an accumulation of gas within the abomasum. This leads to a shift of the abomasum from the abdominal floor towards the dorsal part of the abdominal cavity; i.e. buoyancy of the abomasum (Dirksen, 1962 and Geishauser, 1995).
Dry period husbandry
Milking period husbandry
Over-conditioning
Mineral management
NEB
Lameness/ Mastitis/ Endometritis
Reduced feed intake
Low RCR
Ration milking cows
Dry cow ration
DA
DA
13
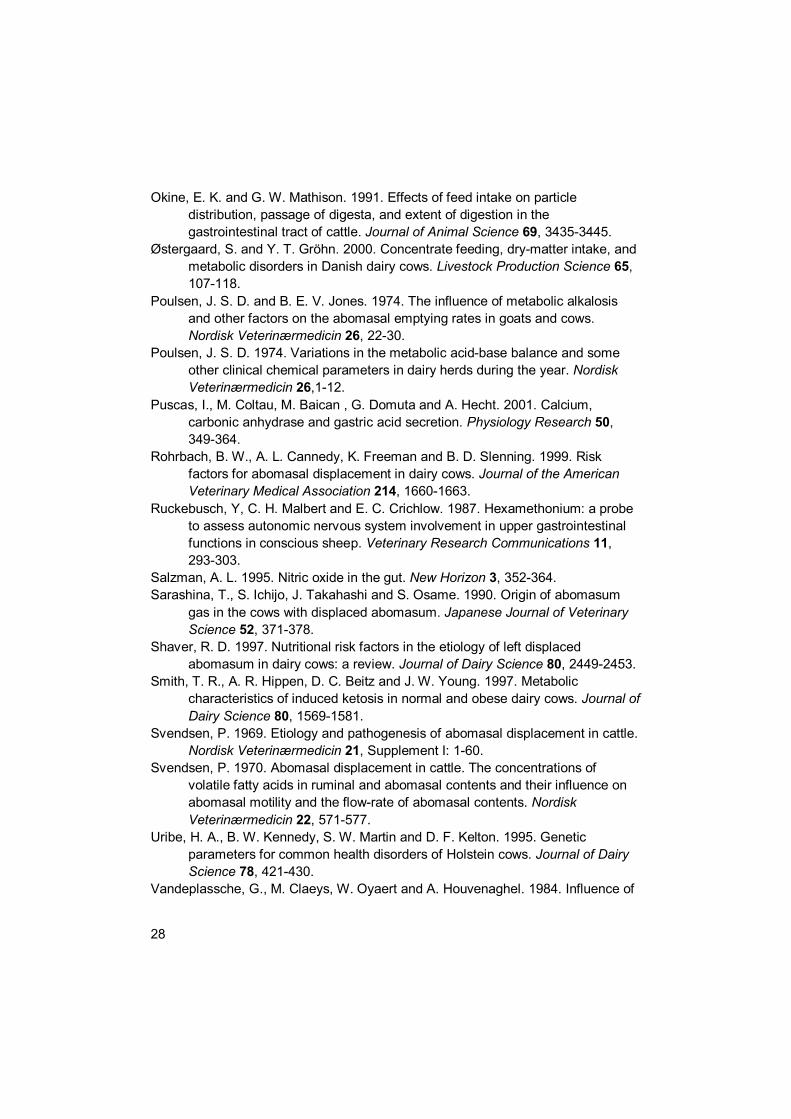
Figure 4. Flow of digesta (thick arrows) from rumen into abomasum, which could result in production of gas in the abomasum. The abomasum can either dislocate temporarily (floater) or the displacement is permanent (DA).
Scope of this thesis The rising incidence of DA has an impact on economics and animal welfare in current dairy practice. For prevention and intervention purposes, one needs to know factors that indicate a high risk of DA. These indicators can be present at both herd- and animal level. Thus in this thesis characteristics of both the herd and pre-clinical changes are evaluated and reported. The underlying pathogenesis leading to DA is of main interest. When the pathogenesis is known, appropriate preventive measures can be taken in order to decrease the numbers of displacement of the abomasum in current dairy practice.
CO2
Omasum fluid Abomasum
CH4
HCO3
-
Rumen fluid
GAS in abomasum
Displaced Abomasum
(permanent)
Healthy cow
Floater
(temporary)
CH4
H+

14
References Bartlett, P. C., M. Kopcha, P. H. Coe, N. K. Ames, P. L. Ruegg and R. J. Erskine.
1995. Economic comparison of pyloro-omentopexy vs roll-and-toggle procedure for the treatment of left displacement of the abomasum in dairy cattle. Journal of the American Veterinary Medical Association 206, 1156-1162.
Dirksen, G. 1962. Die Erweiterung, Verlagerung und Drehung des Lebmages beim Rind. Habilitationsschrift. Berlin and Hamburg, Verlag Paul Parey. pp 121.
Dyce, K. M. and C. J. G. Wensing. 1971. Essentials of bovine anatomy, Utrecht, A. Oosterhoek’s uitegeverij maatschappij N.V. pp211.
Geishauser, T. 1995. Abomasal displacement in the bovine -- a review on character, occurrence aetiology and pathogenesis. Journal of Veterinary Medicine, part A 42, 229-251.
Kelton, D. F., K. D. Lissemore and R. E. Martin. 1998. Recommendations for recording and calculating the incidence of selected clinical diseases of dairy cattle. Journal of Dairy Science 81, 2502-2509.
Kolkman, J. J., P. J. Steverink, A. B. Groeneveld and S. G. Meeuwissen. 1998. Characteristics of time-dependent PCO2 tonometry in the normal human stomach. British Journal of Anaesthesiology 81, 669-675.
Russell, J. R. and J. L. Rychlik. 2001. Factors that alter rumen microbial ecology. Science 292, 1119-1122.
Wolffram, S. 1996. Motorik, Verdauungs- und Sekretionsprozesse der Vormägen un des Labmagens – eine kurze Uebersicht. Schweizer Archiv für Tierheilkunde 138, 343-350.
15
Chapter Two
Left displacement of the abomasum in dairy cattle: recent developments in epidemiological
and etiological aspects
S. C. L. Van Winden* and R. Kuiper*
*Department of Farm Animal Health, Faculty of Veterinary Medicine, Utrecht University, Yalelaan 7, 3584 CL, Utrecht, The Netherlands
Veterinary Research Accepted for publication
16
Summary The research with respect to displacement of the abomasum (DA) in dairy cattle is reviewed. Evaluated articles describe epidemiological and experimental studies. Contributing factors to the occurrence DA are breed, gender, age, concurrent diseases, environmental aspects and production levels. Emphasis is placed on the effects of nutrition and metabolism. Reviewing the experimental work there is focussed on two topics: research of gas production in the abomasum and hypomotility of the abomasum, since both represent presumed pathways in the development of DA. Although the different fields of research have positive contributions to the understanding of the pathogenesis of DA, contradictions in the different studies are present. Abbreviation key: DA = displaced abomasum, NEB = negative energy balance, VFA = volatile fatty acid.

17
Introduction Since the first report of displacement of the abomasum (DA) in a cow by Begg in 1950, this disorder in dairy cattle nowadays has become more common. The DA is characterised by the abomasum filled with gas and floating in the dorsal part of the abdomen. This state can result in anorexia and signs of colic, accompanied by a drop in milk yield, discomfort of the cow and in some cases death (Dirksen, 1962). After (non-) surgical correction of the position of the abomasum the milk production can be disappointing, which may result in culling of the cow. The total estimated economic loss of a case of DA is between US $250 to $450 (Bartlet et al., 1995). Geishauser et al., (2000) have calculated the annual loss in North America due to DA as up to 220 million dollar. The incidence of DA varies, depending on the country, from 0 to 7 percent per year (Cameron et al., 1998 and Kelton et al., 1998). There is however a large variation at herd level within a country (Van Dorp et al., 1999 and Wolf et al., 2001). Some herds seldom have a case of DA, while in other farms the incidence can be 20% (Dawson et al., 1992, Jacobsen, 1995, and Kane, 1983). When the herd-incidence is high, DA can result in considerable economic losses.
In the pathogenesis of the DA the accumulation of gas in the abomasum is crucial. The underlying hypothetical cause of this accumulation is a combination of two pathways: an increased production of gas in the abomasum and a hypomotility of the abomasum (Dirksen, 1962). The gas accumulated in the abomasum consists mainly of methane (70%), and carbondioxide (Dirksen, 1962 and Svendsen, 1969). When gas production is present, this is equal to the clearance in oral or aboral direction. When motility of the abomasum is inadequate accumulation of gas may occur (Breukink, 1977, Dirksen, 1962, and Geishauser, 1995). The vagus nerve plays a predominant role in abomasal motility (Cottrell and Stanley, 1992, Cottrell, 1994, Geishauser 1995, Geishauser et al., 1998b, and Ruckebusch et al., 1987). Besides the effect of the vagal nerve, large amounts of volatile fatty acids (VFA) in the rumen and abomasum (Breukink and De Ruyter, 1977, Gregory and Miller, 1989, Poulsen and Jones, 1974, Svendsen, 1970, and Vlaminck et al., 1984), endotoxins (Vandeplassche et al., 1984, Vlaminck et al., 1984, and Vlaminck et al., 1985), metabolic alkalosis (Poulsen and Jones, 1974) and low blood calcium levels (Madison and Trout, 1988) are mentioned as plausible causes for a decreased motility. Kuiper and Breukink (1988) reported periodical, at night-time, inactivity of the abomasum, mainly the corpus. They related the inactivity to lying at nigh time, or a day-night rhythm. In a postpartum cow one or both mechanisms, hypomotility and gas production or gas inflow, can play a role, resulting in accumulation of gas and buoyancy of the abomasum. In Figure 1 a flowchart is presented. In this chart epidemiological aspects relate to etiological factors. These etiological factors are linked with the two pathogenic pathways (hypomotility and gas production) that

18
lead to DA. The research on abomasal displacements consists mainly of epidemiological
surveys and experimental studies. The epidemiological research has generated associations, risk factors and hypotheses. The experimental work is performed to test these and other hypotheses. The aim of this paper is to evaluate these efforts, with an emphasis on the developments in the last decade, and to suggest directions for further research. Figure 1. Flowchart of risk factors of DA (in left text box), related to etiological factors (ovals). The pathogenic pathway (circles) of the etiological factors
Epidemiological factors
Species, breed, gender, age and production level The displacement of the abomasum as a disease has been described in ruminants of the Western Hemisphere, sheep, goat and cattle, both male and female. With respect to the incidence of DA one should conclude that DA is mainly a disorder associated with cattle, in particular Holstein-Friesian, Jersey and Guernsey cows. Geishauser et al. (1996) and Uribe et al. (1995) reported a heritability of DA of 0.24 and 0.28 respectively. Van Dorp et al. (1998) however, could not confirm this finding.
The major risk period is the first month after calving, with an increasing risk with increasing age (Constable et al., 1992). Other authors report that the first
Breed Production level
Dry cow nutrition
Milking cow nutrition
Metabolism
Concurrent diseases
Environment
……
NEB
Feed intake
Blood calcium
Gas production abomasum
Hypomotilityabomasum
D
isplacement of the abom
asum

19
lactation is also a period with a relative high risks for development of DA. This could be due to poor social and nutritional adaptation of the newly lactating heifer (Jubb et al., 1991). Lacasse et al. (1993) found a four times higher risk for DA in heifers that were fed ad libitum in the period of 1 to 1.5 years of age, compared with their restrictedly fed controls. DA is associated with milk production: the higher the milk yield the larger the risk of development of DA (Fleischer et al., 2001). Other authors report that this relation is not always present (Cameron et al., 1998 and Rohrbach et al., 1999). An explanation can be the findings of Detilleux et al. (1997): DA cows have a 557-kg lower 305-day milk production than control cows and 30% of the milk loss occurred before DA diagnosis. The general opinion is that cows that develop DA are high producing cows, but due to DA the current lactation period has a poor milk yield. Constable et al. (1992) conclude that, taking milk production into account, there is still an unexplained high incidence of DA in Jersey and Guernsey dairy cows. An explanation can be that these breeds are more susceptible than Holstein-Friesian cows for the occurrence of hypocalcemia, which is discussed later. In general could be concluded that a high producing dairy cow in the first four weeks after calving, of the HF, Jersey or Guernsey breed, are animals with high risk for DA. Nutrition and metabolism Cows developing a DA show depressed feed intake prior to DA diagnosis (Østergaard and Gröhn, 2000). This is in accordance with the remarks of Dirksen (1962), who suggests that a decreased rumen filling enables the abomasum to move to the left, even before clinical presence. This is reflected in the findings of Cameron et al. (1998). They report restricted supply of energy dense feed in late gestation as a risk factor for DA. There is an association between the amount as well as the quality of the roughage fed and DA (Dawson et al., 1992, Jacobsen, 1995, and Shaver, 1997). Roughage of poor quality and bat tastiness leads to a lowered feed intake with DA as a result (Jacobsen, 1995). Some authors recommended a fibre length of the roughage of minimal 1.3 to 2.5 centimetres (Dawson et al., 1992 and Shaver, 1997). The fibre length is needed for rumination and saliva production. There is also an association between the kind of roughage fed and the occurrence of DA; feeding a large proportion of maize of the total roughage is associated with a higher risk of DA (Van Winden et al., 2002a). Parallel to these findings Cammack (1997) describes more frequent abomasal displacements and other disorders of the abomasum in herds that are fed a large proportion of maize silage. The roughage component of the ration should not be
20
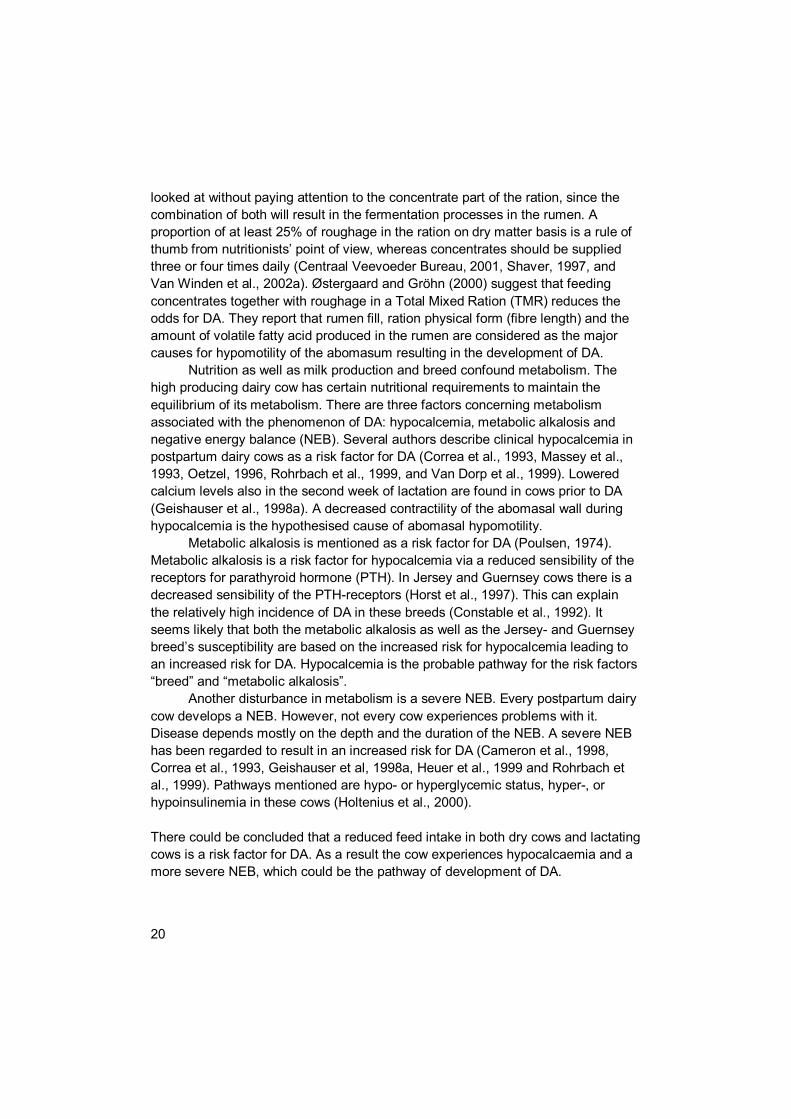
looked at without paying attention to the concentrate part of the ration, since the combination of both will result in the fermentation processes in the rumen. A proportion of at least 25% of roughage in the ration on dry matter basis is a rule of thumb from nutritionists’ point of view, whereas concentrates should be supplied three or four times daily (Centraal Veevoeder Bureau, 2001, Shaver, 1997, and Van Winden et al., 2002a). Østergaard and Gröhn (2000) suggest that feeding concentrates together with roughage in a Total Mixed Ration (TMR) reduces the odds for DA. They report that rumen fill, ration physical form (fibre length) and the amount of volatile fatty acid produced in the rumen are considered as the major causes for hypomotility of the abomasum resulting in the development of DA.
Nutrition as well as milk production and breed confound metabolism. The high producing dairy cow has certain nutritional requirements to maintain the equilibrium of its metabolism. There are three factors concerning metabolism associated with the phenomenon of DA: hypocalcemia, metabolic alkalosis and negative energy balance (NEB). Several authors describe clinical hypocalcemia in postpartum dairy cows as a risk factor for DA (Correa et al., 1993, Massey et al., 1993, Oetzel, 1996, Rohrbach et al., 1999, and Van Dorp et al., 1999). Lowered calcium levels also in the second week of lactation are found in cows prior to DA (Geishauser et al., 1998a). A decreased contractility of the abomasal wall during hypocalcemia is the hypothesised cause of abomasal hypomotility.
Metabolic alkalosis is mentioned as a risk factor for DA (Poulsen, 1974). Metabolic alkalosis is a risk factor for hypocalcemia via a reduced sensibility of the receptors for parathyroid hormone (PTH). In Jersey and Guernsey cows there is a decreased sensibility of the PTH-receptors (Horst et al., 1997). This can explain the relatively high incidence of DA in these breeds (Constable et al., 1992). It seems likely that both the metabolic alkalosis as well as the Jersey- and Guernsey breed’s susceptibility are based on the increased risk for hypocalcemia leading to an increased risk for DA. Hypocalcemia is the probable pathway for the risk factors “breed” and “metabolic alkalosis”.
Another disturbance in metabolism is a severe NEB. Every postpartum dairy cow develops a NEB. However, not every cow experiences problems with it. Disease depends mostly on the depth and the duration of the NEB. A severe NEB has been regarded to result in an increased risk for DA (Cameron et al., 1998, Correa et al., 1993, Geishauser et al, 1998a, Heuer et al., 1999 and Rohrbach et al., 1999). Pathways mentioned are hypo- or hyperglycemic status, hyper-, or hypoinsulinemia in these cows (Holtenius et al., 2000). There could be concluded that a reduced feed intake in both dry cows and lactating cows is a risk factor for DA. As a result the cow experiences hypocalcaemia and a more severe NEB, which could be the pathway of development of DA.
21
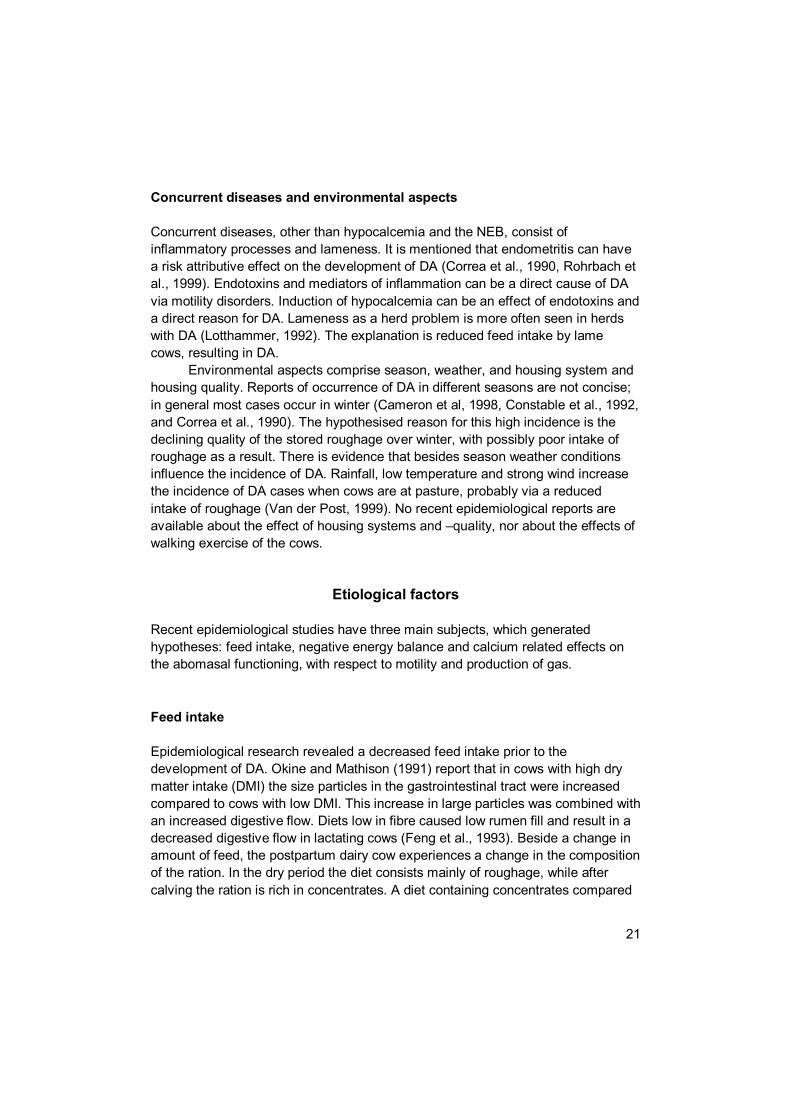
Concurrent diseases and environmental aspects Concurrent diseases, other than hypocalcemia and the NEB, consist of inflammatory processes and lameness. It is mentioned that endometritis can have a risk attributive effect on the development of DA (Correa et al., 1990, Rohrbach et al., 1999). Endotoxins and mediators of inflammation can be a direct cause of DA via motility disorders. Induction of hypocalcemia can be an effect of endotoxins and a direct reason for DA. Lameness as a herd problem is more often seen in herds with DA (Lotthammer, 1992). The explanation is reduced feed intake by lame cows, resulting in DA.
Environmental aspects comprise season, weather, and housing system and housing quality. Reports of occurrence of DA in different seasons are not concise; in general most cases occur in winter (Cameron et al, 1998, Constable et al., 1992, and Correa et al., 1990). The hypothesised reason for this high incidence is the declining quality of the stored roughage over winter, with possibly poor intake of roughage as a result. There is evidence that besides season weather conditions influence the incidence of DA. Rainfall, low temperature and strong wind increase the incidence of DA cases when cows are at pasture, probably via a reduced intake of roughage (Van der Post, 1999). No recent epidemiological reports are available about the effect of housing systems and –quality, nor about the effects of walking exercise of the cows.
Etiological factors Recent epidemiological studies have three main subjects, which generated hypotheses: feed intake, negative energy balance and calcium related effects on the abomasal functioning, with respect to motility and production of gas. Feed intake Epidemiological research revealed a decreased feed intake prior to the development of DA. Okine and Mathison (1991) report that in cows with high dry matter intake (DMI) the size particles in the gastrointestinal tract were increased compared to cows with low DMI. This increase in large particles was combined with an increased digestive flow. Diets low in fibre caused low rumen fill and result in a decreased digestive flow in lactating cows (Feng et al., 1993). Beside a change in amount of feed, the postpartum dairy cow experiences a change in the composition of the ration. In the dry period the diet consists mainly of roughage, while after calving the ration is rich in concentrates. A diet containing concentrates compared

22
with a ration of only roughage resulted in a reduced myoelectrical activity of the abomasum in sheep (Lester and Bolton, 1994). In cattle a change from a roughage rich diet to a concentrate rich ration however, had no influence on abomasal myoelectrical activity or abomasal emptying (Madison et al., 1993).
Fermentation of digested feed stuffs lead to production of volatile fatty acids in the rumen (VFA). Rapid fermentation results in high levels of VFA. The VFA in the rumen fluid are either absorbed, with a limited capacity, or enter the abomasum. The inhibiting effects of VFA on the activity of the abomasum are controversial (Breukink and De Ruyter, 1977 and Svendsen, 1970). Gregory and Miller (1989) showed a reduced activity of the abomasum when infused with VFA concentrations of more than 100 mmol/l. One should consider that concentrations used are fivefold the normal abomasal contents (Breukink and De Ruyter, 1977). According to Forbes and Barrio (1992) the inhibitory effect of VFA on the activity of the abomasum occurs through the osmotic pressure. A high osmotic pressure of abomasal fluid results in a decreased motility of the abomasum and a reduced feed intake (Forbes and Barrio, 1992). Whether interaction of the vagus nerve is the case is uncertain. Martens (2000) postulated that osmotic pressure has its effect through an overload of the abomasum with fluid. An osmotic pressure higher than 341 mmol/kg in rumen contents results in a flux of water into the rumen. Also an increased osmotic pressure resulted in a decreased absorption of VFA by the rumen wall (López et al., 1994). The only pathway of diminishing rumen volume is via a drain towards the abomasum, which leads to a distension of the abomasal wall (Martens, 2000). When the abomasal wall is stretched too much, this can lead to decrease of motility via the vagus nerve or the nonadrenergic noncholinergic (NANC) system (Geishauser et al., 1998b). An impaired response of the abomasal muscles to acetylcholine was noticed in DA patients as a result of an inhibitory effect of nitric oxide (NO). Nitric oxide is synthesised by the abomasal smooth muscle and is part of the NANC system and has a relaxing effect of smooth muscles (Geishauser 1995, Salzman, 1995).
Sarashina and others (1990) concluded that the gas in the abomasum originates from rumen fluid. CO2: CH4 ratio in gas of the rumen is on average 2, whereas the ratio in abomasal gas is 0.4. Absorption of CO2 via the abomasal wall can explain the shift in CO2: CH4 ratio (Kolkman et al., 1998). In cows with a higher amount of concentrates in the ration the CO2: CH4 ratio in both rumen and abomasal fluid increased due to a shift in metabolic products of the microbial flora (Mackie et al., 1992 and Sarashina et al., 1990). Besides the CO2: CH4 ratio, the amount of gas escaping from the abomasum in cows increased in cows that were fed a concentrate rich ration (Svendsen, 1969). He reported an In this report a control diet of hay resulted in a production of 0.5 litre gas in the abomasum, whereas the concentrate rich diet resulted in more than 2 litres of gas. Another possible route of gas production is fermentation of contents in the abomasum. This
23
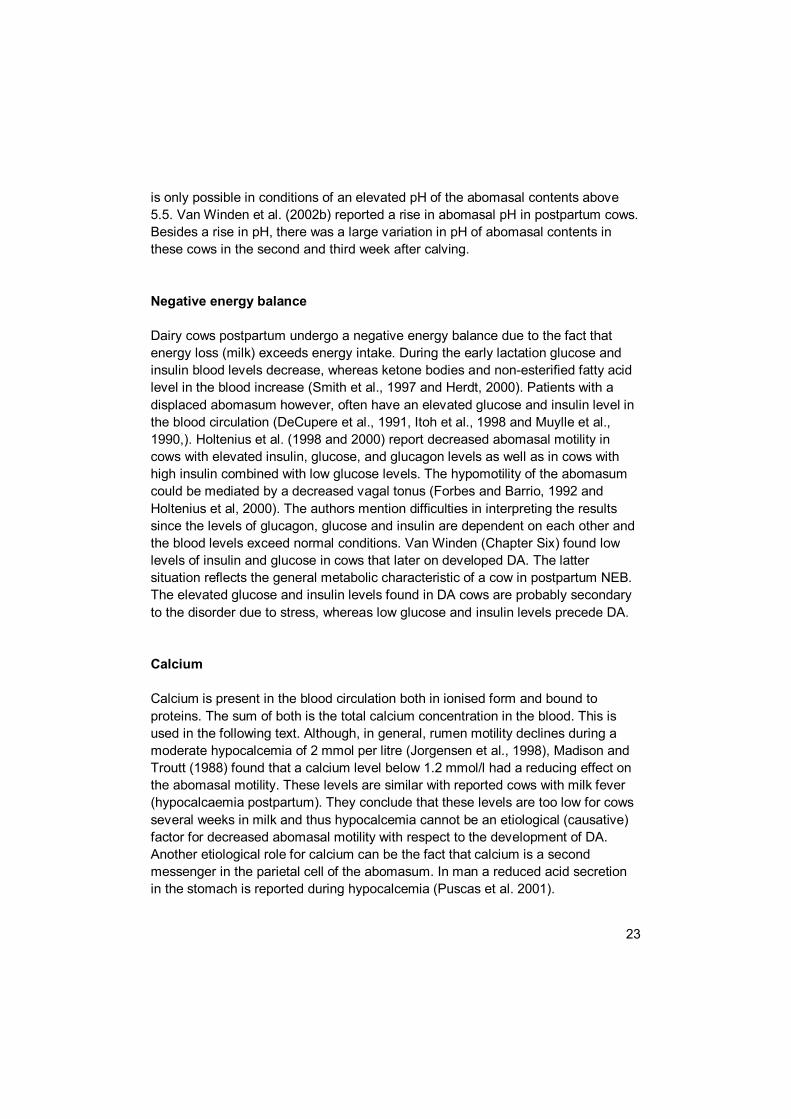
is only possible in conditions of an elevated pH of the abomasal contents above 5.5. Van Winden et al. (2002b) reported a rise in abomasal pH in postpartum cows. Besides a rise in pH, there was a large variation in pH of abomasal contents in these cows in the second and third week after calving. Negative energy balance Dairy cows postpartum undergo a negative energy balance due to the fact that energy loss (milk) exceeds energy intake. During the early lactation glucose and insulin blood levels decrease, whereas ketone bodies and non-esterified fatty acid level in the blood increase (Smith et al., 1997 and Herdt, 2000). Patients with a displaced abomasum however, often have an elevated glucose and insulin level in the blood circulation (DeCupere et al., 1991, Itoh et al., 1998 and Muylle et al., 1990,). Holtenius et al. (1998 and 2000) report decreased abomasal motility in cows with elevated insulin, glucose, and glucagon levels as well as in cows with high insulin combined with low glucose levels. The hypomotility of the abomasum could be mediated by a decreased vagal tonus (Forbes and Barrio, 1992 and Holtenius et al, 2000). The authors mention difficulties in interpreting the results since the levels of glucagon, glucose and insulin are dependent on each other and the blood levels exceed normal conditions. Van Winden (Chapter Six) found low levels of insulin and glucose in cows that later on developed DA. The latter situation reflects the general metabolic characteristic of a cow in postpartum NEB. The elevated glucose and insulin levels found in DA cows are probably secondary to the disorder due to stress, whereas low glucose and insulin levels precede DA. Calcium Calcium is present in the blood circulation both in ionised form and bound to proteins. The sum of both is the total calcium concentration in the blood. This is used in the following text. Although, in general, rumen motility declines during a moderate hypocalcemia of 2 mmol per litre (Jorgensen et al., 1998), Madison and Troutt (1988) found that a calcium level below 1.2 mmol/l had a reducing effect on the abomasal motility. These levels are similar with reported cows with milk fever (hypocalcaemia postpartum). They conclude that these levels are too low for cows several weeks in milk and thus hypocalcemia cannot be an etiological (causative) factor for decreased abomasal motility with respect to the development of DA. Another etiological role for calcium can be the fact that calcium is a second messenger in the parietal cell of the abomasum. In man a reduced acid secretion in the stomach is reported during hypocalcemia (Puscas et al. 2001).
24
Final remarks One can, in general, agree that epidemiological and experimental research both have contributed to the insight of the pathogenesis of DA. However, there is little co-operation between both fields of research. Epidemiological studies generate hypotheses, which are seldom evaluated by experimental work. When experimental work does evaluate epidemiological findings, these epidemiological findings sometimes can not be explained (low calcium levels prior to DA) and even contradictions do occur, e.g. concerning the effect of glucose levels on abomasal functioning. Further research is preferably performed on cows in sufficient numbers in order to prevent lack of power of the experiment. Emphasis should be on the transition period of the postpartum dairy cow, since this is the period at risk for DA.
References Bartlett, P. C., M. Kopcha, P. H. Coe, N. K. Ames, P. L. Ruegg and R. J. Erskine.
1995. Economic comparison of pyloro-omentopexy vs roll-and-toggle procedure for the treatment of left displacement of the abomasum in dairy cattle. Journal of the American Veterinary Medical Association 206, 1156-1162.
Begg, H. 1950. Diseases of the stomach of the ruminant. The Veterinary Record 62, 797.
Breukink, H. J. 1977. Etiologie en pathogenese van de lebmaagdislocatie. Tijdschrift voor Diergeneeskunde 102, 611-618.
Breukink, H. J. and T. De Ruyter. 1977. Lebmaagdislocaties bij het rund: de invloed van het rantsoen of de samenstelling van pensvloeistof, lebmaag- en duodenuminhoud. Tijdschrift voor Diergeneeskunde 102, 554-566.
Cameron, R. E. B., P. B. Dijk, T. H. Herdt, J. B. Kaneene, R. Miller, F. Bucholtz, J. S. Liesman, M. J. Vandehaar and R. S. Emery. 1998. Dry cow diet, management, and energy balance as risk factors for displaced abomasum in high producing dairy herds. Journal of Dairy Science 81, 132-139.
Cammack, J. 1997. Abomasal disorders in dairy cattle. The Veterinary Record 141, 55.
Centraal Veevoeder Bureau. 2001.Tabellenboek Veevoeding 2001; Voedernormen landbouwhuidieren en voederwaarde veevoeders (In Dutch).
Constable, P. D., G. Y. Miller, G. F. Hoffsis, B. L. Hull and D. M. Rings. 1992. Risk factors for abomasal volvulus and left abomasal displacement in cattle. American Journal of Veterinary Research 53, 1184-1192.
Correa, M. T., C. R. Curtis, H. E. Erb, J. M. Scarlett and R. D. Smith. 1990. An ecological analysis of risk factors for postpartum disorders of Holstein-

25
Friesian cows for thirty-two New York farms. Journal of Dairy Science 73, 1515-1524.
Correa, M. T., H. E. Erb and J. M. Scarlett. 1993. Path analysis for seven postpartum disorders of Holstein cows. Journal of Dairy Science 76, 1305-1312.
Cottrell, D. F. and H. G. Stanley. 1992. An excitatory body-antral reflex in the sheep abomasum. Experimental Physiology 77, 565-574.
Cottrell, D. F. 1994. Vagal reflex inhibition of the motility in the abomasal body of sheep by antral and duodenal tension receptors. Veterinary Research Communications 18, 319-330.
Dawson, L. J., E. P. Aalseth, L. E. Rice and G. D. Adams. 1992. Influence of fiber form in a complete mixed ration on incidence of left displacement abomasum in postpartum dairy cows. Journal of the American Veterinary Medicine Association 200, 1989-1992.
Detilleux, J. C., Y. T. Gröhn, S. W. Eicker and R. L. Quaas. 1997. Effects of left displaced abomasum on test day milk of Holstein cows. Journal of Dairy Science 80, 121-126.
DeCupere, F., E. Muylle, C. Van der Hende and W. Oyeart. 1991. Metabolic profile tests in high yielding normal cows and in cows suffering from abomasal displacement. Bovine Practitioner 26, 129-130.
Dirksen, G. 1962. Vorbetrachtungen zur Topographie, Anatomie und Physiologie der Wiederkäuermägen. In Die Erweiterung, Verlagerung und Drehung des Lebmages beim Rind, Berlin and Hamburg, Verlag Paul Parey.
Feng, P., W. H. Hoover, T. K. Miller and R. Blauwiekel. 1993. Interactions of fiber and nonstructural carbohydrates on lactation and ruminal function. Journal of Dairy Science 76, 1324-1333.
Fleischer, P., M. Metzner, M. Beyerbach, M. Hoedemaker and W. Klee. 2001. The relationship between milk yield and the incidence of some diseases in dairy cows. Journal of Dairy Science 84, 2025-2035.
Forbes, J. M. and J. P. Barrio. 1992. Abdominal chemo- and mechanosensitivity in ruminants and its role in the control of food intake. Experimental Physiology 77, 27-50.
Geishauser, T. 1995. Untersuchungen zur Labmagenmotorik von Kühen mit Labmagenverlagerung. Habilitationsschrift. Giessen, Verlag Shaker.
Geishauser T, M. Diederichs, and R. Beuing. 1996. Schätzung der Erblichkeit von Labmagenverlagerung bei Deutsch-Schwarzbunten Rindern in Hessen, in German. Journal of Veterinary Medicine, part A 43, 87-92.
Geishauser, T., K. Leslie, T. Duffield, D. Sandals and V. Edge. 1998a. The association between selected metabolic parameters and left abomasal displacement in dairy cows. Journal of Veterinary Medicine, part A 45, 499-511.
26
Geishauser, T., D. Reiche and M. Schemann. 1998b. In vitro motility disorders associated with displaced abomasum in dairy cows. Neurogastroenterology and Motility 10, 395-401.
Geishauser, T., K. Leslie and T. Duffield. 2000. Metabolic aspects in the etiology of displaced abomasum. Veterinary Clinics of North America: Food Animal Practice 16, 255-65.
Gregory, P. C. and S. J. Miller. 1989. Influence of duodenal digesta composition on abomasal outflow, motility and small intestinal transit time in sheep. Journal of Physiology 413, 415-431.
Herdt, T. H. 2000. Ruminant adaptation to negative energy balance; influences on the etiology of ketosis and fatty liver. Veterinary Clinics of North America: Food Animal Practice 16, 215-230.
Heuer, C., Y. H. Schukken and P. Dobbelaar. 1999. Postpartum body condition score and results from the first test day milk as predictors of disease, fertility, yield and culling on commercial dairy herds. Journal of Dairy Science 82, 295-304.
Holtenius, K., S. O. Jacobsson and P. Holtenius. 1998. Effects of intravenous infusion of glucose and pancreatic glucagon on abomasal function in dairy cows. Acta Veterinaria Scandinavica 39, 291-300.
Holtenius, K., K. Sternbauer and P. Holtenius. 2000. The effect of the plasma glucose level on the abomasal function in dairy cows. Journal of Animal Science 78, 1930-1935.
Horst, R. L., J. P. Goff, T. A. Reinhardt and D. R. Buxton. 1997. Strategies for preventing milk fever in dairy cattle. Journal of Dairy Science 80, 1269-1280.
Itoh, N., M. Koiwa, A. Hatsugaya, H. Yokota, H. Okada and K. Kudo. 1998. Comparative analysis of blood chemical values in primary ketosis and abomasal displacement in cows. Journal of Veterinary Medicine, part A 45, 293-298.
Jacobsen, K. L. 1995. Displaced abomasa and thin cows in a component-fed dairy herd. The compendium. Food Animal S21-S27.
Jorgensen R.J., N. R. Nyengaard, S. Hara, J.M. Enemark and P.H. Andersen. 1998. Rumen motility during induced hyper- and hypocalcaemia. Acta Veterinaria Scandinavica 39, 331-338.
Jubb, T.F., J. Malmo, G. M. Davis and A. S. Vawser. 1991. Left-side displacement of the abomasum in dairy cows at pasture. Australian Veterinary Journal 68, 140-142.
Kane, P. 1983. Displaced abomasums on a dairy farm in Hong Kong. The Veterinary Record 113, 96.
Kelton, D. F., K. D. Lissemore and R. E. Martin. 1998. Recommendations for recording and calculating the incidence of selected clinical diseases of dairy cattle. Journal of Dairy Science 81, 2502-2509.
27
Kolkman, J. J., P. J. Steverink, A. B. Groeneveld and S. G. Meeuwissen. 1998. Characteristics of time-dependent PCO2 tonometry in the normal human stomach. British Journal of Anaesthesiology 81, 669-675.
Kuiper, R. and H. J. Breukink. 1988. Myo-electric activity patterns on the abomasal body in the adult cow recorded with stainless steel electrodes. Journal of Veterinary Medicine Part A 35, 340-346.
Lacasse, P., E. Block, L. A. Guilbault and D. Petitclerc. 1993. Effect of plane of nutrition of dairy heifers before and during gestation on milk production, reproduction, and health. Journal of Dairy Science 76, 3420-3427.
Lester, G. D. and J. R. Bolton. 1994. Effect of dietary composition on abomasal and duodenal myoelectrical activity. Research in Veterinary Science 57, 270-276.
López, S., F. D. Hovell and N. A. MacLeod. 1994. Osmotic pressure, water kinetics and volatile fatty acid absorption in the rumen of sheep sustained by intragastric infusions. British Journal of Nutrition 71, 153-168.
Lotthammer, K. H. 1992. Epidemiologische Untersuchungen über das Vorkommen von Labmagenverlagerungen (dislocatio abomasi) in Milchrinderbeständen. Tierärztlicher Umschau 47, 320-328.
Mackie, R. I., B. A. White and M. P. Bryant. 1992. Methanogenesis, Biochemistry. In Encyclopedia of Microbiology, Volume 3, Editor: Lederberg, J., San Diego, Academic Press Inc., p 97-109.
Madison, J. B. and H. F. Troutt. 1988. Effects of hypocalcaemia on abomasal motility. Research in Veterinary Science 44, 264-266.
Madison, J. B., A. M. Merritt, B. Rise, G. A. Donovan, G. D. Lester and T. Tran. 1993. Influence of an abrupt change in diet on antroduodenal myoelectric activity in lactating cattle. American Journal of Veterinary Research 54, 793-797.
Martens, H. 2000. Relations between feeding, physiology of the forestomacs and pathogenesis of abomasal displacement. In: Ätiologie, Pathogenese, Diagnostik, Prognose, Therapie und Prophylaxe der Dislocatio abomasi, Proceedings Internationaler Workshop. Leipzig 14 Oktober 1998. Editor: Fürll, M., Leipzig, Leipziger Universitätsverlag. pp81-101.
Massey, C. D., C. Wang, G. A. Donovan and D. K. Beede. 1993. Hypocalcemia at parturition as a risk factor for left displacement of the abomasum in dairy cows. Journal of the American Veterinary Medical Association 203, 852-853.
Muylle, E. C., B. Van den Hende, B. Sustronck and P. Deprez. 1990. Biochemical profiles in cows with abomasal displacement estimated by blood and liver parameters. Journal of Veterinary Medicine, part A 37, 259-263.
Oetzel, G. R. 1996. Effect of calcium chloride gel treatment in dairy cow on incidence of periparturient diseases. Journal of the American Veterinary Medical Association 209, 958-961.
28
Okine, E. K. and G. W. Mathison. 1991. Effects of feed intake on particle distribution, passage of digesta, and extent of digestion in the gastrointestinal tract of cattle. Journal of Animal Science 69, 3435-3445.
Østergaard, S. and Y. T. Gröhn. 2000. Concentrate feeding, dry-matter intake, and metabolic disorders in Danish dairy cows. Livestock Production Science 65, 107-118.
Poulsen, J. S. D. and B. E. V. Jones. 1974. The influence of metabolic alkalosis and other factors on the abomasal emptying rates in goats and cows. Nordisk Veterinærmedicin 26, 22-30.
Poulsen, J. S. D. 1974. Variations in the metabolic acid-base balance and some other clinical chemical parameters in dairy herds during the year. Nordisk Veterinærmedicin 26,1-12.
Puscas, I., M. Coltau, M. Baican , G. Domuta and A. Hecht. 2001. Calcium, carbonic anhydrase and gastric acid secretion. Physiology Research 50, 349-364.
Rohrbach, B. W., A. L. Cannedy, K. Freeman and B. D. Slenning. 1999. Risk factors for abomasal displacement in dairy cows. Journal of the American Veterinary Medical Association 214, 1660-1663.
Ruckebusch, Y, C. H. Malbert and E. C. Crichlow. 1987. Hexamethonium: a probe to assess autonomic nervous system involvement in upper gastrointestinal functions in conscious sheep. Veterinary Research Communications 11, 293-303.
Salzman, A. L. 1995. Nitric oxide in the gut. New Horizon 3, 352-364. Sarashina, T., S. Ichijo, J. Takahashi and S. Osame. 1990. Origin of abomasum
gas in the cows with displaced abomasum. Japanese Journal of Veterinary Science 52, 371-378.
Shaver, R. D. 1997. Nutritional risk factors in the etiology of left displaced abomasum in dairy cows: a review. Journal of Dairy Science 80, 2449-2453.
Smith, T. R., A. R. Hippen, D. C. Beitz and J. W. Young. 1997. Metabolic characteristics of induced ketosis in normal and obese dairy cows. Journal of Dairy Science 80, 1569-1581.
Svendsen, P. 1969. Etiology and pathogenesis of abomasal displacement in cattle. Nordisk Veterinærmedicin 21, Supplement I: 1-60.
Svendsen, P. 1970. Abomasal displacement in cattle. The concentrations of volatile fatty acids in ruminal and abomasal contents and their influence on abomasal motility and the flow-rate of abomasal contents. Nordisk Veterinærmedicin 22, 571-577.
Uribe, H. A., B. W. Kennedy, S. W. Martin and D. F. Kelton. 1995. Genetic parameters for common health disorders of Holstein cows. Journal of Dairy Science 78, 421-430.
Vandeplassche, G., M. Claeys, W. Oyaert and A. Houvenaghel. 1984. Influence of
29
prostaglandins on bovine abomasum: biosynthesis and in vitro motility experiments. Prostaglandins, Leukotrienes and Medicine 14, 15-24.
Van der Post, W. H. L. 1999. Unpublished results. Van Dorp R. T. E., S. W. Martin, M. M. Shoukri, J. P. T. M. Noordhuizen and J. C.
M. Dekkers. 1999. An epidemiologic study of disease in 32 registered Holstein dairy herds in British Columbia. Canadian Journal of Veterinary Research 63, 185-92.
Van Dorp, R. T. E., J. C. M. Dekkers, S. W. Martin and J. P. T. M. Noordhuizen. 1998. Genetic parameters of health disorders, and relationships with 305-day milk yield and conformation traits of registered Holstein cows. Journal of Dairy Science 81, 2264-2270.
Van Winden, S. C. L., M. Hoogeslag, R. Kuiper and J. P. T. M. Noordhuizen. 2002a. Risk indicators for displaced abomasa on herd level. The Veterinary Record Submitted.
Van Winden, S. C. L., K. E. Müller, R. Kuiper, and J. P. T. M. Noordhuizen. 2002b. Studies on the pH value of abomasal contents in dairy cows during the first three weeks after calving. Journal of Veterinary Medicine, part A 49, 157-160.
Vlaminck, K., C. Van Den Hende, W. Oyaert and E. Muylle. 1984. Studies of abomasal emptying in cattle. II. Effect of infusions in duodenum and abomasum on electromyographic complexes, pressure changes and emptying of the abomasum. Journal of Veterinary Medicine, Part A 31, 767-682.
Vlaminck , K., H. Van Meirhaeghe, C. Van den Hende, W. Oyaert and E. Muylle. 1985. Einfluß von Endotoxinen auf die Labmagenentleerung bein Rind. Deutsche Tierärztlicher Wochenschrift 92, 345-448.
Wolf, V., H. Hamann, H. Scholtz, and O. Distl. 2001. Einflüsse auf das auftreten von Labmagenverlagerung bei Deutschen Holstein Kühen, in German. Deutsche Tierärztliche Wochenschrift 108, 403-408.

30
31
Chapter Three
Risk indicators for displaced abomasum on herd level
S. C. L. Van Winden*, M. Hoogeslag*, R. Kuiper* and J. P. T. M. Noordhuizen*
*Department of Farm Animal Health, Faculty of Veterinary Medicine, Utrecht University, Yalelaan 7, 3584 CL, Utrecht, The Netherlands
Submitted for publication
32
Summary Displacement of the abomasum (DA) in dairy cattle is a digestive disorder with increasing incidence. The disease is multifactorial but nutrition and metabolism play a central role. Nutritional and management factors were compared in dairy herds with high (more than 5%) incidence of DA and control herds without clinical DA in the Netherlands. Data were collected via a questionnaire survey and analysed with a multivariate logistic regression.
Significant risk increasing factors were the size of the herd, milk production level, fraction of maize silage of the total roughage fed, feeding a mixture of grass silage of all seasons to milking cows, maximum of concentrates fed to the milking cows, the number of industrial by-products fed and the preventive application of propylene glycol. Risk reducing factors were the supply of hay in the dry period, feeding grass silage that contained grass of all seasons stored on one clamp to dry cows, amount of roughage leftovers, feeding concentrates via an automate, the amount of concentrates fed at the first day after calving and the amount of industrial by-products in the ration of milking cows. Underlying mechanisms are discussed and preventive measures in management and nutrition are suggested. Abbreviation key: DA = displaced abomasum, NEB = negative energy balance, VFA = volatile fatty acid.
33
Introduction Displacement of the abomasum (DA) is a disease in dairy cows resulting in economic loss and a reduction of animal welfare. The incidence in high producing dairy herds is rising and nowadays estimated at an average of 5 percent (Cameron et al., 1998). The economic relevance of DA depends on its incidence and on the value of the cows affected with DA. Costs per patient vary between 200 and 400 US $ (Bartlett et al, 1995) or 250 and 700 € (Breukink and Dijkhuizen, 1982). The costs depend on surgical costs, the lactation performance, replacement costs and slaughter value of the animal in case the operation is not successful.
The disease is mentioned to be multifactorial, in which nutrition and metabolism play a central role (Cameron et al., 1998). Most of the research has been done at the individual (cow) level. However, since DA is mainly a herd problem, it may be interesting to evaluate differences in management and feeding practices in different herds. Knowing the specific management practices conducted in problem herds, precautions can be taken. To this purpose herds without clinical DA were compared with herds with a clinical DA incidence of at least 5 percent per year. Via a personal interview data were collected and analysed by multivariate logistic regression.
Materials and methods Selection of herds Within a radius of 40 kilometres from the Utrecht University veterinary practitioners were asked to report dairy herds with an annual DA incidence of at least 5%. The incidence was based on clinical diagnosis followed by treatment. The incidence was based on both heifers and cows, and was verified in the administration of the veterinary practice. A farm without clinical DA as a herd problem, incidence below 1%, was matched with the selected farm on the basis of housing system, surface area of pasture and breed of the cows. The control farm was preferably close to the DA farm and client of the same practitioner. Data were collected from 53 pairs of farms. Data collection Nutritional and management factors that have been suggested to be associated with the incidence of DA were evaluated. Selection of these factors was based on literature, the suggestion of the local practitioner, the nutritionist or the farmer. For
34
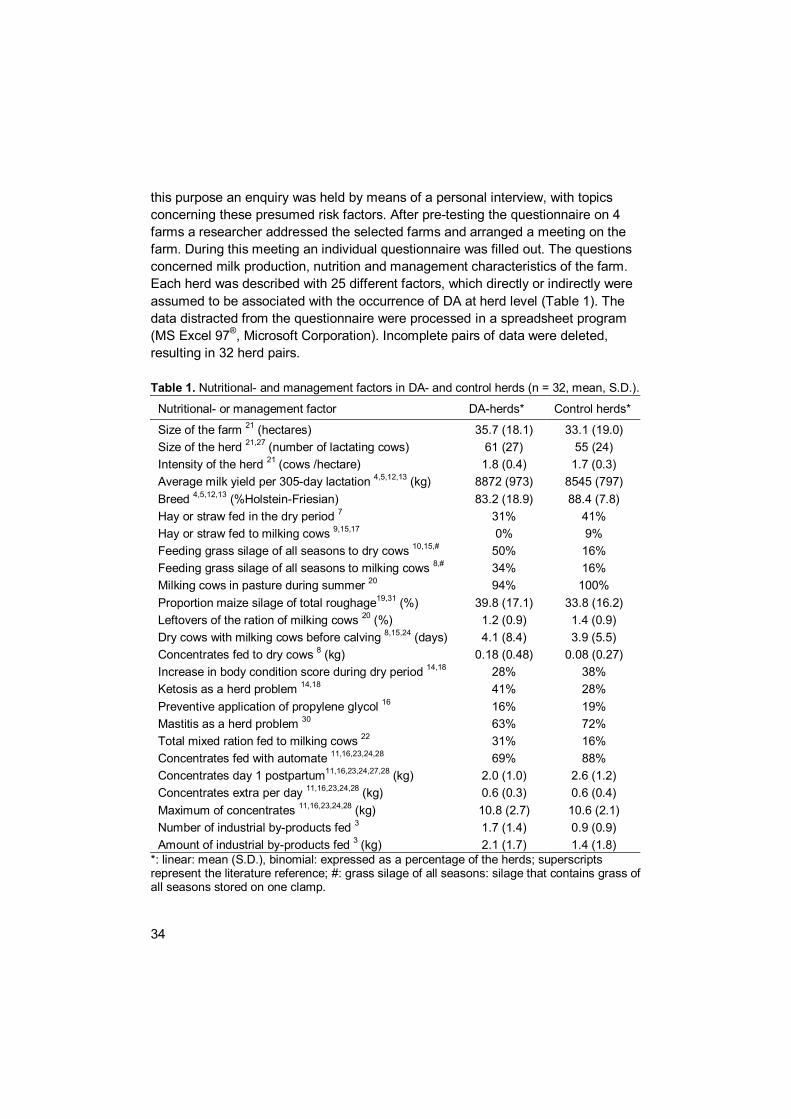
this purpose an enquiry was held by means of a personal interview, with topics concerning these presumed risk factors. After pre-testing the questionnaire on 4 farms a researcher addressed the selected farms and arranged a meeting on the farm. During this meeting an individual questionnaire was filled out. The questions concerned milk production, nutrition and management characteristics of the farm. Each herd was described with 25 different factors, which directly or indirectly were assumed to be associated with the occurrence of DA at herd level (Table 1). The data distracted from the questionnaire were processed in a spreadsheet program (MS Excel 97®, Microsoft Corporation). Incomplete pairs of data were deleted, resulting in 32 herd pairs. Table 1. Nutritional- and management factors in DA- and control herds (n = 32, mean, S.D.).
Nutritional- or management factor DA-herds* Control herds*
Size of the farm 21 (hectares) 35.7 (18.1) 33.1 (19.0) Size of the herd 21,27 (number of lactating cows) 61 (27) 55 (24) Intensity of the herd 21 (cows /hectare) 1.8 (0.4) 1.7 (0.3) Average milk yield per 305-day lactation 4,5,12,13 (kg) 8872 (973) 8545 (797) Breed 4,5,12,13 (%Holstein-Friesian) 83.2 (18.9) 88.4 (7.8) Hay or straw fed in the dry period 7 31% 41% Hay or straw fed to milking cows 9,15,17 0% 9% Feeding grass silage of all seasons to dry cows 10,15,# 50% 16% Feeding grass silage of all seasons to milking cows 8,# 34% 16% Milking cows in pasture during summer 20 94% 100% Proportion maize silage of total roughage19,31 (%) 39.8 (17.1) 33.8 (16.2) Leftovers of the ration of milking cows 20 (%) 1.2 (0.9) 1.4 (0.9) Dry cows with milking cows before calving 8,15,24 (days) 4.1 (8.4) 3.9 (5.5) Concentrates fed to dry cows 8 (kg) 0.18 (0.48) 0.08 (0.27) Increase in body condition score during dry period 14,18 28% 38% Ketosis as a herd problem 14,18 41% 28% Preventive application of propylene glycol 16 16% 19% Mastitis as a herd problem 30 63% 72% Total mixed ration fed to milking cows 22 31% 16% Concentrates fed with automate 11,16,23,24,28 69% 88% Concentrates day 1 postpartum11,16,23,24,27,28 (kg) 2.0 (1.0) 2.6 (1.2) Concentrates extra per day 11,16,23,24,28 (kg) 0.6 (0.3) 0.6 (0.4) Maximum of concentrates 11,16,23,24,28 (kg) 10.8 (2.7) 10.6 (2.1) Number of industrial by-products fed 3 1.7 (1.4) 0.9 (0.9) Amount of industrial by-products fed 3 (kg) 2.1 (1.7) 1.4 (1.8)
*: linear: mean (S.D.), binomial: expressed as a percentage of the herds; superscripts represent the literature reference; #: grass silage of all seasons: silage that contains grass of all seasons stored on one clamp.

35
Modelling technique and statistical analysis DA-herd is a dichotomous variable, thus a logit transformation as a link function is used: the logistic regression in which the log of the odds is a function of the variables in the model. In general formula:
ln (π/1-π) = β0 + β1*variable + …. + βn*variable + residual deviance A multivariate analysis was performed on all 25 factors with a backward
selection procedure; factors with a p-value < 0.10 as based on the maximum likelihood estimator were deleted from the model. The residual deviance of the final model and the degrees of freedom of the residual deviance in a Chi-square test were used to indicate the goodness-of-fit of the complete model (Curtis et al., 1985). Of the significant variables correlation coefficients were calculated in order to detect colinearity of the data, since high correlation coefficients of the variables cause difficulties in interpreting the results.
The estimated base line for the odds of being a DA-herd is eβ0 and the base line probability (π) for being a DA-herd is eβ0 /(1+ eβ0). When the variable associated with being a DA-herd is binomial (present or not present) then the odds ratio (OR) for being a DA-herd is 2,718282(coefficient). When the variable is linear the OR, compared with absence of the variable, is 2,718282(coefficient*value). The OR of the 13 variables of the multivariate model is the product of the 13 OR’s resulting from the formula. The interpretation of the OR is according to Thrusfield (1997).
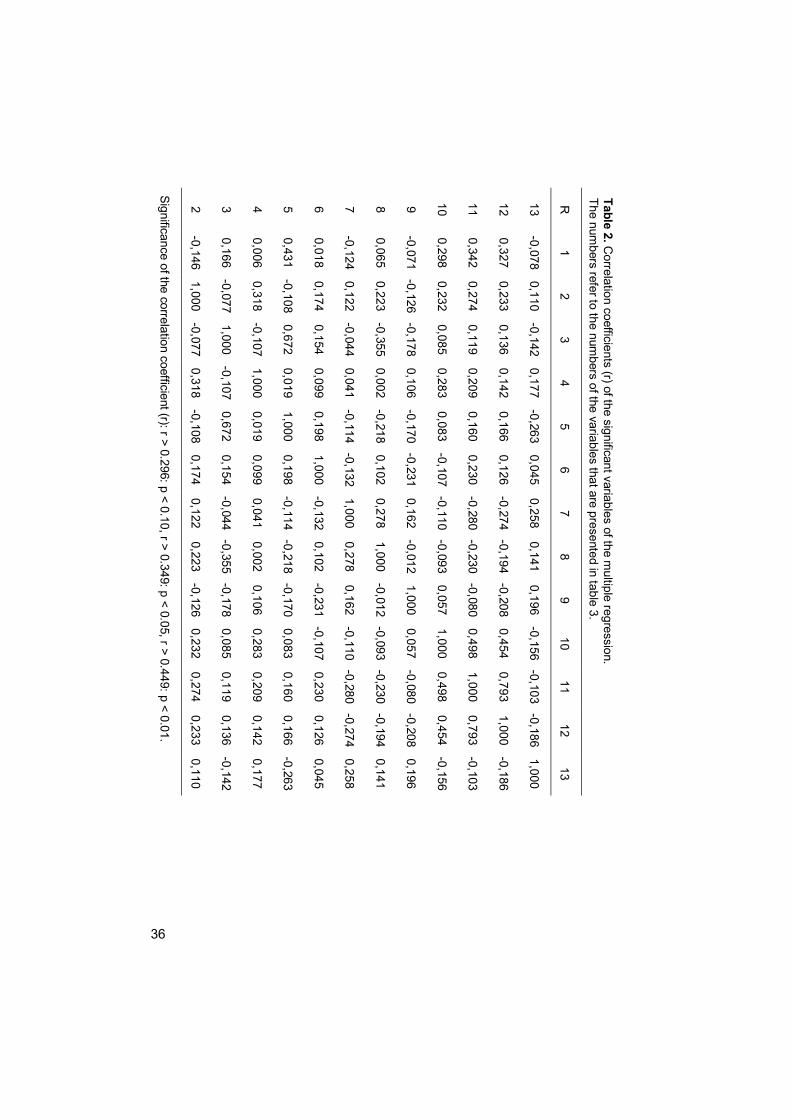
Results All addressed farmers co-operated with the enquiry. The time span for completing the questionnaire was about 45 minutes. As Table 1 shows there are differences between the DA herds and the control herds. In Table 2 the correlation coefficients are reported of the significant variables. There is a high correlation between the number of by-products and the amount of by-products fed to dairy cows. This makes the interpretation of these variables difficult. In Table 3 the results of the multivariate logistic regression analysis are reported. The interpretation of the regression coefficients is as follows: a positive value indicates an increase in the odds for being a DA-herd, a risk-attributing factor, whereas a negative value decreases these odds, a preventive factor. The residual deviance of the complete model is 35.66 with 40 degrees of freedom. The result for the goodness-of-fit of the complete model of the Chi-square test is p=0.67. This indicates that the goodness-of-fit of the complete model is rather high; the probability of p = 0.67 is far higher than the p < 0.05 that is generally accepted to reject a hypothesis or model.
36
2 3 4 5 6 7 8 9
10
11
12
13
R
-0,146
0,166
0,006
0,431
0,018
-0,124
0,065
-0,071
0,298
0,342
0,327
-0,078
1
1,000
-0,077
0,318
-0,108
0,174
0,122
0,223
-0,126
0,232
0,274
0,233
0,110
2
-0,077
1,000
-0,107
0,672
0,154
-0,044
-0,355
-0,178
0,085
0,119
0,136
-0,142
3
0,318
-0,107
1,000
0,019
0,099
0,041
0,002
0,106
0,283
0,209
0,142
0,177
4
-0,108
0,672
0,019
1,000
0,198
-0,114
-0,218
-0,170
0,083
0,160
0,166
-0,263
5
0,174
0,154
0,099
0,198
1,000
-0,132
0,102
-0,231
-0,107
0,230
0,126
0,045
6
0,122
-0,044
0,041
-0,114
-0,132
1,000
0,278
0,162
-0,110
-0,280
-0,274
0,258
7
0,223
-0,355
0,002
-0,218
0,102
0,278
1,000
-0,012
-0,093
-0,230
-0,194
0,141
8
-0,126
-0,178
0,106
-0,170
-0,231
0,162
-0,012
1,000
0,057
-0,080
-0,208
0,196
9
0,232
0,085
0,283
0,083
-0,107
-0,110
-0,093
0,057
1,000
0,498
0,454
-0,156
10
0,274
0,119
0,209
0,160
0,230
-0,280
-0,230
-0,080
0,498
1,000
0,793
-0,103
11
0,233
0,136
0,142
0,166
0,126
-0,274
-0,194
-0,208
0,454
0,793
1,000
-0,186
12
Significance of the correlation coefficient (r): r > 0.296: p < 0.10, r > 0.349: p < 0.05, r > 0.449: p < 0.01.
0,110
-0,142
0,177
-0,263
0,045
0,258
0,141
0,196
-0,156
-0,103
-0,186
1,000
13
Table 2. Correlation coefficients (r) of the significant variables of the m
ultiple regression. The num
bers refer to the numbers of the variables that are presented in table 3.
37
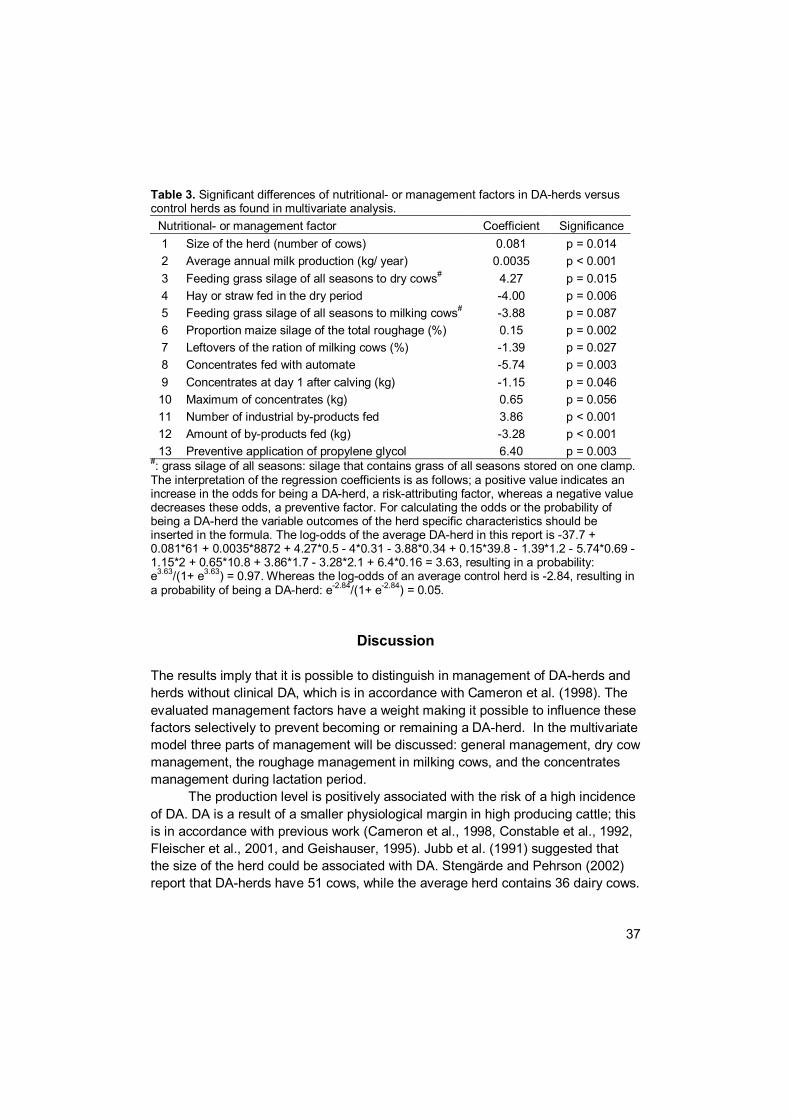
Table 3. Significant differences of nutritional- or management factors in DA-herds versus control herds as found in multivariate analysis.
Nutritional- or management factor Coefficient Significance 1 Size of the herd (number of cows) 0.081 p = 0.014 2 Average annual milk production (kg/ year) 0.0035 p < 0.001 3 Feeding grass silage of all seasons to dry cows# 4.27 p = 0.015 4 Hay or straw fed in the dry period -4.00 p = 0.006 5 Feeding grass silage of all seasons to milking cows# -3.88 p = 0.087 6 Proportion maize silage of the total roughage (%) 0.15 p = 0.002 7 Leftovers of the ration of milking cows (%) -1.39 p = 0.027 8 Concentrates fed with automate -5.74 p = 0.003 9 Concentrates at day 1 after calving (kg) -1.15 p = 0.046 10 Maximum of concentrates (kg) 0.65 p = 0.056 11 Number of industrial by-products fed 3.86 p < 0.001 12 Amount of by-products fed (kg) -3.28 p < 0.001 13 Preventive application of propylene glycol 6.40 p = 0.003
#: grass silage of all seasons: silage that contains grass of all seasons stored on one clamp. The interpretation of the regression coefficients is as follows; a positive value indicates an increase in the odds for being a DA-herd, a risk-attributing factor, whereas a negative value decreases these odds, a preventive factor. For calculating the odds or the probability of being a DA-herd the variable outcomes of the herd specific characteristics should be inserted in the formula. The log-odds of the average DA-herd in this report is -37.7 + 0.081*61 + 0.0035*8872 + 4.27*0.5 - 4*0.31 - 3.88*0.34 + 0.15*39.8 - 1.39*1.2 - 5.74*0.69 - 1.15*2 + 0.65*10.8 + 3.86*1.7 - 3.28*2.1 + 6.4*0.16 = 3.63, resulting in a probability: e3.63/(1+ e3.63) = 0.97. Whereas the log-odds of an average control herd is -2.84, resulting in a probability of being a DA-herd: e-2.84/(1+ e-2.84) = 0.05.
Discussion The results imply that it is possible to distinguish in management of DA-herds and herds without clinical DA, which is in accordance with Cameron et al. (1998). The evaluated management factors have a weight making it possible to influence these factors selectively to prevent becoming or remaining a DA-herd. In the multivariate model three parts of management will be discussed: general management, dry cow management, the roughage management in milking cows, and the concentrates management during lactation period.
The production level is positively associated with the risk of a high incidence of DA. DA is a result of a smaller physiological margin in high producing cattle; this is in accordance with previous work (Cameron et al., 1998, Constable et al., 1992, Fleischer et al., 2001, and Geishauser, 1995). Jubb et al. (1991) suggested that the size of the herd could be associated with DA. Stengärde and Pehrson (2002) report that DA-herds have 51 cows, while the average herd contains 36 dairy cows.
38
The present results confirm the previous findings; there is a positive relation between the number of cows in the herd and the odds for high incidence of DA. Since the surface area of pasture and the number of cows per hectare were non-significant factors in the model, the effect of the number of cows in the herd probably should be explained by the number of cows per labour unit. Although the number of labour units is not quantified per herd as such, a likely explanation could be that much time is needed for the daily work, so less time can be spent on the care and nutrition of the individual postpartum cow.
Dry cow management reveals two factors associated with the incidence of DA in a herd. The first is feeding grass silage that contained grass of all seasons stored on one clamp, compared to seasonally stored grass silage. This can be due to the management practice to store the grass either in one large clamp or in smaller season clamps. When season silage is present the (late) spring silage will be fed to the milking cows, since this silage has a higher quality (energy dense, rapidly fermented) and autumn silage will be supplied to the dry cows. In grass silage that contained grass of all seasons stored on one clamp the average quality is higher than that of autumn silage. Feeding such silage ad libitum to dry cows would lead to an increase in body condition score. In order to prevent this grass silage that contained grass of all seasons stored on one clamp will be fed to the dry cows in restricted amounts. This will lead to a poor rumen filling with a small fibre mat. This fibre mat is essential for optimal rumen fermentation and motility of the gastrointestinal tract (Goff and Horst, 1997). Poor rumen fill is also assumed to be a factor contributing to displacement of the abomasum. A well-filled rumen can prevent the shift of the abomasum to the left, a first start of displacement (Dirksen, 1962 and Goff and Horst, 1997). By the same mechanism feeding hay or straw to dry cows is shown to prevent a high incidence of DA (Coppock et al., 1972 and Nocek et al., 1984).
Feeding grass silage that contained grass of all seasons stored on one clamp to milking cows has a preventive effect on the odds for being a DA-herd. Although fluctuations in quality are more frequently present in grass silage that contained grass of all seasons stored on one clamp, the on average higher fibre content and slower fermentation can be the cause of a reduction of the odds. Another risk reducing feature is the fact that in most cases the cows get the same grass silage that contained grass of all seasons stored on one clamp in the dry period as well as in the milking period. This leads to a faster adaptation of both the cow and the rumen to the ration fed during early lactation compared with a cow fed autumn silage in the dry period and spring silage during the lactation period (Curtis et al., 1985). Another significant roughage characteristic is the percentage of maize silage in the ration of the milking cows; the odds for being a DA-herd increase with the increase in the proportion maize silage. Whitlock (1969) reports maize silage to be more frequently fed in DA cows. The risk attributing effect of a higher amount of

39
maize silage can be due to a reduced fibre quality of roughage. The last item in the milking cows’ roughage management is the percentage of leftovers. This suggests that in DA-herds, cows are fed limited compared with cows in control herds. This is in accordance with a previous report that indicate a reduced feed intake prior to DA (Østergaard and Gröhn, 2000).
Factors concerning concentrates feeding in this report are not all in agreement with previous reports. An explanation for the difference can be the fact that the analysis is performed in a multivariate method. In such a method the effect of one variable is adjusted for by other variables (Thrusfield, 1997). One important factor in this case is the automatic supply of concentrates. The automate gives the concentrates spread over 24 hours in, at least, 6 portions. By supplying smaller amounts the negative effects of a high level of concentrates on the possible occurrence of DA are reduced. Stengärde and Pehrson (2002) reported that the amount of concentrates fed at calving is not an important factor in the development of DA. Our present results indicate that the amount of concentrates given at the first day after calving is a preventive factor. A concentrate rich diet produces more energy and glycogenic precursors than a ration rich of roughage, and may prevent a too severe negative energy balance (NEB). A severe NEB is strongly associated with the development of DA (Geishauser et al., 1998 and Heuer et al., 1999). The automatic supply of concentrates does not decrease the negative effects of the maximum amount of concentrates offered. This is probably due to the fact that even divided in 6 portions the amount supplied per portion is still large enough to result in (subclinical) acidosis of the rumen contents and a shift in the spectrum of volatile fatty acids (VFA). Rapidly fermented concentrates result in higher amounts of VFA and relatively more propionic acid. Both lead to hypomotility of the abomasum with DA as a result (Dougherty et al., 1975, Gregory and Miller, 1989, Lester and Bolton, 1994, Martens, 2000, and Svendsen, 1970). The preventive supply of propylene glycol can by the same pathway result in a higher incidence of DA. Another effect can be that propylene glycol is often, as a metaphylactic treatment, offered to cows presumed to be in NEB. For that reason herds with a frequent preventive supply of propylene glycol can be regarded as herds with problems with severe NEB. As mentioned before cows with severe NEB are more likely to develop DA (Geishauser et al., 1998 and Heuer et al., 1999).
Industrial by-products are stored for several months and fed for either the energy (pressed beet pulp, maize gluten feed) or the protein supply (brewer’s grain, soybean meal). During storage and feeding decay can occur, resulting in “unbalanced” by-products. This can result in a disturbance of the fermentation in the rumen. These disturbances can result in hypomotility of the gastrointestinal tract with the subsequent development of DA (Breukink, 1981 and Dougherty et al., 1975). The risk of “unbalanced” by-products is higher when more by-products are fed and the speed of feeding is low, resulting in an increased risk for DA. Feeding a
40
large amount of by-products increases speed of feeding and reduces in that way the odds for becoming a DA-herd. The interpretation of the effects of feeding of by-products, however, is difficult due to colinearity.
Conclusion The present study reveals several nutritional and management factors that are significantly related with a high incidence of DA at herd level. Knowing these factors and their size of effect a choice can be made which of the factors should be addressed to avoid being or becoming a DA-herd. The choice of which factor to change can be based on economic grounds but also with the aim to approve animal welfare. Feeding hay to dry cows and supply of enough fibre to dairy cows can prevent high incidence of DA, without loosing productivity of the herd. The supply of concentrates with an automate is advisable to prevent DA.
References Bartlett, P. C., M. Kopcha, P. H. Coe, N. K. Ames, P. L. Ruegg, and R. J. Erskine
(1). 1995. Economic comparison of pyloro-omentopexy vs roll-and-toggle procedure for the treatment of left displacement of the abomasum in dairy cattle. Journal of the American Veterinary Medical Association 206, 1156-1162.
Breukink, H. J. (2). 1981. Verstoorde fermentatie van de pens. Tijdschrift voor Diergeneeskunde 106, 185-190. (In Dutch, with English summery)
Breukink, H. J., and A. A. Dijkhuizen (3). 1982. De lebmaagdislocatie naar links in economisch perspectief. Tijdschrift voor Diergeneeskunde 107, 264-270. (In Dutch, with English summery)
Cameron, R. E. B., P. B. Dijk, T. H. Herdt, J. B. Kaneene, R. Miller, F. Bucholtz, J. S. Liesman, M. J. Vandehaar, and R. S. Emery (4). 1998. Dry cow diet, management, and energy balance as risk factors for displaced abomasum in high producing dairy herds. Journal of Dairy Science 81, 132-139.
Constable, P. D., G. Y. Miller, G. F. Hoffsis, B. L. Hull, and D. M. Rings (5). 1992. Risk factors for abomasal volvulus and left abomasal displacement in cattle. American Journal of Veterinary Research 53, 1184-1192.
Coppock, C. E., C. H. Noller, S. A. Wolfe, C. J. Callahan, and J. S. Baker (6). 1972. Effect of forage-concentrate ratio in complete feeds fed ad libitum on feed intake prepartum and the occurrence of abomasal displacement in dairy cows. Journal of Dairy Science 55, 783-789.
Coppock, C. E. (7). 1974. Displaced abomasum in dairy cattle: etiological factors.

41
Journal of Dairy Science 57, 926-933. Curtis, C. R., H. N. Erb, C. J. Sniffen, R. D. Smith, and D. S. Kronfeld (8). 1985.
Path analysis of dry period nutrition, postpartum metabolic and reproductive disorders, and mastitis in Holstein cows. Journal of Dairy Science 68, 2347-2360.
Dawson, L. J., E. P. Aalseth, L. E. Rice, and G. D. Adams (9). 1992. Influence of fiber form in a complete mixed ration on incidence of left displacement abomasum in postpartum dairy cows. Journal of the American Veterinary Medicine Association 200, 1989-1992.
Dirksen, G. (10). 1962. Vorbetrachtungen zur Topographie, Anatomie und Physiologie der Wiederkäuermägen. In Die Erweiterung, Verlagerung und Drehung des Lebmages beim Rind, Berlin and Hamburg, Verlag Paul Parey. pp 8-17.
Dougherty, R. W., J. L. Riley, and H. M. Cook (11). 1975. Changes in Motility and pH in the Digestive Tract of Experimentally Overfed Sheep. American Journal of Veterinary Research 36, 827-829.
Fleischer, P., M. Metzner, M. Beyerbach, M. Hoedemaker, and W. Klee (12). 2001. The relationship between milk yield and the incidence of some diseases in dairy cows. Journal of Dairy Science 84, 2025-2035.
Geishauser, T. (13). 1995. Abomasal displacement in the bovine – a review on character, occurrence aetiology and pathogenesis Journal of Veterinary Medicine Series A 42, 229-251.
Geishauser, T., K. Leslie, T. Duffield, D. Sandals, and V. Edge (14). 1998. The association between selected metabolic parameters and left abomasal displacement in dairy cows. Journal of Veterinary Medicine, Series A 45, 499-511.
Goff, J. P. and R. L. Horst (15). 1997. Physiological changes at parturition and their relationship to metabolic disorders. Journal of Dairy Science 80, 1260-1268.
Gregory, P. C. and S. J. Miller (16). 1989. Influence of duodenal digesta composition on abomasal outflow, motility and small intestinal transit time in sheep. Journal of Physiology 413, 415-432.
Grymer, J., M. Hesselholt, and P. Willeberg (17). 1981. Feed composition and left abomasal displacement in dairy cattle, a case-control study. Nordisk Veterinærmedicin 36, 306-309.
Heuer, C., Y. H. Schukken, and P. Dobbelaar (18). 1999. Postpartum body condition score and results from the first test day milk as predictors of disease, fertility, yield and culling on commercial dairy herds. Journal of Dairy Science 82, 295-304.
Holtenius, K., K. Sternbauer, and P. Holtenius (19). 2000. The effect of the plasma glucose level on the abomasal function in dairy cows. Journal of Animal Science 78, 1930-1935.
42
Jacobsen, K. L. (20). 1995. Displaced abomasa and thin cows in a component-fed dairy herd. The compendium on continuing education for the practising veterinarian, Food Animal 17, Supplement, S21-S27.
Jubb, T. F., J. Malmo, G. M. Davis, and A. S. Vawser (21). 1991. Left-side displacement of the abomasum in dairy cows at pasture. Australian Veterinary Journal 68, 140-142.
Kolver, E. S. and L. D. Muller (22). 1998. Performance and nutrient intake of high producing Holstein cows consuming pasture or a total mixed ration. Journal of Dairy Science 81, 1403-1411.
Lester, G. D. and J. R. Bolton (23). 1994. Effect of dietary composition on abomasal and duodenal myoelectrical activity. Research in Veterinary Science 57, 270-276.
Martens, H. (24). 2000. Relations between feeding, physiology of the forestomacs and pathogenesis of abomasal displacement. In: Ätiologie, Pathogenese, Diagnostik, Prognose, Therapie und Prophylaxe der Dislocatio abomasi, Proceedings Internationaler Workshop. Leipzig 14 Oktober 1998. Editor: Fürll, M., Leipzig, Leipziger Universitätsverlag. pp81-101.
Nocek, J. E., J. E. English, and D. G. Braund (25). 1984. Effects of various forage feeding programs during dry period on body condition and subsequent lactation health, production, and reproduction. Journal of Dairy Science 66, 1108-1118.
Østergaard, S. and Y. T. Gröhn (26). 2000. Concentrate feeding, dry-matter intake, and metabolic disorders in Danish dairy cows. Livestock Production Science 65, 107-118.
Stengärde, L. U. and B. G. Pehrson (27). 2002. Effects of management, feeding, and treatment on clinical and biochmical variables in cattle with displaced abomasum. American Journal of Veterinary Research 63, 137-142.
Svendsen, P. (28). 1970. Abomasal displacement in cattle, the concentrations of volatile fatty acids in ruminal and abomasal contents and their influence on abomasal motility and the flow-rate of the abomasal contents. Nordisk Veterinærmedicin 22, 571-577.
Thrusfield, M. (29). 1997. Determining association; Multivariate analysis. In: Veterinary epidemiology, second edition. Oxford, Blackwell Science Ltd. pp. 218.
Vlaminck, K., H. Van Meirhaeghe, C. Van den Hende, W. Oyaert, and E. Muylle (30). 1985. Einfluß von Endotoxinen auf die Labmagenentleerung bein Rind. Deutsche Tierärztlicher Wochenschrift 92, 345-448.
Whitlock, R. H. (31). 1969. Diseases of the abomasum associates with current feeding practices. Journal of the American Veterinary Medicine Association 154, 1203-1205.
43
Chapter Four
The position of the abomasum in dairy cows during the first six weeks after calving
S. C. L. Van Winden*, C. R. Brattinga#, K. E. Müller*, J. P. T. M. Noordhuizen* and A. C. Beynen†
*Department of Farm Animal Health, Faculty of Veterinary Medicine, Utrecht University, Yalelaan 7, 3584 CL, Utrecht, The Netherlands
†Department of Nutrition, Faculty of Veterinary Medicine, Utrecht University, Yalelaan 16, 3584 CM, Utrecht, The Netherlands
#Department of Animal Sciences, Animal Husbandry Group, Wageningen University, PO Box 338, 6700 AH Wageningen, The Netherlands
The Veterinary Record In press

44
Summary The abdominal position of the abomasum at parturition and during the following days may determine the risk of developing displacement of the abomasum; a high position is assumed to contribute to the risk. The dynamics of the position of the abomasum were unknown. Six cows were examined by ultrasonography at regular intervals during a postpartum period of six weeks. The position of the abomasum was measured by determining the distance between the margin of the abomasum at the left side and the ventral midline at two sites.
During the last weeks of pregnancy the abomasum was present at the left ventral side of the abdominal cavity for a small area. At parturition the abomasum had a high position at the left side which became lower in the subsequent period. The abomasum had the largest deviation from the midline immediately after parturition. The position of the abomasum was related to the number of days after calving, feed intake, pH value and the osmotic pressure of the rumen fluid. There was a considerable inter-individual variation in abomasal position, which was in part due to analytical variation. The position of the abomasum had a circadian rhythm.
It is suggested that non-invasive measurement of the position of the abomasum is a useful method to study, in animal groups, relations between interventions, position of the abomasum, possible physiological determinants and clinically displaced abomasum. Abbreviation key: DA = displaced abomasum, VFA = volatile fatty acid.
45
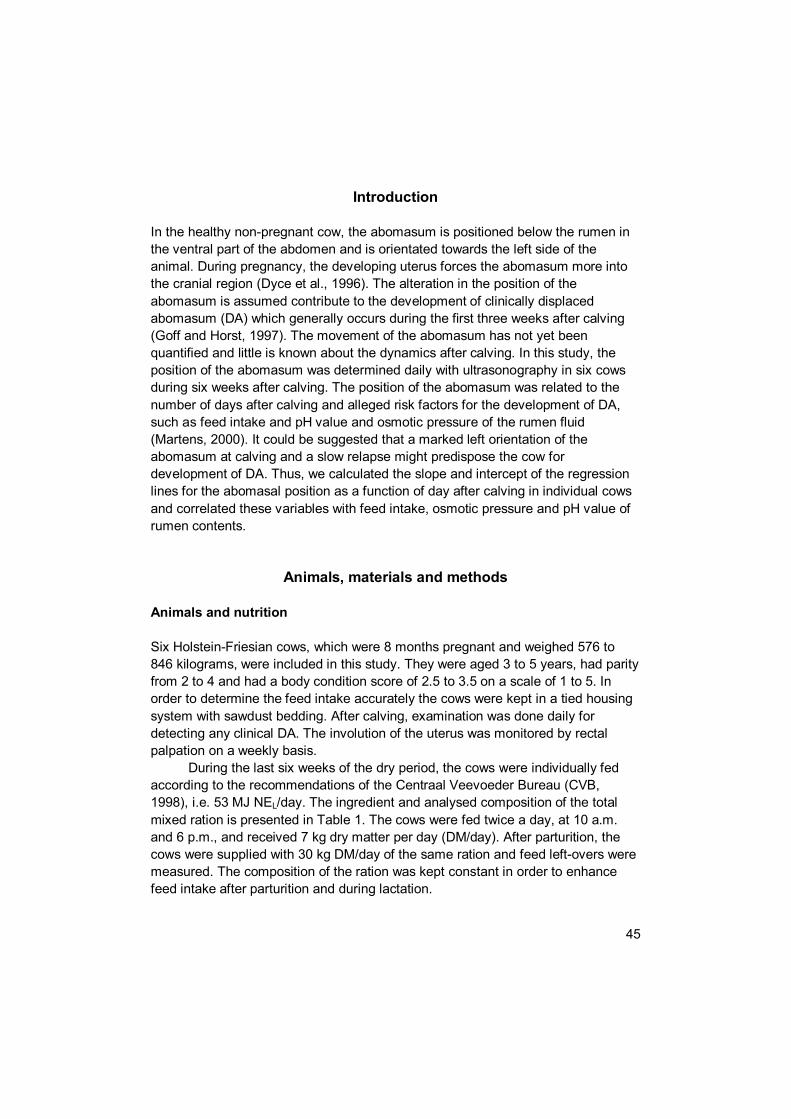
Introduction In the healthy non-pregnant cow, the abomasum is positioned below the rumen in the ventral part of the abdomen and is orientated towards the left side of the animal. During pregnancy, the developing uterus forces the abomasum more into the cranial region (Dyce et al., 1996). The alteration in the position of the abomasum is assumed contribute to the development of clinically displaced abomasum (DA) which generally occurs during the first three weeks after calving (Goff and Horst, 1997). The movement of the abomasum has not yet been quantified and little is known about the dynamics after calving. In this study, the position of the abomasum was determined daily with ultrasonography in six cows during six weeks after calving. The position of the abomasum was related to the number of days after calving and alleged risk factors for the development of DA, such as feed intake and pH value and osmotic pressure of the rumen fluid (Martens, 2000). It could be suggested that a marked left orientation of the abomasum at calving and a slow relapse might predispose the cow for development of DA. Thus, we calculated the slope and intercept of the regression lines for the abomasal position as a function of day after calving in individual cows and correlated these variables with feed intake, osmotic pressure and pH value of rumen contents.
Animals, materials and methods Animals and nutrition Six Holstein-Friesian cows, which were 8 months pregnant and weighed 576 to 846 kilograms, were included in this study. They were aged 3 to 5 years, had parity from 2 to 4 and had a body condition score of 2.5 to 3.5 on a scale of 1 to 5. In order to determine the feed intake accurately the cows were kept in a tied housing system with sawdust bedding. After calving, examination was done daily for detecting any clinical DA. The involution of the uterus was monitored by rectal palpation on a weekly basis.
During the last six weeks of the dry period, the cows were individually fed according to the recommendations of the Centraal Veevoeder Bureau (CVB, 1998), i.e. 53 MJ NEL/day. The ingredient and analysed composition of the total mixed ration is presented in Table 1. The cows were fed twice a day, at 10 a.m. and 6 p.m., and received 7 kg dry matter per day (DM/day). After parturition, the cows were supplied with 30 kg DM/day of the same ration and feed left-overs were measured. The composition of the ration was kept constant in order to enhance feed intake after parturition and during lactation.
46
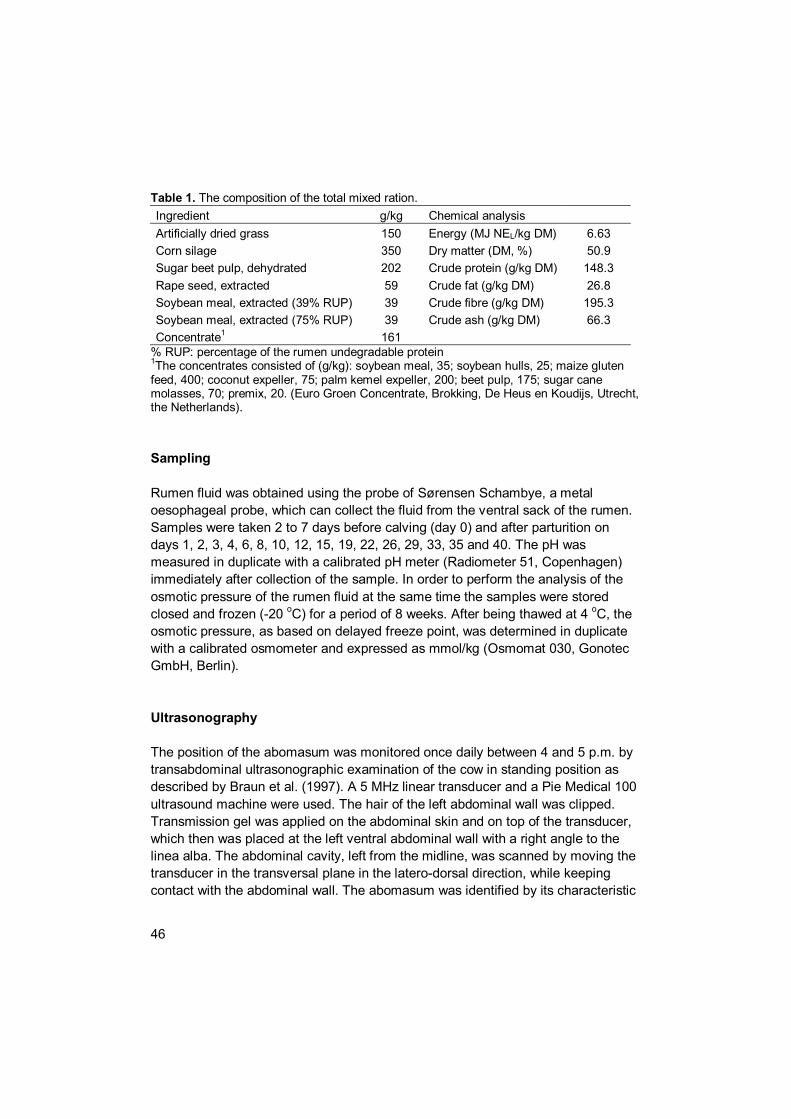
Table 1. The composition of the total mixed ration. Ingredient g/kg Chemical analysis Artificially dried grass 150 Energy (MJ NEL/kg DM) 6.63 Corn silage 350 Dry matter (DM, %) 50.9 Sugar beet pulp, dehydrated 202 Crude protein (g/kg DM) 148.3 Rape seed, extracted 59 Crude fat (g/kg DM) 26.8 Soybean meal, extracted (39% RUP) 39 Crude fibre (g/kg DM) 195.3 Soybean meal, extracted (75% RUP) 39 Crude ash (g/kg DM) 66.3 Concentrate1 161
% RUP: percentage of the rumen undegradable protein 1The concentrates consisted of (g/kg): soybean meal, 35; soybean hulls, 25; maize gluten feed, 400; coconut expeller, 75; palm kemel expeller, 200; beet pulp, 175; sugar cane molasses, 70; premix, 20. (Euro Groen Concentrate, Brokking, De Heus en Koudijs, Utrecht, the Netherlands). Sampling Rumen fluid was obtained using the probe of Sørensen Schambye, a metal oesophageal probe, which can collect the fluid from the ventral sack of the rumen. Samples were taken 2 to 7 days before calving (day 0) and after parturition on days 1, 2, 3, 4, 6, 8, 10, 12, 15, 19, 22, 26, 29, 33, 35 and 40. The pH was measured in duplicate with a calibrated pH meter (Radiometer 51, Copenhagen) immediately after collection of the sample. In order to perform the analysis of the osmotic pressure of the rumen fluid at the same time the samples were stored closed and frozen (-20 oC) for a period of 8 weeks. After being thawed at 4 oC, the osmotic pressure, as based on delayed freeze point, was determined in duplicate with a calibrated osmometer and expressed as mmol/kg (Osmomat 030, Gonotec GmbH, Berlin). Ultrasonography The position of the abomasum was monitored once daily between 4 and 5 p.m. by transabdominal ultrasonographic examination of the cow in standing position as described by Braun et al. (1997). A 5 MHz linear transducer and a Pie Medical 100 ultrasound machine were used. The hair of the left abdominal wall was clipped. Transmission gel was applied on the abdominal skin and on top of the transducer, which then was placed at the left ventral abdominal wall with a right angle to the linea alba. The abdominal cavity, left from the midline, was scanned by moving the transducer in the transversal plane in the latero-dorsal direction, while keeping contact with the abdominal wall. The abomasum was identified by its characteristic
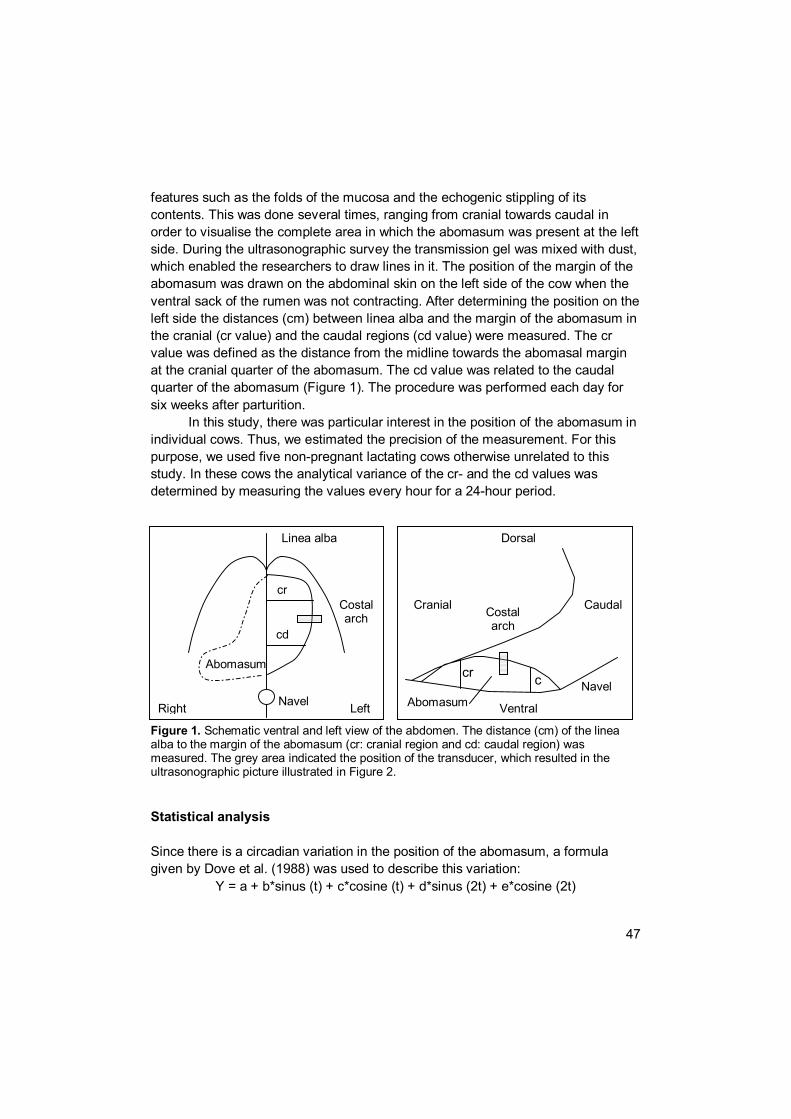
47
features such as the folds of the mucosa and the echogenic stippling of its contents. This was done several times, ranging from cranial towards caudal in order to visualise the complete area in which the abomasum was present at the left side. During the ultrasonographic survey the transmission gel was mixed with dust, which enabled the researchers to draw lines in it. The position of the margin of the abomasum was drawn on the abdominal skin on the left side of the cow when the ventral sack of the rumen was not contracting. After determining the position on the left side the distances (cm) between linea alba and the margin of the abomasum in the cranial (cr value) and the caudal regions (cd value) were measured. The cr value was defined as the distance from the midline towards the abomasal margin at the cranial quarter of the abomasum. The cd value was related to the caudal quarter of the abomasum (Figure 1). The procedure was performed each day for six weeks after parturition.
In this study, there was particular interest in the position of the abomasum in individual cows. Thus, we estimated the precision of the measurement. For this purpose, we used five non-pregnant lactating cows otherwise unrelated to this study. In these cows the analytical variance of the cr- and the cd values was determined by measuring the values every hour for a 24-hour period. Figure 1. Schematic ventral and left view of the abdomen. The distance (cm) of the linea alba to the margin of the abomasum (cr: cranial region and cd: caudal region) was measured. The grey area indicated the position of the transducer, which resulted in the ultrasonographic picture illustrated in Figure 2. Statistical analysis Since there is a circadian variation in the position of the abomasum, a formula given by Dove et al. (1988) was used to describe this variation:
Y = a + b*sinus (t) + c*cosine (t) + d*sinus (2t) + e*cosine (2t)
LeftRight Navel
Linea alba
Costal arch
Abomasum
cr
cd
Abomasum
Costal arch
Ventral
Dorsal
Navel ccr
Cranial Caudal

48
Where Y is the cr or cd value and t is the time expressed in hours, but transformed into radian by multiplying by 2π/24. The terms sinus (t), cosine (t), sinus (2t) and cosine (2t) were calculated for each hour of the day. These terms were used as fixed effects and cow was used as random effect in a Linear Mixed Effects (LME) model. This model was used, as it takes dependency of the data into account. With the LME equation obtained, all values of the position of the abomasum were transformed to values for 4 p.m. Via these values the precision of the measurement of the cr- and the cd values could be determined, as expressed as the coefficient of variation ((standard deviation/mean) * 100%).
Using LME, for all the models the within-group correlation was analysed with the auto-correlation of the first order (AR(1)) option. After analysis with and without AR(1) a likelihood ratio test was performed to determine whether the use of the AR(1) option is justified.
In a LME model the position of the abomasum was related to the numbers of days after calving, feed intake, osmotic pressure and pH value of the rumen fluid. This procedure was performed with all variables as fixed factors in one model and with each variable separately. The cow was a random variable in the LME model. For the individual cow a LME analysis was performed with number of days postpartum as fixed effect.
The pH value of rumen fluid was correlated with the amount of feed intake and the osmotic pressure. The osmotic pressure was related to amount of feed intake and pH value, and feed intake was correlated with the number of days after calving in a LME analysis with cow as a random variable.
From the individual LME equations of the position of the abomasum as function of day after calving, the intercept, slope and the area under the LME line were related with feed intake and pH value and osmotic pressure of the rumen fluid. The data were statistically analysed with the programs of MS Excel 97® (Microsoft Corporation) and S-PLUS 2000® (MathSoft Inc).
Results One of the 6 pregnant cows was carrying twins; another cow had a torsion of the uterus on the day of calving; one cow had developed bronchopneumonia. The data from all cows were used. None of the cows had retained foetal membranes. The involution of the uterus in all cows was considered normal upon clinical examination.
Feed intake was maximal after five weeks: 21.5 +/- 0.72 kg DM/day (mean +/- S.D.). The average pH value and osmotic pressure of the rumen fluid for the entire 6-week period was 6.55 +/- 0.25 and 230 +/- 31 mmol/kg (mean +/- S.D.), respectively. Feed intake was related to number of days after calving; the further
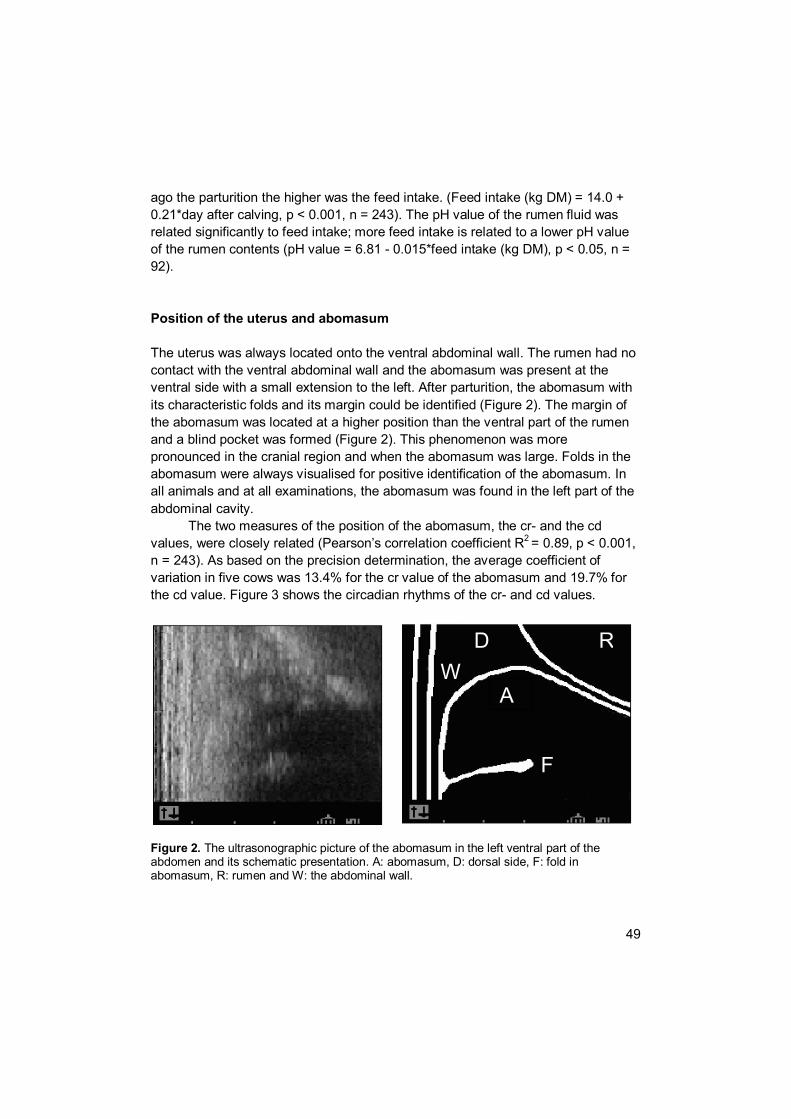
49
ago the parturition the higher was the feed intake. (Feed intake (kg DM) = 14.0 + 0.21*day after calving, p < 0.001, n = 243). The pH value of the rumen fluid was related significantly to feed intake; more feed intake is related to a lower pH value of the rumen contents (pH value = 6.81 - 0.015*feed intake (kg DM), p < 0.05, n = 92).
Position of the uterus and abomasum The uterus was always located onto the ventral abdominal wall. The rumen had no contact with the ventral abdominal wall and the abomasum was present at the ventral side with a small extension to the left. After parturition, the abomasum with its characteristic folds and its margin could be identified (Figure 2). The margin of the abomasum was located at a higher position than the ventral part of the rumen and a blind pocket was formed (Figure 2). This phenomenon was more pronounced in the cranial region and when the abomasum was large. Folds in the abomasum were always visualised for positive identification of the abomasum. In all animals and at all examinations, the abomasum was found in the left part of the abdominal cavity.
The two measures of the position of the abomasum, the cr- and the cd values, were closely related (Pearson’s correlation coefficient R2 = 0.89, p < 0.001, n = 243). As based on the precision determination, the average coefficient of variation in five cows was 13.4% for the cr value of the abomasum and 19.7% for the cd value. Figure 3 shows the circadian rhythms of the cr- and cd values.
Figure 2. The ultrasonographic picture of the abomasum in the left ventral part of the abdomen and its schematic presentation. A: abomasum, D: dorsal side, F: fold in abomasum, R: rumen and W: the abdominal wall.
F
A
RDW
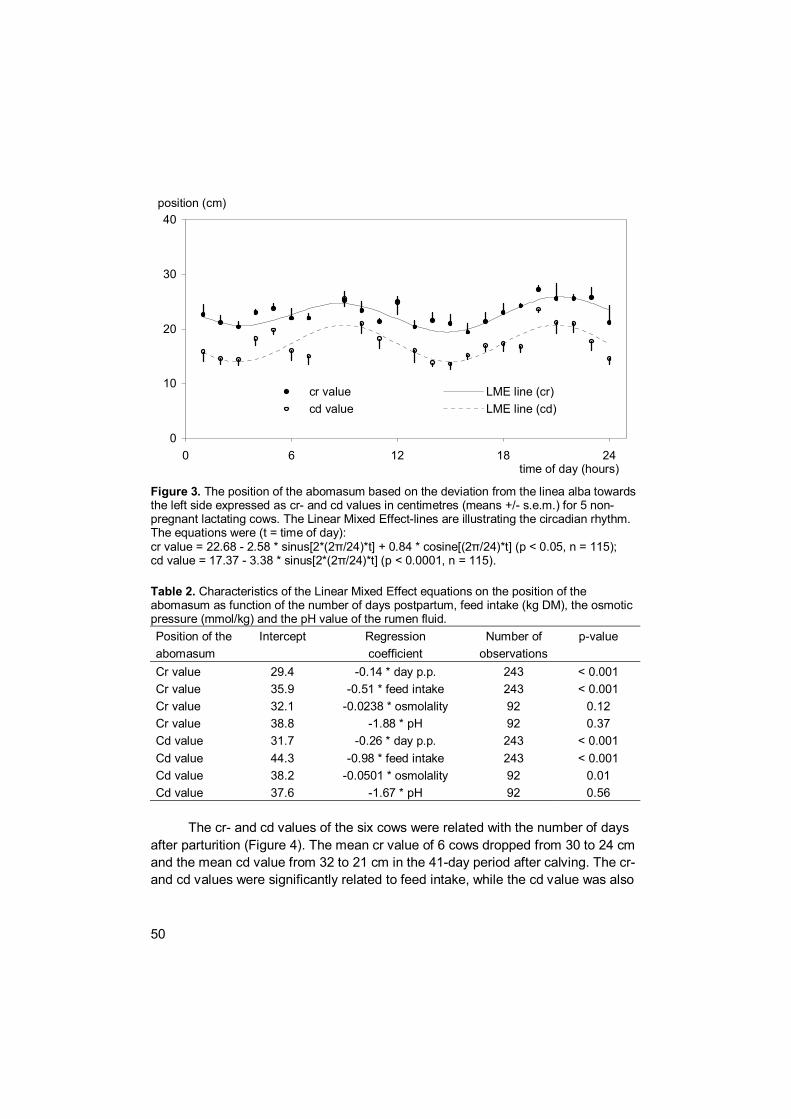
50
0
10
20
30
40
0 6 12 18 24time of day (hours)
position (cm)
cr value LME line (cr)cd value LME line (cd)
Figure 3. The position of the abomasum based on the deviation from the linea alba towards the left side expressed as cr- and cd values in centimetres (means +/- s.e.m.) for 5 non-pregnant lactating cows. The Linear Mixed Effect-lines are illustrating the circadian rhythm. The equations were (t = time of day): cr value = 22.68 - 2.58 * sinus[2*(2π/24)*t] + 0.84 * cosine[(2π/24)*t] (p < 0.05, n = 115); cd value = 17.37 - 3.38 * sinus[2*(2π/24)*t] (p < 0.0001, n = 115).
Table 2. Characteristics of the Linear Mixed Effect equations on the position of the abomasum as function of the number of days postpartum, feed intake (kg DM), the osmotic pressure (mmol/kg) and the pH value of the rumen fluid. Position of the abomasum
Intercept Regression coefficient
Number of observations
p-value
Cr value 29.4 -0.14 * day p.p. 243 < 0.001 Cr value 35.9 -0.51 * feed intake 243 < 0.001 Cr value 32.1 -0.0238 * osmolality 92 0.12 Cr value 38.8 -1.88 * pH 92 0.37 Cd value 31.7 -0.26 * day p.p. 243 < 0.001 Cd value 44.3 -0.98 * feed intake 243 < 0.001 Cd value 38.2 -0.0501 * osmolality 92 0.01 Cd value 37.6 -1.67 * pH 92 0.56
The cr- and cd values of the six cows were related with the number of days
after parturition (Figure 4). The mean cr value of 6 cows dropped from 30 to 24 cm and the mean cd value from 32 to 21 cm in the 41-day period after calving. The cr-and cd values were significantly related to feed intake, while the cd value was also

51
related to the osmotic pressure. All relations were negatively associated with the height of the abomasum (Table 2).
After LME analysis with all explanatory variables, the cr value was only associated with the number of days after calving, as described above. In the complete model the cd value is negatively associated with the number of days after calving, pH value of the rumen fluid and the osmotic pressure of the rumen fluid (cd value = 76.06 - 0.26*day - 5.53*pH - 0.0377*mmol/kg, p < 0.05, n = 98).
There was a large variation between the individual cows as to the relation between the position of the abomasum and the day postpartum; the intercept of the LME line varied between 22.3 and 44.7, while the slope ranged between -0.01 and -0.45. The intercept was related to the average daily feed intake in the first week postpartum. The slope of the LME equations for the cr values was related with the average osmotic pressure of the rumen fluid in the first week postpartum: slope LME line = -1.25 + 0.0051 * osmw1 (R2 = 0.57, p = 0.08, n= 6).
0
10
20
30
40
0 7 14 21 28 35 42day post partum
position (cm)
cr value LME line (cr)
cd value LME line (cd)
Figure 4. The position of the abomasum based on the deviation from the linea alba towards the left side expressed as cr- and cd values in centimetres (mean +/- s.e.m.) for 6 cows in the period 1 to 41 days after calving (dots) and the LME lines. The equations were: cr value = 29.4 - 0.14 * day postpartum (p < 0.0001, n = 243); cd value = 31.7 - 0.26 * day postpartum (p < 0.0001, n = 243).
Discussion
The present study with six Holstein-Friesian cows shows that the abdominal position of the abomasum during pregnancy and after parturition agrees with that
52
described by Dyce et al. (1996), but at parturition the orientation towards the left side was less evident. The position was high immediately after calving and became lower during lactation, which is illustrated in the cr values of two cows at day 1 and day 41 postpartum: 41 respectively 31 and 37 respectively 18 cm. At six weeks after parturition, the cr- and cd values were similar to those reported by Braun et al. (1997) for non-pregnant Brown Swiss cows. The cr- and cd values were lower than to be expected in a case of a clinical displaced abomasum. In such a case one can locate the margin of the abomasum, depending on the size of the cow, up to 90 cm away from the linea alba.
The position of the abomasum had a circadian rhythm, similarly to the findings of Dove et al. (1988). The cows were fed ad lib, but eating and ruminating behaviour could still influence the position of the abomasum. A pocket of the abomasum, the piriform sac of the fundus, was detected (Figure 2) at the left side. These observations are in accordance with those of Dirksen (1962) and Dyce et al. (1996). The pocket was more pronounced when the abomasa were larger. Our findings may explain at least partially the high incidence of clinically DA in the first weeks after parturition (Erb et al., 1984 and Jubb et al., 1991). It is likely that a pronounced lateral orientation of the abomasum predisposes the cow for development of DA.
Flow of rumen fluid into the abomasum can result in production of CO2 and CH4 gasses (Dirksen, 1962). When gas absorption or motility of the abomasum is decreased, the gas is not able to escape from the blind pocket in the abomasum and can be the driving force for developing an abomasal displacement. This phenomenon could explain why the majority of DA cases (80 percent) occur towards the left side (Constable et al., 1992). The size of the blind pocket after calving could determine the development of DA to the left side. Thus, cows with a high position of the abomasum are expected to be at enhanced risk for DA. There was a large variation between the individual cows. In individual cows a high position of the abomasum was negatively associated with feed intake after calving. Feed intake immediately after calving is negatively associated with body condition score during the dry period (Rukkwamsuk et al., 1999). Indeed, epidemiological studies have shown that dry, fat cows are at greater risk for DA after calving than their lean counterparts (Cameron et al., 1998).
The cr- and cd values were negatively related to feed intake: high feed intakes were associated with a low position of the abomasum. This observation can be a result of increased rumen fill: an enlarged rumen caused by high feed intake forces the abomasum downwards. Our observations corroborates earlier work showing that inadequate feed intake is associated with DA (Neal, 1964, Sack et al., 1970, and Svendsen, 1969).
Osmotic pressure and the pH value of the rumen contents were negatively correlated with the cd value. The pH of rumen fluid is determined by the amount of
53
volatile fatty acids (VFA), which in turn determine the osmotic pressure. According to Martens (2000), a very high osmotic pressure of the rumen contents, i.e. more than 400 mmol/kg, can result in a dilatation of the abomasum. If a high position of the abomasum would be the result of an enlargement of the abomasum, then our data would disprove the idea of Martens (2000). This could be due to the fact that extremely high values for osmotic pressure were not seen in this experiment. An explanation for the low values of the osmotic pressure can be the fact that the cows were well adapted to the ration after calving. This will result in less elevated levels of VFA in the rumen fluid, which is reflected in the pH values of the fluid: 6.55 +/- 0.25 (mean +/- S.D.). Contrary to the suggestion of Martens (2000), our data indicate that high osmotic pressure of the rumen fluid is associated with a low position of the abomasum.
Conclusion
This study shows that the position of the abomasum can be measured by a non-invasive method, but the analytical variation is a substantial fraction of the observed, between-cow variation. This limits the use of abomasum position measurements in individual cows. However, on a group mean basis the position of the abomasum in apparently healthy cows may predict the risk for DA. If it does, then research could aim at identifying interventions that favourably modify the position of the abomasum or prevent its changing position.
Acknowledgement The support of Dr. B. Kemp, Department of Animal Husbandry, Wageningen University, is gratefully acknowledged.
References
Braun, U., K. Wild and F. Guscetti. 1997. Ultrasonographic examination of the abomasum of 50 cows. The Veterinary Record 140, 93-98.
Cameron, R. E. B., P. D. Dyk, H. Herdt, J. B. Kaneene, R. Miller, H. F. Bucholtz, J. S. Liesman, M. J. Vandehaar and R. S. Emery. 1998. Dry cow diet, management, and energy balance as risk factors for displaced abomasum in high producing dairy herds. Journal of Dairy Science 81, 132-139.
Centraal Veevoeder Bureau. 1998. Voedernormen landbouwhuidieren en voederwaarde veevoeders, verkorte tabel 1998, CVB-reeks nr.24, august
54
1998 (In Dutch). Constable, P. D., G. Y. Miller, G. F. Hoffsis, B. L. Hull and D. M. Rings. 1992. Risk
factors for abomasal volvulus and left abomasal displacement in cattle. American Journal of Veterinary Research 53, 1184-1192.
Dirksen, G. 1962. Vorbetrachtungen zur Topographie, Anatomie und Physiologie der Wiederkäuermägen. In Die Erweiterung, Verlagerung und Drehung des Lebmages beim Rind, Berlin and Hamburg, Verlag Paul Parey.
Dove, H., J. A. Milne, A. M. Sibbald, C. S. Lamb and H. A. McCormack .1988. Circadian variation in abomasal digesta flow in grazing ewes during lactation. British Journal of Nutrition 60, 653-668.
Dyce, K. M., W. O. Sack and C. J. G. Wensing. 1996. The abdomen of the ruminants. In: Textbook of Veterinary Anatomy, second edition. Philadelphia, W.B. Saunders Company.
Erb, H. N., R. D. Smith, R. B. Hillman, P. A. Powers, M. C. Smith, M. E. White and E. G. Pearson. 1984. Rates of diagnosis of six diseases of Holstein cows during 15-day and 21-day intervals. American Journal of Veterinary Research 45, 333-335.
Goff, J. P. and R. L. Horst. 1997. Physiological changes at parturition and their relationship to metabolic disorders. Journal of Dairy Science 80, 1260-1268.
Jubb, T. F., J. Malmo, G. M. Davis and A. S. Vawser. 1991. Left-side displacement of the abomasum in dairy cows at pasture. Australian Veterinary Journal 68, 140-142.
Martens, H. 2000. Relations between feeding, physiology of the forestomacs and pathogenesis of abomasal displacement. In: Ätiologie, Pathogenese, Diagnostik, Prognose, Therapie und Prophylaxe der Dislocatio abomasi, Proceedings Internationaler Workshop. Leipzig 14 Oktober 1998. Editor: M. Fürll, Leipzig, Leipziger Universitätsverlag.
Neal, P. A. 1964. Some clinical observations on the etiology of displacement of the abomasum in the dairy cow. Nordisk Veterinaer Medicin 16, Supplement I, 361-366.
Rukkwamsuk, T., T. A. M. Kruip, G. A. L. Meijer and T. Wensing. 1999. Hepatic fatty acid composition in periparturient dairy cows with fatty liver induced by intake of a high energy diet in the dry period. Journal of Dairy Science 82, 280-287.
Sack, W. O. and P. Svendsen. 1970. Size and position of the abomasum in ten cows fed high-roughage or high-concentrate rations. American Journal of Veterinary Research 31, 1540-1543.
Svendsen, P. 1969. Etiology and pathogenesis of abomasal displacement in cattle. Nordisk Veterinaer Medicin 21, Supplement I, 1-60.

55
Chapter Five
Changes in feed Intake, pH and osmolality of rumen fluid, and position of the abomasum, prior to diet-induced
left-displaced abomasum in dairy cows
S. C. L. Van Winden*, C. R. Brattinga#, K. E. Müller*, J. Th. Schonewille†, J. P. T. M. Noordhuizen* and A. C. Beynen†
*Department of Farm Animal Health, Faculty of Veterinary Medicine, Utrecht University, Yalelaan 7, 3584 CL, Utrecht, The Netherlands
†Department of Nutrition, Faculty of Veterinary Medicine, Utrecht University, Yalelaan 16, 3584 CM, Utrecht, The Netherlands
#Department of Animal Sciences, Animal Husbandry Group, Wageningen University, PO Box 338, 6700 AH Wageningen, The Netherlands
Submitted for publication
56
Summary In order to study the possible role of selected variables in the development of displacement of the abomasum (DA), the condition was experimentally induced. During the last 6 weeks of the dry period, eight Holstein-Friesian cows were fed a restricted amount of grass silage; after calving, a mixture of maize silage and concentrates was offered in a designed feeding regimen. In the first month after calving, the postpartum cows were monitored for the following variables: feed intake, milk production, the position of the abomasum, and pH and osmotic pressure of rumen contents. In five out of the eight cows a clinical DA to the left occurred between day four and 21 after calving without diseases prior to DA. The DA had a temporary character, its duration varying between five and 36 consecutive hours, and it reoccurred the next day. This finding resulted in a division of the patients into two categories: floaters (n=2) and DA-cows (n=3).
Comparison of the three groups of animals showed that in the postpartum period DA-cows had, prior to DA development, a higher position of the abomasum (+7.9 cm and +4.3 cm), higher osmotic pressure of the rumen contents (+19.2 mmol/kg), and a lower roughage-to-concentrates ratio of the ingested feed (-0.87), compared with cows that did not develop clinical signs of DA (n=3). There were no significant differences in the variables between floaters and healthy cows. Although the number of cows studied is limited, this study does suggest that there are measurable pre-disease changes in cows that develop DA. Knowledge of these changes may contribute to the formulation of measures to prevent DA in dairy cows. Abbreviation key: DA = displaced abomasum, DM = dry matter, NEB = negative energy balance, NEL = net energy lactation
57
Introduction A displacement of the abomasum (DA) in dairy cattle, which usually occurs to the left side, is most frequently seen during the first month after calving. Susceptible breeds are Jersey, Guernsey and Holstein-Friesian cows (Constable et al., 1992, Stengärde and Perhson, 2002). A high level of rapidly fermentable components in the ration supplied after calving (Martens, 2000), a small roughage mat in the rumen (Goff and Horst, 1997), energy dense feed provided before calving (Coppock, 1974), and low feed intake after calving are nutritional factors associated with the occurrence of DA (Dirksen, 1962, Østergaard and Gröhn, 2000). Conditions frequently occurring in the high-producing postpartum cow, such as a severe negative energy balance (NEB), hypocalcaemia and infectious diseases, have been shown to form risk factors for the development of DA (Heuer et al., 1999, Massey et al., 1993). The estimated average incidence of DA is 5 % in postpartum dairy cows, but the incidence range between farms is from zero to 20 percent (Dawson et al., 1992, Jacobsen, 1995, and Kane, 1983).
The goal of the present experiment was to induce DA, and to evaluate changes in feed intake, the roughage-to-concentrate ratio of voluntarily ingested feed, the position of the abomasum, and pH and osmotic pressure of the rumen contents prior to the development of DA. It was anticipated that the information thus obtained would provide clues as to the prevention of DA. In order to meet our objective, we subjected dry pregnant cows to a feeding regimen that was modified from the one that was used by Coppock et al. (1972); they observed DA in 10 out of 32 postpartum cows. The variables that we have chosen were based on earlier reports that showed depressed feed intake in cows with overt DA, a lowered roughage-to-concentrate ratio of voluntarily ingested feed, a decline in pH of rumen fluid and an increased osmotic pressure of rumen fluid (Østergaard and Gröhn, 2000, Martens, 2000, Shaver, 1997). However, it was not known to what extent the variables change, if any, prior to the development of clinical DA. We have recently shown that the position of the abomasum changes after calving in apparently healthy cows (Van Winden et al., 2002), and it was anticipated that larger changes would occur in those cows that eventually develop DA. All 8 cows in this trial were subjected to the potentially DA-inducing feeding regimen and we evaluated differences in the selected variables between cows that did or did not develop a clinical DA.

58
Animals, materials and methods Animals and nutrition The study took place under the supervision and with approval of the Ethical Review Committee of Animal Experimentation of the Faculty of Veterinary Medicine, Utrecht University in the Netherlands. Eight Holstein-Friesian multiparous cows, weighing between 612 and 723 kg at six weeks prior to calving, were included in the experiment. The cows were housed on stands with sawdust bedding. During the last six weeks of the dry period, the cows were individually fed according to the Dutch recommendations for energy requirements (Centraal Veevoeder Bureau, 1998), i.e. they received 53 MJ NEL/day. The ration consisted of 7.7 kg dry matter (kg DM) of grass silage which was given once daily at 10:00 a.m.
Immediately after calving, 5 kg DM of a mixture of concentrates was offered during a 2-hour period. Then, after having removed and weighed the leftovers of the concentrates, 10 kg DM of maize silage was supplied to the cows to which they had access until 8:00 a.m. the next day. An increasing amount of concentrates, with a maximum of 13.5 kg DM/ day, was fed between 10:00 a.m. and 1:00 p.m. Table 1. Amounts of the maize silage and concentrates supplied per cow during the postpartum (p.p.) period (kg DM).
Days p.p. Rape seed1 Soybean meal2 Sugar beet pulp3 Maize silage4
1 2 3 4 5 6 7 8 9
10-11 12-15 16-28
0.9 0.9 0.9 0.9 0.9 0.9 0.9 0.9 0.9 0.9 0.9 0.9
3.2 4.5 4.5 4.5 4.5 4.5 4.5 4.5 4.5 4.5 4.5 4.5
0.9 1.8 2.7 3.6 4.5 5.4 6.3 7.2 8.1 8.1 8.1 8.1
10 10 10 10 10 10
3.15 3.15 15 15
3.96 15
1: Rape seed, extracted, offered from 10:00 a.m. till 1:00 p.m., 2: Soybean meal, extracted, 39% rumen undegradable protein, offered from 10:00 a.m. till 1:00 p.m., 3: Sugar beet pulp, dehydrated, offered from 10:00 a.m. till 1:00 p.m., 4: Maize silage was offered from 1:00 p.m. till 8:00 a.m. Analyzed composition of the maize silage: dry matter (DM, %): 33.5, crude protein (g/kg DM): 67, crude fiber (g/kg DM): 210 and crude ash (g/kg DM): 39, 5: 50% of the individually measured dry matter intake (DMI) of maize on day 6 was supplied; the reported amount is an average, 6: 50% of the individually measured DMI of maize on day 11 was supplied; the reported amount is an average.

59
during the following days. In the period between 1:00 p.m. and 8:00 a.m. maize silage was offered for ad-lib consumption. Two hours before the next supply of concentrates, at 10:00 p.m., the animals were withheld from feed.
The leftovers of both the mixture of concentrates and the maize silage were weighed and recorded. Daily feed intake on a product basis was calculated. The feeding regimen is presented in Table 1. The cows were milked at 12:00 a.m. and 12:00 p.m. Individual milk production was recorded for each milking. Clinical examination Each day at 8:00 a.m., 11:00 a.m., 1:00 p.m., 3:00 p.m. and 5:00 p.m. the cows were clinically examined for the presence of a displacement of the abomasum to the left or to the right. When the abomasum was found to be displaced at 5:00 p.m., the cow was re-examined at 11:00 p.m. Examination was performed by percussion auscultation in an attempt to evoke the characteristic “steelband” sound at the left or at the right side of the cow. For each animal that was suspected of having DA, the diagnosis was confirmed via an ultrasonographic survey (Winter and Hofmann, 1996).
A visual check for mastitis was done on the first milk of each milking period. The involution of the uterus was checked each week by rectal palpation and vaginal discharge was used as criterion to diagnose an endometritis. When a cow was suspected of having milk fever on the basis of clinical symptoms, a blood sample was collected for determination of blood calcium concentration. Position of the abomasum The daily position of the abomasum was determined using the ultrasound technique as described by Braun et al. (1997). The left, ventral abdominal wall was clipped and smeared with transducer gel. A Pie Medical 100 device (Pie Medical BV, Maastricht, The Netherlands) with a 5 MHz transducer was used to perform a transabdominal ultrasonographic examination between 4:00 and 5:00 p.m. each day. The extension of the abomasum from the ventral midline to the left in the cranial (CR) and the caudal region (CD) was measured. Also, the length of abomasum presented in the ventral midline (AL) was measured in cm. Details of the measurements have been described elsewhere (Braun et al., 1997; Van Winden et al., 2002).
60
Measurements The daily intake of both maize silage and concentrates was measured for each cow. The combined intake of silage and concentrates was used to calculate the total daily DM intake per cow. The roughage-to-concentrate ratio of DMI is related to the occurrence of DA (Shaver, 1997) and therefore we calculated this ratio.
Rumen fluid samples were obtained using a metal oesophageal probe after Sørensen-Schambye daily at 1:00 p.m. Since saliva contamination of the samples could occur, only easily obtained samples were used, diminishing the effects of the contamination. Immediately after collection of each sample the pH value of the rumen juice was measured in duplicate using a calibrated pH meter (Radiometer 51, Radiometer, Copenhagen, Denmark). After centrifuging the rumen fluid at 10.000 r/min, the supernatant was stored at -20 oC for up to 6 weeks. When all rumen fluid samples were collected, these samples were thawed. Then the osmotic pressure was determined in duplicate with a calibrated osmometer (Osmomat 030, Gonotec GmbH, Berlin, Germany) as based on a delayed freeze point measurement; all samples were analysed on the same day.
Statistical analysis The values for daily milk production, DM intake, roughage-to-concentrate ratio, the position of the abomasum (CR, CD and AL) and pH value and osmotic pressure of the rumen fluid were entered into a spreadsheet program (MS Excel 97®, Microsoft Corporation, Redmond, USA). For DA cows, only data collected prior to initial DA were used in the analysis.
Cows that developed clinical signs of DA were divided into two categories: floaters and DA cows. Floaters were defined as cows that had a clinically displaced abomasum for one day or two subsequent days and no re-occurrence thereafter, whereas DA cows had more than 2 subsequent days with clinical DA. This resulted in three DA categories: floaters (n=2), DA cows (n=3) and healthy cows (n=3).
The variables were analysed with Linear Mixed Effects method, which takes dependency of the data into account and is suitable to statistically analyse repeated measurements (S-PLUS 2000®, MathSoft Inc., Cambridge, United Kingdom). This method uses maximum likelihood techniques for estimating the fit of the model. The identity of the cow was used as random effect. (Auto)correlation structures were tested and selected as based on Likelihood Ratio test. The normality of the residuals and the random effects in the final model were visually checked with Q-Q plots and both followed more or less a straight line, which shows that the data are normally distributed. Significance of the difference in the variables between the different DA categories was analysed. A backward stepwise selection
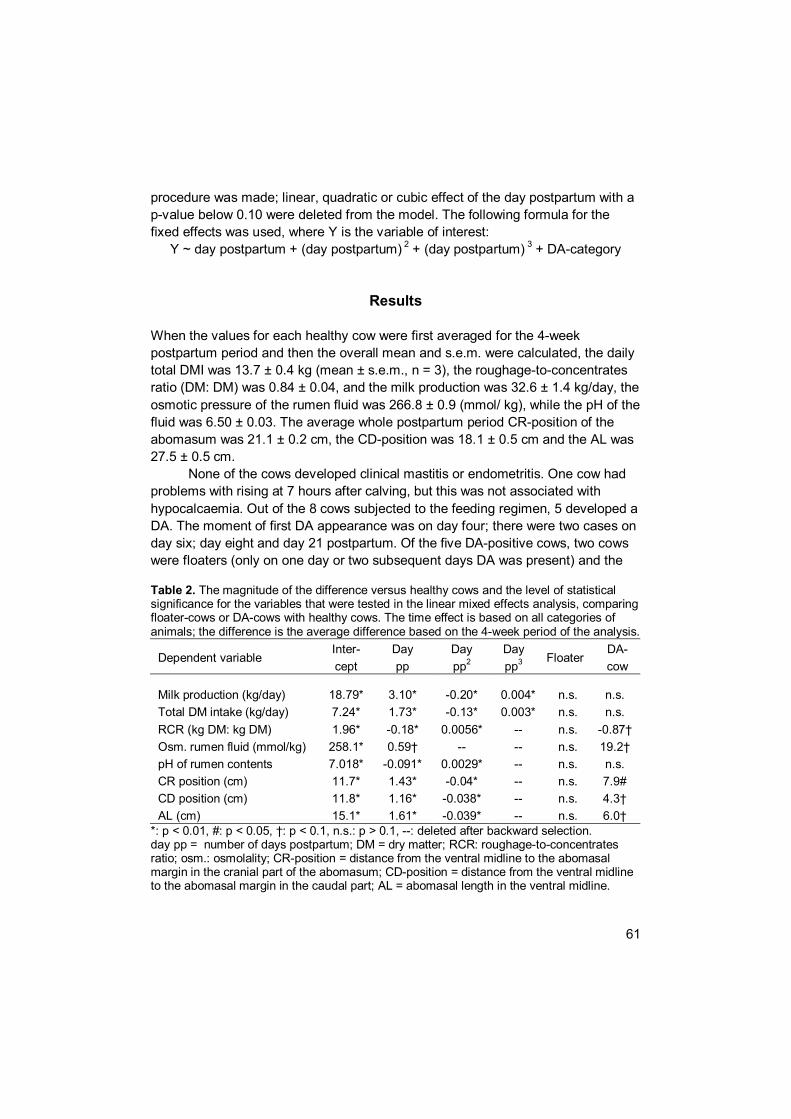
61
procedure was made; linear, quadratic or cubic effect of the day postpartum with a p-value below 0.10 were deleted from the model. The following formula for the fixed effects was used, where Y is the variable of interest:
Y ~ day postpartum + (day postpartum) 2 + (day postpartum) 3 + DA-category
Results When the values for each healthy cow were first averaged for the 4-week postpartum period and then the overall mean and s.e.m. were calculated, the daily total DMI was 13.7 ± 0.4 kg (mean ± s.e.m., n = 3), the roughage-to-concentrates ratio (DM: DM) was 0.84 ± 0.04, and the milk production was 32.6 ± 1.4 kg/day, the osmotic pressure of the rumen fluid was 266.8 ± 0.9 (mmol/ kg), while the pH of the fluid was 6.50 ± 0.03. The average whole postpartum period CR-position of the abomasum was 21.1 ± 0.2 cm, the CD-position was 18.1 ± 0.5 cm and the AL was 27.5 ± 0.5 cm.
None of the cows developed clinical mastitis or endometritis. One cow had problems with rising at 7 hours after calving, but this was not associated with hypocalcaemia. Out of the 8 cows subjected to the feeding regimen, 5 developed a DA. The moment of first DA appearance was on day four; there were two cases on day six; day eight and day 21 postpartum. Of the five DA-positive cows, two cows were floaters (only on one day or two subsequent days DA was present) and the Table 2. The magnitude of the difference versus healthy cows and the level of statistical significance for the variables that were tested in the linear mixed effects analysis, comparing floater-cows or DA-cows with healthy cows. The time effect is based on all categories of animals; the difference is the average difference based on the 4-week period of the analysis.
Dependent variable Inter-cept
Day pp
Day pp2
Day pp3
Floater DA-cow
Milk production (kg/day) 18.79* 3.10* -0.20* 0.004* n.s. n.s. Total DM intake (kg/day) 7.24* 1.73* -0.13* 0.003* n.s. n.s. RCR (kg DM: kg DM) 1.96* -0.18* 0.0056* -- n.s. -0.87† Osm. rumen fluid (mmol/kg) 258.1* 0.59† -- -- n.s. 19.2† pH of rumen contents 7.018* -0.091* 0.0029* -- n.s. n.s. CR position (cm) 11.7* 1.43* -0.04* -- n.s. 7.9# CD position (cm) 11.8* 1.16* -0.038* -- n.s. 4.3† AL (cm) 15.1* 1.61* -0.039* -- n.s. 6.0†
*: p < 0.01, #: p < 0.05, †: p < 0.1, n.s.: p > 0.1, --: deleted after backward selection. day pp = number of days postpartum; DM = dry matter; RCR: roughage-to-concentrates ratio; osm.: osmolality; CR-position = distance from the ventral midline to the abomasal margin in the cranial part of the abomasum; CD-position = distance from the ventral midline to the abomasal margin in the caudal part; AL = abomasal length in the ventral midline.

62
other three cows had DA for 3 or more days. All cases of clinical DA were confirmed by ultrasonographic examination. The DA in each case had a recurrent character, i.e. it was clinically present in the morning, disappeared in the afternoon, and was present again on the next day.
In Table 2, the time effects are presented as their linear, quadratic and cubic contributions to the variables. In addition to the time effects, the comparisons between the cows that did not develop DA (the reference category) and either DA cows or floaters, are reported in the Table. There were no significant differences between healthy cows and floaters, whereas DA cows differed from healthy cows as to various variables. First, the roughage-to-concentrates ratio on average was 0.87 lower in DA cows, indicating that they ate more concentrates (Figure 1). Secondly, the abomasum was present in a higher position at the left side prior to DA; the abomasal margin was in the cranial region 7.9 cm higher in DA cows than in the reference cows. In the caudal region the position was 4.3 cm higher and the length of the abomasum in the ventral midline was 6.0 cm larger in the DA cows (Figures 2, 3 and 4). The time effect of the CR and CD positions differ from those reported earlier (Van Winden et al., 2002), which could relate to the specific feeding regimen in this study. Finally, the osmotic pressure of the rumen contents was on average 19.2 mmol/kg higher in cows that developed DA, when compared with their healthy counterparts (Figure 5).
Figure 1. The roughage-to-concentrates ratio (RCR, kg DM: kg DM) of the ingested feed n postpartum (pp) cows as a function of days postpartum. DA-cows (◊) had on average a 0.87 lower roughage-to-concentrates ratio (p = 0.07), whereas floaters (□) were similar to healthy cows (■). The line represents the regression line linear and quadratic for healthy cows (Table 2).
0123456789
10
0 7 14 21 28 day pp
RC
R (k
g D
M:k
gDM
)
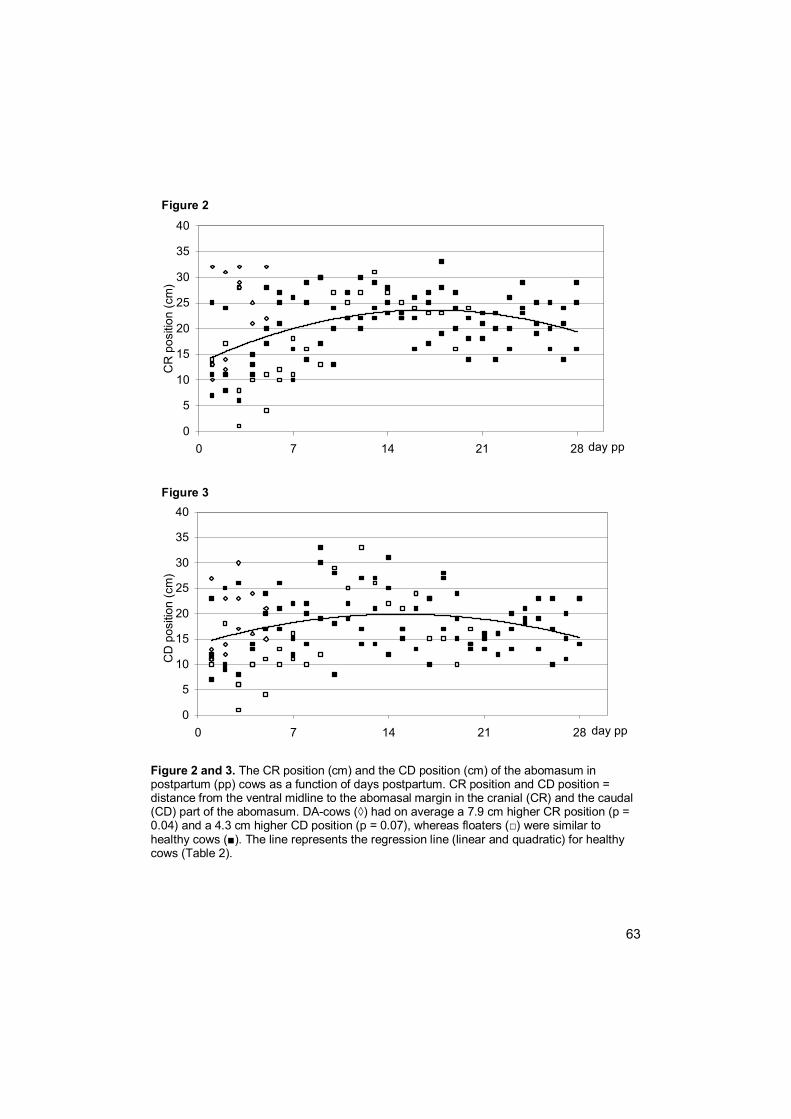
63
Figure 2 and 3. The CR position (cm) and the CD position (cm) of the abomasum in postpartum (pp) cows as a function of days postpartum. CR position and CD position = distance from the ventral midline to the abomasal margin in the cranial (CR) and the caudal (CD) part of the abomasum. DA-cows (◊) had on average a 7.9 cm higher CR position (p = 0.04) and a 4.3 cm higher CD position (p = 0.07), whereas floaters (□) were similar to healthy cows (■). The line represents the regression line (linear and quadratic) for healthy cows (Table 2).
0
5
10
15
20
25
30
35
40
0 7 14 21 28 day pp
CD
pos
ition
(cm
)
Figure 3
0
5
10
15
20
25
30
35
40
0 7 14 21 28 day pp
CR
pos
ition
(cm
)
Figure 2

64
Figure 4.and 5 The length in the ventral midline (cm) of the abomasum and the osmolality of the rumen contents (mmol/kg) in postpartum (pp) cows as a function of days postpartum. DA-cows (◊) had on average a 6.0 cm longer abomasum (p = 0.08) and a19.2 mmol/kg higher osmolality of the rumen contents (p = 0.08), whereas floaters (□) were similar to healthy cows (■). The line represents the regression line (linear and quadratic) for healthy cows (Table 2).
05
10
1520253035404550
0 7 14 21 28 day pp
Abom
asal
leng
th (c
m)
Figure 4
Figure 5
150
175
200
225
250
275
300
325
350
0 7 14 21 28day pp
Osm
olal
ity (m
mol
/kg)
65
Discussion The results show that it is indeed possible to induce displacement of the abomasum in dairy cows, which is in accordance with the findings of Coppock et al. (1972). They found that cows receiving high amounts of concentrates not only had a reduced feed intake at the end of the dry period, but also developed DA more frequently than did cows receiving less concentrate. In our experiment, a restricted amount of energy dense grass silage was supplied during the dry period, imitating the feed intake of the cows that developed DA in the experiment of Coppock et al. (1972). We fed concentrates and maize silage after calving according to a specified regimen and found that 5 out of the 8 cows developed clinical DA, which was confirmed ultrasonographically. The postpartum feeding regimen used in this study was based on epidemiological observations (Shaver1997, Østergaard and Gröhn, 2000) and hypotheses (Martens, 2000, Van Winden et al., 2002) as to possible mechanisms underlying the development of DA.
In the present study there were no significant differences between cows that remained healthy and the floater cows. The floaters had a clinically displaced abomasum, but apparently experienced no negative effects of it prior to DA. In the floaters, the DA was present only for a short period, also indicating a minor clinical event. It should be stressed however, that the present study involved only two floaters so that interpretation of the data and extrapolation to dairy practice is fraught with uncertainty.
Regarding the total feed intake, no significant differences were detected between the three different groups. Østergaard and Gröhn (2000) found that cows ultimately developing DA have a reduced feed intake prior to DA. This study does not support that finding, which may be due to the low number of cows. This probably also holds for milk production, as we found no differences between the groups, whereas Lacasse et al. (1993) reported a decrease in milk production prior to DA. The roughage-to-concentrates ratio, however, was found to be significantly different between the three DA-cows and three healthy cows. The ratio was lower in the DA-cows prior to the development of DA, corroborating previous findings (Coppock et al., 1972, Dirksen, 1962, Shaver, 1997). Consumption of a relatively high amount of concentrates results in an increased production of volatile fatty acids in the rumen, and consequently, in an increased osmotic pressure of the rumen contents (Martens, 2000). In the DA cows an increased osmolality of the rumen contents was noticed, supporting the hypothesis of Martens (2000), who suggested that increased osmotic pressure results in an extension of the abomasal wall. If the wall is extended too much a paralysis could occur with DA as a result (Geishauser, 1998). The current finding that the abomasum was present at a higher position at the left side of the rumen prior to clinical DA, is in accordance

66
with our earlier hypothesis (Van Winden et al., 2002). However, it remains uncertain, whether this altered position is also due to an extension of the abomasum.
The changes seen in DA cows prior to DA, such as a low roughage-to-concentrates ratio, high osmotic pressure of rumen contents and a high position of the abomasum, are probably interrelated. The question remains, which of the variables can be considered as a primary causal factor in the development of DA. Further research with a larger number of cows and with a broader spectrum of variables can provide more insight into approaches of prediction and, ultimately, prevention of the occurrence of DA. The testing of animals in clinical settings and under field conditions, as well as the use of an induction model of DA, can be complementary approaches.
References Braun, U., K. Wild and F. Guscetti. 1997. Ultrasonographic examination of the
abomasum of 50 cows. The Veterinary Record 140, 93-98. Constable, P. D., G. Y. Miller, G. F. Hoffsis, B. L. Hull and D. M. Rings. 1992. Risk
factors for abomasal volvulus and left abomasal displacement in cattle. American Journal Veterinary Research 53, 1184-1192.
Coppock, C. E., C. H. Noller, S. A. Wolfe, C. J. Callahan and J. S. Baker. 1972. Effect of forage-concentrate ratio in complete feeds fed ad libitum on feed intake prepartum and the occurrence of abomasal displacement in dairy cows. Journal of Dairy Science 55, 783-789.
Coppock, C. E. 1974. Displaced abomasum in dairy cattle: etiological factors. Journal of Dairy Science 57, 926-933.
Centraal Veevoeder Bureau. Voedernormen landbouwhuisdieren en voederwaarde veevoeders, verkorte tabel 1998, CVB-reeks nr.24, august 1998 (In Dutch).
Dawson, L. J., E. P. Aalseth, L. E. Rice and G. D. Adams. 1992. Influence of fiber form in a complete mixed ration on incidence of left displacement abomasum in postpartum dairy cows. Journal of the American Veterinary Medical Association 200, 1989-1992.
Dirksen, G. 1962. Die Erweiterung, Verlagerung und Drehung des Lebmages beim Rind, Berlin and Hamburg, Habillitationsschrift, Verlag Paul Parey. pp121
Geishauser, T., D. Reiche and M. Schemann. 1998. In vitro motility disorders associated with displaced abomasum in dairy cows. Neurogastroenterology and Motility 10, 395-401.
Goff, J. P. and R. L. Horst. 1997. Physiological changes at parturition and their relationship to metabolic disorders Journal of Dairy Science 80, 1260-1268.
Heuer, C., Y. H. Schukken and P. Dobbelaar. 1999. Postpartum body condition
67
score and results from the first test day milk as predictors of disease, fertility, yield and culling on commercial dairy herds. Journal of Dairy Science 82, 295-304.
Jacobsen, K. L. 1995. Displaced abomasa and thin cows in a component-fed dairy herd. The compendium. Food Animal S21-S27.
Kane, P. 1983. Displaced abomasums on a dairy farm in Hong Kong. The Veterinary Record 113, 96.
Lacasse, P., E. Block, L. A. Guilbault and D. Petitclerc. 1993. Effect of plane nutrition of dairy heifers before and during gestation on milk production, reproduction, and health. Journal of Dairy Science 76, 3420-3427.
Martens, H. 2000. Relations between feeding, physiology of the forestomacs and pathogenesis of abomasal displacement. In: Ätiologie, Pathogenese, Diagnostik, Prognose, Therapie und Prophylaxe der Dislocatio abomasi, Proceedings Internationaler Workshop. Leipzig 14 Oktober 1998. Editor: Fürll, M., Leipzig, Leipziger Universitätsverlag.
Massey, C. D., C. Wang, G. A. Donovan and D. K. Beede. 1993. Hypocalcemia at parturition as a risk factor for left displacement of the abomasum in dairy cows. Journal of the American Veterinary Medical Association 203, 852-853.
Østergaard, S. and Y. T. Gröhn. 2000. Concentrate feeding, dry-matter intake, and metabolic disorders in Danish dairy cows. Livestock Production Science 65, 107-118.
Shaver, R. D. 1997. Nutritional risk factors in the etiology of left displaced abomasum in dairy cows: a review. Journal of Dairy Science 80, 2449-2453.
Stengärde, L. U. and B. G. Pehrson. 2002. Effects of management, feeding, and treatment on clinical and biochmical variables in cattle with displaced abomasum. American Journal of Veterinary Research 63, 137-142.
Van Winden, S. C. L., C. R. Brattinga, K. E. Müller, J. P. T. M. Noordhuizen and A. C. Beynen. 2002. The position of the abomasum in dairy cows during the first six weeks after calving. The Veterinary Record Accepted for publication.
Winter, T. and W. Hofmann. 1996. Die Sonographie als Hilfsmittel bei der Diagnose von Labmagenverlagerungen. Tierärztlicher Praxis 24, 243-247.

68

69
Chapter Six
Feed intake, milk yield, and metabolic parameters prior to left displaced abomasum in dairy cows
S. C. L. Van Winden*, R. Jorritsma*, K. E. Müller* and J. P. T. M. Noordhuizen*
*Department of Farm Animal Health, Faculty of Veterinary Medicine, Utrecht University, Yalelaan 7, 3584 CL, Utrecht, The Netherlands
Journal of Dairy Science Accepted for publication
70
Summary Left-displaced abomasum (LDA) is strong associated with the negative energy balance (NEB), which dairy cows experience in the postpartum period. In order to study changes prior to LDA in cows suffering from sever NEB, fatty liver was induced in 16 cows. Four out of 16 cows developed LDA. Compared to cows not developing LDA, LDA-cows had a significantly lower feed intake and milk production prior to clinical diagnosis of LDA. In the 10-day period preceding clinical diagnosis of LDA, blood concentrations of calcium, glucose, and insulin were significantly lower while blood levels of non-esterified fatty acids, and beta-hydroxybutyrate, as well as aspartate aminotransferase activities were significantly elevated compared to cows not developing LDA. However, it remains questionable whether the changes in metabolic parameters indeed preceded dysfunction of the abomasum, and whether there is a causal association between these parameters and LDA. Abbreviation key: (L)DA = (left-)displaced abomasum, DM = dry matter, NEB = negative energy balance, NEL = net energy lactation
71
Introduction Left-displaced abomasum (LDA) is a disorder that occurs mainly in high producing post-partum dairy cows (Geishauser, 1995). The economic consequences of LDA are becoming more important as the incidence rate has been increasing to 5% of postpartum dairy cows (Geishasuer et al., 2000). Normally, the abomasum contains fluid and is positioned in the ventral part of the abdomen. In postpartum cows the abomasum may shift to the left without causing clinical signs (Van Winden et al., 2002b). The LDA can be clinically detected if gas is present in the abomasum resulting in a tympanic, resonant, high tone “ping” (Breukink and Kroneman, 1963). It is possible that the clinically present LDA resolves spontaneously; this LDA is in the veterinary field described as “floater”. In this paper the persisting clinical LDA is referred to as LDA.
The early postpartum period is considered to be the major risk period, because hypocalcemia, (endo)metritis, negative energy balance (NEB), as well as nutritional factors play a central role in the pathogenesis of LDA (Shaver, 1997). Dairy cows experience a negative energy balance (NEB), because the drain of energy for milk production exceeds the energy uptake from the ingested feedstuffs (Herdt, 2000). Metabolic correlates of this NEB are hypoglycaemia, ketonemia, high non-esterified fatty acid (NEFA) blood concentrations, and increased accumulation of triacylglycerol (TAG) in the liver (Herdt, 2000). The proportion of TAG in the liver can exceed 150 mg/g liver tissue. Fatty liver in cattle has been shown to be associated with an increased incidence of metabolic disorders (Heuer 2000, Reid and Roberts, 1982, and Rukkwamsuk, 1999). In addition, prolonged endotoxinemia resulting from bacterial infections can be present in cows with fatty liver as a result of insufficient clearance (Hill et al., 1985, and Ohtsuka et al., 2001). Various metabolic aberrations and a severe NEB as such have been reported to be associated with the development of displacement of the abomasum (Geishauser, 1995, and Muylle et al., 1990). For example, Heuer (2000) reports that 53% of the LDA-cases are related to effects of NEB prior to LDA. Geishauser et al. (2000) report that beta-hydroxybutyrate (BHBA) and aspartate aminotransferase (ASAT) activity in the blood, both parameters associated with NEB of postpartum cows, may be used to predict the development of LDA. However, since the sensitivity (Se) and specificity (Sp) of predicting a subsequent LDA in the second week after calving are low (BHBA >1.0 mmol/l: Se = 0.64 and Sp = 0.69, ASAT >100 U/l: Se = 0.79 and Sp = 0.69), not all cows undergoing NEB will develop LDA (Geishauser et al., 2000).
In order to study changes in metabolism prior to LDA in cows suffering from sever NEB, fatty liver was induced in 16 cows. Four out of 16 cows developed LDA. LDA cows were matched, based on parity and fatty contents of the liver tissue, with cows not developing LDA. A retrospective analysis is performed on
72
metabolic parameters in order to detect differences between the two groups.
Animals, materials and methods Animals and nutrition The study took place under the supervision and with approval of the Ethical Review Committee of Animal Experimentation of the Faculty of Veterinary Medicine, Utrecht University in the Netherlands. Sixteen Holstein-Friesian cows of parity 3 to 7 were included in the experiment starting at six weeks before calving. The cows were housed on stands with sawdust bedding. The animals had free access to tap water throughout the experiment. All animals received a total mixed ration (TMR) during the entire experimental period; the composition of the TMR is given in Table 1 and contained 6.42 MJ NEL/ kg dry matter. During the dry period, six cows were individually fed according to the Dutch recommendations for energy requirements (Centraal Veevoeder Bureau, 1998), i.e. they received each 53 MJ NEL/day. After parturition the cows were fed ad libitum TMR. Ten other cows were fed the same TMR ad libitum in the dry period. After calving, these cows were fasted for eight hours and thereafter they received each 22 kg TMR (10 kg of dry matter, DM), being 64.2 MJ NEL/day. Starting from the sixth day of lactation, all cows received TMR ad libitum. Feed intake and milk production were recorded daily. The body weight of the cows at the beginning of the experiment was 730 ± 24 kg and prior to calving 775 ± 24 kg (mean ± s.e.m.).
Cows that were showing sudden loss of appetite or a decreased milk production during the experimental period were clinically examined. Based on a tympanic, resonant, high tone “ping” at the left abdominal wall, LDA was clinically diagnosed, and was confirmed by right flank laparotomy. After correcting the Table 1. Composition of the total mixed ration (TMR, dry matter (DM): 455 g/kg, containing 6.42 MJ NEL/ kg DM) fed throughout the experiment.
Component TMR
composition (%, DM basis)
Crude Protein
(g/kg DM)
Crude Fiber
(g/kg DM)
Crude Ash
(g/kg DM) Maize silage1 52 73 213 179 Rape seed meal2 8 343 114 - Soybean meal3 17 467 37 - Sugar beet pulp, extracted 21 91 179 - Minerals 2 N.D. N.D. N.D.
1 Other characteristics of maize silage per kg DM: 335 g starch, 422 g NDF, 228 g ADF, 25 g ADL. 2 DM = 877 g/kg. 3 DM = 870 g/kg. DM = 905 g/kg. N.D. = not determined.
73
position of the abomasum the omentum major was fixated in the wound during closure of the abdomen (Trent, 1990). Sampling procedure and laboratory analyses Blood was collected from the jugular vein daily at 7.00h and 10.00h during the first 22 days postpartum and subsequently on days 24, 26, 28, and 31 of lactation. Additionally, blood was collected into appropriate vacuum tubes at 12.00h, 22.00h, and 24.00h on day 1 to 7, 9, 11, 12, 15, and 21 after calving. The values of multiple samples that were collected on one day were averaged. Percutaneous liver biopsy samples were taken in the 11th intercostal space during the second week of lactation (Van den Top et al., 1995). Immediately after sampling, connective tissue and blood clots were disposed of and the samples were weighed, homogenised and stored at -20 oC. After thawing the samples, the amount of TAG was determined in liver tissues using a commercial test kit (kit number 337-A; Sigma Chemical Co., St. Louis, MO). In order to make it possible to match cows based on fat contents in the liver, cows were categorised as moderate fatty liver cows (TAG between 50 and 100 mg/g liver tissue), severe fatty liver cows (TAG between 100 and 200 mg/g liver tissue), and extreme fatty liver cows (TAG higher than 200 mg/g liver tissue) (Gaal et al., 1983).
In all blood samples, glucose and beta-hydroxybutyrate (BHBA) concentrations were determined. In the samples of the first 21 days postpartum non-esterified fatty acids (NEFA) and insulin concentrations were determined. On days 3, 7, 9, 13, 15, and 17 postpartum gamma-glutamyl transpeptidase (GGT) activity, aspartate amino transferase (ASAT) activity, cortisol concentrations, and calcium concentrations were determined. Additionally, cortisol concentrations were determined on days 19 and 21 after calving. Cortisol and insulin concentrations were determined by radioimmunoassay (Coat-a-Count®, Diagnostic Products Corp., Los Angeles, CA), the remaining analyses were performed using standard test kits on a Beckman CX automatic analyser. Statistical analysis A cow that developed LDA was matched with two other healthy cows that did not develop LDA. Matching was based on parity, the level of fatty infiltration of the liver and the day of lactation. It could be possible that cows of the restricted fed group were matched with cows of the not restrictedly fed group. This could result in unexpected differences concerning for instance feed intake and weight gain. For that reason the average weekly feed intake of the dry period, the body condition
74
score in the week prior to calving, weight gain in the dry period, and the feed intake on the first day after calving were of the DA-cows and their matched controls were compared by using a student’s T-test.
The day of clinical diagnosis of LDA is defined as day 0. Days prior to LDA were set from day -1 to day -10. The variables were analysed with Linear Mixed Effects method, which takes dependency of the data into account and therefore is suitable to statistically analyse repeated measurements (S-PLUS 2000®, MathSoft Inc., Cambridge, United Kingdom). This method uses maximum likelihood techniques for estimating the fit of the model. The identity of the cow was used as random effect.
The LDA-effect is adjusted for the day postpartum and for the severity of fatty infiltration of the liver by inserting these variables in the first part of the formula for the fixed effects. The following formula for the fixed effects was used:
Y ~ FL-severity + Day PP + PRIOR * LDA Y: feed intake, milk production and values of blood analyses FL-severity: category of fatty liver, ordinal: moderate, severe, and extreme Day PP: number of days postpartum, as a polynomial of the third order PRIOR: day prior to LDA, between -10 and -1, as polynomial of the third
order LDA: occurrence of LDA, binomial PRIOR*LDA: interaction term to analyse whether the trend over time differed
between the LDA-cows and control cows. Significance of the difference between LDA-cows and matched controls on
days prior to DA was analysed. (Auto)correlation structures were tested and selected based on Likelihood Ratio test. The normality of the residuals and the random effects in the final model were visually checked with Q-Q plots and both followed more or less a straight line, indicating that the data were normally distributed.
Results Four out of 16 cows developed LDA on days 4, 11, 21, and 29 after calving. Three of the DA-cows had a severe fat infiltration of the liver (119, 187 and 200 mg/g liver tissue), while in one DA-cow the fatty infiltration of the liver was extreme (307 mg/g liver tissue). 14 out of 16 cows from both experimental groups revealed liver fat contents higher than 50 mg/g liver tissue in the second week postpartum. Two of these cows had extreme fatty liver, severe fatty liver occurred in seven cows, and a moderate fatty infiltration of the liver occurred in five out of 14 cows. Maximum TAG contents in the liver was 307 mg/g tissue in the second week postpartum. There were no significant differences between the DA-cows and their matched

75
counterparts concerning feed intake, weight gain, and body condition score in the dry period or feed intake on the first day after calving.
Average daily feed intake, milk production and blood values in the 10-day period before development of LDA, as well as the values of the matched control cows are given in Table 2. Not adjusted for the day after calving, the concentrations of NEFA, BHBA, GGT and ASAT are higher in cows developing LDA compared with the matched control cows. Table 2. Daily feed intake, milk production and blood values in the 10-day period before development of LDA, the values of the matched control cows (average ± s.e.m.) and the 95% confidence interval (C.I.) of the reference value.
Variable LDA-cows (n = 4)
Control cows (n = 8)
Reference Value (95% C.I.)
Feed intake (kg DM) 8.64 ± 0.73 15.27 ± 0.68 - Milk production (kg) 23.36 ± 6.05 31.59 ± 7.64 - NEFA (mmol/l) 1.23 ± 0.11 0.79 ± 0.05 0 - 0.8 Glucose (mmol/l) 2.46 ± 0.22 2.84 ± 0.05 2.5 - 4.0 Insulin (µIU/ml) 1.12 ± 0.20 3.73 ± 0.21 0 - 5 BHBA (mmol/l) 3.45 ± 0.39 0.99 ± 0.09 0 - 1.2 GGT (U/l) 45.38 ± 8.02 26.13 ± 1.62 0 - 27 ASAT (U/l) 130.00 ± 20.97 75.13 ± 5.67 10 - 70 Cortisol (nmol/l) 2.27 ± 0.71 4.18 ± 1.31 15 - 19 Calcium (mmol/l) 2.56 ± 0.10 2.74 ± 0.06 2.3 - 3.2
Table 3. Levels of significance in the difference of the variables tested between LDA- and matched control cows. Figures 1 to 6 should be used for interpreting the size and direction of the difference between cows that develop LDA and their matched control cows.
Dependent Variable
Severity of Fatty Liver
Day PP (poly, 3)
Prior (poly, 3)
LDA Interaction Prior*LDA
DM intake p = 0.029 p = 0.019 N.S. p = 0.077 p < 0.001 Milk production p = 0.094 p = 0.005 p = 0.009 p = 0.046 p < 0.001 NEFA p = 0.048 p = 0.092 p = 0.059 p = 0.088 p = 0.003 Glucose p = 0.089 p = 0.019 N.S. p = 0.070 N.S. Insulin p = 0.045 p < 0.001 p = 0.023 p < 0.001 N.S. BHBA p = 0.002 p < 0.001 N.S. p < 0.001 p < 0.001 GGT N.S. N.S. N.S. N.S. N.S. ASAT N.S. p = 0.044 N.S. p = 0.025 p = 0.085 Cortisol N.S. N.S. N.S. N.S. N.S. Calcium N.S. N.S. N.S. p = 0.046 N.S.
Day PP = day postpartum, Prior = day prior to left-displaced abomasum (LDA), poly, 3 = as polynomial of the third order, N.S. = not significant at a 10% level
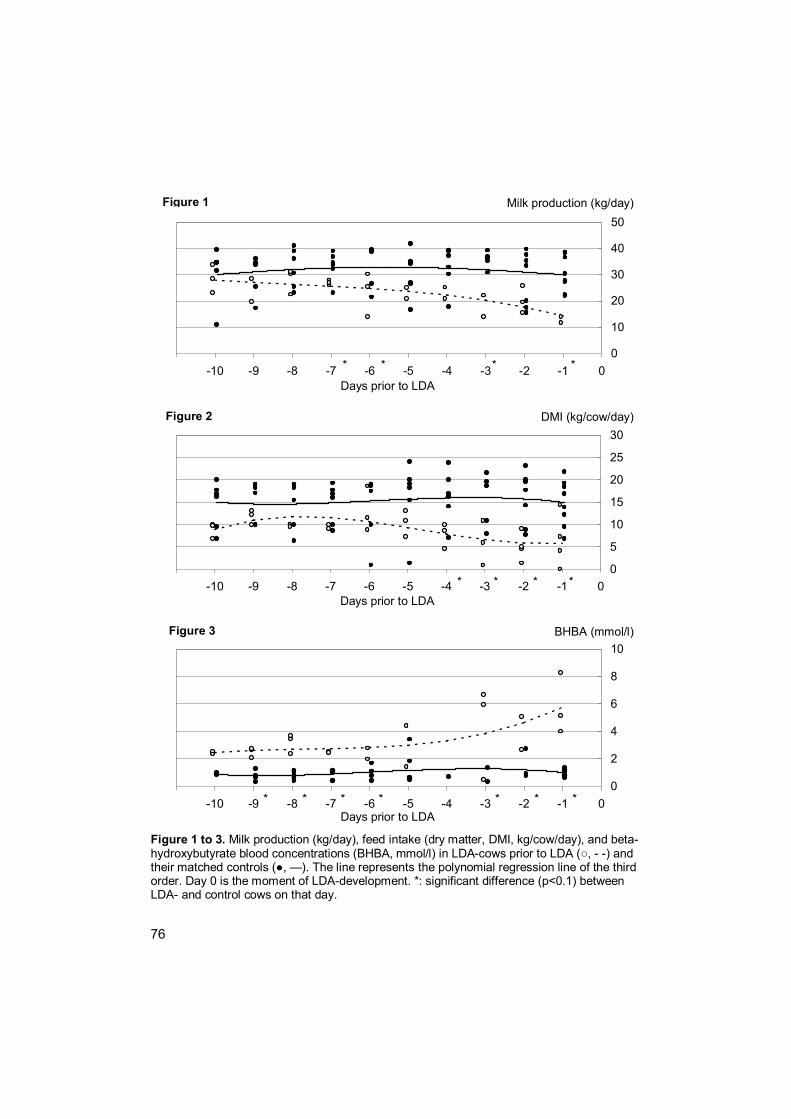
76
Milk production (kg/day)
0
10
20
30
40
50
-11 -10 -9 -8 -7 -6 -5 -4 -3 -2 -1 0Days prior to LDA
Figure 1
* * * *
DMI (kg/cow/day)
0
5
10
15
20
25
30
-11 -10 -9 -8 -7 -6 -5 -4 -3 -2 -1 0Days prior to LDA
* * * *
Figure 2
BHBA (mmol/l)
0
2
4
6
8
10
-11 -10 -9 -8 -7 -6 -5 -4 -3 -2 -1 0Days prior to LDA
* * * *
Figure 3
* * *
Figure 1 to 3. Milk production (kg/day), feed intake (dry matter, DMI, kg/cow/day), and beta-hydroxybutyrate blood concentrations (BHBA, mmol/l) in LDA-cows prior to LDA (○, - -) and their matched controls (●, —). The line represents the polynomial regression line of the third order. Day 0 is the moment of LDA-development. *: significant difference (p<0.1) between LDA- and control cows on that day.
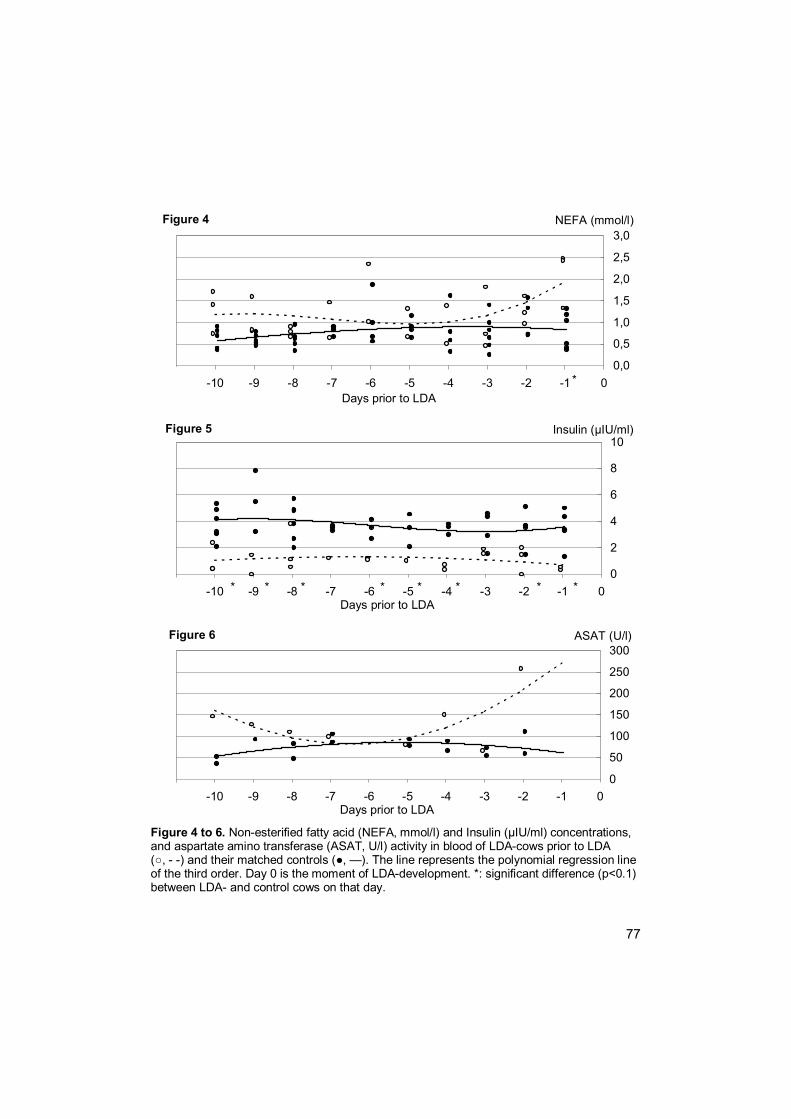
77
NEFA (mmol/l)
0,0
0,5
1,0
1,5
2,0
2,5
3,0
-11 -10 -9 -8 -7 -6 -5 -4 -3 -2 -1 0Days prior to LDA
Figure 4
*
Insulin (µIU/ml)
0
2
4
6
8
10
-11 -10 -9 -8 -7 -6 -5 -4 -3 -2 -1 0Days prior to LDA
*
Figure 5
** * * * * *
ASAT (U/l)
0
50
100
150
200
250
300
-11 -10 -9 -8 -7 -6 -5 -4 -3 -2 -1 0Days prior to LDA
Figure 6
Figure 4 to 6. Non-esterified fatty acid (NEFA, mmol/l) and Insulin (µIU/ml) concentrations, and aspartate amino transferase (ASAT, U/l) activity in blood of LDA-cows prior to LDA (○, - -) and their matched controls (●, —). The line represents the polynomial regression line of the third order. Day 0 is the moment of LDA-development. *: significant difference (p<0.1) between LDA- and control cows on that day.

78
Table 3 shows significant differences between LDA- and control cows for the variables tested in the linear mixed effects model. Adjusted for the day postpartum and the severity of fatty liver, we found that milk production, feed intake, calcium-, glucose- and insulin concentrations were lower in cows that developed LDA. NEFA, BHBA and ASAT levels were elevated in those cows.
Figures 1 to 6 show the trends of the milk production, feed intake, BHBA, NEFA, insulin and ASAT in DA-cows and their control cows within the 10-day period before LDA diagnosis. When comparing the parameters on individual days, BHBA concentrations were elevated, whereas the insulin concentrations were lowered in nearly the whole 10-day period in LDA-cows compared to their matched control cows. At day four prior to LDA detection the feed intake was significantly lower in LDA-cows, which was, with respect to milk production, also the case at three days prior to LDA (Figure 1 to 6)
Discussion Retrospective analysis of results of a feeding trial revealed differences in parameters between animals that developed a clinically persistent LDA and animals that did not. Cows that would develop displacement of the abomasum in general had lower feed intake, lower milk production, decreased blood calcium levels, elevated blood ketone body and NEFA concentrations, and high activity of ASAT compared to the matched animals. These findings are in accordance with previous reports concerning differences in the pre-clinical stage of LDA (Detillieux et al., 1997, Geishauser et al., 1998, Geishauser et al., 2000, Østergaard and Gröhn, 2000).
In the present study, two different phases in the 10-day period can be identified based on the trend over time of the parameters that were evaluated. First the period between ten and five days prior to LDA, and secondly the phase from four days before LDA until the day of DA. The latter period can be interpreted in two ways. First the abomasum can be sub-clinically dislocated several days before clinical diagnosis and the pre-clinical changes in the parameters are due to alterations of the position of the abomasum. The other interpretation is that changes in these last 4 days prior to LDA are putative (co-)initiators for DA, which is also mentioned in literature (Østergaard and Gröhn, 2000).
Central element in the observed changes in parameters prior to LDA in fatty liver cows is the reduced feed intake. A result of reduced feed intake is poor rumen fill. The poorly filled rumen enables the abomasum to shift to the left and finally the abomasum dislocates clinically (Dirksen, 1962). As a consequence of reduced feed intake blood concentrations of calcium and glucose decrease (Herdt, 2000, and Østergaard and Gröhn, 2000). Another effect of low glucose levels in ruminants is

79
ketone body production, leading to a rise of blood BHBA concentrations. In addition a rise of ASAT activity in the blood could be a result from protein mobilisation from muscles in order to deliver glycogenic amino acids as glucose precursors (Herdt, 2000).
Abomasal emptying and digestive flow are positively correlated with the amount of feed intake and the degree of rumen fill (Gregory et al., 1985, and Feng et al., 1993). Motility of the abomasum depends, besides on feed intake, on the tonicity of the vagal nerve, which in turn depends on afferent information of the autonomic system. A part of the autonomic system information is the concentration of glucose and insulin in the blood. High concentrations of glucose and insulin increased the vagal tonicity, which in turn increased motility and gastric acid secretion under experimental conditions (Ash, 1961 Lam et al., 1997, and Kovacs et al, 1995).
Besides the abomasal position in the abdomen and motility of the abomasum, at least a third reason for LDA development is necessary: gas production (Dirksen, 1962). A possible pathway for abomasal gas production is prolongation of fermentation in the abomasum (Van Winden et al., 2002a). They report an increase of abomasal pH in postpartum cows; this increase in pH enables the rumen bacterial flora to continue fermentation. As mentioned above there is a stimulating effect of insulin on gastric acid production. Puscas et al. (2001) described a decreased acid production due to decreased calcium blood concentrations. This effect is caused by a vagal mechanism and by a direct effect on parietal cells; calcium is a second messenger for the increase in activity of carbonic anhydrase. In cows that developed clinically DA, decreased values of calcium were detected prior to LDA which is in accordance with earlier reports (Geishauser et al., 1998). Together with low values of insulin this might have led reduced acid secretion in the abomasum, resulting in increased gas production.
Conclusion In cows that develop displacement of the abomasum, negative energy balance is an important risk factor. In this experiment not all cows with NEB developed clinical DA, but there were marked differences in variables between cows during NEB that did or did not develop clinical LDA. Cows that developed displacement of the abomasum had lower feed intake, lower milk production, decreased blood calcium levels, elevated blood ketone body and NEFA concentrations, and high activity of ASAT compared to the matched animals. However, it remains questionable whether the changes in metabolic parameters indeed preceded dysfunction of the abomasum, and whether there is a causal association between these parameters and LDA.
80
References Ash, R. W. 1961. Stimuli influencing the secretion of acid by the abomasum of
sheep. Journal of Physiology 157, 185-207. Breukink, H.J. and J. Kroneman. 1963. Een nieuw diagnostisch hulpmiddel bij het
onderzoek van het rund op de aanwezigheid van een gedilateerde en/of gedisloceerde lebmaag; het zgn. “Steelband-effect”. Tijdschrift voor Diergeneeskunde 88, 282-291.
Centraal Veevoeder Bureau. Voedernormen landbouwhuidieren en voederwaarde veevoeders, verkorte tabel 1998, CVB-reeks nr.24, august 1998 (In Dutch).
Detillieux, J. C., Y. T. Gröhn, S. W. Eicker and R. L. Quaas. 1997. Effects of left displaced abomasum on test day milk of Holstein cows. Journal of Dairy Science 80, 121-126.
Dirksen, G. 1962. Die Erweiterung, Verlagerung und Drehung des Lebmages beim Rind, Berlin and Hamburg, Verlag Paul Parey. pp 121.
Feng, P., W. H. Hoover, T. K. Miller and R. Blauwiekel. 1993. Interactions of fiber and nonstructural carbohydrates on lactation and ruminal function. Journal of Dairy Science 76, 1324-1333.
Gaal, T., I. M. Reid, R. A. Collins, C. J. Roberts and B. V. Pike. 1983. Comparison of biochemical and histological methods of estimating fat content of liver of dairy cows. Research in Veterinary Science 34, 245-248.
Geishauser, T. 1995. Abomasal displacement in the bovine -- a review on character, occurrence aetiology and pathogenesis. Journal of Veterinary Medicine, part A 42, 229-251.
Geishauser, T., K. Leslie, T. Duffield, D. Sandals and V. Edge. 1998. The association between selected metabolic parameters and left abomasal displacement in dairy cows. Journal of Veterinary Medicine, part A 45, 499-511.
Geishauser, T., K. Leslie and T Duffield. 2000. Prevention and prediction of displaced abomasum in dairy cows. The Bovine Practitioner 34, 51-55.
Gregory, P. C., S. J. Miller and A. C. Brewer. 1985. The relation between food intake and abomasal emptying and small intestinal transit time in sheep. British Journal of Nutrition 53, 373-380.
Herdt, T. H. 2000. Ruminant adaptation to negative energy balance, influences on the etiology of ketosis and fatty liver. Veterinary Clinics of North America: Food Animal Practice 16, 215-230.
Heuer, C. 2000. Negative energy balance in dairy cows- prediction, consequences, prevention. Ph.D. thesis Utrecht University, pp165-189.
Hill, A. W., I. M. Reid and R. A. Collins. 1985. Influence of liver fat on experimental Escherichia coli mastitis in periparturient cows. Veterinary Record 117, 549-551.
81
Holtenius, K., K. Sternbauer and P. Holtenius. 2000. The effect of the plasma glucose level on the abomasal function in dairy cows. Journal of Animal Science 78, 1930-1935.
Holtenius, P and K. Holtenius. 1996. New aspects of ketone bodies in energy metabolism in dairy cows: a review. Journal of Veterinary Medicine, Part A 43, 579-587.
Kovacs, T. O. G., K. C. K. Lloyd and J. H. Walsh. 1996. Gastrin partially mediates insulin-induced acid secretion in dogs. Peptides 17, 583-587.
Lam, W. F., A. A. M. Masclee, E. S. M. Muller and C. B. H. W. Lamers. 1997. Effect of hyperglycemia on gastric acid secretion during gastric phase of digestion. American Journal of Physiology 272, G1116-G1121.
Muylle, E., C. van den Hende, B. Sustronck and P. Deprez. Biochemical profiles in cows with abomasal displacement estimated by blood and liver parameters. Journal of Veterinary Medicine, part A 37, 259-263.
Ohtsuka, H., M. Koiwa, A. Hutsugaya, K. Kudo, F. Hoshi, N. Itoh, H. Yokota, H. Okada and S. Kawamura. 2001. Relationship between serum TNF activity and insulin resistance in dairy cows affected with naturally occurring fatty liver. Journal of Veterinary Medical Science 63, 1021-1025.
Østergaard, S. and Y. T. Gröhn. 2000. Concentrate feeding, dry-matter intake, and metabolic disorders in Danish dairy cows. Livestock Production Science 65, 107-118.
Puscas, I., M. Coltau, M. Baican , G. Domuta and A. Hecht. 2001. Calcium, carbonic anhydrase and gastric acid secretion. Physiology Research 50, 349-364.
Reid, I. M. and C. J. Roberts. 1982 Fatty liver in dairy cows. In Practice 4, 164-169. Rukkwamsuk, T. 1999. Negative energy balance in postparturient dairy cows:
consequences and adaptations. Ph.D. thesis Utrecht University, pp113-125. Shaver, R. D. 1997. Nutritional risk factors in the etiology of left displaced
abomasum in dairy cows: a review. Journal of Dairy Science 80, 2449-2453. Trent, A. M. 1990. Surgery of the bovine abomasum. Veterinary Clinics of North
America: Food Animal Practice 6, 399-448. Van den Top, A. M., T. Wensing, M. J. H. Geelen, G. H. Wentink, A. T. van ‘t
Klooster and A. C. Beynen. 1995. Time trends of plasma lipids and hepatic triacylglycerol synthesizing enzymes during postpartum fatty liver development in dairy cows with unlimited access to feeding during the dry period. Journal of Dairy Science 78, 2208-2220.
Van Winden, S. C. L., K. E. Müller, R. Kuiper, and J. P. T. M. Noordhuizen. 2002a. Studies on the pH value of abomasal contents in dairy cows during the first three weeks after calving. Journal of Veterinary Medicine Part A 49, 157-160.
Van Winden, S. C. L., C. R. Brattinga, K. E. Müller, J. P. T. M. Noordhuizen and A.

82
C. Beynen. 2002b. The position of the abomasum in dairy cows during the first six weeks after calving. Veterinary Record In press.
83
Chapter Seven
Studies on the pH value of abomasal contents in dairy cows during the first three weeks after calving
S. C. L. Van Winden*, K. E. Müller*, R. Kuiper* and J. P. T. M. Noordhuizen*
*Department of Farm Animal Health, Faculty of Veterinary Medicine, Utrecht University, Yalelaan 7, 3584 CL, Utrecht, The Netherlands
Journal of Veterinary Medicine, Part A. 2002. 49, 157-160

84
Summary The pH value of the abomasal contents in adult cattle is normally constant and has a value of 2. Abomasal contents with pH values of 5.5 and higher could give rise to bacterial fermentation with subsequent gas production. Accumulation of gas is thought to form a key event in the pathogenesis of abomasal displacement (DA). The aim of the present study was to determine the pH values of abomasal contents of dairy cows in the first three weeks after calving.
The pH of the abomasal contents was, over several days, higher than the pH value of the abomasal juice in mid-lactation cows. The highest pH values were measured at day 14 after calving. Possible explanations for the rise of the pH value of the abomasal contents are discussed. Abbreviation key: DA = displaced abomasum.
85
Introduction Displacement of the abomasum (DA) forms a major problem of high yielding cows. Geishauser et al. (2000) estimated that DA caused losses of 55 to 200 million dollars in the US on a yearly basis. In the pathophysiology of DA abomasal atony and accumulation of gas in the gastric lumen play a crucial role. Dirksen (1962) described four potential pathways of gas formation within the abomasum, one of which is the continuing fermentation of rumen contents. If fermentation in the abomasum is an option, there should be a suitable environment for the microbes, which is necessary for the perpetuation of fermentative process. One of the demands would be a pH of the contents of the abomasum 5.5 or higher, since this is the minimum of the optimal pH-value for methane-producing bacteria. Under this circumstance methane production becomes probable (Mackie et al., 1992). Another effect of an elevation of the pH of the abomasal contents is a rise in pH of the duodenal contents. This results in a decrease of the motility of the abomasum, which is another predisposing factor for developing a DA (Madison et al., 1993).
Abomasal contents of healthy adult cattle have a pH value of 2.1 (Sarashina et al., 1990). When the pH rises above this value, production of acid by the gastric parietal cells will decrease the pH until the equilibrium is reached (Ash, 1961). Experimental inhibition of the vagal cholinergic system and stimulation of the sympathetic system were shown to result in hypomotility and a reduced secretion of gastric acid (Ash, 1961). Under pathological conditions increased pH values were measured in abomasal contents of adult cattle. Breukink (1973) and Dougherty et al. (1975) reported that acidosis of the rumen resulted in an increase of the pH of the abomasal contents. In DA to the left, the pH of the contents was found lowered, whereas the pH values of abomasal contents in a DA to the right side was elevated (Decraemere et al., 1976 and Geishauser et al., 1996). As measurements were performed when the abomasum was already displaced, no conclusions could be drawn with respect to the pH values in the abomasum in the period before the displacement occurred.
The aim of the present study was to find out if gastric pH values are increased in dairy cows during the first three weeks after calving. Since after calving the digestive tract has to adapt to the higher amount of feed intake in general, and intake of concentrate in particular, it is possible that the equilibrium of the acidity of the abomasal contents is disturbed with an increased risk for DA as a result (Martens, 2000 and Svendsen, 1969).
The pH values of abomasal contents in the early postpartum period in eight dairy cows were obtained by abomasocentesis on days 1, 2, 4, 8, 14 and 21 following calving. The pH values of 24 (8*3) abomasal juice samples obtained from dairy cows more than 150 days after calving served as controls. The results are discussed with respect to the risk of DA development.
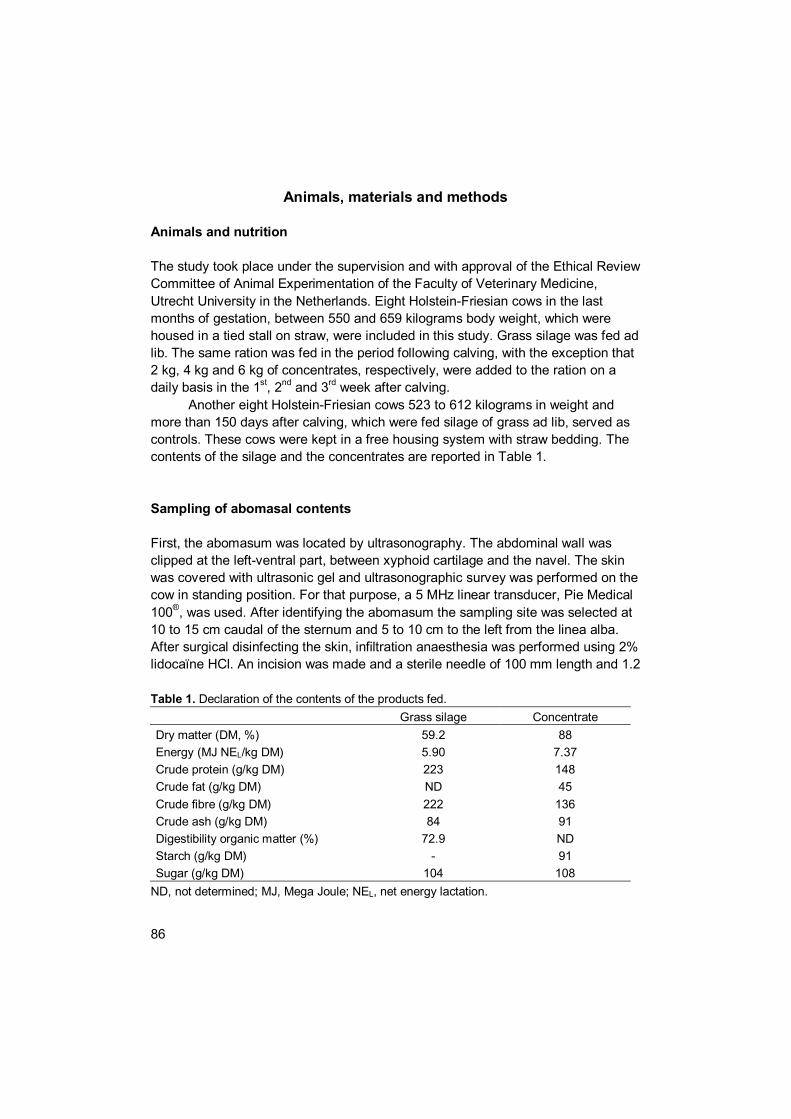
86
Animals, materials and methods Animals and nutrition The study took place under the supervision and with approval of the Ethical Review Committee of Animal Experimentation of the Faculty of Veterinary Medicine, Utrecht University in the Netherlands. Eight Holstein-Friesian cows in the last months of gestation, between 550 and 659 kilograms body weight, which were housed in a tied stall on straw, were included in this study. Grass silage was fed ad lib. The same ration was fed in the period following calving, with the exception that 2 kg, 4 kg and 6 kg of concentrates, respectively, were added to the ration on a daily basis in the 1st, 2nd and 3rd week after calving.
Another eight Holstein-Friesian cows 523 to 612 kilograms in weight and more than 150 days after calving, which were fed silage of grass ad lib, served as controls. These cows were kept in a free housing system with straw bedding. The contents of the silage and the concentrates are reported in Table 1.
Sampling of abomasal contents First, the abomasum was located by ultrasonography. The abdominal wall was clipped at the left-ventral part, between xyphoid cartilage and the navel. The skin was covered with ultrasonic gel and ultrasonographic survey was performed on the cow in standing position. For that purpose, a 5 MHz linear transducer, Pie Medical 100®, was used. After identifying the abomasum the sampling site was selected at 10 to 15 cm caudal of the sternum and 5 to 10 cm to the left from the linea alba. After surgical disinfecting the skin, infiltration anaesthesia was performed using 2% lidocaïne HCl. An incision was made and a sterile needle of 100 mm length and 1.2 Table 1. Declaration of the contents of the products fed. Grass silage Concentrate Dry matter (DM, %) 59.2 88 Energy (MJ NEL/kg DM) 5.90 7.37 Crude protein (g/kg DM) 223 148 Crude fat (g/kg DM) ND 45 Crude fibre (g/kg DM) 222 136 Crude ash (g/kg DM) 84 91 Digestibility organic matter (%) 72.9 ND Starch (g/kg DM) - 91 Sugar (g/kg DM) 104 108
ND, not determined; MJ, Mega Joule; NEL, net energy lactation.
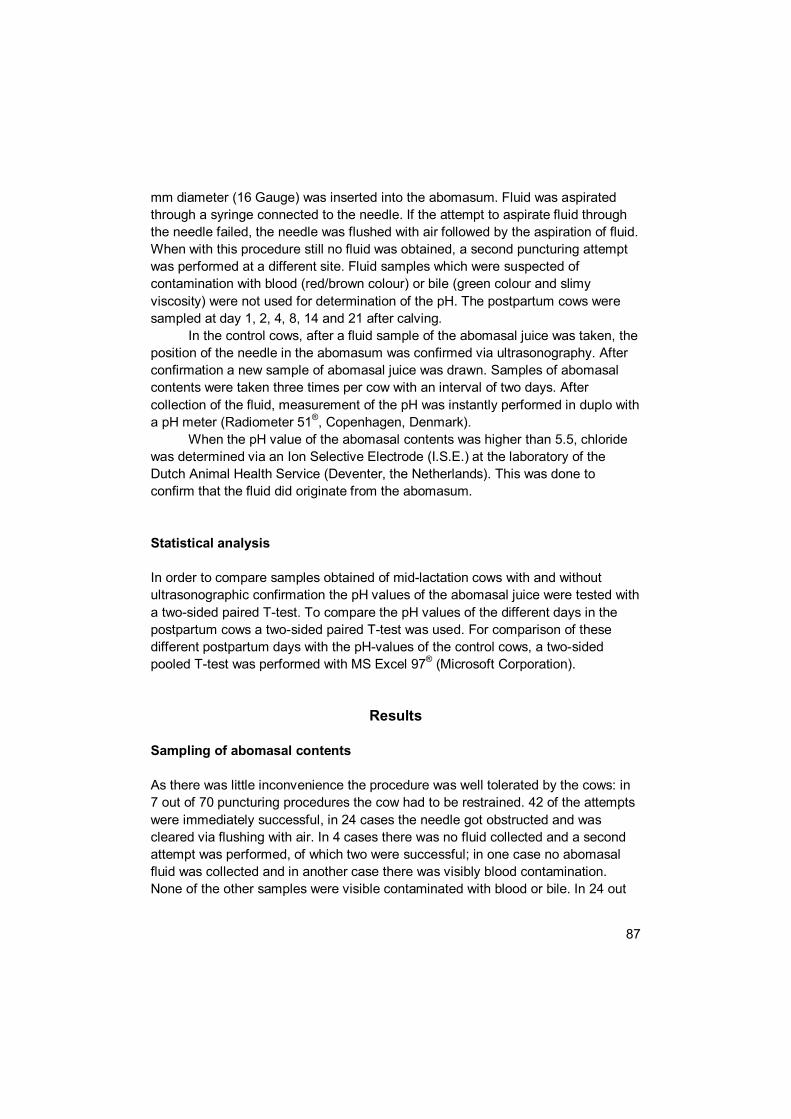
87
mm diameter (16 Gauge) was inserted into the abomasum. Fluid was aspirated through a syringe connected to the needle. If the attempt to aspirate fluid through the needle failed, the needle was flushed with air followed by the aspiration of fluid. When with this procedure still no fluid was obtained, a second puncturing attempt was performed at a different site. Fluid samples which were suspected of contamination with blood (red/brown colour) or bile (green colour and slimy viscosity) were not used for determination of the pH. The postpartum cows were sampled at day 1, 2, 4, 8, 14 and 21 after calving.
In the control cows, after a fluid sample of the abomasal juice was taken, the position of the needle in the abomasum was confirmed via ultrasonography. After confirmation a new sample of abomasal juice was drawn. Samples of abomasal contents were taken three times per cow with an interval of two days. After collection of the fluid, measurement of the pH was instantly performed in duplo with a pH meter (Radiometer 51®, Copenhagen, Denmark).
When the pH value of the abomasal contents was higher than 5.5, chloride was determined via an Ion Selective Electrode (I.S.E.) at the laboratory of the Dutch Animal Health Service (Deventer, the Netherlands). This was done to confirm that the fluid did originate from the abomasum. Statistical analysis In order to compare samples obtained of mid-lactation cows with and without ultrasonographic confirmation the pH values of the abomasal juice were tested with a two-sided paired T-test. To compare the pH values of the different days in the postpartum cows a two-sided paired T-test was used. For comparison of these different postpartum days with the pH-values of the control cows, a two-sided pooled T-test was performed with MS Excel 97® (Microsoft Corporation).
Results Sampling of abomasal contents As there was little inconvenience the procedure was well tolerated by the cows: in 7 out of 70 puncturing procedures the cow had to be restrained. 42 of the attempts were immediately successful, in 24 cases the needle got obstructed and was cleared via flushing with air. In 4 cases there was no fluid collected and a second attempt was performed, of which two were successful; in one case no abomasal fluid was collected and in another case there was visibly blood contamination. None of the other samples were visible contaminated with blood or bile. In 24 out
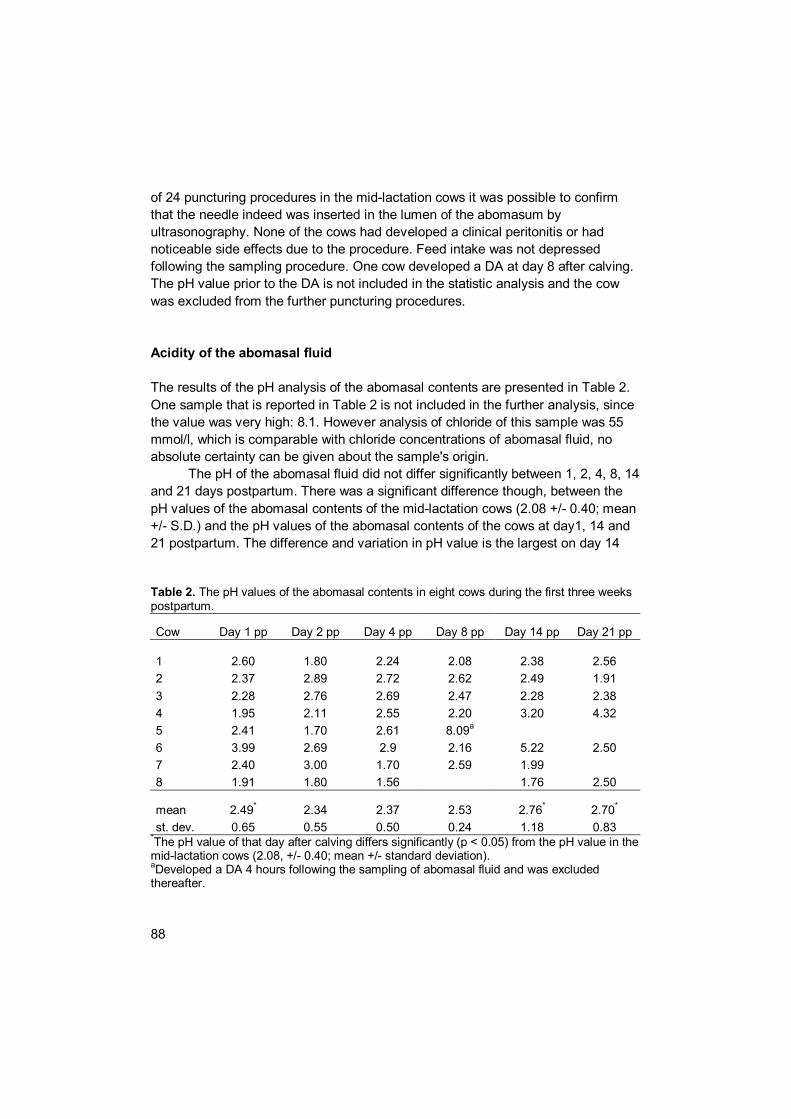
88
of 24 puncturing procedures in the mid-lactation cows it was possible to confirm that the needle indeed was inserted in the lumen of the abomasum by ultrasonography. None of the cows had developed a clinical peritonitis or had noticeable side effects due to the procedure. Feed intake was not depressed following the sampling procedure. One cow developed a DA at day 8 after calving. The pH value prior to the DA is not included in the statistic analysis and the cow was excluded from the further puncturing procedures. Acidity of the abomasal fluid
The results of the pH analysis of the abomasal contents are presented in Table 2. One sample that is reported in Table 2 is not included in the further analysis, since the value was very high: 8.1. However analysis of chloride of this sample was 55 mmol/l, which is comparable with chloride concentrations of abomasal fluid, no absolute certainty can be given about the sample's origin.
The pH of the abomasal fluid did not differ significantly between 1, 2, 4, 8, 14 and 21 days postpartum. There was a significant difference though, between the pH values of the abomasal contents of the mid-lactation cows (2.08 +/- 0.40; mean +/- S.D.) and the pH values of the abomasal contents of the cows at day1, 14 and 21 postpartum. The difference and variation in pH value is the largest on day 14 Table 2. The pH values of the abomasal contents in eight cows during the first three weeks postpartum.
Cow Day 1 pp Day 2 pp Day 4 pp Day 8 pp Day 14 pp Day 21 pp
1 2.60 1.80 2.24 2.08 2.38 2.56 2 2.37 2.89 2.72 2.62 2.49 1.91 3 2.28 2.76 2.69 2.47 2.28 2.38 4 1.95 2.11 2.55 2.20 3.20 4.32 5 2.41 1.70 2.61 8.09a 6 3.99 2.69 2.9 2.16 5.22 2.50 7 2.40 3.00 1.70 2.59 1.99 8 1.91 1.80 1.56 1.76 2.50
mean 2.49* 2.34 2.37 2.53 2.76* 2.70* st. dev. 0.65 0.55 0.50 0.24 1.18 0.83
*The pH value of that day after calving differs significantly (p < 0.05) from the pH value in the mid-lactation cows (2.08, +/- 0.40; mean +/- standard deviation). aDeveloped a DA 4 hours following the sampling of abomasal fluid and was excluded thereafter.

89
and then declines on day 21. There was no significant difference (p = 0.948) between the pH values of the sampling methods with and without ultrasonographic confirmation.
Discussion Since there was no significant difference between the samples with and without ultrasonographic confirmation, both collection methods are equally suited for acquiring abomasal contents.
The results imply an elevation of the pH of the abomasal contents after calving. Increased values of the pH in abomasal contents can be caused by contamination of bile or blood, which both have a high pH value and a considerable buffering capacity (Dirksen, 1990 and Stöber, 1961). Since there was no visible contamination with bile and blood, this is not a probable reason. Another cause for a rise in the pH value could be an infestation of the abomasum with Ostertagia ostertagi, a gastric parasite (Fox, 1997). The cows were adults, housed indoors and were fed grass silage. However an anti-parasitic agent was not used, under these conditions infection with Ostertagia ostertagi in cows is assumed to be low (Fox, 1997).
Another possible cause for the rise in the pH value of the abomasal fluid can be stress due to maladaptation, which results in a stimulation of the sympathetic system and/ or inhibition of the vagal cholinergic system. Both can result in a hypomotility of the abomasum and a reduced secretion of gastric acid (Ash, 1961, Breukink, 1973 and Holtenius et al. 2000). When fluid of the rumen is transported to the abomasum and not mixed with the acid of the abomasal contents due to decreased motility of the abomasum, the pH will rise. Such an assumption, as postulated by Svendsen (1969), could not be confirmed with the results of Breukink and De Ruyter (1977). The elevation of pH may enable the microbes in the fluid to produce methane and carbon dioxide, the main components of gas in a displaced abomasum (Mackie et al., 1992 and Svendsen, 1969).
Finally, the cause of the elevation of the pH in the abomasal fluid could be due to malabsorption of bicarbonate in the omasum. In a healthy ruminant, the omasum absorbs bicarbonate and other buffers such as phosphates. When the omasum does not function properly, the buffering capacity of the contents entering the abomasum will be higher, resulting in higher pH values in the abomasal fluid (Engelhardt and Hauffe, 1975). This malabsorption can be due to an increase in flow of rumen fluid with high osmotic values. This occurs in dairy cows due to maladaptation to the diet in the postpartum period (Martens, 2000). This phenomenon is due to an increased intake of feed, especially concentrates, which can result in rumen acidosis. As reported before, ruminal acidosis is associated
90
with in an increase of the pH of the abomasal contents (Breukink, 1973 and Dougherty et al., 1975). The hypothesis of maladaptation to the sudden change of ration after calving is supported by the fact that pH values of the abomasal contents decline after day 14 postpartum. The gastrointestinal tract is from that moment on adapting to the changed feeding practices after calving.
It is important to bear in mind that two pH values were above 5, which makes fermentation in the abomasum likely. Whether the pH value of 8.1 in one cow actually resulted in a displacement of the abomasum is not known and can only be assumed. Since this sample was obtained without ultrasonographic confirmation, there is still the possibility that the fluid with a pH of 8.1 did not originate from the abomasum but from the rumen. The concentration of chloride, 55 mmol/l, is in agreement with the values of abomasal contents that Braun et al. (1997) reported and much higher than presumed to be normal in rumen fluid (Geishauser et al., 1996).
The results of this study show that there is an increase of the pH value of the abomasal contents in the postpartum period compared with later stages in lactation. The elevated pH can result in continuation of fermentation. This, together with a poor motility of the abomasum, can result in a displacement of the abomasum. Thus, the rise in pH of the abomasal contents can play an important role in the aetiology of the displacement of the abomasum in dairy cows.
References Ash, R. W. 1961 Stimuli influencing the secretion of acid by the abomasum of
sheep. Journal of Physiology 157, 185-207. Braun, U., K. Wild, M. Merz and H. Hertzberg. 1997. Percutaneous ultrasound-
guided abomasoscentesis in cows. The Veterinary Record 140, 599-602. Breukink, H. J. 1973. Het verloop van pH en pepsinegehalte van de
lebmaaginhoud bij het volwassen rund. Tijdschrift voor Diergeneeskunde (In Dutch, English summary) 98, 1051-1062.
Breukink, H. J. and T. De Ruyter. 1977. Lebmaagdislocaties bij het rund: de invloed van het rantsoen op de samenstelling van pensvloeistof, lebmaag- en duodenuminhoud. Tijdschrift voor Diergeneeskunde (In Dutch, English summary) 102, 554-566.
Decraemere, H., W. Oyaert, C. Vanden Hende, E. Muylle and L. Ooms. 1976. Lebmaagverplaatsing bij het rund II Biochemische veranderingen in bloed en maaginhoud van dieren met lebmaagdilatatie. Vlaams Diergeneeskundig Tijdsschrift (In Dutch, English summary) 45, 300-325.
Dirksen, G. 1962. Vorbetrachtungen zur Topographie, Anatomie und Physiologie der Wiederkäuermägen. In: Die Erweiterung, Verlagerung und Drehung des
91
Labmagens beim Rind, Berlin and Hamburg, Verlag Paul Parey. Dirksen, G. 1990. Verdauungsapparat. In: Die Klinische Untersuchung des Rindes,
3rd edition, Editors: G. Dirksen, H. D. Gründer and M. Stöber, Berlin and Hamburg, Verlag Paul Parey.
Dougherty, R. W., J. L. Riley and H. M. Cook. 1975. Changes in Motility and pH in the Digestive Tract of Experimentally Overfed Sheep. American Journal of Veterinary Research 36, 827-829.
Engelhardt, W. and R. Von Hauffe. 1975. Role of the omasum in absorption and secretion of water and electrolytes in sheep and goats. In: Digestion and Metabolism in the Ruminant: proceedings of the IV international symposium on ruminant physiology, Sydney, Australia, August 1974, Editors: I. McDonalds and E. Warner. Armidale, University of New England Publishing Unit.
Fox, M.T. 1997. Pathophysiology of infection with gastrointestinal nematodes in domestic ruminants: recent developments. Veterinary Parasitology 72, 285-308.
Geishauser, Th., D. Reiche, Ch. Seeh, B. Thünker, St. Verwohlt and K. Failing. 1996. pH, Natrium, Kalium, Magnesium, Kalzium, Phosphat und Chlorid im Pansen- und Labmageninhalt von Kühen mit Labmagenverlagerung. Deutsche Tierärztlicher Wochenschrift (In German, English summary) 103, 16-20.
Geishauser, Th., K. Leslie and T. Duffield. 2000. Metabolic aspects in the etiology of displaced abomasum. Veterinary Clinics of North America: Food Animal Practice 16, 255-265.
Holtenius, K., K. Sternbauer and P. Holtenius. 2000. The effect of the plasma glucose level on the abomasal function in dairy cows. Journal of Animal Science 78, 1930-1935.
Mackie, R. I., B. A. White and M. P. Bryant. 1992. Methanogenesis, Biochemistry. In Encyclopedia of Microbiology, Volume 3, Editor: J. Lederberg, San Diego, Academic Press Inc.
Madison, J. B., A. M. Merritt, B. Rise, G. A. Donovan, G. D. Lester and T. Tran. 1993. Influence of an abrupt change in diet on antroduodenal myoelectric activity in lactating cattle. American Journal of Veterinary Research 54, 793-797.
Martens, H. 2000. Relations between feeding, physiology of the forestomacs and pathogenesis of abomasal displacement. In Ätiologie, Pathogenese, Diagnostik, Prognose, Therapie und Prophylaxe der Dislocatio abomasi, Proceedings Internationaler Workshop (In German, English summary). Leipzig 14 Oktober 1998. Editor: M. Fürll, Leipzig, Leipziger Universitätsverlag.
Sarashina, T., S. Ichijo, J. Takahashi and S. Osame. 1990. Origin of Abomasum

92
Gas in the Cows with Displaced Abomasum. Japanese Journal of Veterinary Science 52, 371-378.
Stöber, M. 1961. Die Technik der Labmageninjektion beim Rind. Deutsche Tierärztlicher Wochenschrift (In German, English summary) 3, 72-75.
Svendsen, P. 1969. Etiology and pathogenesis of abomasal displacement in cattle. Nordisk Veterinaer Medicin 21, Supplement I, 1-60.
93
Chapter Eight
General discussion

94
Introduction As mentioned in the general introduction of this thesis, risk factors for displacement of the abomasum are related to etiological (causative) factors. In the following part results of the research presented in this thesis are evaluated and linked with the pathogenesis of DA. There are six main risk factors reported in the general introduction: ration of dry cows, ration of milking cows, roughage-to-concentrates ratio of the ration fed to milking cows, reduced feed intake in milking cows, the negative energy balance, and the presence of lameness, mastitis or endometritis. The ration of milking cows incorporates the roughage-to-concentrates ratio of the ration fed to milking cows and reduced feed intake in milking cows, for that reason these two factors are discussed in the part concerning the ration of milking cows. In the following part the risk factors are linked with the pre-clinical alterations observed in cows that develop DA.
Figure 1 and Figure 2 are the same figures of the general introduction, but now the risk factors are linked to etiological factors that could lead to DA (Figure 1). These etiological factors are used and related to the pathogenesis of DA in Figure 2. In the following part these observations are discussed further.
Ration of dry cows As reported in Chapter Three, two factors concerning the ration of dry cows are related to a high incidence of DA; the dry cows in a herd with low incidence of DA were fed grass silage that was relatively low in energy density and the dry cows were fed hay or straw.
Dry cow management is of major importance for the reason that many of the postpartum disorders have their origin in the dry period. The dry cow period ration should consist of low energy (< 5.2 NEL) in order to prevent over-conditioning in the dry period (Centraal Veevoeder Bureau). As described in Chapter Six, obese cows have a high incidence of DA. Compared to their also obese counterparts, obese cows that develop DA have a reduced feed intake, lower concentrations of calcium, glucose and insulin. As presented in Figure 2, all parameters affect abomasal motility. Moreover the low glucose and insulin levels as well as the reduced feed intake could result in a lower tonicity of the vagal nerve. In addition, the amount of acid production in the abomasum has been shown to depend at least partially on the tone of the vagal nerve (Chapter Seven). Prevention of obese cows in the dry period is thus of significant importance.
Besides an excessive supply of energy to dry cows, over-supply of minerals could also occur. Milk fever or hypocalcaemia in the early milking period could be prevented by a restricted supply of calcium in the dry period, but this is in practice
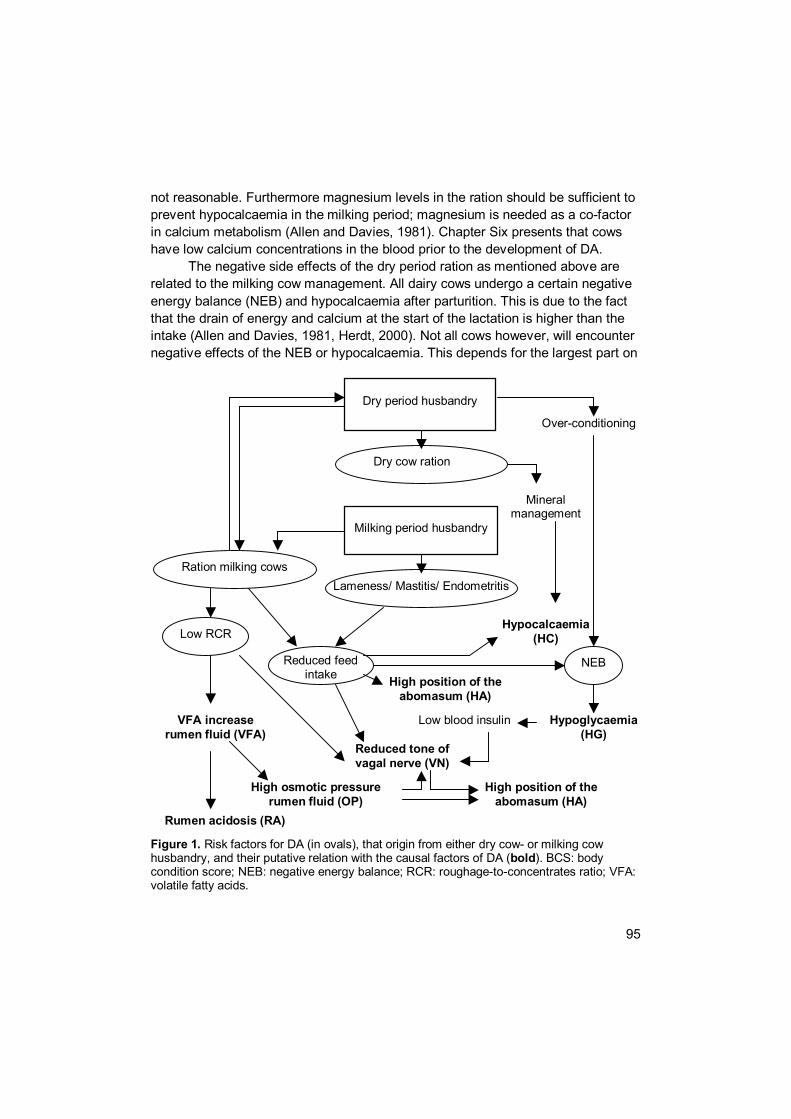
95
not reasonable. Furthermore magnesium levels in the ration should be sufficient to prevent hypocalcaemia in the milking period; magnesium is needed as a co-factor in calcium metabolism (Allen and Davies, 1981). Chapter Six presents that cows have low calcium concentrations in the blood prior to the development of DA.
The negative side effects of the dry period ration as mentioned above are related to the milking cow management. All dairy cows undergo a certain negative energy balance (NEB) and hypocalcaemia after parturition. This is due to the fact that the drain of energy and calcium at the start of the lactation is higher than the intake (Allen and Davies, 1981, Herdt, 2000). Not all cows however, will encounter negative effects of the NEB or hypocalcaemia. This depends for the largest part on Figure 1. Risk factors for DA (in ovals), that origin from either dry cow- or milking cow husbandry, and their putative relation with the causal factors of DA (bold). BCS: body condition score; NEB: negative energy balance; RCR: roughage-to-concentrates ratio; VFA: volatile fatty acids.
Dry period husbandry
Milking period husbandry
Over-conditioning
Mineral management
NEB
Lameness/ Mastitis/ Endometritis
Reduced feed intake
Low RCR
Ration milking cows
Dry cow ration
Hypocalcaemia (HC)
Hypoglycaemia (HG)
High position of the abomasum (HA)
Reduced tone of vagal nerve (VN)
Low blood insulin VFA increase rumen fluid (VFA)
High osmotic pressure rumen fluid (OP)
High position of the abomasum (HA)
Rumen acidosis (RA)

96
whether the feed intake of postpartum cows remains undisturbed. If the cow does not stop eating, hypocalcaemia and NEB are not an issue. The biggest concern is thus the cow’s feed intake. Tastiness and the availability of the feed stuff influence the feed intake of a cow. This can be influenced in the dry period. In the dry period cows should be fed the same ration as the milking cows, at least the last two weeks. The cow and her rumen micro-flora can adapt to the lactation feed stuffs and this results in a good feed intake after calving (Shaver, 1997). Furthermore it is important that social stability should be present before calving. A cow should be able to obtain a position in the social structure prior to calving so she does not have to fight her position when she is at the weakest: directly after calving; this also Figure 2. Flow of digesta (thick arrows) from rumen into abomasum, which could result in production of gas in the abomasum. The abomasum can either dislocate temporarily (floater) or the displacement is permanent (DA). The causative factors that can disturb the balance of gas production and gas elimination of the abomasum are mentioned between brackets. The abbreviations are similar to the abbreviations used in Figure 1.
CO2
Omasum fluid Abomasum
CH4
HCO3
-
Rumen fluid
GAS in abomasum
Displaced Abomasum
(permanent)
Healthy cow
Floater
(temporary)
CH4
H+
Fermentation: Production (VFA: +)
Absorption: (RA: -)
(VN: -)
Fermentation continues: (VN, RA: -)
HA: collection of gas in blind pocket of the abomasal lumen
Motility and absorption fails
(VN, OP, VFA, HC, HG and E:
reduced motility)
Motility and absorption fails
(VN, OP, VFA, HC, HG, and E: reduced motility)
97
affects feed intake. Both the ration and the social adaptation process are the best when cows enter the milking group two weeks prior to the expected calving date. As a recommendation the following could be suggested: give the dry cows sufficient roughage in the ration, limit the energy (< 5.2 NEL), sufficient magnesium levels of the ration, and let the dry cow adapt to the ration and social structure two weeks before calving.
Ration of milking cows
Roughage-to-concentrates ratio In the ration of milking cows the supplied concentrates play an important role. Feeding concentrates enables the cow to produce more than 25 litres milk per day. However, the balance between the feeding of concentrates and the health of the animal is subtle: feeding large amounts of concentrates (>11 kg) is related to high incidence of DA. The possible negative effects of concentrates fed to dairy cows should be discussed in combination with the intake of roughage: feeding roughage restrictedly also relates to high incidence of DA (Chapter Three). However, the negative effects of concentrates can be diminished by feeding these concentrates by means of an automate (Chapter Three).
The effect of feeding a high level of concentrates, relative to roughage, is that large amounts of VFA are produced (Martens, 2000). High levels of VFA lead to high osmolality (>350 mmol/kg) of the rumen fluid. This high osmotic pressure results in a flux of water into the rumen. This could lead to an overflow of fluid in the abomasum, which could result in extension of the abomasum. When this extension becomes too large, the abomasal motility will decline due to vagal interference (Martens, 2000). The extension of the abomasum as a result from high osmolality of rumen contents, however, is not a sole or satisfactory explanation. Osmotic pressure values described in Chapter Five were not as high as Martens’ hypothesis (2000), who reported that only values above 400 mmol/kg would have adverse effects on abomasal physiology.
An effect of low roughage-to-concentrates ratio of the ration is low roughage content in the rumen. This results in less saliva production that contains bicarbonate, and less bicarbonate secretion by the rumen epithelial cells (Allen, 1997). The decrease in bicarbonate production leads to poorly buffered rumen ecology, leading to more severe pH fluctuations (Allen, 1997). The pH fluctuation of the rumen contents depends also on the amounts of volatile fatty acid (VFA) and lactic acid that is produced in the rumen. In Chapter Seven the possible effects of rumen acidosis on the pH of the abomasal contents are reported. Literature

98
reviews that rumen acidosis could result in a rising pH of the abomasal contents. This could lead to continuation of fermentation in the abomasum. The gas that is produced by the fermentation process can result in DA.
Another explanation could be the finding that cows with high osmotic pressure of rumen fluid in the first week after calving have a slow declining position of the abomasum after calving (Chapter Four). A high positioned abomasum could increase the accumulation of gas. In Chapter Five it is reported that the abomasum is higher positioned at the left side of the abdomen in cows that later will develop DA. This would imply that cows with high osmolality of the rumen contents are more at risk for development of DA and this risk is present for a longer period.
The experiment described in Chapter Five revealed that prior to the development of the DA cows have, relative to cows that do not develop DA, lower roughage-to-concentrates ratio of their voluntary feed intake. In the epidemiological survey is reported that a high amount of the maximum concentrates fed is associated with high incidence of DA, which is in agreement with the pre-clinical finding and with previous research (Shaver, 1997). The fact that automatic supply of concentrates reduces the negative side effects of concentrates may be explained by the production of VFA. The peak concentration of VFA is lower, resulting in lower osmotic values and less low pH values of the rumen contents. These cows have a more constant feed intake and the total feed intake is higher (Allen, 1997). Reduced feed intake A well-filled rumen is assumed to keep the abomasum in the right-ventral part of the abdomen (Dirksen, 1962). Staufenbiel (2002), who reports spontaneous occurring DA after feed depravation, also reports this. These DA disappeared again after feeding and had thus a similar character as we found in Chapter Five. In Chapter Four it is reported that the position is related to the total feed intake: the more feed is ingested, the lower is the position of the abomasum. Furthermore in Chapter Five it is concluded that a DA is preceded with a higher position at the left side.
The feed intake also has an effect on the flow in the digestive tract: low feed intake relates to lower passage of digested feed (Okine and Mathison, 1991). This suggests a reduced flow or motility of the abomasum, and can be part of the causal pathway in the cow that had a reduced feed intake prior to DA (Chapter Six). Another effect of the reduced feed intake prior to DA is a lowered concentration of calcium in the blood. This could result in lower motility of the abomasum, so an accumulation of gas will not be eliminated easily. The final effect of the decreased feed intake is the severity of the negative energy balance. This is discussed

99
hereafter. Advice to the dairy cattle owner concerning the ration of dairy cows: first, supply tasty and fresh feed stuffs to the dairy cows. The cows should be adapted to the roughage that is supplied and if a change of ration occurs, e.g. another silage clamp is fed, let the cows adapt gradually (in a week time) to the different feed stuff. Secondly, concentrates should be fed by means of an automate, or mixed with the total ration. This reduces the negative side effects of the concentrate supply. Finally, the dairy herdsman/- owner has to pay attention to the postpartum cows, it is important that cows always have fresh, high quality roughage available and the farmer should be sure that every postpartum cow eats enough. For accomplishing this, there should be enough feeding space and concurrent diseases should be treated as soon as they are noticed or, rather prevented.
Negative energy balance in lactating cows In earlier work Heuer (2000) reports that over 50 percent of the DA cases are associated with ketosis prior to DA. This suggests a major role of NEB in the pathogenesis of DA. There are reports suggesting that cows in severe negative energy balance undergo metabolic stress, this could result in a depletion of the sum of antioxidants. This presumed lack of antioxidants could play a role in the pathogenesis of DA. The fact that DA-cows have no significant lower antioxidant status prior to diagnosis suggests that there is another, more important pathway (Fürll et al., 2001).
In cows with severe negative energy balance, DA-cows differed from cows that did not develop DA (Chapter Six). The DA-cows had higher concentrations of beta-hydroxybutyric acid and non-esterified fatty acid in the blood and lowered concentrations of insulin and glucose. Possibly cows that develop DA are less adapted to the change in energy demand. Also, these cows do not eat as much as their healthy counterparts. This results in low glucose and insulin levels and high concentrations of BHBA and NEFA. The pathway of action could be through vagal mediated poor abomasal contractility and acid production. Regarding the negative energy balance the following suggestions are made for preventing the severe negative energy balance: prevent over-feeding and over-conditioning of dry cows and make sure that postpartum cows keep up a good feed intake.
100
Further research This thesis presents pre-clinical changes in cows developing DA. These changes are found in studies in which DA is induced, without a control diet. In further research the study should take place with a control diet with sufficient animals per group (at least 20). These experiments could generate advice for feeding practice in order to prevent high incidence of DA. During the experiments causative factors should be evaluated. Besides variables concerning the NEB, endotoxins and radicals could be evaluated. When discriminating variables are distracted an in vitro study can confirm the causative relation. With these in vitro studies emphasis should be made on the production of both carbon dioxide and methane, the absorption of those gasses by the abomasal wall, and the effects on the contractility of the abomasal wall.
By monitoring milk, blood, rumen and abomasal fluid a predictor of DA could be distracted. This predictor might be used in dairy practice to identify animals that are at high risk for DA. The indicator should be easy to access and cheap.
Final remarks The pre-clinical changes indicate that cows that will develop DA could be detected before final disease occurs. There are some uncertainties still present, since in this thesis no strong causal factors are presented. But even without causal relations, the present knowledge can be used to largely prevent DA. By optimising the ration in the dry period (prevent obese cows), facilitate the adaptation process of the lactating cow (socially and nutritionally by adding dry cow two weeks before the estimated calving date) and optimise postpartum feed intake (prevent concurrent diseases, sufficient supply of proper feed stuffs), the problem regarding displacement of the abomasum might be reduced to a minimum.
References Allen, W. M. and D. C. Davies 1981. Milk fever, hypomagnesaemia and the
‘downer cow’ syndrome. British Veterinary Journal 137, 435-441. Allen, M. S. 1997. Relationship between fermentation acid production in the rumen
and the requirement for physically effective fiber. Journal of Dairy Science 80, 1447-1462.
Dirksen, G. 1962. Die Erweiterung, Verlagerung und Drehung des Lebmages beim Rind, Berlin and Hamburg, Verlag Paul Parey. pp 121.
Centraal Veevoeder Bureau. Voedernormen landbouwhuidieren en voederwaarde

101
veevoeders, verkorte tabel 1998, CVB-reeks nr.24, august 1998 (In Dutch). Fürll, M, M. N. Dabbagh, H. Kirbach, C. Nauruschat, T. Sattler and H. Wilken 2001.
The anti-oxidative state before and after a diagnosed abomasal displacement in cows. Program and Abstracts 11th International Conference on Production Diseases in Farm Animals, Frederiksberg 12-16 August 2001. Editor: Agger, J. F. and N. Toft., Frederiksberg.
Herdt, T. H. 2000. Ruminant adaptation to negative energy balance, influences on the etiology of ketosis and fatty liver. Veterinary Clinics of North America: Food Animal Practice 16, 215-230.
Heuer, C. 2000. Negative energy balance in dairy cows- prediction, consequences, prevention. Ph.D. thesis Utrecht University, pp165-189.
Martens, H. 2000. Relations between feeding, physiology of the forestomacs and pathogenesis of abomasal displacement. In: Ätiologie, Pathogenese, Diagnostik, Prognose, Therapie und Prophylaxe der Dislocatio abomasi, Proceedings Internationaler Workshop. Leipzig 14 Oktober 1998. Editor: Fürll, M., Leipzig, Leipziger Universitätsverlag. pp81-101.
Okine, E. K. and G. W. Mathison. 1991. Effects of feed intake on particle distribution, passage of digesta, and extent of digestion in the gastrointestinal tract of cattle. Journal of Animal Science 69, 3435-3445.
Shaver, R. D. 1997. Nutritional risk factors in the etiology of left displaced abomasum in dairy cows: a review. Journal of Dairy Science 80, 2449-2453.
Staufenbiel, R. 2002. Ansätze zur Profhylaxe der Labmageverlagerung. http://www.vetmed.fu-berlin.de/klauentierklinik/index.html: Lehre/ Spezielle Themen.

102

103
Nederlandse
samenvatting
104
Inleiding Dit proefschrift is een verslag van een onderzoek naar lebmaag verplaatsingen bij melkkoeien. Lebmaag verplaatsingen zijn reeds enkele decennia bekend bij met name melkkoeien. De normale, gezonde lebmaag ligt onder in de buikholte bij herkauwers. Als gevolg van gasophoping in de lebmaag zal deze gaan “drijven” in de buikholte: de lebmaag raakt verplaatst. Deze verplaatsing kan naar links of naar rechts optreden en treedt met name op in de eerste vier weken na het kalveren. Dit heeft voor de veehouder financiële gevolgen: het dier produceert minder melk en zij moet behandeld worden door een dierenarts. Deze behandeling kan, afhankelijk van de situatie -zoals de waarde van de koe- op verschillende manieren gebeuren, met elk verschillenden kosten en resultaten. Bij de behandeling speelt ook de voorkeur van de veehouder en de dierenarts een belangrijke rol.
Het vóórkomen van lebmaagdislocaties (LD) is aan het toenemen, kreeg tien jaar geleden nog maar twee van de 100 koeien die afkalfde een LD, nu is dit gestegen naar vijf. Dit is het gevolg van het stijgen van de melkproductie en, als gevolg hiervan, veranderingen in de voeding. De oorzaak van de LD is tweeledig: een verminderde transport capaciteit van de lebmaag en/ of een verhoogde gasproductie in de lebmaag.
Het onderzoek bestaat uit twee delen. Ten eerste is een veldstudie beschreven waarin bedrijven met veel en met weinig lebmaag verplaatsingen met elkaar zijn vergeleken. Hierbij zijn risicofactoren voor lebmaag verplaatsing naar voren gekomen. Deze risicofactoren zijn vervolgens gekoppeld aan etiologische (oorzakelijke) factoren. Dit is gedaan met in het achterhoofd het gegeven dat risicofactoren via de etiologische factoren met het probleem lebmaagdislocaties zijn verbonden. Deze etiologische factoren zullen wellicht veranderen vóórdat er een verplaatsing van de lebmaag optreedt. Het doel van het onderzoek was om deze veranderingen vast te stellen. Dit omdat mogelijk deze veranderingen als voorspeller zouden kunnen fungeren bij het vroegtijdig opsporen van lebmaagverplaatsingen. Dit is gedaan in twee dierexperimenten.
Rantsoen van de droge koeien Uit het veldonderzoek is gebleken dat er twee risico factoren zijn in het rantsoen van de droge koeien. De droge koeien moeten voldoende ruw vezelig voer krijgen. Daarnaast moeten de dieren niet te vet worden in de droogstand. Dit laatste is om te voorkomen dat de dieren na het afkalven te weinig voer opnemen en een te ernstige negatieve energiebalans ondergaan. Gebleken is dat dieren (met vervette lever) die een lebmaagverplaatsing gaan krijgen een verminderde voeropname en melkproductie hebben. Van de onderzochte bloedwaarden is gebleken dat de

105
serum glucose, insuline en calcium concentraties in deze dieren verlaagd zijn, terwijl de ketonlichamen (beta-hydroxyboterzuur) en de vrije vetzuren (non-esterified fatty acids) juist verhoogd zijn. Waarschijnlijk hebben dieren die een lebmaagverplaatsing gaan krijgen meer problemen met de verandering in omgeving en rantsoen die is opgetreden na het afkalven. Ze hebben een adaptatie probleem. Als advies kan worden gegeven: de dieren in de droogstand voldoende vezelig ruwvoer met een beperkte energie waarde (minder dan 750 VEM) te geven. De droge koeien mogen niet te vet worden met oog op de negatieve energiebalans die in de lactatieperiode volgt.
Rantsoen van de melkkoeien Bij het rantsoen voor de melkkoeien is een belangrijke rol weggelegd voor het krachtvoer aandeel. Uit het dierexperimenteel onderzoek is gebleken dat dieren die een lebmaagverplaatsing gaan krijgen een hogere krachtvoer-ruwvoer verhouding in het opgenomen voer hebben. Dit houdt in dat de dieren in verhouding meer krachtvoer dan ruwvoer opnemen dan hun gezond blijvende koppelgenoten. Het gevolg hiervan kan zijn dat er hogere concentraties aan vluchtige vetzuren en meer schommelingen in de pH van de pensvloeistof ontstaan. Deze veronderstelling wordt deels gesteund door de bevinding dat de osmolariteit in de pensvloeistof hoger is bij dieren die een lebmaagverplaatsing gaan krijgen.
Naast een verhoogde krachtvoer-ruwvoer verhouding is er tevens aangetoond dat de dieren minder vreten alvorens een lebmaagverplaatsing optreedt. Als gevolg hiervan, en van de verhoogde osmolariteit van de pensvloeistof, neemt de lebmaag een hogere positie in vóórdat er klinische symptomen zijn. Belangrijk is dus in het kader van preventie van lebmaagverplaatsingen dat de dieren genoeg en smakelijk ruwvoer aangeboden krijgen. Hierdoor blijft de ruwvoeropname gewaarborgd en blijft hierdoor de krachtvoer-ruwvoer verhouding laag. Het (ruw)voer dat ter beschikking is gesteld aan de melkkoeien dient vers en fris te zijn. Tevens moet dit voer regelmatig worden aangeschoven of aangevuld.
Slotopmerking Het is gebleken dat koeien die een lebmaagverplaatsing gaan krijgen reeds merkbare veranderingen hebben vóórdat het dier waarneembaar ziek is van de

106
lebmaagverplaatsing. Dit zou mogelijk kunnen zijn door effecten van een sub-klinische lebmaagverplaatsing. Door er voor te zorgen dat de dieren niet te vet worden tijdens de droogstand en goed blijven vreten in de vroege lactatie periode kan het probleem lebmaagverplaatsingen op melkveebedrijven beperkt worden.

107
Dankwoord
en
Curriculum Vitae

108
109
Dankwoord Een proefschrift schrijven is een proces waarbij aan een legio van randvoorwaarden voldaan moet worden om het te kunnen afronden. Hierbij komen mensen, dieren en dingen kijken die als zodanig niet zijn te benoemen. Deze vergeet ik dan ook te noemen, aangezien ik niet kan zeggen wie of wat deze zijn geweest. Zij hebben ervoor gezorgd dat de omstandigheden goed waren en maakten het mogelijk dit werk af te maken.
Natuurlijk zijn er ook wèl mensen, dieren en dingen te definiëren die een substantiële bijdrage hebben geleverd aan dit resultaat:
Proefdieren die zichzelf, zij het onwetend, hebben laten plagen door mijn manipulaties. Een geruststellend idee is dat geen van de beesten het leven heeft gelaten tijdens de proeven. Daarnaast wil ik de meewerkende dierenartsen en rundveehouders bedanken voor het kunnen houden van een epidemiologisch veldonderzoek.
Dierverzorgers voor het voeren, melken en verzorgen van de proefkoeien tijdens de experimenten. Zonder jullie bijdrage was dit proefschrift zo goed als leeg geweest. Laboratorium medewerkers voor hun analyses en steun bij de uitvoering van mijn eigen analyses. Het was erg lastig en onmogelijk geweest om zonder jullie hulp tot de huidige beschreven uitspraken te komen.
Samenwerkende dierenartsen en leden van de patiëntenadministratie, ik heb regelmatig mijn onmacht op jullie botgevierd, dat was oneerlijk maar toch heerlijk en daarvoor mijn misplaatste excuses en dank. Jullie hebben een incasserings-vermogen waar Mohammed Ali trots op zou zijn. Daarnaast heb ik ook van jullie veel geleerd, over collegialiteit en vakinhoudelijke dingen, en dat mag ook wel eens gezegd worden.
Chris Brattinga en Martijn Hoogeslag, jullie hebben beide (afzonderlijk van elkaar) een zeer grote bijdrage geleverd aan dit proefschrift. Door jullie beider meedenken en meewerken ben ik erg gegroeid, in data sets en kennis.
Kerstin Müller, voor de grondigheid die je me hebt proberen bij te brengen. Jouw verassende inzichten in het fenomeen koe hebben bij mij veel nieuwe ideeën opgeleverd. En Thomas Schonewille, jouw kennis over voeding van rundvee gaat vaak het geschrevene te boven. Je hebt me bijgebracht dat alles is te analyseren en te berekenen, maar het moet uiteindelijk toch in het dier zelf gebeuren, of juist niet.
Anton Beynen en Jos Noordhuizen, jullie zijn de personen die het inhoudelijk en organisatorisch mogelijk hebben gemaakt om dit proefschrift te laten worden wat het nu is, promotoren: bedankt.
En natuurlijk de mensen die het uiteindelijk werkelijk mogelijk hebben gemaakt: mijn ouders, broer en zussen, vrienden en vriendinnen. Jullie hebben me op de wereld gezet en me gemaakt wie ik nu ben. Ik ben daar zeer dankbaar voor.

110
Tenslotte: van te voren bedanken is lastig, maar het is voor mij een geruststellende gedachte dat mijn paranimfen, Jan Lievaart en Rogier Kuiper, mij in de tijd van verdediging bijstaan. Bedankt dat jullie je bereid vonden om je beschikbaar te stellen voor deze belangrijke taak.

111
Curriculum Vitae Steven van Winden werd geboren op 4 december 1970 te Pijnacker. Bij het opgroeien werd hij dagelijks geconfronteerd met koeien, hetgeen veel invloed heeft (gehad) op zijn verdere leven. Na het voltooien van het Voorbereidend Wetenschappelijk Onderwijs in 1989 aan het Alfrink College te Zoetermeer, is hij in één keer ingeloot voor de studie diergeneeskunde aan de Universiteit Utrecht. Na het afronden van deze studie in 1996, is hij gaan werken bij de Vakgroep Inwendige Ziekten en Voeding der Grote Huisdieren. Bij de reorganisatie in 1999, heeft hij gekozen voor de geneeskunde van herkauwers; tot heden wekt hij bij de Afdeling Gezondheidszorg Herkauwers van de Hoofdafdeling Gezondheidszorg Landbouwhuisdieren. Bij deze hoofdafdeling heeft hij tevens de opleiding tot veterinair epidemioloog gevolgd. Per december 2002 zal hij gaan werken bij Stichting Instituut voor de Veevoeding “de Schothorst” in Lelystad. Steven van Winden was born on December 4, 1970 in Pijnacker, the Netherlands. While growing up he was frequently confronted with cattle, which has influenced his path of life. In 1989 he passed his exams at the Alfrink College (high school) in Zoetermeer. Since 1989 he studied Veterinary Medicine at the Utrecht University. Following graduation in 1996, he worked at the Department of Large Animal Medicine and Nutrition at the Utrecht University. During a reorganisation in 1999 he chose for cattle health care; up to this moment he has been working at the Ruminant Health Unit of the Department of Farm Animal Health. At the same department he obtained the degree of M.Sc. for Veterinary Epidemiology. He will be working at the Institute for Animal Nutrition “de Schothorst” in Lelystad from December 2002.

112