dislocation modelling of the 1987 edgecumbe earthquake, new zealand
TRANSCRIPT

This article was downloaded by: [The Aga Khan University]On: 09 October 2014, At: 17:53Publisher: Taylor & FrancisInforma Ltd Registered in England and Wales Registered Number: 1072954 Registered office: Mortimer House,37-41 Mortimer Street, London W1T 3JH, UK
New Zealand Journal of Geology and GeophysicsPublication details, including instructions for authors and subscription information:http://www.tandfonline.com/loi/tnzg20
Dislocation modelling of the 1987 Edgecumbeearthquake, New ZealandDesmond J. Darby aa Department of Scientific and Industrial Research , New Zealand Geological Survey , P OBox 30 368, Lower Hutt , New ZealandPublished online: 05 Jan 2012.
To cite this article: Desmond J. Darby (1989) Dislocation modelling of the 1987 Edgecumbe earthquake, New Zealand, NewZealand Journal of Geology and Geophysics, 32:1, 115-122, DOI: 10.1080/00288306.1989.10421394
To link to this article: http://dx.doi.org/10.1080/00288306.1989.10421394
PLEASE SCROLL DOWN FOR ARTICLE
Taylor & Francis makes every effort to ensure the accuracy of all the information (the “Content”) containedin the publications on our platform. However, Taylor & Francis, our agents, and our licensors make norepresentations or warranties whatsoever as to the accuracy, completeness, or suitability for any purpose of theContent. Any opinions and views expressed in this publication are the opinions and views of the authors, andare not the views of or endorsed by Taylor & Francis. The accuracy of the Content should not be relied upon andshould be independently verified with primary sources of information. Taylor and Francis shall not be liable forany losses, actions, claims, proceedings, demands, costs, expenses, damages, and other liabilities whatsoeveror howsoever caused arising directly or indirectly in connection with, in relation to or arising out of the use ofthe Content.
This article may be used for research, teaching, and private study purposes. Any substantial or systematicreproduction, redistribution, reselling, loan, sub-licensing, systematic supply, or distribution in anyform to anyone is expressly forbidden. Terms & Conditions of access and use can be found at http://www.tandfonline.com/page/terms-and-conditions
New Zealand Journal of Geology and Geophysics, 1989, Vol. 32: 115-122 115 0028-8306/89/3201-D115 $2.50/0 © Crown copyright 1989
Dislocation modelling of the 1987 Edgecumbe earthquake, New Zealand
DESMOND J. DARBY New Zealand Geological Survey Department of Scientific and Industrial Research POBox 30368 Lower Hult, New Zealand
Abstract Geodetic observations made before and after the 1987 March 2 Edgecumbe earthquake have been inverted to deduce for that event the parameters of arectangular dislocation model with uniform slip. Despite the effects on the vertical data of near-surface compaction during shaking. and ground damage, the results are consistent with geological and seismic information. Solutions can be found for all parameters of the unconstrained problem, but to maintain agreement with geological observations, the strike can be constrained at 0550
•
The remaining parameters are then estimated as: normal dipslip:::: 2.7 ± 0.4 m (with insignificant strike-slip), dip = 39 ± 30 to the nonhwest, length = 13 ± 1 km, depth to top edge = 0.6 ± 0.2 km, depth to bottom edge = 6.4 ± 1.0 km. The inferred moment is 8.5 X 10¹⁸ N m corresponding to a moment magnitude of 6.6.
Keywords Edgecumbe earthquake; inverse problem; fault model
INTRODUCTION
The 1987 March 2 Edgecumbe earthquake provided an opportunity, unique in New Zealand, of inferring from horizontal and vertical geodetic measurements precise static dislocation parameters as a model for the rupture surface. The uniqueness arose because the affected region is sufficiently inland and accessible to have been traversed by geodetic measurements, and because those measurements were made (Crook & Hannah 1988; Blick & Flaherty 1989, this issue).
The dislocation model consists of uniform slip on a rectangular planar segment of a fault with top and bottom edges parallel to the ground surface. The segment is embedded in an elastic half-space which is assumed to be a Poisson solid (e.g., Mansinha & Smylie 1971).
Though the inversion can operate for the completely unconstrained problem, it is preferable to incorporate the geological information of fault strike. This, together with the use of vertical data, results in a more realistic model than the one presented by Crook & Hannah (1988). They used the same procedure (developed by the present author and discussed below), but with horizontal data only. Their purpose was to provide a simple characterisation of the horizontal deformation, and the modelling worked well.
Received 29 June 1988; accepted 21 November 1988
DATA
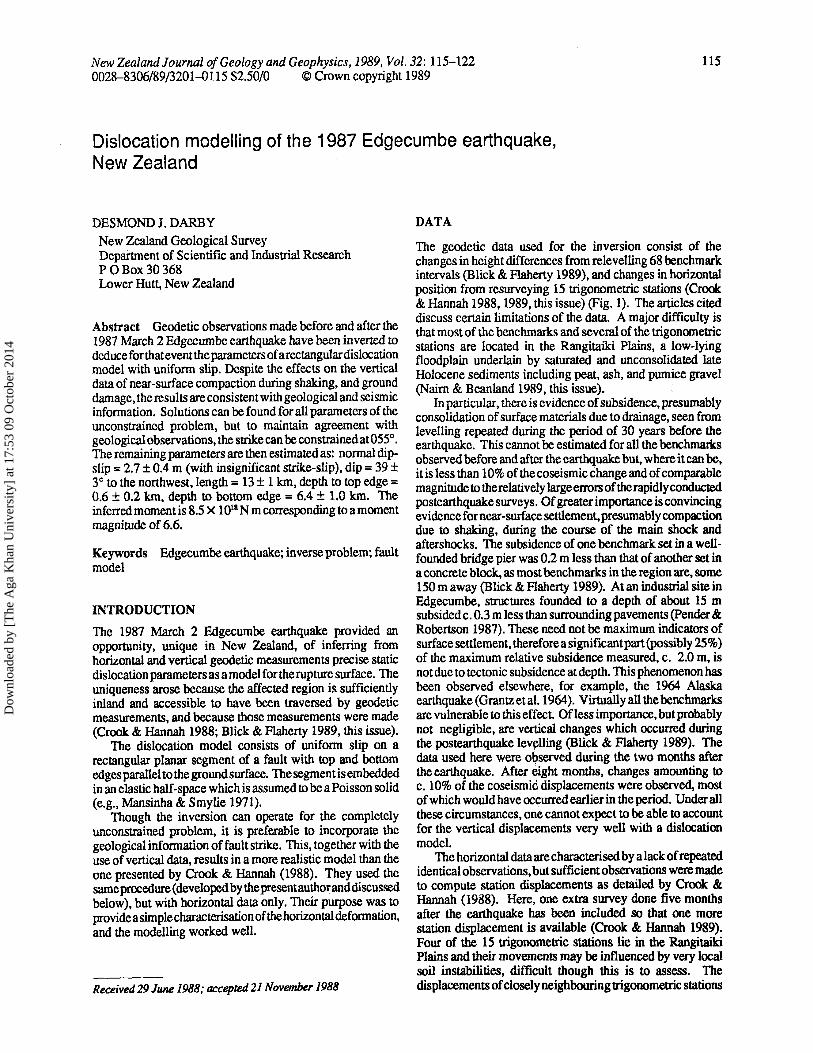
The geodetic data used for the inversion consist of the changes in height differences from relevelling 68 benchmark intervals (Blick & Flaherty 1989), and changes in horizontal position from resurveying 15 trigonometric stations (Crook & Hannah 1988, 1989, this issue) (Fig. 1). The articles cited discuss certain limitations of the data. A major difficulty is that most of the benchmarks and several of the trigonometric stations are located in the Rangitaiki Plains, a low-lying floodplain underlain by saturated and unconsolidated late Holocene sediments including peat, ash, and pumice gravel (Nairn & Beanland 1989, this issue).
In particular, there is evidence of subsidence, presumably consolidation of surface materials due to drainage, seen from levelling repeated during the period of 30 years before the earthquake. This cannot be estimated for all the benchmarks observed before and after the earthquake but, where it can be, it is less than 10% of the coseismic change and of comparable magnitude to the relatively large errors of the rapidly conducted posteanhquake surveys. Of greater importance is convincing evidence for near-surface settlement, presumably compaction due to shaking, during the course of the main shock and aftershocks. The subsidence of one benchmark set in a wellfounded bridge pier was 0.2 m less than that of another set in a concrete block, as most benchmarks in the region are, some 150 m away (Blick & Flaherty 1989). At an industrial site in Edgecumbe, structures founded to a depth of about 15 m subsided c. 0.3 m less than surrounding pavements (pender & Robertson 1987). These need not be maximum indicators of surface settlement, therefore a significant pan (possibly 25%) of the maximum relative subsidence measured, c. 2.0 m, is not due to tectonic subsidence at depth. This phenomenon has been observed elsewhere, for example, the 1964 Alaska earthquake (Grantz et a1. 1964). Virtually all the benchmarks are vulnerable to this effect. Ofless importance, but probably not negligible, are vertical changes which occurred during the postearthquake lev~lling (Blick & Flaherty 1989). The data used here were observed during the two months after the earthquake. Mter eight months, changes amounting to c. 10% of the coseismiC. displacements were observed, most of which would have occurred earlier in the period. Under all these circumstances, one cannot expect to be able to account for the vertical displacements very well with a dislocation model.
The horizontal data are characterised by a lack of repeated identical observations, but sufficient observations were made to compute station displacements as detailed by Crook & Hannah (1988). Here, one extra survey done five months after the earthquake has been included so that one more station displacement is available (Crook & Hannah 1989). Four of the 15 trigonometric stations lie in the Rangitaiki Plains and their movements may be influenced by very local soil instabilities, difficult though this is to assess. The displacements of closely neighbouring trigonometric stations
Dow
nloa
ded
by [
The
Aga
Kha
n U
nive
rsity
] at
17:
53 0
9 O
ctob
er 2
014
116 New Zealand Journal of Geology and Geophysics, 1989, Vol. 32
38°00'S
I I
l:/ I
I I .....
I
/
" I I I
l::J.' /
, , I -~
Fig.1 Benchmarks (open circles) and trigonometric stations (triangles) surveyed before and after the Edgecumbe earthquake. Letters a-g label principal portions of the levelling route, and Tl-T4 label trigonometric stations on the Rangitaiki Plains and those specifically referred to in the text. Surface ruptures due to the main shock and/or aftershocks are shown by solid lines and the approximate boundary of the Rangitaiki Plains is shown by a dashed line.
o 10km I I
l::J. Geographic scale
176°40' 177°00'E
Tl and 1'2 (Fig. 1) are not giving independent information about the model. They are therefore downweighted so that together they carry the weight of a single station. The horizontal displacement formulation, useful because of the diverse observational procedures, entails three datum deficiencies (two horizontal translations and one rotation). These must be estimated together with the dislocation model parameters. The scales of distance surveys before and after the earthquake seem sufficiently compatible that a scale parameter need not be estimated as well.
A factor affecting both benchmarks and trigonometric stations is their proximity to the major ground-surface damage. It is not the purpose of the dislocation modelling to describe deformation on scales less than the scale of elastic heterogeneities which are neglected in the uniform Poisson solid approximation. Apart from ground failure, there is considerable evidence for rapidly varying elastic properties in at least the top 1 or 2 kIn in various parts of the Rangitaiki Plains (Woodward pers. comm.; Stem & Davey 1985). Therefore, the displacement of any survey monument within lor 2 kIn of a surface rupture (Fig. 1) cannot be expected to conform well with dislocation model predictions.
The correlation of computed benchmark height changes is taken into account very crudely by fitting changes in height differences between fairly uniformly spaced (1-2 kIn) benchmarks rather than the vertical displacements themselves. This goes some way towards approximating independently observed quantities of similar variance, and eliminates the vertical datum deficiency. Currently available software does not provide the true covariance matrix of benchmark heights but it may not be very important The covariance matrix of computed horizontal displacements is available but it is not
used and also is probably not important. Crook & Hannah (pers. comm.) found for the horizontal data that the covariance had little effect on the final dislocation parameter solution. When model misfits exceed observational errors or show systematic trends, as they tend to do here, it may be more appropriate not to use the observational covariance matrix (at least not without modification). For example, the levelling misclosures of 3 mm X (dist [km])lf2 and 8 mm X (dist [km])1f2 for the pre-earthquake and postearthquake surveys are not as important as the compaction effects already discussed. The left side of Table 1 gives estimates of the precision of the data and a rough indication of the size of other effects which may contribute to modelling error. Relative weighting of the horizontal and vertical data sets also has to be determined. This may be done by reweighting and reiterating the solution procedure until estimates of the standard errors of unit weight for the two data sets become approximatel y equal. Op.e can expect, however, that the vertical data need to be downweighted because of the probable significant departures from model predictions.
Table 1 Data and modelling errors (in metres).
Expected Model residuals
Other Redundancy factors'" El E2
Horizontal 0.08 <0.02 0.05 0.08t Vertical 0.01 <0.05 0.29* 0.19
"'Monument instability or nontectonic subsidence. tDisplacement of T3 not used for models E2 and E3. * Vertical data not used for model El.
E3
0.12t 0.16
Dow
nloa
ded
by [
The
Aga
Kha
n U
nive
rsity
] at
17:
53 0
9 O
ctob
er 2
014
Darby-Dislocation modelling. Edgecumbe
MODELLING PROCEDURE
The planar dislocation model used here is fully described by nine parameters: the horizontal location of the fault segment. its dip and strike. its length. the depths to its top an~ botto~ edges. and the dip and strike componen~ of shp on l~. Formulas such as those of Mansinha & Smybe (1971) permIt the calculation of horizontal and vertical displacements of the ground surface for such a model. More complex models can be constructed by varying the slip distribution over the fault segment. or by introducing a bend in the segment to approximate a listric fault. Preliminary work shows that parameters corresponding to a lis~ic fault can beres~lved. but do not significantly improve the fIt to the data. I~ VI~W of the problems with the vertical data, complex modelhng IS fraught with difficulty, and only planar uniform slip models are presented here.
With the 9 model parameters, and 3 horizontal datum deficiencies, there are a total of 12 parameters to be estimated. The use of changes in height differences between benchmarks eliminates the vertical datum deficiency. The equations relating horizontal and vertical displacements to model parameters are nonlinear, and .the p~oblem is ~erefore t?at of iteratively solving locally lmeansed equanons ~nt11 ~e residuals are minimised; the process commences WIth a tnal set of parameters which can be guessed or inferred from geologi::al and seismic inform~tion. This ha~ been done,.for checking purposes, with two dIfferent algonthms. One IS a finite difference Levenberg-Marquardt method (Brown & Dennis 1972), and the other is another m~ified Ga~ssNewton method (Gill & Murray 1978). NeIther requtres expressions for derivatives of observed quantities with respect to model parameters. The latter seems to be particularly effective for the degree of ill-conditioning, with a condition number from 50 to 200, often encountered in this type of geodetic problem. Here, we can solve for all model parameters and none need to be constrained, even though it is prudent to fix one parameter, the strike of the fault.
DISLOCATION MODELS
Because of doubts about the influence of near-surface settlement on the levelling data, and stability of four of the horizontal stations, I have inspected model solutions from.the horizontal data set alone before incorporating the vertlcal data.
117
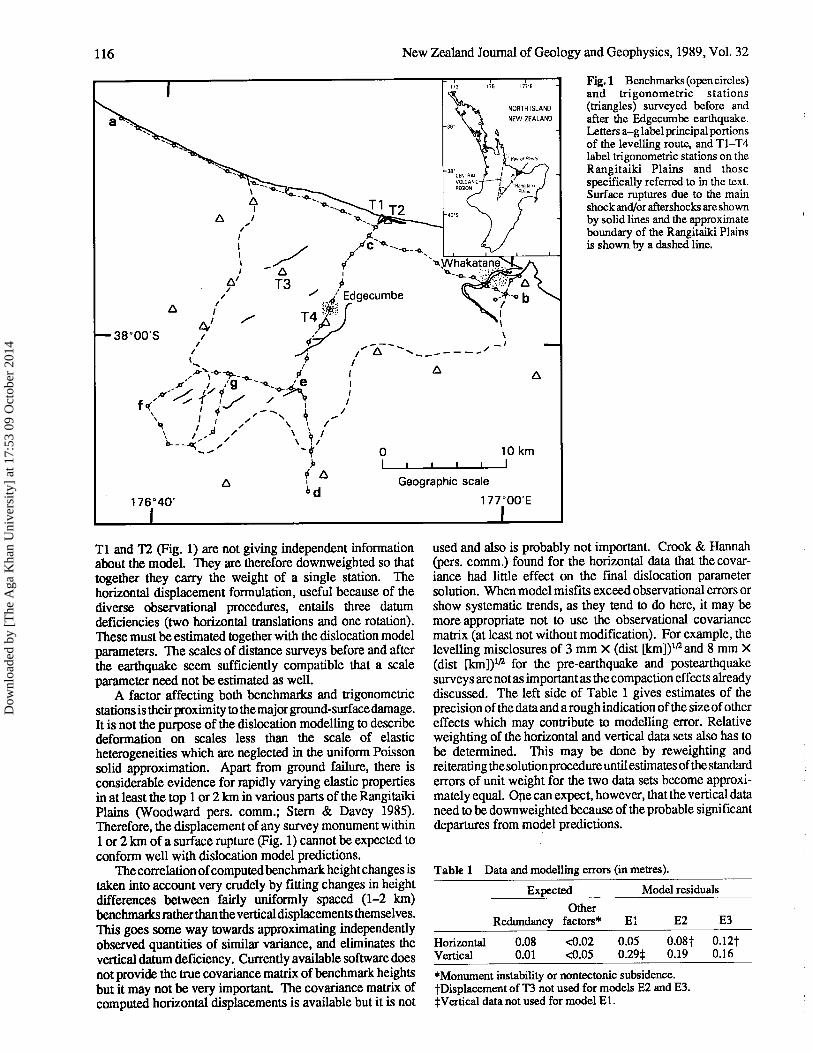
A solution, model El (Table 2), using hOrizon.tal data only, fits all horizontal displacements very well (FIg. 2A). The estimated standard error derived from the misfit of the model, 0.05 m, is slightly smaller than might be expected (Table 1). This model is of course very similar to the solution derived with the same algorithm and presented by Crook & Hannah (1988). Its depth range of 2.5-4.5 Ion is perhaps too small to represent faulting physically, and its strike is not consistent with the field observations of ground rupture, which also had negligible strike-slip components (Beanland et al. 1989, this issue). Remarkably, it predicts the location of some of the principal vertical changes along the levelling route (Fig. 2B). even though these data have n?t ~n used ~o find the solution. The root-mean-square mIsfIt shown 10
Table 1 is fairly large, but is not even an order of magnitude larger than the expected data error. Notwithstanding the difficulties of using the vertical data, they would therefore appear to be able to contribute to the determination of a more satisfactory model. .
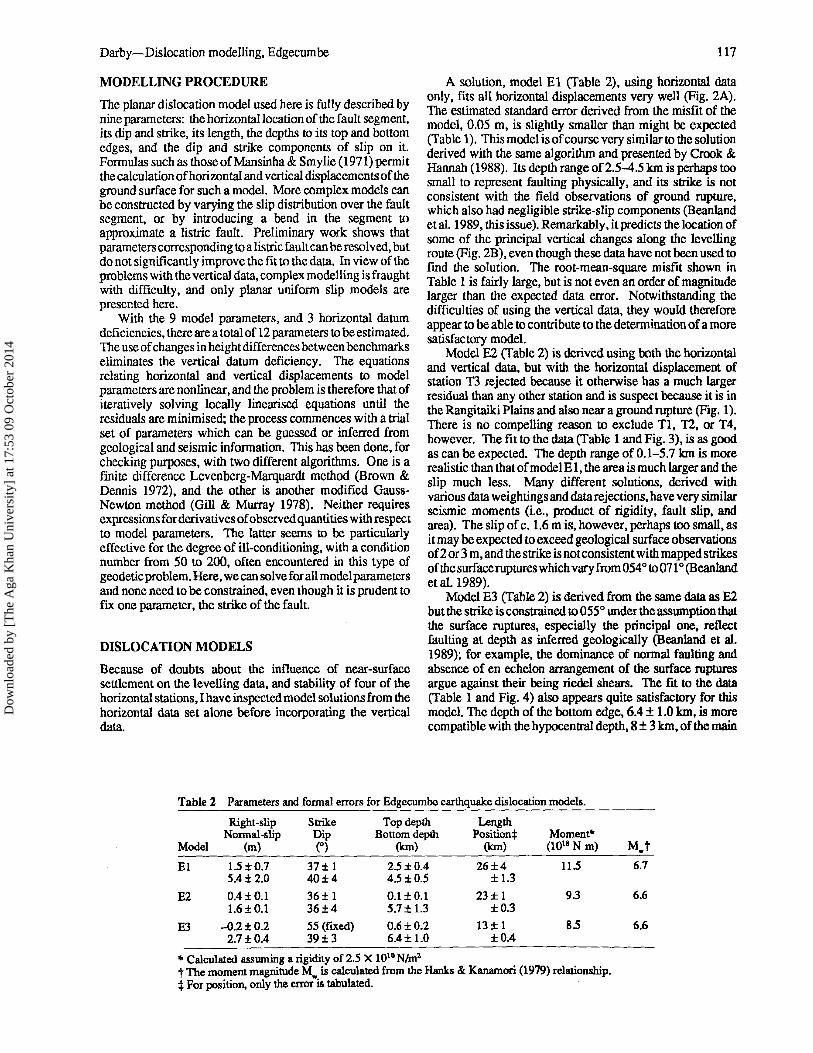
Model E2 (Table 2) is derived using both the honzontal and venical data, but with the horizontal displacement of station T3 rejected because it otherwise has a much larger residual than any other station and is suspect because i.t is in the Rangitaiki Plains and also near a ground rupture (FIg. 1). There is no compelling reason to exclude Tl, '1'2, or T4, however. The fit to the data (Table 1 and Fig. 3), is as good as can be expected. The depth range of 0.1-5.7 km is more realistic than that of model E 1, the area is much larger and the slip much less. Many different. so~utions, derived. ~ith various data weightings and datareJecnons, have very SimIlar seismic moments (Le .• product of rigidity, fault slip, and area). The slip of c. 1.6 m is, however, perhaps too small, as it may be expected to exceed geological surface observa~ons of2 or 3 m, and the strike is not consistent with mapped strikes of the surface ruptures which vary from 0540 to 0710 (BeanIand et al. 1989),
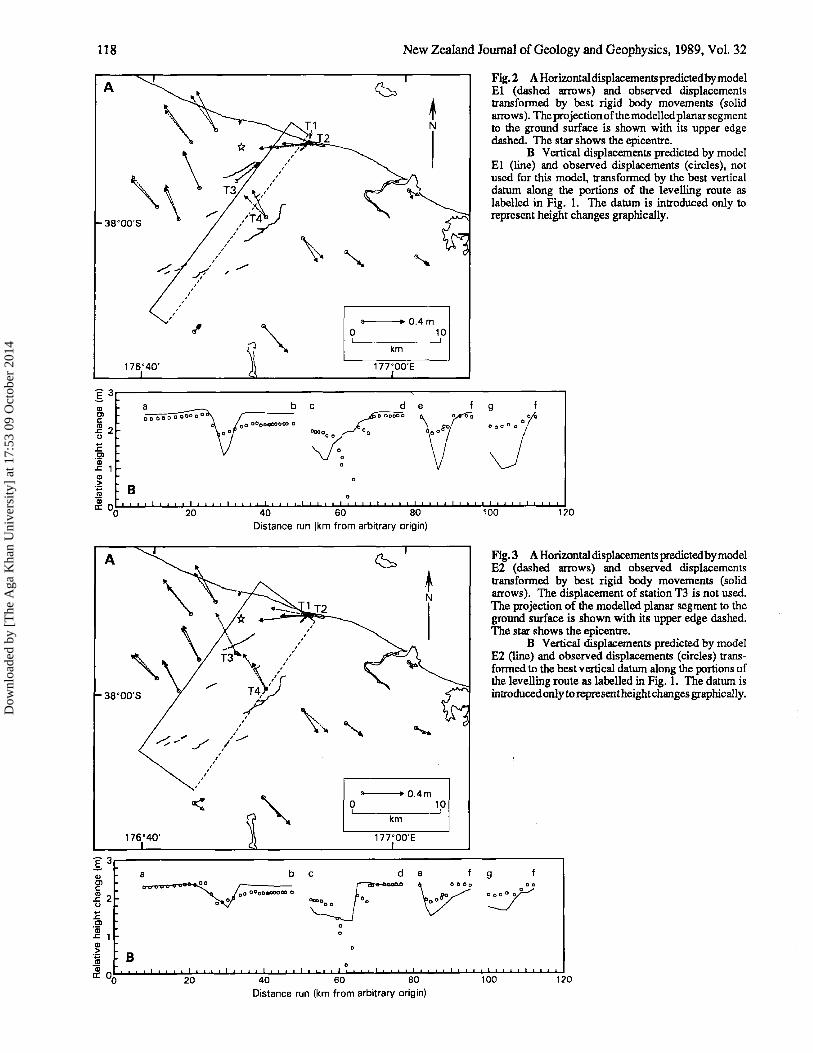
Model E3 (Table 2) is derived from the same data as E2 but the strike is constrained. lO 0550 under the assumption that the surface ruptures, especially the principal one, reflect faulting at depth as inferred geologically (Beanland et aI. 1989); for example, the dominance of normal faulting and absence of en echelon arrangement of the surface ruptures argue against their being riedel she~s. ~e fit to the ~ (Table 1 and Fig. 4) also appears qUIte sausfactory for this model. The depth of the bouom edge, 6.4 ± 1.0 kIn, is mo~e compatible with the hypocentral depth, 8 ± 3 kIn, of the maID
Table 2 Parameters and fonnal errors for Edgecumbe earthquake dislocation mOdels.
Model
El 1.5 ±O.7 37± 1 5.4±2.0 40±4
E2 0.4± 0.1 36± 1 1.6± 0.1 36±4
E3 -0.2 ± 0.2 55 (fixed) 2.7±OA 39±3
0.1 ± 0.1 5.7 ± 1.3
O.6±0.2 6.4± 1.0
Length Position;
23±l ±0.3
13± 1 ±O.4
9.3
8.5
* Calculated assuming a rigidity of 2.5 X lOHIN/ml •. • t The moment magnitude M ... is calculated from the Hanks & Kanamon (1979) relatIonship. ; For position, only the error is tabulated.
6.6
6.6
Dow
nloa
ded
by [
The
Aga
Kha
n U
nive
rsity
] at
17:
53 0
9 O
ctob
er 2
014
118 New Zealand Journal of Geology and Geophysics, 1989, Vol. 32
176°40'
1 3
Q) a Cl t: 00000000000
~ 2 t.l
1: Cl 'a; J::. Q)
> B .;::
III a; c:: 00 20
A
176°40'
2
o !
b c ,.-----
40 60
---.0.4m 10
!
km
177°00'E
80 Distance run (km from arbitrary origin)
<>-----+. 0.4 m o 10 , I
km
177°00'E
Fig.2 A Horizontal displacements predicted by model El (dashed arrows) and observed displacements transformed by best rigid body movements (solid arrows). The projection of the modelled planar segment to the ground surface is shown with its upper edge dashed. The star shows the epicentre.
B Vertical displacements predicted by model El (line) and observed displacements (circles), not used for this model, transformed by the best vertical datum along the portions of the levelling route as labelled in Fig. 1. The datum is introduced only to represent height changes graphically.
100 120
Fig.3 A Horizontal displacements predicted by model E2 (dashed arrows) and observed displacements transformed by best rigid body movements (solid arrows). The displacement of station T3 is not used. The projection of the modelled planar segment to the ground surface is shown with its upper edge dashed. The star shows the epicentre.
B Vertical displacements predicted by model E2 (line) and observed displacements (circles) transformed to the best vertical datum along the portions of the levelling route as labelled in Fig. 1. The datum is introduced only to represent height changes graphically.
13r--------------------------------------------------------. Q) abc d
Cl •• 00 ""'_ ~ ! 2 00.. ~OooooD--mD ~ 00
Cl 'a; '<:1 Q)
> .~
1) c:: 00
B
20 40 60
e
WOOO
8" DO
80
Distance run (km from arbitrary origin)
9 00
"7
100 120
Dow
nloa
ded
by [
The
Aga
Kha
n U
nive
rsity
] at
17:
53 0
9 O
ctob
er 2
014

Darby-Dislocation modelling, Edgecumbe
Fig.4 A Horizontal displacements predicted by model E3 (dashed arrows) and observed displacements transfonned by best rigid body movements (solid arrows). The displacement of station T3 is not used. The projection of the modelled planar segment to the ground surface is shown with its upper edge dashed. The star shows the epicentre.
B Vertical displacements predicted by model E3 (line) and observed displacements (circles) transfonned to relatively the best vertical datum along the portions of the levelling route as labelled in Fig. 1. The datum is introduced only to represent height changes graphically.
A
119
---.... ·0.4m o 10 I !
km
176'40' 17rOO'E
a ]:3 Ql d e b c g en <:
..2! 2 0
QOPQOPpooQoo ~OOOOIDDOOCIO 0
°00 0 °0 () Vo 000000 ~
.... .r:. .2> Ql
1 .r::. Ql ">
B '; Qi a: 00 20
Fig. 5 Lower hemisphere equal area projection of strike and dip of model E. The solid circle represents the direction of slip. The labels P and T are, respectively, in the centres of quadrants which would be observed to have dilatational and compressional first seismic motions.
o o o
o
40 60 80 100 120
Distance run (km from arbitrary origin)
event (Anderson & Webb 1989, this issue). The area is smaller than model E2,but the dip-slip, 2.7 ± 0.4 m, is larger and more consistent with the surface observations, as is the absence of a significant strike-slip component The upper edge coincides well with the main rupture. Figure 5 shows the orientation of the planar segment and slip direction plotted as a stereographic projection.
DISCUSSION AND CONCLUSIONS
The three models illustr~te the rnnge of parameters obtainable depending on the choice: of data and the implementation of a reasonable parameter cqnstraint. Model El, derived from only horizontal data., sqows that the major trends of the vertical data are probably tectonic even though near-surface compaction has undoubtedly affected their minor details. Model E2, derived from both vertical and horizontal data, has a slip of about 1.6 m which is somewhat smaller than surface observations of 2-3 m, and its strike of 0360 is inconsistent with mapped surface ruptures. A further model, E3, is presented which has the strike fixed at 0550 in order to be consistent with the genernl trend of the surface ruptures considered geologically to be of tectonic origin (Beanland et al.1989).
E3 is the most realistic model and compares favourably with geological (Beanland et al. 1989) and seismological (Anderson & Webb 1989; Robinson 1989, this issue; Smith & Oppenheimer 1989. this issue) information in considerable
Dow
nloa
ded
by [
The
Aga
Kha
n U
nive
rsity
] at
17:
53 0
9 O
ctob
er 2
014
120 New Zealand Journal of Geology and Geophysics, 1989, Vol. 32
""" , , , ... ... ... ,
"""""'\' .. " " , , , , , , ,I, .. ... , , , , , , , ,I, , I
, \ ,
.. ... .. .. .. .. , , , ~ , , , ...... , , .... , ,', , I .......... , , 'I'
" " , " " , .. .. ..
",
./ " ..r ..... 1 1 1
I
'\ I
, ................ --" ................ _--;.- I , '1("', .......... ..... >.,.. .,..<
, \ , , , ... ,
... , , , , , , , \ "''I.'''' I " ,J\,-"' .... '-~~~ ___ .,..--
.. 'I. 'I. )" " 'I. , , , , ...... , , 'I. 'I. ) 'I. 'I. , , , , .. , ...
~\\\\\\\" .. ' ... ./ /\\\\\\'.\\\\ .. ",
... - ... \ \ \ \ '),', , , , .. , ... , ...
,," \ \ \ .,"" \ , " " " .. , , ... " "\\ \ 1\ " " " .. .. .. .. .. I
.,.." ~_r/\\ .. \ .... \\
" ,
./ " ..r ..... 1
I
I I
I
,
"\ I
"
, I
I
t. \ , \ '\ '\
.,.. .,..
o 10 km 'L... __ ~ __ -L __ ~L-__ ~ __ ~'
0.5m displacement
...... ~--- ..... - ---- -.",
I
o 10 km I ,
extension 1 000 ppm contraction
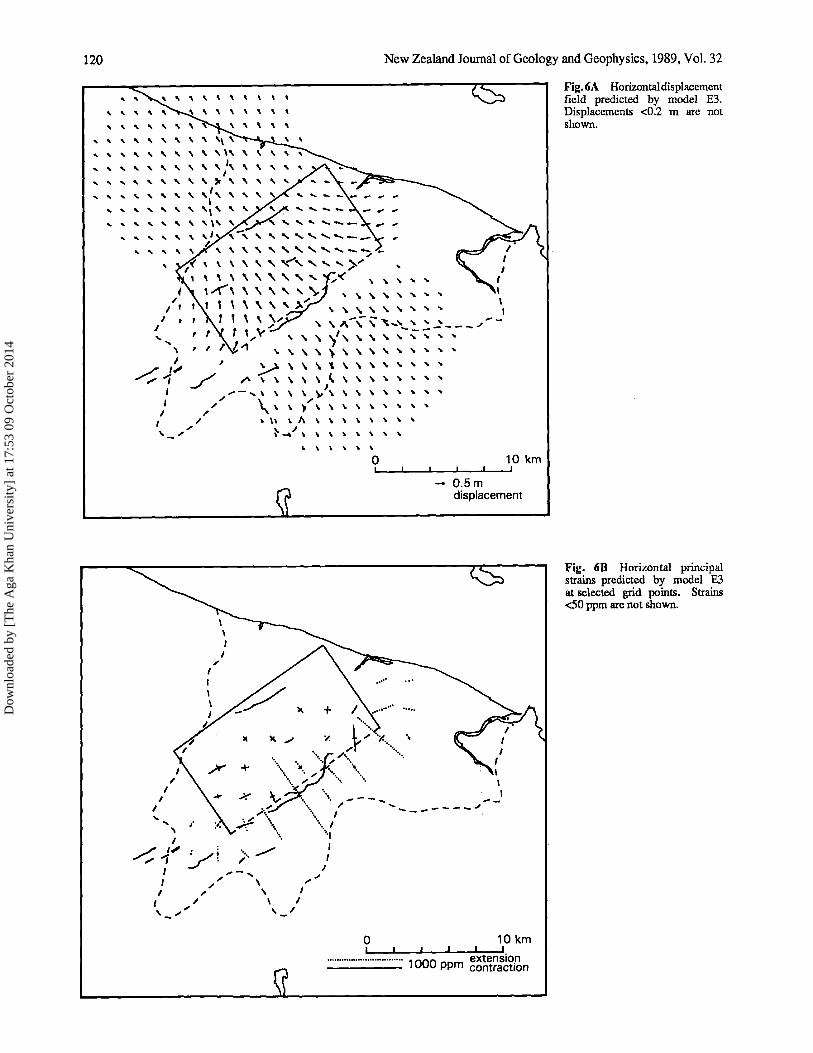
Fig.6A Horizontal displacement field predicted by model E3. Displacements <0.2 m are not shown.
Fig. 6B Horizontal principal strains predicted by model E3 at selected grid points. Strains <50 ppm are not shown .
Dow
nloa
ded
by [
The
Aga
Kha
n U
nive
rsity
] at
17:
53 0
9 O
ctob
er 2
014
Darby-Dislocation modelling, Edgecumbe
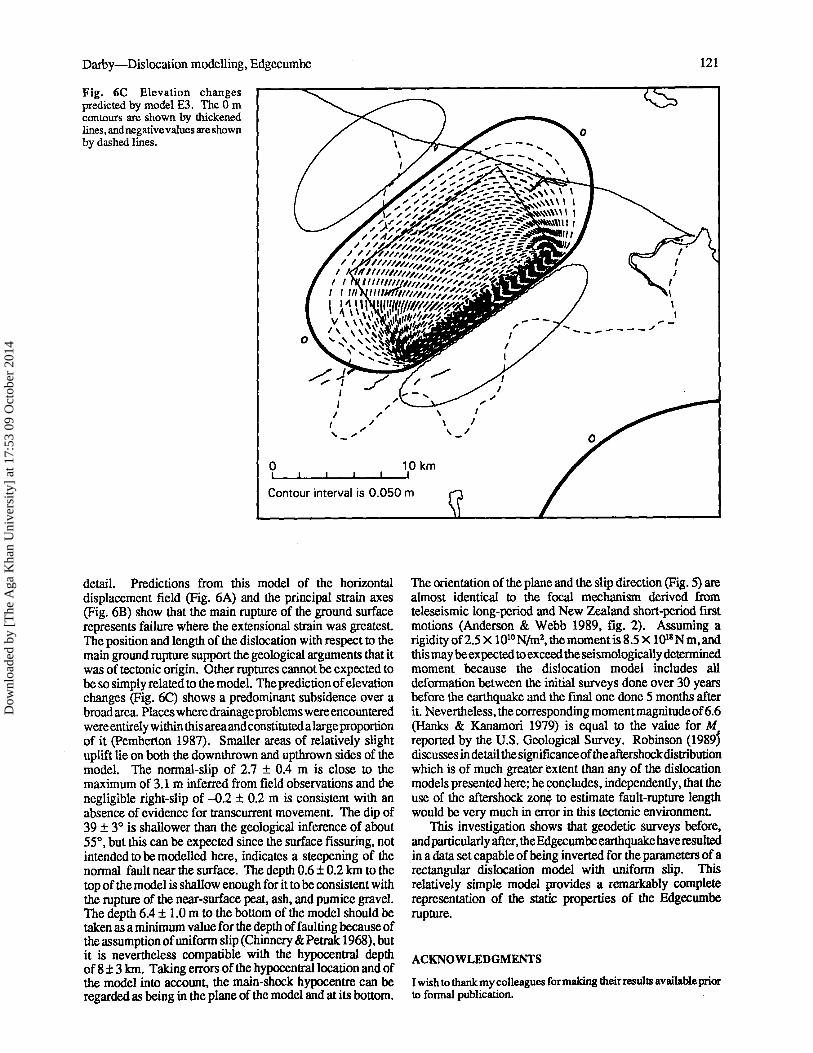
Fig. 6C Elevation changes predicted by model E3. The 0 m contours are shown by thickened lines, and negative values are shown by dashed lines.
121
o 10km ~I __ ~~ __ ~ __ ~~I
Contour interval ;s 0.050 m
detail. Predictions from this model of the horizontal displacement field (Fig. 6A) and the principal strain axes (Fig. 6B) show that the main rupture of the ground surface represents failure where the extensional strain was greatest. The position and length of the dislocation with respect to the main ground rupture support the geological arguments that it was of tectonic origin. Other ruptures cannot be expected to be so simply related to the model. The prediction of elevation changes (Fig. 6C) shows a predominant subsidence over a broad area. Places where drainage problems were encountered were entirely within this area and constituted a large proportion of it (pemberton 1987). Smaller areas of relatively slight uplift lie on both the downthrown and upthrown sides of the model. The normal-slip of 2.7 ± 0.4 m is close to the maximum of 3.1 m inferred from field observations and the negligible right-slip of -0.2 ± 0.2 m is consistent with an absence of evidence for transcurrent movement. The dip of 39 ± 3° is shallower than the geological inference of about 55°, but this can be expected since the surface fissuring, not intended to be modelled here, indicates a steepening of the normal fault near the surface. The depth 0.6 ± 0.2 km to the top of the model is shallow enough for it to be consistent with the rupture of the near-surface peat, ash, and pumice gravel. The depth 6.4 ± 1.0 m to the bottom of the model should be taken as a minimum value for the depth of faulting because of the assumption of uniform slip (Chinnery & Petrak 1968), but it is nevertheless compatible with the hypocentral depth of 8 ± 3 km. Taking errors of the hypocentrallocation and of the model into account, the main-shock hypocentre can be regarded as being in the plane of the model and at its bottom.
The orientation of the plane and the slip direction (Fig. 5) are almost identical to the focal mechanism derived from teleseismic long-period and New Zealand short-period first motions (Anderson & Webb 1989, fig. 2). Assuming a rigidity of2.5 X 101oN/m2, themomentis8.5X 1018 Nm,and this may be expected to exceed the seismologically determined moment because the dislocation model includes all deformation between the initial surveys done over 30 years before the earthquake and the final one done 5 months after it. Nevertheless, the corresponding moment magnitude of 6.6 (Hanks & Kanamori 1979) is equal to the value for M reported by the U.S. Geological Survey. Robinson (l989~ discusses in detail the significance of the aftershock distribution which is of much greater extent than any of the dislocation models presented here; he ~oncludes, independently. that the use of the aftershock zon~ to estimate fault-rupture length would be very much in error in this tectonic environment
This investigation shows that geodetic surveys before, and particularly after, the Edgecumbe earthquake have resulted in a data set capable of being inverted for the parameters of a rectangular dislocation model with uniform slip. This relatively simple model provides a remarkably complete representation of the static properties of the Edgecumbe rupture.
ACKNOWLEDGMENTS
I wish to thank my colleagues for making their results available prior to fonnal publication.
Dow
nloa
ded
by [
The
Aga
Kha
n U
nive
rsity
] at
17:
53 0
9 O
ctob
er 2
014
122 New Zealand Journal of Geology and Geophysics, 1989, Vol. 32
REFERENCES
Anderson, H.; Webb, T. 1989: The rupture process of the 1987 Edgecumbe earthquake, New Zealand. New Zealandjournal of geology and geophysics 32: 43-52 (this issue).
Beanland, S.; Berryman, K. R.; Blick, G. H. 1989: Geological investigations of the 1987 Edgecumbe earthquake, New Zealand. New Zealandjournal of geology and geophysics 32: 73-91 (this issue).
Blick, G. H.; Flaherty, M. P. 1989: Regional vertical deformation associated with the 1987 Edgecumbe earthquake, New Zealand. New Zealand journal of geology and geophysics 32: 99-108 (this issue).
Brown, K. M.; Dennis, 1. E. 1972: Derivative free analogues of the Levenberg-Marquardt and Gauss algorithms for nonlinear least squares approximation. NU17I£rische Mathematik 18: 289-297.
Chinnery, M. A.; Petrak, J. A. 1968: The dislocation fault model with a variable discontinuity. Tectonophysics 5: 513-529.
Crook, C. N.; Hannah, 1. 1988: Regional horizontal deformation associated with the March 2, 1987, Edgecumbe earthquake. Geophysical research letters 15: 361-364.
----1989: Regional horizontal deformation associated with the 1987 Edgecumbe earthquake, New Zealand - an introduction. New Zealandjournal of geology and geophysics 32: 93-98 (this issue).
Gill, P. E.; Murray, W. 1978: Algorithms for the solution of the nonlinear least squares problem. SIAM journal on nU17I£rical analysis 15: 977-992.
Grantz, A.; Plafker, G.; Kachadoorian, R. 1964: Alaska's Good Friday EarthquakeMarch27 ,1964. United States Department of the Interior Geological Survey circular 491.
Hanks, T. C.; Kanamori, H. 1979: A moment magnitude scale. Journal of geophysical research 84: 2348-2350.
Mansinha, L.; Smylie, D. E. 1971: The displacement fields of inclined faults. Bulletin of the Seismological Society of America 61: 1433-1440.
Nairn, I. A.; Beanland, S. 1989: Geological setting of the 1987 Edgecumbe earthquake, New Zealand. New Zealandjournal of geology and geophysics 32: 1-13 (this issue).
Pemberton, G. 1987: 2 March 1987 earthquake, Rangitaiki Plains: effect on flood protection and drainage. Unpublished report, Bay of Plenty Catchment Commission.
Pender, M. J.; Robertson, T. W. ed. 1987: Edgecumbe earthquake: reconnaissance report. B ulletinoftheN ew ZealandN ational Society for Earthquake Engineering 20: 201-249.
Robinson, R. 1989: Aftershocks of the 1987 Edgecumbe earthquake, New Zealand: seismological and structural studies using portable seismographs in the epicentral region. New Zealand journal of geology and geophysics 32: 61-72 (this issue).
Smith,E.; Oppenheimer, C.M.M. 1989: TheEdgecumbeearthquake sequence: 1987 February 21 to March 18. New Zealand journal of geology and geophysics 32: 31-42 (this issue).
Stem, T. A.; Davey, F. 1. 1985: Crustal structure studies within the central North Island: the Central Volcanic Region. Wellington, New Zealand. Department of Scientific and Industrial Research. Geophysics Division report 207.
Dow
nloa
ded
by [
The
Aga
Kha
n U
nive
rsity
] at
17:
53 0
9 O
ctob
er 2
014