disclaimer - california department of transportation€¦ · freight and d7 goods movement corridor...
TRANSCRIPT

Disclaimer
The information and data contained in this document are for planning purposes only and should
not be relied upon for final design of any project. Any information in this Transportation
Concept Report (TCR) is subject to modifications as conditions change and new information is
obtained. Although planning information is dynamic and continually changing, the D7 Office of
Transportation Planning makes every effort to ensure the accuracy and timeliness of the
information contained in the TCR. The information in the TCR does not constitute a standard,
specification, or regulation, nor is it intended to address design policies and procedures.

TABLE OF CONTENTS
About the Transportation Concept Report 1 Stakeholder Participation 2 Executive Summary 3 Corridor Overview/ Route Segmentation 5 Route Description 6 Community Characteristics and Land Use 8 System Characteristics 16 Ramp Meters Listing 17 Active Transportation, Transit Facility 18 Freight and D7 Goods Movement Corridor Map 19-20 Environmental Consideration 20 Corridor Performance 21 Corridor Concept/Concept Rationale 22 Planned and Programmed Projects and Strategies 22 Conclusion 23 Appendix A: Glossary of Terms and Acronyms, Definitions and Resources 24-28
1
ABOUT THE TRANSPORTATION CONCEPT REPORT
System Planning is the long-range transportation planning process for the California Department of Transportation (Caltrans). The System Planning process fulfills Caltrans’ statutory responsibility as owner/operator of the State Highway System (SHS) by identifying deficiencies and proposing improvements to the SHS. Through System Planning, Caltrans focuses on developing an integrated multimodal transportation system that meets Caltrans’ goals of safety, mobility, delivery, stewardship, and service.
The System Planning process is primarily composed of four parts: the District System Management Plan (DSMP), the Transportation Concept Report (TCR), the Corridor System Management Plan (CSMP) and the Transportation System Development Plan (TSDP).
The District wide DSMP is a strategic policy and planning document that focuses on maintaining, operating, managing, and developing the transportation system. The TCR is a planning document that identifies the existing and future route conditions as well as future needs for each route on the SHS. The CSMP is a complex, multi-jurisdictional planning document that identifies future needs within corridors experiencing or expected to experience high levels of congestion. The TSDP is a list of planned and partially programmed transportation projects used to recommend projects for funding. These System Planning products are also intended as resources for public/private stakeholders, the regional and local agencies.
TCR Purpose
California’s State Highway System needs long range planning documents to guide the logical development of transportation systems as required by law and as necessitated by public, stakeholders, and system users. The purpose of the TCR is to evaluate current and projected conditions along the route and communicate the vision for the development of each route in each Caltrans District during a 20-25 year planning horizon. The TCR is developed with the goals of increasing safety, improving mobility, providing excellent stewardship, and meeting community and environmental needs along the corridor through integrated management of the transportation network, including the highway, transit, pedestrian, bicycle, freight, operational improvements and travel demand management components of the corridor.

2
STAKEHOLDER PARTICIPATION
Stakeholder participation was sought throughout the development of the SR-91 TCR. Outreach involved internal and external stakeholders.
Both internal and external stakeholders were asked to review the document for comments, edits, and for consistency with the intent of existing plans, policies, and procedures. The process of including and working closely with stakeholders adds value to the TCR, allows for outside input and ideas to be reflected in the document, increases credibility and helps strengthen public support and trust.

3
EXECUTIVE SUMMARY
The SR-91 Transportation Concept Report (TCR) is divided into several major sections; three of the sections – the Corridor Performance, System Characteristics and Corridor Concept – are the core of the document. All of the remaining sections provide a context for analyzing the SR-91 corridor and document the data resources.
The main purpose of this TCR is to evaluate current and projected conditions along the route and suggest a configuration for SR 91 that will meet projected demand within a framework of programming and implementation constraints and regional policy.
Historically the freeway system in Southern California is highly congested and this trend will continue into the future. Due to our financial, environmental, right of way and political constraints, it is very difficult for Caltrans to continue to add more lanes to the system. With these limitations, Caltrans D7 office has established LOS F0 as the minimum acceptable level of service on the freeway system (1996 District System Management Plan). The 2035 concept facility intent is to show how much additional capacity is needed to achieve the desired LOS.
Concept Summary Table
CONCEPT – 2035 FACILITY
Segment/ Description
Existing Facility (Each Direction)
ADT Dir. Split
Peak Hr.
Truck Peak Hr.
2035 Baseline RTP (Both Direction)
LOS “D” Attainment (Both Directions)
Concept LOS F0 Attainment (Both Directions)
1 Begin fwy To Rte 110
5 MF 127,000 55.2% 5300 4.2%
250 2.6%
5 MF 20 15 V/C LOS 2.04 F3
2 Rte 110 to Rte 710
4 MF + 1 HOV
251,500 53.3% 20,400 8.1%
1400 6.9%
8 MF+2 HOV 14 11 V/C LOS 1.044 F0
3 Rte 710 to SR 19
5 MF + 1 HOV
298,000 51.7% 22,800 7.7%
2400 10.4%
8 MF+2HOV 15 11 V/C LOS 1.13 FO
4 SR 19 to I-605
4 MF + 1 HOV
300,000 52.2% 23,400 7.7%
2400 10.2%
8MF+2 HOV 16 11 V/C LOS 1.07 F0
5 I-605 to Orange Co. Line
4 MF + 1 HOV
251,300 51% 20,400 8.1%
1500 7.4%
8 MF+2HOV 13 10 V/C LOS 1.10 F0
Source: 2012-2035 RTP/SCS
*LOS D Attainment indicates how many lanes it would require to achieve LOS D. It is meant to show the severity of future conditions and what it will take to achieve LOS D. The number of lanes in the LOS D attainment column is for both directions. Caltrans is not suggesting that it is our plan to build the facility to achieve the LOS D.
4
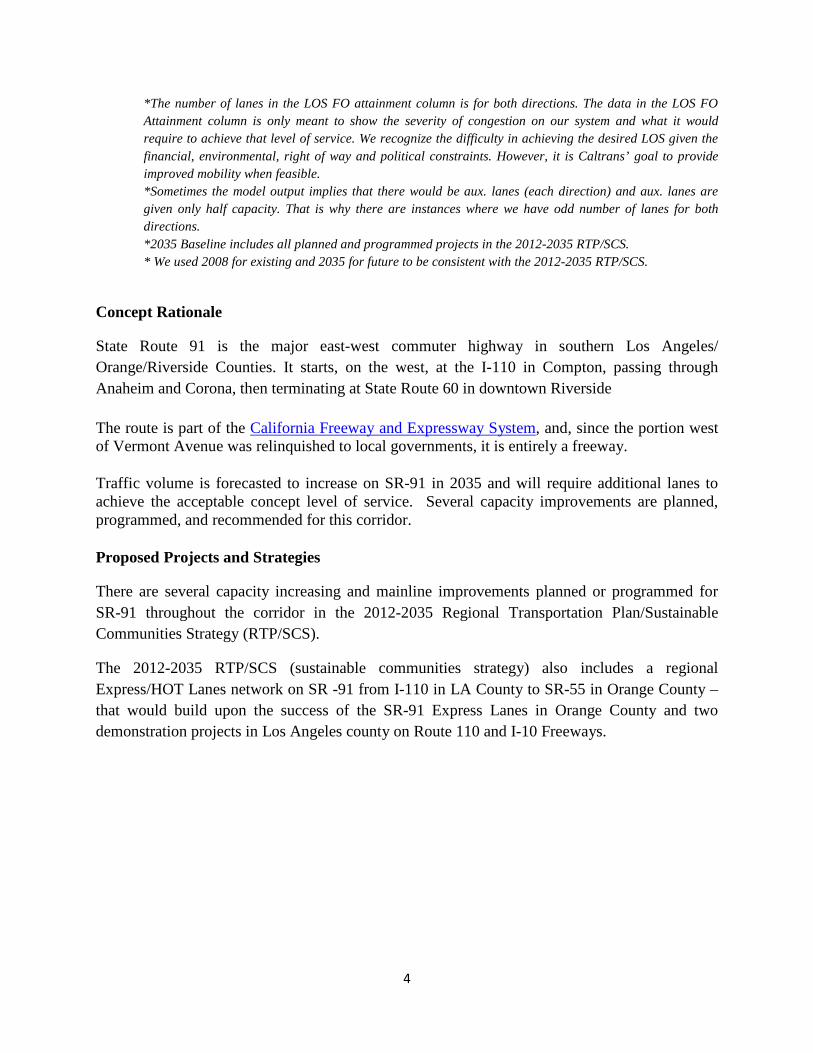
*The number of lanes in the LOS FO attainment column is for both directions. The data in the LOS FO Attainment column is only meant to show the severity of congestion on our system and what it would require to achieve that level of service. We recognize the difficulty in achieving the desired LOS given the financial, environmental, right of way and political constraints. However, it is Caltrans’ goal to provide improved mobility when feasible. *Sometimes the model output implies that there would be aux. lanes (each direction) and aux. lanes are given only half capacity. That is why there are instances where we have odd number of lanes for both directions. *2035 Baseline includes all planned and programmed projects in the 2012-2035 RTP/SCS. * We used 2008 for existing and 2035 for future to be consistent with the 2012-2035 RTP/SCS.
Concept Rationale
State Route 91 is the major east-west commuter highway in southern Los Angeles/ Orange/Riverside Counties. It starts, on the west, at the I-110 in Compton, passing through Anaheim and Corona, then terminating at State Route 60 in downtown Riverside
The route is part of the California Freeway and Expressway System, and, since the portion west of Vermont Avenue was relinquished to local governments, it is entirely a freeway.
Traffic volume is forecasted to increase on SR-91 in 2035 and will require additional lanes to achieve the acceptable concept level of service. Several capacity improvements are planned, programmed, and recommended for this corridor.
Proposed Projects and Strategies
There are several capacity increasing and mainline improvements planned or programmed for SR-91 throughout the corridor in the 2012-2035 Regional Transportation Plan/Sustainable Communities Strategy (RTP/SCS).
The 2012-2035 RTP/SCS (sustainable communities strategy) also includes a regional Express/HOT Lanes network on SR -91 from I-110 in LA County to SR-55 in Orange County – that would build upon the success of the SR-91 Express Lanes in Orange County and two demonstration projects in Los Angeles county on Route 110 and I-10 Freeways.
5
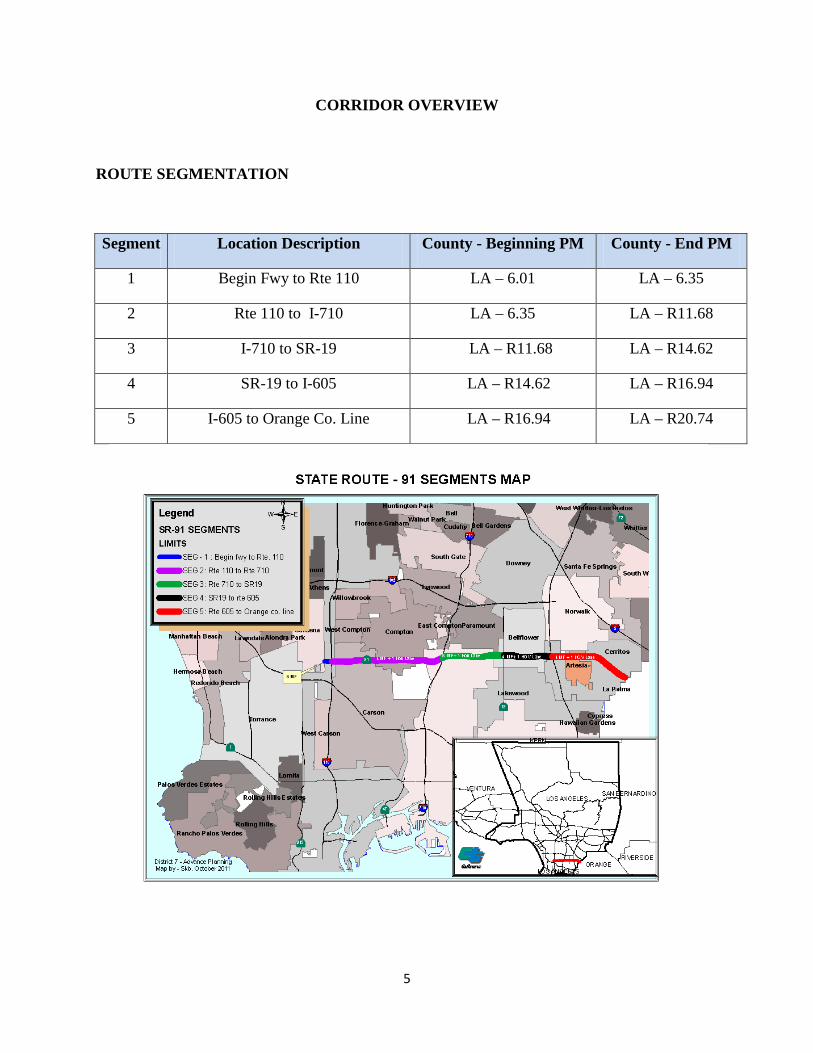
CORRIDOR OVERVIEW
ROUTE SEGMENTATION
Segment Location Description County - Beginning PM County - End PM
1 Begin Fwy to Rte 110 LA – 6.01 LA – 6.35
2 Rte 110 to I-710 LA – 6.35 LA – R11.68
3 I-710 to SR-19 LA – R11.68 LA – R14.62
4 SR-19 to I-605 LA – R14.62 LA – R16.94
5 I-605 to Orange Co. Line LA – R16.94 LA – R20.74

6
ROUTE DESCRIPTION
The SR-91 serves as an interregional and intra-regional travel and shipping route and is considered as one of the major Goods Movement Route in Los Angeles. SR-91 also serves as a major east west freight truck route connecting Los Angeles County, two community colleges (El Camino and Compton), California State University Dominguez Hills and three resort cities: Manhattan Beach, Hermosa Beach, and Redondo Beach. SR-91 is a part of the Intermodal Corridors of Economic Significance (ICES).
SR-91 is also known as the Gardena freeway in Los Angeles County. The terrain along the SR-91 Corridor is flat.
On October 7, 1999, Governor Gray Davis signed into law Assembly Bill 1650 Section 391.3. which included the relinquishment of a portion of SR-91 from SR-1 in Hermosa Beach to Vermont Avenue in the City of Gardena (PM 0.00 – 6.01). The relinquished portion of the route consists of a total of six miles and traverses several cities including the cities of Hermosa Beach, Manhattan Beach, Redondo Beach, Lawndale, Torrance, and Gardena.
This TCR analyzes SR-91 conditions using the ‘segment’ as the study unit. The Segments are generally defined as ‘freeway interchange to freeway interchange’ ‘county line to freeway interchange’, or ‘freeway interchange to end of freeway’
7
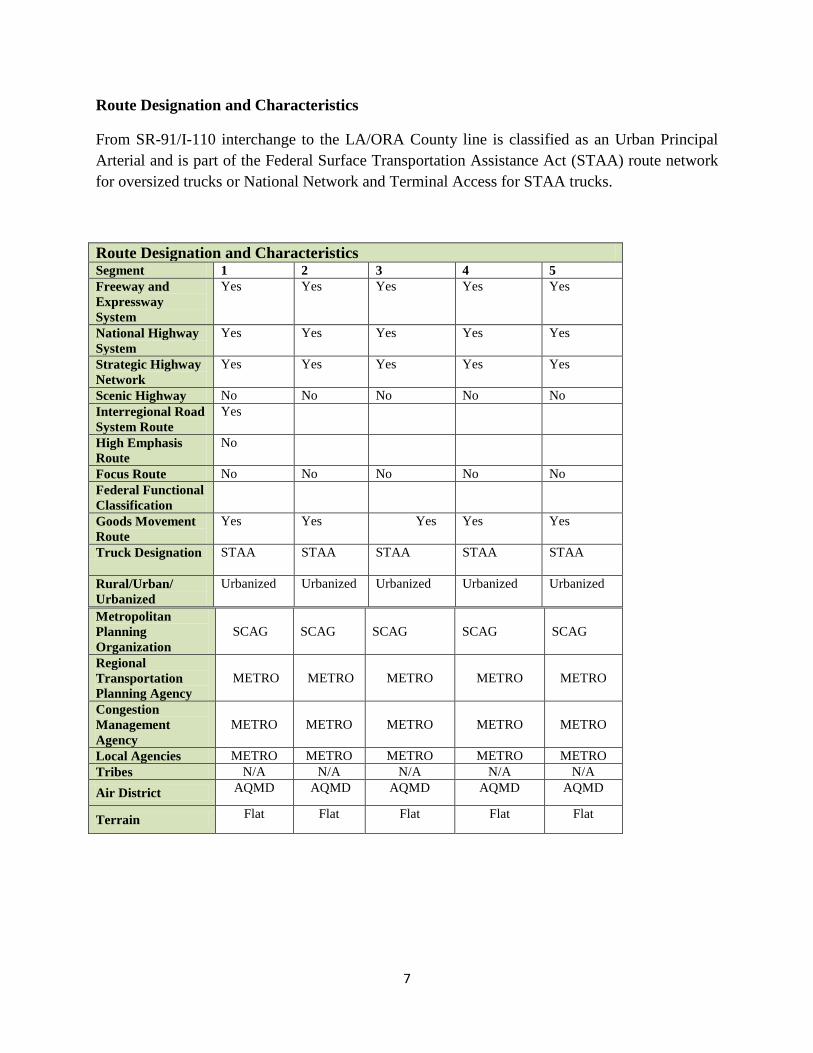
Route Designation and Characteristics
From SR-91/I-110 interchange to the LA/ORA County line is classified as an Urban Principal Arterial and is part of the Federal Surface Transportation Assistance Act (STAA) route network for oversized trucks or National Network and Terminal Access for STAA trucks.
Route Designation and Characteristics Segment 1 2 3 4 5 Freeway and Expressway System
Yes Yes Yes Yes Yes
National Highway System
Yes Yes Yes Yes Yes
Strategic Highway Network
Yes Yes Yes Yes Yes
Scenic Highway No No No No No Interregional Road System Route
Yes
High Emphasis Route
No
Focus Route No No No No No Federal Functional Classification
Goods Movement Route
Yes Yes Yes Yes Yes
Truck Designation STAA STAA STAA STAA
STAA
Rural/Urban/ Urbanized
Urbanized Urbanized Urbanized Urbanized Urbanized
Metropolitan Planning Organization
SCAG
SCAG
SCAG
SCAG
SCAG
Regional Transportation Planning Agency
METRO
METRO
METRO
METRO
METRO
Congestion Management Agency
METRO
METRO
METRO
METRO
METRO
Local Agencies METRO METRO METRO METRO METRO Tribes N/A N/A N/A N/A N/A Air District AQMD AQMD AQMD AQMD AQMD
Terrain Flat Flat Flat Flat Flat
8
COMMUNITY CHARACTERISTICS
SR-91 is a Principal Arterial in an urbanized corridor providing access to the resort cities of Hermosa Beach, Manhattan Beach, Redondo Beach, Lawndale, Torrance, Gardena, Compton, and Long Beach.
LAND USE
In Caltrans District 7, SR-91 traverses few of the Southern California Association of Government’s (SCAG) Regional Statistical Areas (RSA). These RSAs are South Bay/Torrance, Long Beach, East LA/South Gate and Downey/Santa Fe Springs
The SR-91 corridor is congested in certain areas, highly developed and the land use varies from residential, commercial, to industrial. The many significant trip generators along this corridor include:
• Long Beach Airport • Compton Airport • Compton College • California State University, Dominguez Hills • Cerritos College • Cerritos Auto Square • Cerritos Center for the Performing Arts • Cerritos Town Center • Cerritos Regional County Park • El Camino College • Home Depot Center • Soccer Stadium • Heritage Park • Knotts Berry Farm • Disneyland
Significant growth in housing, population, and employment are generally projected throughout the SR-91 corridor area. This growth is expected to occur through in fill and recycling of existing land uses.
Here are some projected socioeconomic growths in the cities along Route 91 Corridor per the SCAG 2012 -2035 RTP/SCS GROWTH FORECAST

9
CITY OF ARTESIA 2008 - 2020 2008 -2035
2008 2020 2035 CHANGE CHANGE POPULATION 16,500 16,700 17,000 1.21% 3.03% HOUSING 4,500 4,700 4,800 4.44% 6.67% EMPLOYMENT 5,900 6,200 6,500 5.08% 10.17%
0
2,000
4,000
6,000
8,000
10,000
12,000
14,000
16,000
18,000
2008 2020 2035
POPULATION
HOUSING
EMPLOYMENT
10
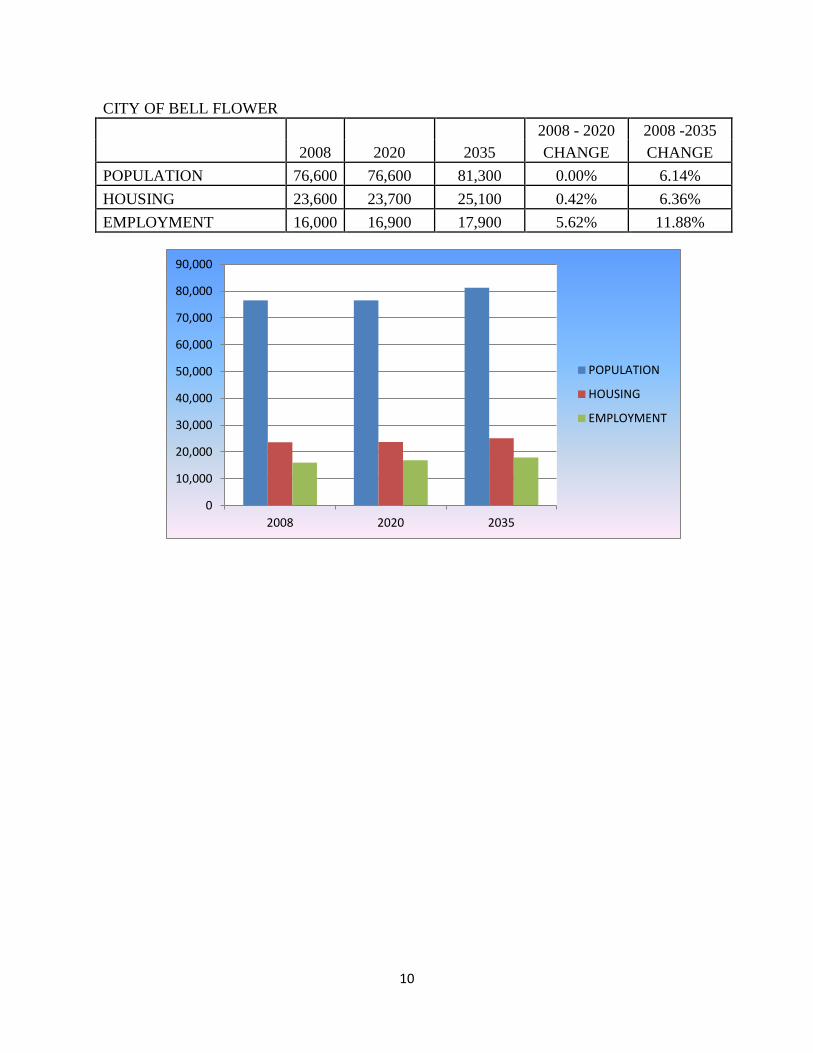
CITY OF BELL FLOWER 2008 - 2020 2008 -2035
2008 2020 2035 CHANGE CHANGE POPULATION 76,600 76,600 81,300 0.00% 6.14% HOUSING 23,600 23,700 25,100 0.42% 6.36% EMPLOYMENT 16,000 16,900 17,900 5.62% 11.88%
0
10,000
20,000
30,000
40,000
50,000
60,000
70,000
80,000
90,000
2008 2020 2035
POPULATION
HOUSING
EMPLOYMENT

11
CITY OF CARSON 2008 - 2020 2008 -2035
2008 2020 2035 CHANGE CHANGE POPULATION 91,700 97,500 106,000 6.32% 15.59% HOUSING 25,500 27,400 29,600 7.45% 16.08% EMPLOYMENT 51,900 52,500 54,000 1.16% 4.05%
0
20,000
40,000
60,000
80,000
100,000
120,000
2008 2020 2035
POPULATION
HOUSING
EMPLOYMENT

12
CITY OF LAKEWOOD 2008 - 2020 2008 -2035
2008 2020 2035 CHANGE CHANGE POPULATION 80,000 80,500 80,600 0.63% 0.75% HOUSING 26,600 27,100 27,400 1.88% 3.01% EMPLOYMENT 15,700 16,800 17,800 7.01% 13.38%
0
10,000
20,000
30,000
40,000
50,000
60,000
70,000
80,000
90,000
2008 2020 2035
POPULATION
HOUSING
EMPLOYMENT

13
CITY OF CERRITOS 2008 - 2020 2008 -2035
2008 2020 2035 CHANGE CHANGE POPULATION 49,000 49,400 49,800 0.82% 1.63% HOUSING 15,500 15,600 15,800 0.65% 1.94% EMPLOYMENT 35,900 37,100 38,600 3.34% 7.52%
0
10,000
20,000
30,000
40,000
50,000
60,000
2008 2020 2035
POPULATION
HOUSING
EMPLOYMENT
14
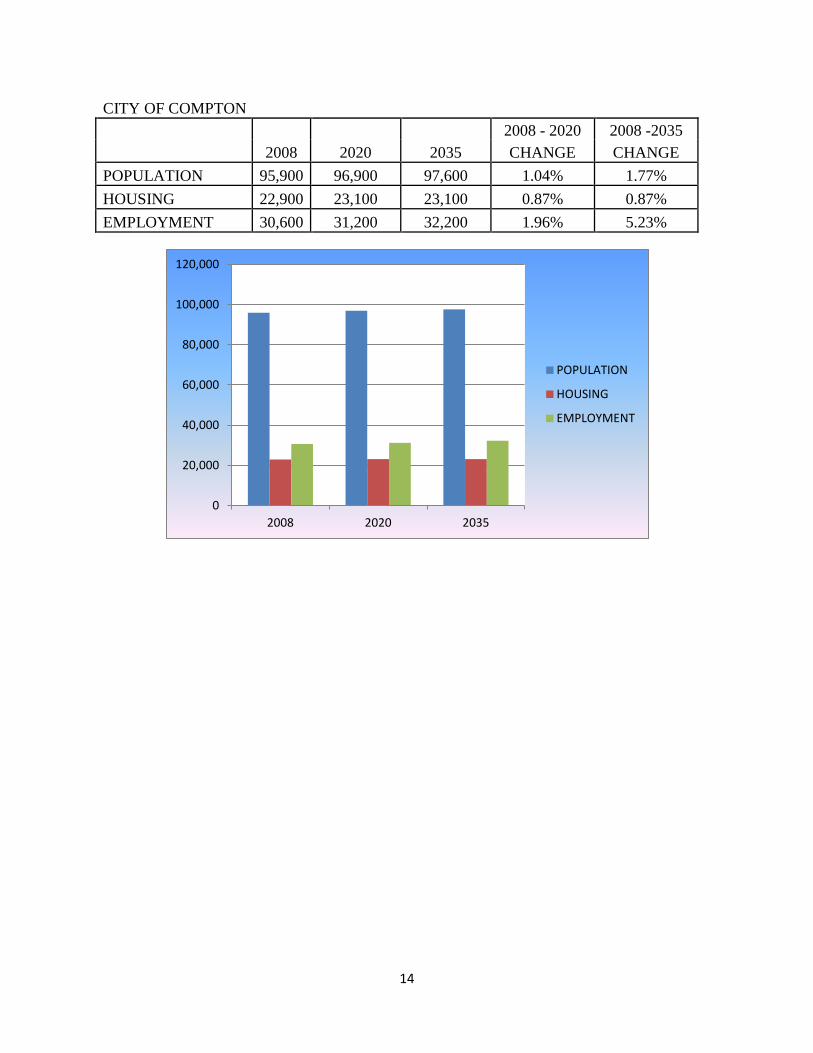
CITY OF COMPTON 2008 - 2020 2008 -2035
2008 2020 2035 CHANGE CHANGE POPULATION 95,900 96,900 97,600 1.04% 1.77% HOUSING 22,900 23,100 23,100 0.87% 0.87% EMPLOYMENT 30,600 31,200 32,200 1.96% 5.23%
0
20,000
40,000
60,000
80,000
100,000
120,000
2008 2020 2035
POPULATION
HOUSING
EMPLOYMENT

15
CITY OF LONG BEACH 2008 - 2020 2008 -2035
2008 2020 2035 CHANGE CHANGE POPULATION 462,200 491,000 534,100 6.23% 15.56% HOUSING 163,500 175,600 188,900 7.40% 15.54% EMPLOYMENT 168,100 176,000 184,800 4.70% 9.93%
0
100,000
200,000
300,000
400,000
500,000
600,000
2008 2020 2035
POPULATION
HOUSING
EMPLOYMENT
16
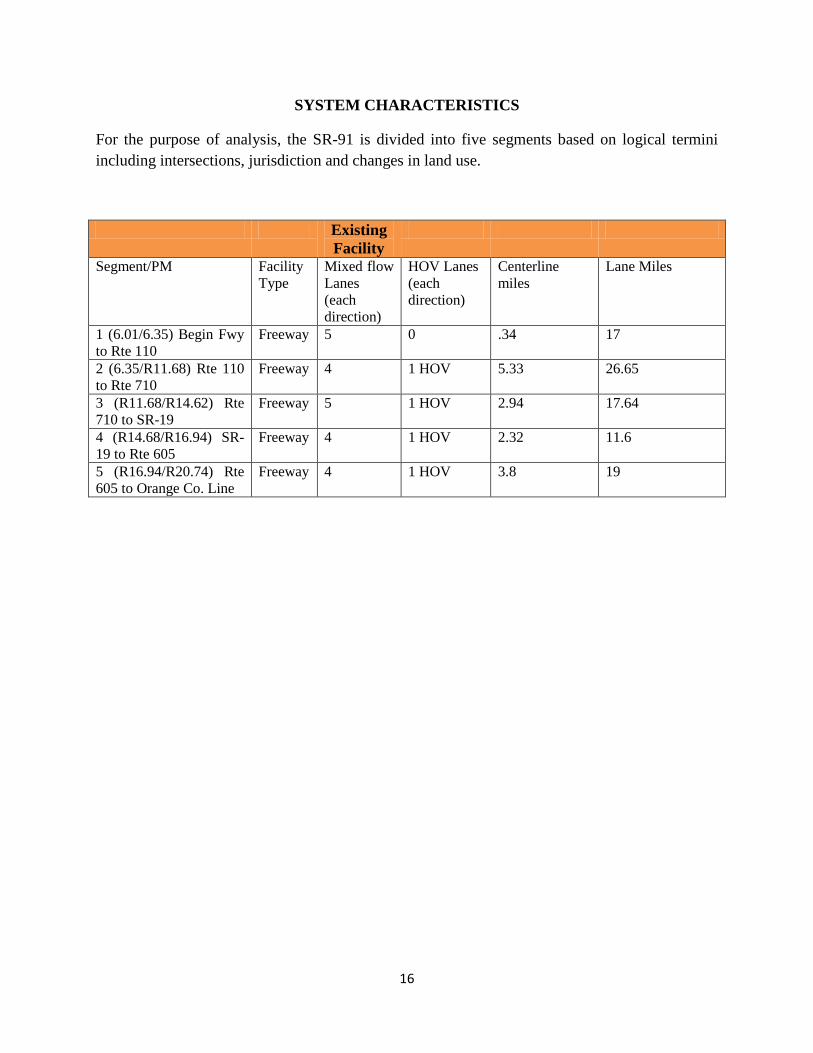
SYSTEM CHARACTERISTICS
For the purpose of analysis, the SR-91 is divided into five segments based on logical termini including intersections, jurisdiction and changes in land use.
Existing Facility
Segment/PM Facility Type
Mixed flow Lanes (each direction)
HOV Lanes (each direction)
Centerline miles
Lane Miles
1 (6.01/6.35) Begin Fwy to Rte 110
Freeway 5 0 .34 17
2 (6.35/R11.68) Rte 110 to Rte 710
Freeway 4 1 HOV 5.33 26.65
3 (R11.68/R14.62) Rte 710 to SR-19
Freeway 5 1 HOV 2.94 17.64
4 (R14.68/R16.94) SR-19 to Rte 605
Freeway 4 1 HOV 2.32 11.6
5 (R16.94/R20.74) Rte 605 to Orange Co. Line
Freeway 4 1 HOV 3.8 19

17
RAMP METERS ON SR-91 SEGMENT 1 (PM 6.01/6.35) POSTMILE DIRECTION LOCATION COMMENT 6.94 WB MAIN STREET OPERATIONAL SEGMENT 2 (PM 6.35/R11.68) 7.16 EB MAIN STREET OPERATIONAL 7.55 WB AVALON OPERATIONL 7.81 EB AVALON OPERATIONAL 8.27 WB CENTRAL OPERATIONAL 8.58 EB CENTRAL OPERATIONAL 9.10 WB WILMINGTON OPERATIONAL 9.67 WB ACACIA STREET OPERATIONAL 10.13 EB ALAMEDA STREET OPERATIONAL 10.48 EB SANTA FE OPERATIONAL 11.03 EB LONG BEACH OPERATIONAL 11.03 WB LONG BEACH OPERATIONAL SEGMENT 3 (PM R11.68/R14.62) 11.78 WB ATLANTIC OPERATIONAL 12.21 EB ATLANTIC OPERATIONAL 13.01 WB CHERRY OPERATIONAL 13.26 EB CHERRY OPERATIONAL 13.51 WB PARAMOUNT OPERATIONAL 13.69 EB PARAMOUNT OPERATIONAL 14.04 WB DOWNEY OPERATIONAL 14.21 EB DOWNEY OPERATIONAL 14.55 WB LAKEWOD SB OPERATIONAL 14.59 EB LAKEWOOD SB OPERATIONAL SEGMENT 4 (R14.62/R16.94) 14.65 WB LAKEWOOD NB OPERATIONAL 14.80 EB LAKEWOOD NB OPERATIONAL 15.22 EB CLARK OPERATIONAL 15.54 WB BELLFLOWER OPERATIONAL 15.76 EB BELLFLOWER OPERATIONAL SEGMENT 5 (R16.94/R20.74) 17.37 EB STUDEBAKER OPERATIONAL 17.96 EB PIONEER SB OPERATIONAL 17.96 WB PIONEER SB OPERATIONAL 18.21 EB PIONEER NB OPERATIONAL 18.21 WB PIONEER NB OPERATIONAL 18.50 WB NORWALK SB OPERATIONAL 18.54 EB NORWALK SB OPERATIONAL 18.70 WB NORWALK NB OPERATIOAL 18.77 EB NORWALK NB OPERATIONAL 19.06 WB BLOOMFIELD OPERATIONAL 19.30 WB ARTESIA WB OPERATIONAL 19.40 EB SHOEMAKER OPERATIONAL 20.14 WB 183RD/CARMENITA OPERATIONAL
SOURCE – 2011 RMDP
18
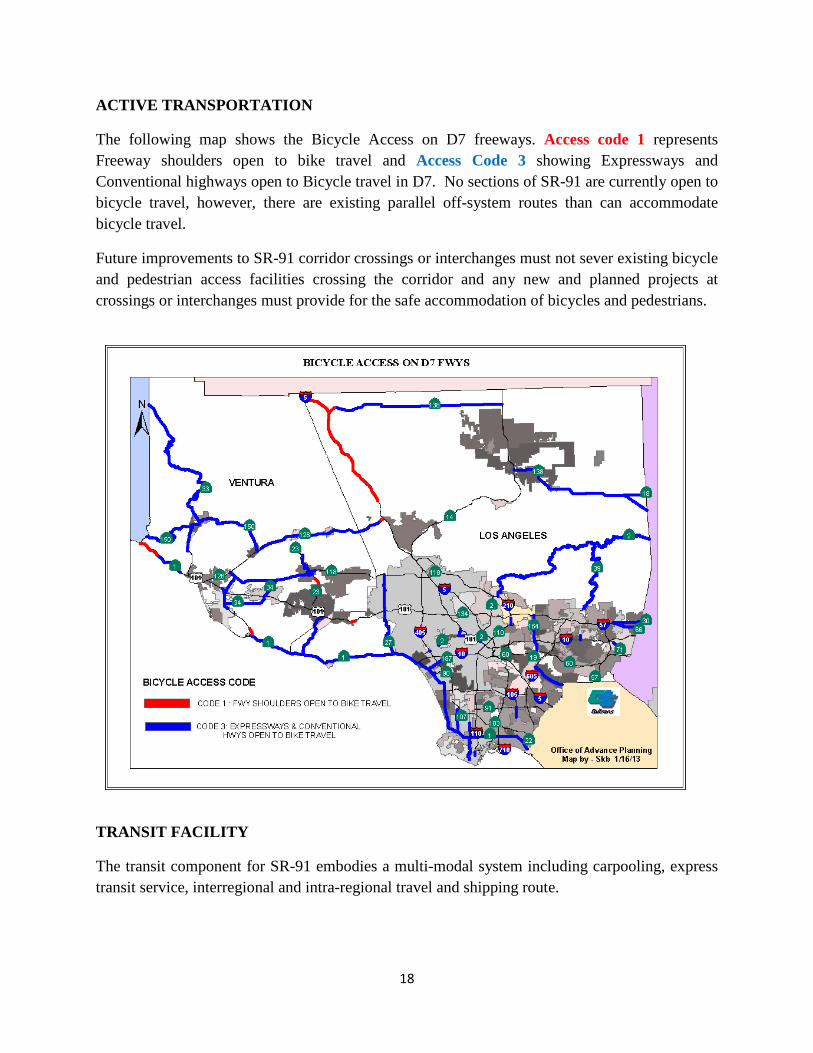
ACTIVE TRANSPORTATION
The following map shows the Bicycle Access on D7 freeways. Access code 1 represents Freeway shoulders open to bike travel and Access Code 3 showing Expressways and Conventional highways open to Bicycle travel in D7. No sections of SR-91 are currently open to bicycle travel, however, there are existing parallel off-system routes than can accommodate bicycle travel.
Future improvements to SR-91 corridor crossings or interchanges must not sever existing bicycle and pedestrian access facilities crossing the corridor and any new and planned projects at crossings or interchanges must provide for the safe accommodation of bicycles and pedestrians.
TRANSIT FACILITY
The transit component for SR-91 embodies a multi-modal system including carpooling, express transit service, interregional and intra-regional travel and shipping route.

19
The Los Angeles County Metropolitan Transportation Authority (LACMTA) commonly branded as METRO, Long Beach Transit, Torrance Transit, Norwalk Transit and Los Angeles Department of Transportation (LADOT) Commuter Express currently serve this route.
Currently, there are two multi-modal facilities servicing this route. The largest is the Artesia Transit Center serving as a staging complex for commuter rail, carpools, vanpools, local and express transit.
FREIGHT
The economic vitality and well being of the Greater Los Angeles region depends upon the safe and timely transport of goods as well as people. SR-91 is identified in the Caltrans District 7 Goods Movement Corridor as a Primary Corridor from I-710 to Orange County and as a Secondary Corridor from SR-110 to I-710.
Current levels of congestion are detrimental to this vitality, and future projections indicate that this situation will get much worse. Southern California’s aging transportation system is at capacity, serving a population in Los Angeles County of approximately ten million people. District 7 has five of the ten worst truck bottlenecks in the U.S. Truck vehicle miles traveled (VMT) is expected to double by 2030. Significant actions thus need to be taken to protect the economic well being of the region. These include improved rail service, including more grade separations; additional and improved intermodal transfer facilities; truck lanes on major truck routes; improved intermodal transfer facilities; truck lanes on major truck routes; improved access to and enhanced cargo handling capabilities at seaports: and improved air cargo accessibility with separation from passenger activities at airports.
Some of the specific conditions affecting SR-91 are as follows:
Trucks: SR-91 is part of the Surface Transportation Assistance Act (STAA) truck network, and is identified in the SCAG Regional Transportation Plan.
Truck volumes in 2008 range from 4.7% to 11.2% of ADT. Regionally, truck traffic is expected to increase by over 50% by 2025, with virtually no capacity available to handle this added volume.
Seaports: As part of the Southwest Compact Multi-Modal Corridor, SR-91 will handle some of the freight from the ports of Los Angeles and Long Beach. It is expected that most port cargo going less than 800 miles will be transported by truck. These are full service ports, handling in particular containers, autos, and bulk cargo. Two ports combined handle 40 percent of all U.S. containerized waterborne imports. Volume of cargo is expected to triple, from 11.8 million TEU (twenty-foot equivalent units) in 2009 to 43.2 million TEU in 2035.
20
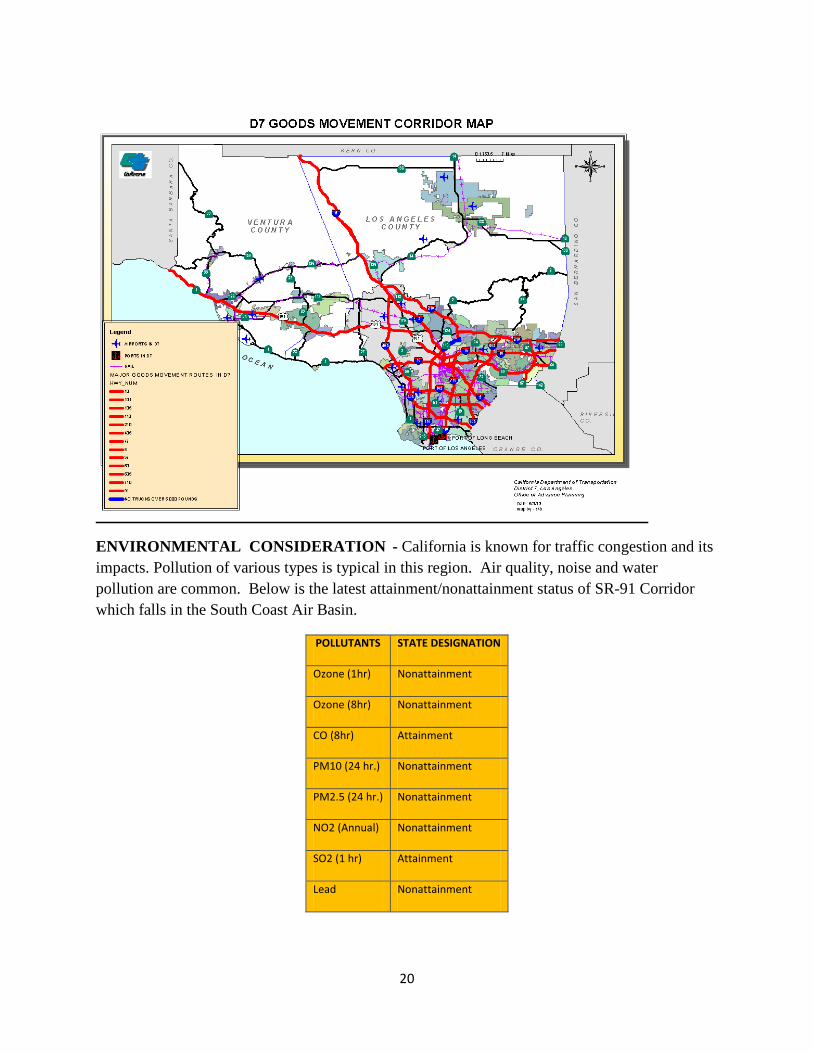
ENVIRONMENTAL CONSIDERATION - California is known for traffic congestion and its impacts. Pollution of various types is typical in this region. Air quality, noise and water pollution are common. Below is the latest attainment/nonattainment status of SR-91 Corridor which falls in the South Coast Air Basin.
POLLUTANTS STATE DESIGNATION
Ozone (1hr) Nonattainment
Ozone (8hr) Nonattainment
CO (8hr) Attainment
PM10 (24 hr.) Nonattainment
PM2.5 (24 hr.) Nonattainment
NO2 (Annual) Nonattainment
SO2 (1 hr) Attainment
Lead Nonattainment

21
CORRIDOR PERFORMANCE
Segment 1 (pm 6.01/6.35) carried approximately 128,000 average annual daily trips (AADT) per the 2008 Traffic Volume Book; 2.6% of which are associated with truck travel. The segment currently operates at level of service F3.
Segment 2 (pm 6.35/R11.68) had 249,000 AADT in 2008, 4.9 % of which is associated with truck travel. The segment currently operates at LOS F0.
Segment 3 (pm R11.68/R14.62) had 289,300 AADT, 9.4% of which was truck travel. The segment also operates with LOS F0.
Segment 4 (pm R14.62/R16.94) has 295,700 AADT, 8.8% of which was truck travel. It operates with LOS F0.
Segment 5 (pm R16.94/R20.74) has 273,200 AADT, 7.1% of which was truck travel. It operates with LOS F0.
BASIC SYSTEM OPERATIONS
Segment AADT 2008
AADT 2035
LOS 2008
LOS 2035
LOS CONCEPT
VMT 2008
VMT 2035
1 128,000 127,000 F3 F3 F0 21,800 24,000 2 249,900 251,500 F0 F0 F0 1,126,300 1,133,487 3 289,300 298,000 F0 F0 F0 637,200 655,600 4 295,700 300,000 F0 F0 F0 446,700 453,700 5 273,200 251,300 F0 F0 F0 916,600 842,707
TRUCK TRAFFIC
Segment Total Average Annual Truck Traffic (AADT) 2008
Total Trucks (% of AADT) 2008
Heavy Duty Average Annual Daily Truck Traffic (AADTT) 2008
Heavy Duty Trucks (% of AADTT) 2008
1 3,300 2.6 1,400 42.8 2 12,400 4.9 5,300 42.8 3 27,300 9.4 14,900 54.7 4 26,100 8.8 14,300 54.7 5 19,400 7.1 9,200 47.7

22
CORRIDOR CONCEPT
CONCEPT RATIONALE
The transportation concept describes the operating conditions and physical facilities required to provide those conditions that could exist on SR-91 after considering the conclusions, priorities and strategies discussed in the District System Management Plan (DSMP), the SCAG Regional Transportation Plan (RTP), and other planning documents. The route concept represents what could reasonably be accomplished to facilitate the mobility of traffic desiring to use the route. It assumes that management improvement strategies and system operation improvements to maximize the efficiency on SR-91 will be implemented.
The transportation concept is composed of a Level of Service (LOS) and facility component. The concept LOS indicates the minimum level of service the District would allow on a route prior to proposing an alternative to improve operating conditions. The concept facility is the facility that could be developed to maintain or attain the concept LOS.
PLANNED AND PROGRAMMED PROJECTS AND STRATEGIES
FROM TO DESCRIPTION PROJECT COMPLETION BY
Lead Agency
Project
2012 Financially Constrained RTP Projects 91/105/110/405 Ramp and Interchange Improvements
(South Bay) RTP ID – 1M1003 2014 South
Bay
RTP 2012 Strategic (Un-constrained Projects) 91/605/405 Additional SR-91/I-605/I-405
Solutions (Beyond Identified Hot Spots) RTP ID – S1120039
Metro
Metro Strategic Unfunded Projects/METRO LRTP 2009 SR-91/I-110 ` Partial HOV Connector – from east to
south and from east to north
SR -91 Additional lanes in each direction (I-710 to Orange Co. Line)
Metro
SR-91 Conduct Toll Lanes feasibility Study Metro Demonstration Projects from Compass Blueprint (Compass Blueprint is a new way to look at how Southern California grows. It is driven by Mobility, Livability, Prosperity and Sustainability.) Compton General Plan – identifies the Artesia Blue Line Station and the Compton Community College as priority areas for increased mixed-use development. Both study areas are just north of the corridor on either side of the Alameda Street. Bellflower Alondra Specific Plan – project areas is approximately 1 mile north of the corridor at the Bellflower Blvd off-ramps. Cerritos Station Area TOD Concept Plan – Project area located directly southeast of SR-91 and I-605 Interchange. Study does call for more density in the area, therefore, may impact traffic flow to the corridor.
23
CONCLUSION - Traffic volume is forecasted to increase on SR-91 due to growth in population, housing and employment along this route and throughout the region. Growth in the region will continue to create mobility challenges and put additional stresses on our transportation system. Southern California is not only an important component of California’s economy but it is also vital to the United States and world’s economy as a whole. It is critical that mobility be maintained and improved in order to sustain the economic growth that is expected. In addition to sustaining the economic vitality of the region, mobility is also an important component in enhancing the quality of life for the residents in this region.
District 7 Office employs a variety of strategies to address current congestion challenges including:
• High Occupancy Vehicle Lane (HOV) • Ramp Metering • Congestion Pricing (Toll Lanes) • Changeable Message Signs (CMS)
Several regional freeway capacity expansion projects are in the planning process, under development or under construction which will assist in decreasing congestion.
Constructing an HOV or Managed Lane system continues to be a priority.
In addition to the projects on our system, Caltrans support programs such as Transit Oriented Development (TOD). TOD is a moderate to higher density development, located within easy walk of major transit stop. Generally with a mix of residential, employment and shopping opportunities designed for pedestrians. Research have shown that these types of development increase the number of trips made by transit, walking and cycling thus reducing the number of car trips and reducing tailpipe emissions
SCAG’s 2012-2035 Regional Transportation Plan /Sustainable Communities Strategy (RTP/SCS) identifies High Quality Transit Areas (HQTAs) meeting definitions established in SB 375. These areas are intended to direct and prioritize future growth, and further, establish eligibility for certain types of projects to access CEQA streamlining. However, residential and other types of development along freeways can be associated with increased health risk due to emissions exposure. Therefore, future projects should refer to available information resources, including but not limited to SCAG’s 2012-2035 RTP/SCS Environmental Justice Appendix and Program Environmental Impact Report.
The highway system is only one component of the transportation infrastructure; but it plays a very important role in providing mobility for the region. To achieve the desired minimum acceptable level of service, additional lanes will be needed beyond those planned and programmed in the 2012 RTP.

24
Appendix A
GLOSSARY OF TERMS AND ACRONYMS
Acronyms
AADT Annual Average Daily Traffic
ADT Average Daily Traffic
AQMD Air Quality Management District
CALTRANS California Department of Transportation
CMP Congestion Management Plan
FHWA Federal Highway Administration
HOV High Occupancy Vehicle Lane
HOT High Occupancy Toll Lane
IC Interchange
ITS Intelligent Transportation System
LOS Level of Service
MF Mixed Flow Lane
MFE Mixed Flow Equivalent
ML Managed Lane
MPO Metropolitan Planning Organizations
RTP Regional Transportation Plan
RTIP Regional Transportation Improvement Program
RTPA Regional Transportation Planning Agency
SCAG Southern California Association of Governments
SHOPP State Highway Operation Protection Program
STIP State Transportation Improvement Program

25
T Truck Lane
TDM Transportation Demand Management
V/C Volume to Capacity Ratio
VMT Vehicle Miles Travel
26
DEFINITIONS
Annual Average Daily Traffic (AADT) - AADT is the total volume for the year divided by 365 days. The traffic count year is from October 1st through September 30th.
Concept LOS – The minimum acceptable level of service over the next 20-25 years.
Facility Concept – Describes the facility and strategies that may be needed within 20-25 years. This can include capacity increasing, state highway, bicycle facility, pedestrian facility, transit facility, non-capacity increasing operational improvements, new managed lanes, conversion of existing managed lanes to another managed lane type or characteristic, TMS field elements, transportation demand management, and incident management.
Headway – The time between two successive vehicles as they pass a point on the roadway, measured from the same common feature of both vehicles.
Level of Service (LOS) – It is a qualitative measure describing operational conditions within a traffic stream and their perception by motorists. A LOS definition generally describes these conditions in terms of speed, travel time, freedom to maneuver, traffic interruption, comfort and convenience. LOS can be categorized as follows:
LOS A describes free flowing conditions.
LOS B also indicative of free flow conditions. Average travel speeds are the same as in LOS A, but drivers have slightly less freedom to maneuver.
LOS C represents a range in which the influence of traffic density on operations becomes marked. The ability to maneuver with the traffic stream is now clearly affected by the present of other vehicles.
LOS D demonstrates a range in which the ability to maneuver is severely restricted because of the traffic congestion. Travel speed begins to be reduced as traffic volume increases.
LOS E reflects operations at or near capacity and is quite unstable. Because the limits of the level of service are approached, service disruptions cannot be damped or readily dissipated.
LOS F is a stop and go, low speed conditions with little or poor maneuverability. Speed and traffic flow may drop to zero and considerable delays occur. For intersections, LOS F describes operations with delay in excess of 60 seconds per vehicle.
Mainline – includes travel way for through traffic but not freeway to freeway interchanges, local road interchanges, ramps, or auxiliary lanes.
27
Peak Hour – The hour of the day in which the maximum volume occurs across a point on the highway.
Peak Hour Volume – The hourly volume during the highest hour traffic volume of the day traversing a point on a highway segment. It is generally between six percent and 10 percent of the Annual Daily Traffic (ADT). The lower values are generally found on roadways with low volumes.
Post Mile (PM) – A post mile is an identified point on the State Highway System. The milepost values increase from the beginning of a route within a county to the next county line. The milepost values start over again at each county line. Mile post values usually increase from south to north or west to east depending upon the general direction the route follows within the State. The milepost at a given location will remain the same year after year. When a section of road is relocated, new milepost (usually noted by an alphabetical prefix such as “R” or “M”) are established for it.
Segment – A portion of a facility between two points.
Vehicle Miles Traveled (VMT) – Is the total number of miles traveled by motor vehicles on a road or highway segments.

28
RESOURCES
Air Quality Management Plan, South Coast Air Quality Management District, December, 2012 2008 Annual Average Daily Truck Traffic on the California State Highway System Draft Interregional Transportation Strategic Plan – Dec. 2012 2011 Traffic Volumes on California State Highways Congestion Management Program for Los Angeles County, Los Angeles County Metropolitan Transportation Authority, October, 2010 District System Management Plan, California Department of Transportation, District 7, August 1996 DRAFT Southern California Mobility Plan – August 2012 Long-Range Transportation Plan. Los Angeles County Metropolitan Transportation Authority, 2009 2012-2035 Regional Transportation Plan, (Adopted), Southern California Association of Governments, April 2012 Ramp Meter Development Plan - December 2011 Transportation Concept Report – SR-91 – April 2005