direxion funds annual report - 2008
TRANSCRIPT
8/14/2019 Direxion Funds Annual Report - 2008
http://slidepdf.com/reader/full/direxion-funds-annual-report-2008 1/87
A N N U A L R E P O R T A U G U S T 3 1 , 2 0 0 833 Whitehall Street, 10th Floor New York, New York 10004 (800) 851-0511
B U L L F U N D S B E A R F U N D S
D O M E S T I C I N D E X E Q U I T Y F U N D S
Small Cap Bull 2.5X FundNASDAQ-100» Bull 1.25X Fund
(formerly OTC Plus Fund)
Dow 30SM Bull 1.25X Fund(formerly Dow 30SM Plus Fund)
Small Cap Bear 2.5X Fund
I N T E R N A T I O N A L F U N D S
Emerging Markets Bull 2X Fund Emerging Markets Bear 2X Fund
Developed Markets Bull 2X Fund Developed Markets Bear 2X Fund
China Bull 2X Fund China Bear 2X Fund
India Bull 2X Fund
S P E C I A L T Y F U N D S
Commodity Bull 2X Fund(formerly Commodity Bull Fund)
F I X E D I N C O M E F U N D S
10 Year Note Bull 2.5X Fund 10 Year Note Bear 2.5X Fund
Dynamic HY Bond Fund HY Bear Fund
U . S . G O V E R N M E N T M O N E Y M A R K E T F U N D
8/14/2019 Direxion Funds Annual Report - 2008
http://slidepdf.com/reader/full/direxion-funds-annual-report-2008 2/87
Table of Contents
Letter to Shareholders . . . . . . . . . . . . . . . . . . . . 2
Performance Summary . . . . . . . . . . . . . . . . . . . . 4
Expense Example . . . . . . . . . . . . . . . . . . . . . . . . 20
Allocation of Portfolio Holdings. . . . . . . . . . . . . . 22
Schedule of Investments . . . . . . . . . . . . . . . . . . 23
Financial Statements. . . . . . . . . . . . . . . . . . . . . . 41
Financial Highlights . . . . . . . . . . . . . . . . . . . . . . . 59
Notes to the Financial Statements . . . . . . . . . . . 61
Report of Independent Registered Public
Accounting Firm . . . . . . . . . . . . . . . . . . . . . . . 76
Additional Information . . . . . . . . . . . . . . . . . . . . . 77
Information on Board of Trustees and Officers . . 81
8/14/2019 Direxion Funds Annual Report - 2008
http://slidepdf.com/reader/full/direxion-funds-annual-report-2008 3/87
Help Preserve the Environment – Go Green!
Go paperless with Direxion e-Delivery – a service allowing shareholders to reduce clutter with fullonline access to regulatory documents. Begin the preservation process with e-delivery.
With Direxion e-Delivery you can:
• Receive email notifications when your most recent shareholder communications are available forreview.
• Access prospectuses, annual reports and semi-annual reports online.
It’s easy to enroll:
1. Visit www.direxionfunds.com/edelivery
2. Follow the simple enrollment instructions
If you have questions about Direxion e-Delivery services, contact one of our shareholder represen-tatives at 800-851-0511.
8/14/2019 Direxion Funds Annual Report - 2008
http://slidepdf.com/reader/full/direxion-funds-annual-report-2008 4/87
LETTER TO SHAREHOLDERS
Dear Shareholders,
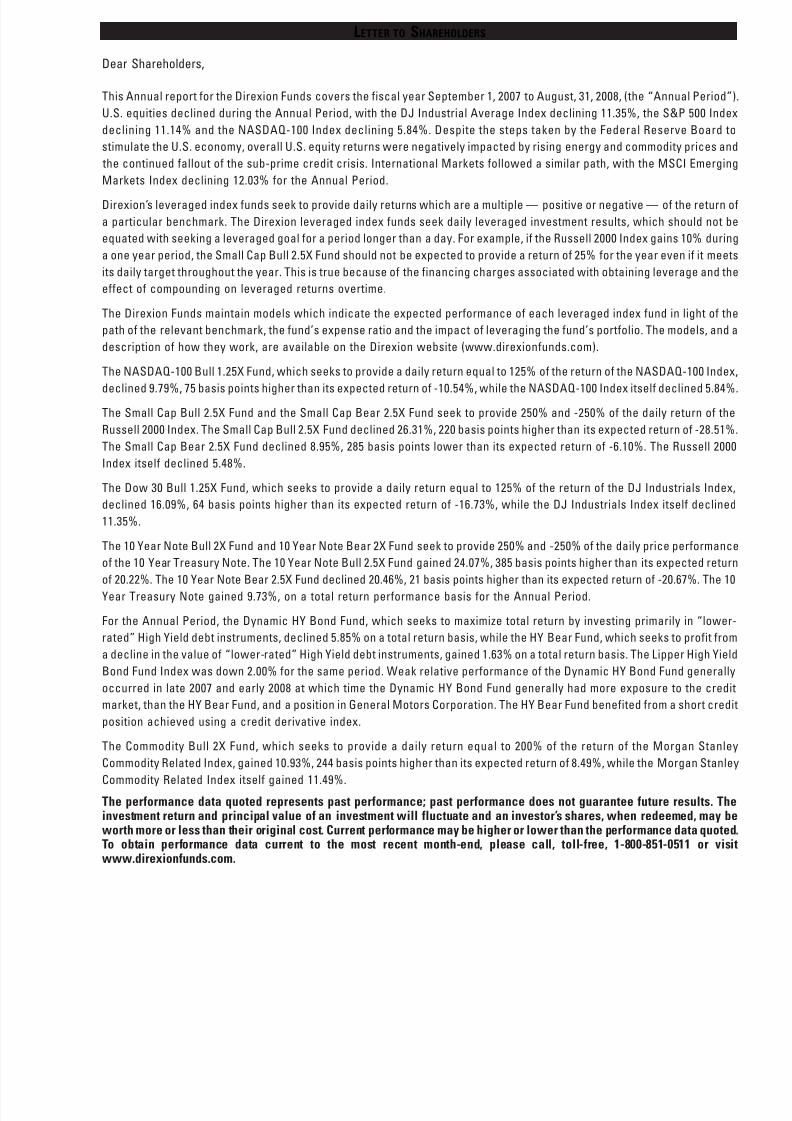
This Annual report for the Direxion Funds covers the fiscal year September 1, 2007 to August, 31, 2008, (the “Annual Period”)
U.S. equities declined during the Annual Period, with the DJ Industrial Average Index declining 11.35%, the S&P 500 Index
declining 11.14% and the NASDAQ-100 Index declining 5.84%. Despite the steps taken by the Federal Reserve Board to
stimulate the U.S. economy, overall U.S. equity returns were negatively impacted by rising energy and commodity prices and
the continued fallout of the sub-prime credit crisis. International Markets followed a similar path, with the MSCI Emerging
Markets Index declining 12.03% for the Annual Period.
Direxion’s leveraged index funds seek to provide daily returns which are a multiple — positive or negative — of the return of
a particular benchmark. The Direxion leveraged index funds seek daily leveraged investment results, which should not be
equated with seeking a leveraged goal for a period longer than a day. For example, if the Russell 2000 Index gains 10% during
a one year period, the Small Cap Bull 2.5X Fund should not be expected to provide a return of 25% for the year even if it meets
its daily target throughout the year. This is true because of the financing charges associated with obtaining leverage and the
effect of compounding on leveraged returns overtime.
The Direxion Funds maintain models which indicate the expected performance of each leveraged index fund in light of the
path of the relevant benchmark, the fund’s expense ratio and the impact of leveraging the fund’s portfolio. The models, and a
description of how they work, are available on the Direxion website (www.direxionfunds.com).
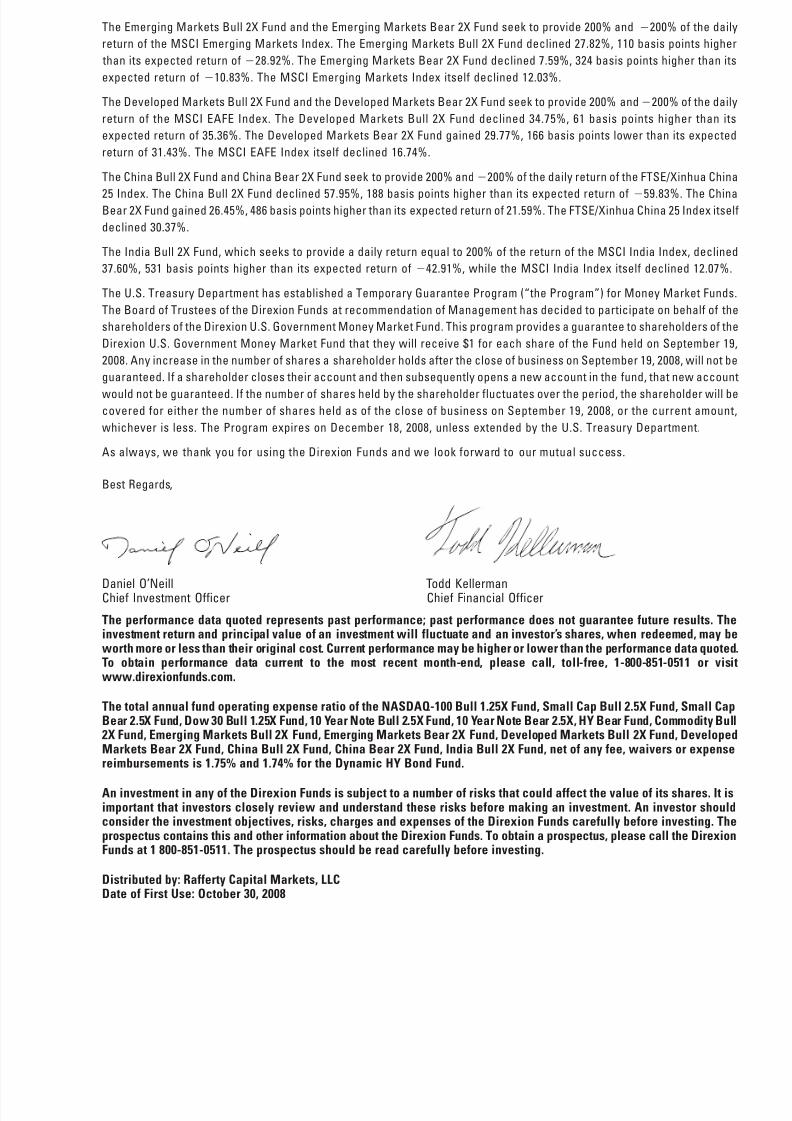
The NASDAQ-100 Bull 1.25X Fund, which seeks to provide a daily return equal to 125% of the return of the NASDAQ-100 Index,
declined 9.79%, 75 basis points higher than its expected return of -10.54%, while the NASDAQ-100 Index itself declined 5.84%.
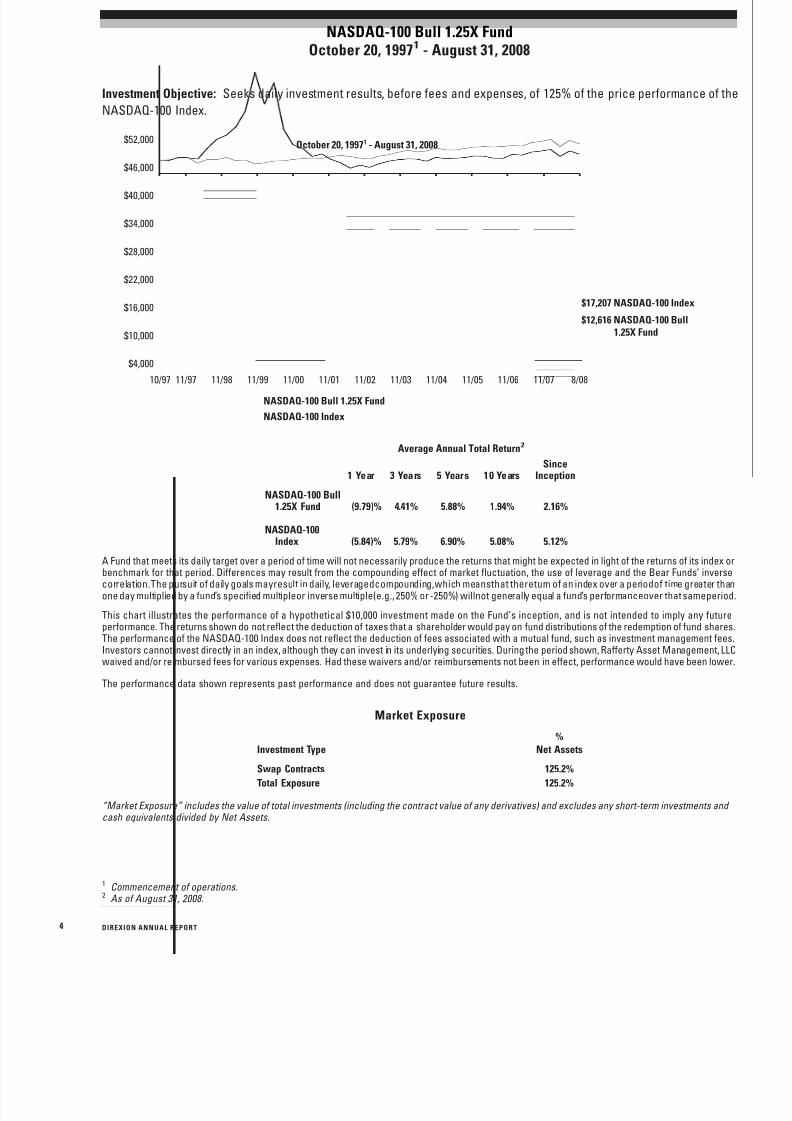
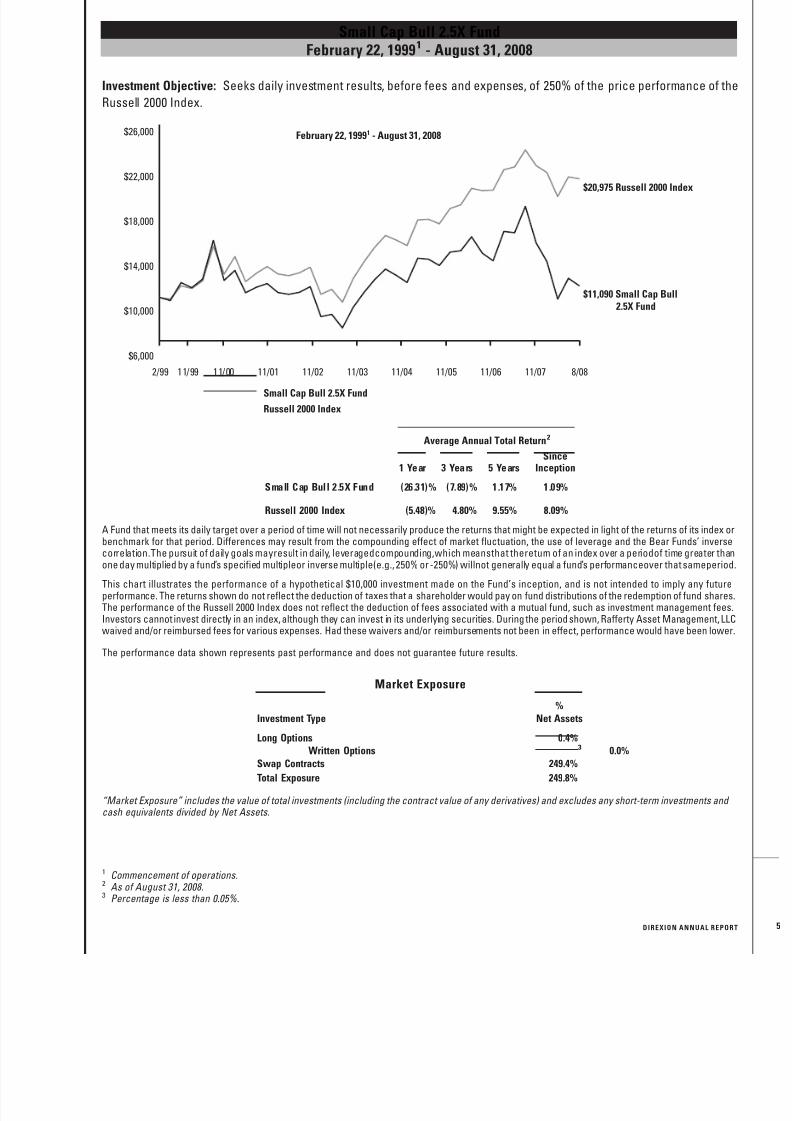
The Small Cap Bull 2.5X Fund and the Small Cap Bear 2.5X Fund seek to provide 250% and -250% of the daily return of the
Russell 2000 Index. The Small Cap Bull 2.5X Fund declined 26.31%, 220 basis points higher than its expected return of -28.51%.
The Small Cap Bear 2.5X Fund declined 8.95%, 285 basis points lower than its expected return of -6.10%. The Russell 2000
Index itself declined 5.48%.
The Dow 30 Bull 1.25X Fund, which seeks to provide a daily return equal to 125% of the return of the DJ Industrials Index,
declined 16.09%, 64 basis points higher than its expected return of -16.73%, while the DJ Industrials Index itself declined
11.35%.
The 10 Year Note Bull 2X Fund and 10 Year Note Bear 2X Fund seek to provide 250% and -250% of the daily price performance
of the 10 Year Treasury Note. The 10 Year Note Bull 2.5X Fund gained 24.07%, 385 basis points higher than its expected return
of 20.22%. The 10 Year Note Bear 2.5X Fund declined 20.46%, 21 basis points higher than its expected return of -20.67%. The 10
Year Treasury Note gained 9.73%, on a total return performance basis for the Annual Period.
For the Annual Period, the Dynamic HY Bond Fund, which seeks to maximize total return by investing primarily in “lower-
rated” High Yield debt instruments, declined 5.85% on a total return basis, while the HY Bear Fund, which seeks to profit from
a decline in the value of “lower-rated” High Yield debt instruments, gained 1.63% on a total return basis. The Lipper High Yield
Bond Fund Index was down 2.00% for the same period. Weak relative performance of the Dynamic HY Bond Fund generally
occurred in late 2007 and early 2008 at which time the Dynamic HY Bond Fund generally had more exposure to the credit
market, than the HY Bear Fund, and a position in General Motors Corporation. The HY Bear Fund benefited from a short credit
position achieved using a credit derivative index.
The Commodity Bull 2X Fund, which seeks to provide a daily return equal to 200% of the return of the Morgan Stanley
Commodity Related Index, gained 10.93%, 244 basis points higher than its expected return of 8.49%, while the Morgan StanleyCommodity Related Index itself gained 11.49%.
The performance data quoted represents past performance; past performance does not guarantee future results. Theinvestment return and principal value of an investment will fluctuate and an investor’s shares, when redeemed, may beworth more or less than their original cost. Current performance may be higher or lower than the performance data quoted.To obtain performance data current to the most recent month-end, please call, toll-free, 1-800-851-0511 or visitwww.direxionfunds.com.
8/14/2019 Direxion Funds Annual Report - 2008
http://slidepdf.com/reader/full/direxion-funds-annual-report-2008 5/87
The Emerging Markets Bull 2X Fund and the Emerging Markets Bear 2X Fund seek to provide 200% and 200% of the daily
return of the MSCI Emerging Markets Index. The Emerging Markets Bull 2X Fund declined 27.82%, 110 basis points higher
than its expected return of 28.92%. The Emerging Markets Bear 2X Fund declined 7.59%, 324 basis points higher than its
expected return of 10.83%. The MSCI Emerging Markets Index itself declined 12.03%.
The Developed Markets Bull 2X Fund and the Developed Markets Bear 2X Fund seek to provide 200% and200% of the daily
return of the MSCI EAFE Index. The Developed Markets Bull 2X Fund declined 34.75%, 61 basis points higher than its
expected return of 35.36%. The Developed Markets Bear 2X Fund gained 29.77%, 166 basis points lower than its expected
return of 31.43%. The MSCI EAFE Index itself declined 16.74%.
The China Bull 2X Fund and China Bear 2X Fund seek to provide 200% and200% of the daily return of the FTSE/Xinhua China
25 Index. The China Bull 2X Fund declined 57.95%, 188 basis points higher than its expected return of
59.83%. The ChinaBear 2X Fund gained 26.45%, 486 basis points higher than its expected return of 21.59%. The FTSE/Xinhua China 25 Index itself
declined 30.37%.
The India Bull 2X Fund, which seeks to provide a daily return equal to 200% of the return of the MSCI India Index, declined
37.60%, 531 basis points higher than its expected return of 42.91%, while the MSCI India Index itself declined 12.07%.
The U.S. Treasury Department has established a Temporary Guarantee Program (“the Program”) for Money Market Funds.
The Board of Trustees of the Direxion Funds at recommendation of Management has decided to participate on behalf of the
shareholders of the Direxion U.S. Government Money Market Fund. This program provides a guarantee to shareholders of the
Direxion U.S. Government Money Market Fund that they will receive $1 for each share of the Fund held on September 19,
2008. Any increase in the number of shares a shareholder holds after the close of business on September 19, 2008, will not be
guaranteed. If a shareholder closes their account and then subsequently opens a new account in the fund, that new accountwould not be guaranteed. If the number of shares held by the shareholder fluctuates over the period, the shareholder will be
covered for either the number of shares held as of the close of business on September 19, 2008, or the current amount,
whichever is less. The Program expires on December 18, 2008, unless extended by the U.S. Treasury Department.
As always, we thank you for using the Direxion Funds and we look forward to our mutual success.
Best Regards,
Daniel O’Neill Todd KellermanChief Investment Officer Chief Financial Officer
The performance data quoted represents past performance; past performance does not guarantee future results. Theinvestment return and principal value of an investment will fluctuate and an investor’s shares, when redeemed, may beworth more or less than their original cost. Current performance may be higher or lower than the performance data quoted.To obtain performance data current to the most recent month-end, please call, toll-free, 1-800-851-0511 or visitwww.direxionfunds.com.
The total annual fund operating expense ratio of the NASDAQ-100 Bull 1.25X Fund, Small Cap Bull 2.5X Fund, Small CapBear 2.5X Fund, Dow 30 Bull 1.25X Fund, 10 Year Note Bull 2.5X Fund, 10 Year Note Bear 2.5X, HY Bear Fund, Commodity Bull2X Fund, Emerging Markets Bull 2X Fund, Emerging Markets Bear 2X Fund, Developed Markets Bull 2X Fund, DevelopedMarkets Bear 2X Fund, China Bull 2X Fund, China Bear 2X Fund, India Bull 2X Fund, net of any fee, waivers or expense
reimbursements is 1.75% and 1.74% for the Dynamic HY Bond Fund.
An investment in any of the Direxion Funds is subject to a number of risks that could affect the value of its shares. It isimportant that investors closely review and understand these risks before making an investment. An investor shouldconsider the investment objectives, risks, charges and expenses of the Direxion Funds carefully before investing. Theprospectus contains this and other information about the Direxion Funds. To obtain a prospectus, please call the DirexionFunds at 1 800-851-0511. The prospectus should be read carefully before investing.
Distributed by: Rafferty Capital Markets, LLCDate of First Use: October 30, 2008
8/14/2019 Direxion Funds Annual Report - 2008
http://slidepdf.com/reader/full/direxion-funds-annual-report-2008 6/87
NASDAQ-100 Bull 1.25X FundOctober 20, 19971 - August 31, 2008
Investment Objective: Seeks daily investment results, before fees and expenses, of 125% of the price performance of the
NASDAQ-100 Index.
NASDAQ-100 Index
NASDAQ-100 Bull 1.25X Fund
$17,207 NASDAQ-100 Index
$12,616 NASDAQ-100 Bull1.25X Fund
October 20, 19971 - August 31, 2008
$4,000
$10,000
$16,000
$22,000
$28,000
$34,000
$40,000
$46,000
$52,000
11/04 8/0811/0711/0611/0511/0311/0211/0111/0011/9911/9811/9710/97
1 Year 3 Years 5 Years 10 YearsSince
Inception
Average Annual Total Return2
NASDAQ-100 Bull1.25X Fund (9.79)% 4.41% 5.88% 1.94% 2.16%
NASDAQ-100Index (5.84)% 5.79% 6.90% 5.08% 5.12%
A Fund that meets its daily target over a period of time will not necessarily produce the returns that might be expected in light of the returns of its index or
benchmark for that period. Differences may result from the compounding effect of market fluctuation, the use of leverage and the Bear Funds’ inversecorrelation.The pursuit of daily goals mayresult in daily, leveragedcompounding,which meansthat thereturn of an index over a periodof time greater thanone day multiplied by a fund’s specified multipleor inverse multiple(e.g., 250% or -250%) willnot generally equal a fund’s performanceover that sameperiod
This chart illustrates the performance of a hypothetical $10,000 investment made on the Fund’s inception, and is not intended to imply any futureperformance. The returns shown do not reflect the deduction of taxes that a shareholder would pay on fund distributions of the redemption of fund sharesThe performance of the NASDAQ-100 Index does not reflect the deduction of fees associated with a mutual fund, such as investment management fees.Investors cannot invest directly in an index, although they can invest in its underlying securities. During the period shown, Rafferty Asset Management, LLCwaived and/or reimbursed fees for various expenses. Had these waivers and/or reimbursements not been in effect, performance would have been lower
The performance data shown represents past performance and does not guarantee future results.
Market Exposure
Investment Type
%
Net Assets
Swap Contracts 125.2%Total Exposure 125.2%
“Market Exposure” includes the value of total investments (including the contract value of any derivatives) and excludes any short-term investments and cash equivalents divided by Net Assets.
1 Commencement of operations.2 As of August 31, 2008.
D I REXI O N A NNU A L REPO RT4
8/14/2019 Direxion Funds Annual Report - 2008
http://slidepdf.com/reader/full/direxion-funds-annual-report-2008 7/87
Small Cap Bull 2.5X FundFebruary 22, 19991 - August 31, 2008
Investment Objective: Seeks daily investment results, before fees and expenses, of 250% of the price performance of the
Russell 2000 Index.
Russell 2000 Index
Small Cap Bull 2.5X Fund
$20,975 Russell 2000 Index
$11,090 Small Cap Bull2.5X Fund
February 22, 19991 - August 31, 2008
$6,000
$10,000
$18,000
$14,000
$26,000
$22,000
11/04 8/0811/0711/0611/0511/0311/0211/0111/99 11/002/99
1 Year 3 Years 5 YearsSince
Inception
Average Annual Total Return2
Small Cap Bull 2.5X Fund (26.31)% (7.89)% 1.17% 1.09%
Russell 2000 Index (5.48)% 4.80% 9.55% 8.09%
A Fund that meets its daily target over a period of time will not necessarily produce the returns that might be expected in light of the returns of its index orbenchmark for that period. Differences may result from the compounding effect of market fluctuation, the use of leverage and the Bear Funds’ inversecorrelation.The pursuit of daily goals mayresult in daily, leveragedcompounding,which meansthat thereturn of an index over a periodof time greater thanone day multiplied by a fund’s specified multipleor inverse multiple(e.g., 250% or -250%) willnot generally equal a fund’s performanceover that sameperiod
This chart illustrates the performance of a hypothetical $10,000 investment made on the Fund’s inception, and is not intended to imply any futureperformance. The returns shown do not reflect the deduction of taxes that a shareholder would pay on fund distributions of the redemption of fund sharesThe performance of the Russell 2000 Index does not reflect the deduction of fees associated with a mutual fund, such as investment management fees.Investors cannot invest directly in an index, although they can invest in its underlying securities. During the period shown, Rafferty Asset Management, LLCwaived and/or reimbursed fees for various expenses. Had these waivers and/or reimbursements not been in effect, performance would have been lower
The performance data shown represents past performance and does not guarantee future results.
Market Exposure
Investment Type
%
Net Assets
Long Options 0.4%
Written Options 0.0%3
Swap Contracts 249.4%Total Exposure 249.8%
“Market Exposure” includes the value of total investments (including the contract value of any derivatives) and excludes any short-term investments and cash equivalents divided by Net Assets.
1 Commencement of operations.2 As of August 31, 2008.3 Percentage is less than 0.05%.
D I REXI O N A NNU A L REPO RT
8/14/2019 Direxion Funds Annual Report - 2008
http://slidepdf.com/reader/full/direxion-funds-annual-report-2008 8/87
Small Cap Bear 2.5X FundDecember 21, 19991 - August 31, 2008
Investment Objective: Seeks daily investment results, before fees and expenses, of 250% of the inverse of the price
performance of the Russell 2000 Index.
Russell 2000 Index
Small Cap Bear 2.5X Fund
$17,340 Russell 2000 Index
$2,970 Small Cap Bear2.5X Fund
December 21, 19991 - August 31, 2008
$2,000
$4,000
$6,000
$10,000
$8,000
$12,000
$14,000
$16,000
$18,000
$20,000
11/04 8/0811/0711/0611/0511/0311/0211/0111/0012/99
1 Year 3 Years 5 YearsSince
Inception
Average Annual Total Return2
Small Cap Bear 2.5X Fund (8.95)% (16.62)% (18.29)% (13.03)%
Russell 2000 Index (5.48)% 4.80% 9.55% 6.53%
A Fund that meets its daily target over a period of time will not necessarily produce the returns that might be expected in light of the returns of its index orbenchmark for that period. Differences may result from the compounding effect of market fluctuation, the use of leverage and the Bear Funds’ inversecorrelation.The pursuit of daily goals mayresult in daily, leveragedcompounding,which meansthat thereturn of an index over a periodof time greater thanone day multiplied by a fund’s specified multipleor inverse multiple(e.g., 250% or -250%) willnot generally equal a fund’s performanceover that sameperiod
This chart illustrates the performance of a hypothetical $10,000 investment made on the Fund’s inception, and is not intended to imply any futureperformance. The returns shown do not reflect the deduction of taxes that a shareholder would pay on fund distributions of the redemption of fund sharesThe performance of the Russell 2000 Index does not reflect the deduction of fees associated with a mutual fund, such as investment management fees.Investors cannot invest directly in an index, although they can invest in its underlying securities. During the period shown, Rafferty Asset Management, LLCwaived and/or reimbursed fees for various expenses. Had these waivers and/or reimbursements not been in effect, performance would have been lower
The performance data shown represents past performance and does not guarantee future results.
Market Exposure
Investment Type
%
Net Assets
Long Options 0.1% Written Options 0.0%3
Swap Contracts (250.1)%Total Exposure (250.0)%
“Market Exposure” includes the value of total investments (including the contract value of any derivatives) and excludes any short-term investments and cash equivalents divided by Net Assets.
1 Commencement of operations.2 As of August 31, 2008.3 Percentage is less than 0.05%.
D I REXI O N A NNU A L REPO RT6
8/14/2019 Direxion Funds Annual Report - 2008
http://slidepdf.com/reader/full/direxion-funds-annual-report-2008 9/87
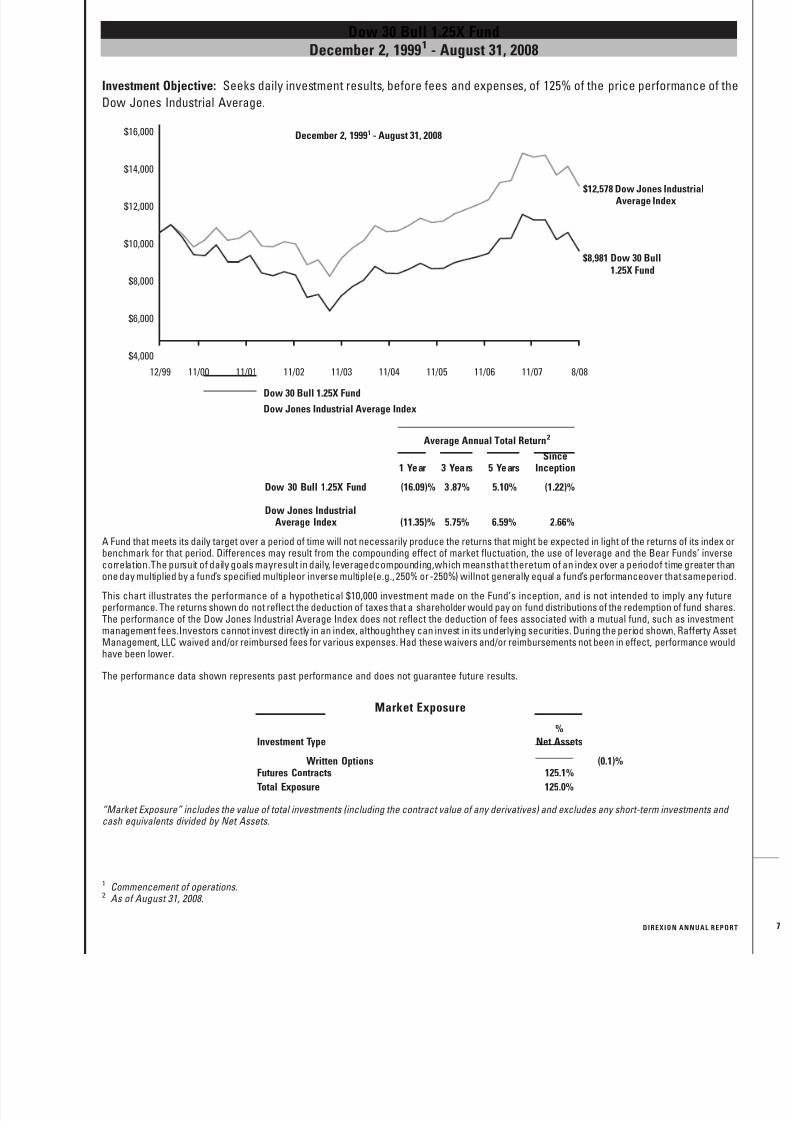
Dow 30 Bull 1.25X FundDecember 2, 19991 - August 31, 2008
Investment Objective: Seeks daily investment results, before fees and expenses, of 125% of the price performance of the
Dow Jones Industrial Average.
Dow Jones Industrial Average Index
Dow 30 Bull 1.25X Fund
$12,578 Dow Jones IndustrialAverage Index
$8,981 Dow 30 Bull1.25X Fund
December 2, 19991 - August 31, 2008
$4,000
$6,000
$10,000
$8,000
$12,000
$14,000
$16,000
11/04 8/0811/0711/0611/0511/0311/0211/0111/0012/99
1 Year 3 Years 5 YearsSince
Inception
Average Annual Total Return2
Dow 30 Bull 1.25X Fund (16.09)% 3.87% 5.10% (1.22)%
Dow Jones IndustrialAverage Index (11.35)% 5.75% 6.59% 2.66%
A Fund that meets its daily target over a period of time will not necessarily produce the returns that might be expected in light of the returns of its index orbenchmark for that period. Differences may result from the compounding effect of market fluctuation, the use of leverage and the Bear Funds’ inversecorrelation.The pursuit of daily goals mayresult in daily, leveragedcompounding,which meansthat thereturn of an index over a periodof time greater than
one day multiplied by a fund’s specified multipleor inverse multiple(e.g., 250% or -250%) willnot generally equal a fund’s performanceover that sameperiod
This chart illustrates the performance of a hypothetical $10,000 investment made on the Fund’s inception, and is not intended to imply any futureperformance. The returns shown do not reflect the deduction of taxes that a shareholder would pay on fund distributions of the redemption of fund sharesThe performance of the Dow Jones Industrial Average Index does not reflect the deduction of fees associated with a mutual fund, such as investmentmanagement fees.Investors cannot invest directly in an index, althoughthey can invest in its underlying securities. During the period shown, Rafferty AssetManagement, LLC waived and/or reimbursed fees for various expenses. Had these waivers and/or reimbursements not been in effect, performance wouldhave been lower.
The performance data shown represents past performance and does not guarantee future results.
Market Exposure
Investment Type
%
Net Assets
Written Options (0.1)%Futures Contracts 125.1%
Total Exposure 125.0%
“Market Exposure” includes the value of total investments (including the contract value of any derivatives) and excludes any short-term investments and cash equivalents divided by Net Assets.
1 Commencement of operations.2 As of August 31, 2008.
D I REXI O N A NNU A L REPO RT
8/14/2019 Direxion Funds Annual Report - 2008
http://slidepdf.com/reader/full/direxion-funds-annual-report-2008 10/87
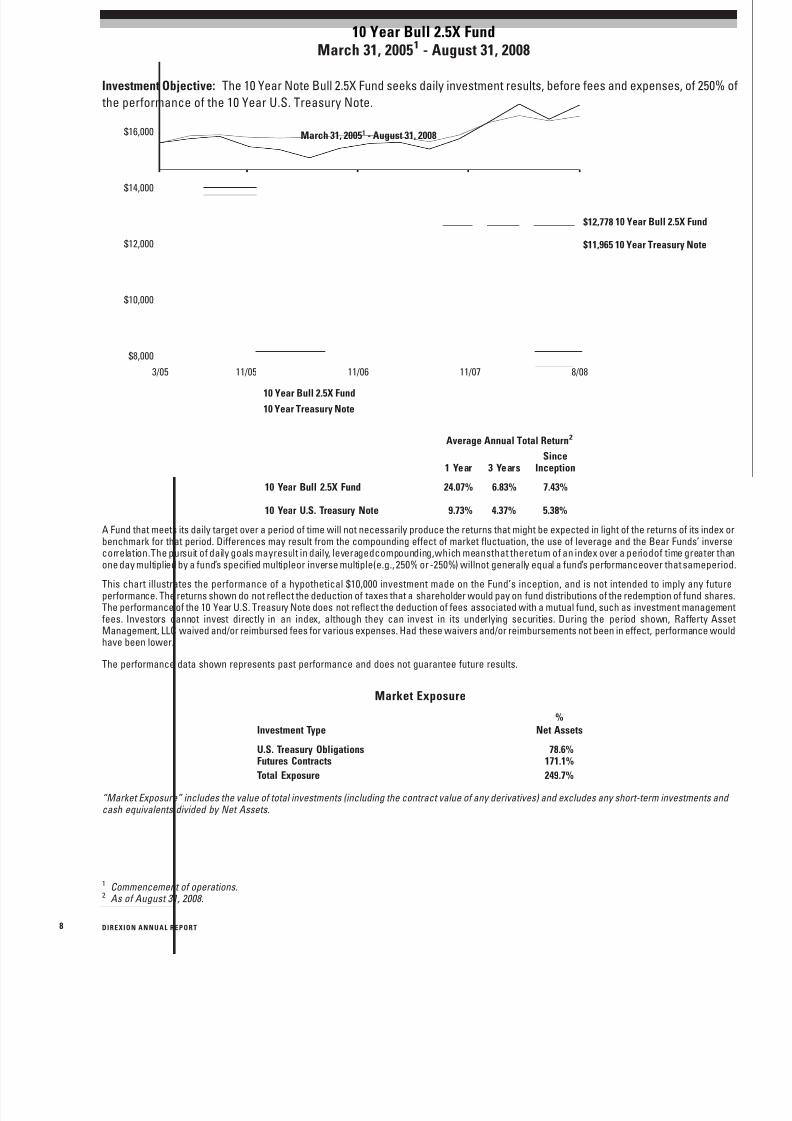
10 Year Bull 2.5X FundMarch 31, 20051 - August 31, 2008
Investment Objective: The 10 Year Note Bull 2.5X Fund seeks daily investment results, before fees and expenses, of 250% of
the performance of the 10 Year U.S. Treasury Note.
10 Year Treasury Note
10 Year Bull 2.5X Fund
$12,778 10 Year Bull 2.5X Fund
$11,965 10 Year Treasury Note
March 31, 20051 - August 31, 2008
$8,000
$10,000
$12,000
$14,000
$16,000
8/0811/0711/0611/053/05
1 Year 3 YearsSince
Inception
Average Annual Total Return2
10 Year Bull 2.5X Fund 24.07% 6.83% 7.43%
10 Year U.S. Treasury Note 9.73% 4.37% 5.38%
A Fund that meets its daily target over a period of time will not necessarily produce the returns that might be expected in light of the returns of its index orbenchmark for that period. Differences may result from the compounding effect of market fluctuation, the use of leverage and the Bear Funds’ inversecorrelation.The pursuit of daily goals mayresult in daily, leveragedcompounding,which meansthat thereturn of an index over a periodof time greater thanone day multiplied by a fund’s specified multipleor inverse multiple(e.g., 250% or -250%) willnot generally equal a fund’s performanceover that sameperiod
This chart illustrates the performance of a hypothetical $10,000 investment made on the Fund’s inception, and is not intended to imply any futureperformance. The returns shown do not reflect the deduction of taxes that a shareholder would pay on fund distributions of the redemption of fund sharesThe performance of the 10 Year U.S. Treasury Note does not reflect the deduction of fees associated with a mutual fund, such as investment managementfees. Investors cannot invest directly in an index, although they can invest in its underlying securities. During the period shown, Rafferty AssetManagement, LLC waived and/or reimbursed fees for various expenses. Had these waivers and/or reimbursements not been in effect, performance wouldhave been lower.
The performance data shown represents past performance and does not guarantee future results.
Market Exposure
Investment Type
%
Net Assets
U.S. Treasury Obligations 78.6%
Futures Contracts 171.1%Total Exposure 249.7%
“Market Exposure” includes the value of total investments (including the contract value of any derivatives) and excludes any short-term investments and cash equivalents divided by Net Assets.
1 Commencement of operations.2 As of August 31, 2008.
D I REXI O N A NNU A L REPO RT8
8/14/2019 Direxion Funds Annual Report - 2008
http://slidepdf.com/reader/full/direxion-funds-annual-report-2008 11/87
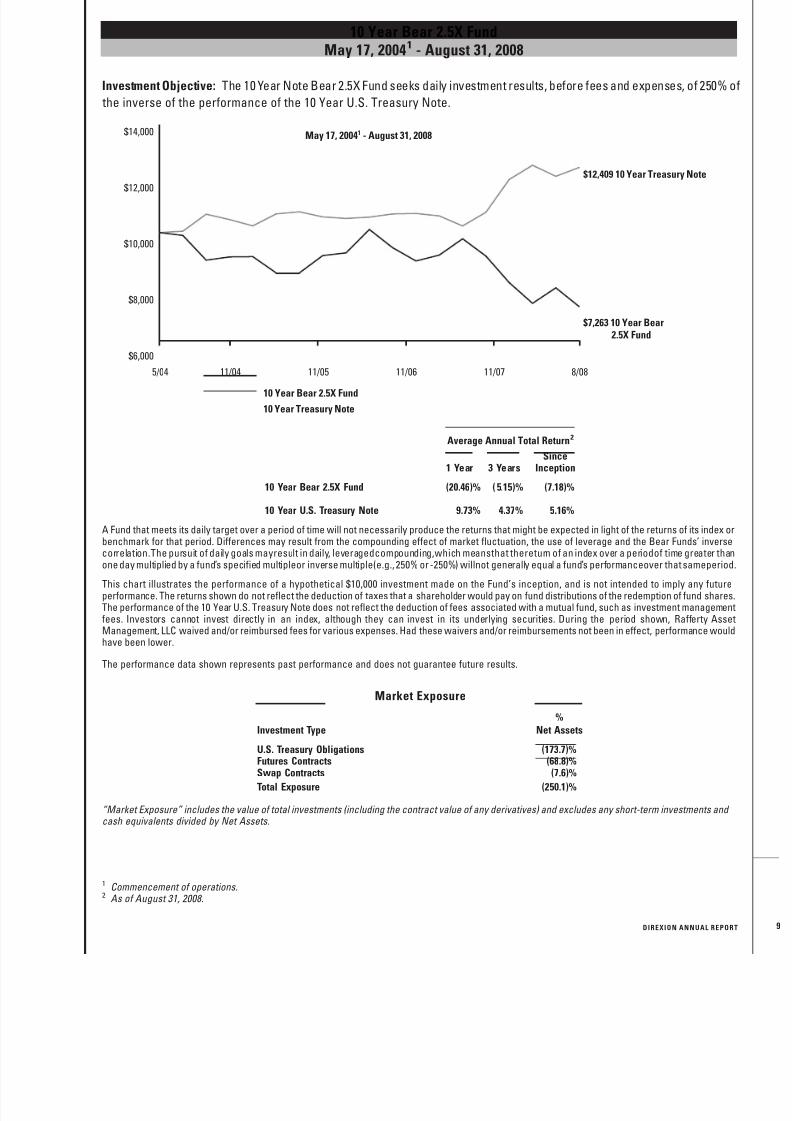
10 Year Bear 2.5X FundMay 17, 20041 - August 31, 2008
Investment Objective: The 10 Year Note Bear 2.5X Fund seeks daily investment results, before fees and expenses, of 250% of
the inverse of the performance of the 10 Year U.S. Treasury Note.
10 Year Treasury Note
10 Year Bear 2.5X Fund
$12,409 10 Year Treasury Note
$7,263 10 Year Bear2.5X Fund
May 17, 20041 - August 31, 2008
$6,000
$8,000
$10,000
$12,000
$14,000
8/0811/0711/0611/055/04 11/04
1 Year 3 YearsSince
Inception
Average Annual Total Return2
10 Year Bear 2.5X Fund (20.46)% ( 5.15)% (7.18)%
10 Year U.S. Treasury Note 9.73% 4.37% 5.16%
A Fund that meets its daily target over a period of time will not necessarily produce the returns that might be expected in light of the returns of its index orbenchmark for that period. Differences may result from the compounding effect of market fluctuation, the use of leverage and the Bear Funds’ inversecorrelation.The pursuit of daily goals mayresult in daily, leveragedcompounding,which meansthat thereturn of an index over a periodof time greater thanone day multiplied by a fund’s specified multipleor inverse multiple(e.g., 250% or -250%) willnot generally equal a fund’s performanceover that sameperiod
This chart illustrates the performance of a hypothetical $10,000 investment made on the Fund’s inception, and is not intended to imply any futureperformance. The returns shown do not reflect the deduction of taxes that a shareholder would pay on fund distributions of the redemption of fund sharesThe performance of the 10 Year U.S. Treasury Note does not reflect the deduction of fees associated with a mutual fund, such as investment managementfees. Investors cannot invest directly in an index, although they can invest in its underlying securities. During the period shown, Rafferty AssetManagement, LLC waived and/or reimbursed fees for various expenses. Had these waivers and/or reimbursements not been in effect, performance wouldhave been lower.
The performance data shown represents past performance and does not guarantee future results.
Market Exposure
Investment Type
%
Net Assets
U.S. Treasury Obligations (173.7)%
Futures Contracts (68.8)%Swap Contracts (7.6)%
Total Exposure (250.1)%
“Market Exposure” includes the value of total investments (including the contract value of any derivatives) and excludes any short-term investments and cash equivalents divided by Net Assets.
1 Commencement of operations.2 As of August 31, 2008.
D I REXI O N A NNU A L REPO RT
8/14/2019 Direxion Funds Annual Report - 2008
http://slidepdf.com/reader/full/direxion-funds-annual-report-2008 12/87
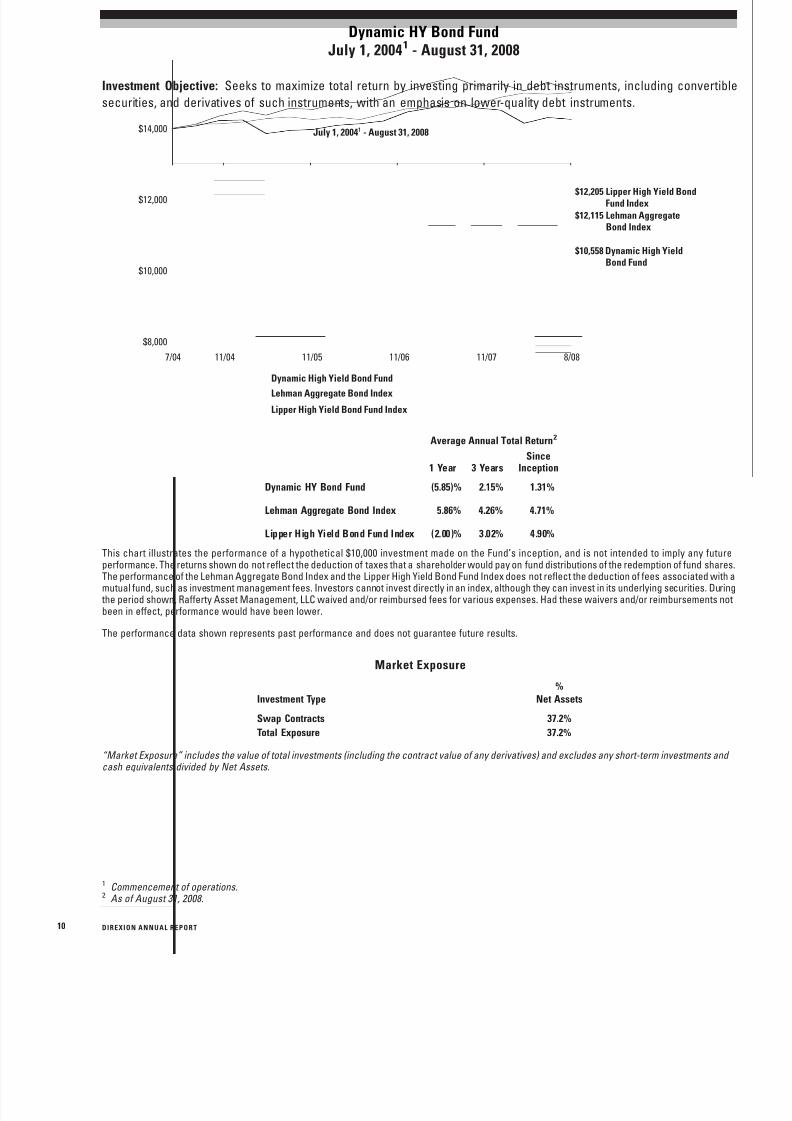
Dynamic HY Bond FundJuly 1, 20041 - August 31, 2008
Investment Objective: Seeks to maximize total return by investing primarily in debt instruments, including convertible
securities, and derivatives of such instruments, with an emphasis on lower-quality debt instruments.
Lipper High Yield Bond Fund Index
Lehman Aggregate Bond IndexDynamic High Yield Bond Fund
$12,205 Lipper High Yield BondFund Index
$12,115 Lehman AggregateBond Index
July 1, 20041 - August 31, 2008
$8,000
$10,000
$12,000
$14,000
8/0811/06 11/0711/057/04 11/04
$10,558 Dynamic High YieldBond Fund
1 Year 3 YearsSince
Inception
Average Annual Total Return2
Dynamic HY Bond Fund (5.85)% 2.15% 1.31%
Lehman Aggregate Bond Index 5.86% 4.26% 4.71%
Lipper High Yield Bond Fund Index (2.00)% 3.02% 4.90%
This chart illustrates the performance of a hypothetical $10,000 investment made on the Fund’s inception, and is not intended to imply any futureperformance. The returns shown do not reflect the deduction of taxes that a shareholder would pay on fund distributions of the redemption of fund shares
The performance of the Lehman Aggregate Bond Index and the Lipper High Yield Bond Fund Index does not reflect the deduction of fees associated with amutual fund, such as investment management fees. Investors cannot invest directly in an index, although they can invest in its underlying securities. During
the period shown, Rafferty Asset Management, LLC waived and/or reimbursed fees for various expenses. Had these waivers and/or reimbursements notbeen in effect, performance would have been lower.
The performance data shown represents past performance and does not guarantee future results.
Market Exposure
Investment Type
%
Net Assets
Swap Contracts 37.2%
Total Exposure 37.2%
“Market Exposure” includes the value of total investments (including the contract value of any derivatives) and excludes any short-term investments and
cash equivalents divided by Net Assets.
1 Commencement of operations.2 As of August 31, 2008.
D I REXI O N A NNU A L REPO RT10
8/14/2019 Direxion Funds Annual Report - 2008
http://slidepdf.com/reader/full/direxion-funds-annual-report-2008 13/87
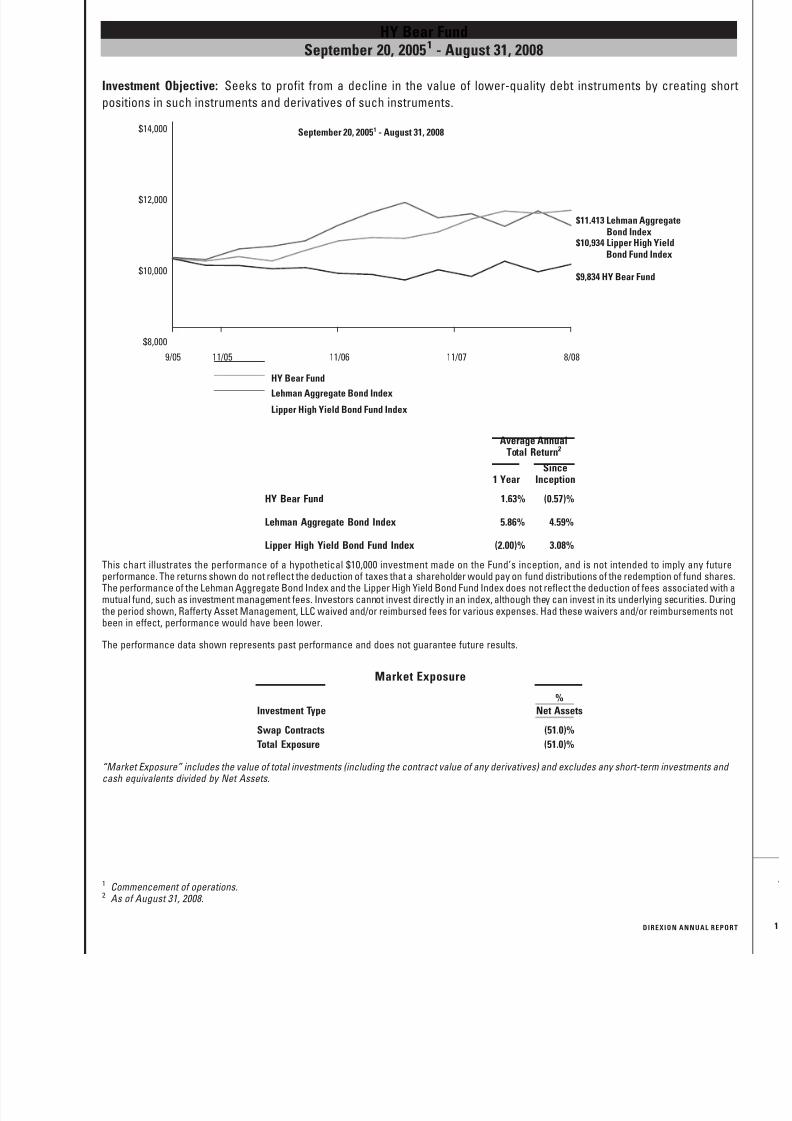
HY Bear FundSeptember 20, 20051 - August 31, 2008
Investment Objective: Seeks to profit from a decline in the value of lower-quality debt instruments by creating short
positions in such instruments and derivatives of such instruments.
Lipper High Yield Bond Fund Index
Lehman Aggregate Bond IndexHY Bear Fund
$10,934 Lipper High YieldBond Fund Index
$11,413 Lehman AggregateBond Index
$9,834 HY Bear Fund
September 20, 20051 - August 31, 2008
$8,000
$10,000
$12,000
$14,000
8/0811/06 11/079/05 11/05
1 YearSince
Inception
Average AnnualTotal Return2
HY Bear Fund 1.63% (0.57)%
Lehman Aggregate Bond Index 5.86% 4.59%
Lipper High Yield Bond Fund Index (2.00)% 3.08%
This chart illustrates the performance of a hypothetical $10,000 investment made on the Fund’s inception, and is not intended to imply any future
performance. The returns shown do not reflect the deduction of taxes that a shareholder would pay on fund distributions of the redemption of fund sharesThe performance of the Lehman Aggregate Bond Index and the Lipper High Yield Bond Fund Index does not reflect the deduction of fees associated with amutual fund, such as investment management fees. Investors cannot invest directly in an index, although they can invest in its underlying securities. During
the period shown, Rafferty Asset Management, LLC waived and/or reimbursed fees for various expenses. Had these waivers and/or reimbursements notbeen in effect, performance would have been lower.
The performance data shown represents past performance and does not guarantee future results.
Market Exposure
Investment Type
%
Net Assets
Swap Contracts (51.0)%
Total Exposure (51.0)%
“Market Exposure” includes the value of total investments (including the contract value of any derivatives) and excludes any short-term investments and cash equivalents divided by Net Assets.
1 Commencement of operations.2 As of August 31, 2008.
D I REXI O N A NNU A L REPO RT
8/14/2019 Direxion Funds Annual Report - 2008
http://slidepdf.com/reader/full/direxion-funds-annual-report-2008 14/87
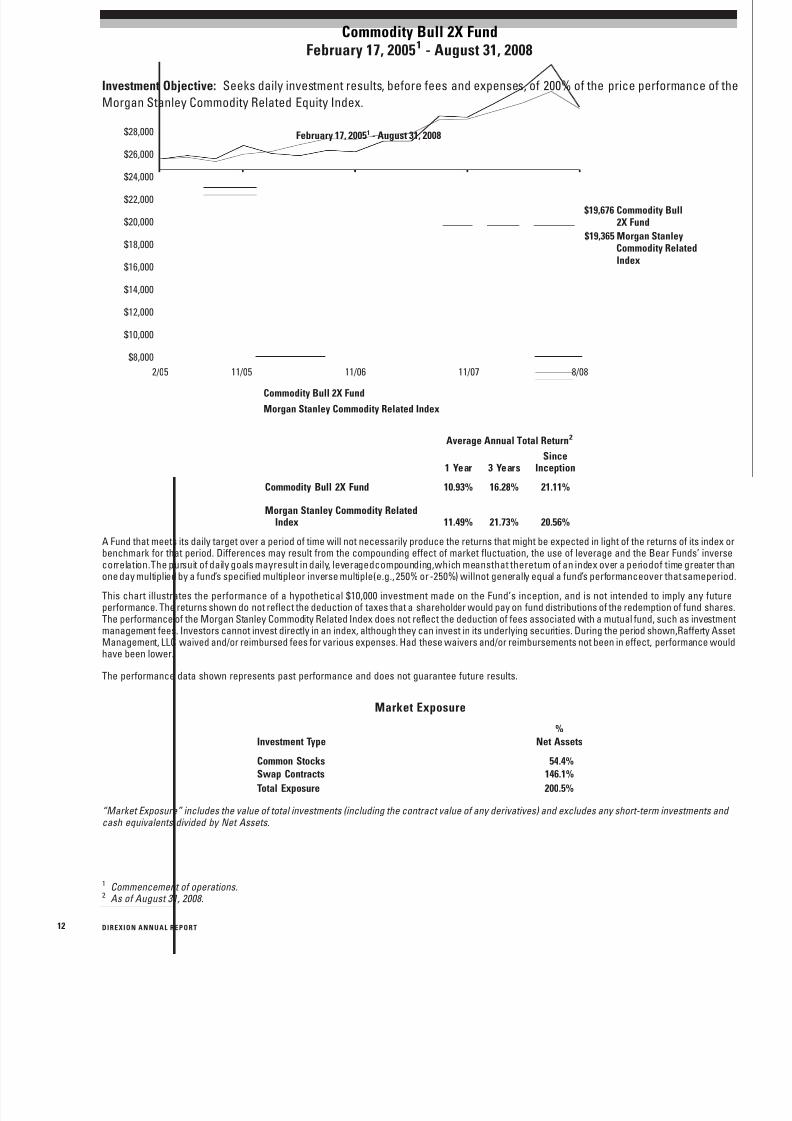
Commodity Bull 2X FundFebruary 17, 20051 - August 31, 2008
Investment Objective: Seeks daily investment results, before fees and expenses, of 200% of the price performance of the
Morgan Stanley Commodity Related Equity Index.
Morgan Stanley Commodity Related Index
Commodity Bull 2X Fund
$19,365 Morgan StanleyCommodity RelatedIndex
$19,676 Commodity Bull 2X Fund
February 17, 20051 - August 31, 2008
$8,000
$12,000
$14,000
$18,000
$10,000
$16,000
$20,000
$22,000
$26,000
$24,000
$28,000
8/0811/0711/062/05 11/05
1 Year 3 YearsSince
Inception
Average Annual Total Return2
Commodity Bull 2X Fund 10.93% 16.28% 21.11%
Morgan Stanley Commodity RelatedIndex 11.49% 21.73% 20.56%
A Fund that meets its daily target over a period of time will not necessarily produce the returns that might be expected in light of the returns of its index orbenchmark for that period. Differences may result from the compounding effect of market fluctuation, the use of leverage and the Bear Funds’ inversecorrelation.The pursuit of daily goals mayresult in daily, leveragedcompounding,which meansthat thereturn of an index over a periodof time greater than
one day multiplied by a fund’s specified multipleor inverse multiple(e.g., 250% or -250%) willnot generally equal a fund’s performanceover that sameperiod
This chart illustrates the performance of a hypothetical $10,000 investment made on the Fund’s inception, and is not intended to imply any futureperformance. The returns shown do not reflect the deduction of taxes that a shareholder would pay on fund distributions of the redemption of fund sharesThe performance of the Morgan Stanley Commodity Related Index does not reflect the deduction of fees associated with a mutual fund, such as investmentmanagement fees. Investors cannot invest directly in an index, although they can invest in its underlying securities. During the period shown,Rafferty AssetManagement, LLC waived and/or reimbursed fees for various expenses. Had these waivers and/or reimbursements not been in effect, performance wouldhave been lower.
The performance data shown represents past performance and does not guarantee future results.
Market Exposure
Investment Type
%
Net Assets
Common Stocks 54.4%Swap Contracts 146.1%
Total Exposure 200.5%
“Market Exposure” includes the value of total investments (including the contract value of any derivatives) and excludes any short-term investments and cash equivalents divided by Net Assets.
1 Commencement of operations.2 As of August 31, 2008.
D I REXI O N A NNU A L REPO RT12
8/14/2019 Direxion Funds Annual Report - 2008
http://slidepdf.com/reader/full/direxion-funds-annual-report-2008 15/87
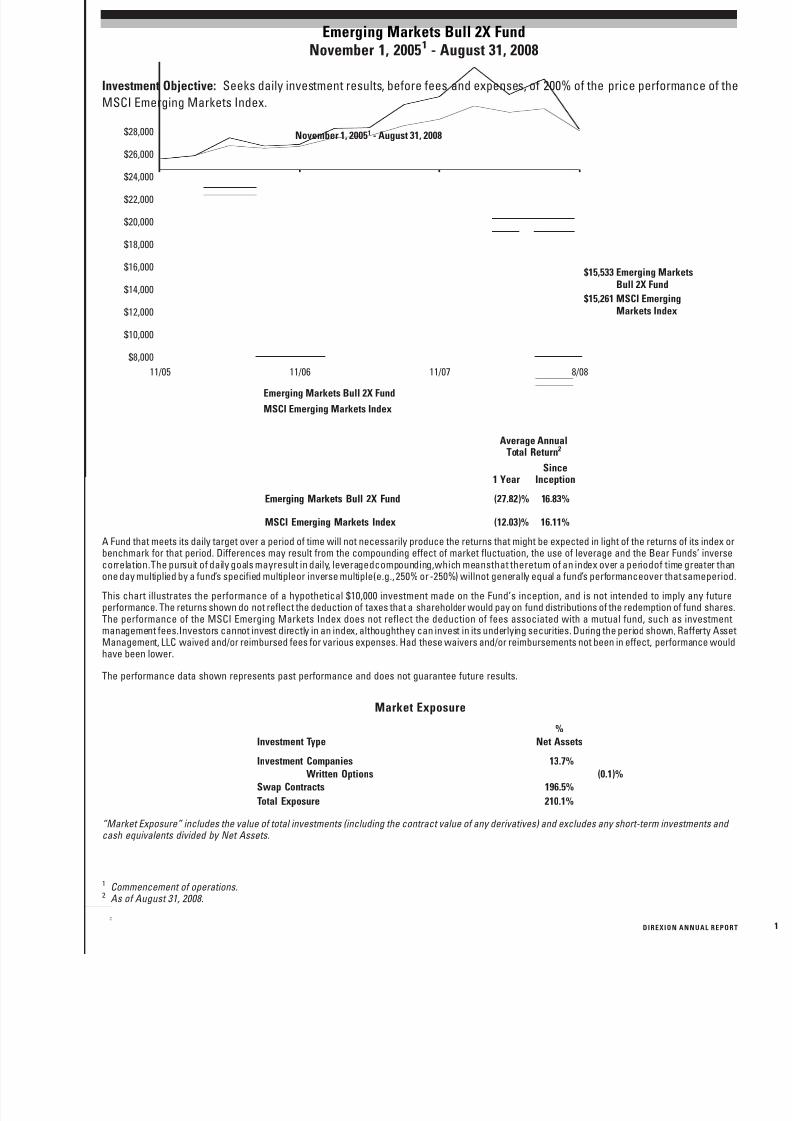
Emerging Markets Bull 2X FundNovember 1, 20051 - August 31, 2008
Investment Objective: Seeks daily investment results, before fees and expenses, of 200% of the price performance of the
MSCI Emerging Markets Index.
MSCI Emerging Markets Index
Emerging Markets Bull 2X Fund
$15,261 MSCI EmergingMarkets Index
$15,533 Emerging MarketsBull 2X Fund
November 1, 20051 - August 31, 2008
$8,000
$10,000
$12,000
$14,000
$18,000
$16,000
$22,000
$20,000
$24,000
$26,000
$28,000
8/0811/0711/0611/05
1 YearSince
Inception
Average AnnualTotal Return2
Emerging Markets Bull 2X Fund (27.82)% 16.83%
MSCI Emerging Markets Index (12.03)% 16.11%
A Fund that meets its daily target over a period of time will not necessarily produce the returns that might be expected in light of the returns of its index orbenchmark for that period. Differences may result from the compounding effect of market fluctuation, the use of leverage and the Bear Funds’ inversecorrelation.The pursuit of daily goals mayresult in daily, leveragedcompounding,which meansthat thereturn of an index over a periodof time greater than
one day multiplied by a fund’s specified multipleor inverse multiple(e.g., 250% or -250%) willnot generally equal a fund’s performanceover that sameperiod
This chart illustrates the performance of a hypothetical $10,000 investment made on the Fund’s inception, and is not intended to imply any futureperformance. The returns shown do not reflect the deduction of taxes that a shareholder would pay on fund distributions of the redemption of fund sharesThe performance of the MSCI Emerging Markets Index does not reflect the deduction of fees associated with a mutual fund, such as investmentmanagement fees.Investors cannot invest directly in an index, althoughthey can invest in its underlying securities. During the period shown, Rafferty AssetManagement, LLC waived and/or reimbursed fees for various expenses. Had these waivers and/or reimbursements not been in effect, performance wouldhave been lower.
The performance data shown represents past performance and does not guarantee future results.
Market Exposure
Investment Type
%
Net Assets
Investment Companies 13.7% Written Options (0.1)%
Swap Contracts 196.5%
Total Exposure 210.1%
“Market Exposure” includes the value of total investments (including the contract value of any derivatives) and excludes any short-term investments and cash equivalents divided by Net Assets.
1 Commencement of operations.2 As of August 31, 2008.
D I REXI O N A NNU A L REPO RT
8/14/2019 Direxion Funds Annual Report - 2008
http://slidepdf.com/reader/full/direxion-funds-annual-report-2008 16/87
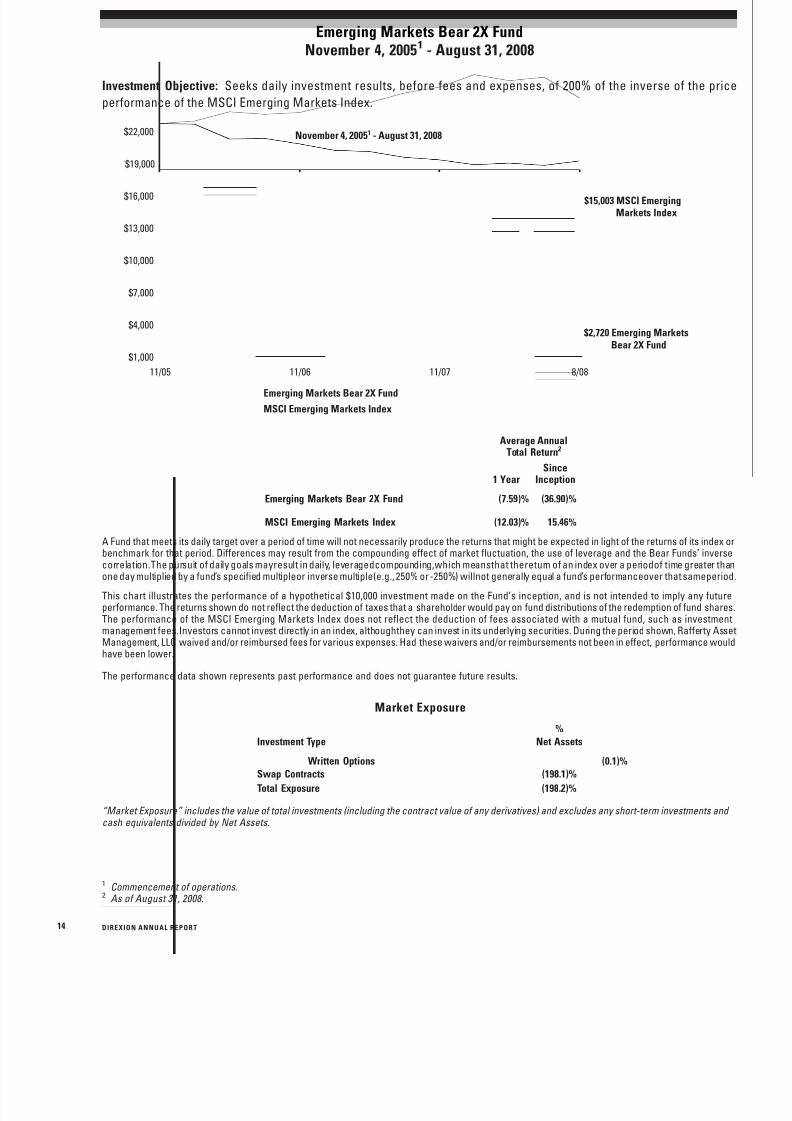
Emerging Markets Bear 2X FundNovember 4, 20051 - August 31, 2008
Investment Objective: Seeks daily investment results, before fees and expenses, of 200% of the inverse of the price
performance of the MSCI Emerging Markets Index.
MSCI Emerging Markets Index
Emerging Markets Bear 2X Fund
$15,003 MSCI EmergingMarkets Index
$2,720 Emerging MarketsBear 2X Fund
November 4, 20051 - August 31, 2008
$1,000
$4,000
$7,000
$10,000
$13,000
$16,000
$19,000
$22,000
8/0811/0711/0611/05
1 YearSince
Inception
Average AnnualTotal Return2
Emerging Markets Bear 2X Fund (7.59)% (36.90)%
MSCI Emerging Markets Index (12.03)% 15.46%
A Fund that meets its daily target over a period of time will not necessarily produce the returns that might be expected in light of the returns of its index orbenchmark for that period. Differences may result from the compounding effect of market fluctuation, the use of leverage and the Bear Funds’ inversecorrelation.The pursuit of daily goals mayresult in daily, leveragedcompounding,which meansthat thereturn of an index over a periodof time greater than
one day multiplied by a fund’s specified multipleor inverse multiple(e.g., 250% or -250%) willnot generally equal a fund’s performanceover that sameperiod
This chart illustrates the performance of a hypothetical $10,000 investment made on the Fund’s inception, and is not intended to imply any futureperformance. The returns shown do not reflect the deduction of taxes that a shareholder would pay on fund distributions of the redemption of fund sharesThe performance of the MSCI Emerging Markets Index does not reflect the deduction of fees associated with a mutual fund, such as investmentmanagement fees.Investors cannot invest directly in an index, althoughthey can invest in its underlying securities. During the period shown, Rafferty AssetManagement, LLC waived and/or reimbursed fees for various expenses. Had these waivers and/or reimbursements not been in effect, performance wouldhave been lower.
The performance data shown represents past performance and does not guarantee future results.
Market Exposure
Investment Type
%
Net Assets
Written Options (0.1)%Swap Contracts (198.1)%
Total Exposure (198.2)%
“Market Exposure” includes the value of total investments (including the contract value of any derivatives) and excludes any short-term investments and cash equivalents divided by Net Assets.
1 Commencement of operations.2 As of August 31, 2008.
D I REXI O N A NNU A L REPO RT14
8/14/2019 Direxion Funds Annual Report - 2008
http://slidepdf.com/reader/full/direxion-funds-annual-report-2008 17/87
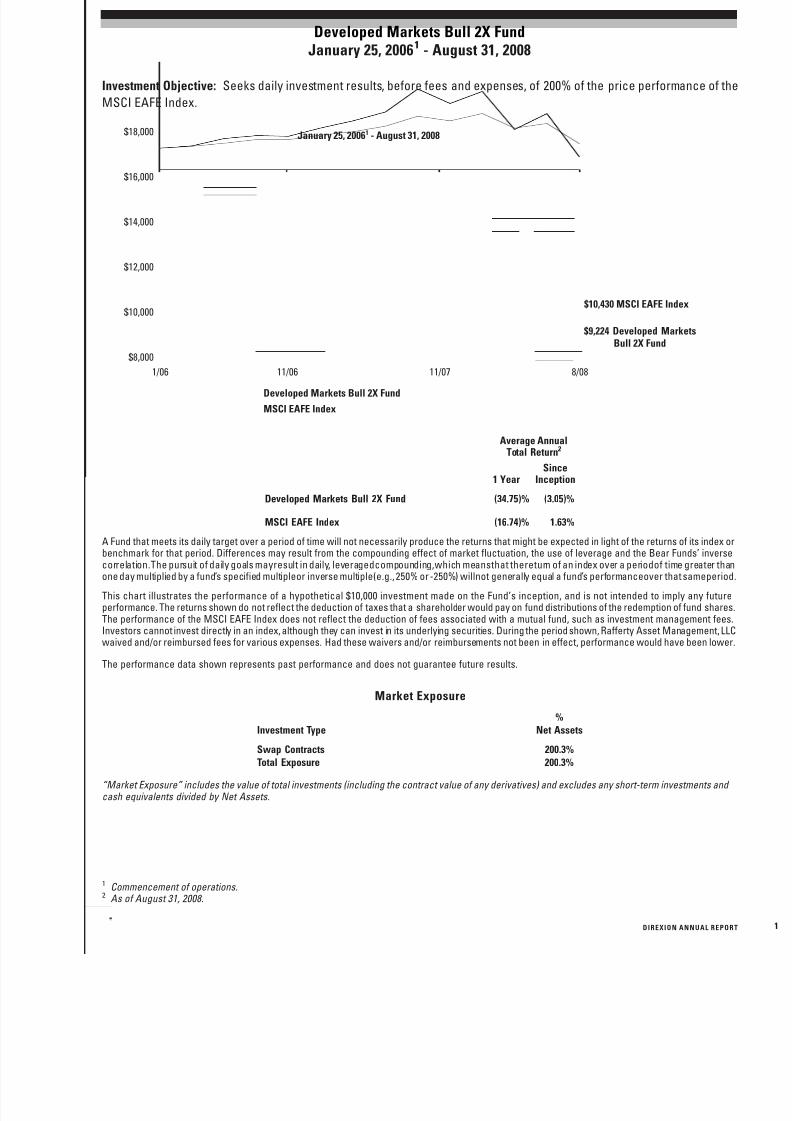
Developed Markets Bull 2X FundJanuary 25, 20061 - August 31, 2008
Investment Objective: Seeks daily investment results, before fees and expenses, of 200% of the price performance of the
MSCI EAFE Index.
MSCI EAFE Index
Developed Markets Bull 2X Fund
$10,430 MSCI EAFE Index
$9,224 Developed MarketsBull 2X Fund
January 25, 20061 - August 31, 2008
$8,000
$10,000
$12,000
$14,000
$16,000
$18,000
8/0811/0711/061/06
1 YearSince
Inception
Average AnnualTotal Return2
Developed Markets Bull 2X Fund (34.75)% (3.05)%
MSCI EAFE Index (16.74)% 1.63%
A Fund that meets its daily target over a period of time will not necessarily produce the returns that might be expected in light of the returns of its index orbenchmark for that period. Differences may result from the compounding effect of market fluctuation, the use of leverage and the Bear Funds’ inversecorrelation.The pursuit of daily goals mayresult in daily, leveragedcompounding,which meansthat thereturn of an index over a periodof time greater than
one day multiplied by a fund’s specified multipleor inverse multiple(e.g., 250% or -250%) willnot generally equal a fund’s performanceover that sameperiod
This chart illustrates the performance of a hypothetical $10,000 investment made on the Fund’s inception, and is not intended to imply any futureperformance. The returns shown do not reflect the deduction of taxes that a shareholder would pay on fund distributions of the redemption of fund sharesThe performance of the MSCI EAFE Index does not reflect the deduction of fees associated with a mutual fund, such as investment management fees.Investors cannot invest directly in an index, although they can invest in its underlying securities. During the period shown, Rafferty Asset Management, LLCwaived and/or reimbursed fees for various expenses. Had these waivers and/or reimbursements not been in effect, performance would have been lower
The performance data shown represents past performance and does not guarantee future results.
Market Exposure
Investment Type
%
Net Assets
Swap Contracts 200.3%
Total Exposure 200.3%
“Market Exposure” includes the value of total investments (including the contract value of any derivatives) and excludes any short-term investments and cash equivalents divided by Net Assets.
1 Commencement of operations.2 As of August 31, 2008.
D I REXI O N A NNU A L REPO RT
8/14/2019 Direxion Funds Annual Report - 2008
http://slidepdf.com/reader/full/direxion-funds-annual-report-2008 18/87
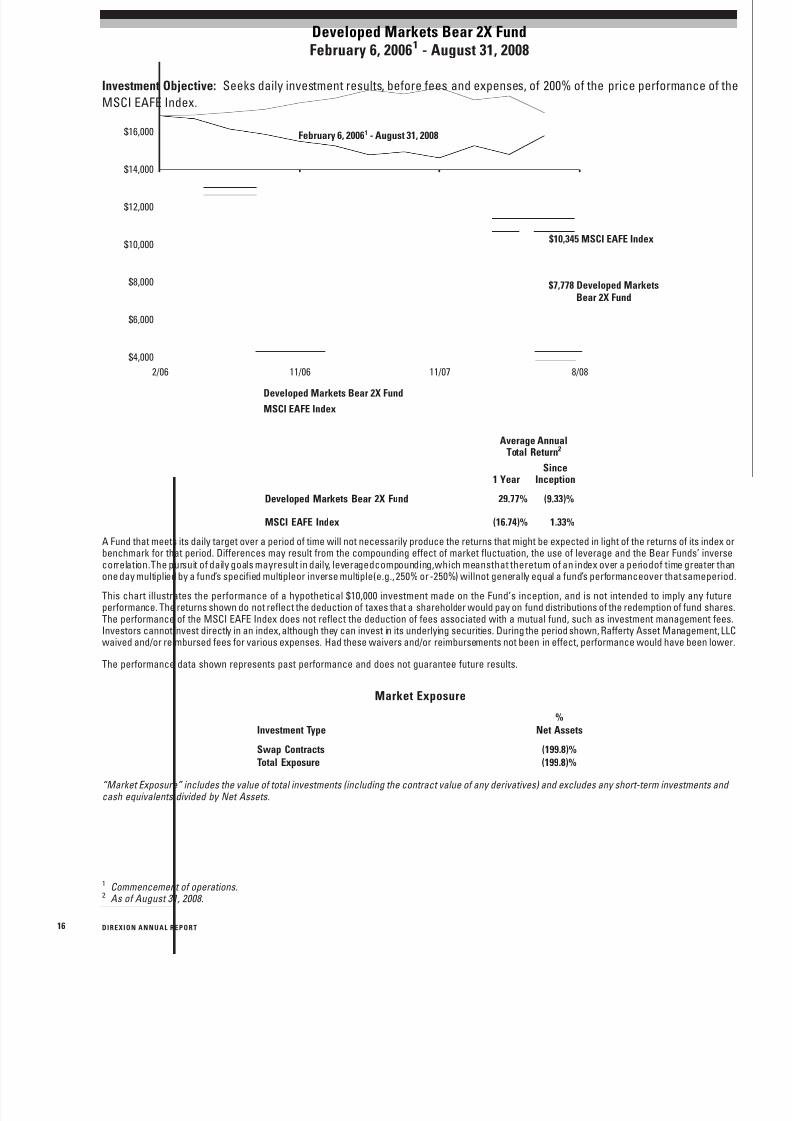
Developed Markets Bear 2X FundFebruary 6, 20061 - August 31, 2008
Investment Objective: Seeks daily investment results, before fees and expenses, of 200% of the price performance of the
MSCI EAFE Index.
MSCI EAFE Index
Developed Markets Bear 2X Fund
$10,345 MSCI EAFE Index
$7,778 Developed MarketsBear 2X Fund
February 6, 20061 - August 31, 2008
$4,000
$6,000
$8,000
$10,000
$12,000
$14,000
$16,000
8/0811/0711/062/06
1 YearSince
Inception
Average AnnualTotal Return2
Developed Markets Bear 2X Fund 29.77% (9.33)%
MSCI EAFE Index (16.74)% 1.33%
A Fund that meets its daily target over a period of time will not necessarily produce the returns that might be expected in light of the returns of its index orbenchmark for that period. Differences may result from the compounding effect of market fluctuation, the use of leverage and the Bear Funds’ inversecorrelation.The pursuit of daily goals mayresult in daily, leveragedcompounding,which meansthat thereturn of an index over a periodof time greater than
one day multiplied by a fund’s specified multipleor inverse multiple(e.g., 250% or -250%) willnot generally equal a fund’s performanceover that sameperiod
This chart illustrates the performance of a hypothetical $10,000 investment made on the Fund’s inception, and is not intended to imply any futureperformance. The returns shown do not reflect the deduction of taxes that a shareholder would pay on fund distributions of the redemption of fund sharesThe performance of the MSCI EAFE Index does not reflect the deduction of fees associated with a mutual fund, such as investment management fees.Investors cannot invest directly in an index, although they can invest in its underlying securities. During the period shown, Rafferty Asset Management, LLCwaived and/or reimbursed fees for various expenses. Had these waivers and/or reimbursements not been in effect, performance would have been lower
The performance data shown represents past performance and does not guarantee future results.
Market Exposure
Investment Type
%
Net Assets
Swap Contracts (199.8)%
Total Exposure (199.8)%
“Market Exposure” includes the value of total investments (including the contract value of any derivatives) and excludes any short-term investments and cash equivalents divided by Net Assets.
1 Commencement of operations.2 As of August 31, 2008.
D I REXI O N A NNU A L REPO RT16
8/14/2019 Direxion Funds Annual Report - 2008
http://slidepdf.com/reader/full/direxion-funds-annual-report-2008 19/87
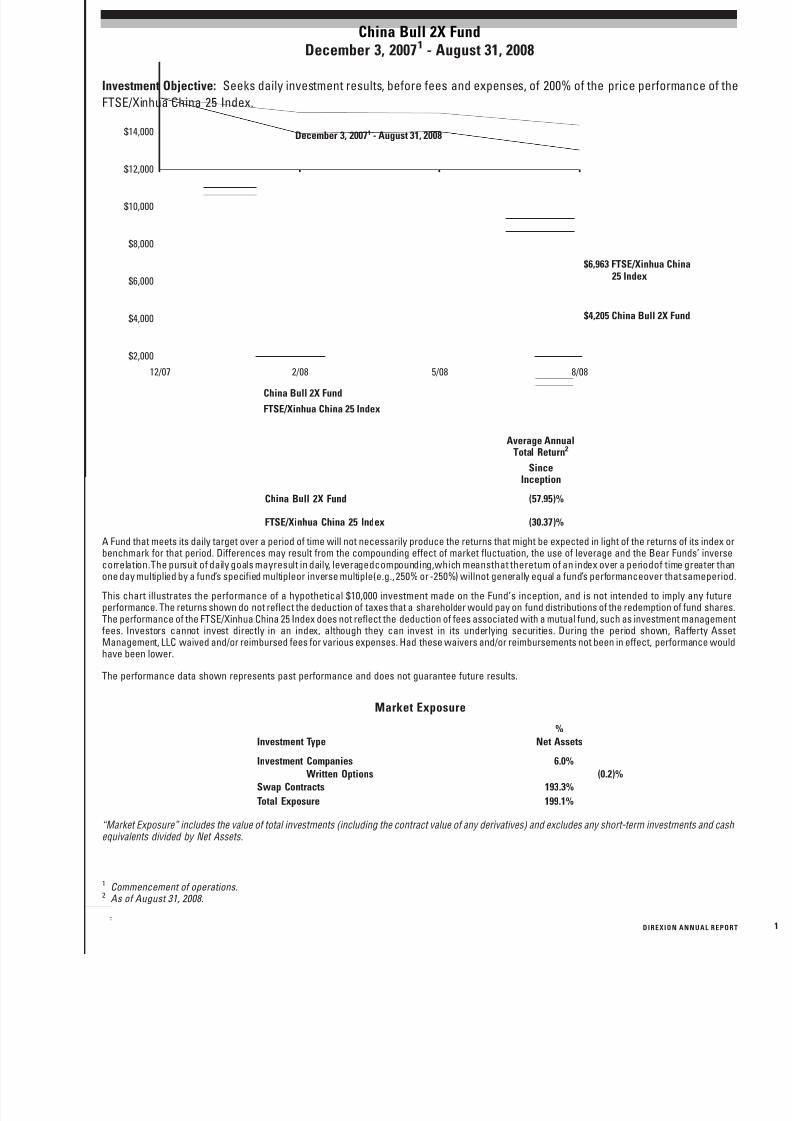
China Bull 2X FundDecember 3, 20071 - August 31, 2008
Investment Objective: Seeks daily investment results, before fees and expenses, of 200% of the price performance of the
FTSE/Xinhua China 25 Index.
FTSE/Xinhua China 25 Index
China Bull 2X Fund
$6,963 FTSE/Xinhua China25 Index
$4,205 China Bull 2X Fund
December 3, 20071 - August 31, 2008
$2,000
$4,000
$6,000
$8,000
$10,000
$12,000
$14,000
8/085/082/0812/07
SinceInception
Average AnnualTotal Return2
China Bull 2X Fund (57.95)%
FTSE/Xinhua China 25 Index (30.37)%
A Fund that meets its daily target over a period of time will not necessarily produce the returns that might be expected in light of the returns of its index orbenchmark for that period. Differences may result from the compounding effect of market fluctuation, the use of leverage and the Bear Funds’ inversecorrelation.The pursuit of daily goals mayresult in daily, leveragedcompounding,which meansthat thereturn of an index over a periodof time greater than
one day multiplied by a fund’s specified multipleor inverse multiple(e.g., 250% or -250%) willnot generally equal a fund’s performanceover that sameperiod
This chart illustrates the performance of a hypothetical $10,000 investment made on the Fund’s inception, and is not intended to imply any futureperformance. The returns shown do not reflect the deduction of taxes that a shareholder would pay on fund distributions of the redemption of fund sharesThe performance of the FTSE/Xinhua China 25 Index does not reflect the deduction of fees associated with a mutual fund, such as investment managementfees. Investors cannot invest directly in an index, although they can invest in its underlying securities. During the period shown, Rafferty AssetManagement, LLC waived and/or reimbursed fees for various expenses. Had these waivers and/or reimbursements not been in effect, performance wouldhave been lower.
The performance data shown represents past performance and does not guarantee future results.
Market Exposure
Investment Type
%
Net Assets
Investment Companies 6.0% Written Options (0.2)%
Swap Contracts 193.3%
Total Exposure 199.1%
“Market Exposure” includes the value of total investments (including the contract value of any derivatives) and excludes any short-term investments and cashequivalents divided by Net Assets.
1 Commencement of operations.2 As of August 31, 2008.
D I REXI O N A NNU A L REPO RT
8/14/2019 Direxion Funds Annual Report - 2008
http://slidepdf.com/reader/full/direxion-funds-annual-report-2008 20/87
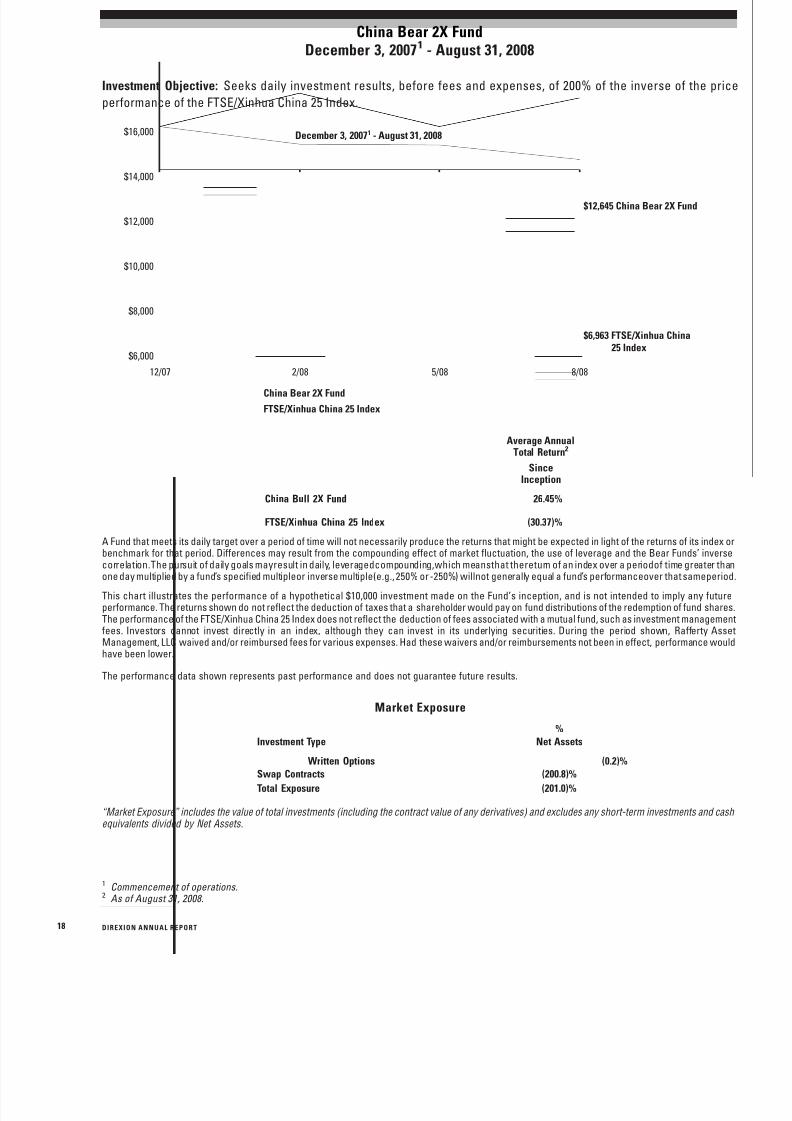
China Bear 2X FundDecember 3, 20071 - August 31, 2008
Investment Objective: Seeks daily investment results, before fees and expenses, of 200% of the inverse of the price
performance of the FTSE/Xinhua China 25 Index.
FTSE/Xinhua China 25 Index
China Bear 2X Fund
$12,645 China Bear 2X Fund
$6,963 FTSE/Xinhua China25 Index
December 3, 20071 - August 31, 2008
$6,000
$8,000
$10,000
$12,000
$14,000
$16,000
8/085/082/0812/07
SinceInception
Average AnnualTotal Return2
China Bull 2X Fund 26.45%
FTSE/Xinhua China 25 Index (30.37)%
A Fund that meets its daily target over a period of time will not necessarily produce the returns that might be expected in light of the returns of its index orbenchmark for that period. Differences may result from the compounding effect of market fluctuation, the use of leverage and the Bear Funds’ inversecorrelation.The pursuit of daily goals mayresult in daily, leveragedcompounding,which meansthat thereturn of an index over a periodof time greater than
one day multiplied by a fund’s specified multipleor inverse multiple(e.g., 250% or -250%) willnot generally equal a fund’s performanceover that sameperiod
This chart illustrates the performance of a hypothetical $10,000 investment made on the Fund’s inception, and is not intended to imply any futureperformance. The returns shown do not reflect the deduction of taxes that a shareholder would pay on fund distributions of the redemption of fund sharesThe performance of the FTSE/Xinhua China 25 Index does not reflect the deduction of fees associated with a mutual fund, such as investment managementfees. Investors cannot invest directly in an index, although they can invest in its underlying securities. During the period shown, Rafferty AssetManagement, LLC waived and/or reimbursed fees for various expenses. Had these waivers and/or reimbursements not been in effect, performance wouldhave been lower.
The performance data shown represents past performance and does not guarantee future results.
Market Exposure
Investment Type
%
Net Assets
Written Options (0.2)%Swap Contracts (200.8)%
Total Exposure (201.0)%
“Market Exposure” includes the value of total investments (including the contract value of any derivatives) and excludes any short-term investments and cashequivalents divided by Net Assets.
1 Commencement of operations.2 As of August 31, 2008.
D I REXI O N A NNU A L REPO RT18
8/14/2019 Direxion Funds Annual Report - 2008
http://slidepdf.com/reader/full/direxion-funds-annual-report-2008 21/87
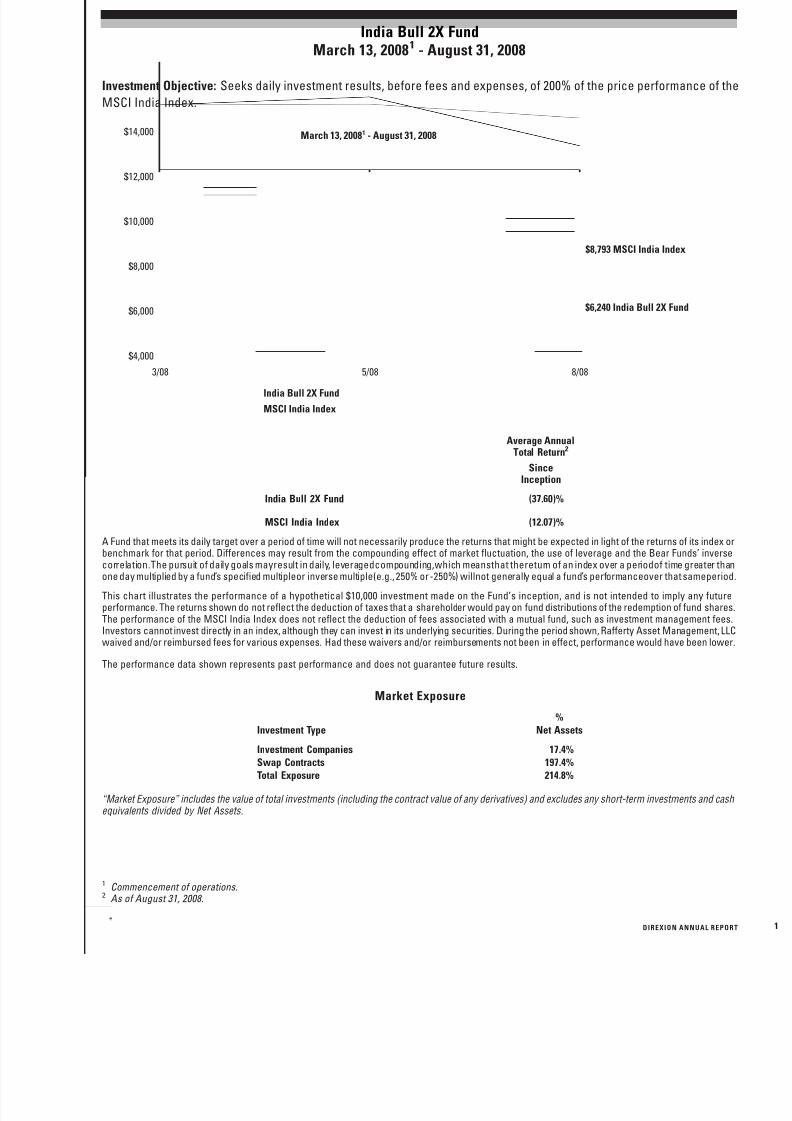
India Bull 2X FundMarch 13, 20081 - August 31, 2008
Investment Objective: Seeks daily investment results, before fees and expenses, of 200% of the price performance of the
MSCI India Index.
MSCI India Index
India Bull 2X Fund
$8,793 MSCI India Index
$6,240 India Bull 2X Fund
March 13, 20081 - August 31, 2008
$4,000
$6,000
$8,000
$10,000
$12,000
$14,000
8/085/083/08
SinceInception
Average AnnualTotal Return2
India Bull 2X Fund (37.60)%
MSCI India Index (12.07)%
A Fund that meets its daily target over a period of time will not necessarily produce the returns that might be expected in light of the returns of its index orbenchmark for that period. Differences may result from the compounding effect of market fluctuation, the use of leverage and the Bear Funds’ inversecorrelation.The pursuit of daily goals mayresult in daily, leveragedcompounding,which meansthat thereturn of an index over a periodof time greater than
one day multiplied by a fund’s specified multipleor inverse multiple(e.g., 250% or -250%) willnot generally equal a fund’s performanceover that sameperiod
This chart illustrates the performance of a hypothetical $10,000 investment made on the Fund’s inception, and is not intended to imply any futureperformance. The returns shown do not reflect the deduction of taxes that a shareholder would pay on fund distributions of the redemption of fund sharesThe performance of the MSCI India Index does not reflect the deduction of fees associated with a mutual fund, such as investment management fees.Investors cannot invest directly in an index, although they can invest in its underlying securities. During the period shown, Rafferty Asset Management, LLCwaived and/or reimbursed fees for various expenses. Had these waivers and/or reimbursements not been in effect, performance would have been lower
The performance data shown represents past performance and does not guarantee future results.
Market Exposure
Investment Type
%
Net Assets
Investment Companies 17.4%
Swap Contracts 197.4%Total Exposure 214.8%
“Market Exposure” includes the value of total investments (including the contract value of any derivatives) and excludes any short-term investments and cashequivalents divided by Net Assets.
1 Commencement of operations.2 As of August 31, 2008.
D I REXI O N A NNU A L REPO RT
8/14/2019 Direxion Funds Annual Report - 2008
http://slidepdf.com/reader/full/direxion-funds-annual-report-2008 22/87
Expense ExampleAugust 31, 2008 (Unaudited)
As a shareholder of a mutual fund, you incur two types of costs: (1) transaction costs, including sales charges (loads)on
purchase payments, reinvested dividends, or other distributions; redemption fees; and exchange fees; and (2) ongoing costs,
including management fees; distribution and/or service fees; and other Fund expenses. This example is intended to help you
understand your ongoing costs (in dollars) of investing in the Fund and to compare costs with the ongoing costs of investing
in other mutual funds.
The Example is based on an investment of $1,000 invested at the beginning of the period and held the entire period (March 1,
2008 — August 31, 2008).
Actual Expenses
The first line of the table below provides information about actual account values and actual expenses. Although the Fund
charges no sales load or transactions fees, you will be assessed fees for outgoing wire transfers, returned checks or stop
payment orders at prevailing rates charged by U.S. Bancorp Fund Services, LLC, the Funds’ transfer agent. If you request a
redemption be made by wire transfer, currently a $15.00 fee is charged by the Funds’ transfer agent. However, the example
below does not include portfolio trading commissions and related expenses or other extraordinary expenses as determined
under generally accepted accounting principles. You may use the information in this line, together with the amount you
invested, to estimate the expenses that you paid over the period. Simply divide your account value by $1,000 (for example, an
$8,600 account value divided by $1,000 = 8.6), then multiply the result by the number in the first line under the heading entitled
“Expenses Paid During Period” to estimate the expenses you paid on your account during this period.
Hypothetical Example for Comparison Purposes
The second line of the table below provides information about hypothetical account values and hypothetical expenses based
on the Funds’ actual expense ratios and an assumed rate of return of 5% per year before expenses, which is not the Funds’
actual return. The hypothetical account values and expenses may not be used to estimate the actual ending account
balance or expenses you paid for the period. You may use this information to compare the ongoing costs of investing in the
Funds and other funds. To do so, compare this 5% hypothetical example with the 5% hypothetical examples that appear in the
shareholder reports of the other funds.
Please note that the expenses shown in the table are meant to highlight your ongoing costs only and do not reflect any
transactional costs, such as wire transfers, returned checks or stop payment orders. Therefore, the second line of the table
is useful in comparing ongoing costs only, and will not help you determine the relative costs of owning different funds. In
addition, if these transactional costs were included, your costs would have been higher.
D I REXI O N A NNU A L REPO RT20

8/14/2019 Direxion Funds Annual Report - 2008
http://slidepdf.com/reader/full/direxion-funds-annual-report-2008 23/87
Expense Example TablesAugust 31, 2008 (Unaudited)
NetExpense
Ratio1
BeginningAccount ValueMarch 1, 2008
EndingAccount Value
August 31, 2008
ExpensesPaid During
Period2
NASDAQ-100 Bull 1.25X FundBased on actual fund return 1.75% $1,000.00 $1,084.20 $ 9.17Based on hypothetical 5% return 1.75% 1,000.00 1,016.34 8.87
Small Cap Bull 2.5X FundBased on actual fund return 1.75% 1,000.00 1,125.80 9.35
Based on hypothetical 5% return 1.75% 1,000.00 1,016.34 8.87Small Cap Bear 2.5X Fund
Based on actual fund return 1.75% 1,000.00 706.90 7.51Based on hypothetical 5% return 1.75% 1,000.00 1,016.34 8.87
Dow 30 Bull 1.25X FundBased on actual fund return 1.75% 1,000.00 934.70 8.51Based on hypothetical 5% return 1.75% 1,000.00 1,016.34 8.87
10 Year Note Bull 2.5X FundBased on actual fund return 1.75% 1,000.00 993.00 8.77Based on hypothetical 5% return 1.75% 1,000.00 1,016.34 8.87
10 Year Note Bear 2.5X Fund3
Based on actual fund return 7.88% 1,000.00 983.60 39.29Based on hypothetical 5% return 7.88% 1,000.00 985.52 39.33
Dynamic HY Bond FundBased on actual fund return 1.75% 1,000.00 1,023.70 8.90
Based on hypothetical 5% return 1.75% 1,000.00 1,016.34 8.87HY Bear Fund3
Based on actual fund return 1.81% 1,000.00 990.70 9.06Based on hypothetical 5% return 1.81% 1,000.00 1,016.04 9.17
Commodity Bull 2X FundBased on actual fund return 1.75% 1,000.00 849.20 8.13Based on hypothetical 5% return 1.75% 1,000.00 1,016.34 8.87
Emerging Markets Bull 2X FundBased on actual fund return 1.75% 1,000.00 708.50 7.52Based on hypothetical 5% return 1.75% 1,000.00 1,016.34 8.87
Emerging Markets Bear 2X FundBased on actual fund return 1.73% 1,000.00 1,179.90 9.48Based on hypothetical 5% return 1.73% 1,000.00 1,016.44 8.77
Developed Markets Bull 2X FundBased on actual fund return 1.74% 1,000.00 786.50 7.81
Based on hypothetical 5% return 1.74% 1,000.00 1,016.39 8.82Developed Markets Bear 2X Fund
Based on actual fund return 1.75% 1,000.00 1,168.20 9.54Based on hypothetical 5% return 1.75% 1,000.00 1,016.34 8.87
China Bull 2X FundBased on actual fund return 1.75% 1,000.00 694.50 7.45Based on hypothetical 5% return 1.75% 1,000.00 1,016.34 8.87
China Bear 2X FundBased on actual fund return 1.75% 1,000.00 966.40 8.65Based on hypothetical 5% return 1.75% 1,000.00 1,016.34 8.87
India Bull 2X Fund4
Based on actual fund return 1.75% 1,000.00 624.00 6.68Based on hypothetical 5% return 1.75% 1,000.00 1,014.70 8.28
U.S. Government Money Market FundBased on actual fund return 1.08% 1,000.00 1,005.40 5.44Based on hypothetical 5% return 1.08% 1,000.00 1,019.71 5.48
1 Annualized2 Expenses are equal to the Fund’s annualized expense ratio, multiplied by the average account value over the period, multiplied by the
number of days in the most recent fiscal half-year/period, then divided by 366.3 Net expense ratio includes interest on securities sold short.4 Since commencement of operations on March 13, 2008.
D I REXI O N A NNU A L REPO RT
8/14/2019 Direxion Funds Annual Report - 2008
http://slidepdf.com/reader/full/direxion-funds-annual-report-2008 24/87
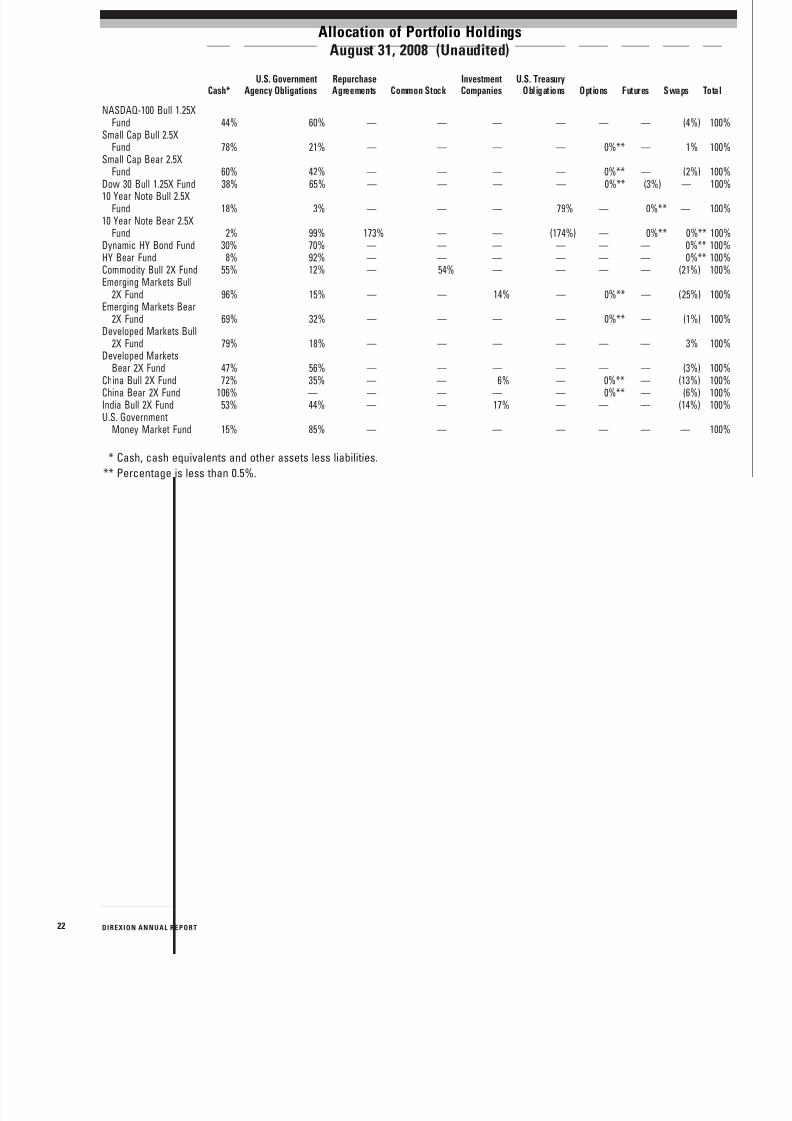
Allocation of Portfolio HoldingsAugust 31, 2008 (Unaudited)
Cash*U.S. Government
Agency ObligationsRepurchaseAgreements Common Stock
InvestmentCompanies
U.S. TreasuryObligations Options Futures Swaps Total
NASDAQ-100 Bull 1.25XFund 44% 60% — — — — — — (4%) 100%
Small Cap Bull 2.5XFund 78% 21% — — — — 0%** — 1% 100%
Small Cap Bear 2.5XFund 60% 42% — — — — 0%** — (2%) 100%
Dow 30 Bull 1.25X Fund 38% 65% — — — — 0%** (3%) — 100%10 Year Note Bull 2.5X
Fund 18% 3% — — — 79% — 0%** — 100%10 Year Note Bear 2.5X
Fund 2% 99% 173% — — (174%) — 0%** 0%** 100%Dynamic HY Bond Fund 30% 70% — — — — — — 0%** 100%HY Bear Fund 8% 92% — — — — — — 0%** 100%Commodity Bull 2X Fund 55% 12% — 54% — — — — (21%) 100%Emerging Markets Bull
2X Fund 96% 15% — — 14% — 0%** — (25%) 100%Emerging Markets Bear
2X Fund 69% 32% — — — — 0%** — (1%) 100%Developed Markets Bull
2X Fund 79% 18% — — — — — — 3% 100%Developed Markets
Bear 2X Fund 47% 56% — — — — — — (3%) 100%
China Bull 2X Fund 72% 35% — — 6% — 0%** — (13%) 100%China Bear 2X Fund 106% — — — — — 0%** — (6%) 100%India Bull 2X Fund 53% 44% — — 17% — — — (14%) 100%U.S. Government
Money Market Fund 15% 85% — — — — — — — 100%
* Cash, cash equivalents and other assets less liabilities.
** Percentage is less than 0.5%.
D I REXI O N A NNU A L REPO RT22

8/14/2019 Direxion Funds Annual Report - 2008
http://slidepdf.com/reader/full/direxion-funds-annual-report-2008 25/87
NASDAQ-100 Bull Fund 1.25XSchedule of Investments
August 31, 2008
PrincipalAmount Value
SHORT TERM INVESTMENTS - 69.5%U.S. GOVERNMENT AGENCY OBLIGATIONS - 59.7%
$3,100,000 Federal Home Loan BankDiscount Note, 1.9667%, 9/2/2008 $3,099,848
Shares
MONEY MARKET FUNDS - 9.8%508,809 Fidelity Institutional Money Market
Portfolio 508,809
TOTAL SHORT TERMINVESTMENTS(Cost $3,608,657) $3,608,657
TOTAL INVESTMENTS(Cost $3,608,657) - 69.5% $3,608,657
Other Assets in Excess ofLiabilities - 30.5% 1,587,602
TOTAL NET ASSETS - 100.0% $5,196,259
Percentages are stated as a percent of net assets.
NASDAQ-100 Bull Fund 1.25XEquity Swap Contracts
August 31, 2008
Counterparty Reference EntityNumber ofContracts
NotionalAmount
TerminationDate
UnrealizedDepreciation
Credit Suisse Capital LLC NASDAQ-100 Index 3,475 $6,716,272 6/4/2010 $(213,314)
The accompanying notes are an integral part of these financial statements.
D I REXI O N A NNU A L REPO RT
8/14/2019 Direxion Funds Annual Report - 2008
http://slidepdf.com/reader/full/direxion-funds-annual-report-2008 26/87
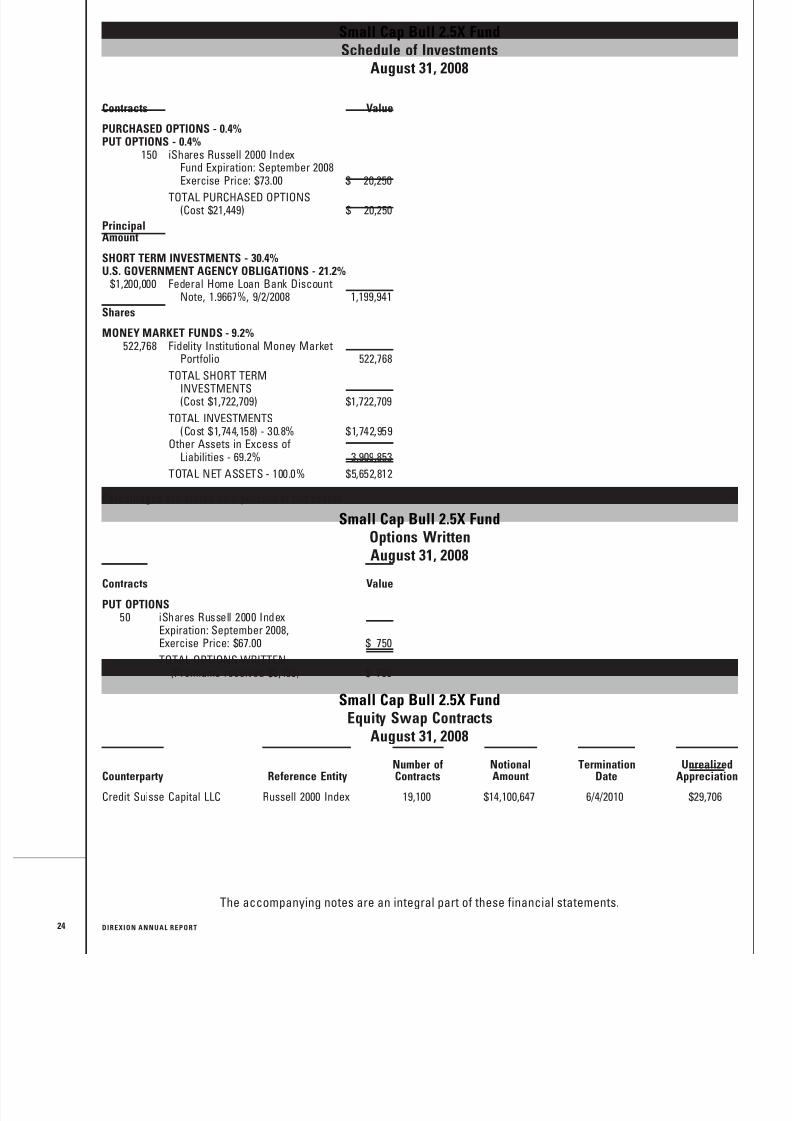
Small Cap Bull 2.5X FundSchedule of Investments
August 31, 2008
Contracts Value
PURCHASED OPTIONS - 0.4%PUT OPTIONS - 0.4%
150 iShares Russell 2000 IndexFund Expiration: September 2008Exercise Price: $73.00 $ 20,250
TOTAL PURCHASED OPTIONS(Cost $21,449) $ 20,250
PrincipalAmount
SHORT TERM INVESTMENTS - 30.4%U.S. GOVERNMENT AGENCY OBLIGATIONS - 21.2%
$1,200,000 Federal Home Loan Bank DiscountNote, 1.9667%, 9/2/2008 1,199,941
Shares
MONEY MARKET FUNDS - 9.2%522,768 Fidelity Institutional Money Market
Portfolio 522,768
TOTAL SHORT TERMINVESTMENTS(Cost $1,722,709) $1,722,709
TOTAL INVESTMENTS(Cost $1,744,158) - 30.8% $1,742,959
Other Assets in Excess ofLiabilities - 69.2% 3,909,853
TOTAL NET ASSETS - 100.0% $5,652,812
Percentages are stated as a percent of net assets.
Small Cap Bull 2.5X FundOptions WrittenAugust 31, 2008
Contracts Value
PUT OPTIONS50 iShares Russell 2000 Index
Expiration: September 2008,Exercise Price: $67.00 $ 750
TOTAL OPTIONS WRITTEN(Premiums received $6,450) $ 750
Small Cap Bull 2.5X FundEquity Swap Contracts
August 31, 2008
Counterparty Reference Entity Number ofContracts NotionalAmount TerminationDate UnrealizedAppreciation
Credit Suisse Capital LLC Russell 2000 Index 19,100 $14,100,647 6/4/2010 $29,706
24
The accompanying notes are an integral part of these financial statements.
D I REXI O N A NNU A L REPO RT
8/14/2019 Direxion Funds Annual Report - 2008
http://slidepdf.com/reader/full/direxion-funds-annual-report-2008 27/87
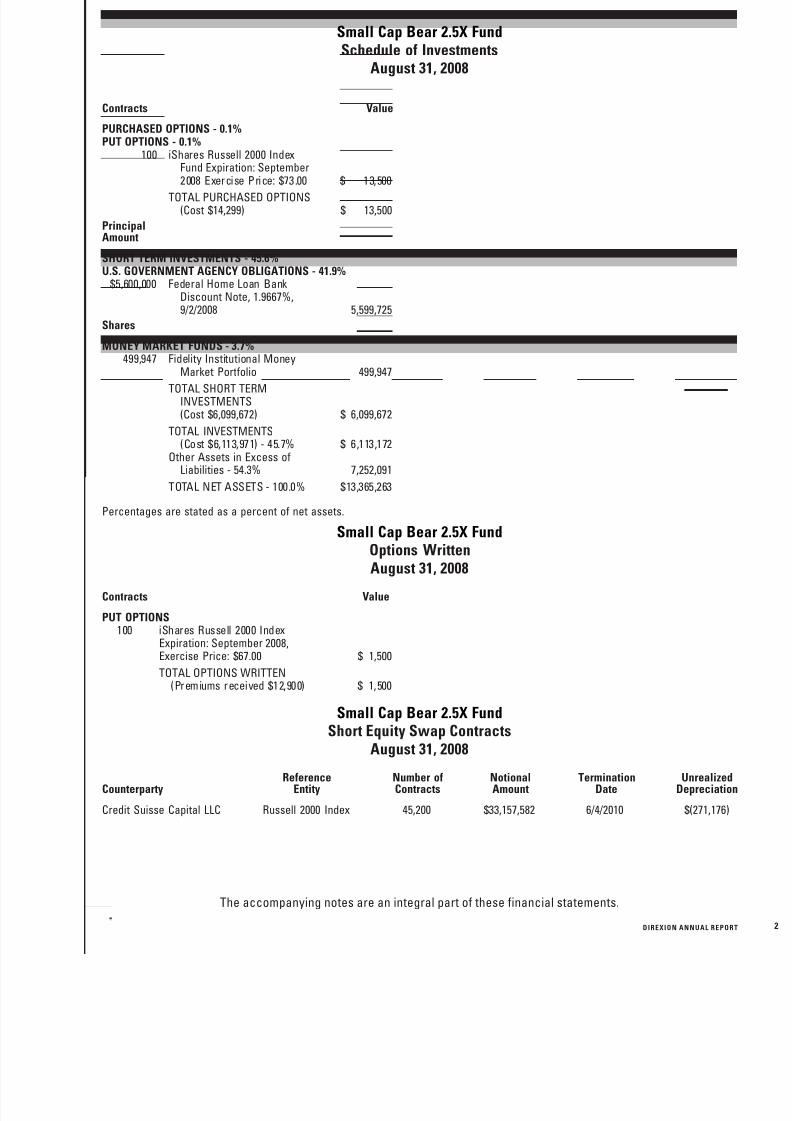
Small Cap Bear 2.5X FundSchedule of Investments
August 31, 2008
Contracts Value
PURCHASED OPTIONS - 0.1%PUT OPTIONS - 0.1%
100 iShares Russell 2000 IndexFund Expiration: September2008 Exercise Price: $73.00 $ 13,500
TOTAL PURCHASED OPTIONS(Cost $14,299) $ 13,500
PrincipalAmount
SHORT TERM INVESTMENTS - 45.6%U.S. GOVERNMENT AGENCY OBLIGATIONS - 41.9%
$5,600,000 Federal Home Loan BankDiscount Note, 1.9667%,9/2/2008 5,599,725
Shares
MONEY MARKET FUNDS - 3.7%499,947 Fidelity Institutional Money
Market Portfolio 499,947
TOTAL SHORT TERMINVESTMENTS(Cost $6,099,672) $ 6,099,672
TOTAL INVESTMENTS(Cost $6,113,971) - 45.7% $ 6,113,172
Other Assets in Excess ofLiabilities - 54.3% 7,252,091
TOTAL NET ASSETS - 100.0% $13,365,263
Percentages are stated as a percent of net assets.
Small Cap Bear 2.5X FundOptions Written
August 31, 2008Contracts Value
PUT OPTIONS100 iShares Russell 2000 Index
Expiration: September 2008,Exercise Price: $67.00 $ 1,500
TOTAL OPTIONS WRITTEN(Premiums received $12,900) $ 1,500
Small Cap Bear 2.5X FundShort Equity Swap Contracts
August 31, 2008
CounterpartyReference
EntityNumber ofContracts
NotionalAmount
TerminationDate
UnrealizedDepreciation
Credit Suisse Capital LLC Russell 2000 Index 45,200 $33,157,582 6/4/2010 $(271,176)
The accompanying notes are an integral part of these financial statements.
D I REXI O N A NNU A L REPO RT
8/14/2019 Direxion Funds Annual Report - 2008
http://slidepdf.com/reader/full/direxion-funds-annual-report-2008 28/87
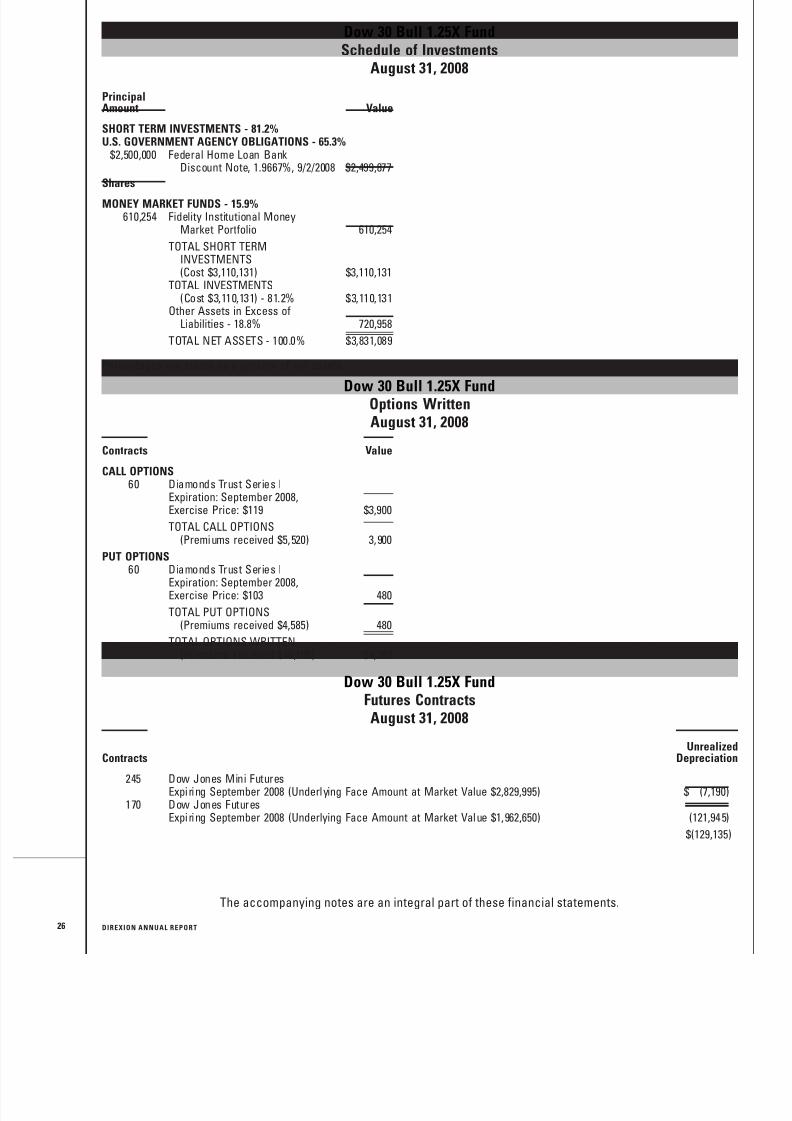
Dow 30 Bull 1.25X FundSchedule of Investments
August 31, 2008
PrincipalAmount Value
SHORT TERM INVESTMENTS - 81.2%U.S. GOVERNMENT AGENCY OBLIGATIONS - 65.3%
$2,500,000 Federal Home Loan BankDiscount Note, 1.9667%, 9/2/2008 $2,499,877
Shares
MONEY MARKET FUNDS - 15.9%610,254 Fidelity Institutional Money
Market Portfolio 610,254
TOTAL SHORT TERMINVESTMENTS(Cost $3,110,131) $3,110,131
TOTAL INVESTMENTS(Cost $3,110,131) - 81.2% $3,110,131
Other Assets in Excess ofLiabilities - 18.8% 720,958
TOTAL NET ASSETS - 100.0% $3,831,089
Percentages are stated as a percent of net assets.
Dow 30 Bull 1.25X FundOptions WrittenAugust 31, 2008
Contracts Value
CALL OPTIONS60 Diamonds Trust Series I
Expiration: September 2008,Exercise Price: $119 $3,900
TOTAL CALL OPTIONS(Premiums received $5,520) 3,900
PUT OPTIONS
60 Diamonds Trust Series IExpiration: September 2008,Exercise Price: $103 480
TOTAL PUT OPTIONS(Premiums received $4,585) 480
TOTAL OPTIONS WRITTEN(Premiums received $10,105) $4,380
Dow 30 Bull 1.25X FundFutures Contracts
August 31, 2008
ContractsUnrealized
Depreciation
245 Dow Jones Mini FuturesExpiring September 2008 (Underlying Face Amount at Market Value $2,829,995) $ (7,190)
170 Dow Jones FuturesExpiring September 2008 (Underlying Face Amount at Market Value $1,962,650) (121,945)
$(129,135)
26
The accompanying notes are an integral part of these financial statements.
D I REXI O N A NNU A L REPO RT
8/14/2019 Direxion Funds Annual Report - 2008
http://slidepdf.com/reader/full/direxion-funds-annual-report-2008 29/87
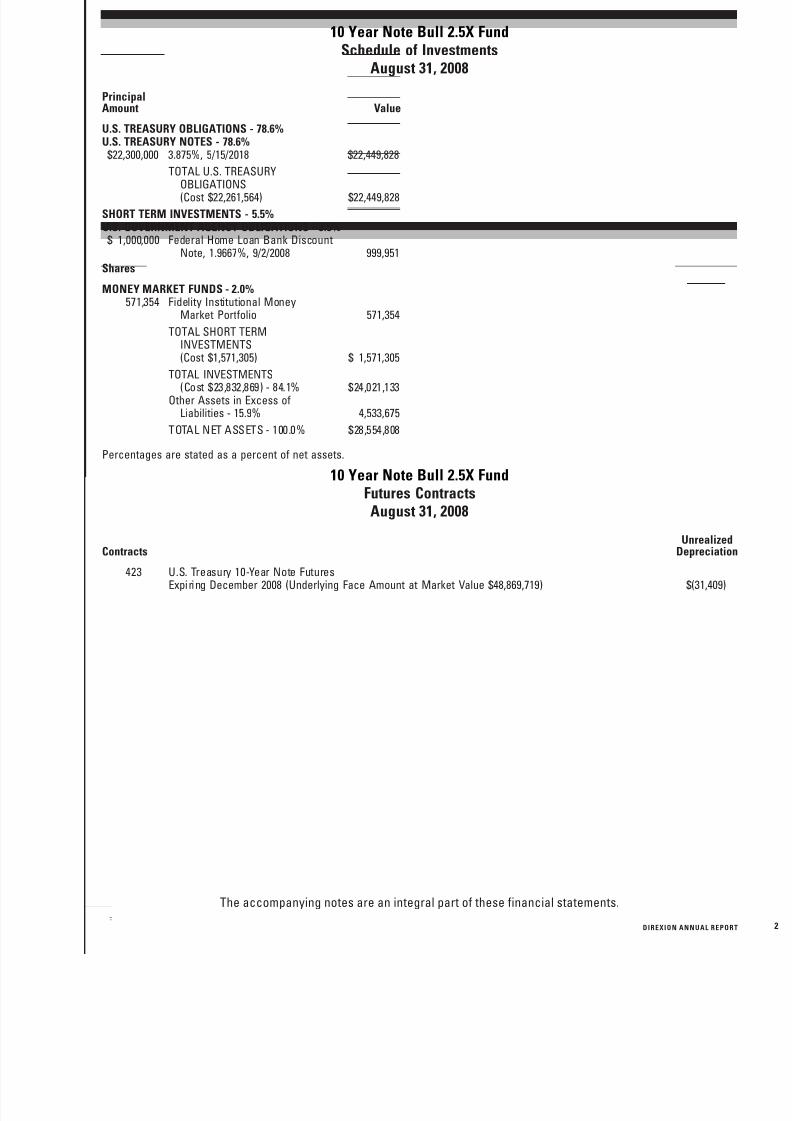
10 Year Note Bull 2.5X FundSchedule of Investments
August 31, 2008
PrincipalAmount Value
U.S. TREASURY OBLIGATIONS - 78.6%U.S. TREASURY NOTES - 78.6%
$22,300,000 3.875%, 5/15/2018 $22,449,828
TOTAL U.S. TREASURYOBLIGATIONS(Cost $22,261,564) $22,449,828
SHORT TERM INVESTMENTS - 5.5%U.S. GOVERNMENT AGENCY OBLIGATIONS - 3.5%
$ 1,000,000 Federal Home Loan Bank DiscountNote, 1.9667%, 9/2/2008 999,951
Shares
MONEY MARKET FUNDS - 2.0%571,354 Fidelity Institutional Money
Market Portfolio 571,354
TOTAL SHORT TERMINVESTMENTS(Cost $1,571,305) $ 1,571,305
TOTAL INVESTMENTS(Cost $23,832,869) - 84.1% $24,021,133
Other Assets in Excess ofLiabilities - 15.9% 4,533,675
TOTAL NET ASSETS - 100.0% $28,554,808
Percentages are stated as a percent of net assets.
10 Year Note Bull 2.5X FundFutures Contracts
August 31, 2008
ContractsUnrealized
Depreciation
423 U.S. Treasury 10-Year Note FuturesExpiring December 2008 (Underlying Face Amount at Market Value $48,869,719) $(31,409)
The accompanying notes are an integral part of these financial statements.
D I REXI O N A NNU A L REPO RT
8/14/2019 Direxion Funds Annual Report - 2008
http://slidepdf.com/reader/full/direxion-funds-annual-report-2008 30/87
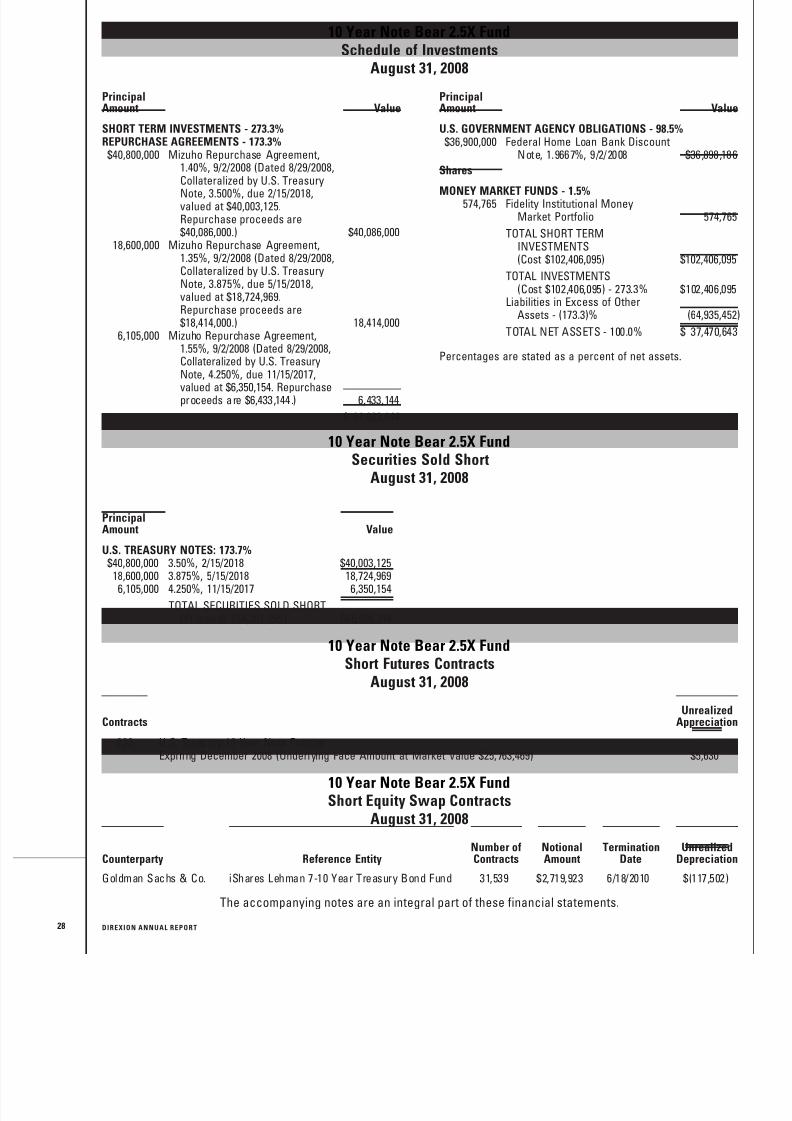
10 Year Note Bear 2.5X FundSchedule of Investments
August 31, 2008
PrincipalAmount Value
SHORT TERM INVESTMENTS - 273.3%REPURCHASE AGREEMENTS - 173.3%
$40,800,000 Mizuho Repurchase Agreement,1.40%, 9/2/2008 (Dated 8/29/2008,Collateralized by U.S. Treasury
Note, 3.500%, due 2/15/2018,valued at $40,003,125.Repurchase proceeds are$40,086,000.) $40,086,000
18,600,000 Mizuho Repurchase Agreement,1.35%, 9/2/2008 (Dated 8/29/2008,Collateralized by U.S. TreasuryNote, 3.875%, due 5/15/2018,valued at $18,724,969.Repurchase proceeds are$18,414,000.) 18,414,000
6,105,000 Mizuho Repurchase Agreement,1.55%, 9/2/2008 (Dated 8/29/2008,Collateralized by U.S. TreasuryNote, 4.250%, due 11/15/2017,valued at $6,350,154. Repurchaseproceeds are $6,433,144.) 6,433,144
$ 64,933,144
PrincipalAmount Value
U.S. GOVERNMENT AGENCY OBLIGATIONS - 98.5%$36,900,000 Federal Home Loan Bank Discount
Note, 1.9667%, 9/2/2008 $36,898,186
Shares
MONEY MARKET FUNDS - 1.5%574,765 Fidelity Institutional Money
Market Portfolio 574,765
TOTAL SHORT TERMINVESTMENTS(Cost $102,406,095) $102,406,095
TOTAL INVESTMENTS(Cost $102,406,095) - 273.3% $102,406,095
Liabilities in Excess of OtherAssets - (173.3)% (64,935,452
TOTAL NET ASSETS - 100.0% $ 37,470,643
Percentages are stated as a percent of net assets.
10 Year Note Bear 2.5X FundSecurities Sold Short
August 31, 2008
PrincipalAmount Value
U.S. TREASURY NOTES: 173.7%$40,800,000 3.50%, 2/15/2018 $40,003,125
18,600,000 3.875%, 5/15/2018 18,724,9696,105,000 4.250%, 11/15/2017 6,350,154
TOTAL SECURITIES SOLD SHORT(Proceeds $64,291,255) $65,078,248
10 Year Note Bear 2.5X FundShort Futures Contracts
August 31, 2008
ContractsUnrealized
Appreciation
223 U.S. Treasury 10-Year Note FuturesExpiring December 2008 (Underlying Face Amount at Market Value $25,763,469) $5,630
10 Year Note Bear 2.5X FundShort Equity Swap Contracts
August 31, 2008
Counterparty Reference EntityNumber ofContracts
NotionalAmount
TerminationDate
UnrealizedDepreciation
Goldman Sachs & Co. iShares Lehman 7-10 Year Treasury Bond Fund 31,539 $2,719,923 6/18/2010 $(117,502)
28
The accompanying notes are an integral part of these financial statements.
D I REXI O N A NNU A L REPO RT
8/14/2019 Direxion Funds Annual Report - 2008
http://slidepdf.com/reader/full/direxion-funds-annual-report-2008 31/87
Dynamic HY Bond FundSchedule of Investments
August 31, 2008
PrincipalAmount Value
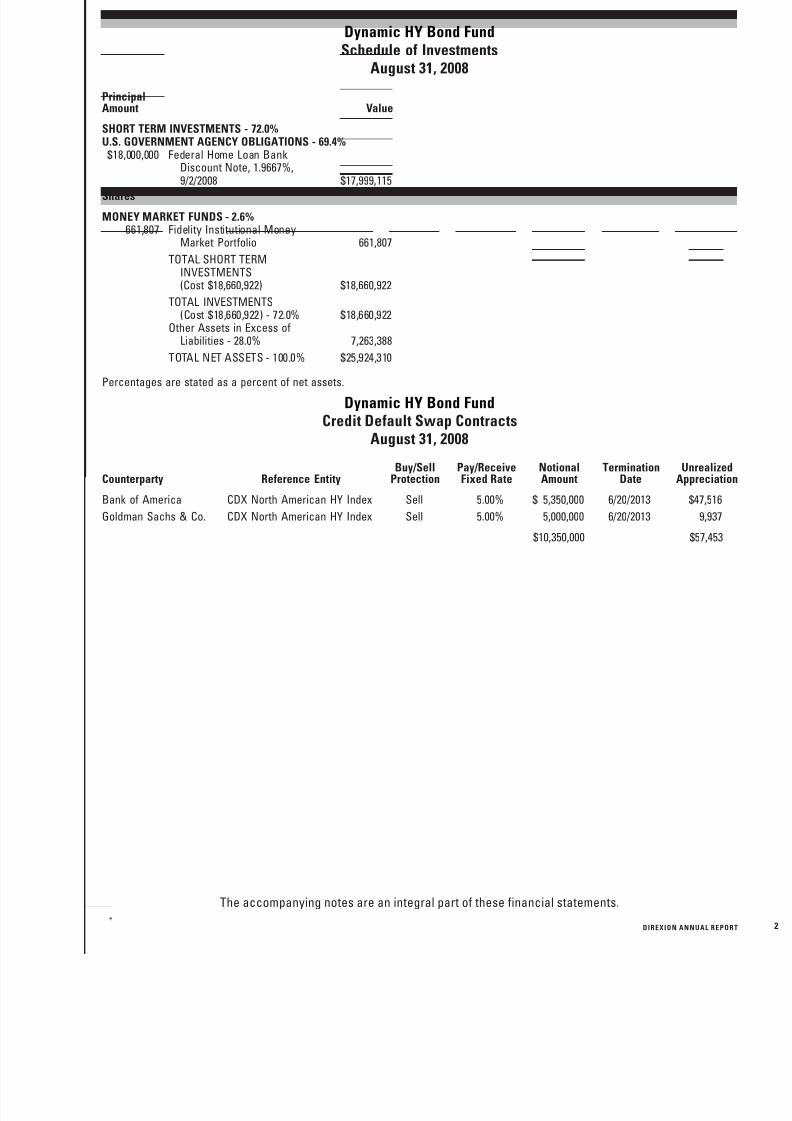
SHORT TERM INVESTMENTS - 72.0%U.S. GOVERNMENT AGENCY OBLIGATIONS - 69.4%
$18,000,000 Federal Home Loan BankDiscount Note, 1.9667%,9/2/2008 $17,999,115
Shares
MONEY MARKET FUNDS - 2.6%661,807 Fidelity Institutional Money
Market Portfolio 661,807
TOTAL SHORT TERMINVESTMENTS(Cost $18,660,922) $18,660,922
TOTAL INVESTMENTS(Cost $18,660,922) - 72.0% $18,660,922
Other Assets in Excess ofLiabilities - 28.0% 7,263,388
TOTAL NET ASSETS - 100.0% $25,924,310
Percentages are stated as a percent of net assets.
Dynamic HY Bond FundCredit Default Swap Contracts
August 31, 2008
Counterparty Reference EntityBuy/Sell
ProtectionPay/ReceiveFixed Rate
NotionalAmount
TerminationDate
UnrealizedAppreciation
Bank of America CDX North American HY Index Sell 5.00% $ 5,350,000 6/20/2013 $47,516
Goldman Sachs & Co. CDX North American HY Index Sell 5.00% 5,000,000 6/20/2013 9,937
$10,350,000 $57,453
The accompanying notes are an integral part of these financial statements.
D I REXI O N A NNU A L REPO RT
8/14/2019 Direxion Funds Annual Report - 2008
http://slidepdf.com/reader/full/direxion-funds-annual-report-2008 32/87
HY Bear FundSchedule of Investments
August 31, 2008
PrincipalAmount Value
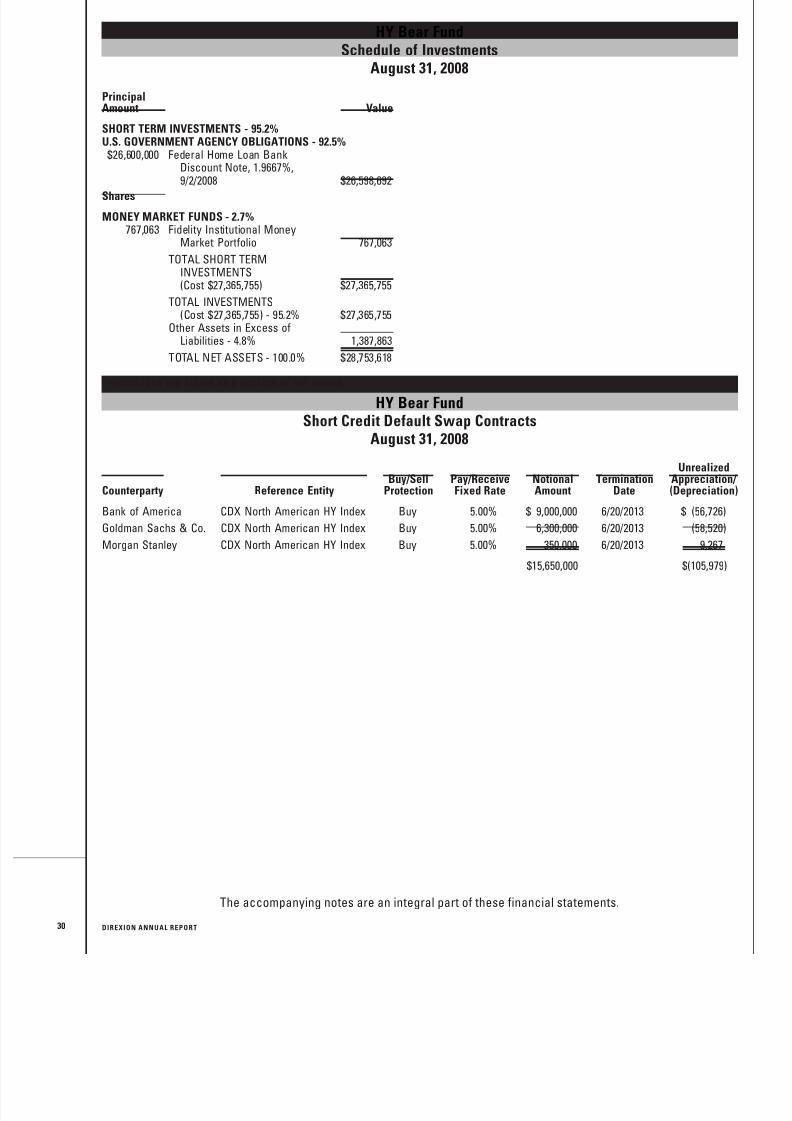
SHORT TERM INVESTMENTS - 95.2%U.S. GOVERNMENT AGENCY OBLIGATIONS - 92.5%
$26,600,000 Federal Home Loan BankDiscount Note, 1.9667%,9/2/2008 $26,598,692
Shares
MONEY MARKET FUNDS - 2.7%767,063 Fidelity Institutional Money
Market Portfolio 767,063
TOTAL SHORT TERMINVESTMENTS(Cost $27,365,755) $27,365,755
TOTAL INVESTMENTS(Cost $27,365,755) - 95.2% $27,365,755
Other Assets in Excess ofLiabilities - 4.8% 1,387,863
TOTAL NET ASSETS - 100.0% $28,753,618
Percentages are stated as a percent of net assets.
HY Bear FundShort Credit Default Swap Contracts
August 31, 2008
Counterparty Reference EntityBuy/Sell
ProtectionPay/ReceiveFixed Rate
NotionalAmount
TerminationDate
UnrealizedAppreciation/ (Depreciation)
Bank of America CDX North American HY Index Buy 5.00% $ 9,000,000 6/20/2013 $ (56,726)
Goldman Sachs & Co. CDX North American HY Index Buy 5.00% 6,300,000 6/20/2013 (58,520)
Morgan Stanley CDX North American HY Index Buy 5.00% 350,000 6/20/2013 9,267
$15,650,000 $(105,979)
30
The accompanying notes are an integral part of these financial statements.
D I REXI O N A NNU A L REPO RT
8/14/2019 Direxion Funds Annual Report - 2008
http://slidepdf.com/reader/full/direxion-funds-annual-report-2008 33/87
Commodity Bull 2X FundSchedule of Investments
August 31, 2008
Shares Value
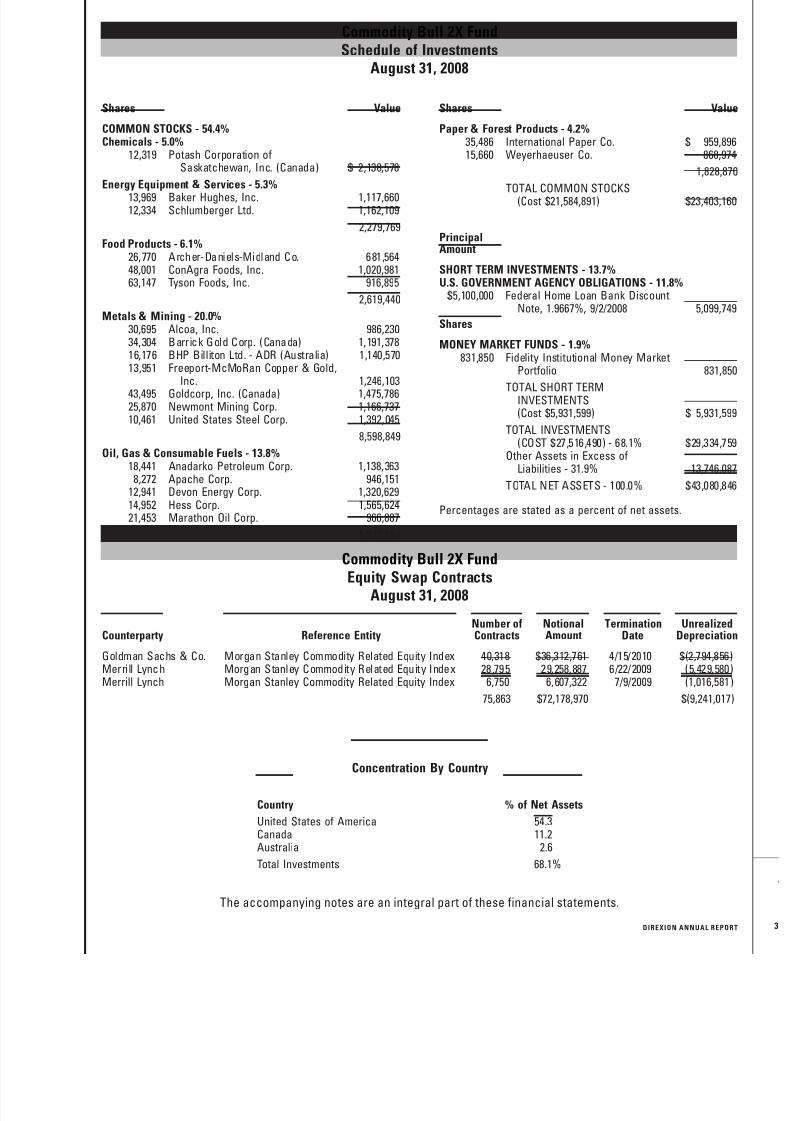
COMMON STOCKS - 54.4%Chemicals - 5.0%
12,319 Potash Corporation ofSaskatchewan, Inc. (Canada) $ 2,138,578
Energy Equipment & Services - 5.3%13,969 Baker Hughes, Inc. 1,117,66012,334 Schlumberger Ltd. 1,162,109
2,279,769
Food Products - 6.1%26,770 Archer-Daniels-Midland Co. 681,56448,001 ConAgra Foods, Inc. 1,020,98163,147 Tyson Foods, Inc. 916,895
2,619,440
Metals & Mining - 20.0%30,695 Alcoa, Inc. 986,23034,304 Barrick Gold Corp. (Canada) 1,191,37816,176 BHP Billiton Ltd. - ADR (Australia) 1,140,57013,951 Freeport-McMoRan Copper & Gold,
Inc. 1,246,10343,495 Goldcorp, Inc. (Canada) 1,475,78625,870 Newmont Mining Corp. 1,166,73710,461 United States Steel Corp. 1,392,045
8,598,849
Oil, Gas & Consumable Fuels - 13.8%18,441 Anadarko Petroleum Corp. 1,138,363
8,272 Apache Corp. 946,15112,941 Devon Energy Corp. 1,320,62914,952 Hess Corp. 1,565,62421,453 Marathon Oil Corp. 966,887
5,937,654
Shares Value
Paper & Forest Products - 4.2%35,486 International Paper Co. $ 959,89615,660 Weyerhaeuser Co. 868,974
1,828,870
TOTAL COMMON STOCKS(Cost $21,584,891) $23,403,160
PrincipalAmount
SHORT TERM INVESTMENTS - 13.7%U.S. GOVERNMENT AGENCY OBLIGATIONS - 11.8%
$5,100,000 Federal Home Loan Bank DiscountNote, 1.9667%, 9/2/2008 5,099,749
Shares
MONEY MARKET FUNDS - 1.9%831,850 Fidelity Institutional Money Market
Portfolio 831,850
TOTAL SHORT TERMINVESTMENTS(Cost $5,931,599) $ 5,931,599
TOTAL INVESTMENTS(COST $27,516,490) - 68.1% $29,334,759
Other Assets in Excess ofLiabilities - 31.9% 13,746,087
TOTAL NET ASSETS - 100.0% $43,080,846
Percentages are stated as a percent of net assets.
Commodity Bull 2X Fund
Equity Swap ContractsAugust 31, 2008
Counterparty Reference EntityNumber ofContracts
NotionalAmount
TerminationDate
UnrealizedDepreciation
Goldman Sachs & Co. Morgan Stanley Commodity Related Equity Index 40,318 $36,312,761 4/15/2010 $(2,794,856)Merrill Lynch Morgan Stanley Commodity Related Equity Index 28,795 29,258,887 6/22/2009 (5,429,580)Merrill Lynch Morgan Stanley Commodity Related Equity Index 6,750 6,607,322 7/9/2009 (1,016,581)
75,863 $72,178,970 $(9,241,017)
Concentration By Country
Country % of Net Assets
United States of America 54.3Canada 11.2Australia 2.6
Total Investments 68.1%
The accompanying notes are an integral part of these financial statements.
D I REXI O N A NNU A L REPO RT
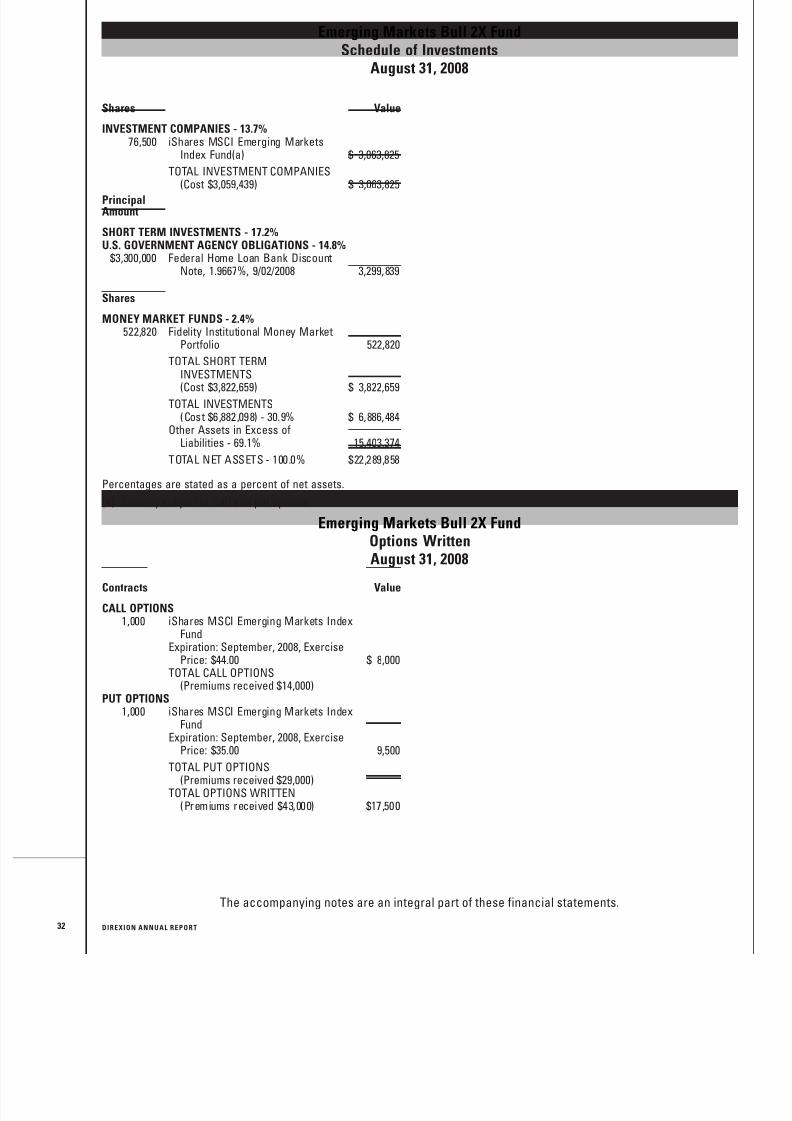
8/14/2019 Direxion Funds Annual Report - 2008
http://slidepdf.com/reader/full/direxion-funds-annual-report-2008 34/87
Emerging Markets Bull 2X FundSchedule of Investments
August 31, 2008
Shares Value
INVESTMENT COMPANIES - 13.7%76,500 iShares MSCI Emerging Markets
Index Fund(a) $ 3,063,825
TOTAL INVESTMENT COMPANIES(Cost $3,059,439) $ 3,063,825
PrincipalAmount
SHORT TERM INVESTMENTS - 17.2%U.S. GOVERNMENT AGENCY OBLIGATIONS - 14.8%
$3,300,000 Federal Home Loan Bank DiscountNote, 1.9667%, 9/02/2008 3,299,839
Shares
MONEY MARKET FUNDS - 2.4%522,820 Fidelity Institutional Money Market
Portfolio 522,820
TOTAL SHORT TERMINVESTMENTS(Cost $3,822,659) $ 3,822,659
TOTAL INVESTMENTS(Cost $6,882,098) - 30.9% $ 6,886,484
Other Assets in Excess ofLiabilities - 69.1% 15,403,374
TOTAL NET ASSETS - 100.0% $22,289,858
Percentages are stated as a percent of net assets.
(a) Security subject to call and put options.
Emerging Markets Bull 2X FundOptions WrittenAugust 31, 2008
Contracts Value
CALL OPTIONS1,000 iShares MSCI Emerging Markets Index
FundExpiration: September, 2008, Exercise
Price: $44.00 $ 8,000TOTAL CALL OPTIONS
(Premiums received $14,000)PUT OPTIONS
1,000 iShares MSCI Emerging Markets IndexFund
Expiration: September, 2008, ExercisePrice: $35.00 9,500
TOTAL PUT OPTIONS(Premiums received $29,000)
TOTAL OPTIONS WRITTEN(Premiums received $43,000) $17,500
32
The accompanying notes are an integral part of these financial statements.
D I REXI O N A NNU A L REPO RT
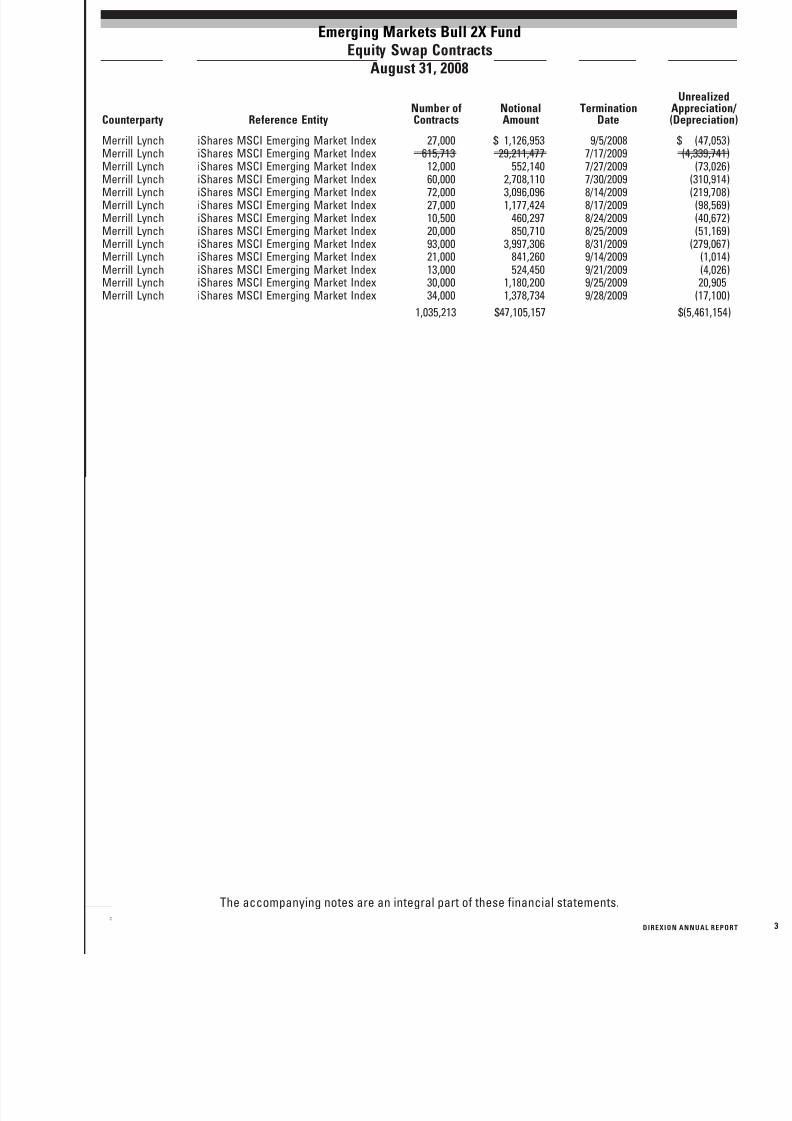
8/14/2019 Direxion Funds Annual Report - 2008
http://slidepdf.com/reader/full/direxion-funds-annual-report-2008 35/87
Emerging Markets Bull 2X FundEquity Swap Contracts
August 31, 2008
Counterparty Reference EntityNumber ofContracts
NotionalAmount
TerminationDate
UnrealizedAppreciation/ (Depreciation)
Merrill Lynch iShares MSCI Emerging Market Index 27,000 $ 1,126,953 9/5/2008 $ (47,053)Merrill Lynch iShares MSCI Emerging Market Index 615,713 29,211,477 7/17/2009 (4,339,741)Merrill Lynch iShares MSCI Emerging Market Index 12,000 552,140 7/27/2009 (73,026)Merrill Lynch iShares MSCI Emerging Market Index 60,000 2,708,110 7/30/2009 (310,914)
Merrill Lynch iShares MSCI Emerging Market Index 72,000 3,096,096 8/14/2009 (219,708)Merrill Lynch iShares MSCI Emerging Market Index 27,000 1,177,424 8/17/2009 (98,569)Merrill Lynch iShares MSCI Emerging Market Index 10,500 460,297 8/24/2009 (40,672)Merrill Lynch iShares MSCI Emerging Market Index 20,000 850,710 8/25/2009 (51,169)Merrill Lynch iShares MSCI Emerging Market Index 93,000 3,997,306 8/31/2009 (279,067)Merrill Lynch iShares MSCI Emerging Market Index 21,000 841,260 9/14/2009 (1,014)Merrill Lynch iShares MSCI Emerging Market Index 13,000 524,450 9/21/2009 (4,026)Merrill Lynch iShares MSCI Emerging Market Index 30,000 1,180,200 9/25/2009 20,905Merrill Lynch iShares MSCI Emerging Market Index 34,000 1,378,734 9/28/2009 (17,100)
1,035,213 $47,105,157 $(5,461,154)
The accompanying notes are an integral part of these financial statements.
D I REXI O N A NNU A L REPO RT
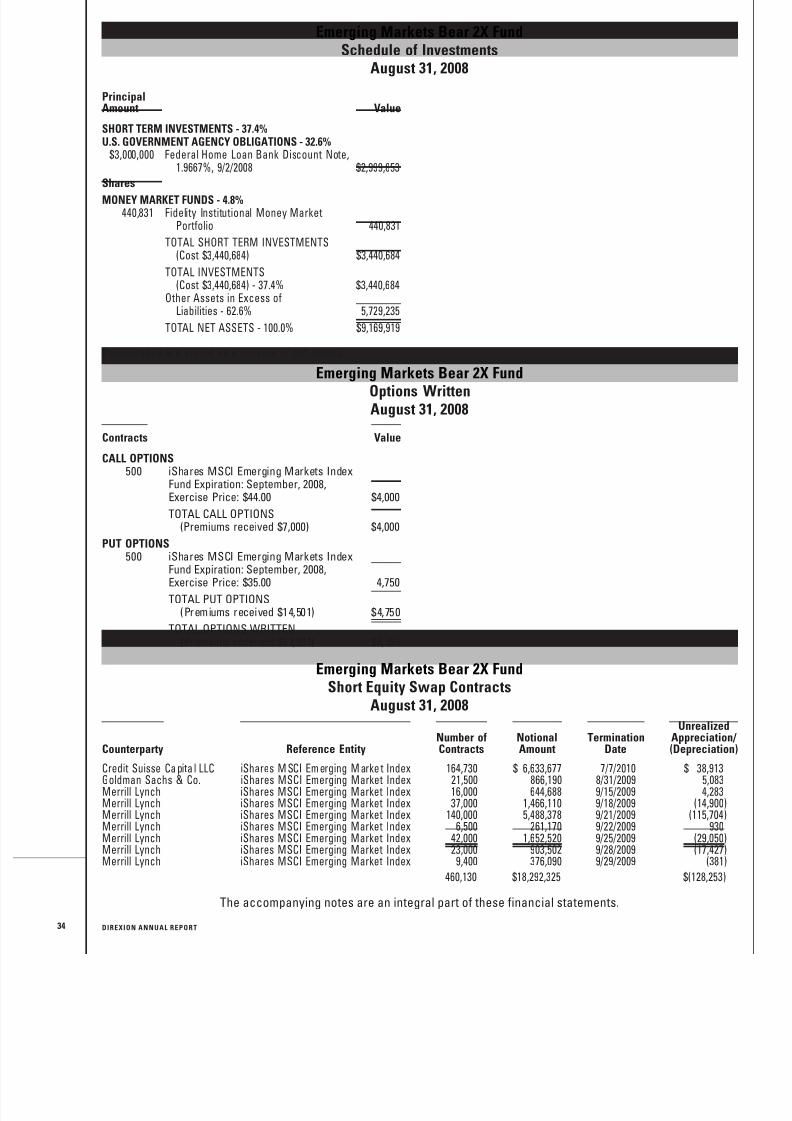
8/14/2019 Direxion Funds Annual Report - 2008
http://slidepdf.com/reader/full/direxion-funds-annual-report-2008 36/87
Emerging Markets Bear 2X FundSchedule of Investments
August 31, 2008
PrincipalAmount Value
SHORT TERM INVESTMENTS - 37.4%
U.S. GOVERNMENT AGENCY OBLIGATIONS - 32.6%
$3,000,000 Federal Home Loan Bank Discount Note,1.9667%, 9/2/2008 $2,999,853
Shares
MONEY MARKET FUNDS - 4.8%
440,831 Fidelity Institutional Money MarketPortfolio 440,831
TOTAL SHORT TERM INVESTMENTS(Cost $3,440,684) $3,440,684
TOTAL INVESTMENTS(Cost $3,440,684) - 37.4% $3,440,684
Other Assets in Excess ofLiabilities - 62.6% 5,729,235
TOTAL NET ASSETS - 100.0% $9,169,919
Percentages are stated as a percent of net assets.
Emerging Markets Bear 2X FundOptions WrittenAugust 31, 2008
Contracts Value
CALL OPTIONS500 iShares MSCI Emerging Markets Index
Fund Expiration: September, 2008,Exercise Price: $44.00 $4,000
TOTAL CALL OPTIONS(Premiums received $7,000) $4,000
PUT OPTIONS500 iShares MSCI Emerging Markets Index
Fund Expiration: September, 2008,Exercise Price: $35.00 4,750
TOTAL PUT OPTIONS(Premiums received $14,501) $4,750
TOTAL OPTIONS WRITTEN(Premiums received $21,501) $8,750
Emerging Markets Bear 2X FundShort Equity Swap Contracts
August 31, 2008
Counterparty Reference EntityNumber ofContracts
NotionalAmount
TerminationDate
UnrealizedAppreciation/ (Depreciation)
Credit Suisse Capita l LLC iShares MSCI Emerging Market Index 164,730 $ 6,633,677 7/7/2010 $ 38,913Goldman Sachs & Co. iShares MSCI Emerging Market Index 21,500 866,190 8/31/2009 5,083Merrill Lynch iShares MSCI Emerging Market Index 16,000 644,688 9/15/2009 4,283Merrill Lynch iShares MSCI Emerging Market Index 37,000 1,466,110 9/18/2009 (14,900)Merrill Lynch iShares MSCI Emerging Market Index 140,000 5,488,378 9/21/2009 (115,704)Merrill Lynch iShares MSCI Emerging Market Index 6,500 261,170 9/22/2009 930Merrill Lynch iShares MSCI Emerging Market Index 42,000 1,652,520 9/25/2009 (29,050)Merrill Lynch iShares MSCI Emerging Market Index 23,000 903,502 9/28/2009 (17,427)Merrill Lynch iShares MSCI Emerging Market Index 9,400 376,090 9/29/2009 (381)
460,130 $18,292,325 $(128,253)
34
The accompanying notes are an integral part of these financial statements.
D I REXI O N A NNU A L REPO RT
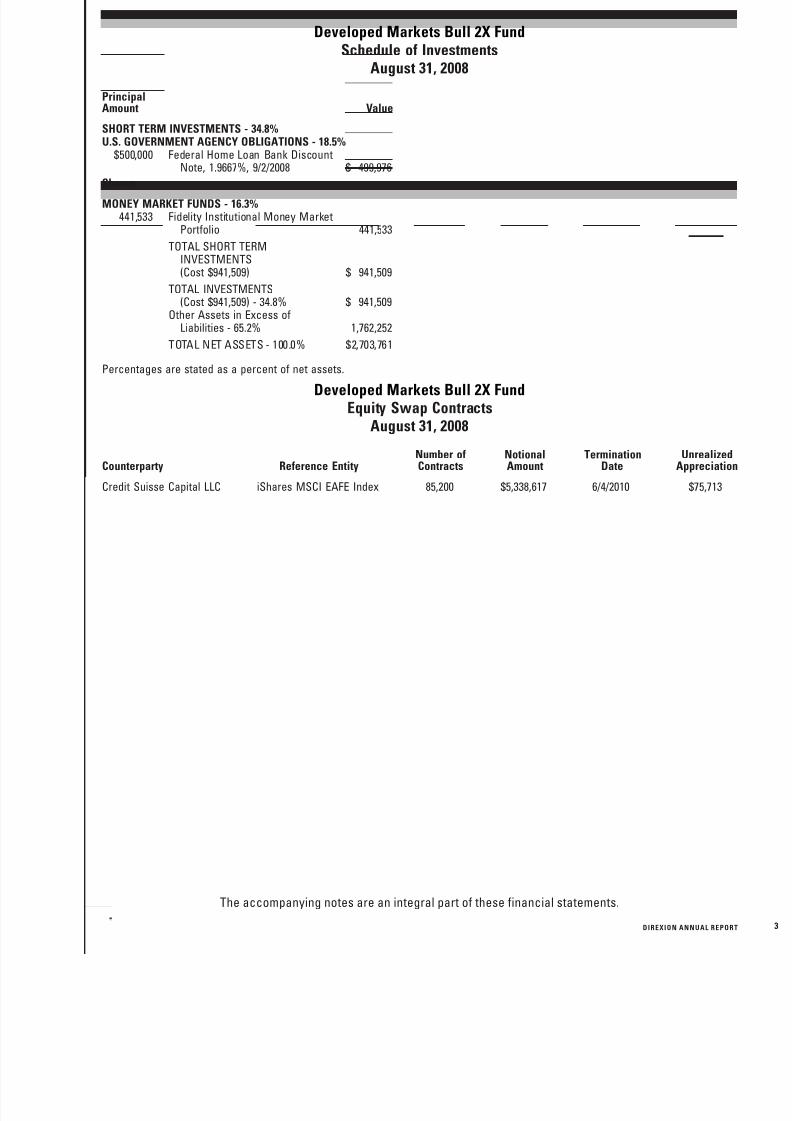
8/14/2019 Direxion Funds Annual Report - 2008
http://slidepdf.com/reader/full/direxion-funds-annual-report-2008 37/87
Developed Markets Bull 2X FundSchedule of Investments
August 31, 2008
PrincipalAmount Value
SHORT TERM INVESTMENTS - 34.8%U.S. GOVERNMENT AGENCY OBLIGATIONS - 18.5%
$500,000 Federal Home Loan Bank DiscountNote, 1.9667%, 9/2/2008 $ 499,976
Shares
MONEY MARKET FUNDS - 16.3%441,533 Fidelity Institutional Money Market
Portfolio 441,533
TOTAL SHORT TERMINVESTMENTS(Cost $941,509) $ 941,509
TOTAL INVESTMENTS(Cost $941,509) - 34.8% $ 941,509
Other Assets in Excess ofLiabilities - 65.2% 1,762,252
TOTAL NET ASSETS - 100.0% $2,703,761
Percentages are stated as a percent of net assets.
Developed Markets Bull 2X FundEquity Swap Contracts
August 31, 2008
Counterparty Reference EntityNumber ofContracts
NotionalAmount
TerminationDate
UnrealizedAppreciation
Credit Suisse Capital LLC iShares MSCI EAFE Index 85,200 $5,338,617 6/4/2010 $75,713
The accompanying notes are an integral part of these financial statements.
D I REXI O N A NNU A L REPO RT

8/14/2019 Direxion Funds Annual Report - 2008
http://slidepdf.com/reader/full/direxion-funds-annual-report-2008 38/87
Developed Markets Bear 2X FundSchedule of Investments
August 31, 2008
PrincipalAmount Value
SHORT TERM INVESTMENTS - 60.4%U.S. GOVERNMENT AGENCY OBLIGATIONS - 55.7%
$6,200,000 Federal Home Loan BankDiscount Note, 1.9667%,9/2/2008 $ 6,199,695
Shares
MONEY MARKET FUNDS - 4.7%528,679 Fidelity Institutional Money
Market Portfolio 528,679
TOTAL SHORT TERMINVESTMENTS(Cost $6,728,374) $ 6,728,374
TOTAL INVESTMENTS(Cost $6,728,374) - 60.4% $ 6,728,374
Other Assets in Excess ofLiabilities - 39.6% 4,404,722
TOTAL NET ASSETS - 100.0% $11,133,096
Percentages are stated as a percent of net assets.
Developed Markets Bear 2X FundShort Equity Swap Contracts
August 31, 2008
Counterparty Reference EntityNumber ofContracts
NotionalAmount
TerminationDate
UnrealizedDepreciation
Credit Suisse Capital LLC iShares MSCI EAFE Index 350,150 $21,885,804 7/23/2010 $(360,682)
36
The accompanying notes are an integral part of these financial statements.
D I REXI O N A NNU A L REPO RT
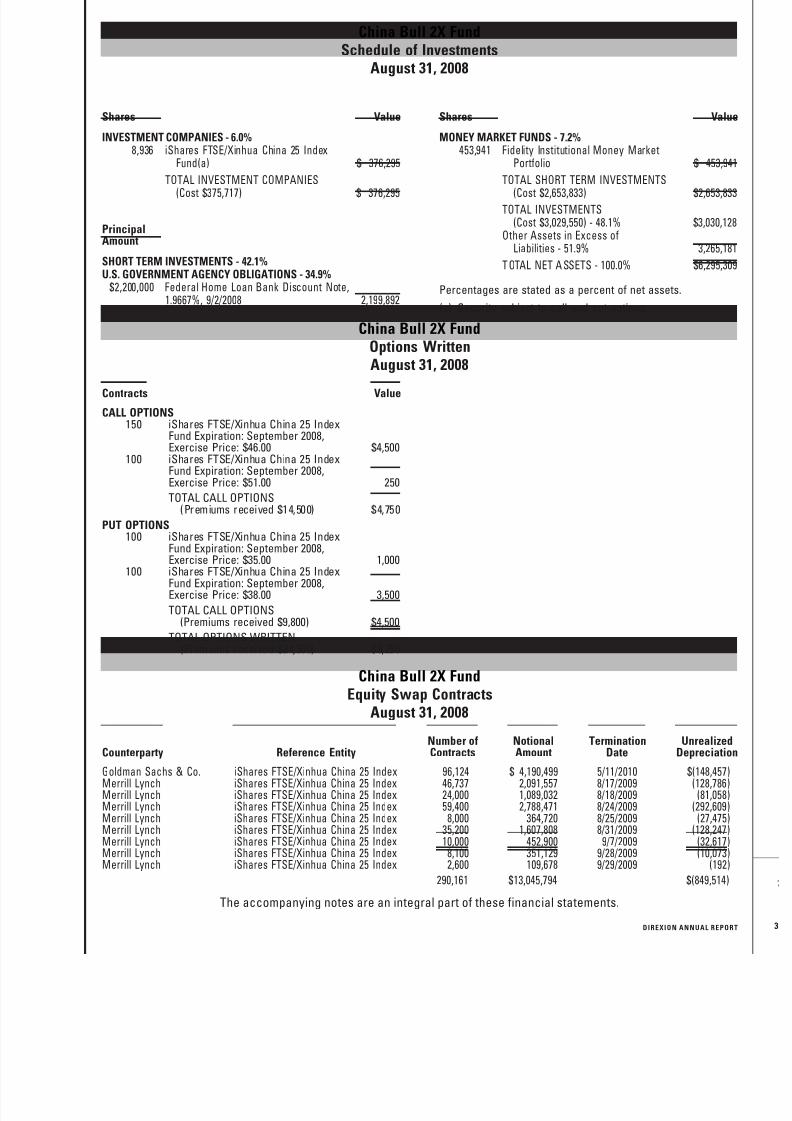
8/14/2019 Direxion Funds Annual Report - 2008
http://slidepdf.com/reader/full/direxion-funds-annual-report-2008 39/87
China Bull 2X FundSchedule of Investments
August 31, 2008
Shares Value
INVESTMENT COMPANIES - 6.0%
8,936 iShares FTSE/Xinhua China 25 IndexFund(a) $ 376,295
TOTAL INVESTMENT COMPANIES
(Cost $375,717) $ 376,295
PrincipalAmount
SHORT TERM INVESTMENTS - 42.1%
U.S. GOVERNMENT AGENCY OBLIGATIONS - 34.9%
$2,200,000 Federal Home Loan Bank Discount Note,1.9667%, 9/2/2008 2,199,892
Shares Value
MONEY MARKET FUNDS - 7.2%
453,941 Fidelity Institutional Money MarketPortfolio $ 453,941
TOTAL SHORT TERM INVESTMENTS
(Cost $2,653,833) $2,653,833TOTAL INVESTMENTS
(Cost $3,029,550) - 48.1% $3,030,128Other Assets in Excess of
Liabilities - 51.9% 3,265,181
TOTAL NET ASSETS - 100.0% $6,295,309
Percentages are stated as a percent of net assets.
(a) Security subject to call and put options.
China Bull 2X FundOptions WrittenAugust 31, 2008
Contracts Value
CALL OPTIONS150 iShares FTSE/Xinhua China 25 Index
Fund Expiration: September 2008,Exercise Price: $46.00 $4,500
100 iShares FTSE/Xinhua China 25 IndexFund Expiration: September 2008,Exercise Price: $51.00 250
TOTAL CALL OPTIONS(Premiums received $14,500) $4,750
PUT OPTIONS100 iShares FTSE/Xinhua China 25 Index
Fund Expiration: September 2008,Exercise Price: $35.00 1,000
100 iShares FTSE/Xinhua China 25 IndexFund Expiration: September 2008,Exercise Price: $38.00 3,500
TOTAL CALL OPTIONS(Premiums received $9,800) $4,500
TOTAL OPTIONS WRITTEN(Premiums received $24,300) $9,250
China Bull 2X FundEquity Swap Contracts
August 31, 2008
Counterparty Reference EntityNumber ofContracts
NotionalAmount
TerminationDate
UnrealizedDepreciation
Goldman Sachs & Co. iShares FTSE/Xinhua China 25 Index 96,124 $ 4,190,499 5/11/2010 $(148,457)Merrill Lynch iShares FTSE/Xinhua China 25 Index 46,737 2,091,557 8/17/2009 (128,786)Merrill Lynch iShares FTSE/Xinhua China 25 Index 24,000 1,089,032 8/18/2009 (81,058)Merrill Lynch iShares FTSE/Xinhua China 25 Index 59,400 2,788,471 8/24/2009 (292,609)Merrill Lynch iShares FTSE/Xinhua China 25 Index 8,000 364,720 8/25/2009 (27,475)Merrill Lynch iShares FTSE/Xinhua China 25 Index 35,200 1,607,808 8/31/2009 (128,247)Merrill Lynch iShares FTSE/Xinhua China 25 Index 10,000 452,900 9/7/2009 (32,617)Merrill Lynch iShares FTSE/Xinhua China 25 Index 8,100 351,129 9/28/2009 (10,073)Merrill Lynch iShares FTSE/Xinhua China 25 Index 2,600 109,678 9/29/2009 (192)
290,161 $13,045,794 $(849,514)
The accompanying notes are an integral part of these financial statements.
D I REXI O N A NNU A L REPO RT
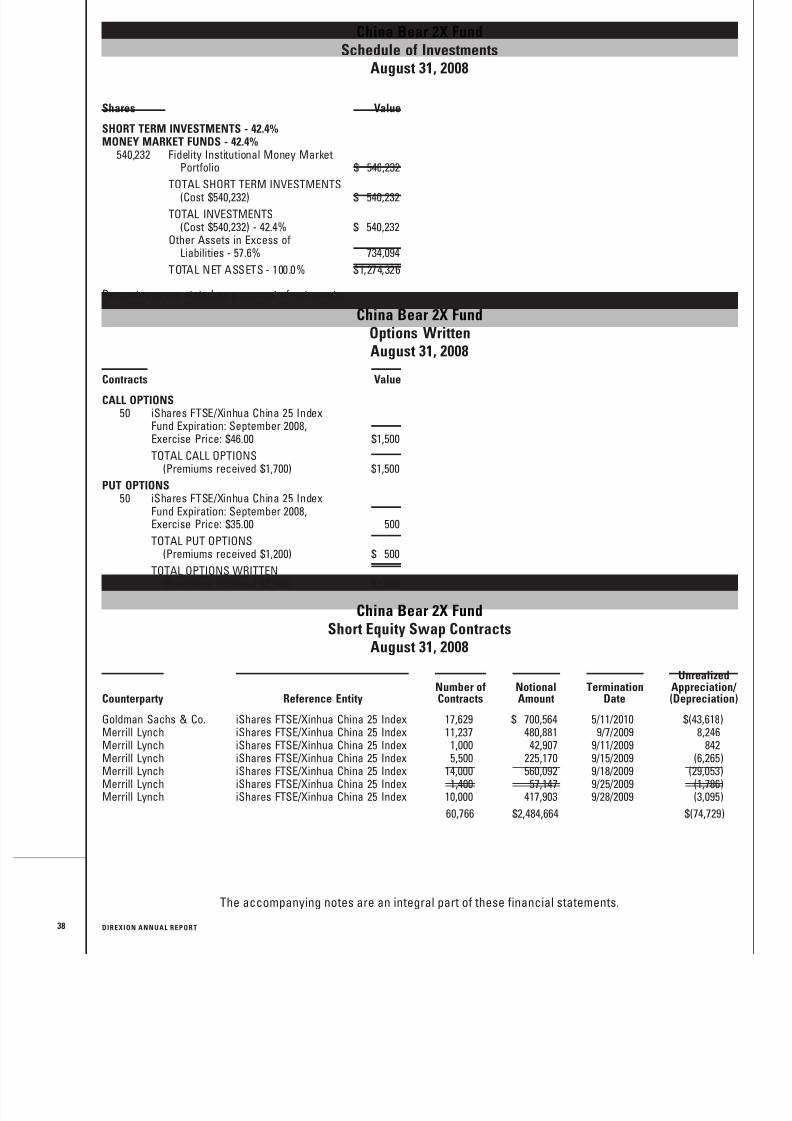
8/14/2019 Direxion Funds Annual Report - 2008
http://slidepdf.com/reader/full/direxion-funds-annual-report-2008 40/87
China Bear 2X FundSchedule of Investments
August 31, 2008
Shares Value
SHORT TERM INVESTMENTS - 42.4%MONEY MARKET FUNDS - 42.4%
540,232 Fidelity Institutional Money MarketPortfolio $ 540,232
TOTAL SHORT TERM INVESTMENTS(Cost $540,232) $ 540,232
TOTAL INVESTMENTS(Cost $540,232) - 42.4% $ 540,232
Other Assets in Excess ofLiabilities - 57.6% 734,094
TOTAL NET ASSETS - 100.0% $1,274,326
Percentages are stated as a percent of net assets.
China Bear 2X FundOptions WrittenAugust 31, 2008
Contracts ValueCALL OPTIONS
50 iShares FTSE/Xinhua China 25 IndexFund Expiration: September 2008,Exercise Price: $46.00 $1,500
TOTAL CALL OPTIONS(Premiums received $1,700) $1,500
PUT OPTIONS50 iShares FTSE/Xinhua China 25 Index
Fund Expiration: September 2008,Exercise Price: $35.00 500
TOTAL PUT OPTIONS(Premiums received $1,200) $ 500
TOTAL OPTIONS WRITTEN(Premiums received $2,900) $2,000
China Bear 2X FundShort Equity Swap Contracts
August 31, 2008
Counterparty Reference EntityNumber ofContracts
NotionalAmount
TerminationDate
UnrealizedAppreciation/ (Depreciation)
Goldman Sachs & Co. iShares FTSE/Xinhua China 25 Index 17,629 $ 700,564 5/11/2010 $(43,618)Merrill Lynch iShares FTSE/Xinhua China 25 Index 11,237 480,881 9/7/2009 8,246Merrill Lynch iShares FTSE/Xinhua China 25 Index 1,000 42,907 9/11/2009 842Merrill Lynch iShares FTSE/Xinhua China 25 Index 5,500 225,170 9/15/2009 (6,265)Merrill Lynch iShares FTSE/Xinhua China 25 Index 14,000 560,092 9/18/2009 (29,053)Merrill Lynch iShares FTSE/Xinhua China 25 Index 1,400 57,147 9/25/2009 (1,786)Merrill Lynch iShares FTSE/Xinhua China 25 Index 10,000 417,903 9/28/2009 (3,095)
60,766 $2,484,664 $(74,729)
38
The accompanying notes are an integral part of these financial statements.
D I REXI O N A NNU A L REPO RT
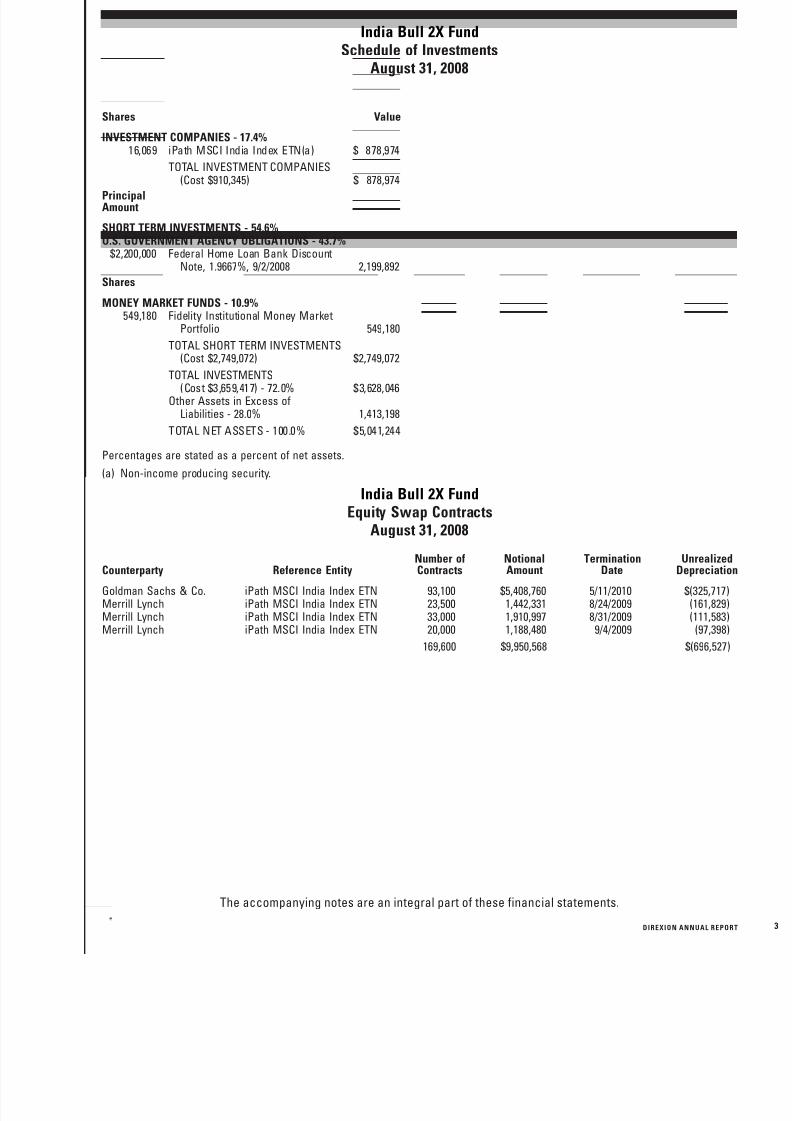
8/14/2019 Direxion Funds Annual Report - 2008
http://slidepdf.com/reader/full/direxion-funds-annual-report-2008 41/87
India Bull 2X FundSchedule of Investments
August 31, 2008
Shares Value
INVESTMENT COMPANIES - 17.4%16,069 iPath MSCI India Index ETN(a) $ 878,974
TOTAL INVESTMENT COMPANIES(Cost $910,345) $ 878,974
PrincipalAmount
SHORT TERM INVESTMENTS - 54.6%U.S. GOVERNMENT AGENCY OBLIGATIONS - 43.7%
$2,200,000 Federal Home Loan Bank DiscountNote, 1.9667%, 9/2/2008 2,199,892
Shares
MONEY MARKET FUNDS - 10.9%549,180 Fidelity Institutional Money Market
Portfolio 549,180
TOTAL SHORT TERM INVESTMENTS(Cost $2,749,072) $2,749,072
TOTAL INVESTMENTS(Cost $3,659,417) - 72.0% $3,628,046
Other Assets in Excess ofLiabilities - 28.0% 1,413,198
TOTAL NET ASSETS - 100.0% $5,041,244
Percentages are stated as a percent of net assets.
(a) Non-income producing security.
India Bull 2X FundEquity Swap Contracts
August 31, 2008
Counterparty Reference Entity
Number of
Contracts
Notional
Amount
Termination
Date
Unrealized
DepreciationGoldman Sachs & Co. iPath MSCI India Index ETN 93,100 $5,408,760 5/11/2010 $(325,717)Merrill Lynch iPath MSCI India Index ETN 23,500 1,442,331 8/24/2009 (161,829)Merrill Lynch iPath MSCI India Index ETN 33,000 1,910,997 8/31/2009 (111,583)Merrill Lynch iPath MSCI India Index ETN 20,000 1,188,480 9/4/2009 (97,398)
169,600 $9,950,568 $(696,527)
The accompanying notes are an integral part of these financial statements.
D I REXI O N A NNU A L REPO RT
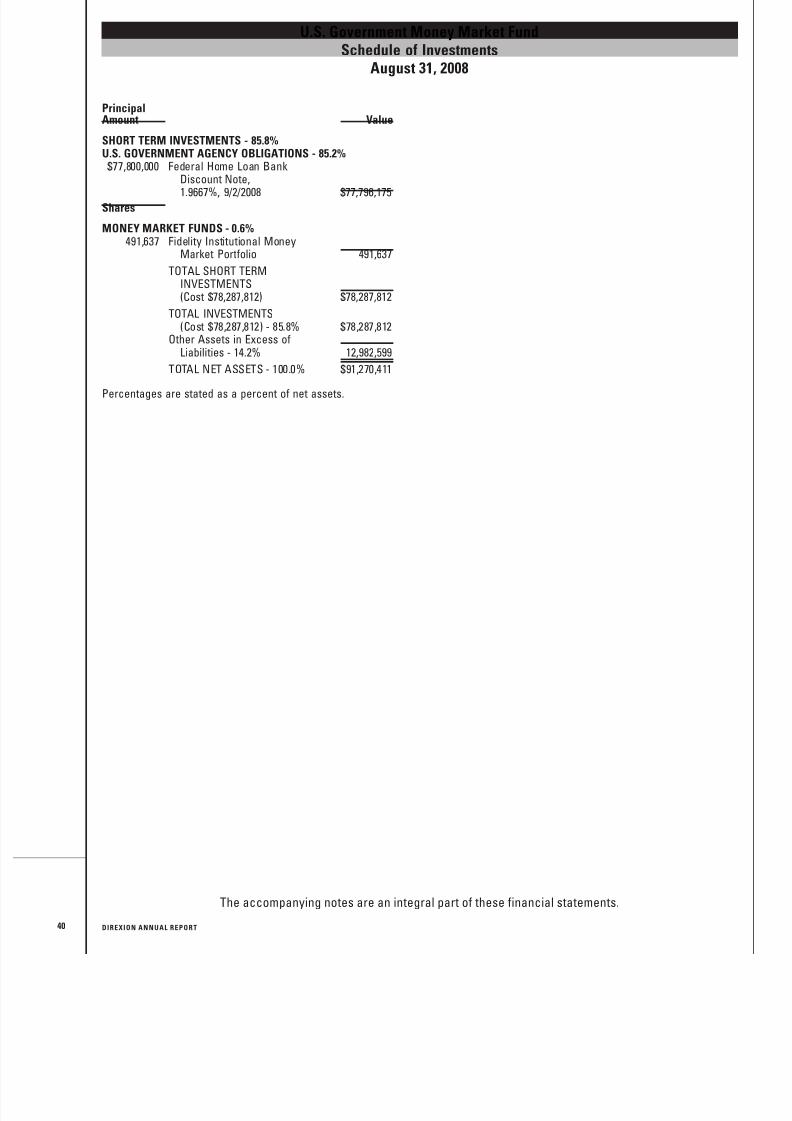
8/14/2019 Direxion Funds Annual Report - 2008
http://slidepdf.com/reader/full/direxion-funds-annual-report-2008 42/87
U.S. Government Money Market FundSchedule of Investments
August 31, 2008
PrincipalAmount Value
SHORT TERM INVESTMENTS - 85.8%U.S. GOVERNMENT AGENCY OBLIGATIONS - 85.2%
$77,800,000 Federal Home Loan BankDiscount Note,
1.9667%, 9/2/2008 $77,796,175Shares
MONEY MARKET FUNDS - 0.6%491,637 Fidelity Institutional Money
Market Portfolio 491,637
TOTAL SHORT TERMINVESTMENTS(Cost $78,287,812) $78,287,812
TOTAL INVESTMENTS(Cost $78,287,812) - 85.8% $78,287,812
Other Assets in Excess ofLiabilities - 14.2% 12,982,599
TOTAL NET ASSETS - 100.0% $91,270,411
Percentages are stated as a percent of net assets.
40
The accompanying notes are an integral part of these financial statements.
D I REXI O N A NNU A L REPO RT
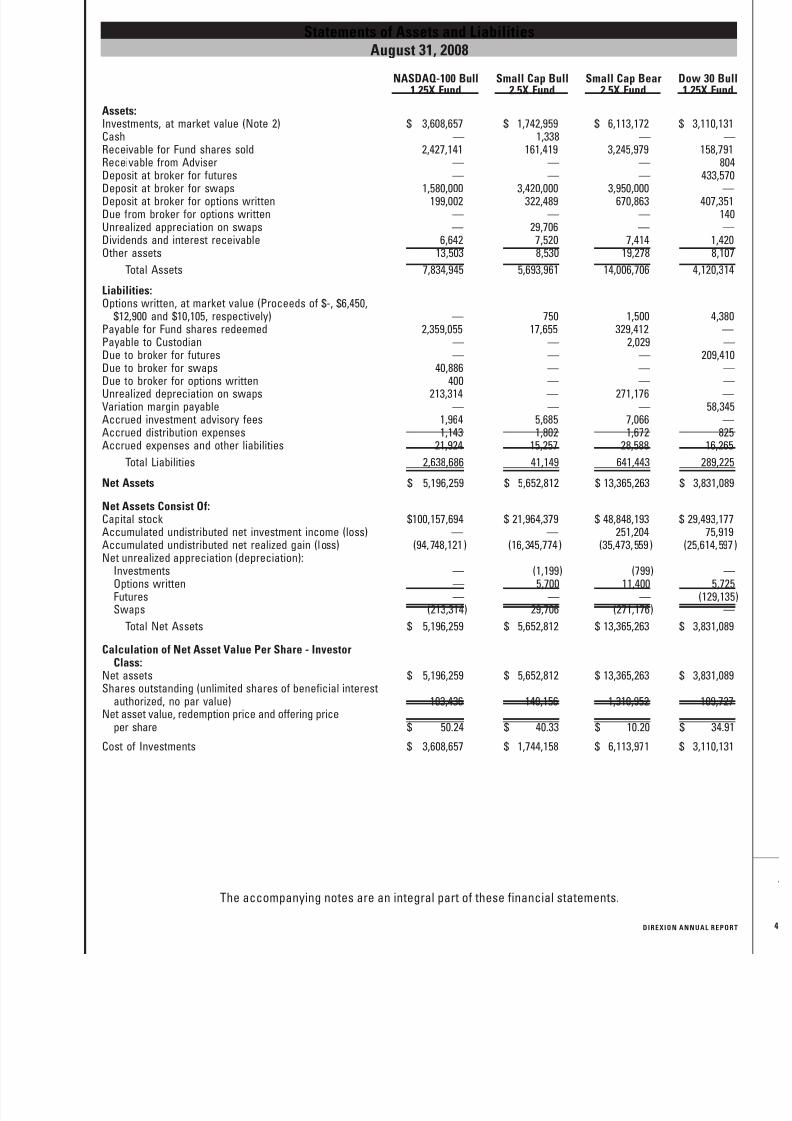
8/14/2019 Direxion Funds Annual Report - 2008
http://slidepdf.com/reader/full/direxion-funds-annual-report-2008 43/87
Statements of Assets and LiabilitiesAugust 31, 2008
NASDAQ-100 Bull1.25X Fund
Small Cap Bull2.5X Fund
Small Cap Bear2.5X Fund
Dow 30 Bull1.25X Fund
Assets:Investments, at market value (Note 2) $ 3,608,657 $ 1,742,959 $ 6,113,172 $ 3,110,131Cash — 1,338 — —Receivable for Fund shares sold 2,427,141 161,419 3,245,979 158,791Receivable from Adviser — — — 804Deposit at broker for futures — — — 433,570
Deposit at broker for swaps 1,580,000 3,420,000 3,950,000 —Deposit at broker for options written 199,002 322,489 670,863 407,351Due from broker for options written — — — 140Unrealized appreciation on swaps — 29,706 — —Dividends and interest receivable 6,642 7,520 7,414 1,420Other assets 13,503 8,530 19,278 8,107
Total Assets 7,834,945 5,693,961 14,006,706 4,120,314
Liabilities:Options written, at market value (Proceeds of $-, $6,450,
$12,900 and $10,105, respectively) — 750 1,500 4,380Payable for Fund shares redeemed 2,359,055 17,655 329,412 —Payable to Custodian — — 2,029 —Due to broker for futures — — — 209,410Due to broker for swaps 40,886 — — —
Due to broker for options written 400 — — —Unrealized depreciation on swaps 213,314 — 271,176 —Variation margin payable — — — 58,345Accrued investment advisory fees 1,964 5,685 7,066 —Accrued distribution expenses 1,143 1,802 1,672 825Accrued expenses and other liabilities 21,924 15,257 28,588 16,265
Total Liabilities 2,638,686 41,149 641,443 289,225
Net Assets $ 5,196,259 $ 5,652,812 $ 13,365,263 $ 3,831,089
Net Assets Consist Of:Capital stock $100,157,694 $ 21,964,379 $ 48,848,193 $ 29,493,177Accumulated undistributed net investment income (loss) — — 251,204 75,919Accumulated undistributed net realized gain (loss) (94,748,121) (16,345,774) (35,473,559) (25,614,597Net unrealized appreciation (depreciation):
Investments — (1,199) (799) —Options written — 5,700 11,400 5,725Futures — — — (129,135Swaps (213,314) 29,706 (271,176) —
Total Net Assets $ 5,196,259 $ 5,652,812 $ 13,365,263 $ 3,831,089
Calculation of Net Asset Value Per Share - InvestorClass:
Net assets $ 5,196,259 $ 5,652,812 $ 13,365,263 $ 3,831,089Shares outstanding (unlimited shares of beneficial interest
authorized, no par value) 103,436 140,156 1,310,952 109,727Net asset value, redemption price and offering price
per share $ 50.24 $ 40.33 $ 10.20 $ 34.91
Cost of Investments $ 3,608,657 $ 1,744,158 $ 6,113,971 $ 3,110,131
The accompanying notes are an integral part of these financial statements.
D I REXI O N A NNU A L REPO RT
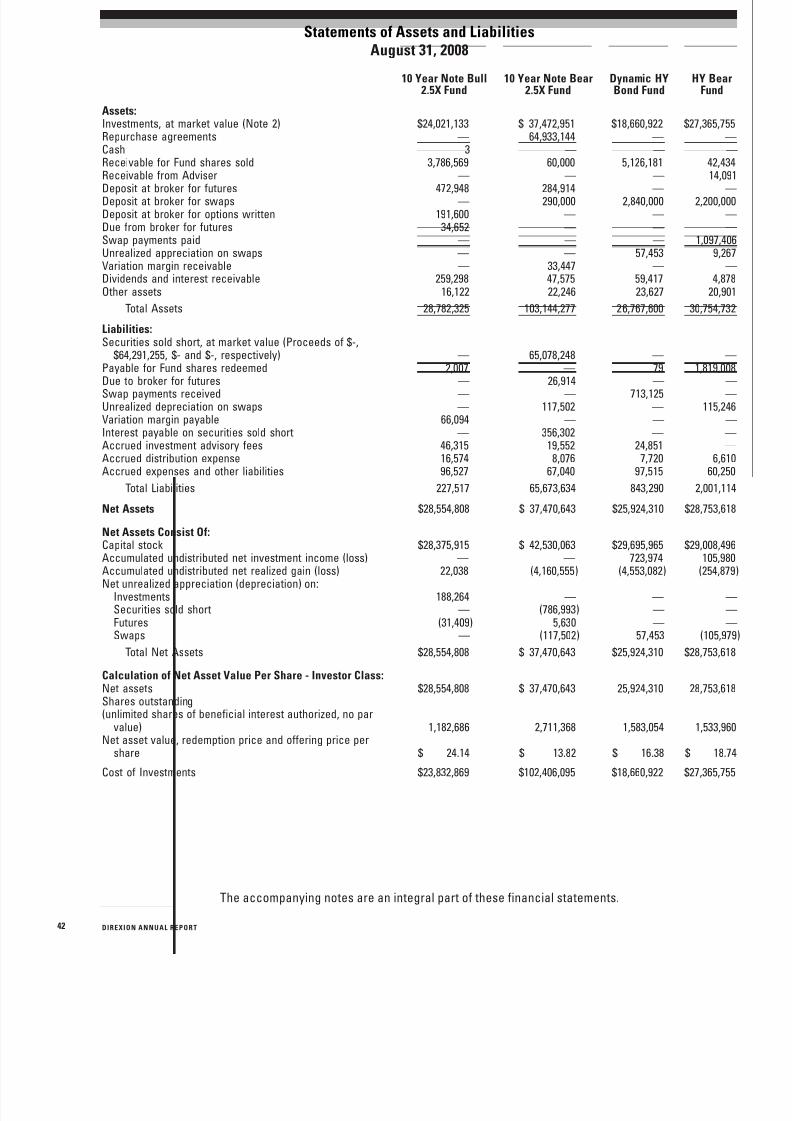
8/14/2019 Direxion Funds Annual Report - 2008
http://slidepdf.com/reader/full/direxion-funds-annual-report-2008 44/87
Statements of Assets and LiabilitiesAugust 31, 2008
10 Year Note Bull2.5X Fund
10 Year Note Bear2.5X Fund
Dynamic HYBond Fund
HY BearFund
Assets:Investments, at market value (Note 2) $24,021,133 $ 37,472,951 $18,660,922 $27,365,755Repurchase agreements — 64,933,144 — —Cash 3 — — —Receivable for Fund shares sold 3,786,569 60,000 5,126,181 42,434Receivable from Adviser — — — 14,091
Deposit at broker for futures 472,948 284,914 — —Deposit at broker for swaps — 290,000 2,840,000 2,200,000Deposit at broker for options written 191,600 — — —Due from broker for futures 34,652 — — —Swap payments paid — — — 1,097,406Unrealized appreciation on swaps — — 57,453 9,267Variation margin receivable — 33,447 — —Dividends and interest receivable 259,298 47,575 59,417 4,878Other assets 16,122 22,246 23,627 20,901
Total Assets 28,782,325 103,144,277 26,767,600 30,754,732
Liabilities:Securities sold short, at market value (Proceeds of $-,
$64,291,255, $- and $-, respectively) — 65,078,248 — —Payable for Fund shares redeemed 2,007 — 79 1,819,008
Due to broker for futures — 26,914 — —Swap payments received — — 713,125 —Unrealized depreciation on swaps — 117,502 — 115,246Variation margin payable 66,094 — — —Interest payable on securities sold short — 356,302 — —Accrued investment advisory fees 46,315 19,552 24,851 —Accrued distribution expense 16,574 8,076 7,720 6,610Accrued expenses and other liabilities 96,527 67,040 97,515 60,250
Total Liabilities 227,517 65,673,634 843,290 2,001,114
Net Assets $28,554,808 $ 37,470,643 $25,924,310 $28,753,618
Net Assets Consist Of:Capital stock $28,375,915 $ 42,530,063 $29,695,965 $29,008,496Accumulated undistributed net investment income (loss) — — 723,974 105,980
Accumulated undistributed net realized gain (loss) 22,038 (4,160,555) (4,553,082) (254,879Net unrealized appreciation (depreciation) on:Investments 188,264 — — —Securities sold short — (786,993) — —Futures (31,409) 5,630 — —Swaps — (117,502) 57,453 (105,979
Total Net Assets $28,554,808 $ 37,470,643 $25,924,310 $28,753,618
Calculation of Net Asset Value Per Share - Investor Class:Net assets $28,554,808 $ 37,470,643 25,924,310 28,753,618Shares outstanding(unlimited shares of beneficial interest authorized, no par
value) 1,182,686 2,711,368 1,583,054 1,533,960Net asset value, redemption price and offering price per
share $ 24.14 $ 13.82 $ 16.38 $ 18.74
Cost of Investments $23,832,869 $102,406,095 $18,660,922 $27,365,755
The accompanying notes are an integral part of these financial statements.
42 D I REXI O N A NNU A L REPO RT

8/14/2019 Direxion Funds Annual Report - 2008
http://slidepdf.com/reader/full/direxion-funds-annual-report-2008 45/87
Statements of Assets and LiabilitiesAugust 31, 2008
CommodityBull 2X Fund
Emerging MarketsBull 2X Fund
Emerging MarketsBear 2X Fund
Assets:Investments, at market value (Note 2) $29,334,759 $ 6,886,484 $ 3,440,684Cash 563 — —Receivable for Fund shares sold 199,559 688,279 19,762Receivable for investments sold — 281,176 —Deposit at broker for swaps 23,290,000 17,080,000 5,650,000
Deposit at broker for options written — 3,523,559 709,139Due from broker for swaps — — 92,901Due from broker for options written — 577 —Unrealized appreciation on swaps — — 43,996Dividends and interest receivable 105,247 193,853 32,787Other assets 21,255 26,238 21,496
Total Assets 52,951,383 28,680,166 10,010,765
Liabilities:Options written, at market value (Proceeds of $—, $43,000 and $21,501,
respectively) — 17,500 8,750Payable for Fund shares redeemed 152,448 628,651 633,509Payable to Custodian — — 50Due to broker for swaps 326,050 190,364 —Due to broker for options written — — —
Unrealized depreciation on swaps 9,241,017 5,461,154 172,249Accrued investment advisory fees 13,853 9,879 2,681Accrued distribution expense 10,036 8,115 1,942Accrued expenses and other liabilities 127,133 74,645 21,665
Total Liabilities 9,870,537 6,390,308 840,846
Net Assets $43,080,846 $ 22,289,858 $ 9,169,919
Net Assets Consist Of:Capital stock $56,620,275 $ 45,272,116 $ 20,605,961Accumulated undistributed net investment income (loss) — — —Accumulated undistributed net realized gain (loss) (6,116,681) (17,550,990) (11,320,540)Net unrealized appreciation (depreciation) on:
Investments 1,818,269 4,386 —Options written — 25,500 12,751
Swaps (9,241,017) (5,461,154) (128,253)Total Net Assets $43,080,846 $ 22,289,858 $ 9,169,919
Calculation of Net Asset Value Per Share - Investor Class:Net assets $43,080,846 $ 22,289,858 $ 9,169,919Shares outstanding(unlimited shares of beneficial interest authorized, no par value) 1,432,521 1,047,193 346,965Net asset value, redemption price and offering price per share $ 30.07 $ 21.29 $ 26.43
Cost of Investments $27,516,490 $ 6,882,098 $ 3,440,684
The accompanying notes are an integral part of these financial statements.
D I REXI O N A NNU A L REPO RT
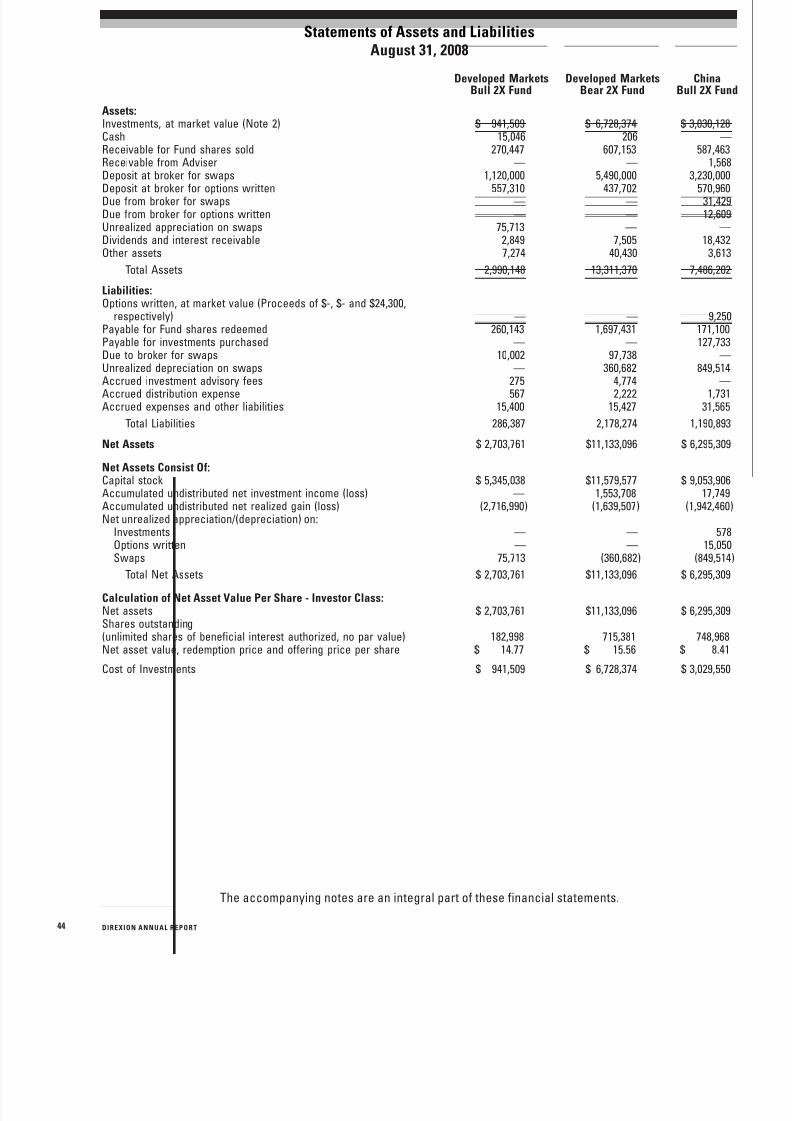
8/14/2019 Direxion Funds Annual Report - 2008
http://slidepdf.com/reader/full/direxion-funds-annual-report-2008 46/87
Statements of Assets and LiabilitiesAugust 31, 2008
Developed MarketsBull 2X Fund
Developed MarketsBear 2X Fund
ChinaBull 2X Fund
Assets:Investments, at market value (Note 2) $ 941,509 $ 6,728,374 $ 3,030,128Cash 15,046 206 —Receivable for Fund shares sold 270,447 607,153 587,463Receivable from Adviser — — 1,568Deposit at broker for swaps 1,120,000 5,490,000 3,230,000
Deposit at broker for options written 557,310 437,702 570,960Due from broker for swaps — — 31,429Due from broker for options written — — 12,609Unrealized appreciation on swaps 75,713 — —Dividends and interest receivable 2,849 7,505 18,432Other assets 7,274 40,430 3,613
Total Assets 2,990,148 13,311,370 7,486,202
Liabilities:Options written, at market value (Proceeds of $-, $- and $24,300,
respectively) — — 9,250Payable for Fund shares redeemed 260,143 1,697,431 171,100Payable for investments purchased — — 127,733Due to broker for swaps 10,002 97,738 —Unrealized depreciation on swaps — 360,682 849,514
Accrued investment advisory fees 275 4,774 —Accrued distribution expense 567 2,222 1,731Accrued expenses and other liabilities 15,400 15,427 31,565
Total Liabilities 286,387 2,178,274 1,190,893
Net Assets $ 2,703,761 $11,133,096 $ 6,295,309
Net Assets Consist Of:Capital stock $ 5,345,038 $11,579,577 $ 9,053,906Accumulated undistributed net investment income (loss) — 1,553,708 17,749Accumulated undistributed net realized gain (loss) (2,716,990) (1,639,507) (1,942,460)Net unrealized appreciation/(depreciation) on:
Investments — — 578Options written — — 15,050Swaps 75,713 (360,682) (849,514)
Total Net Assets $ 2,703,761 $11,133,096 $ 6,295,309
Calculation of Net Asset Value Per Share - Investor Class:Net assets $ 2,703,761 $11,133,096 $ 6,295,309Shares outstanding(unlimited shares of beneficial interest authorized, no par value) 182,998 715,381 748,968Net asset value, redemption price and offering price per share $ 14.77 $ 15.56 $ 8.41
Cost of Investments $ 941,509 $ 6,728,374 $ 3,029,550
The accompanying notes are an integral part of these financial statements.
44 D I REXI O N A NNU A L REPO RT
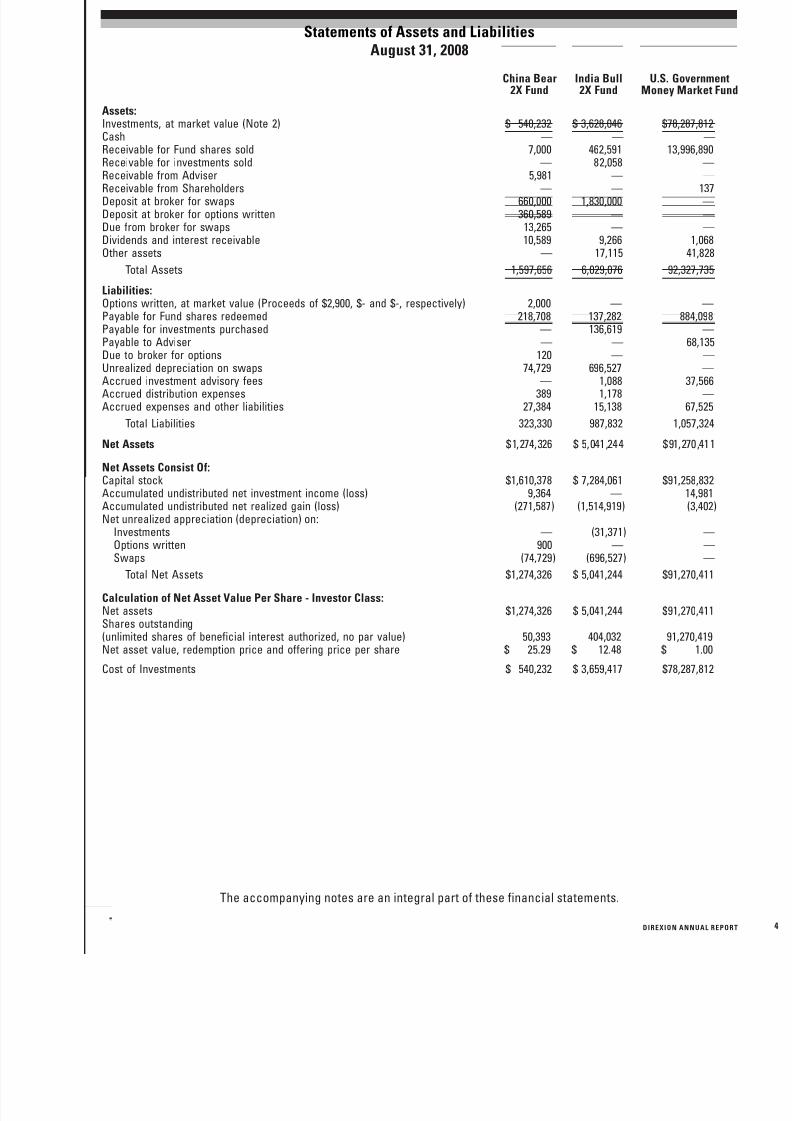
8/14/2019 Direxion Funds Annual Report - 2008
http://slidepdf.com/reader/full/direxion-funds-annual-report-2008 47/87
Statements of Assets and LiabilitiesAugust 31, 2008
China Bear2X Fund
India Bull2X Fund
U.S. GovernmentMoney Market Fund
Assets:Investments, at market value (Note 2) $ 540,232 $ 3,628,046 $78,287,812Cash — — —Receivable for Fund shares sold 7,000 462,591 13,996,890Receivable for investments sold — 82,058 —Receivable from Adviser 5,981 — —
Receivable from Shareholders — — 137Deposit at broker for swaps 660,000 1,830,000 —Deposit at broker for options written 360,589 — —Due from broker for swaps 13,265 — —Dividends and interest receivable 10,589 9,266 1,068Other assets — 17,115 41,828
Total Assets 1,597,656 6,029,076 92,327,735
Liabilities:Options written, at market value (Proceeds of $2,900, $- and $-, respectively) 2,000 — —Payable for Fund shares redeemed 218,708 137,282 884,098Payable for investments purchased — 136,619 —Payable to Adviser — — 68,135Due to broker for options 120 — —Unrealized depreciation on swaps 74,729 696,527 —
Accrued investment advisory fees — 1,088 37,566Accrued distribution expenses 389 1,178 —Accrued expenses and other liabilities 27,384 15,138 67,525
Total Liabilities 323,330 987,832 1,057,324
Net Assets $1,274,326 $ 5,041,244 $91,270,411
Net Assets Consist Of:Capital stock $1,610,378 $ 7,284,061 $91,258,832Accumulated undistributed net investment income (loss) 9,364 — 14,981Accumulated undistributed net realized gain (loss) (271,587) (1,514,919) (3,402)Net unrealized appreciation (depreciation) on:
Investments — (31,371) —Options written 900 — —Swaps (74,729) (696,527) —
Total Net Assets $1,274,326 $ 5,041,244 $91,270,411
Calculation of Net Asset Value Per Share - Investor Class:Net assets $1,274,326 $ 5,041,244 $91,270,411Shares outstanding(unlimited shares of beneficial interest authorized, no par value) 50,393 404,032 91,270,419Net asset value, redemption price and offering price per share $ 25.29 $ 12.48 $ 1.00
Cost of Investments $ 540,232 $ 3,659,417 $78,287,812
The accompanying notes are an integral part of these financial statements.
D I REXI O N A NNU A L REPO RT
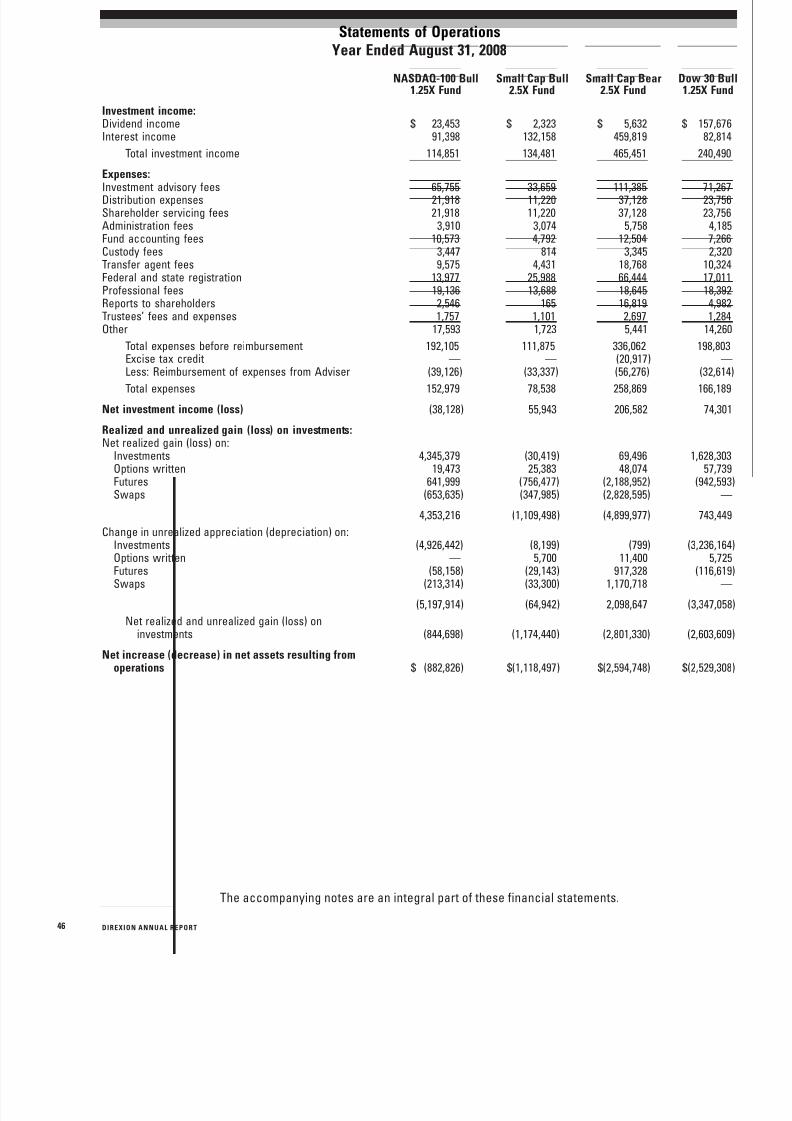
8/14/2019 Direxion Funds Annual Report - 2008
http://slidepdf.com/reader/full/direxion-funds-annual-report-2008 48/87
Statements of OperationsYear Ended August 31, 2008
NASDAQ-100 Bull1.25X Fund
Small Cap Bull2.5X Fund
Small Cap Bear2.5X Fund
Dow 30 Bull1.25X Fund
Investment income:Dividend income $ 23,453 $ 2,323 $ 5,632 $ 157,676Interest income 91,398 132,158 459,819 82,814
Total investment income 114,851 134,481 465,451 240,490
Expenses:
Investment advisory fees 65,755 33,659 111,385 71,267Distribution expenses 21,918 11,220 37,128 23,756Shareholder servicing fees 21,918 11,220 37,128 23,756Administration fees 3,910 3,074 5,758 4,185Fund accounting fees 10,573 4,792 12,504 7,266Custody fees 3,447 814 3,345 2,320Transfer agent fees 9,575 4,431 18,768 10,324Federal and state registration 13,977 25,988 66,444 17,011Professional fees 19,136 13,688 18,645 18,392Reports to shareholders 2,546 165 16,819 4,982Trustees’ fees and expenses 1,757 1,101 2,697 1,284Other 17,593 1,723 5,441 14,260
Total expenses before reimbursement 192,105 111,875 336,062 198,803Excise tax credit — — (20,917) —Less: Reimbursement of expenses from Adviser (39,126) (33,337) (56,276) (32,614)
Total expenses 152,979 78,538 258,869 166,189
Net investment income (loss) (38,128) 55,943 206,582 74,301
Realized and unrealized gain (loss) on investments:Net realized gain (loss) on:
Investments 4,345,379 (30,419) 69,496 1,628,303Options written 19,473 25,383 48,074 57,739Futures 641,999 (756,477) (2,188,952) (942,593)Swaps (653,635) (347,985) (2,828,595) —
4,353,216 (1,109,498) (4,899,977) 743,449
Change in unrealized appreciation (depreciation) on:Investments (4,926,442) (8,199) (799) (3,236,164)Options written — 5,700 11,400 5,725
Futures (58,158) (29,143) 917,328 (116,619)Swaps (213,314) (33,300) 1,170,718 —
(5,197,914) (64,942) 2,098,647 (3,347,058)
Net realized and unrealized gain (loss) oninvestments (844,698) (1,174,440) (2,801,330) (2,603,609)
Net increase (decrease) in net assets resulting fromoperations $ (882,826) $(1,118,497) $(2,594,748) $(2,529,308)
The accompanying notes are an integral part of these financial statements.
46 D I REXI O N A NNU A L REPO RT
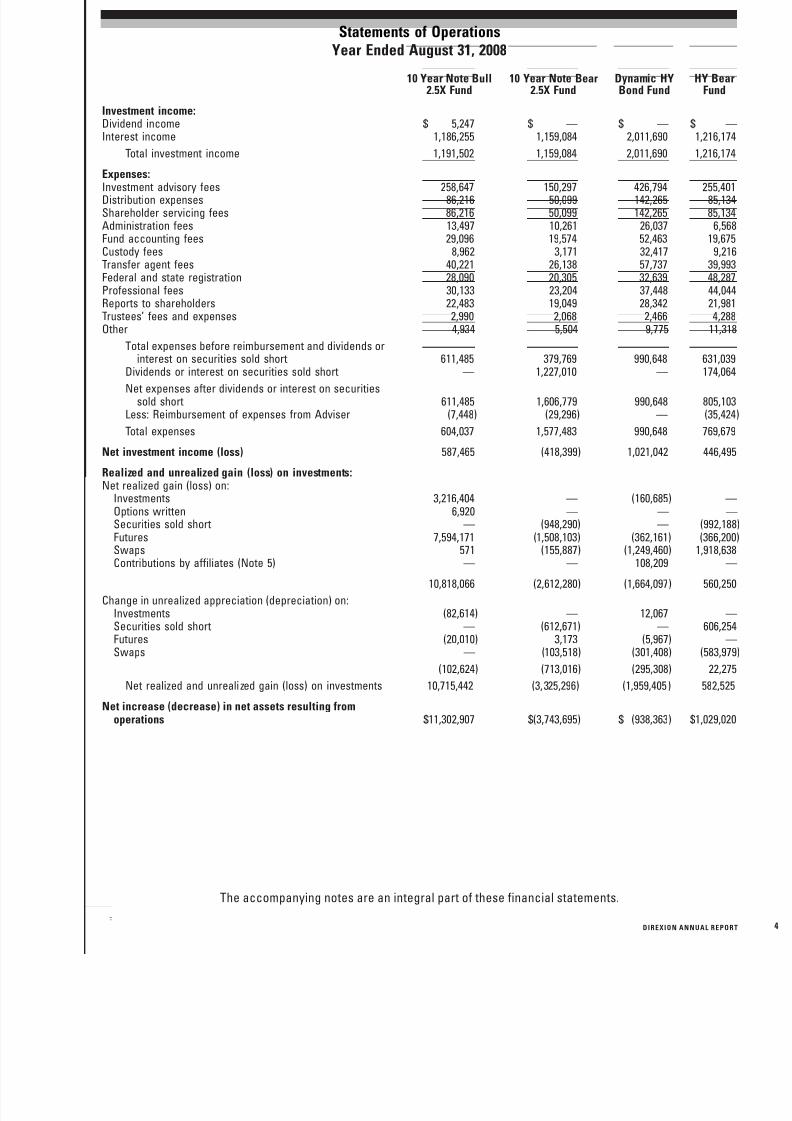
8/14/2019 Direxion Funds Annual Report - 2008
http://slidepdf.com/reader/full/direxion-funds-annual-report-2008 49/87
Statements of OperationsYear Ended August 31, 2008
10 Year Note Bull2.5X Fund
10 Year Note Bear2.5X Fund
Dynamic HYBond Fund
HY BearFund
Investment income:Dividend income $ 5,247 $ — $ — $ —Interest income 1,186,255 1,159,084 2,011,690 1,216,174
Total investment income 1,191,502 1,159,084 2,011,690 1,216,174
Expenses:
Investment advisory fees 258,647 150,297 426,794 255,401Distribution expenses 86,216 50,099 142,265 85,134Shareholder servicing fees 86,216 50,099 142,265 85,134Administration fees 13,497 10,261 26,037 6,568Fund accounting fees 29,096 19,574 52,463 19,675Custody fees 8,962 3,171 32,417 9,216Transfer agent fees 40,221 26,138 57,737 39,993Federal and state registration 28,090 20,305 32,639 48,287Professional fees 30,133 23,204 37,448 44,044Reports to shareholders 22,483 19,049 28,342 21,981Trustees’ fees and expenses 2,990 2,068 2,466 4,288Other 4,934 5,504 9,775 11,318
Total expenses before reimbursement and dividends orinterest on securities sold short 611,485 379,769 990,648 631,039
Dividends or interest on securities sold short — 1,227,010 — 174,064
Net expenses after dividends or interest on securitiessold short 611,485 1,606,779 990,648 805,103
Less: Reimbursement of expenses from Adviser (7,448) (29,296) — (35,424
Total expenses 604,037 1,577,483 990,648 769,679
Net investment income (loss) 587,465 (418,399) 1,021,042 446,495
Realized and unrealized gain (loss) on investments:Net realized gain (loss) on:
Investments 3,216,404 — (160,685) —Options written 6,920 — — —Securities sold short — (948,290) — (992,188Futures 7,594,171 (1,508,103) (362,161) (366,200Swaps 571 (155,887) (1,249,460) 1,918,638Contributions by affiliates (Note 5) — — 108,209 —
10,818,066 (2,612,280) (1,664,097) 560,250
Change in unrealized appreciation (depreciation) on:Investments (82,614) — 12,067 —Securities sold short — (612,671) — 606,254Futures (20,010) 3,173 (5,967) —Swaps — (103,518) (301,408) (583,979
(102,624) (713,016) (295,308) 22,275
Net realized and unrealized gain (loss) on investments 10,715,442 (3,325,296) (1,959,405) 582,525
Net increase (decrease) in net assets resulting fromoperations $11,302,907 $(3,743,695) $ (938,363) $1,029,020
The accompanying notes are an integral part of these financial statements.
D I REXI O N A NNU A L REPO RT
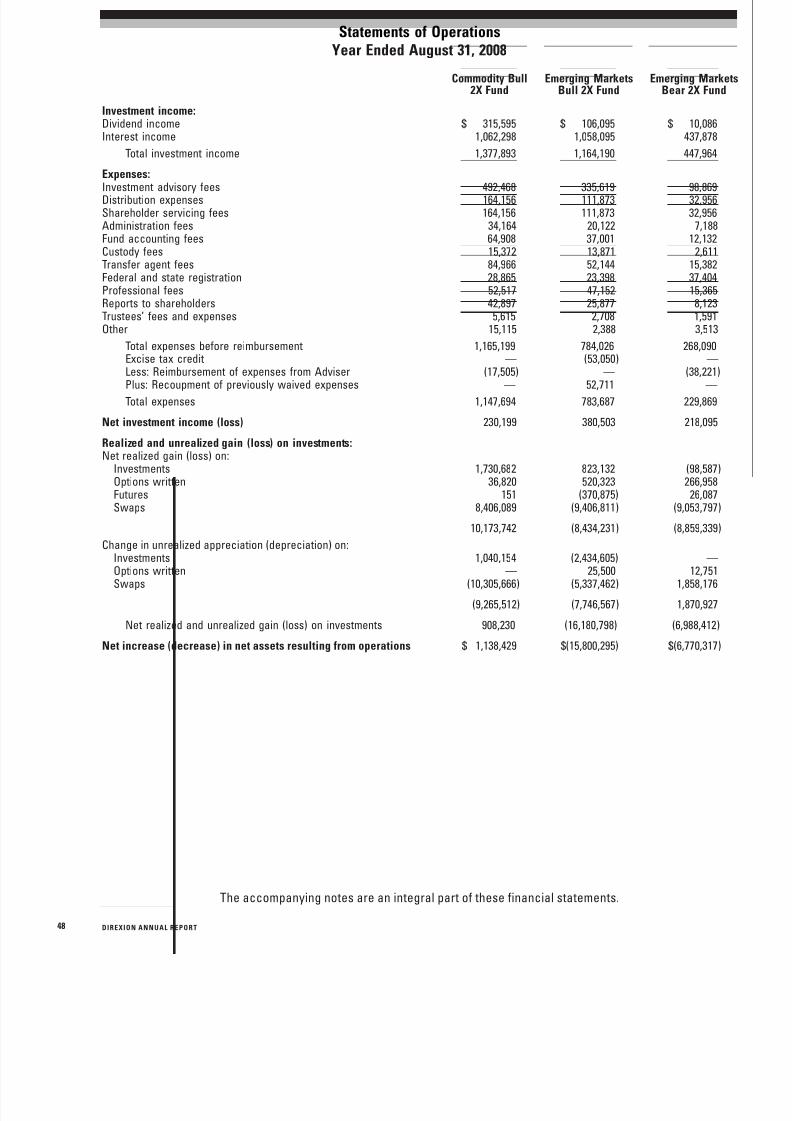
8/14/2019 Direxion Funds Annual Report - 2008
http://slidepdf.com/reader/full/direxion-funds-annual-report-2008 50/87
Statements of OperationsYear Ended August 31, 2008
Commodity Bull2X Fund
Emerging MarketsBull 2X Fund
Emerging MarketsBear 2X Fund
Investment income:Dividend income $ 315,595 $ 106,095 $ 10,086Interest income 1,062,298 1,058,095 437,878
Total investment income 1,377,893 1,164,190 447,964
Expenses:
Investment advisory fees 492,468 335,619 98,869Distribution expenses 164,156 111,873 32,956Shareholder servicing fees 164,156 111,873 32,956Administration fees 34,164 20,122 7,188Fund accounting fees 64,908 37,001 12,132Custody fees 15,372 13,871 2,611Transfer agent fees 84,966 52,144 15,382Federal and state registration 28,865 23,398 37,404Professional fees 52,517 47,152 15,365Reports to shareholders 42,897 25,877 8,123Trustees’ fees and expenses 5,615 2,708 1,591Other 15,115 2,388 3,513
Total expenses before reimbursement 1,165,199 784,026 268,090Excise tax credit — (53,050) —Less: Reimbursement of expenses from Adviser (17,505) — (38,221)
Plus: Recoupment of previously waived expenses — 52,711 —Total expenses 1,147,694 783,687 229,869
Net investment income (loss) 230,199 380,503 218,095
Realized and unrealized gain (loss) on investments:Net realized gain (loss) on:
Investments 1,730,682 823,132 (98,587)Options written 36,820 520,323 266,958Futures 151 (370,875) 26,087Swaps 8,406,089 (9,406,811) (9,053,797)
10,173,742 (8,434,231) (8,859,339)
Change in unrealized appreciation (depreciation) on:Investments 1,040,154 (2,434,605) —
Options written — 25,500 12,751Swaps (10,305,666) (5,337,462) 1,858,176
(9,265,512) (7,746,567) 1,870,927
Net realized and unrealized gain (loss) on investments 908,230 (16,180,798) (6,988,412)
Net increase (decrease) in net assets resulting from operations $ 1,138,429 $(15,800,295) $(6,770,317)
The accompanying notes are an integral part of these financial statements.
48 D I REXI O N A NNU A L REPO RT
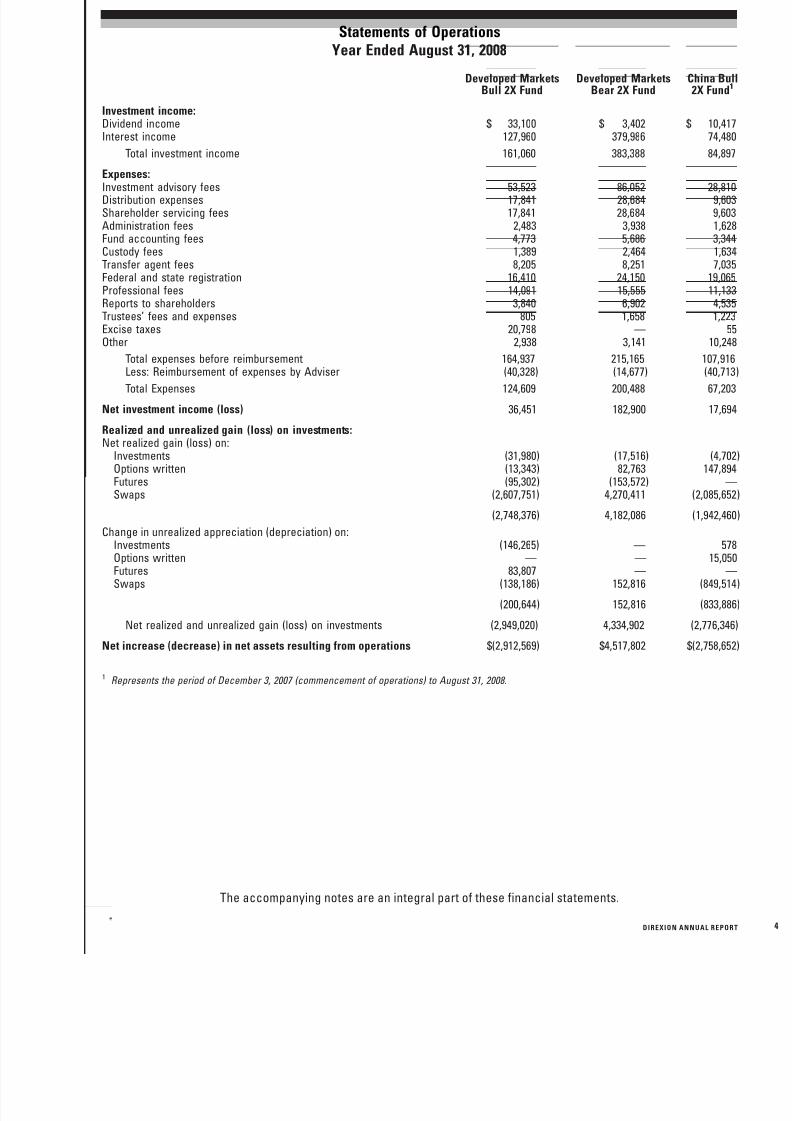
8/14/2019 Direxion Funds Annual Report - 2008
http://slidepdf.com/reader/full/direxion-funds-annual-report-2008 51/87
Statements of OperationsYear Ended August 31, 2008
Developed MarketsBull 2X Fund
Developed MarketsBear 2X Fund
China Bull2X Fund1
Investment income:Dividend income $ 33,100 $ 3,402 $ 10,417Interest income 127,960 379,986 74,480
Total investment income 161,060 383,388 84,897
Expenses:
Investment advisory fees 53,523 86,052 28,810Distribution expenses 17,841 28,684 9,603Shareholder servicing fees 17,841 28,684 9,603Administration fees 2,483 3,938 1,628Fund accounting fees 4,773 5,686 3,344Custody fees 1,389 2,464 1,634Transfer agent fees 8,205 8,251 7,035Federal and state registration 16,410 24,150 19,065Professional fees 14,091 15,555 11,133Reports to shareholders 3,840 6,902 4,535Trustees’ fees and expenses 805 1,658 1,223Excise taxes 20,798 — 55Other 2,938 3,141 10,248
Total expenses before reimbursement 164,937 215,165 107,916Less: Reimbursement of expenses by Adviser (40,328) (14,677) (40,713
Total Expenses 124,609 200,488 67,203
Net investment income (loss) 36,451 182,900 17,694
Realized and unrealized gain (loss) on investments:Net realized gain (loss) on:
Investments (31,980) (17,516) (4,702Options written (13,343) 82,763 147,894Futures (95,302) (153,572) —Swaps (2,607,751) 4,270,411 (2,085,652
(2,748,376) 4,182,086 (1,942,460
Change in unrealized appreciation (depreciation) on:Investments (146,265) — 578Options written — — 15,050
Futures 83,807 — —Swaps (138,186) 152,816 (849,514
(200,644) 152,816 (833,886
Net realized and unrealized gain (loss) on investments (2,949,020) 4,334,902 (2,776,346
Net increase (decrease) in net assets resulting from operations $(2,912,569) $4,517,802 $(2,758,652
1 Represents the period of December 3, 2007 (commencement of operations) to August 31, 2008.
The accompanying notes are an integral part of these financial statements.
D I REXI O N A NNU A L REPO RT
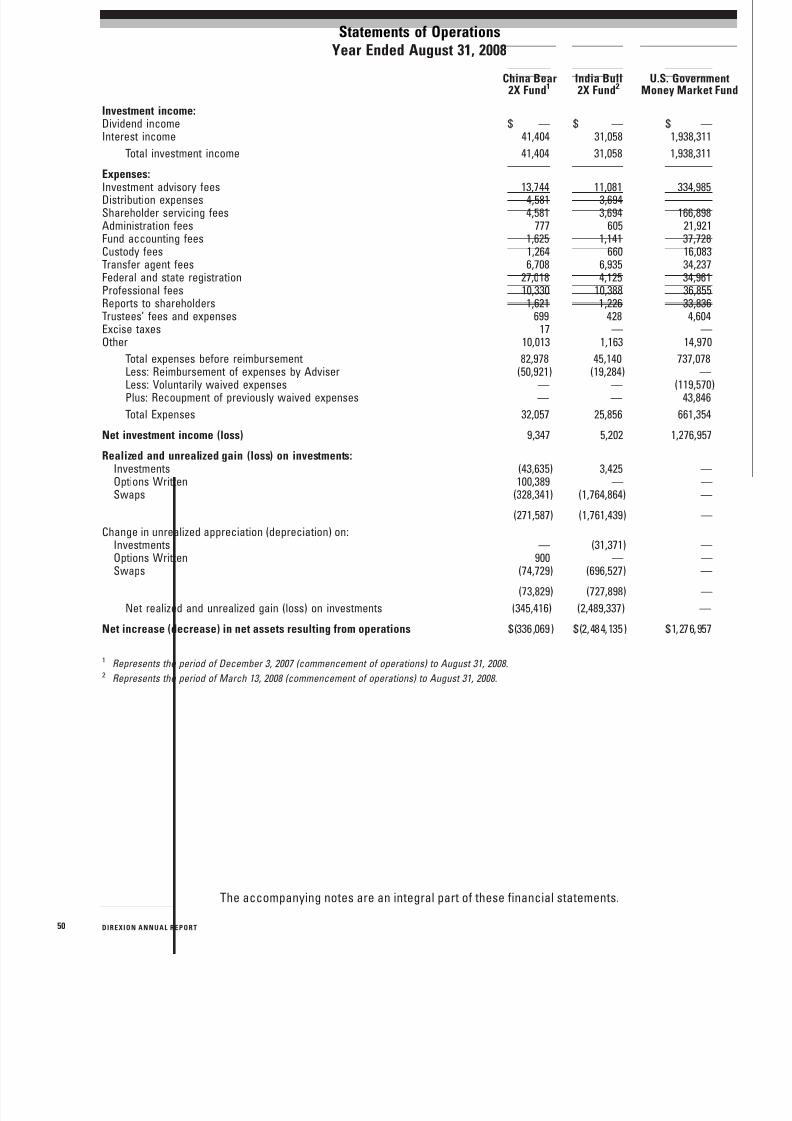
8/14/2019 Direxion Funds Annual Report - 2008
http://slidepdf.com/reader/full/direxion-funds-annual-report-2008 52/87
Statements of OperationsYear Ended August 31, 2008
China Bear2X Fund1
India Bull2X Fund2
U.S. GovernmentMoney Market Fund
Investment income:Dividend income $ — $ — $ —Interest income 41,404 31,058 1,938,311
Total investment income 41,404 31,058 1,938,311
Expenses:
Investment advisory fees 13,744 11,081 334,985Distribution expenses 4,581 3,694 —Shareholder servicing fees 4,581 3,694 166,898Administration fees 777 605 21,921Fund accounting fees 1,625 1,141 37,728Custody fees 1,264 660 16,083Transfer agent fees 6,708 6,935 34,237Federal and state registration 27,018 4,125 34,961Professional fees 10,330 10,388 36,855Reports to shareholders 1,621 1,226 33,836Trustees’ fees and expenses 699 428 4,604Excise taxes 17 — —Other 10,013 1,163 14,970
Total expenses before reimbursement 82,978 45,140 737,078Less: Reimbursement of expenses by Adviser (50,921) (19,284) —
Less: Voluntarily waived expenses — — (119,570)Plus: Recoupment of previously waived expenses — — 43,846
Total Expenses 32,057 25,856 661,354
Net investment income (loss) 9,347 5,202 1,276,957
Realized and unrealized gain (loss) on investments:Investments (43,635) 3,425 —Options Written 100,389 — —Swaps (328,341) (1,764,864) —
(271,587) (1,761,439) —
Change in unrealized appreciation (depreciation) on:Investments — (31,371) —Options Written 900 — —
Swaps (74,729) (696,527) —(73,829) (727,898) —
Net realized and unrealized gain (loss) on investments (345,416) (2,489,337) —
Net increase (decrease) in net assets resulting from operations $(336,069) $(2,484,135) $1,276,957
1 Represents the period of December 3, 2007 (commencement of operations) to August 31, 2008.2 Represents the period of March 13, 2008 (commencement of operations) to August 31, 2008.
The accompanying notes are an integral part of these financial statements.
50 D I REXI O N A NNU A L REPO RT
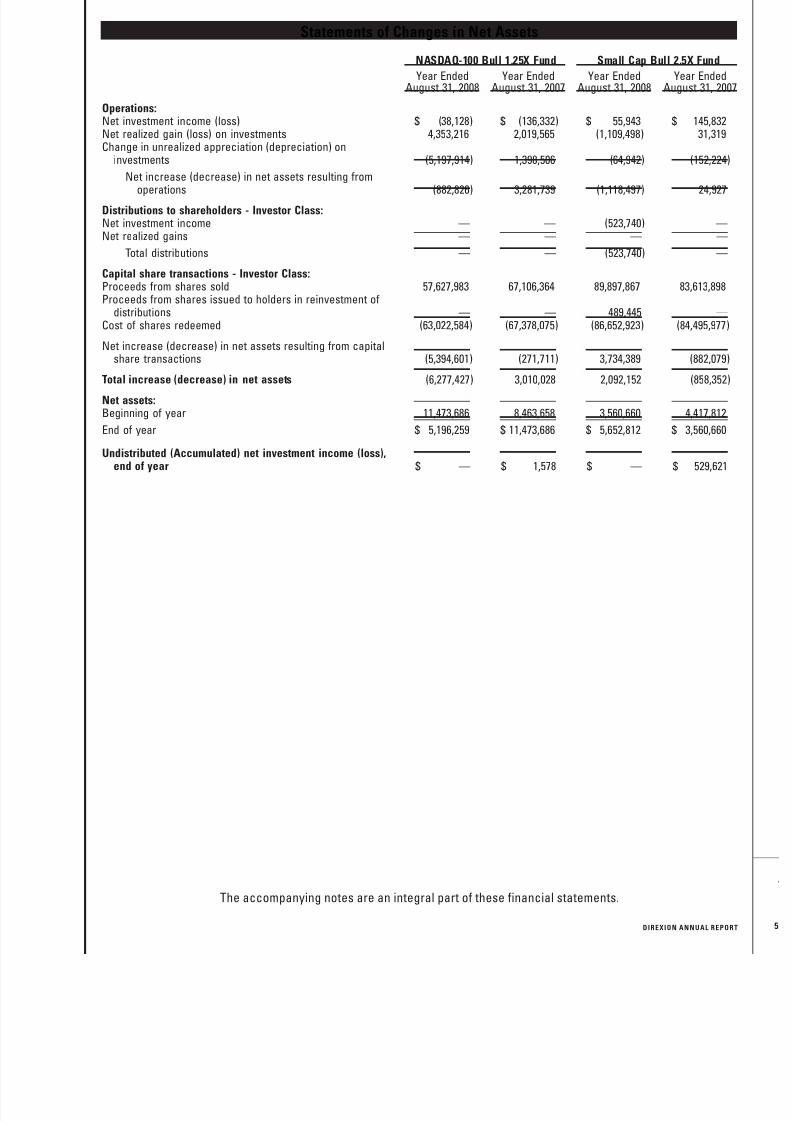
8/14/2019 Direxion Funds Annual Report - 2008
http://slidepdf.com/reader/full/direxion-funds-annual-report-2008 53/87
Statements of Changes in Net Assets
Year EndedAugust 31, 2008
Year EndedAugust 31, 2007
Year EndedAugust 31, 2008
Year EndedAugust 31, 2007
NASDAQ-100 Bull 1.25X Fund Small Cap Bull 2.5X Fund
Operations:Net investment income (loss) $ (38,128) $ (136,332) $ 55,943 $ 145,832Net realized gain (loss) on investments 4,353,216 2,019,565 (1,109,498) 31,319Change in unrealized appreciation (depreciation) on
investments (5,197,914) 1,398,506 (64,942) (152,224)
Net increase (decrease) in net assets resulting from
operations (882,826) 3,281,739 (1,118,497) 24,927Distributions to shareholders - Investor Class:Net investment income — — (523,740) —Net realized gains — — — —
Total distributions — — (523,740) —
Capital share transactions - Investor Class:Proceeds from shares sold 57,627,983 67,106,364 89,897,867 83,613,898Proceeds from shares issued to holders in reinvestment of
distributions — — 489,445 —Cost of shares redeemed (63,022,584) (67,378,075) (86,652,923) (84,495,977)
Net increase (decrease) in net assets resulting from capitalshare transactions (5,394,601) (271,711) 3,734,389 (882,079)
Total increase (decrease) in net assets (6,277,427) 3,010,028 2,092,152 (858,352)Net assets:Beginning of year 11,473,686 8,463,658 3,560,660 4,417,812
End of year $ 5,196,259 $ 11,473,686 $ 5,652,812 $ 3,560,660
Undistributed (Accumulated) net investment income (loss),end of year $ — $ 1,578 $ — $ 529,621
The accompanying notes are an integral part of these financial statements.
D I REXI O N A NNU A L REPO RT
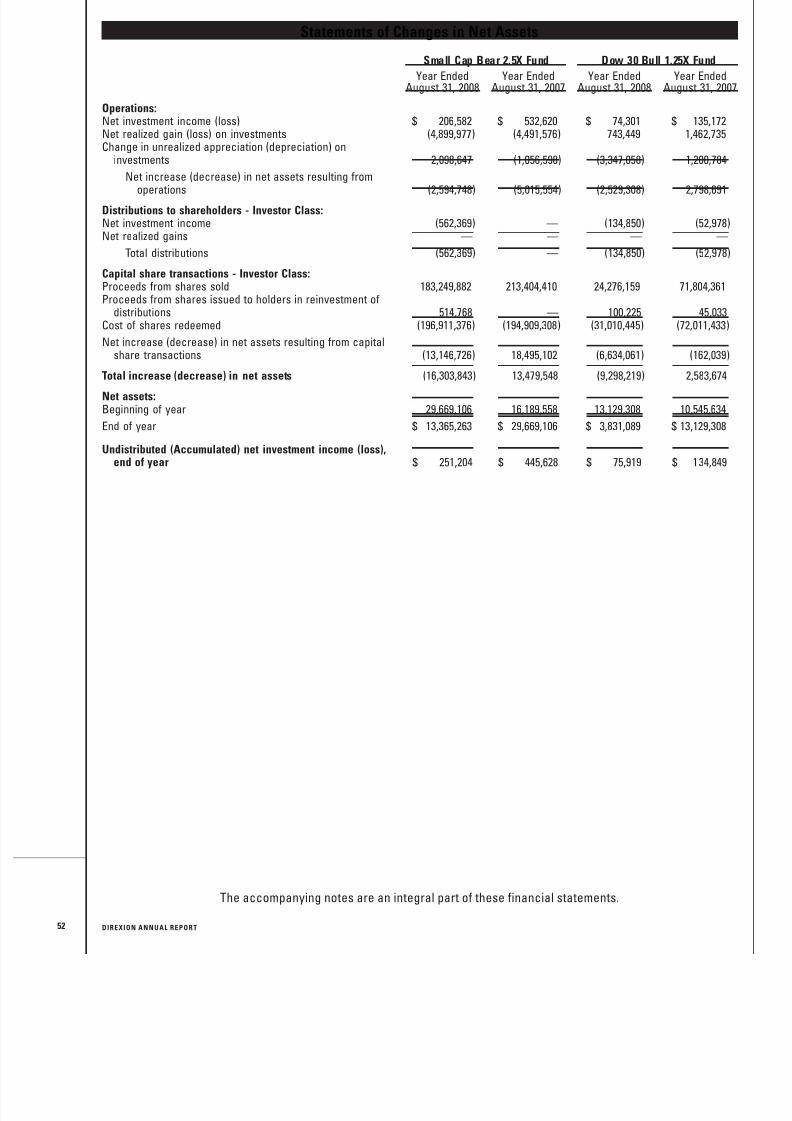
8/14/2019 Direxion Funds Annual Report - 2008
http://slidepdf.com/reader/full/direxion-funds-annual-report-2008 54/87
Statements of Changes in Net Assets
Year EndedAugust 31, 2008
Year EndedAugust 31, 2007
Year EndedAugust 31, 2008
Year EndedAugust 31, 2007
Small Cap Bear 2.5X Fund Dow 30 Bull 1.25X Fund
Operations:Net investment income (loss) $ 206,582 $ 532,620 $ 74,301 $ 135,172Net realized gain (loss) on investments (4,899,977) (4,491,576) 743,449 1,462,735Change in unrealized appreciation (depreciation) on
investments 2,098,647 (1,056,598) (3,347,058) 1,200,784
Net increase (decrease) in net assets resulting from
operations (2,594,748) (5,015,554) (2,529,308) 2,798,691Distributions to shareholders - Investor Class:Net investment income (562,369) — (134,850) (52,978)Net realized gains — — — —
Total distributions (562,369) — (134,850) (52,978)
Capital share transactions - Investor Class:Proceeds from shares sold 183,249,882 213,404,410 24,276,159 71,804,361Proceeds from shares issued to holders in reinvestment of
distributions 514,768 — 100,225 45,033Cost of shares redeemed (196,911,376) (194,909,308) (31,010,445) (72,011,433)
Net increase (decrease) in net assets resulting from capitalshare transactions (13,146,726) 18,495,102 (6,634,061) (162,039)
Total increase (decrease) in net assets (16,303,843) 13,479,548 (9,298,219) 2,583,674
Net assets:Beginning of year 29,669,106 16,189,558 13,129,308 10,545,634
End of year $ 13,365,263 $ 29,669,106 $ 3,831,089 $ 13,129,308
Undistributed (Accumulated) net investment income (loss),end of year $ 251,204 $ 445,628 $ 75,919 $ 134,849
The accompanying notes are an integral part of these financial statements.
52 D I REXI O N A NNU A L REPO RT
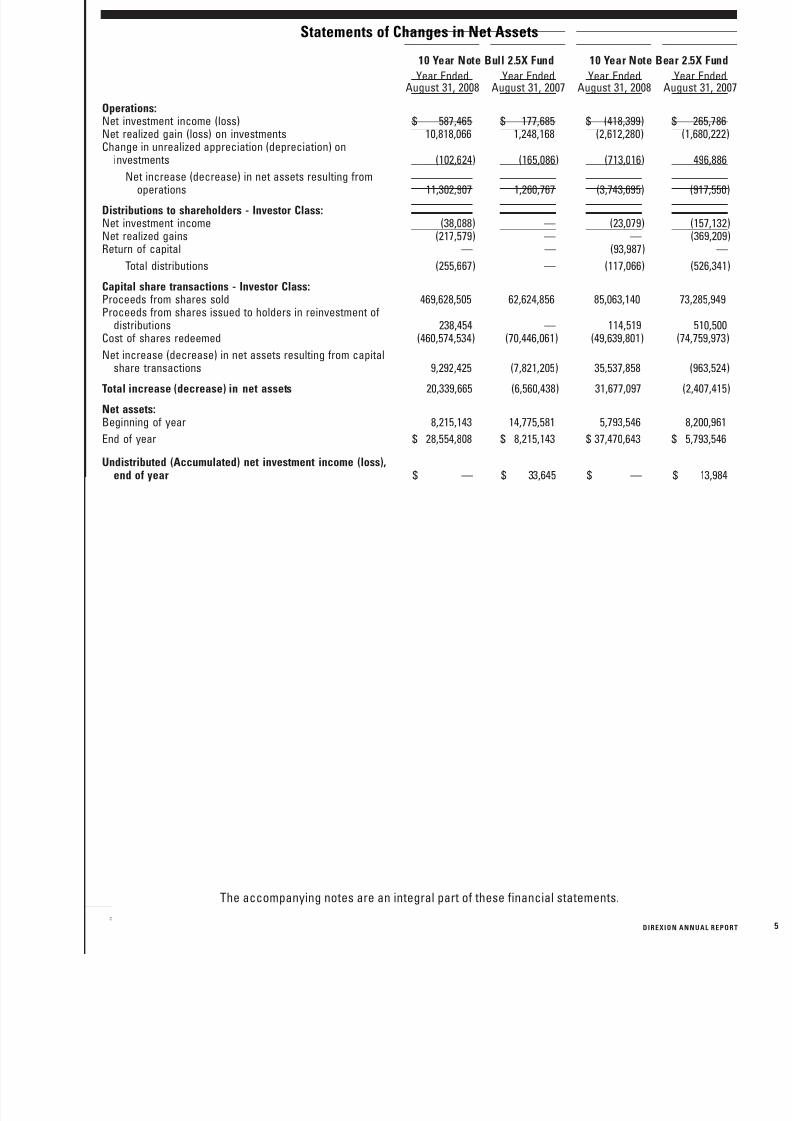
8/14/2019 Direxion Funds Annual Report - 2008
http://slidepdf.com/reader/full/direxion-funds-annual-report-2008 55/87
Statements of Changes in Net Assets
Year EndedAugust 31, 2008
Year EndedAugust 31, 2007
Year EndedAugust 31, 2008
Year EndedAugust 31, 2007
10 Year Note Bull 2.5X Fund 10 Year Note Bear 2.5X Fund
Operations:Net investment income (loss) $ 587,465 $ 177,685 $ (418,399) $ 265,786Net realized gain (loss) on investments 10,818,066 1,248,168 (2,612,280) (1,680,222)Change in unrealized appreciation (depreciation) on
investments (102,624) (165,086) (713,016) 496,886
Net increase (decrease) in net assets resulting from
operations 11,302,907 1,260,767 (3,743,695) (917,550)Distributions to shareholders - Investor Class:Net investment income (38,088) — (23,079) (157,132)Net realized gains (217,579) — — (369,209)Return of capital — — (93,987) —
Total distributions (255,667) — (117,066) (526,341)
Capital share transactions - Investor Class:Proceeds from shares sold 469,628,505 62,624,856 85,063,140 73,285,949Proceeds from shares issued to holders in reinvestment of
distributions 238,454 — 114,519 510,500Cost of shares redeemed (460,574,534) (70,446,061) (49,639,801) (74,759,973)
Net increase (decrease) in net assets resulting from capitalshare transactions 9,292,425 (7,821,205) 35,537,858 (963,524)
Total increase (decrease) in net assets 20,339,665 (6,560,438) 31,677,097 (2,407,415)
Net assets:Beginning of year 8,215,143 14,775,581 5,793,546 8,200,961
End of year $ 28,554,808 $ 8,215,143 $ 37,470,643 $ 5,793,546
Undistributed (Accumulated) net investment income (loss),end of year $ — $ 33,645 $ — $ 13,984
The accompanying notes are an integral part of these financial statements.
D I REXI O N A NNU A L REPO RT
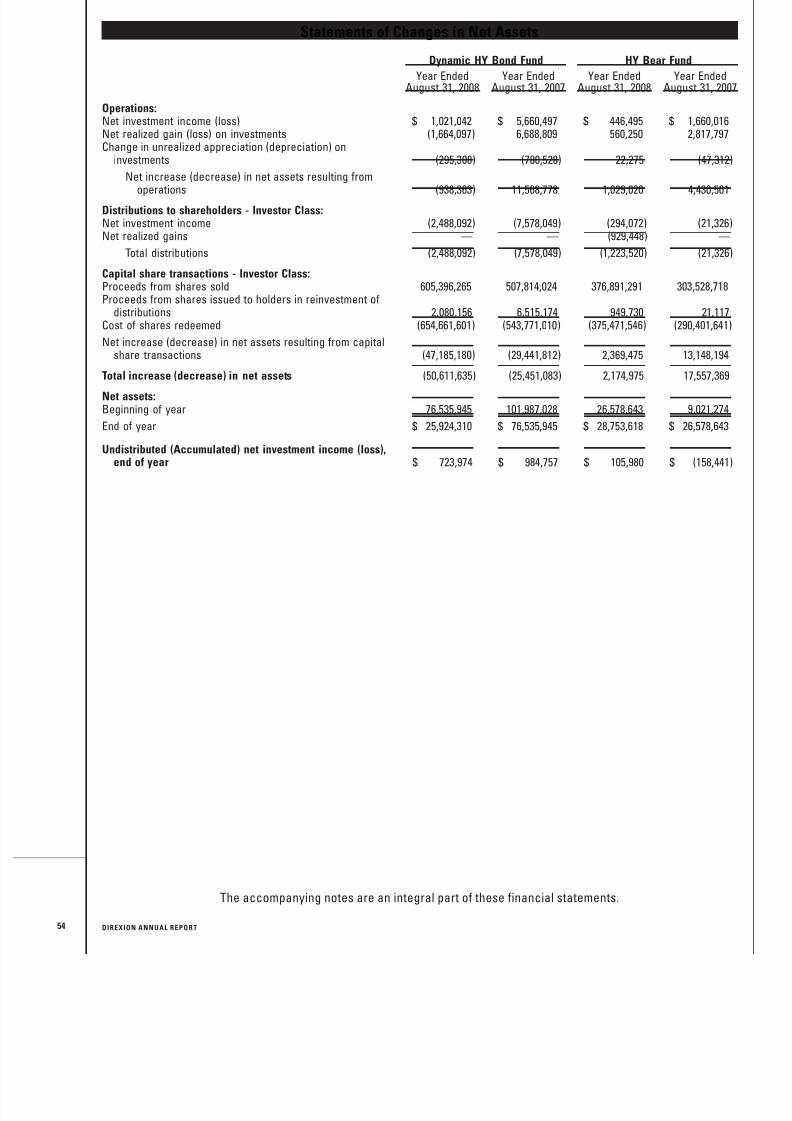
8/14/2019 Direxion Funds Annual Report - 2008
http://slidepdf.com/reader/full/direxion-funds-annual-report-2008 56/87
Statements of Changes in Net Assets
Year EndedAugust 31, 2008
Year EndedAugust 31, 2007
Year EndedAugust 31, 2008
Year EndedAugust 31, 2007
Dynamic HY Bond Fund HY Bear Fund
Operations:Net investment income (loss) $ 1,021,042 $ 5,660,497 $ 446,495 $ 1,660,016Net realized gain (loss) on investments (1,664,097) 6,688,809 560,250 2,817,797Change in unrealized appreciation (depreciation) on
investments (295,308) (780,528) 22,275 (47,312)
Net increase (decrease) in net assets resulting from
operations (938,363) 11,568,778 1,029,020 4,430,501Distributions to shareholders - Investor Class:Net investment income (2,488,092) (7,578,049) (294,072) (21,326)Net realized gains — — (929,448) —
Total distributions (2,488,092) (7,578,049) (1,223,520) (21,326)
Capital share transactions - Investor Class:Proceeds from shares sold 605,396,265 507,814,024 376,891,291 303,528,718Proceeds from shares issued to holders in reinvestment of
distributions 2,080,156 6,515,174 949,730 21,117Cost of shares redeemed (654,661,601) (543,771,010) (375,471,546) (290,401,641)
Net increase (decrease) in net assets resulting from capitalshare transactions (47,185,180) (29,441,812) 2,369,475 13,148,194
Total increase (decrease) in net assets (50,611,635) (25,451,083) 2,174,975 17,557,369
Net assets:Beginning of year 76,535,945 101,987,028 26,578,643 9,021,274
End of year $ 25,924,310 $ 76,535,945 $ 28,753,618 $ 26,578,643
Undistributed (Accumulated) net investment income (loss),end of year $ 723,974 $ 984,757 $ 105,980 $ (158,441)
The accompanying notes are an integral part of these financial statements.
54 D I REXI O N A NNU A L REPO RT
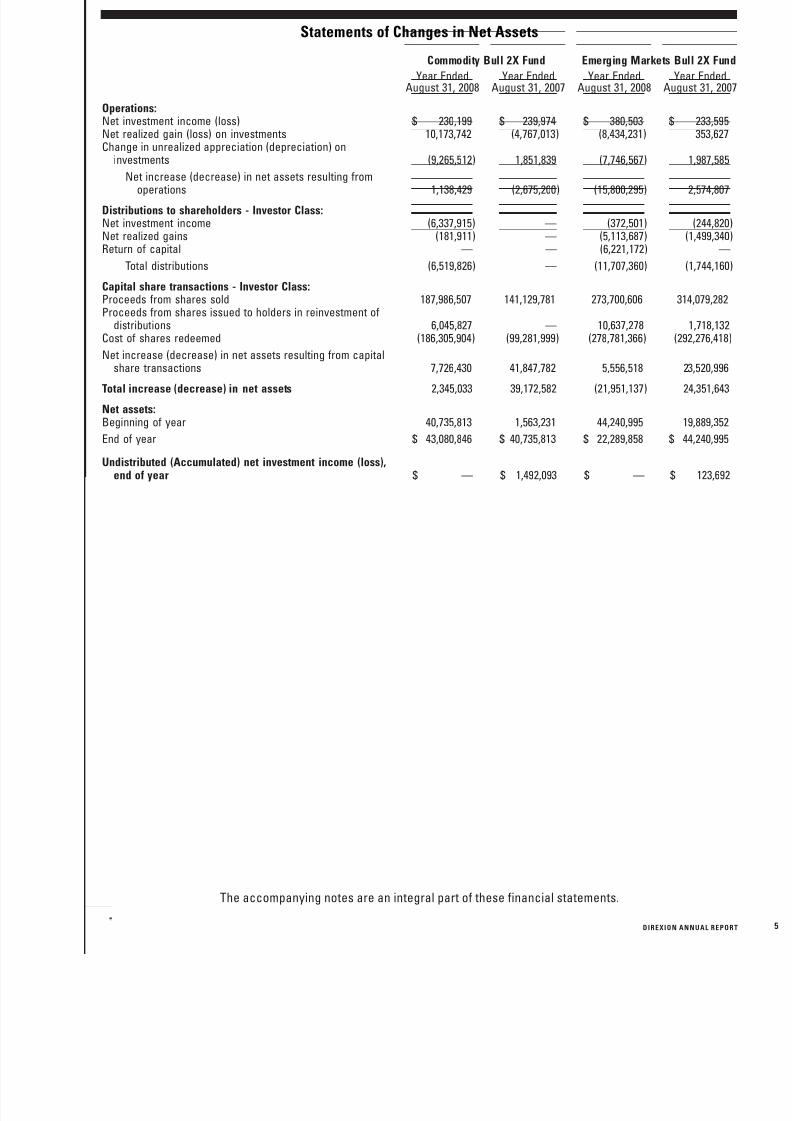
8/14/2019 Direxion Funds Annual Report - 2008
http://slidepdf.com/reader/full/direxion-funds-annual-report-2008 57/87
Statements of Changes in Net Assets
Year EndedAugust 31, 2008
Year EndedAugust 31, 2007
Year EndedAugust 31, 2008
Year EndedAugust 31, 2007
Commodity Bull 2X Fund Emerging Markets Bull 2X Fund
Operations:Net investment income (loss) $ 230,199 $ 239,974 $ 380,503 $ 233,595Net realized gain (loss) on investments 10,173,742 (4,767,013) (8,434,231) 353,627Change in unrealized appreciation (depreciation) on
investments (9,265,512) 1,851,839 (7,746,567) 1,987,585
Net increase (decrease) in net assets resulting from
operations 1,138,429 (2,675,200) (15,800,295) 2,574,807Distributions to shareholders - Investor Class:Net investment income (6,337,915) — (372,501) (244,820)Net realized gains (181,911) — (5,113,687) (1,499,340)Return of capital — — (6,221,172) —
Total distributions (6,519,826) — (11,707,360) (1,744,160)
Capital share transactions - Investor Class:Proceeds from shares sold 187,986,507 141,129,781 273,700,606 314,079,282Proceeds from shares issued to holders in reinvestment of
distributions 6,045,827 — 10,637,278 1,718,132Cost of shares redeemed (186,305,904) (99,281,999) (278,781,366) (292,276,418)
Net increase (decrease) in net assets resulting from capitalshare transactions 7,726,430 41,847,782 5,556,518 23,520,996
Total increase (decrease) in net assets 2,345,033 39,172,582 (21,951,137) 24,351,643
Net assets:Beginning of year 40,735,813 1,563,231 44,240,995 19,889,352
End of year $ 43,080,846 $ 40,735,813 $ 22,289,858 $ 44,240,995
Undistributed (Accumulated) net investment income (loss),end of year $ — $ 1,492,093 $ — $ 123,692
The accompanying notes are an integral part of these financial statements.
D I REXI O N A NNU A L REPO RT
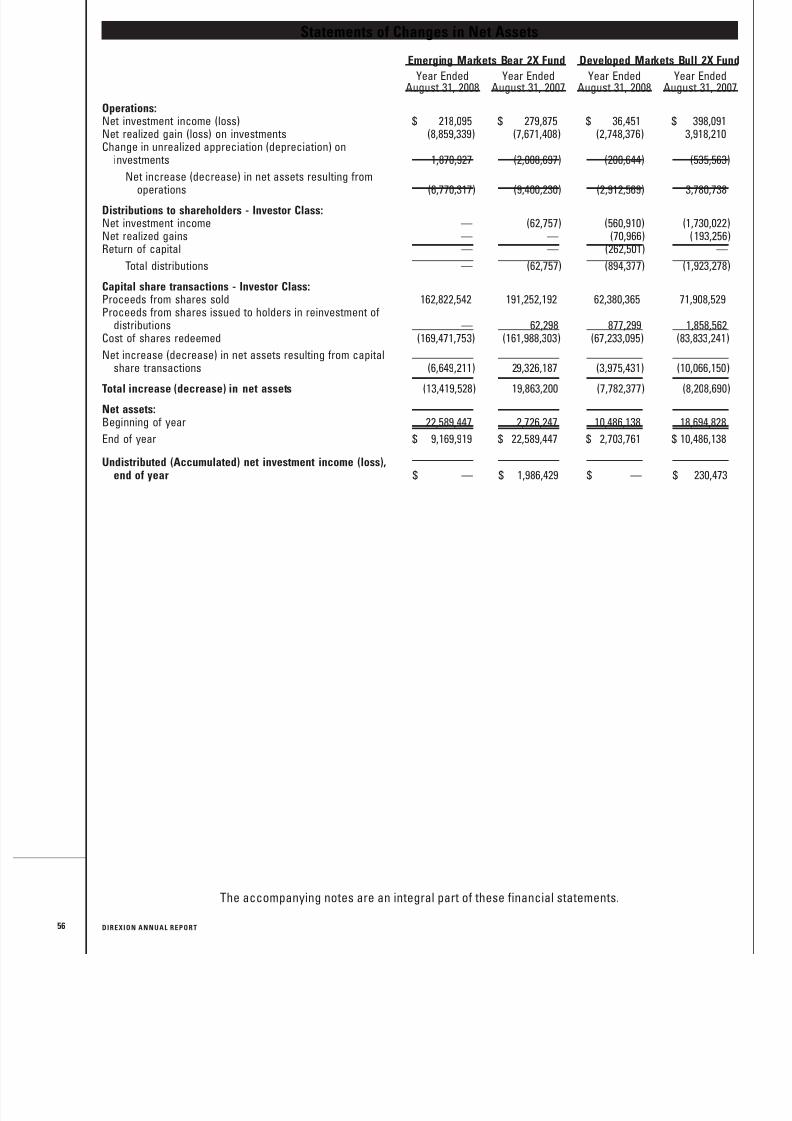
8/14/2019 Direxion Funds Annual Report - 2008
http://slidepdf.com/reader/full/direxion-funds-annual-report-2008 58/87
Statements of Changes in Net Assets
Year EndedAugust 31, 2008
Year EndedAugust 31, 2007
Year EndedAugust 31, 2008
Year EndedAugust 31, 2007
Emerging Markets Bear 2X Fund Developed Markets Bull 2X Fund
Operations:Net investment income (loss) $ 218,095 $ 279,875 $ 36,451 $ 398,091Net realized gain (loss) on investments (8,859,339) (7,671,408) (2,748,376) 3,918,210Change in unrealized appreciation (depreciation) on
investments 1,870,927 (2,008,697) (200,644) (535,563)
Net increase (decrease) in net assets resulting from
operations (6,770,317) (9,400,230) (2,912,569) 3,780,738Distributions to shareholders - Investor Class:Net investment income — (62,757) (560,910) (1,730,022)Net realized gains — — (70,966) (193,256)Return of capital — — (262,501) —
Total distributions — (62,757) (894,377) (1,923,278)
Capital share transactions - Investor Class:Proceeds from shares sold 162,822,542 191,252,192 62,380,365 71,908,529Proceeds from shares issued to holders in reinvestment of
distributions — 62,298 877,299 1,858,562Cost of shares redeemed (169,471,753) (161,988,303) (67,233,095) (83,833,241)
Net increase (decrease) in net assets resulting from capitalshare transactions (6,649,211) 29,326,187 (3,975,431) (10,066,150)
Total increase (decrease) in net assets (13,419,528) 19,863,200 (7,782,377) (8,208,690)
Net assets:Beginning of year 22,589,447 2,726,247 10,486,138 18,694,828
End of year $ 9,169,919 $ 22,589,447 $ 2,703,761 $ 10,486,138
Undistributed (Accumulated) net investment income (loss),end of year $ — $ 1,986,429 $ — $ 230,473
The accompanying notes are an integral part of these financial statements.
56 D I REXI O N A NNU A L REPO RT
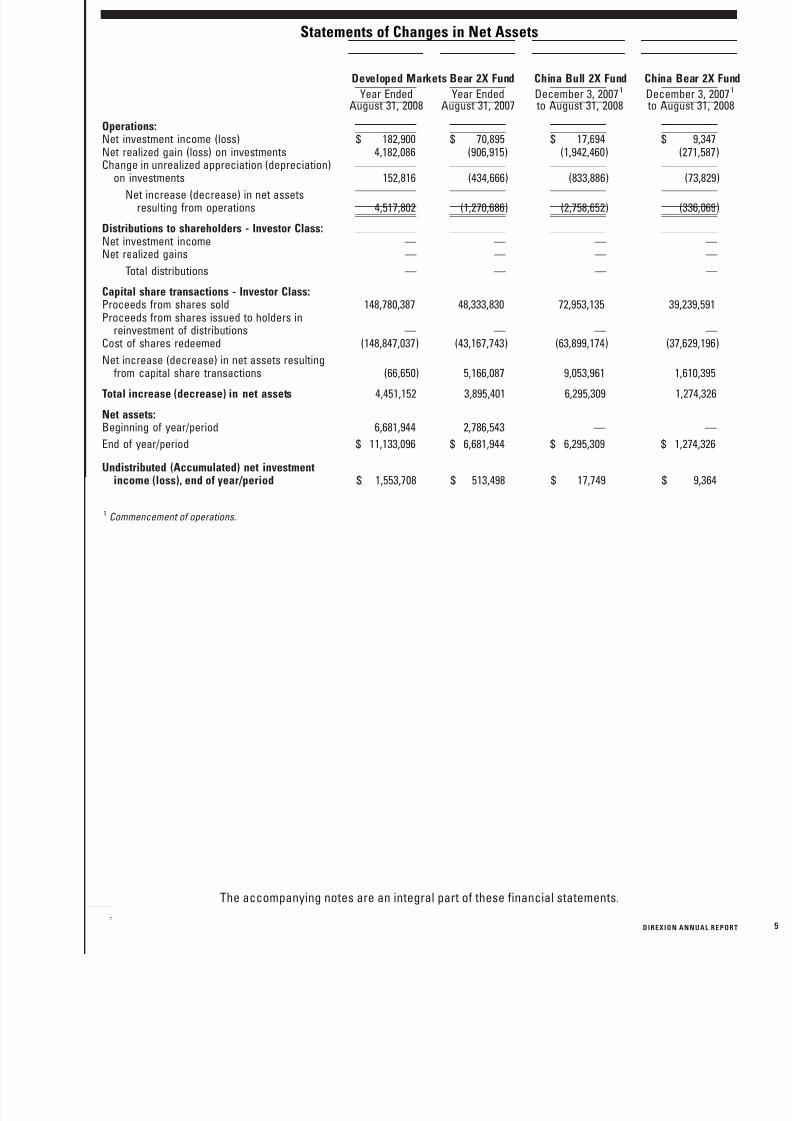
8/14/2019 Direxion Funds Annual Report - 2008
http://slidepdf.com/reader/full/direxion-funds-annual-report-2008 59/87
Statements of Changes in Net Assets
Year EndedAugust 31, 2008
Year EndedAugust 31, 2007
December 3, 20071
to August 31, 2008December 3, 20071
to August 31, 2008
Developed Markets Bear 2X Fund China Bull 2X Fund China Bear 2X Fund
Operations:Net investment income (loss) $ 182,900 $ 70,895 $ 17,694 $ 9,347Net realized gain (loss) on investments 4,182,086 (906,915) (1,942,460) (271,587)Change in unrealized appreciation (depreciation)
on investments 152,816 (434,666) (833,886) (73,829)
Net increase (decrease) in net assetsresulting from operations 4,517,802 (1,270,686) (2,758,652) (336,069)
Distributions to shareholders - Investor Class:Net investment income — — — —Net realized gains — — — —
Total distributions — — — —
Capital share transactions - Investor Class:Proceeds from shares sold 148,780,387 48,333,830 72,953,135 39,239,591Proceeds from shares issued to holders in
reinvestment of distributions — — — —Cost of shares redeemed (148,847,037) (43,167,743) (63,899,174) (37,629,196)
Net increase (decrease) in net assets resultingfrom capital share transactions (66,650) 5,166,087 9,053,961 1,610,395
Total increase (decrease) in net assets 4,451,152 3,895,401 6,295,309 1,274,326
Net assets:Beginning of year/period 6,681,944 2,786,543 — —
End of year/period $ 11,133,096 $ 6,681,944 $ 6,295,309 $ 1,274,326
Undistributed (Accumulated) net investmentincome (loss), end of year/period $ 1,553,708 $ 513,498 $ 17,749 $ 9,364
1 Commencement of operations.
The accompanying notes are an integral part of these financial statements.
D I REXI O N A NNU A L REPO RT
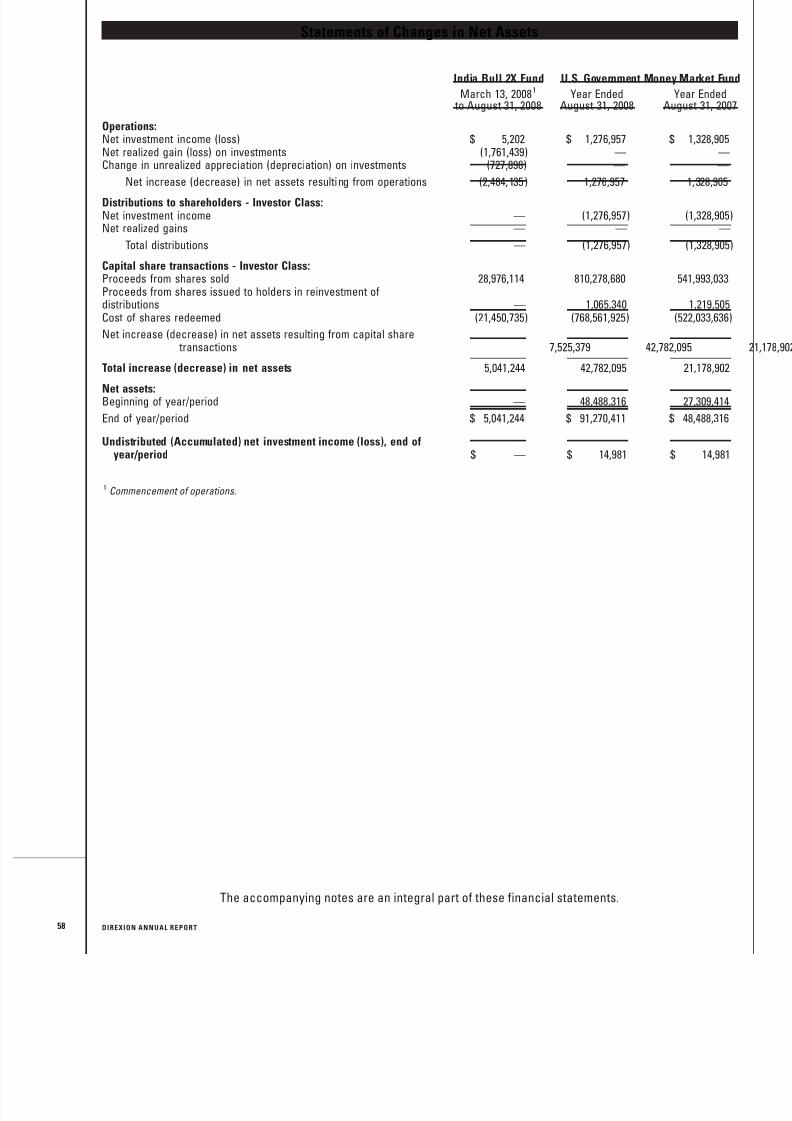
8/14/2019 Direxion Funds Annual Report - 2008
http://slidepdf.com/reader/full/direxion-funds-annual-report-2008 60/87
Statements of Changes in Net Assets
March 13, 20081
to August 31, 2008Year Ended
August 31, 2008Year Ended
August 31, 2007
India Bull 2X Fund U.S. Government Money Market Fund
Operations:Net investment income (loss) $ 5,202 $ 1,276,957 $ 1,328,905Net realized gain (loss) on investments (1,761,439) — —Change in unrealized appreciation (depreciation) on investments (727,898) — —
Net increase (decrease) in net assets resulting from operations (2,484,135) 1,276,957 1,328,905
Distributions to shareholders - Investor Class:Net investment income — (1,276,957) (1,328,905)Net realized gains — — —
Total distributions — (1,276,957) (1,328,905)
Capital share transactions - Investor Class:Proceeds from shares sold 28,976,114 810,278,680 541,993,033Proceeds from shares issued to holders in reinvestment ofdistributions — 1,065,340 1,219,505Cost of shares redeemed (21,450,735) (768,561,925) (522,033,636)
Net increase (decrease) in net assets resulting from capital share transactions 7,525,379 42,782,095
Total increase (decrease) in net assets 5,041,244 42,782,095 21,178,902
Net assets:Beginning of year/period — 48,488,316 27,309,414
End of year/period $ 5,041,244 $ 91,270,411 $ 48,488,316
Undistributed (Accumulated) net investment income (loss), end ofyear/period $ — $ 14,981 $ 14,981
1 Commencement of operations.
The accompanying notes are an integral part of these financial statements.
58 D I REXI O N A NNU A L REPO RT
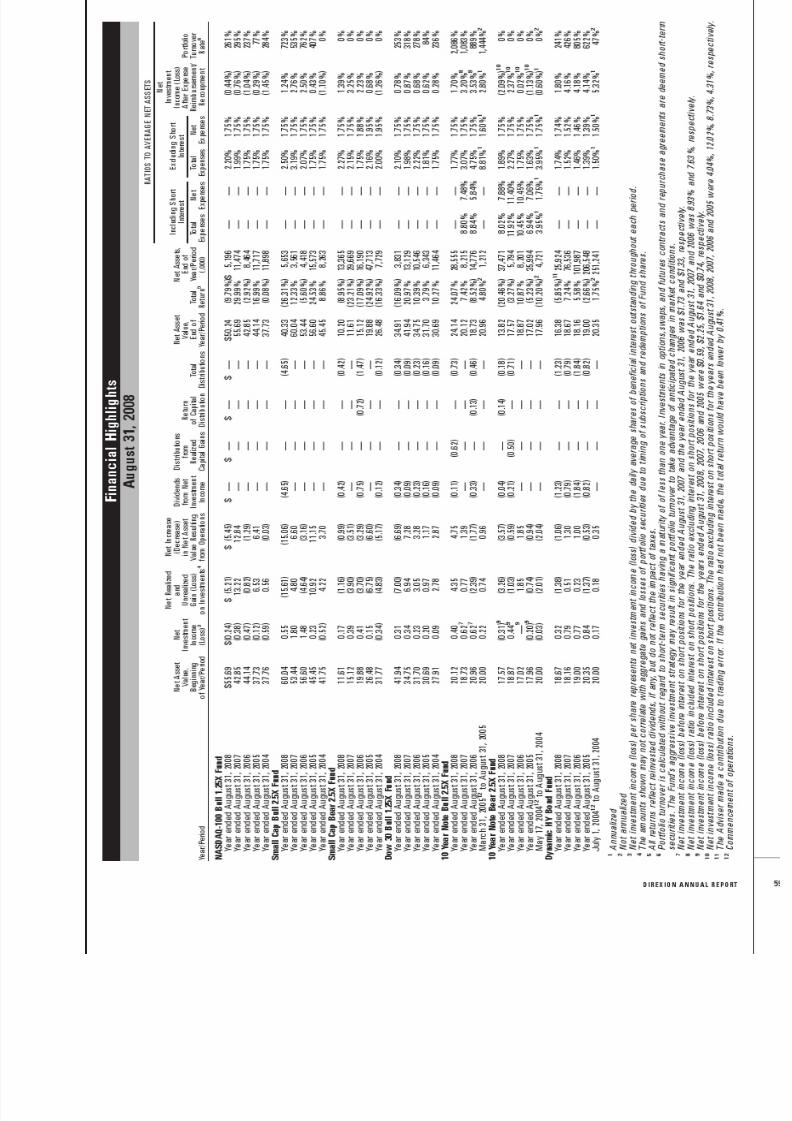
8/14/2019 Direxion Funds Annual Report - 2008
http://slidepdf.com/reader/full/direxion-funds-annual-report-2008 61/87
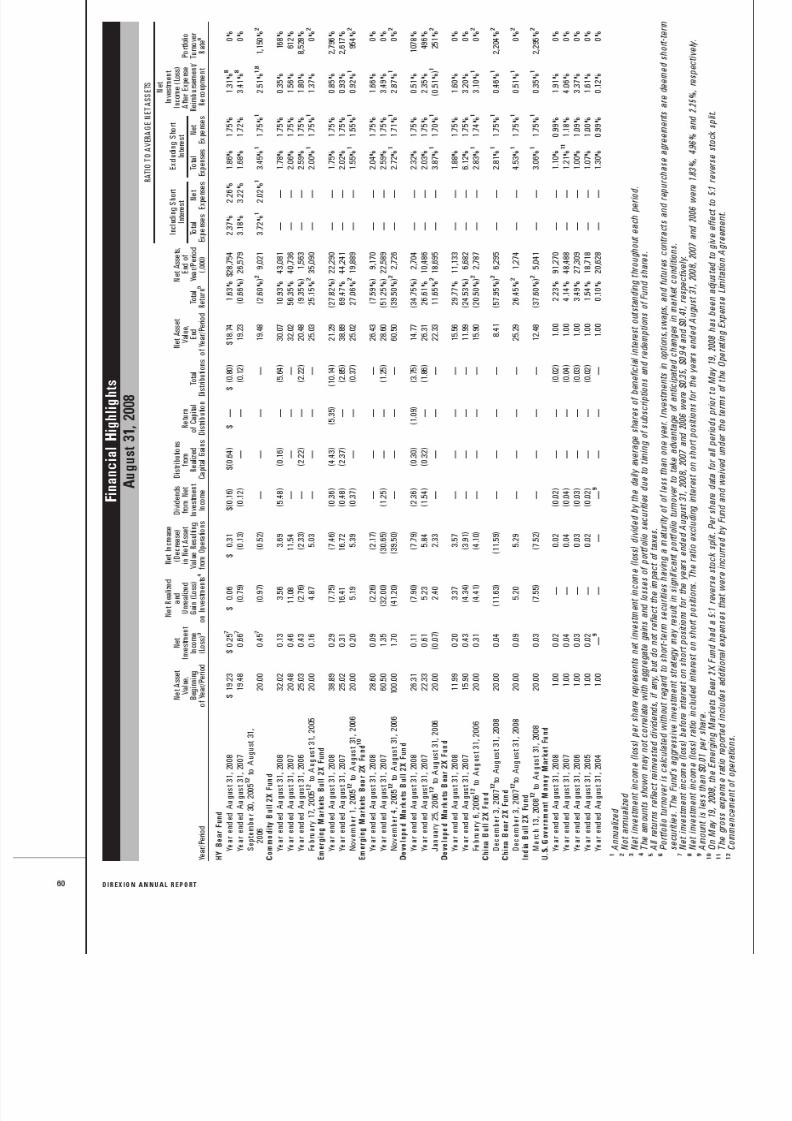
8/14/2019 Direxion Funds Annual Report - 2008
http://slidepdf.com/reader/full/direxion-funds-annual-report-2008 62/87
8/14/2019 Direxion Funds Annual Report - 2008
http://slidepdf.com/reader/full/direxion-funds-annual-report-2008 63/87
Direxion FundsNOTES TO THE FINANCIAL STATEMENTS
August 31, 2008
1. ORGANIZATION
Direxion Funds (the “Trust”) was organized as a Massachusetts Business Trust on June 6, 1997 and is registered under the
Investment Company Act of 1940, as amended (the “1940 Act”), as an open-end management investment company issuing its
shares in series, each series representing a distinct portfolio with its own investment objective and policies. The trust
currently has 40 series of which 17 are included in this report, NASDAQ-100 Bull 1.25X Fund, Small Cap Bull 2.5X, Small Cap
Bear 2.5X, Dow 30 Bull 1.25X Fund, 10 Year Note Bear 2.5X Fund, 10 Year Note Bull 2.5X Fund, Dynamic HY Bond Fund, HY BearFund, Commodity Bull 2X Fund, Emerging Markets Bull 2X Fund, Emerging Markets Bear 2X Fund, Developed Markets Bull 2X
Fund, Developed Markets Bear 2X Fund, China Bull 2X Fund, China Bear 2X Fund, India Bull 2X Fund and the U.S. Government
Money Market Fund (each a “Fund” and collectively, the “Funds”). Each Fund (other than the U.S. Government Money
Market Fund) is a non-diversified series of the Trust pursuant to the 1940 Act. The China Bull 2X Fund and China Bear 2X Fund
commenced operations on December 3, 2007. The India Bull 2X Fund commenced operations on March 13, 2008. The 17
Funds included in this report offer only Investor Class of shares.
The objective of the NASDAQ-100 Bull 1.25X Fund is to provide daily investment returns that correspond to 125% of the
performance of the NASDAQ-100 IndexTM (“NASDAQ Index”). The objective of the Small Cap Bull 2.5X Fund is to provide
daily investment returns that correspond to 250% of the performance of the Russell 2000» Index (Russell 2000 Index”). The
objective of the Small Cap Bear 2.5X Fund is to provide daily investment returns that inversely correspond (or opposite) to250% of the performance of the Russell 2000 Index. The objective of the Dow 30 Bull 1.25X Fund is to provide daily investment
returns that correspond to 125% of the performance of the Dow Jones Industrial AverageSM (“Dow”). The objective of the 10
Year Note Bear 2.5X Fund is to provide investment returns that inversely correspond (or opposite) to 250% of the daily price
movement of the benchmark 10-year U.S. Treasury Note. The objective of the 10 Year Note Bull 2.5X Fund is to provide
investment returns that correspond to 250% of the daily price movement of the benchmark 10 Year Note. The objective of the
Dynamic HY Bond Fund is to maximize total return (income plus capital appreciation) by investing primarily in debt
instruments, including convertible securities, and derivatives of such investments, with an emphasis on lower-quality debt
instruments. The objective of the HY Bear Fund is to profit from a decline in the value of lower-quality debt instruments by
creating short positions in such instruments and derivatives of such instruments. The objective of the Commodity Bull 2X
Fund is to seek capital appreciation on an annual basis by investing in commodity-linked derivative instruments, including
swap agreements, commodity options, futures, options on futures and commodity-linked notes, in an attempt to gain
exposure to the investment returns of the commodities markets without investing directly in physical commodities. Theobjective of the Emerging Markets Bull 2X Fund is to provide investment returns that correspond to 200% of the performance
of the MSCI Emerging Markets Index (’EM Index”). The objective of the Emerging Market Bear 2X Fund is to provide
investment returns that inversely correspond (opposite) to 200% of the performance of the EM Index. The objective of the
Developed Markets Bull 2X Fund is to provide investment returns that correspond to 200% of the performance of the MSCI
EAFE Index (“EAFE Index”). The objective of the Developed Markets Bear 2X Fund is to provide investment returns that
inversely correspond (or opposite) to 200% of the performance of the EAFE Index. The objective of the China Bull 2X Fund is to
provide investment returns that correspond to 200% of the performance of the FTSE/Xinhua China 25 Index. The China Bear
2X Fund is to provide investment returns that inversely correspond (or opposite) to 200% of the FTSE/Xinhua China 25 Index.
The objective of the India Bull 2X Fund is to provide investment returns that correspond to 200% of the performance of the
MSCI India Index. The objective of the U.S. Government Money Market Fund is to provide security of principal, current
income and liquidity by investing primarily in obligations issued or guaranteed, as to principal and interest, by the U.S.government, its agencies or instrumentalities and repurchase agreements that are fully collateralized by such obligations.
2. SIGNIFICANT ACCOUNTING POLICIES
The following is a summary of significant accounting policies consistently followed by the Funds in the preparation of their
financial statements. These policies are in conformity with U.S. generally accepted accounting principles (“GAAP”).
D I REXI O N A NNU A L REPO RT
8/14/2019 Direxion Funds Annual Report - 2008
http://slidepdf.com/reader/full/direxion-funds-annual-report-2008 64/87
62
a) Investment Valuation – Equity securities, exchange-traded funds, closed-end investment companies, options, futures
and options on futures are valued at their last sales price, or if not available, the average of the last bid and ask prices. Over-
the-counter (“OTC”) securities and swap agreements are valued at the average of the last bid and ask prices. Securities
primarily traded on the NASDAQ National Market are valued using the NASDAQ Official Closing Price (“NOCP”). Investments
in open-end mutual funds are valued at their respective net asset values on the valuation date. Short-term debt securities
with a maturity of 60 days or less and money market securities are valued using the amortized cost method. Other debt
securities are valued by using the closing bid and asked prices provided by the Funds’ pricing service or, if such services are
unavailable, by a pricing matrix method. Securities for which reliable market quotations are not readily available, the Funds’
pricing service does not provide a valuation for such securities, the Funds’ pricing service provides a valuation that in the
judgment of Rafferty Asset Management, LLC (the “Adviser”) does not represent fair value, or the Fund or the Adviser
believes the market price is stale will be fair valued as determined by the Adviser under the supervision of the Board ofTrustees.
b) Repurchase Agreements – Each Fund may enter into repurchase agreements with institutions that are members of the
Federal Reserve System or securities dealers who are members of a national securities exchange or are primary dealers in
U.S. government securities. In connection with transactions in repurchase agreements, it is the Trust’s policy that the Fund
receives, as collateral, cash and/or securities (primarily U.S. government securities) whose market value, including accrued
interest, at all times will be at least equal to 100% of the amount invested by the Fund in each repurchase agreement. If the
seller defaults, and the value of the collateral declines, realization of the collateral by the Fund may be delayed or limited.
c) Stock Index Futures Contracts and Options on Futures Contracts – Each Fund, other than the U.S. Government Money
Market Fund, may purchase and sell stock index futures contracts and options on such futures contracts. Upon entering intoa contract, the Fund deposits and maintains as collateral such initial margin as required by the exchange on which the
transaction is effected. Pursuant to the contract, the Fund agrees to receive from or pay to the broker an amount of cash
equal to the daily fluctuation in value of the contract. Such receipts or payments are known as “variation margin” and are
recorded by the Fund as unrealized gains and losses. When the contract is closed, the Fund records a realized gain or loss
equal to the difference between the value of the contract at the time it was opened and the value at the time it was closed. As
collateral for futures contracts, the Fund is required under the 1940 Act to maintain assets consisting of cash, cash
equivalents or liquid securities. This collateral is required to be adjusted daily to reflect the market value of the purchase
obligation for long futures contracts or the market value of the instrument underlying the contract, but not less than the
market price at which the futures contract was established, for short futures contracts.
d) Swap Contracts – Each Fund, other than the U.S. Government Money Market Fund, may enter into equity swap contacts.
Standard swap contracts are between two parties that agree to exchange the returns (or differentials in rates of return)earned or realized on particular predetermined investments or instruments. The gross amount to be exchanged is calculated
with respect to a “notional amount” (i.e. the return on or increase in value of a particular dollar amount invested in a “basket”
of securities representing a particular index or industry sector). The Fund’s obligations are accrued daily (offset by any
amounts owed to the funds.)
In a “long” swap agreement, the counterparty will generally agree to pay the Funds the amount, if any, by which the notional
amount of the swap contract would have increased in value if the Funds had been invested in the particular securities, plus
dividends that would have been received on those securities. The Funds will agree to pay the counterparty a floating rate of
interest on the notional amount of the swap contract plus the amount, if any, by which the notional amount of the swap
contract would have decreased in value if it had it been invested in such securities plus, in certain instances, commissions or
trading spreads on the notional amounts. Thus, the return on the swap contract should be the gain or loss on the notionalamount plus dividends on the securities less the interest paid by the Fund on the notional amount. Interest on swap contracts
accrues at a rate of LIBOR plus a variable rate for a Bull Fund and a rate of LIBOR less a variable rate for a Bear Fund.
Payments may be made at the conclusion of the contract or periodically during its term. Swap contracts do not include the
delivery of securities or other underlying securities. The net amount of the excess, if any, of the Fund’s obligations over its
entitlement with respect to each swap is accrued on a daily basis and an amount of cash or liquid assets, having an
aggregate net asset value at least equal to such accrued excess is maintained in a segregated account by the Fund’s
custodian. Until a swap contract is settled in cash, the gain or loss on the notional amount plus dividends on the securities
less the interest paid by the Funds on the notional amount are recorded as “unrealized gains or losses on swaps and futures”
D I REXI O N A NNU A L REPO RT
8/14/2019 Direxion Funds Annual Report - 2008
http://slidepdf.com/reader/full/direxion-funds-annual-report-2008 65/87
and when cash is exchanged, the gain or loss is recorded as “realized gains or losses on swaps and futures”. Swap
contracts are collateralized by cash, cash equivalents and securities of the Fund held as deposits at the broker.
Each Fund, other than the U.S. Government Money Market Fund, may enter into swap contracts that provide the opposite
return of the particular benchmark or security (“short” the index or security). The operations are similar to that of the swaps
disclosed above except that the counterparty pays interest to the Fund on the notional amount outstanding and the dividends
on the underlying securities reduce the value of the swap, plus, in certain instances, the Fund will agree to pay to the
counterparty commissions or trading spreads on the notional amount. These amounts are netted with any unrealized
appreciation or depreciation to determine the value of the swap.
The Dynamic HY Bond Fund and HY Bear Fund may enter into credit default swaps. In a credit default swap, one party makesa stream of payments to another party in exchange for the right to receive a specified return in the event of a default by a
referenced entity, typically a default by a corporate issuer on its debt obligations. The stream of payments is recorded as an
unrealized gain or loss until the swap is sold or expires. The Fund may use swaps to attempt to gain exposure to debt
securities without actually purchasing those securities or to hedge a position. The Fund may purchase credit protection on
the referenced entity of the credit default swap (“Buy Contract”) or provide credit protection on the referenced entity of the
credit default swap (“Sale Contract”). If a credit event occurs, the maximum payout amount for a sale contract is limited to
the notional amount of the swap contract (“Maximum Payout Amount”). At August 31, 2008, the Dynamic HY Bond Fund had
Sale Contracts outstanding with Maximum Payout Amounts aggregating $10,350,000, with net unrealized appreciation of
$57,453, as reflected in the schedule of investments. The HY Bear Fund had Buy Contracts outstanding with Maximum Payout
Amounts aggregating $15,650,000 with net unrealized depreciation of $105,979 as reflected in the schedule of investments.
Maximum Payout Amounts could be offset by the subsequent sale, in any, of assets obtained via the execution of a payoutevent.
Swap contracts involve, to varying degrees, elements of market risk and exposure to loss in excess of the amount reflected
in the Statements of Assets and Liabilities. The notional amounts reflect the extent of the total investment exposure that each
Fund has under the swap contract. The primary risks associated with the use of swap agreements are imperfect correlation
between movements in the notional amount and the price of the underlying securities and the inability of counterparties to
perform. A Fund bears the risk of loss of the amount expected to be received under a swap contract in the event of default or
bankruptcy of a swap contract counterparty. In order to minimize credit risk, the Funds will attempt to enter into swap
contracts with multiple counterparties. The Funds will not enter into swap agreements unless the Adviser believes that the
other party to the transaction is creditworthy, the Funds do bear the risk loss of loss of the amount in the event of the default
or bankruptcy of the agreement counterparty. The Funds have established counterparty credit guidelines and entered into
transactions only with financial institutions or investment grade or better.
e) Short Positions – The Small Cap Bear 2.5X Fund, 10 Year Note Bear 2.5X Fund, HY Bear Fund, Emerging Markets Bear 2X
Fund, Developed Markets Bear 2X Fund, and China Bear 2X Fund may engage in short sale transactions. The NASDAQ-100
Bull 1.25X Fund, Small Cap Bull 2.5X Fund and Dow 30 Bull 1.25X Fund can only engage in short sales “against the box” In this
instance a security can only be sold short if a long position is held on the same security. For financial statement purposes, an
amount equal to the settlement amount is included in the Statement of Assets and Liabilities as an asset and an equivalent
liability. The amount of the liability is subsequently marked-to-market to reflect the current value of the short position.
Subsequent fluctuations in the market prices of short securities may require purchasing the securities at prices which
may differ from the market value reflected on the Statement of Assets and Liabilities. The Fund is liable to the buyer for any
dividends payable on securities while those securities are in a short position. As collateral for its short positions, the Fund is
required under the 1940 Act to maintain assets consisting of cash, cash equivalents or liquid securities equal to the marketvalue of the securities sold short. This collateral is required to be adjusted daily.
f) Risks of Options, Futures Contracts, Options on Futures Contracts and Short Positions – The risks inherent in the use of
options, futures contracts, options on futures contracts and short positions include 1) adverse changes in the value of such
instruments; 2) imperfect correlation between the price of options and futures contracts and options thereon and
movements in the price of the underlying securities, index or futures contracts; 3) the possible absence of a liquid
secondary market for any particular instrument at any time; 4) the possible need to defer closing out certain positions to
avoid adverse tax consequences; and 5) the possible nonperformance by the counterparty under the terms of the contract
D I REXI O N A NNU A L REPO RT
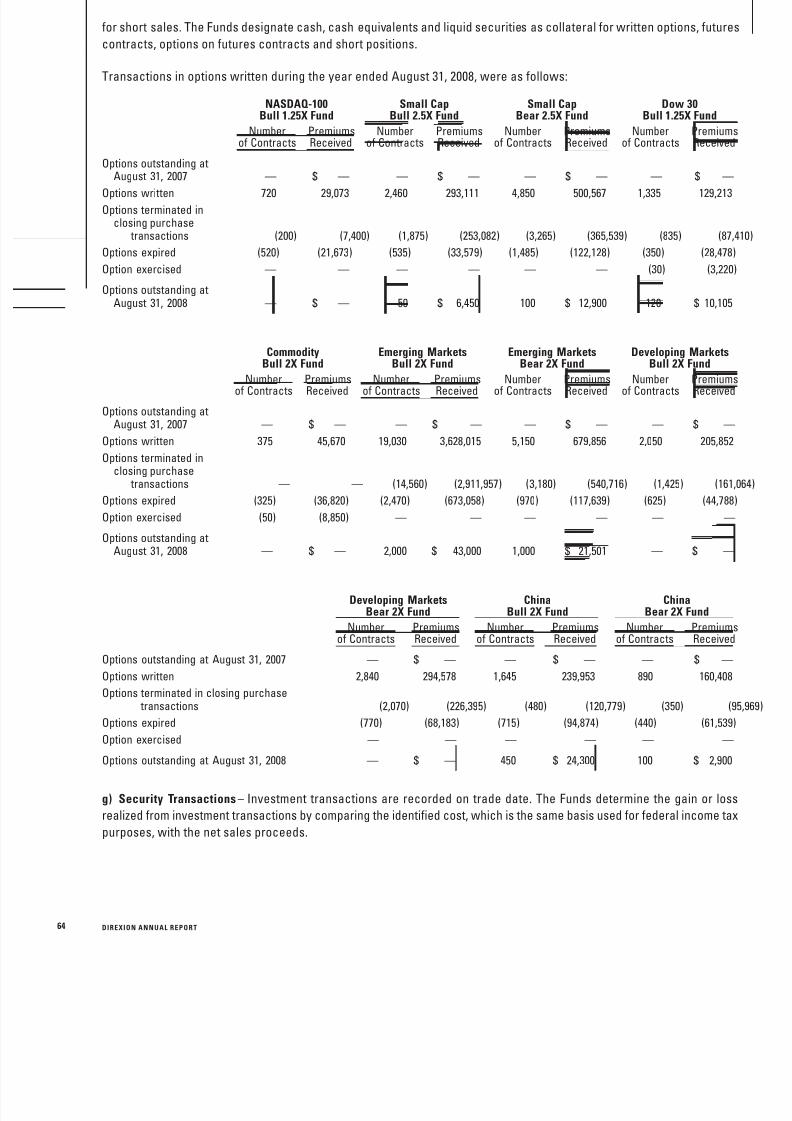
8/14/2019 Direxion Funds Annual Report - 2008
http://slidepdf.com/reader/full/direxion-funds-annual-report-2008 66/87
64
for short sales. The Funds designate cash, cash equivalents and liquid securities as collateral for written options, futures
contracts, options on futures contracts and short positions.
Transactions in options written during the year ended August 31, 2008, were as follows:
Numberof Contracts
PremiumsReceived
Numberof Contracts
PremiumsReceived
Numberof Contracts
PremiumsReceived
Numberof Contracts
PremiumsReceived
NASDAQ-100Bull 1.25X Fund
Small CapBull 2.5X Fund
Small CapBear 2.5X Fund
Dow 30Bull 1.25X Fund
Options outstanding atAugust 31, 2007 — $ — — $ — — $ — — $ —
Options written 720 29,073 2,460 293,111 4,850 500,567 1,335 129,213Options terminated in
closing purchase transactions (200) (7,400) (1,875) (253,082) (3,265) (365,539) (835) (87,4
Options expired (520) (21,673) (535) (33,579) (1,485) (122,128) (350) (28,478)
Option exercised — — — — — — (30) (3,220)
Options outstanding atAugust 31, 2008 — $ — 50 $ 6,450 100 $ 12,900 120 $ 10,105
Numberof Contracts PremiumsReceived Numberof Contracts PremiumsReceived Numberof Contracts PremiumsReceived Numberof Contracts PremiumsReceived
CommodityBull 2X Fund
Emerging MarketsBull 2X Fund
Emerging MarketsBear 2X Fund
Developing MarketsBull 2X Fund
Options outstanding atAugust 31, 2007 — $ — — $ — — $ — — $ —
Options written 375 45,670 19,030 3,628,015 5,150 679,856 2,050 205,852
Options terminated inclosing purchase transactions — — (14,560) (2,911,957) (3,180) (540,716) (1,425) (161,
Options expired (325) (36,820) (2,470) (673,058) (970) (117,639) (625) (44,788
Option exercised (50) (8,850) — — — — — —
Options outstanding atAugust 31, 2008 — $ — 2,000 $ 43,000 1,000 $ 21,501 — $ —
Numberof Contracts
PremiumsReceived
Numberof Contracts
PremiumsReceived
Numberof Contracts
PremiumsReceived
Developing MarketsBear 2X Fund
ChinaBull 2X Fund
ChinaBear 2X Fund
Options outstanding at August 31, 2007 — $ — — $ — — $ —
Options written 2,840 294,578 1,645 239,953 890 160,408
Options terminated in closing purchase transactions (2,070) (226,395) (480) (120,779) (350) (9
Options expired (770) (68,183) (715) (94,874) (440) (61,539)
Option exercised — — — — — —
Options outstanding at August 31, 2008 — $ — 450 $ 24,300 100 $ 2,900
g) Security Transactions – Investment transactions are recorded on trade date. The Funds determine the gain or loss
realized from investment transactions by comparing the identified cost, which is the same basis used for federal income tax
purposes, with the net sales proceeds.
D I REXI O N A NNU A L REPO RT
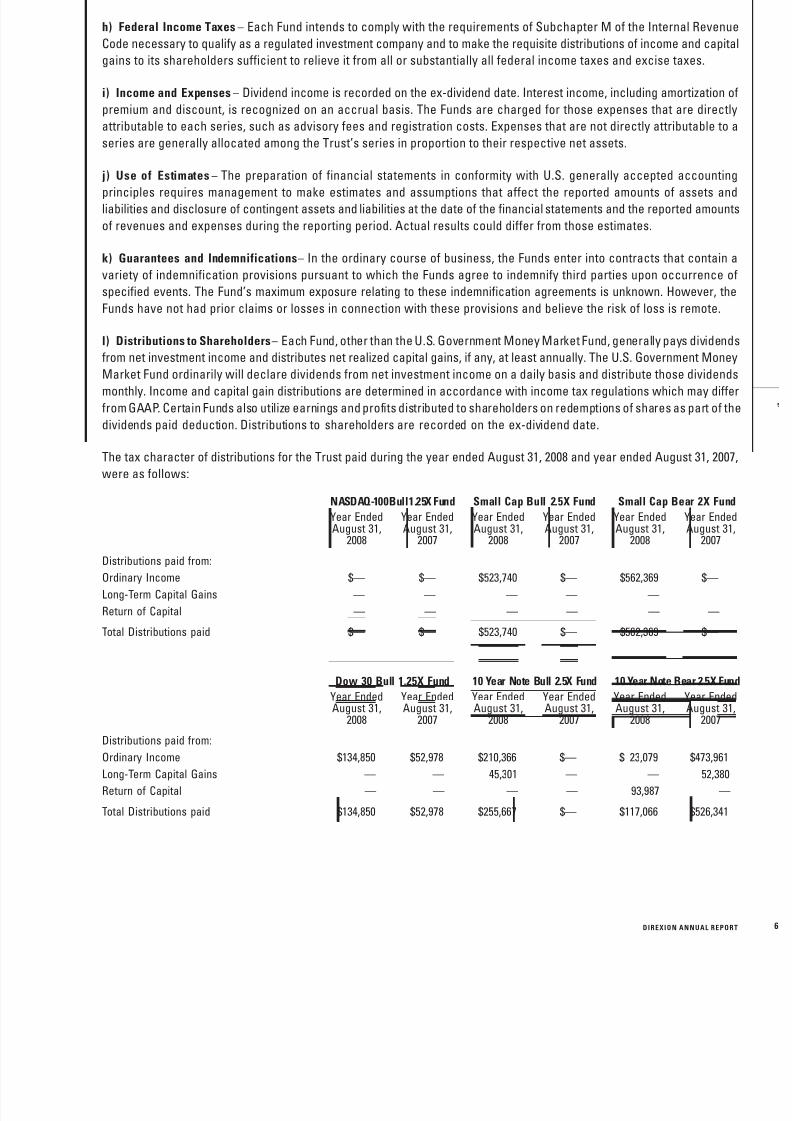
8/14/2019 Direxion Funds Annual Report - 2008
http://slidepdf.com/reader/full/direxion-funds-annual-report-2008 67/87
h) Federal Income Taxes – Each Fund intends to comply with the requirements of Subchapter M of the Internal Revenue
Code necessary to qualify as a regulated investment company and to make the requisite distributions of income and capital
gains to its shareholders sufficient to relieve it from all or substantially all federal income taxes and excise taxes.
i) Income and Expenses – Dividend income is recorded on the ex-dividend date. Interest income, including amortization of
premium and discount, is recognized on an accrual basis. The Funds are charged for those expenses that are directly
attributable to each series, such as advisory fees and registration costs. Expenses that are not directly attributable to a
series are generally allocated among the Trust’s series in proportion to their respective net assets.
j) Use of Estimates – The preparation of financial statements in conformity with U.S. generally accepted accounting
principles requires management to make estimates and assumptions that affect the reported amounts of assets andliabilities and disclosure of contingent assets and liabilities at the date of the financial statements and the reported amounts
of revenues and expenses during the reporting period. Actual results could differ from those estimates.
k) Guarantees and Indemnifications – In the ordinary course of business, the Funds enter into contracts that contain a
variety of indemnification provisions pursuant to which the Funds agree to indemnify third parties upon occurrence of
specified events. The Fund’s maximum exposure relating to these indemnification agreements is unknown. However, the
Funds have not had prior claims or losses in connection with these provisions and believe the risk of loss is remote.
l) Distributions to Shareholders – Each Fund, other than the U.S. Government Money Market Fund, generally pays dividends
from net investment income and distributes net realized capital gains, if any, at least annually. The U.S. Government Money
Market Fund ordinarily will declare dividends from net investment income on a daily basis and distribute those dividends
monthly. Income and capital gain distributions are determined in accordance with income tax regulations which may differ
from GAAP. Certain Funds also utilize earnings and profits distributed to shareholders on redemptions of shares as part of the
dividends paid deduction. Distributions to shareholders are recorded on the ex-dividend date.
The tax character of distributions for the Trust paid during the year ended August 31, 2008 and year ended August 31, 2007,
were as follows:
Year EndedAugust 31,
2008
Year EndedAugust 31,
2007
Year EndedAugust 31,
2008
Year EndedAugust 31,
2007
Year EndedAugust 31,
2008
Year EndedAugust 31,
2007
NASDAQ-100Bull1.25X Fund Small Cap Bull 2.5X Fund Small Cap Bear 2X Fund
Distributions paid from:
Ordinary Income $— $— $523,740 $— $562,369 $—
Long-Term Capital Gains — — — — — —
Return of Capital — — — — — —
Total Distributions paid $— $— $523,740 $— $562,369 $—
Year EndedAugust 31,
2008
Year EndedAugust 31,
2007
Year EndedAugust 31,
2008
Year EndedAugust 31,
2007
Year EndedAugust 31,
2008
Year EndedAugust 31,
2007
Dow 30 Bull 1.25X Fund 10 Year Note Bull 2.5X Fund 10 Year Note Bear 2.5X Fund
Distributions paid from:
Ordinary Income $134,850 $52,978 $210,366 $— $ 23,079 $473,961
Long-Term Capital Gains — — 45,301 — — 52,380
Return of Capital — — — — 93,987 —
Total Distributions paid $134,850 $52,978 $255,667 $— $117,066 $526,341
D I REXI O N A NNU A L REPO RT
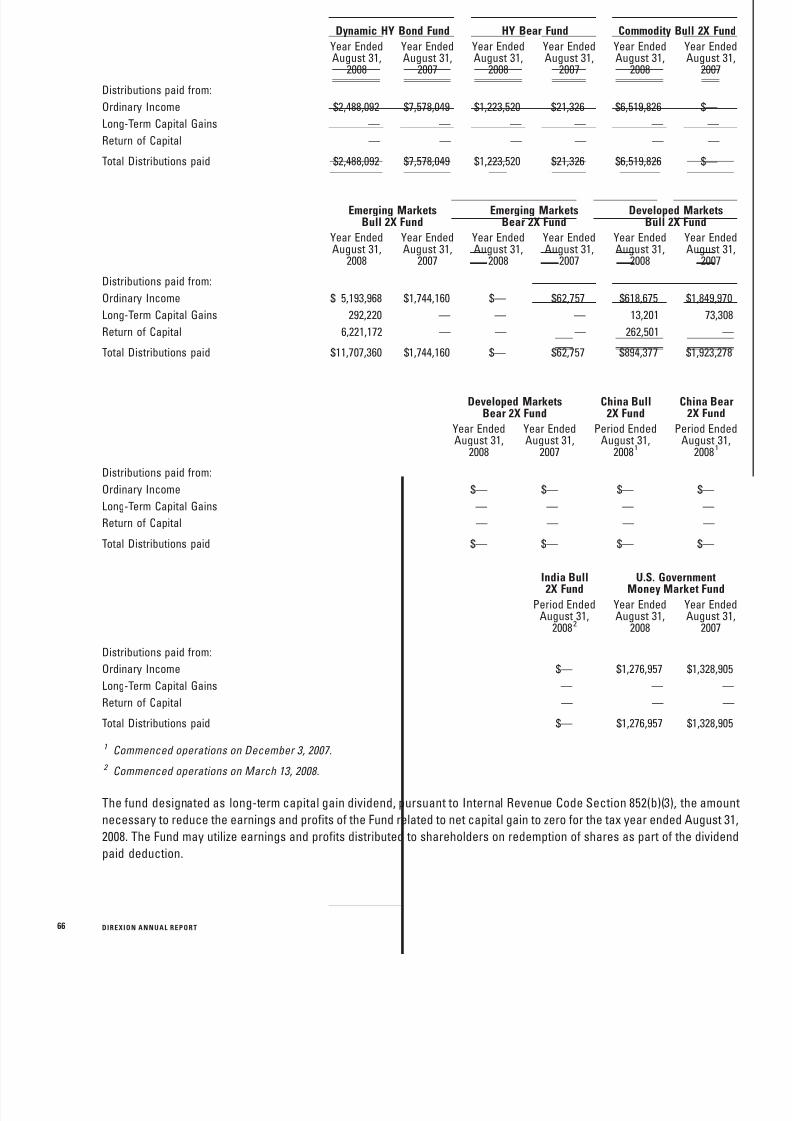
8/14/2019 Direxion Funds Annual Report - 2008
http://slidepdf.com/reader/full/direxion-funds-annual-report-2008 68/87
Year EndedAugust 31,
2008
Year EndedAugust 31,
2007
Year EndedAugust 31,
2008
Year EndedAugust 31,
2007
Year EndedAugust 31,
2008
Year EndedAugust 31,
2007
Dynamic HY Bond Fund HY Bear Fund Commodity Bull 2X Fund
Distributions paid from:
Ordinary Income $2,488,092 $7,578,049 $1,223,520 $21,326 $6,519,826 $—
Long-Term Capital Gains — — — — — —
Return of Capital — — — — — —
Total Distributions paid $2,488,092 $7,578,049 $1,223,520 $21,326 $6,519,826 $—
Year EndedAugust 31,
2008
Year EndedAugust 31,
2007
Year EndedAugust 31,
2008
Year EndedAugust 31,
2007
Year EndedAugust 31,
2008
Year EndedAugust 31,
2007
Emerging MarketsBull 2X Fund
Emerging MarketsBear 2X Fund
Developed MarketsBull 2X Fund
Distributions paid from:
Ordinary Income $ 5,193,968 $1,744,160 $— $62,757 $618,675 $1,849,970
Long-Term Capital Gains 292,220 — — — 13,201 73,308
Return of Capital 6,221,172 — — — 262,501 —
Total Distributions paid $11,707,360 $1,744,160 $— $62,757 $894,377 $1,923,278
Year EndedAugust 31,
2008
Year EndedAugust 31,
2007
Period EndedAugust 31,
20081
Period EndedAugust 31,
20081
Developed MarketsBear 2X Fund
China Bull2X Fund
China Bear2X Fund
Distributions paid from:
Ordinary Income $— $— $— $—
Long-Term Capital Gains — — — —
Return of Capital — — — —
Total Distributions paid $— $— $— $—
Period EndedAugust 31,
20082
Year EndedAugust 31,
2008
Year EndedAugust 31,
2007
India Bull2X Fund
U.S. GovernmentMoney Market Fund
Distributions paid from:
Ordinary Income $— $1,276,957 $1,328,905
Long-Term Capital Gains — — —
Return of Capital — — —
Total Distributions paid $— $1,276,957 $1,328,905
1 Commenced operations on December 3, 2007.
2 Commenced operations on March 13, 2008.
The fund designated as long-term capital gain dividend, pursuant to Internal Revenue Code Section 852(b)(3), the amount
necessary to reduce the earnings and profits of the Fund related to net capital gain to zero for the tax year ended August 31,
2008. The Fund may utilize earnings and profits distributed to shareholders on redemption of shares as part of the dividend
paid deduction.
66 D I REXI O N A NNU A L REPO RT
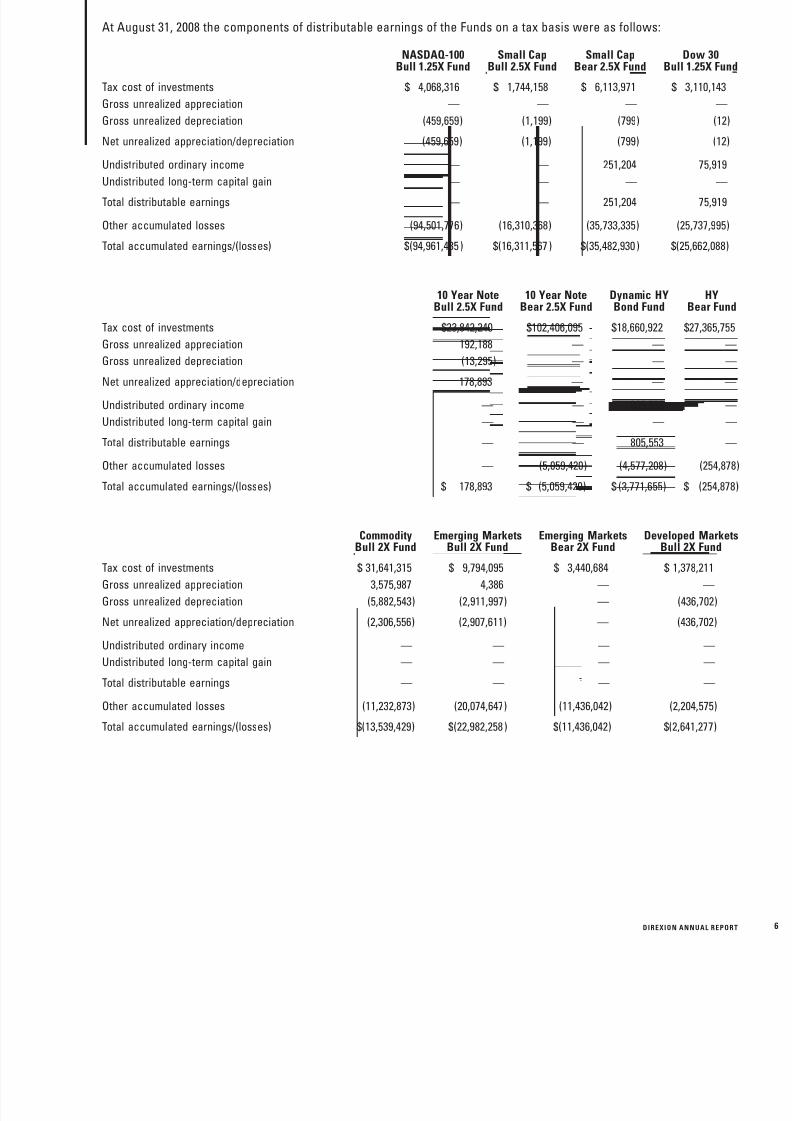
8/14/2019 Direxion Funds Annual Report - 2008
http://slidepdf.com/reader/full/direxion-funds-annual-report-2008 69/87
At August 31, 2008 the components of distributable earnings of the Funds on a tax basis were as follows:
NASDAQ-100Bull 1.25X Fund
Small CapBull 2.5X Fund
Small CapBear 2.5X Fund
Dow 30Bull 1.25X Fund
Tax cost of investments $ 4,068,316 $ 1,744,158 $ 6,113,971 $ 3,110,143
Gross unrealized appreciation — — — —
Gross unrealized depreciation (459,659) (1,199) (799) (12)
Net unrealized appreciation/depreciation (459,659) (1,199) (799) (12)
Undistributed ordinary income — — 251,204 75,919
Undistributed long-term capital gain — — — —
Total distributable earnings — — 251,204 75,919
Other accumulated losses (94,501,776) (16,310,368) (35,733,335) (25,737,995)
Total accumulated earnings/(losses) $(94,961,435 ) $(16,311,567 ) $(35,482,930 ) $(25,662,088)
10 Year NoteBull 2.5X Fund
10 Year NoteBear 2.5X Fund
Dynamic HYBond Fund
HYBear Fund
Tax cost of investments $23,842,240 $102,406,095 $18,660,922 $27,365,755
Gross unrealized appreciation 192,188 — — —
Gross unrealized depreciation (13,295) — — —
Net unrealized appreciation/depreciation 178,893 — — —
Undistributed ordinary income — — 805,553 —
Undistributed long-term capital gain — — — —
Total distributable earnings — — 805,553 —
Other accumulated losses — (5,059,420) (4,577,208) (254,878
Total accumulated earnings/(losses) $ 178,893 $ (5,059,420) $ (3,771,655) $ (254,878
CommodityBull 2X Fund
Emerging MarketsBull 2X Fund
Emerging MarketsBear 2X Fund
Developed MarketsBull 2X Fund
Tax cost of investments $ 31,641,315 $ 9,794,095 $ 3,440,684 $ 1,378,211
Gross unrealized appreciation 3,575,987 4,386 — —
Gross unrealized depreciation (5,882,543) (2,911,997) — (436,702)
Net unrealized appreciation/depreciation (2,306,556) (2,907,611) — (436,702)
Undistributed ordinary income — — — —
Undistributed long-term capital gain — — — —
Total distributable earnings — — — —
Other accumulated losses (11,232,873) (20,074,647) (11,436,042) (2,204,575)
Total accumulated earnings/(losses) $(13,539,429) $(22,982,258 ) $(11,436,042) $(2,641,277)
D I REXI O N A NNU A L REPO RT
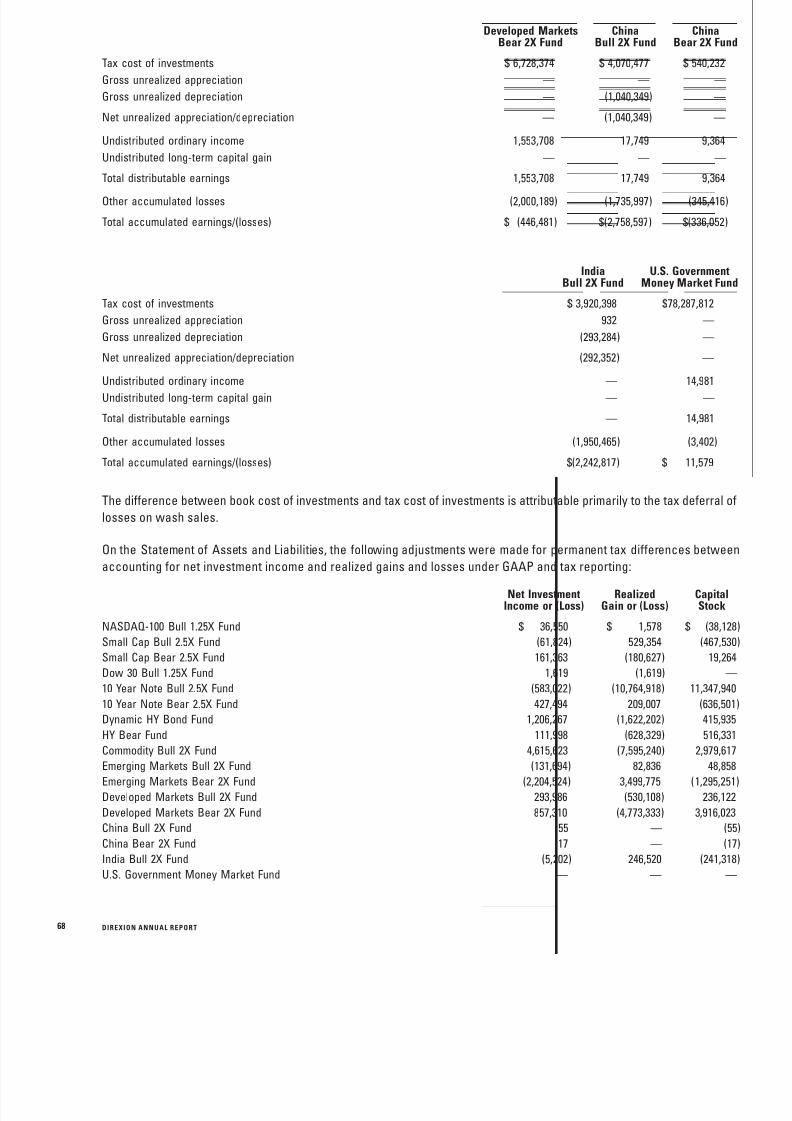
8/14/2019 Direxion Funds Annual Report - 2008
http://slidepdf.com/reader/full/direxion-funds-annual-report-2008 70/87
Developed MarketsBear 2X Fund
ChinaBull 2X Fund
ChinaBear 2X Fund
Tax cost of investments $ 6,728,374 $ 4,070,477 $ 540,232
Gross unrealized appreciation — — —
Gross unrealized depreciation — (1,040,349) —
Net unrealized appreciation/depreciation — (1,040,349) —
Undistributed ordinary income 1,553,708 17,749 9,364
Undistributed long-term capital gain — — —
Total distributable earnings 1,553,708 17,749 9,364
Other accumulated losses (2,000,189) (1,735,997) (345,416)
Total accumulated earnings/(losses) $ (446,481) $(2,758,597) $(336,052)
IndiaBull 2X Fund
U.S. GovernmentMoney Market Fund
Tax cost of investments $ 3,920,398 $78,287,812
Gross unrealized appreciation 932 —
Gross unrealized depreciation (293,284) —
Net unrealized appreciation/depreciation (292,352) —
Undistributed ordinary income — 14,981Undistributed long-term capital gain — —
Total distributable earnings — 14,981
Other accumulated losses (1,950,465) (3,402)
Total accumulated earnings/(losses) $(2,242,817) $ 11,579
The difference between book cost of investments and tax cost of investments is attributable primarily to the tax deferral of
losses on wash sales.
On the Statement of Assets and Liabilities, the following adjustments were made for permanent tax differences between
accounting for net investment income and realized gains and losses under GAAP and tax reporting:
Net InvestmentIncome or (Loss)
RealizedGain or (Loss)
CapitalStock
NASDAQ-100 Bull 1.25X Fund $ 36,550 $ 1,578 $ (38,128
Small Cap Bull 2.5X Fund (61,824) 529,354 (467,530
Small Cap Bear 2.5X Fund 161,363 (180,627) 19,264
Dow 30 Bull 1.25X Fund 1,619 (1,619) —
10 Year Note Bull 2.5X Fund (583,022) (10,764,918) 11,347,940
10 Year Note Bear 2.5X Fund 427,494 209,007 (636,501
Dynamic HY Bond Fund 1,206,267 (1,622,202) 415,935
HY Bear Fund 111,998 (628,329) 516,331
Commodity Bull 2X Fund 4,615,623 (7,595,240) 2,979,617
Emerging Markets Bull 2X Fund (131,694) 82,836 48,858Emerging Markets Bear 2X Fund (2,204,524) 3,499,775 (1,295,251
Developed Markets Bull 2X Fund 293,986 (530,108) 236,122
Developed Markets Bear 2X Fund 857,310 (4,773,333) 3,916,023
China Bull 2X Fund 55 — (55
China Bear 2X Fund 17 — (17
India Bull 2X Fund (5,202) 246,520 (241,318
U.S. Government Money Market Fund — — —
68 D I REXI O N A NNU A L REPO RT
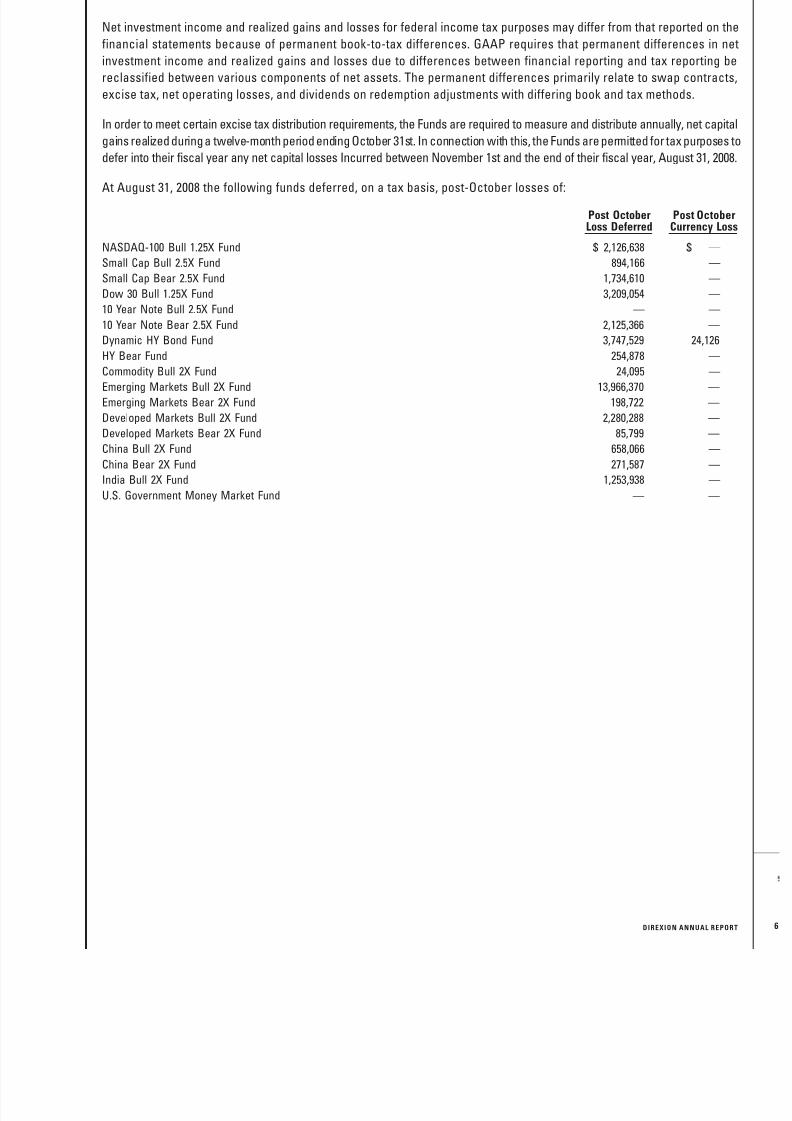
8/14/2019 Direxion Funds Annual Report - 2008
http://slidepdf.com/reader/full/direxion-funds-annual-report-2008 71/87
Net investment income and realized gains and losses for federal income tax purposes may differ from that reported on the
financial statements because of permanent book-to-tax differences. GAAP requires that permanent differences in net
investment income and realized gains and losses due to differences between financial reporting and tax reporting be
reclassified between various components of net assets. The permanent differences primarily relate to swap contracts,
excise tax, net operating losses, and dividends on redemption adjustments with differing book and tax methods.
In order to meet certain excise tax distribution requirements, the Funds are required to measure and distribute annually, net capital
gains realized duringa twelve-month period ending October 31st. In connection with this, the Funds are permitted for tax purposes to
defer into their fiscal year any net capital losses Incurred between November 1st and the end of their fiscal year, August 31, 2008.
At August 31, 2008 the following funds deferred, on a tax basis, post-October losses of:
Post OctoberLoss Deferred
Post OctoberCurrency Loss
NASDAQ-100 Bull 1.25X Fund $ 2,126,638 $ —
Small Cap Bull 2.5X Fund 894,166 —
Small Cap Bear 2.5X Fund 1,734,610 —
Dow 30 Bull 1.25X Fund 3,209,054 —
10 Year Note Bull 2.5X Fund — —
10 Year Note Bear 2.5X Fund 2,125,366 —
Dynamic HY Bond Fund 3,747,529 24,126
HY Bear Fund 254,878 —
Commodity Bull 2X Fund 24,095 —
Emerging Markets Bull 2X Fund 13,966,370 —
Emerging Markets Bear 2X Fund 198,722 —
Developed Markets Bull 2X Fund 2,280,288 —
Developed Markets Bear 2X Fund 85,799 —
China Bull 2X Fund 658,066 —
China Bear 2X Fund 271,587 —
India Bull 2X Fund 1,253,938 —
U.S. Government Money Market Fund — —
D I REXI O N A NNU A L REPO RT
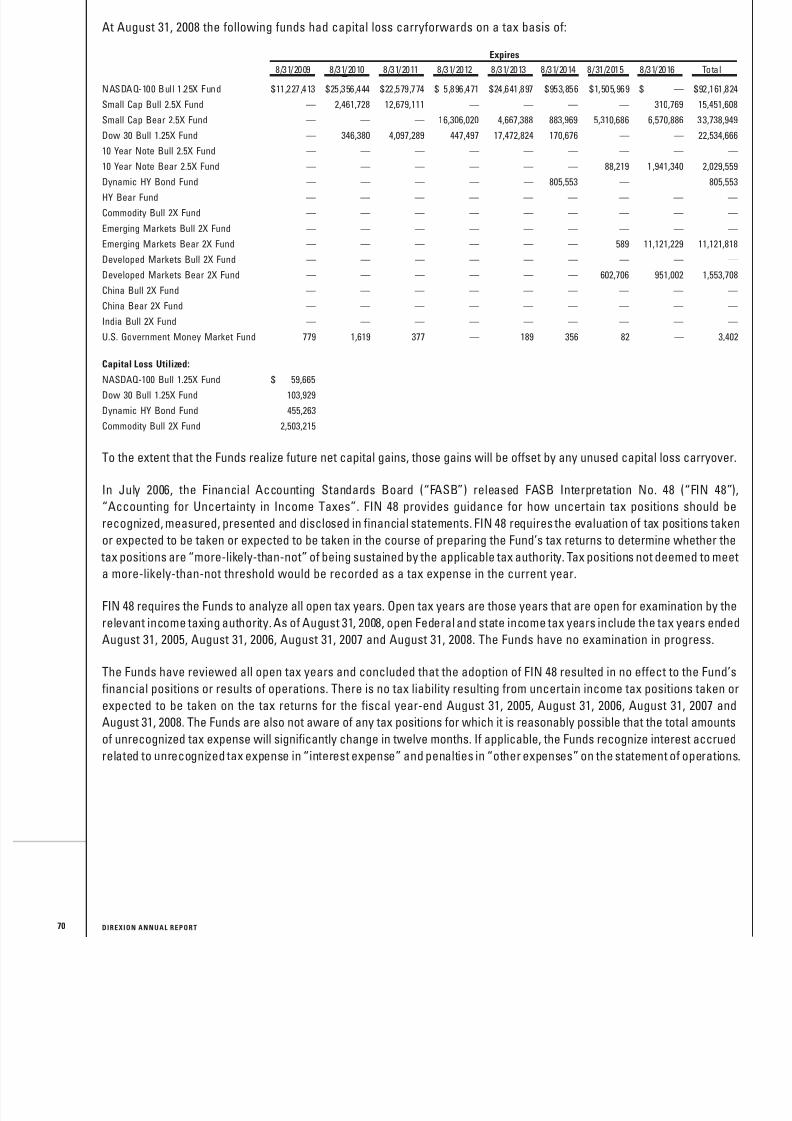
8/14/2019 Direxion Funds Annual Report - 2008
http://slidepdf.com/reader/full/direxion-funds-annual-report-2008 72/87
70
At August 31, 2008 the following funds had capital loss carryforwards on a tax basis of:
8/31/2009 8/31/2010 8/31/2011 8/31/2012 8/31/2013 8/31/2014 8/31/2015 8/31/2016 Total
Expires
NASDAQ-100 Bull 1.25X Fund $11,227,413 $25,356,444 $22,579,774 $ 5,896,471 $24,641,897 $953,856 $1,505,969 $ — $92,161,824
Small Cap Bull 2.5X Fund — 2,461,728 12,679,111 — — — — 310,769 15,451,608
Small Cap Bear 2.5X Fund — — — 16,306,020 4,667,388 883,969 5,310,686 6,570,886 33,738,949
Dow 30 Bull 1.25X Fund — 346,380 4,097,289 447,497 17,472,824 170,676 — — 22,534,666
10 Year Note Bull 2.5X Fund — — — — — — — — —
10 Year Note Bear 2.5X Fund — — — — — — 88,219 1,941,340 2,029,559
Dynamic HY Bond Fund — — — — — 805,553 — 805,553
HY Bear Fund — — — — — — — — —
Commodity Bull 2X Fund — — — — — — — — —
Emerging Markets Bull 2X Fund — — — — — — — — —
Emerging Markets Bear 2X Fund — — — — — — 589 11,121,229 11,121,818
Developed Markets Bull 2X Fund — — — — — — — — —
Developed Markets Bear 2X Fund — — — — — — 602,706 951,002 1,553,708
China Bull 2X Fund — — — — — — — — —
China Bear 2X Fund — — — — — — — — —
India Bull 2X Fund — — — — — — — — —
U.S. Government Money Market Fund 779 1,619 377 — 189 356 82 — 3,402
Capital Loss Utilized:
NASDAQ-100 Bull 1.25X Fund $ 59,665Dow 30 Bull 1.25X Fund 103,929
Dynamic HY Bond Fund 455,263
Commodity Bull 2X Fund 2,503,215
To the extent that the Funds realize future net capital gains, those gains will be offset by any unused capital loss carryover.
In July 2006, the Financial Accounting Standards Board (“FASB”) released FASB Interpretation No. 48 (“FIN 48”),
“Accounting for Uncertainty in Income Taxes”. FIN 48 provides guidance for how uncertain tax positions should be
recognized, measured, presented and disclosed in financial statements. FIN 48 requires the evaluation of tax positions taken
or expected to be taken or expected to be taken in the course of preparing the Fund’s tax returns to determine whether the
tax positions are “more-likely-than-not” of being sustained by the applicable tax authority. Tax positions not deemed to meet
a more-likely-than-not threshold would be recorded as a tax expense in the current year.
FIN 48 requires the Funds to analyze all open tax years. Open tax years are those years that are open for examination by the
relevant income taxing authority. As of August 31, 2008, open Federal and state income tax years include the tax years ended
August 31, 2005, August 31, 2006, August 31, 2007 and August 31, 2008. The Funds have no examination in progress.
The Funds have reviewed all open tax years and concluded that the adoption of FIN 48 resulted in no effect to the Fund’s
financial positions or results of operations. There is no tax liability resulting from uncertain income tax positions taken or
expected to be taken on the tax returns for the fiscal year-end August 31, 2005, August 31, 2006, August 31, 2007 and
August 31, 2008. The Funds are also not aware of any tax positions for which it is reasonably possible that the total amounts
of unrecognized tax expense will significantly change in twelve months. If applicable, the Funds recognize interest accrued
related to unrecognized tax expense in “interest expense” and penalties in “other expenses” on the statement of operations.
D I REXI O N A NNU A L REPO RT
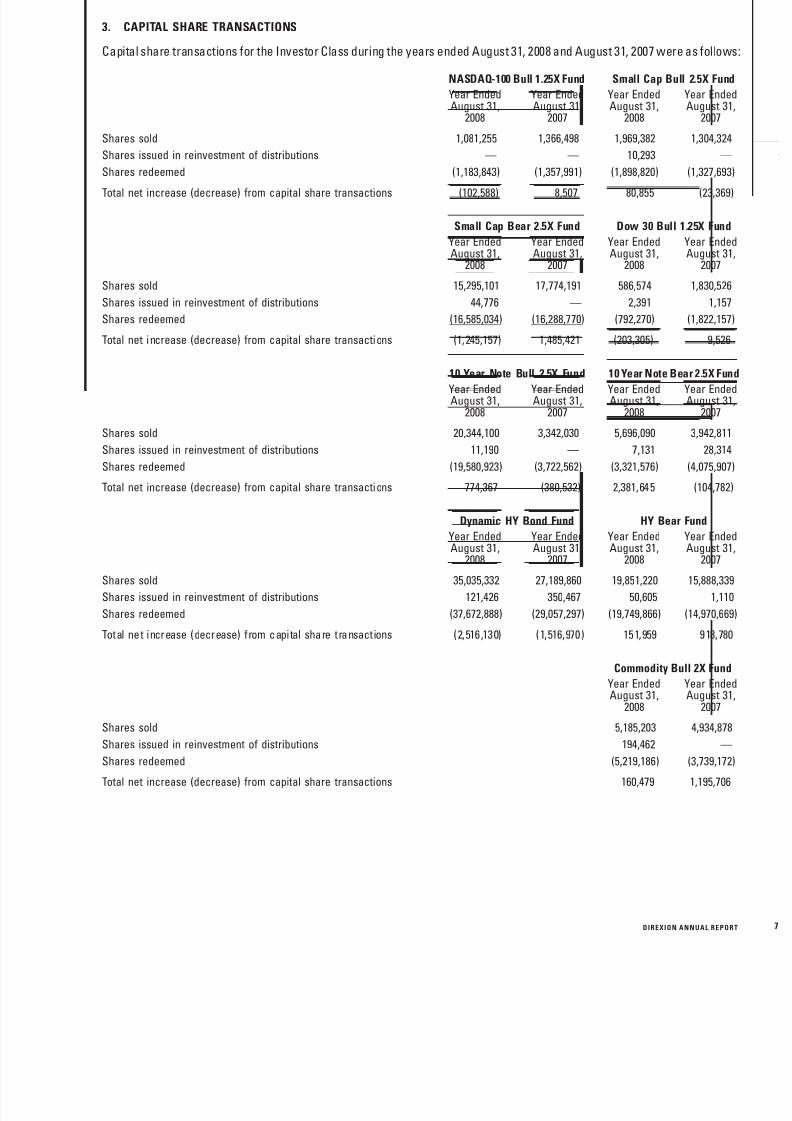
8/14/2019 Direxion Funds Annual Report - 2008
http://slidepdf.com/reader/full/direxion-funds-annual-report-2008 73/87
3. CAPITAL SHARE TRANSACTIONS
Capital share transactions for the Investor Class during the years ended August 31, 2008 and August 31, 2007 were as follows
Year EndedAugust 31,
2008
Year EndedAugust 31,
2007
Year EndedAugust 31,
2008
Year EndedAugust 31,
2007
NASDAQ-100 Bull 1.25X Fund Small Cap Bull 2.5X Fund
Shares sold 1,081,255 1,366,498 1,969,382 1,304,324
Shares issued in reinvestment of distributions — — 10,293 —
Shares redeemed (1,183,843) (1,357,991) (1,898,820) (1,327,693)
Total net increase (decrease) from capital share transactions (102,588) 8,507 80,855 (23,369)
Year EndedAugust 31,
2008
Year EndedAugust 31,
2007
Year EndedAugust 31,
2008
Year EndedAugust 31,
2007
Small Cap Bear 2.5X Fund Dow 30 Bull 1.25X Fund
Shares sold 15,295,101 17,774,191 586,574 1,830,526
Shares issued in reinvestment of distributions 44,776 — 2,391 1,157
Shares redeemed (16,585,034) (16,288,770) (792,270) (1,822,157)
Total net increase (decrease) from capital share transactions (1,245,157) 1,485,421 (203,305) 9,526
Year EndedAugust 31,
2008
Year EndedAugust 31,
2007
Year EndedAugust 31,
2008
Year EndedAugust 31,
2007
10 Year Note Bull 2.5X Fund 10 Year Note Bear 2.5X Fund
Shares sold 20,344,100 3,342,030 5,696,090 3,942,811
Shares issued in reinvestment of distributions 11,190 — 7,131 28,314
Shares redeemed (19,580,923) (3,722,562) (3,321,576) (4,075,907)
Total net increase (decrease) from capital share transactions 774,367 (380,532) 2,381,645 (104,782)
Year EndedAugust 31,
2008
Year EndedAugust 31,
2007
Year EndedAugust 31,
2008
Year EndedAugust 31,
2007
Dynamic HY Bond Fund HY Bear Fund
Shares sold 35,035,332 27,189,860 19,851,220 15,888,339
Shares issued in reinvestment of distributions 121,426 350,467 50,605 1,110
Shares redeemed (37,672,888) (29,057,297) (19,749,866) (14,970,669
Total net increase (decrease) from capital share transactions (2,516,130) (1,516,970) 151,959 918,780
Year EndedAugust 31,
2008
Year EndedAugust 31,
2007
Commodity Bull 2X Fund
Shares sold 5,185,203 4,934,878
Shares issued in reinvestment of distributions 194,462 —
Shares redeemed (5,219,186) (3,739,172)Total net increase (decrease) from capital share transactions 160,479 1,195,706
D I REXI O N A NNU A L REPO RT
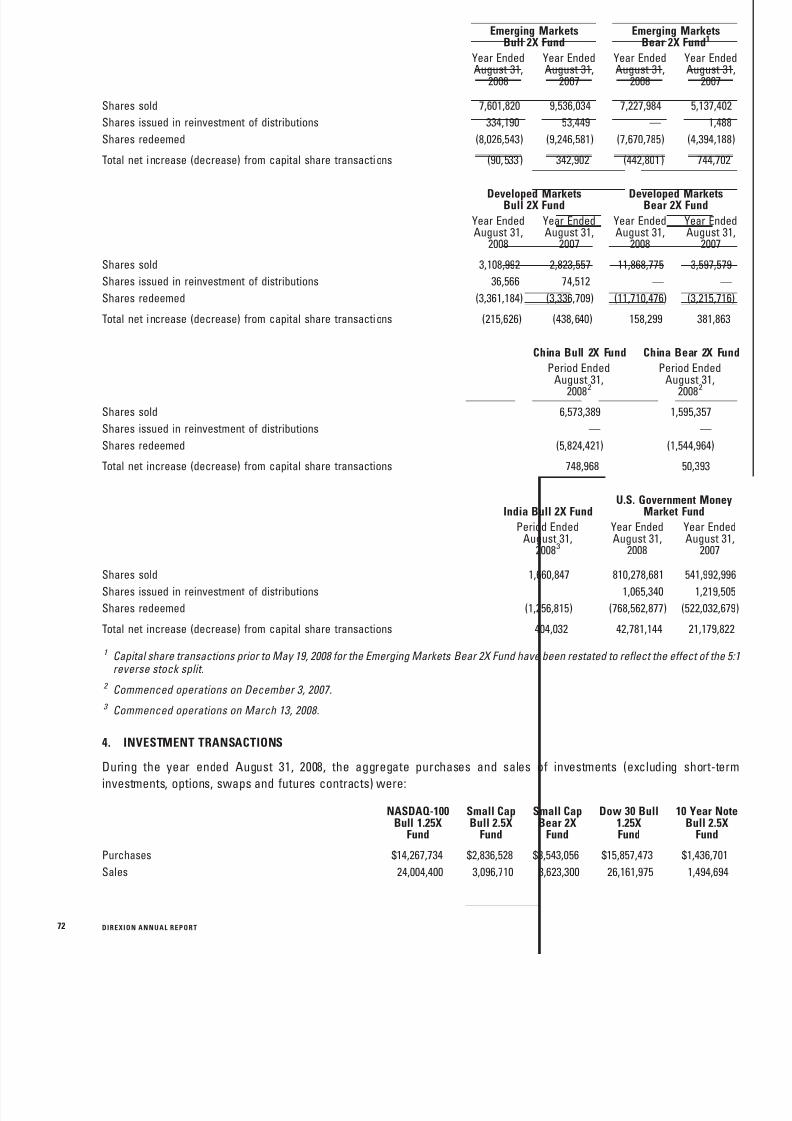
8/14/2019 Direxion Funds Annual Report - 2008
http://slidepdf.com/reader/full/direxion-funds-annual-report-2008 74/87
72
Year EndedAugust 31,
2008
Year EndedAugust 31,
2007
Year EndedAugust 31,
2008
Year EndedAugust 31,
2007
Emerging MarketsBull 2X Fund
Emerging MarketsBear 2X Fund1
Shares sold 7,601,820 9,536,034 7,227,984 5,137,402
Shares issued in reinvestment of distributions 334,190 53,449 — 1,488
Shares redeemed (8,026,543) (9,246,581) (7,670,785) (4,394,188)
Total net increase (decrease) from capital share transactions (90,533) 342,902 (442,801) 744,702
Year EndedAugust 31,
2008
Year EndedAugust 31,
2007
Year EndedAugust 31,
2008
Year EndedAugust 31,
2007
Developed MarketsBull 2X Fund
Developed MarketsBear 2X Fund
Shares sold 3,108,992 2,823,557 11,868,775 3,597,579
Shares issued in reinvestment of distributions 36,566 74,512 — —
Shares redeemed (3,361,184) (3,336,709) (11,710,476) (3,215,716)
Total net increase (decrease) from capital share transactions (215,626) (438,640) 158,299 381,863
Period Ended
August 31,20082
Period Ended
August 31,20082
China Bull 2X Fund China Bear 2X Fund
Shares sold 6,573,389 1,595,357
Shares issued in reinvestment of distributions — —
Shares redeemed (5,824,421) (1,544,964)
Total net increase (decrease) from capital share transactions 748,968 50,393
Period EndedAugust 31,
20083
Year EndedAugust 31,
2008
Year EndedAugust 31,
2007
India Bull 2X FundU.S. Government Money
Market Fund
Shares sold 1,660,847 810,278,681 541,992,996Shares issued in reinvestment of distributions 1,065,340 1,219,505
Shares redeemed (1,256,815) (768,562,877) (522,032,679
Total net increase (decrease) from capital share transactions 404,032 42,781,144 21,179,822
1 Capital share transactions prior to May 19, 2008 for the Emerging Markets Bear 2X Fund have been restated to reflect the effect of the 5:1reverse stock split.
2 Commenced operations on December 3, 2007.
3 Commenced operations on March 13, 2008.
4. INVESTMENT TRANSACTIONS
During the year ended August 31, 2008, the aggregate purchases and sales of investments (excluding short-terminvestments, options, swaps and futures contracts) were:
NASDAQ-100Bull 1.25X
Fund
Small CapBull 2.5X
Fund
Small CapBear 2X
Fund
Dow 30 Bull1.25XFund
10 Year NoteBull 2.5X
Fund
Purchases $14,267,734 $2,836,528 $3,543,056 $15,857,473 $1,436,701
Sales 24,004,400 3,096,710 3,623,300 26,161,975 1,494,694
D I REXI O N A NNU A L REPO RT
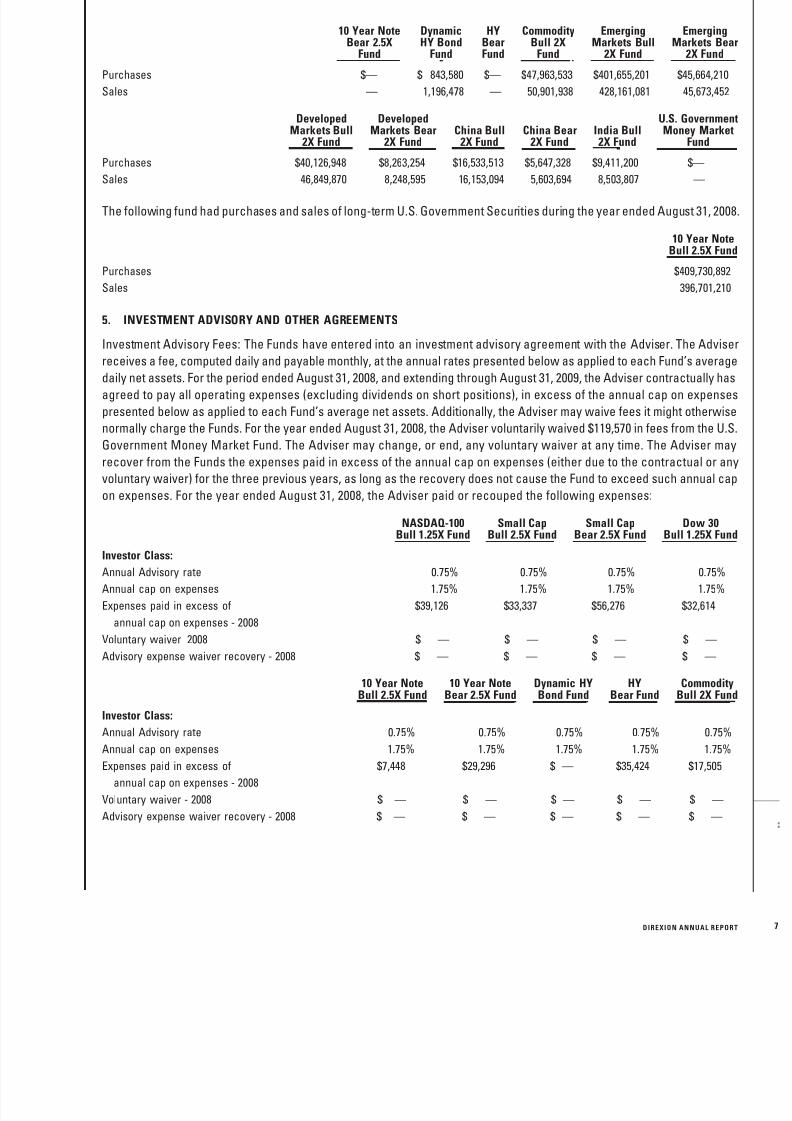
8/14/2019 Direxion Funds Annual Report - 2008
http://slidepdf.com/reader/full/direxion-funds-annual-report-2008 75/87
10 Year NoteBear 2.5X
Fund
DynamicHY Bond
Fund
HYBearFund
CommodityBull 2X
Fund
EmergingMarkets Bull
2X Fund
EmergingMarkets Bear
2X Fund
Purchases $— $ 843,580 $— $47,963,533 $401,655,201 $45,664,210
Sales — 1,196,478 — 50,901,938 428,161,081 45,673,452
DevelopedMarkets Bull
2X Fund
DevelopedMarkets Bear
2X FundChina Bull
2X FundChina Bear
2X FundIndia Bull
2X Fund
U.S. GovernmentMoney Market
Fund
Purchases $40,126,948 $8,263,254 $16,533,513 $5,647,328 $9,411,200 $—
Sales 46,849,870 8,248,595 16,153,094 5,603,694 8,503,807 —
The following fund had purchases and sales of long-term U.S. Government Securities during the year ended August 31, 2008.
10 Year NoteBull 2.5X Fund
Purchases $409,730,892
Sales 396,701,210
5. INVESTMENT ADVISORY AND OTHER AGREEMENTS
Investment Advisory Fees: The Funds have entered into an investment advisory agreement with the Adviser. The Adviser
receives a fee, computed daily and payable monthly, at the annual rates presented below as applied to each Fund’s average
daily net assets. For the period ended August 31, 2008, and extending through August 31, 2009, the Adviser contractually hasagreed to pay all operating expenses (excluding dividends on short positions), in excess of the annual cap on expenses
presented below as applied to each Fund’s average net assets. Additionally, the Adviser may waive fees it might otherwise
normally charge the Funds. For the year ended August 31, 2008, the Adviser voluntarily waived $119,570 in fees from the U.S.
Government Money Market Fund. The Adviser may change, or end, any voluntary waiver at any time. The Adviser may
recover from the Funds the expenses paid in excess of the annual cap on expenses (either due to the contractual or any
voluntary waiver) for the three previous years, as long as the recovery does not cause the Fund to exceed such annual cap
on expenses. For the year ended August 31, 2008, the Adviser paid or recouped the following expenses:
NASDAQ-100Bull 1.25X Fund
Small CapBull 2.5X Fund
Small CapBear 2.5X Fund
Dow 30Bull 1.25X Fund
Investor Class:
Annual Advisory rate 0.75% 0.75% 0.75% 0.75%Annual cap on expenses 1.75% 1.75% 1.75% 1.75%
Expenses paid in excess of $39,126 $33,337 $56,276 $32,614
annual cap on expenses - 2008
Voluntary waiver 2008 $ — $ — $ — $ —
Advisory expense waiver recovery - 2008 $ — $ — $ — $ —
10 Year NoteBull 2.5X Fund
10 Year NoteBear 2.5X Fund
Dynamic HYBond Fund
HYBear Fund
CommodityBull 2X Fund
Investor Class:
Annual Advisory rate 0.75% 0.75% 0.75% 0.75% 0.75%
Annual cap on expenses 1.75% 1.75% 1.75% 1.75% 1.75%
Expenses paid in excess of $7,448 $29,296 $ — $35,424 $17,505annual cap on expenses - 2008
Voluntary waiver - 2008 $ — $ — $ — $ — $ —
Advisory expense waiver recovery - 2008 $ — $ — $ — $ — $ —
D I REXI O N A NNU A L REPO RT
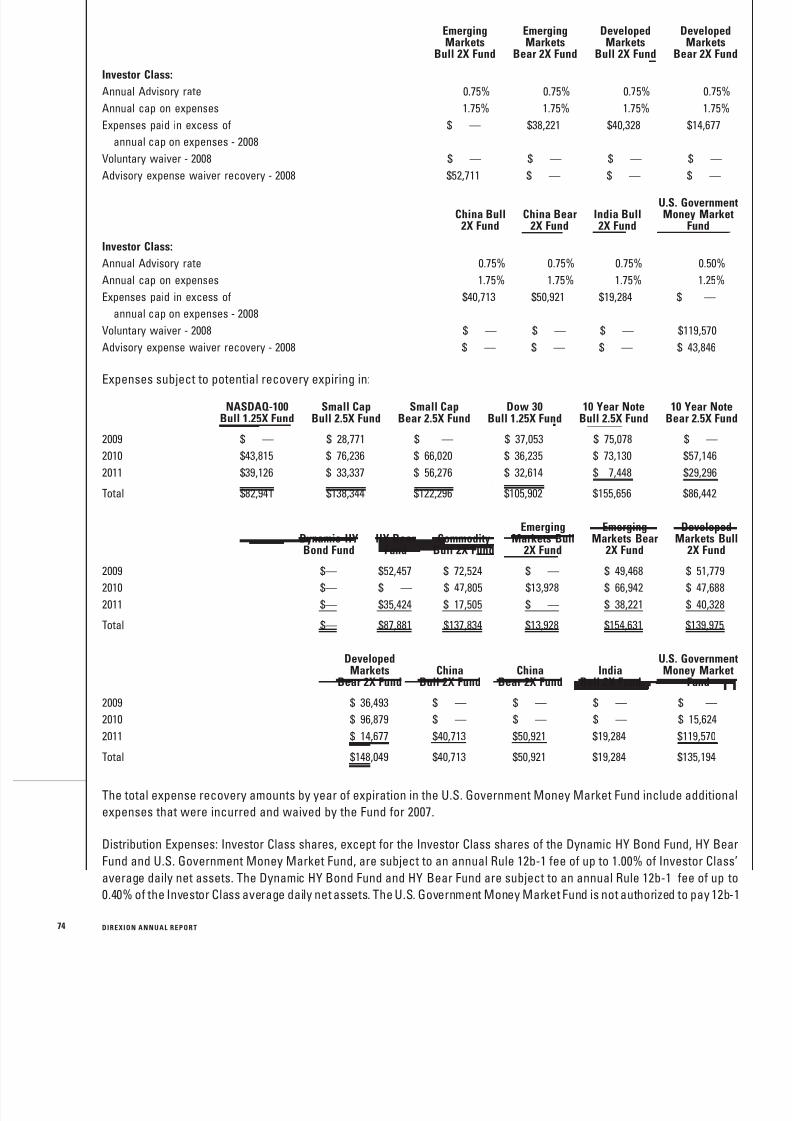
8/14/2019 Direxion Funds Annual Report - 2008
http://slidepdf.com/reader/full/direxion-funds-annual-report-2008 76/87
74
EmergingMarkets
Bull 2X Fund
EmergingMarkets
Bear 2X Fund
DevelopedMarkets
Bull 2X Fund
DevelopedMarkets
Bear 2X Fund
Investor Class:
Annual Advisory rate 0.75% 0.75% 0.75% 0.75%
Annual cap on expenses 1.75% 1.75% 1.75% 1.75%
Expenses paid in excess of $ — $38,221 $40,328 $14,677
annual cap on expenses - 2008
Voluntary waiver - 2008 $ — $ — $ — $ —
Advisory expense waiver recovery - 2008 $52,711 $ — $ — $ —
China Bull2X Fund
China Bear2X Fund
India Bull2X Fund
U.S. GovernmentMoney Market
Fund
Investor Class:
Annual Advisory rate 0.75% 0.75% 0.75% 0.50%
Annual cap on expenses 1.75% 1.75% 1.75% 1.25%
Expenses paid in excess of $40,713 $50,921 $19,284 $ —
annual cap on expenses - 2008
Voluntary waiver - 2008 $ — $ — $ — $119,570
Advisory expense waiver recovery - 2008 $ — $ — $ — $ 43,846
Expenses subject to potential recovery expiring in:
NASDAQ-100Bull 1.25X Fund
Small CapBull 2.5X Fund
Small CapBear 2.5X Fund
Dow 30Bull 1.25X Fund
10 Year NoteBull 2.5X Fund
10 Year NoteBear 2.5X Fund
2009 $ — $ 28,771 $ — $ 37,053 $ 75,078 $ —
2010 $43,815 $ 76,236 $ 66,020 $ 36,235 $ 73,130 $57,146
2011 $39,126 $ 33,337 $ 56,276 $ 32,614 $ 7,448 $29,296
Total $82,941 $138,344 $122,296 $105,902 $155,656 $86,442
Dynamic HYBond Fund
HY BearFund
CommodityBull 2X Fund
EmergingMarkets Bull
2X Fund
EmergingMarkets Bear
2X Fund
DevelopedMarkets Bull
2X Fund
2009 $— $52,457 $ 72,524 $ — $ 49,468 $ 51,7792010 $— $ — $ 47,805 $13,928 $ 66,942 $ 47,688
2011 $— $35,424 $ 17,505 $ — $ 38,221 $ 40,328
Total $— $87,881 $137,834 $13,928 $154,631 $139,975
DevelopedMarkets
Bear 2X FundChina
Bull 2X FundChina
Bear 2X FundIndia
Bull 2X Fund
U.S. GovernmentMoney Market
Fund
2009 $ 36,493 $ — $ — $ — $ —
2010 $ 96,879 $ — $ — $ — $ 15,624
2011 $ 14,677 $40,713 $50,921 $19,284 $119,570
Total $148,049 $40,713 $50,921 $19,284 $135,194
The total expense recovery amounts by year of expiration in the U.S. Government Money Market Fund include additional
expenses that were incurred and waived by the Fund for 2007.
Distribution Expenses: Investor Class shares, except for the Investor Class shares of the Dynamic HY Bond Fund, HY Bear
Fund and U.S. Government Money Market Fund, are subject to an annual Rule 12b-1 fee of up to 1.00% of Investor Class’
average daily net assets. The Dynamic HY Bond Fund and HY Bear Fund are subject to an annual Rule 12b-1 fee of up to
0.40% of the Investor Class average daily net assets. The U.S. Government Money Market Fund is not authorized to pay 12b-1
D I REXI O N A NNU A L REPO RT
8/14/2019 Direxion Funds Annual Report - 2008
http://slidepdf.com/reader/full/direxion-funds-annual-report-2008 77/87
fees. The Funds, except the U.S. Government Money Market Fund, currently pay a 12b-1 fee of 0.25% of the Investor Class
average daily net assets.
Shareholder Servicing Fees: The Board has also authorized each Fund’s Investor Class shares to pay a shareholder servicing
fee of 0.25% of each Fund’s Investor Class average daily net assets. The Trust, on behalf of each Fund, pays the fee to
financial institutions and other persons who provide services for and maintain shareholder accounts.
Rafferty Capital Markets, LLC (the “Distributor”) serves as principal underwriter of the Fund and acts as the Funds’ distributor
in a continuous public offering of the Funds’ shares. The Distributor is an affiliate of the Adviser.
A trading error of $108,209 occurred on a variance swap contract which was held in the Dynamic HY Bond Fund. The Adviserreimbursed the Fund for this loss. This amount is reflected on the Statement of Operations as Contribution by Affiliates and in
the Financial Highlights.
6. NEW ACCOUNTING PRONOUNCEMENTS
In September 2006, FASB issued its Statement on Financial Accounting Standards No. 157, Fair Value Measurements
(“FAS 157”). FAS 157 is designed to unify guidance for the measurement of fair value of all types of assets, including financia
instruments, and certain liabilities, throughout a number of accounting standards. FAS 157 also establishes a hierarchy for
measuring fair value in generally accepted accounting principles and expands financial statement disclosures about fair
value measurements that are relevant to mutual funds. FAS 157 is effective for financial statements issued for fiscal years
beginning after November 15, 2007, and earlier adoption is permitted. At this time, management is evaluating the implications
of FAS 157 and its impact on the financial statements has not yet been determined.
In March 2008, FASB issued its Statement on Financial Accounting Standards No. 161, “Disclosures about Derivatives
Instruments and Hedging Activities” (“SFAS 161”). This standard is intended to enhance financial statement disclosure for
derivative instruments and hedging activities and enable investors to understand: a) how and why a fund uses derivatives
instruments, b) how derivatives instruments and related hedge items are accounted for, and c) how derivative instruments
and statements issued for fiscal years and interim periods beginning after November 15, 2008. As of August 31, 2008,
management does not believe the adoption of SFAS No. 161 will impact the financial statement amounts; however, additiona
footnote disclosures will be required about the use of derivative instruments and hedge items.
7. SUBSEQUENT EVENTS
The Board of Trustees of the Trust, based upon the recommendation of management, determined to close three of its series, the NASDAQ-100» Bull 1.25X Fund, Dow 30SM Bull 1.25X Fund and China Bear 2X Fund. These Funds will be closed to new
investments after November 3, 2008 and will be liquidated on November 14, 2008.
The U.S. Treasury Department has established a Temporary Guarantee Program for Money Market Funds. Under this
program, the U.S. Treasury will guarantee to investors that they will receive $1 for each money market share held as of close
of business on September 19, 2008. The Board of Trustees of the Trust has approved participation in the program on behalf of
the shareholders of the U.S. Government Money Market Fund (the “Fund”). This program covers all shareholders in the Fund
as of close of business on September 19, 2008. Management believes the risk of the net asset value falling below $1 in the
Fund is minimal.
D I REXI O N A NNU A L REPO RT
8/14/2019 Direxion Funds Annual Report - 2008
http://slidepdf.com/reader/full/direxion-funds-annual-report-2008 78/87
76
DIREXION FUNDS
REPORT OF INDEPENDENT REGISTERED PUBLIC ACCOUNTING FIRM
To the Shareholders and
Board of Trustees of the Direxion Funds:
We have audited the accompanying statement of assets and liabilities of the NASDAQ-100 Bull 1.25x Fund, Small Cap Bull
2.5X Fund, Small Cap Bear 2.5X Fund, Dow 30 Bull 1.25X Fund, 10-Year Note Bull 2.5X Fund, 10-Year Note Bear 2.5X Fund,
Dynamic HY Bond Fund, HY Bear Fund, Commodity Bull 2X Fund, Emerging Markets Bull 2X Fund, Emerging Markets Bear 2X
Fund, Developed Markets Bull 2X Fund, Developed Markets Bear 2X Fund, China Bull 2X Fund, China Bear 2X Fund, India Bul
2X Fund, and U.S. Government Money Market Fund (17 of the series constituting Direxion Funds) (the “Funds”), including the
schedules of investments, as of August 31, 2008, and the related statements of operations, the statements of changes in net
assets, and the financial highlights for each of the periods indicated therein. These financial statements and financial
highlights are the responsibility of the Funds’ management. Our responsibility is to express an opinion on these financial
statements and financial highlights based on our audits.
We conducted our audits in accordance with the standards of the Public Company Accounting Oversight Board
(United States). Those standards require that we plan and perform the audit to obtain reasonable assurance about whether
the financial statements and financial highlights are free of material misstatement. We were not engaged to perform an aud
of the Funds’ internal control over financial reporting. Our audits included consideration of internal control over financia
reporting as a basis for designing audit procedures that are appropriate in the circumstances, but not for the purpose of
expressing an opinion on the effectiveness of the Funds’ internal control over financial reporting. Accordingly, we express nosuch opinion. An audit also includes examining, on a test basis, evidence supporting the amounts and disclosures in the
financial statements and financial highlights, assessing the accounting principles used and significant estimates made by
management, and evaluating the overall financial statement presentation. Our procedures included confirmation of
securities owned as of August 31, 2008, by correspondence with the custodian and brokers or by other appropriate
auditing procedures where replies from brokers were not received. We believe that our audits provide a reasonable basis for
our opinion.
In our opinion, the financial statements and financial highlights referred to above present fairly, in all material respects, the
financial position of the above mentioned 17 series of Direxion Funds at August 31, 2008, the results of their operations, the
changes in their net assets, and the financial highlights for each of the periods indicated therein in conformity with
U.S. generally accepted accounting principles.
October 24, 2008
Milwaukee, Wisconsin
D I REXI O N A NNU A L REPO RT
8/14/2019 Direxion Funds Annual Report - 2008
http://slidepdf.com/reader/full/direxion-funds-annual-report-2008 79/87
ADDITIONAL INFORMATION
(UNAUDITED)
QUALIFIED DIVIDEND INCOME/DIVIDENDS RECEIVED DEDUCTION
For the year ended August 31, 2008, certain dividends paid by the Funds may be subject to a maximum tax rate of 15%, as
provided for by the Jobs and Growth Tax Relief Reconciliation Act of 2003. The percentage of dividends declared from
ordinary income designated as qualified income was as follows:
NASDAQ-100 Bull 1.25X Fund . . . . . . . . . . . . . . . . . . . . . . . . . . . . . . . . . . . . . . . . . . . . . . . . . . . . . . . . . . . . . . . . . . . . . . . . 0.0
Small Cap Bull 2.5X Fund . . . . . . . . . . . . . . . . . . . . . . . . . . . . . . . . . . . . . . . . . . . . . . . . . . . . . . . . . . . . . . . . . . . . . . . . . . . 0.0Small Cap Bear 2.5X Fund . . . . . . . . . . . . . . . . . . . . . . . . . . . . . . . . . . . . . . . . . . . . . . . . . . . . . . . . . . . . . . . . . . . . . . . . . . 0.0
Dow 30 Bull 1.25X Fund . . . . . . . . . . . . . . . . . . . . . . . . . . . . . . . . . . . . . . . . . . . . . . . . . . . . . . . . . . . . . . . . . . . . . . . . . . . . 100.0
10 Year Note Bull 2.5X Fund . . . . . . . . . . . . . . . . . . . . . . . . . . . . . . . . . . . . . . . . . . . . . . . . . . . . . . . . . . . . . . . . . . . . . . . . . 0.0
10 Year Note Bear 2.5X Fund . . . . . . . . . . . . . . . . . . . . . . . . . . . . . . . . . . . . . . . . . . . . . . . . . . . . . . . . . . . . . . . . . . . . . . . . 0.0
Dynamic HY Bond Fund . . . . . . . . . . . . . . . . . . . . . . . . . . . . . . . . . . . . . . . . . . . . . . . . . . . . . . . . . . . . . . . . . . . . . . . . . . . . 0.0
HY Bear Fund . . . . . . . . . . . . . . . . . . . . . . . . . . . . . . . . . . . . . . . . . . . . . . . . . . . . . . . . . . . . . . . . . . . . . . . . . . . . . . . . . . . 0.0
Commodity Bull 2X Fund. . . . . . . . . . . . . . . . . . . . . . . . . . . . . . . . . . . . . . . . . . . . . . . . . . . . . . . . . . . . . . . . . . . . . . . . . . . . 3.8
Emerging Markets Bull 2X Fund . . . . . . . . . . . . . . . . . . . . . . . . . . . . . . . . . . . . . . . . . . . . . . . . . . . . . . . . . . . . . . . . . . . . . . 1.9
Emerging Markets Bear 2X Fund . . . . . . . . . . . . . . . . . . . . . . . . . . . . . . . . . . . . . . . . . . . . . . . . . . . . . . . . . . . . . . . . . . . . . 0.0
Developed Markets Bull 2X Fund . . . . . . . . . . . . . . . . . . . . . . . . . . . . . . . . . . . . . . . . . . . . . . . . . . . . . . . . . . . . . . . . . . . . . 6.3
Developed Markets Bear 2X Fund. . . . . . . . . . . . . . . . . . . . . . . . . . . . . . . . . . . . . . . . . . . . . . . . . . . . . . . . . . . . . . . . . . . . . 0.0China Bull 2X Fund. . . . . . . . . . . . . . . . . . . . . . . . . . . . . . . . . . . . . . . . . . . . . . . . . . . . . . . . . . . . . . . . . . . . . . . . . . . . . . . . 0.0
China Bear 2X Fund . . . . . . . . . . . . . . . . . . . . . . . . . . . . . . . . . . . . . . . . . . . . . . . . . . . . . . . . . . . . . . . . . . . . . . . . . . . . . . . 0.0
India Bull 2X Fund . . . . . . . . . . . . . . . . . . . . . . . . . . . . . . . . . . . . . . . . . . . . . . . . . . . . . . . . . . . . . . . . . . . . . . . . . . . . . . . . 0.0
U.S. Government Money Market Fund. . . . . . . . . . . . . . . . . . . . . . . . . . . . . . . . . . . . . . . . . . . . . . . . . . . . . . . . . . . . . . . . . . 0.0
For corporate shareholders, the percent of ordinary income distributions qualifying for the corporate dividends received
deduction for the year ended August 31, 2008, was as follows:
NASDAQ-100 Bull 1.25X Fund . . . . . . . . . . . . . . . . . . . . . . . . . . . . . . . . . . . . . . . . . . . . . . . . . . . . . . . . . . . . . . . . . . . . . . . . 0.0
Small Cap Bull 2.5X Fund . . . . . . . . . . . . . . . . . . . . . . . . . . . . . . . . . . . . . . . . . . . . . . . . . . . . . . . . . . . . . . . . . . . . . . . . . . . 0.0
Small Cap Bear 2.5X Fund . . . . . . . . . . . . . . . . . . . . . . . . . . . . . . . . . . . . . . . . . . . . . . . . . . . . . . . . . . . . . . . . . . . . . . . . . . 0.0
Dow 30 Bull 1.25X Fund . . . . . . . . . . . . . . . . . . . . . . . . . . . . . . . . . . . . . . . . . . . . . . . . . . . . . . . . . . . . . . . . . . . . . . . . . . . . 100.010 Year Note Bull 2.5X Fund . . . . . . . . . . . . . . . . . . . . . . . . . . . . . . . . . . . . . . . . . . . . . . . . . . . . . . . . . . . . . . . . . . . . . . . . . 0.0
10 Year Note Bear 2.5X Fund . . . . . . . . . . . . . . . . . . . . . . . . . . . . . . . . . . . . . . . . . . . . . . . . . . . . . . . . . . . . . . . . . . . . . . . . 0.0
Dynamic HY Bond Fund . . . . . . . . . . . . . . . . . . . . . . . . . . . . . . . . . . . . . . . . . . . . . . . . . . . . . . . . . . . . . . . . . . . . . . . . . . . . 0.0
HY Bear Fund . . . . . . . . . . . . . . . . . . . . . . . . . . . . . . . . . . . . . . . . . . . . . . . . . . . . . . . . . . . . . . . . . . . . . . . . . . . . . . . . . . . 0.0
Commodity Bull 2X Fund. . . . . . . . . . . . . . . . . . . . . . . . . . . . . . . . . . . . . . . . . . . . . . . . . . . . . . . . . . . . . . . . . . . . . . . . . . . . 3.2
Emerging Markets Bull 2X Fund . . . . . . . . . . . . . . . . . . . . . . . . . . . . . . . . . . . . . . . . . . . . . . . . . . . . . . . . . . . . . . . . . . . . . . 1.9
Emerging Markets Bear 2X Fund . . . . . . . . . . . . . . . . . . . . . . . . . . . . . . . . . . . . . . . . . . . . . . . . . . . . . . . . . . . . . . . . . . . . . 0.0
Developed Markets Bull 2X Fund . . . . . . . . . . . . . . . . . . . . . . . . . . . . . . . . . . . . . . . . . . . . . . . . . . . . . . . . . . . . . . . . . . . . . 6.3
Developed Markets Bear 2X Fund. . . . . . . . . . . . . . . . . . . . . . . . . . . . . . . . . . . . . . . . . . . . . . . . . . . . . . . . . . . . . . . . . . . . . 0.0
China Bull 2X Fund. . . . . . . . . . . . . . . . . . . . . . . . . . . . . . . . . . . . . . . . . . . . . . . . . . . . . . . . . . . . . . . . . . . . . . . . . . . . . . . . 0.0
China Bear 2X Fund . . . . . . . . . . . . . . . . . . . . . . . . . . . . . . . . . . . . . . . . . . . . . . . . . . . . . . . . . . . . . . . . . . . . . . . . . . . . . . . 0.0
India Bull 2X Fund . . . . . . . . . . . . . . . . . . . . . . . . . . . . . . . . . . . . . . . . . . . . . . . . . . . . . . . . . . . . . . . . . . . . . . . . . . . . . . . . 0.0
U.S. Government Money Market Fund. . . . . . . . . . . . . . . . . . . . . . . . . . . . . . . . . . . . . . . . . . . . . . . . . . . . . . . . . . . . . . . . . . 0.0
D I REXI O N A NNU A L REPO RT
8/14/2019 Direxion Funds Annual Report - 2008
http://slidepdf.com/reader/full/direxion-funds-annual-report-2008 80/87
INVESTMENT ADVISORY AGREEMENT APPROVAL
Provided below is a summary of certain of the factors the Board considered at its August 13, 2008 Board meeting in renewing
the Advisory Agreement (the “Agreement”) between Rafferty Asset Management (“Rafferty”) and the Direxion Funds (the
“Trust”), on behalf of Small Cap Bull 2.5X Fund, Small Cap Bear 2.5X Fund, NASDAQ 100 Bull 1.25X Fund, Dow 30 Bull 1.25X
Fund, India Bull 2X Fund, Emerging Markets Bull 2X Fund, Emerging Markets Bear 2X Fund, Developed Markets Bull 2X Fund,
Developed Markets Bear 2X Fund, Commodity Bull 2X Fund, 10 Year Note Bull 2.5X Fund, 10 Year Note Bear 2.5X Fund,
Dynamic HY Bond Fund, HY Bear Fund and U.S. Government Money Market Fund (each a “Fund” and collectively, the
“Funds”), each a series of the Trust. In addition, at its August 15, 2007 Board meeting, the Board approved the Advisory
Agreement between Rafferty and the Trust on behalf of the India Bull 2X Fund. Each Fund, except Dynamic HY Bond Fund, HY
Bear Fund and U.S. Government Money Market Fund, also are referred to as a “Leveraged-Index Fund.” The Dynamic HYBond, HY Bear Fund and U.S. Government Money Market Fund also are referred to as a “Non-Leveraged Fund.”
The Board did not identify any particular information that was most relevant to its consideration to approve the Agreement
and each Trustee may have afforded different weight to the various factors. The Board noted that certain Funds as indicated
in the Exhibits were not operational. In these instances, the Board considered primarily the services to be provided by
Rafferty, management fee rates to be paid to Rafferty and each Fund’s estimated expenses. Because these Funds have not
commenced operations, they do not have any prior performance history and Rafferty does not have any profit data.
In determining whether to approve the continuance of the Agreement, the Board considered the best interests of each Fund
separately. In addition, the Board noted that the Trustees have considered various reports and information provided
throughout the year at their regular Board meetings and otherwise. While the Agreement for all of the Funds was considered
at the same Board meeting, the Board considered each Fund’s investment advisory relationship separately. In each instance,
the Board considered, among other things, the following factors: (1) the nature and quality of the services provided; (2) the
investment performance of the Fund to the extent applicable; (3) the cost to Rafferty for providing services and the
profitability of the advisory business to Rafferty, if such information was provided; (4) the extent to which economies of scale
have been taken into account in setting fee schedules; (5) whether fee levels reflect these economies of scale, if any, for the
benefit of Fund shareholders; (6) comparisons of services and fees with contracts entered into by Rafferty with other clients
(such as pension funds and other institutional investors), if any; and (7) other benefits derived or anticipated to be derived by
Rafferty from its relationship with the Funds.
Nature, Extent and Quality of Services Provided. The Board reviewed the nature, extent and quality of the services provided
or to be provided under the Agreement by Rafferty. The Board noted that Rafferty has provided services to the Trusts since
their inception and has developed an expertise in managing the Funds, particularly those using a leveraged strategy. The
Board also noted that Rafferty trades efficiently with low commission schedules, which helps improve performance results
The Board considered Rafferty’s representation that it has the financial resources and appropriate staffing to manage the
Funds and meet its expense reimbursement obligations, if any. The Board also considered that Rafferty had enhanced the
compliance programs of the Trust by utilizing the services of an independent compliance consulting firm and that a report
from the chief compliance officer are provided to the Board at its regularly scheduled quarterly Board meetings. The Board
noted Rafferty’s marketing and distribution efforts, including offering additional investment options to shareholders through
the creation of new funds and promoting the Funds through new broker and platform relationships. The Board considered
that Rafferty oversees all aspects of the operation of the Funds, including oversight of the Funds’ service providers.
Based on these and other considerations, the Board determined that, in the exercise of its business judgment, the nature,
extent and quality of the services provided by Rafferty to the Funds under the Agreement were fair and reasonable.
Performance of the Funds. The Board evaluated the performance of those leveraged-index Funds with a performance
history relative to performance models and/or relevant market indices for monthly periods and the year-to-date period endedJuly 31, 2008. The Board considered Rafferty’s explanation that the leveraged-index Funds’ performance is more accurately
compared to the models rather than to the market indices. In addition, unless otherwise noted, the Board also evaluated the
performance of certain of the leveraged-index Funds and non-leveraged Funds to the average performance of the relevant
Lipper fund universe for the one-, three- and six-month periods ended July 31, 2008 and the one-, three- and five-year periods
ended July 31, 2008 to the extent such data was available. The Board also considered Rafferty’s explanation that the
leveraged-index Funds are difficult to categorize with other Lipper peer group funds because the Funds seek daily investment
78 D I REXI O N A NNU A L REPO RT
8/14/2019 Direxion Funds Annual Report - 2008
http://slidepdf.com/reader/full/direxion-funds-annual-report-2008 81/87
results and the Lipper peer group funds generally do not. Although the Board received monthly performance reports for its
consideration, the Board generally assigned more weight to the longer-term performance of the Funds.
Leveraged-Index Funds:
With respect to the NASDAQ 100 1.25X Bull Fund, the Board considered that: (1) the Fund outperformed its model but
underperformed its benchmark index; and (2) the Fund outperformed its peer group for all relevant periods, except the five-
year period.
With respect to the Small Cap Bull 2.5X Fund, the Board considered that: (1) the Fund outperformed its model but
underperformed its benchmark index; and (2) the Fund outperformed the average of the relevant Lipper fund universe
for the one-month, three-month, and six-month periods, but underperformed for the one-year, three-year and five-year
periods.
With respect to the Small Cap Bear 2.5X Fund, the Board considered that: (1) the Fund underperformed its model but
outperformed its benchmark index; and (2) the Fund underperformed the average of the relevant Lipper fund universe for all
relevant periods.
With respect to the 10 Year Note Bull 2.5X Fund, the Board considered that the Fund underperformed its model but
outperformed its benchmark index.
With respect to the 10 Year Note Bear 2.5X Fund, the Board considered that: (1) the Fund outperformed its model but
underperformed its benchmark index; and (2) the Fund underperformed the average of the relevant Lipper fund universe for
all relevant periods.
With respect to the Dow 30 Bull 1.25X Fund, the Board considered that: (1) the Fund outperformed its model butunderperformed its benchmark index; and (2) the Fund outperformed the average of the relevant Lipper fund universe
for the one-month, one-year and three-year periods but underperformed for the three-month, six-month and five-year
periods.
With respect to the Commodity Bull 2X Fund, the Board considered that: (1) the Fund outperformed its model but
underperformed its benchmark index; and (2) the Fund outperformed the average of the relevant Lipper fund universe
for all relevant periods, except the one-month period.
With respect to the Developed Markets Bull 2X Fund, the Board considered that: (1) the Fund outperformed its model but
underperformed its benchmark index; and (2) the Fund underperformed the average of the relevant Lipper fund universe for
all relevant periods.
With respect to the Developed Markets Bear 2X Fund, the Board considered that: (1) the Fund underperformed its model butoutperformed its benchmark index; and (2) the Fund outperformed the average of the relevant Lipper fund universe for all
relevant periods.
With respect to the Emerging Markets Bull 2X Fund, the Board considered that: (1) the Fund outperformed its model but
underperformed its benchmark index; and (2) the Fund outperformed the average of the relevant Lipper fund universe for all
relevant periods, except the one-year period.
With respect to the Emerging Markets Bear 2X Fund, the Board considered that: (1) the Fund outperformed its model and
benchmark index; and (2) the Fund underperformed the average of the relevant Lipper fund universe for all relevant periods
Non-Leveraged Funds:
With respect to the Dynamic HY Bond Fund, the Board considered management’s description of the performance of the
Lipper universe of high current yield funds. The Board considered that, as of June 30, 2008: (1) the Fund outperformed its
benchmark index for the one-month and three-month periods, but underperformed for the six-month and year-to-date
periods; and (2) the Fund outperformed the average of the relevant Lipper fund universe for the one-month and three-month
periods, but underperformed for the six-month and year-to-date periods.
With respect to the HY Bear Fund, the Board considered that the Fund underperformed the average of the relevant Lipper
fund universe for all relevant periods.
D I REXI O N A NNU A L REPO RT
8/14/2019 Direxion Funds Annual Report - 2008
http://slidepdf.com/reader/full/direxion-funds-annual-report-2008 82/87
With respect to the U.S. Government Money Market Fund, the Board considered management’s description that, in order to
provide security of principal, current income and liquidity, the Fund typically invests in obligations issued or guaranteed by
the U.S. government and its agencies, U.S. government-sponsored enterprises and repurchase agreements that are fully
collateralized by such obligations.
Costs of Services Provided to the Funds and Profits Realized. The Board considered the overall fees paid to Rafferty on an
annual basis since each Fund’s commencement of operations, including any fee waivers and recoupment of fees previously
waived. With respect to the leveraged-index Funds and non-leveraged Funds, the Board also considered advisory fees
charged by, and total expense ratios of, comparable fund groups. In this regard, management advised the Board that the
advisory fees for each of these Funds is similar to and, in some cases lower than, the advisory fees for the comparable fund
groups. The Board also considered that the total expense ratio for each leveraged-index Fund and non-leveraged Fund isgenerally higher than comparable funds. However, Rafferty indicated that the comparable fund groups have higher asset
levels, which account for the lower total expense ratios. The Board also noted that Rafferty does not have any non-mutual
fund clients, except for one hedge fund client. In this connection, the Board considered that Rafferty charges higher fees for
that hedge fund compared to the advisory fees of these Funds. The Board also considered that Rafferty contractually agreed
to limit the total expenses for the most recent and upcoming fiscal years for each leveraged-index Fund and non-leveraged
Fund via fee waivers and/or expense limitations. The Board also considered the overall profitability of Rafferty’s investment
business and its representation that it does not allocate internal costs and assess profitability with respect to its services to
individual Funds. Based on these considerations, the Board determined that, in the exercise of its business judgment, the
costs of the services provided and the profits realized under the Agreement were fair and reasonable.
Economies of Scale. The Board considered Rafferty’s representation that it believes that asset levels at this time are not
sufficient to achieve economies of scale or warrant a reduction in fee rates or the addition of breakpoints. Rafferty noted thatit was continuing to work on its sales and marketing efforts to raise additional assets. Based on these and other
considerations, the Board determined that, in the exercise of its business judgment, the reduction in fee rates or additions
of breakpoints were not necessary at this time.
Other Benefits. The Board considered Rafferty’s representation that its relationship with the Funds has permitted Rafferty
to attract business to its non-mutual fund account. The Board also considered that Rafferty’s overall business with brokerage
firms helps to lower commission rates and provide better execution for Fund portfolio transactions. Based on these and other
considerations, the Board determined that, in the exercise of its business judgment, the benefits were fair and reasonable.
Conclusion. Based on, but not limited to, the above considerations and determinations, the Board determined that the
Agreement for the Funds was fair and reasonable in light of the services to be performed, fees, expenses and such other
matters as the Board considered relevant in the exercise of its business judgment. On this basis, the Board unanimously
voted in favor of the continuance of the Agreement.
80 D I REXI O N A NNU A L REPO RT
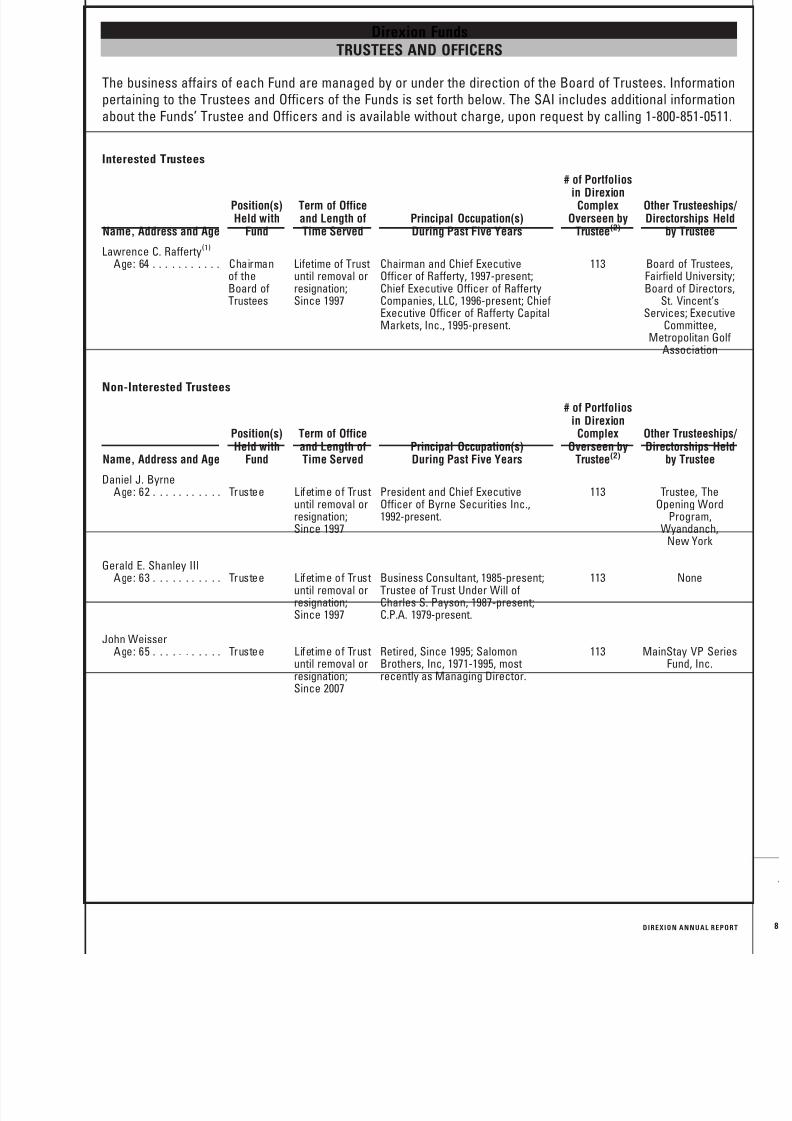
8/14/2019 Direxion Funds Annual Report - 2008
http://slidepdf.com/reader/full/direxion-funds-annual-report-2008 83/87
Direxion FundsTRUSTEES AND OFFICERS
The business affairs of each Fund are managed by or under the direction of the Board of Trustees. Informationpertaining to the Trustees and Officers of the Funds is set forth below. The SAI includes additional informationabout the Funds’ Trustee and Officers and is available without charge, upon request by calling 1-800-851-0511.
Interested Trustees
Name, Address and Age
Position(s)Held with
Fund
Term of Officeand Length ofTime Served
Principal Occupation(s)During Past Five Years
# of Portfolios
in DirexionComplex
Overseen byTrustee(2)
Other Trusteeships/Directorships Held
by Trustee
Lawrence C. Rafferty(1)
Age: 64 . . . . . . . . . . . Chairmanof theBoard ofTrustees
Lifetime of Trustuntil removal orresignation;Since 1997
Chairman and Chief ExecutiveOfficer of Rafferty, 1997-present;Chief Executive Officer of RaffertyCompanies, LLC, 1996-present; ChiefExecutive Officer of Rafferty CapitalMarkets, Inc., 1995-present.
113 Board of Trustees,Fairfield University;Board of Directors,
St. Vincent’sServices; Executive
Committee,Metropolitan Golf
Association
Non-Interested Trustees
Name, Address and Age
Position(s)Held with
Fund
Term of Officeand Length ofTime Served
Principal Occupation(s)During Past Five Years
# of Portfoliosin Direxion
ComplexOverseen by
Trustee(2)
Other Trusteeships/Directorships Held
by Trustee
Daniel J. ByrneAge: 62 . . . . . . . . . . . Trustee Lifetime of Trust
until removal orresignation;Since 1997
President and Chief ExecutiveOfficer of Byrne Securities Inc.,1992-present.
113 Trustee, TheOpening Word
Program,Wyandanch,
New York
Gerald E. Shanley III
Age: 63 . . . . . . . . . . . Trustee Lifetime of Trustuntil removal orresignation;Since 1997
Business Consultant, 1985-present;Trustee of Trust Under Will ofCharles S. Payson, 1987-present;C.P.A. 1979-present.
113 None
John WeisserAge: 65 . . . . . . . . . . . Trustee Lifetime of Trust
until removal orresignation;Since 2007
Retired, Since 1995; SalomonBrothers, Inc, 1971-1995, mostrecently as Managing Director.
113 MainStay VP SeriesFund, Inc.
D I REXI O N A NNU A L REPO RT
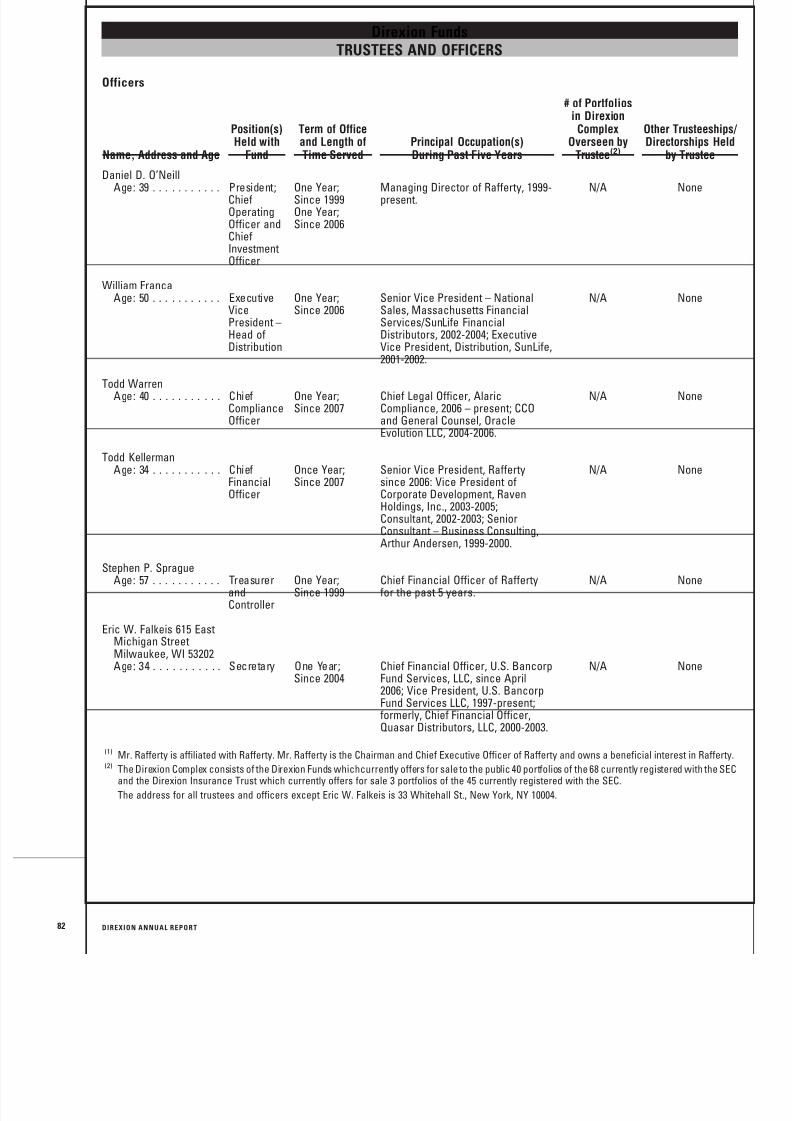
8/14/2019 Direxion Funds Annual Report - 2008
http://slidepdf.com/reader/full/direxion-funds-annual-report-2008 84/87
82
Officers
Name, Address and Age
Position(s)Held with
Fund
Term of Officeand Length ofTime Served
Principal Occupation(s)During Past Five Years
# of Portfoliosin Direxion
ComplexOverseen by
Trustee(2)
Other Trusteeships/Directorships Held
by Trustee
Daniel D. O’Neill
Age: 39 . . . . . . . . . . . President;ChiefOperatingOfficer andChiefInvestmentOfficer
One Year;Since 1999One Year;Since 2006
Managing Director of Rafferty, 1999-present. N/A None
William FrancaAge: 50 . . . . . . . . . . . Executive
VicePresident –Head ofDistribution
One Year;Since 2006
Senior Vice President – NationalSales, Massachusetts FinancialServices/SunLife FinancialDistributors, 2002-2004; ExecutiveVice President, Distribution, SunLife,2001-2002.
N/A None
Todd WarrenAge: 40 . . . . . . . . . . . Chief
ComplianceOfficer
One Year;Since 2007
Chief Legal Officer, AlaricCompliance, 2006 – present; CCOand General Counsel, OracleEvolution LLC, 2004-2006.
N/A None
Todd KellermanAge: 34 . . . . . . . . . . . Chief
FinancialOfficer
Once Year;Since 2007
Senior Vice President, Raffertysince 2006: Vice President ofCorporate Development, RavenHoldings, Inc., 2003-2005;Consultant, 2002-2003; SeniorConsultant – Business Consulting,Arthur Andersen, 1999-2000.
N/A None
Stephen P. SpragueAge: 57 . . . . . . . . . . . Treasurer
andController
One Year;Since 1999
Chief Financial Officer of Raffertyfor the past 5 years.
N/A None
Eric W. Falkeis 615 EastMichigan StreetMilwaukee, WI 53202Age: 34 . . . . . . . . . . . Secretary One Year;
Since 2004Chief Financial Officer, U.S. BancorpFund Services, LLC, since April2006; Vice President, U.S. BancorpFund Services LLC, 1997-present;formerly, Chief Financial Officer,Quasar Distributors, LLC, 2000-2003.
N/A None
(1) Mr. Rafferty is affiliated with Rafferty. Mr. Rafferty is the Chairman and Chief Executive Officer of Rafferty and owns a beneficial interest in Rafferty.
(2) The Direxion Complex consists of the Direxion Funds whichcurrently offers for sale to the public 40 portfolios of the 68 currently registered with the SECand the Direxion Insurance Trust which currently offers for sale 3 portfolios of the 45 currently registered with the SEC.
The address for all trustees and officers except Eric W. Falkeis is 33 Whitehall St., New York, NY 10004.
D I REXI O N A NNU A L REPO RT
Direxion FundsTRUSTEES AND OFFICERS

8/14/2019 Direxion Funds Annual Report - 2008
http://slidepdf.com/reader/full/direxion-funds-annual-report-2008 85/87
T H I S P A G E I N T E N T I O N A L LY L E F T B L A N K

8/14/2019 Direxion Funds Annual Report - 2008
http://slidepdf.com/reader/full/direxion-funds-annual-report-2008 86/87
84
T H I S P A G E I N T E N T I O N A L LY L E F T B L A N K
8/14/2019 Direxion Funds Annual Report - 2008
http://slidepdf.com/reader/full/direxion-funds-annual-report-2008 87/87
A N N U A L R E P O R T A U G U S T 3 1 , 2 0 0 833 Whitehall Street, 10th Floor New York, New York 10004 (800) 851-0511
Investment AdviserRafferty Asset Management, LLC33 Whitehall St. 10th FloorNew York, NY 10004
Administrator, Transfer Agent, DividendPaying Agent & Shareholding ServicingAgentU.S. Bancorp Fund Services, LLC
P.O. Box 1993Milwaukee, WI 53201-1993
CustodianU.S. Bank, N.A.1555 RiverCenter Dr., Suite 302Milwaukee, WI 53212
Independent Registered Public Accounting FirmErnst & Young LLP875 E. Wisconsin AvenueMilwaukee, WI 53202
DistributorRafferty Capital Markets, LLC59 Hilton AvenueGarden City, NY 11530
The Fund’s Proxy Voting Policies are available withoutcharge by calling 1-800-851-0511, or by accessing theSEC’s website, at www.sec.gov.
The actual voting records relating to portfolio securi- ties during the most recent period ended June 30( t ti ith th d d J 30 2005) i il