direct solar spectral irradiance and transmittance measurements from 350 to 2500 nm
TRANSCRIPT

Direct solar spectral irradiance and transmittancemeasurements from 350 to 2500 nm
Bruce C. Kindel, Zheng Qu, and Alexander F. H. Goetz
A radiometrically stable, commercially available spectroradiometer was used in conjunction with asimple, custom-designed telescope to make spectrally continuous measurements of solar spectral trans-mittance and directly transmitted solar spectral irradiance. The wavelength range of the instrument is350–2500 nm and the resolution is 3–11.7 nm. Laboratory radiometric calibrations show the instru-ment to be stable to better than 1.0% over a nine-month period. The instrument and telescope are highlyportable, can be set up in a matter of minutes, and can be operated by one person. A method ofabsolute radiometric calibration that can be tied to published top-of-the-atmosphere ~TOA! solar spectrain valid Langley channels as well as regions of strong molecular absorption is also presented. High-altitude Langley plot calibration experiments indicate that this technique is limited ultimately by thecurrent uncertainties in the TOA solar spectra, approximately 2–3%. Example comparisons of mea-sured and MODTRAN-modeled direct solar irradiance show that the model can be parameterized to agreewith measurements over the large majority of the wavelength range to the 3% level for the two examplecases shown. Side-by-side comparisons with a filter-based solar radiometer are in excellent agreement,with a mean absolute difference of t 5 0.0036 for eight overlapping wavelengths over three experimentdays. © 2001 Optical Society of America
OCIS codes: 010.1320, 010.1110, 120.5630, 300.6190.
micsr
1. Introduction
Traditionally, the measurement of extinction of solarradiation by the various constituents of the Earth’satmosphere by sunphotometry or, more properly, so-lar radiometry has been undertaken with filter-basedinstruments. These instruments typically containrelatively narrow-bandpass ~,10-nm! filters that areevenly distributed through the shorter wavelengths~300 to ;1000 nm! of the solar spectrum, placed care-fully to avoid regions of strong molecular absorption.They may also contain a channel placed inside awater-vapor absorption region ~e.g., 940 nm! to inferwater-vapor amount. The measurements of aerosoloptical depth and water-vapor amount are used toconstrain atmospheric radiative transfer models usedin, for example, radiation budget studies, remote
All the authors are with the University of Colorado at Boulder,Campus Box 216, Boulder, Colorado 80309-0216. B. C. [email protected]!, Z. Qu, A. F. H. Goetz are with theCenter for the Study of Earth from Space, Cooperative Institute forResearch in Environmental Sciences. A. F. H. Goetz is also withthe Department of Geological Sciences.
Received 28 November 2000; revised manuscript received 11April 2001.
0003-6935y01y213483-12$15.00y0© 2001 Optical Society of America
sensing ground reflectance retrievals, and satellitesensor calibration studies.
More recently, instruments based on prisms or dif-fraction gratings in conjunction with photodiode ar-rays are being utilized to make spectrally continuoustransmittance and irradiance measurements.1–3 Wepresent the use of a commercially available spectrora-diometer with a custom-designed telescope that signif-icantly extends solar spectral extinction andirradiance measurements to 2500 nm. The wave-length range of this instrument, 350–2500 nm, encom-passes 1273 Wm22 or 92% of the Sun’s radiant energybefore interaction with the terrestrial atmosphere.In addition to the parameters usually determined bysolar radiometry ~e.g., aerosol optical depth, ozone andwater-vapor amount, aerosol size distribution!, these
easurements will permit the direct determination ofn-band spectral transmittance for virtually all theurrent Earth-observing instruments with coarserpectral resolution. These include the moderate-esolution imaging spectroradiometer4 ~MODIS!, the
Multiangle Imaging Spectroradiometer4 ~MISR!, andthe advanced spaceborne thermal emission and reflec-tion radiometer4 ~ASTER! on the Earth ObservingPlatform AM-1, the Landsat Thematic Mapper,5 theimaging spectrometer HYPERION6 on the EO-1 plat-form, as well as the airborne visible infrared imaging
20 July 2001 y Vol. 40, No. 21 y APPLIED OPTICS 3483

7
F
cdasp3sVfptrtaeTmplsoSictpnlttEwasrw
ftmT1andatwcct
oitatnscictiamastrt
3
spectrometer ~AVIRIS! instrument on NASA’s ER-2.In the case of imaging spectrometers, in addition tobetter parameterization of the atmosphere ~ozone,aerosol, and water-vapor amount!, it may also be pos-sible to apply a residual correction directly to thetransmission term in the surface reflectance retrieval.In this paper we describe the design of the spectrora-diometer and telescope, its radiometric stability, and amethod of absolute radiometric calibration for bothspectral regions that obey a type of Beer’s law trans-mission ~a valid Langley channel! and spectral regionsthat contain strong molecular absorption and thuscannot be calibrated with the traditional Langleymethod. Finally we present the results of a side-by-side experiment with a filter-based solar radiometerand some example comparisons with the atmosphericradiative transfer code MODTRAN8 with the measureddirect solar spectral irradiance.
2. Methods
A. Instrument Design
The Analytical Spectral Devices Full Range ~ASD-R! is a commercially available, portable spectrome-
ter designed originally and primarily for themeasurement of surface spectral reflectance.9 Re-ent upgrades to the temperature stabilization andark current control have made the instrument suit-ble as a spectroradiometer. The instrument con-ists of three separate spectrometers: a siliconhotodiode array in the visible near infrared ~VNIR,50–1000 nm! and two scanning spectrometers in thehortwave infrared ~SWIR, 1000–2500 nm!. In theNIR a fixed concave holographic diffraction grating
ocuses light onto a temperature-stabilized siliconhotodiode array. An order-sorting filter placed onop of the array prevents higher-order light fromeaching the detectors. The two SWIR spectrome-ers designated SWIR1 for the 1000–1770-nm regionnd SWIR2 for the 1770–2500-nm region are single-lement, thermoelectrically cooled InGaAs detectors.he SWIR1 and SWIR2 gratings are attached to aotor that scans back and forth every 0.1 s. The
osition of the grating shaft, and thus the wave-ength, is determined with an optical encoder. In-trumental dark current is measured and subtractedut from each spectrum prior to its recording in theWIR1 and SWIR2. In the VNIR, the dark current
s measured at the beginning of the measurementycle, and masked detectors in the array thereafterrack dark current fluctuations. The spectral sam-ling is approximately 1.4 nm in the VNIR and 2.0m in the SWIR. The spectrum is linearly interpo-
ated to every nanometer prior to being recorded onhe personal computer that controls the spectrome-er. For relatively smooth varying spectra fromarth surface cover materials, the errors associatedith this interpolation are small. The errors gener-ted from this interpolation for atmospheric mea-urements are addressed in Subsection 3.A. Theesolution of the ASD-FR as measured by the fullidth at half-maximum ~FWHM! varies in the VNIR
484 APPLIED OPTICS y Vol. 40, No. 21 y 20 July 2001
rom approximately 7 to 3 nm was determined whenhe instrument was scanned with a 0.5-m monochro-ator every 0.1 nm over the entire wavelength range.he FWHM measured in the SWIR1 is 11.4 and is1.7 nm in the SWIR2; the resolution does not varyppreciably across these wavelengths. It should beoted that, although time-consuming and rather te-ious to measure, it is critical to know the resolutionccurately for atmospheric measurements that con-ain sharp, strong absorption features. Simulationsith a radiative transfer code have shown that a
hange in FWHM of only 0.5 nm, at 1-nm sampling,an result in nearly a 10% change in irradiance overhe oxygen A band.
The spectrometers are fed light from a 1.0-m fiber-ptic cable that also eliminates any polarization ofncoming light. A laptop computer mounted on theop of the ASD-FR serves to control the spectrometernd record the spectra. The spectrometer measureshe entire wavelength range in 0.1 s, and a largeumber of spectra can be averaged to achieve a highignal-to-noise ratio ~SNR!. The spectra are en-oded to a 16-bit resolution, and real-time display ofrradiance spectra is possible with the inclusion ofalibration coefficients. Either ac or batteries powerhe spectroradiometer. It is highly portable ~weigh-ng only 6.6 kg!, can be set up in a matter of minutes,nd is easily operated by one person. With someodification to the ASD-FR control software as well
s weatherproofing of the spectroradiometer and tele-cope system, this system could be utilized as a long-erm monitoring system. Currently, however, itequires an operator to periodically check the opera-ion of the ASD-FR.
B. Radiometric Stability
Solar radiometers depend on a radiometrically stablesystem of detectors and electronics. Once the cali-bration of the instrument is established, a stable ra-diometer can be deployed to make instantaneousmeasurements of transmittance and irradiance. Todetermine the long-term radiometric stability of anASD-FR, we undertook a series of laboratory calibra-tions. The laboratory calibration uses a commer-cially available quartz-halogen irradiance standard~Optronic Laboratories10! 1000-W lamp in conjunc-tion with a Spectralon diffusing panel. Spectralon isa commercially available, National Institute of Stan-dards and Technology-traceable, diffuse reflectancestandard.11 The lamp is powered by a highly stablecurrent source, the output of which is crossed checkedwith a National Institute of Standards andTechnology-traceable current shunt and digital volt-meter. Because we were determining only the long-term stability of the radiometer and not its absolutecalibration, seasoned uncalibrated lamps were used.Forty-two calibrations taken from January to Sep-tember 1999 are plotted on the left-hand side of Fig.1. The coefficient of variation ~standard deviationdivided by the mean! is plotted on the right-hand sideof Fig. 1. In addition to the statistics for all 42 cal-ibrations, a second set of statistics was calculated for

rAd
the calibrations made when the instrument was innear constant use during the summer field season,either making solar radiometric measurements ormeasurements of surface reflectance. The instru-ment shows excellent radiometric stability for thisnine-month period, better than 1% for virtually theentire wavelength region and better than 0.5% forwavelengths beyond 1000 nm. The higher devia-tions centered on 1400 and 1900 nm are the result ofwater-vapor absorption bands present in the atmo-sphere surrounding the laboratory calibration setup.This demonstrates the strong sensitivity of thesebands to even small amounts of water vapor over ashort path length ~,70 cm! in a relatively dry envi-onment. These measurements indicate that theSD-FR is suitable for use as a precision spectrora-iometer.
C. Telescope Design
To measure the direct normal solar spectral irradi-ance, the field of view ~FOV! of the radiometer mustbe restricted to only that of the solar disk. This isaccomplished either by use of a telescope with a FOVslightly larger than the angle subtended by the Sun,approximately 0.5°, or by a combination of a diffuserto measure total downwelling irradiance and a shad-ing device to determine the diffuse component. Bysubtracting the diffuse from the total, we can deter-mine the direct component. Finding a diffuser withexcellent cosine response over such a wide wave-length range proved difficult. For this reason, wedesigned a telescope-type instrument. The tele-scope contains front and rear apertures that definethe FOV and does not contain any optical elements~see Fig. 2!. The apertures are removable and canbe replaced easily with apertures of various sizes toincrease or decrease the FOV. Attached to the rearof the telescope is a 2-in. ~5-cm! Spectralon integrat-ing sphere. The integrating sphere serves to pro-vide a highly spatially uniform source of light for thefiber optic to view as well as to minimize the effects ofpointing errors as long as the 2.0° FOV of the tele-scope encompasses the solar disk. In addition, Spec-tralon has been shown to be resistant to degradationby ultraviolet radiation after treatment of baking invacuo at 90 °C for several hours.12 Thus this design
Fig. 1. Digital number for all 42 calibrations are plotted on theleft. Coefficient of variation is plotted on the right for all 42calibrations ~solid curve! and for the summer months when theinstrument was in near constant use ~dotted curve!.
should be free of the temporal degradation thatplagues filter-based solar radiometers. On the top ofthe telescope a pinhole and target allow for precisealignment to the Sun. The telescope was designedfor use with commercially available solar trackers.We made all the measurements presented in thispaper by manually tracking the Sun using a simple,commercially available, elevation-azimuth mount.An example ASD-FR optical depth spectrum is plot-ted on the left-hand side of Fig. 3. On the right-handside of Fig. 3 is an ASD-FR solar irradiance spectrum.
D. Radiometric Calibration
Careful radiometric calibration of a solar radiometeris essential to obtain meaningful results. The twocommon methods of calibration are the Langley plotmethod and the standard lamp method. In the Lan-gley plot method, the directly transmitted solar irra-diance Fl can be described by the Beer–Bouguer–Lambert law13:
Fl 5 F0l R22Tl , (1)
Tl 5 exp~mtl! , (2)
where F0l is the top-of-the-atmosphere ~TOA! solarspectral irradiance, R is the Earth–Sun distance in
Fig. 2. Simple schematic drawing, in cross section ~top view!, ofthe telescope. Front and rear apertures are exchangeable tochange the FOV. The telescope is 570 cm in length and weight 2kg. It can be attached to a solar tracking device or track the Sunmanually. The pinhole and target are on top of the telescope andare not shown in this view.
Fig. 3. Example optical depth spectrum is plotted on the left, andthe solar irradiance spectrum is plotted on the right. The opticaldepth spectrum, from Mauna Loa, is the result of a Langley plot;thus the optical depths are not correct for regions of strong absorp-tion. The example surface solar irradiance spectrum is from thecoast of Hawaii.
20 July 2001 y Vol. 40, No. 21 y APPLIED OPTICS 3485

pttr
oat
cptioRoamsw
m
3
astronomical units, m is the relative air mass, and tis the total optical depth at wavelength l. The airmass m is commonly determined from an air-masstable that accounts for spherical geometry and theeffects of atmospheric refraction.
For a series of measurements taken over a range ofair mass m under stable conditions of constant opticaldepth t, a plot of ln~Fl! versus m produces a straightline for which the intercept is F0l and the slope is 2t.To satisfy the assumption of constant t, measure-ments are best performed at a high-altitude moun-tain site in the morning before atmosphericconvection has begun. Measurements over severaldays are required to make a robust estimate of F0l.Perhaps the single greatest advantage of the Langleyplot method is that it allows the instrument calibra-tion to be tied directly to any of the currently avail-able published TOA solar irradiance spectra,facilitating comparison with atmospheric radiativetransfer models. Unfortunately, the Langley plotmethod is valid only in spectral regions that obey theBeer–Bouguer–Lambert law. Regions of strong gas-eous absorption in the atmosphere covering approx-imately 80% of the solar spectrum from 350 to 2500nm invalidate the Langley plot method. Several au-thors have proposed modifications to the standardLangley method. Reagan et al. propose a square-root dependence to describe water-vapor absorptionin the 940-nm water-vapor band.14 Others have
roposed modifications to account for ozone and ni-rogen dioxide.15,16 Even with this modification tohe standard Langley method, spatially and tempo-ally constant absorber amounts ~constant t! are re-
quired to obtain an accurate estimate of F0l. Thusthe calibration uncertainties are invariably higherfor the 940-nm water-vapor band and will be higherfor any of the water-vapor bands calibrated by a mod-ified Langley method.
The alternate method of calibration is by standardlamp. In the standard lamp method, a National In-stitute of Standards and Technology-traceable1000-W quartz-halogen bulb, powered by a highlystable current source, provides a known irradiance ata set distance, usually 0.5 m. Standard lamp cali-brations depend on accurate alignment and othergeometric factors such as lamp and receiver distanceand telescope aperture size. Standard lamps allowfor calibration throughout the 350–2500-nm rangebut may be subject to unknown systematic errors,either in the standard lamp itself17 or in the labora-tory configuration.
Clearly the modification of standard Langley plotanalysis to every absorber present in the atmospherefrom 350 to 2500 nm is not an attractive solution tothe problem of calibration in non-Langley channels.We propose a hybrid calibration, relying on a stan-dard lamp only to accurately reproduce its spectralshape. All the geometric factors involved in a stan-dard lamp calibration, source and detector distance,aperture size, and lamp alignment, are grouped intoone scaling factor S, which is independent of wave-length. This scaling factor is determined from the
486 APPLIED OPTICS y Vol. 40, No. 21 y 20 July 2001
mean of the ratio of the Langley-determined radio-metric coefficients CL~l! to the lamp coefficients CB~l!
in the valid Langley channels. The radiometric co-efficients are, of course, the ratio of the digital num-ber from the ASD-FR to a known source irradiance,either the solar spectrum or a standard lamp.Mathematically,
CL~l! 5 CB~l!S . (3)
The scaled lamp coefficients should closely agree withthe Langley coefficients in valid Langley channelsand fill in spectral regions with strong gaseous ab-sorption. We stress that this scaling factor is a sin-gle number applied across all wavelengths; nospectral fitting is performed. The final radiometriccoefficients of the ASD-FR are the scaled bulb values.With this method, systematic laboratory calibrationerrors either in laboratory configuration ~geometric!r the lamp standard itself ~spectral! should be avoid-ble, at least to the level of current uncertainties inhe TOA solar spectrum.
As a first step in the calibration, we determined thehannels where the Langley plot method can be ap-lied. Numerous gaseous absorbers are present inhe solar spectrum. In a radiative sense, the mostmportant gaseous absorber is water vapor by virtuef both the number and the strength of its bands.adiatively less important absorbers such as ozone,xygen, carbon dioxide, and methane must also bevoided to obtain an accurate calibration. To deter-ine the channels unaffected by these absorbers, we
imulated a high-altitude calibration experimentith the radiative transfer code MODTRAN4.0, creating
a series of synthetic Langley plots.MODTRAN4.0 is the latest upgrade to the MODTRAN
atmospheric radiative transfer model and has beenderived from the HITRAN9718 spectroscopic data-base compilation and includes line parameter up-dates for several water-vapor bands in the solarspectral region.19 In addition, MODTRAN can be run ina direct solar irradiance mode for direct comparisonwith our measurements rapidly because the calcula-tion does not include multiple scattering, allows easyscaling of several of the most important absorbers,and contains several of the currently available TOAsolar spectra.
MODTRAN was run in the direct solar irradiancemode, with elevation angles corresponding to therange of 1 air mass ~90° solar elevation! to 15 air
asses evenly spaced in the air mass ~Fig. 4!. TheMODTRAN parameters were defined to simulate ourhigh-altitude calibration site in Colorado. Themodel output irradiances were resampled to a 10-nmFWHM Gaussian slit function over the wavelengthrange of the ASD-FR, and a least-squares fit betweenthe air mass and the ln~irradiance! was performed.The Langley-extrapolated TOA solar spectrum wasthen compared with the model input TOA solar spec-trum to determine valid channels. We considerchannels that recreate the TOA solar spectrum to 60.5% to be valid Langley channels. In this analysis,

tTarm
p
379 of 2151 ASD-FR channels ~18%! in the 350–2500-nm wavelength range were found to be valid.Valid channels are found throughout the entire wave-length range, including a few channels in the 2000–2500-nm range. Although not meeting our criteriaof 0.5%, this study indicates that channels shorterthan 500 nm are still accessible to the standard Lan-gley calibration method, albeit with an error of ap-proximately 1.0–1.5%.
E. Langley and Standard Lamp Calibrations
Two high-altitude calibration experiments were car-ried out in the fall of 1999 and the spring of 2000.The fall 1999 experiment was performed at the NiwotRidge Mountain Research Station approximately 32km west of Boulder, Colorado, at an elevation of2870 m. The second calibration experiment was
Fig. 4. ~Top! Series of the solar irradiance spectra from MODTRAN
simulating a high-altitude calibration experiment and evenlyspaced in the air mass. ~Middle! The solid curve is the Langley-plot-reconstructed TOA solar spectrum; the dotted curve is theMODTRAN input TOA solar spectrum. ~Bottom! The channels thatrecreate the TOA solar spectrum to 6 0.5% are overplotted withdiamonds.
performed in April 2000 at the Mauna Loa Observa-tory ~MLO!, elevation 3390 m, widely considered to behe premier location for Langley plot calibrations.he telescope was aligned to the Sun and tracked forpproximately 3 h after sunrise. A spectrum wasecorded approximately once per minute, and everyeasurement is the average of 5 s of data or 50 spec-
tra. The PC clock was set to UTC at the beginningof each experiment with a Global Positioning Systemreceiver so that the Sun elevation angle and thus theair mass could be determined accurately.
Fifteen sunrise experiments over six weeks at Ni-wot Ridge yielded eight runs under clear and stableconditions that were considered to be of calibrationquality. Similarly, four sunrise measurements weremade during the relatively short experiment period ofone week at the MLO. Immediately upon the com-pletion of the Langley measurements, the ASD-FRand telescope were taken into the laboratory. Thetelescope was aligned carefully to a calibrated stan-dard lamp ~Optronic FEL-506C! with a laser andalignment jig, and the front end of the telescope wasplaced within 10 cm of the lamp to maximize inputinto the integrating sphere. The alignment proce-dure was undertaken only to maximize the input intothe sphere, and no attempt was made to measure thesource and receiver distance. A metal baffle wasplaced between the telescope and the lamp to preventheating of the telescope during the lamp warm-upperiod. Immediately after removing the baffle, wecollected ten spectra over the course of approximately1 min. Each spectrum consisted of the average of 50spectra, and all ten were averaged together to obtaina high SNR.
The lamp-scaling factor was then determined asdescribed above. The left-hand side of Fig. 5 showsthe coefficient of variation for the eight Langley cal-ibration experiments performed at Niwot Ridge. Asimilar plot is shown on the right-hand side of Fig. 5for the MLO calibrations. For the Colorado data,the deviations are less than 1.5% throughout the en-tire spectrum ~excluding regions of strong absorption!and are considerably better in the SWIR1 regionwhere excellent radiometric stability and small opti-cal depths ~i.e., mild Langley plot slopes! combine to
roduce deviations around 0.5%. In the SWIR2 re-
Fig. 5. Coefficient of variation for eight Langley-plot-determinedcalibrations performed at Niwot Ridge, Colorado, are plotted on theleft. Coefficient of variation for four Langley plot calibrationsundertaken at the MLO are plotted on the right.
20 July 2001 y Vol. 40, No. 21 y APPLIED OPTICS 3487
bdcst
auc
siaw
mfoc
3
gion, the deviations increase again to approximately1.5%. This is probably the result of a smaller SNRthat is due to fewer available photons from the Sunand the slightly lower reflectance of the Spectralonintegrating sphere. On average, a photon is scat-tered dozens of times before entering the fiber optic,so that even small changes in reflectance of thesphere coating produces a large change in sphereoutput. The results for the MLO are noticeably bet-ter than those obtained in Colorado. The deviationsare less than 1% over the whole wavelength rangeand are better than 0.5% beyond 500 nm. Thesesmaller deviations are due primarily to the superior-ity of MLO as a calibration site and are not an artifactof the shorter calibration period undertaken at MLO.This is indicated by the laboratory calibration stabil-ity as well as ratios of intercepts from calibrationstaken on consecutive days for both Colorado andMLO. All the deviations in the Langley channel in-tercepts are smaller, and in the case of MLO they areconsiderably smaller than the current absolute un-certainties in the published TOA solar spectra.
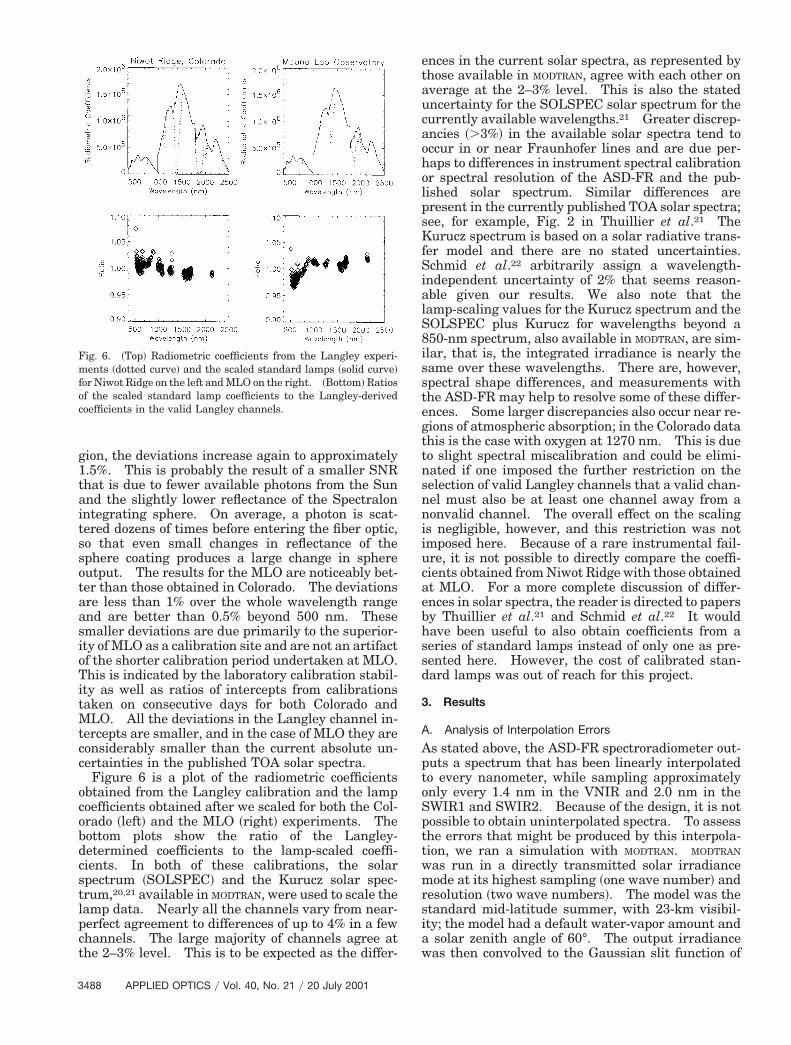
Figure 6 is a plot of the radiometric coefficientsobtained from the Langley calibration and the lampcoefficients obtained after we scaled for both the Col-orado ~left! and the MLO ~right! experiments. Theottom plots show the ratio of the Langley-etermined coefficients to the lamp-scaled coeffi-ients. In both of these calibrations, the solarpectrum ~SOLSPEC! and the Kurucz solar spec-rum,20,21 available in MODTRAN, were used to scale the
lamp data. Nearly all the channels vary from near-perfect agreement to differences of up to 4% in a fewchannels. The large majority of channels agree atthe 2–3% level. This is to be expected as the differ-
Fig. 6. ~Top! Radiometric coefficients from the Langley experi-ents ~dotted curve! and the scaled standard lamps ~solid curve!
or Niwot Ridge on the left and MLO on the right. ~Bottom! Ratiosf the scaled standard lamp coefficients to the Langley-derivedoefficients in the valid Langley channels.
488 APPLIED OPTICS y Vol. 40, No. 21 y 20 July 2001
ences in the current solar spectra, as represented bythose available in MODTRAN, agree with each other onverage at the 2–3% level. This is also the statedncertainty for the SOLSPEC solar spectrum for theurrently available wavelengths.21 Greater discrep-
ancies ~.3%! in the available solar spectra tend tooccur in or near Fraunhofer lines and are due per-haps to differences in instrument spectral calibrationor spectral resolution of the ASD-FR and the pub-lished solar spectrum. Similar differences arepresent in the currently published TOA solar spectra;see, for example, Fig. 2 in Thuillier et al.21 TheKurucz spectrum is based on a solar radiative trans-fer model and there are no stated uncertainties.Schmid et al.22 arbitrarily assign a wavelength-independent uncertainty of 2% that seems reason-able given our results. We also note that thelamp-scaling values for the Kurucz spectrum and theSOLSPEC plus Kurucz for wavelengths beyond a850-nm spectrum, also available in MODTRAN, are sim-ilar, that is, the integrated irradiance is nearly thesame over these wavelengths. There are, however,spectral shape differences, and measurements withthe ASD-FR may help to resolve some of these differ-ences. Some larger discrepancies also occur near re-gions of atmospheric absorption; in the Colorado datathis is the case with oxygen at 1270 nm. This is dueto slight spectral miscalibration and could be elimi-nated if one imposed the further restriction on theselection of valid Langley channels that a valid chan-nel must also be at least one channel away from anonvalid channel. The overall effect on the scalingis negligible, however, and this restriction was notimposed here. Because of a rare instrumental fail-ure, it is not possible to directly compare the coeffi-cients obtained from Niwot Ridge with those obtainedat MLO. For a more complete discussion of differ-ences in solar spectra, the reader is directed to papersby Thuillier et al.21 and Schmid et al.22 It wouldhave been useful to also obtain coefficients from aseries of standard lamps instead of only one as pre-sented here. However, the cost of calibrated stan-dard lamps was out of reach for this project.
3. Results
A. Analysis of Interpolation Errors
As stated above, the ASD-FR spectroradiometer out-puts a spectrum that has been linearly interpolatedto every nanometer, while sampling approximatelyonly every 1.4 nm in the VNIR and 2.0 nm in theSWIR1 and SWIR2. Because of the design, it is notpossible to obtain uninterpolated spectra. To assessthe errors that might be produced by this interpola-tion, we ran a simulation with MODTRAN. MODTRAN
was run in a directly transmitted solar irradiancemode at its highest sampling ~one wave number! andresolution ~two wave numbers!. The model was thetandard mid-latitude summer, with 23-km visibil-ty; the model had a default water-vapor amount and
solar zenith angle of 60°. The output irradianceas then convolved to the Gaussian slit function of

~
the ASD-FR in two different manners. We createdthe first spectrum by resampling with true 1-nm sam-pling and ASD-FR resolution. We created a secondspectrum by resampling with ASD-FR sampling andresolution. The result was then linearly interpo-lated to 1-nm sampling, simulating what actuallytakes place within the ASD-FR. The ratio of the twoprovides an estimate of errors associated with thelinear interpolation ~Fig. 7!. As was expected, theerrors are greatest where the strongest and thussharpest absorption features are found in conjunctionwith the highest instrumental resolution. Thegreatest errors range from 4% to 9% in the oxygen Aband and a select few channels in the water-vaporband at 940 nm. For the large majority of channels~93%!, excluding the water-vapor bands at 1400 and1900 nm, which are saturated and give spurious re-
Fig. 7. ~Top! At-surface solar irradiance spectrum calculated byMODTRAN at its highest sampling and resolution. ~Middle! Lin-early interpolated and uninterpolated spectra. The differencesare nearly impossible to detect from this plot. ~Bottom! The ratioof the interpolated and uninterpolated spectra. The errors aregreatest in areas of strong absorption combined with high instru-mental resolution.
sults when ratioed, we obtain errors that are below0.5%. The errors are also more or less evenly di-vided between overestimation and underestimation;thus when integrating for the total irradiance overthese wavelengths, the difference we obtain is negli-gible.
B. Example Comparisons with MODTRAN
With a radiometrically stable spectroradiometerthat has an absolute calibration that is tied to a pub-lished TOA solar spectrum, it is possible to makedirect comparisons with atmospheric radiative trans-fer codes. Again for this comparison we usedMODTRAN4.0 for reasons stated above. As an exam-ple, two measurements were selected at random fromthe experiment undertaken in Hawaii in April 2000.One spectrum was selected from the measurementstaken at MLO, and a second spectrum was selectedfrom measurements taken on the west coast of Ha-waii at sea level and thus containing a much highercolumn water-vapor amount.
MODTRAN4.0 was used to calculate the direct solar
Fig. 8. ASD-FR measured ~solid curve! and the MODTRAN-modeleddotted curve! direct solar irradiance for a measurement taken at
MLO are shown on the left. The same is shown on the right forWaima Bay, Hawaii, with a higher water-vapor amount.
Table 1. MODTRAN4.0 Parameterization and Output for Mauna Loa andWaima Bay, Hawaii
MODTRAN Input MODTRAN Outputa
Input: MLOSolar zenith angle, 44.0° —Ground altitude, 3.39 km —Model atmosphere, tropical —Ozone scaling factor, 0.95 0.354 atm cmWater-vapor scaling factor, 0.25 256.02 atm cmVisibility ~550 nm!, 98 km taerosol~550 nm! 5 0.0736CO2 mixing ratio, 360 parts per
million270.36 atm cm
Input: Waima BaySolar zenith angle, 13.8° —Ground altitude, 0.010 km —Model atmosphere, tropical —Ozone scaling factor, 0.95 0.271 atm cmWater-vapor scaling factor, 0.50 2624.0 atm cmVisibility ~550 nm!, 140 km taerosol~550 nm! 5 0.0720CO2 mixing ratio, 360 parts per
million298.06 atm cm
aTotal column absorber amounts for the line-of-sight path.
20 July 2001 y Vol. 40, No. 21 y APPLIED OPTICS 3489

3
irradiance. The modeled and measured irradiancesare plotted in Fig. 8. For both cases, the ozone andaerosol amount were varied until a best fit was foundin the 400–700-nm range. The water-vapor amountwas then scaled to best fit the unsaturated bands at940 and 1140 nm. Finally, the aerosol amount wasfine-tuned until the integrated irradiance agreed to
Fig. 9. Identical plots to Fig. 8 but the spectra are broken into tASD-FR for clarity. The solid curves are the measurements; the
490 APPLIED OPTICS y Vol. 40, No. 21 y 20 July 2001
within 1 Wym2 over the entire wavelength range.The MODTRAN input parameters and output are sum-marized in Table 1. Finally, because the spectralshape agrees better with the SOLSPEC data for thecurrently available wavelengths, the input TOA solarspectrum is a combination of the SOLSPEC and Ku-rucz spectra. For clarity, the spectral plots are also
spectral regions corresponding to the three spectrometers in theed curves are the MODTRAN models.
hreedott

broken into three spectral regions loosely correspond-ing to the range of each of the spectrometers in theASD-FR ~Fig. 9!.
The overall agreement is excellent; departures of themeasurement from the model greater than 3% are gen-erally found only in regions of strong absorption, whichmay be due to interpolation errors as discussed above.
Fig. 10. Plots of the MODTRAN model spectra ~solid curves! and 6 3Bay.
Errors slightly greater than 3% also occur at the veryshortest ~,400-nm! wavelengths where the standardlamp output is small and detector sensitivity is lowthus diminishing the SNR, or the longest ~.2450-nm!wavelengths where sphere and lamp output combineto decrease the SNR. It may be more appropriate touse Langley-derived coefficients, with some modifica-
the ASD-FR measured values ~dotted curves! for MLO and Waima
% of20 July 2001 y Vol. 40, No. 21 y APPLIED OPTICS 3491

3
tion in the short wavelengths, rather than the lamp-scaled coefficients. In Fig. 10 the MODTRAN-modeledirradiance is plotted along with 6 3% of the ASD-FRmeasured irradiance. This 3% represents a conser-vative estimate of the error between the SOLSPEC–Kurucz solar spectrum and the scaled standard lampvalues; 99% of the channels agree at this level in theColorado calibration data; 97% of the channels agree atthis level in the MLO data.
C. Side-by-Side Comparison with a Filter Radiometer
As an additional test of the suitability of the ASD-FRas a solar radiometer, we made a side-by-side com-
492 APPLIED OPTICS y Vol. 40, No. 21 y 20 July 2001
parison with the Reagan ten-channel solar radiome-ter. The Reagan instrument is a well-established,filter-based, commercially available solar radiome-ter.23 The Reagan instrument has channels cen-tered at 380, 400, 440, 520, 610, 670, 780, 870, 940,and 1030 nm. The approximate bandpass for eachchannel is 10 nm and the FOV is 3.2°. Three days~sunrises! were collected at the Table Mountain Ob-servatory north of Boulder, Colorado. The datawere fit over an air-mass range of 8–2 for each day.Air masses were determined with Kasten andYoung’s table.24 The results for the three days of
Fig. 11. Optical depths determined for the three sunrise experiments conducted at the Table Mountain Observatory are shown on theleft. The solid curves are the ASD-FR measurements; the diamonds are the Reagan solar radiometer measurements. Note that theseare the results from straight Langley analysis and are not true optical depths for regions of strong molecular absorption. Examples ofthe Langley plots from three different wavelengths for the three different days are shown on the right. The triangles are the Reaganradiometer values; the diamonds are the ASD-FR values.

Table 2. Comparison of Optical Depths from the ASD-FR and the
data are shown in Fig. 11. These optical depths aretotal optical depths and have not had the Rayleighcomponent subtracted from them. The continuousspectrum is the ASD-FR measurement; the diamondsare the optical depths determined for the ten Reaganchannels. The overall agreement is excellent, withdifferences in optical depth typically in the third dec-imal place. Table 2 provides a complete listing ofthe ASD-FR and Reagan values for the three days.The relatively large difference at 670 nm is a problemin our Reagan instrument, as the Langley plots showa distinct departure ~break! from a straight line.Differences in the water-vapor channel ~940 nm! areprobably due to the high sensitivity to the filter func-tion of the instruments to the strong absorbing linespresent in water-vapor bands. The values listed forthe 940-nm channel are the result of a straight Lan-gley fit to the data and thus are not true opticaldepths. The overall mean absolute difference for thethree days of data, excluding the 670- and 940-nmchannels, is t 5 0.0036.
4. Conclusions
We have presented use of a highly portable, commer-cially available spectroradiometer and custom-designed telescope to make spectrally resolved
Reagan Solar Radiometer
DayWavelength
~nm!ASD-FR
Optical DepthReagan
Optical Depth Difference
263 380 0.386 0.407 0.021400 0.325 0.334 0.009440 0.234 0.235 0.001520 0.138 0.137 0.001610 0.102 0.105 0.003670 0.064 0.088 0.024780 0.035 0.035 0870 0.024 0.024 0940 0.151 0.080 0.071
1030 0.016 0.016 0265 380 0.376 0.387 0.011
400 0.313 0.320 0.007440 0.225 0.224 0.001520 0.132 0.131 0.001610 0.100 0.102 0.002670 0.062 0.085 0.023780 0.035 0.034 0.001870 0.025 0.024 0.001940 0.160 0.083 0.077
1030 0.018 0.018 0277 380 0.428 0.435 0.007
400 0.365 0.367 0.002440 0.274 0.268 0.006520 0.176 0.171 0.005610 0.139 0.137 0.002670 0.099 0.107 0.008780 0.068 0.065 0.003870 0.056 0.055 0.001940 0.137 0.078 0.059
1030 0.047 0.046 0.001
measurements of transmittance and direct solarspectral irradiance from 350 to 2500 nm. The spec-troradiometer has demonstrated excellent radiomet-ric stability, better than 1% for the majority ofwavelengths in the laboratory over nine months anda precision that exceeds our ability to calibrate it inan absolute sense, currently approximately 3%. Theabsolute error in the radiometric calibration is cur-rently limited by our knowledge of the TOA solarspectrum. The spectroradiometer–telescope combi-nation should be free from the temporal degradationexperienced by filter-based radiometers, and the ab-solute radiometry of the ASD-FR can be easilytracked in the laboratory with an uncalibrated sea-soned standard lamp. Comparisons with a filter-based solar radiometer have shown the twoinstruments to be in agreement with a mean absolutedifference of t 5 0.0036 over all comparable wave-lengths for three sunrise experiments.
We have presented a method for calibration thatcan be applied in all wavelengths and can be simul-taneously tied to published TOA solar spectra, anessential feature to make comparisons with atmo-spheric radiative transfer models. This calibrationtechnique indicates that the solar spectrum ofSOLSPEC–Kurucz, the output of a solar radiativetransfer model for wavelengths beyond 870 nm, isconsistent with our standard lamp in the wave-lengths that are accessible by the Langley method tothe 3% level for 97% of the channels. A more rigor-ous investigation of the TOA solar spectrum wouldrequire comparison with a series of standard lampsrather than the results from a single standard pre-sented here.
Errors of up to 9% are present in regions of strongabsorption and are a result of linear interpolation.These errors cannot be avoided because of instrumen-tal design; however, their position and magnitude canbe predicted with some rather simple modeling. Thismodeling also demonstrates that errors greater than0.5% are present in approximately only 7% of theASD-FR channels and are evenly divided betweenoverestimation and underestimation, resulting in neg-ligible error when one is integrating for total irradi-ance.
Finally, we have presented example irradiancespectra from the MLO and the west coast of Hawaiiand comparisons with the atmospheric radiativetransfer model MODTRAN4.0. For these two exam-ples, chosen at random, it was shown that MODTRAN
can be parameterized to match the measurements towithin measurement uncertainty. In both cases,the parameterization was within what is consideredreasonable bounds. Independent validation of themodel parameterization is an area of further inves-tigation and may prove difficult. Water-vapor re-trievals from solar radiometers have been validatedindependently with microwave radiometers and ra-diosondes but are limited by intrinsic measurementerrors or differences in spatial and temporal sam-pling.25 Independent aerosol validation may proveeven more difficult or impossible. Nevertheless this
20 July 2001 y Vol. 40, No. 21 y APPLIED OPTICS 3493

11. R. D. Jackson, T. R. Clarke, and M. S. Moran, “Bidirectional
2
2
3
is an area for further research. The direct incorpo-ration of these measurements into radiative transfermodels for surface reflectance retrieval and radiomet-ric sensor calibration is also an area of ongoing re-search.
The authors thank the following people: KenSmith of Cooperative Institute for Research in Envi-ronmental Sciences ~CIRES!, the Integrated Instru-ment Development Facility ~IIDF! for help withtelescope design and the fabrication of the telescope;Patrick Disterhoft of CIRES for the generous use ofthe facilities at the Table Mountain Observatory andthe Mountain Research Station at Niwot Ridge, Col-orado; John Barnes of the Mauna Loa Observatoryfor the generous use of that facility; and finally Alex-ander Berk of Spectral Sciences, Inc. for his advice onMODTRAN4.0. This research was funded under NASAcontract NAG5-4447 and an Innovative ResearchGrant made through CIRES and the University ofColorado.
References1. L. Harrison, M. Beauharnois, J. Berndt, P. Kiedron, J. Michal-
sky, and Q. L. Min, “The rotating shadowband spectroradiom-eter ~RSS! at SGP,” Geophys. Res. Lett. 26, 1715–1718 ~1999!.
2. M. Sicard, K. J. Thome, B. G. Crowther, and M. W. Smith,“Shortwave infrared spectroradiometer for atmospheric trans-mittance measurements,” J. Atmos. Oceanic Technol. 15, 174–183 ~1998!.
3. P. Pilewskie, A. F. H. Goetz, D. A. Beal, R. W. Bergstrom, andP. Mariani, “Observations of the spectral distribution of solarirradiance at the ground during SUCCESS,” Geophys. Res.Lett. 25, 1141–1144 ~1998!.
4. Y. J. Kaufman, D. D. Herring, K. J. Ranson, and G. J. Collatz,“Earth Observing System AM1 mission to earth,” IEEE Trans.Geosci. Remote Sens. 36, 1045–1055 ~1998!.
5. S. N. Goward and D. L. Williams, “Landsat and Earth systemsscience: development of terrestrial monitoring,” Photo-gramm. Eng. Remote Sens. 63, 887–900 ~1997!.
6. S. G. Ungar, “Technologies for furture Landsat missions,” Pho-togramm. Eng. Remote Sens. 63, 901–905 ~1997!.
7. R. O. Green, M. L. Eastwood, C. M. Sarture, T. G. Chrien, M.Aronsson, B. J. Chippendale, J. A. Faust, B. E. Pavri, C. J.Chovit, M. S. Solis, M. R. Olah, and O. Williams, “Imagingspectroscopy and the Airborne Visible Infrared Imaging Spec-trometer ~AVIRIS!,” Remote Sens. Environ. 65, 227–248~1998!.
8. F. X. Kneizys, L. W. Abreu, G. P. Anderson, J. H. Chetwynd,E. P. Shettle, A. Berk, L. S. Bernstein, D. C. Robertson, P.Acharaya, L. S. Rothman, J. E. A. Selby, W. O. Gallery, andS. A. Clough, “The MODTRAN 2y3 report and the LOWTRAN7 model,” ~Geophysics Directorate, Phillips Laboratory, 29Randolph Road, Hanscom Air Force Base, Mass., 1996!.
9. Analytical Spectral Devices, Inc., “FieldSpec user’s guide,”~Boulder, Colo., 1996!.
10. Optronic Laboratories, Inc., “Instructions for the OptronicsLaboratories 1000-W FEL tungsten-halogen lamp standardsof total and spectral irradiance” ~Orlando, Fla., 1995!.
494 APPLIED OPTICS y Vol. 40, No. 21 y 20 July 2001
calibration results for 11 Spectralon and 16 BaSO4 referencereflectance panels,” Remote Sens. Environ. 40, 231–239~1992!.
12. A. E. Stiegman, C. J. Bruegge, and A. W. Springsteen, “UVstability and contamination analysis of Spectralon diffuse re-flectance material,” Opt. Eng. 32, 799–804 ~1993!.
13. K.-N. Liou, An Introduction to Atmospheric Radiation ~Aca-demic, New York, 1980!.
14. J. A. Reagan, K. Thome, B. Herman, and R. Gall, “Watervapor measurements in the 0.94 micron absorption band:calibration, measurements and data applications,” pre-sented at the IGARSS ’87 Symposium, Ann Arbor, Mich.,18–21 May 1987.
15. C. J. Bruegge, R. N. Halthore, B. Markham, M. Spanner, andR. Wrigley, “Aerosol optical depth retrievals over the KonzaPrairie,” J. Geophys. Res. 97, 18743–18758 ~1992!.
16. B. Schmid and C. Wehrli, “Comparison of Sun photometercalibration by use of the Langley technique and the standardlamp,” Appl. Opt. 34, 4500–4512 ~1995!.
17. P. W. Kiedron, J. J. Michalsky, J. L. Berndt, and L. C. Harri-son, “Comparison of spectral irradiance standards used to cal-ibrate shortwave radiometers and spectroradiometers,” Appl.Opt. 38, 2432–2439 ~1999!.
18. L. S. Rothman, C. P. Rinsland, A. Goldman, S. T. Massie, D. P.Edwards, J. M. Flaud, A. Perrin, V. Dana, J. Y. Mandin, J.Schroeder, A. McCann, R. R. Gamache, R. B. Wattson, K.Yoshino, K. Chance, K. W. Jucks, L. R. Brown, V. Nemtchinov,and P. Varanasi, “The HITRAN molecular spectroscopic data-base and HAWKS ~HITRAN Atmospheric Workstation!:1996 edition,” J. Quant. Spectrosc. Radiat. Transfer 60, 665–710 ~1998!.
19. L. P. Giver, C. Chackerian, and P. Varanasi, “Visible andnear-infrared H2O line intensity corrections for HITRAN96,”J. Quant. Spectroscoc. Radiat. Transfer 66, 101–105 ~2000!.
0. R. L. Kurucz, “Solar irradiance by computation,” in Proceed-ings of the 17th Annual Conference on Atmospheric Trans-mission Models, PL-TR-95-2060, G. P. Anderson, R. H.Picard, and J. H. Chetwynd, eds. ~Directorate of Geophysics,Phillips Laboratory, Hanscom Air Force Base, Mass., 1995!,pp. 333–334.
1. G. Thuillier, M. Herse, P. C. Simon, D. Labs, H. Mandel, D.Gillotay, and T. Foujols, “The visible solar spectral irradiancefrom 350 to 850nm as measured by the SOLSPEC spectrom-eter during the Atlas I mission,” Sol. Phys. 177, 41–61 ~1998!.
22. B. Schmid, P. R. Spyak, S. F. Biggar, C. Wehrli, J. Sekler, T.Ingold, C. Matzler, and N. Kampfer, “Evaluation of the appli-cability of solar and lamp radiometric calibrations of a preci-sion Sun photometer operating between 300 and 1025 nm,”Appl. Opt. 37, 3923–3941 ~1998!.
23. A. R. Ehansi, J. A. Reagan, and W. H. Erxleben, “Design andperformance analysis of an automated 10-channel solar radi-ometer instrument,” J. Atmos. Oceanic Technol. 15, 697–707~1998!.
24. F. Kasten and A. T. Young, “Revised optical air mass tablesand approximation formula,” Appl. Opt. 28, 4735–4738 ~1989!.
25. J. Reagan, K. Thome, B. Herman, R. Stone, J. Deluisi, and J.Snider, “A comparison of columnar water vapor retrievals ob-tained with near-IR solar radiometer and microwave radiom-eter measurements,” J. Appl. Meteorol. 34, 1384–1391 ~1995!.