direct detection of antibody concentration and affinity in human serum using microscale...
TRANSCRIPT
Direct Detection of Antibody Concentration and Affinity in HumanSerum Using Microscale ThermophoresisSvenja Lippok,† Susanne A. I. Seidel,† Stefan Duhr,‡ Kerstin Uhland,§ Hans-Peter Holthoff,§ Dieter Jenne,∥
and Dieter Braun*,†
†Systems Biophysics, Center for Nanoscience, Physics Department, Ludwig Maximilians Universitat Munchen, Amalienstrasse 54,80799 Munchen, Germany‡NanoTemper Technologies GmbH, Flossergasse 4, 81369 Munchen, Germany§Corimmun GmbH, Lochhamer Strasse 29, 82152 Martinsried, Germany∥Max Planck Institute of Neurobiology, Am Klopferspitz 18, 82152 Martinsried, Germany
*S Supporting Information
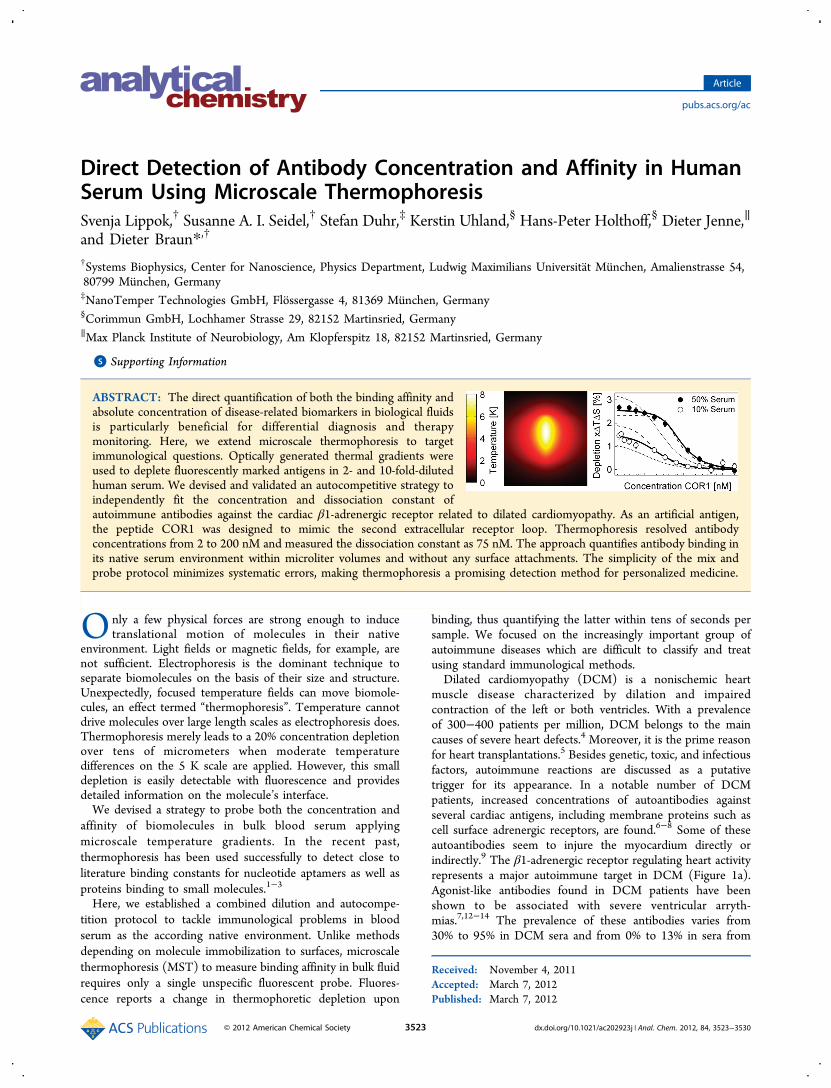
ABSTRACT: The direct quantification of both the binding affinity andabsolute concentration of disease-related biomarkers in biological fluidsis particularly beneficial for differential diagnosis and therapymonitoring. Here, we extend microscale thermophoresis to targetimmunological questions. Optically generated thermal gradients wereused to deplete fluorescently marked antigens in 2- and 10-fold-dilutedhuman serum. We devised and validated an autocompetitive strategy toindependently fit the concentration and dissociation constant ofautoimmune antibodies against the cardiac β1-adrenergic receptor related to dilated cardiomyopathy. As an artificial antigen,the peptide COR1 was designed to mimic the second extracellular receptor loop. Thermophoresis resolved antibodyconcentrations from 2 to 200 nM and measured the dissociation constant as 75 nM. The approach quantifies antibody binding inits native serum environment within microliter volumes and without any surface attachments. The simplicity of the mix andprobe protocol minimizes systematic errors, making thermophoresis a promising detection method for personalized medicine.
Only a few physical forces are strong enough to inducetranslational motion of molecules in their native
environment. Light fields or magnetic fields, for example, arenot sufficient. Electrophoresis is the dominant technique toseparate biomolecules on the basis of their size and structure.Unexpectedly, focused temperature fields can move biomole-cules, an effect termed “thermophoresis”. Temperature cannotdrive molecules over large length scales as electrophoresis does.Thermophoresis merely leads to a 20% concentration depletionover tens of micrometers when moderate temperaturedifferences on the 5 K scale are applied. However, this smalldepletion is easily detectable with fluorescence and providesdetailed information on the molecule’s interface.We devised a strategy to probe both the concentration and
affinity of biomolecules in bulk blood serum applyingmicroscale temperature gradients. In the recent past,thermophoresis has been used successfully to detect close toliterature binding constants for nucleotide aptamers as well asproteins binding to small molecules.1−3
Here, we established a combined dilution and autocompe-tition protocol to tackle immunological problems in bloodserum as the according native environment. Unlike methodsdepending on molecule immobilization to surfaces, microscalethermophoresis (MST) to measure binding affinity in bulk fluidrequires only a single unspecific fluorescent probe. Fluores-cence reports a change in thermophoretic depletion upon
binding, thus quantifying the latter within tens of seconds persample. We focused on the increasingly important group ofautoimmune diseases which are difficult to classify and treatusing standard immunological methods.Dilated cardiomyopathy (DCM) is a nonischemic heart
muscle disease characterized by dilation and impairedcontraction of the left or both ventricles. With a prevalenceof 300−400 patients per million, DCM belongs to the maincauses of severe heart defects.4 Moreover, it is the prime reasonfor heart transplantations.5 Besides genetic, toxic, and infectiousfactors, autoimmune reactions are discussed as a putativetrigger for its appearance. In a notable number of DCMpatients, increased concentrations of autoantibodies againstseveral cardiac antigens, including membrane proteins such ascell surface adrenergic receptors, are found.6−8 Some of theseautoantibodies seem to injure the myocardium directly orindirectly.9 The β1-adrenergic receptor regulating heart activityrepresents a major autoimmune target in DCM (Figure 1a).Agonist-like antibodies found in DCM patients have beenshown to be associated with severe ventricular arryth-mias.7,12−14 The prevalence of these antibodies varies from30% to 95% in DCM sera and from 0% to 13% in sera from
Received: November 4, 2011Accepted: March 7, 2012Published: March 7, 2012
Article
pubs.acs.org/ac
© 2012 American Chemical Society 3523 dx.doi.org/10.1021/ac202923j | Anal. Chem. 2012, 84, 3523−3530
unaffected controls.15,16 It is widely accepted that, in manypatients suffering from heart failure, a chronic adrenergicoverexcitation plays a harmful role.17 Permanent stimulation ofβ1-adrenoceptors due to elevated levels of circulating catechol-amines in combination with autoantibodies could change theCa2+ homeostasis of cardiomyocytes, resulting in metabolic andelectrophysiological disturbances which are responsible fortachyarrhythmia and sudden death.18 It was also shown thatDCM autoantibodies against β1-adrenergic receptors increasethe activity of cyclic adenosine monophosphate (cAMP)-dependent protein kinase A (PKA).19 Therefore, the detectionof β1-adrenergic receptor autoantibodies in human serum as anindicator for dilated cardiomyopathy and the development ofspecific antigens are important steps toward reliable diagnosticsand treatment of the disease. The autoimmune antibodies’target, the second extracellular receptor loop,10,11 is mimickedby the candidate peptide drug COR1 (Figure 1b). Thus, COR1competes with the binding of autoimmune antibodies to thereceptor. In animal models, COR1 was shown to prevent heartfailure and reverse existing cardiac insufficiency (manuscript inpreparation).Although quantitative autoantibody analysis is crucial to
characterize and discriminate different autoimmune diseasetypes and optimize their treatment, it still remains challenging.Enzyme-linked immunosorbent assays (ELISAs) are widelyused to detect and quantify disease-related biomarkers, butdisplay several disadvantages. Surface immobilization, initialstrong dilution as well as tedious washing steps, enzymaticsignal amplification, and normalization to a standard curveoften cannot be avoided, resulting in unpredictable influenceson the results. The optimization of surfaces and linkers hasimproved the binding protocols of ELISA; however, it is time-consuming and often depends on the studied binding reaction.Linking small peptides to surfaces in a way that all bindingepitopes are presented in the same manner as in solutionremains a pertinent obstacle.20,21 The surface density of thecaptured proteins is hard to predict.22,23 Additionally, thenonspecific binding of molecules of interest and plasma/serumposes a challenge. Thus, absolute biomarker quantification viaELISA remains difficult. Despite these limitations and pitfalls,the popularity and application depth of ELISA are enormous.
Only a few solution-phase alternatives to ELISA are beingutilized. As radioimmunoassays (RIAs) fulfilled these principlesvery closely, they were popular until the 1970s. However, theneed for radioactive labeling and purification of the analyte−probe complexes from the free radioactive probe by asecondary reagent is a significant disadvantage compared tothe later developed ELISA.A number of recent approaches are based on fluorescence
resonance energy transfer (FRET) between two labeled ligandsto detect binding in biological fluids or inside cells.24 Forexample, homogeneous time-resolved fluorescence (HTRF)25
detects binding by proximity in bulk fluids, while in the bead-based alphascreen26 singlet oxygen is used as a chemicalproximity signal.In contrast to the above methods, microscale thermophoresis
is much simpler to set up, as only one binder is labeled and themeasurement follows a straightforward mix and read protocol.It is sample-efficient and immobilization-free and allowsmeasurements in bulk fluids. As shown here, it can be usedfor simultaneous and quantitative analysis of antibodyconcentration and affinity, making it a promising alternativeto the commonly used techniques.
■ EXPERIMENTAL SECTIONSetup. A fluorescence microscope (AxioScope Vario, Carl
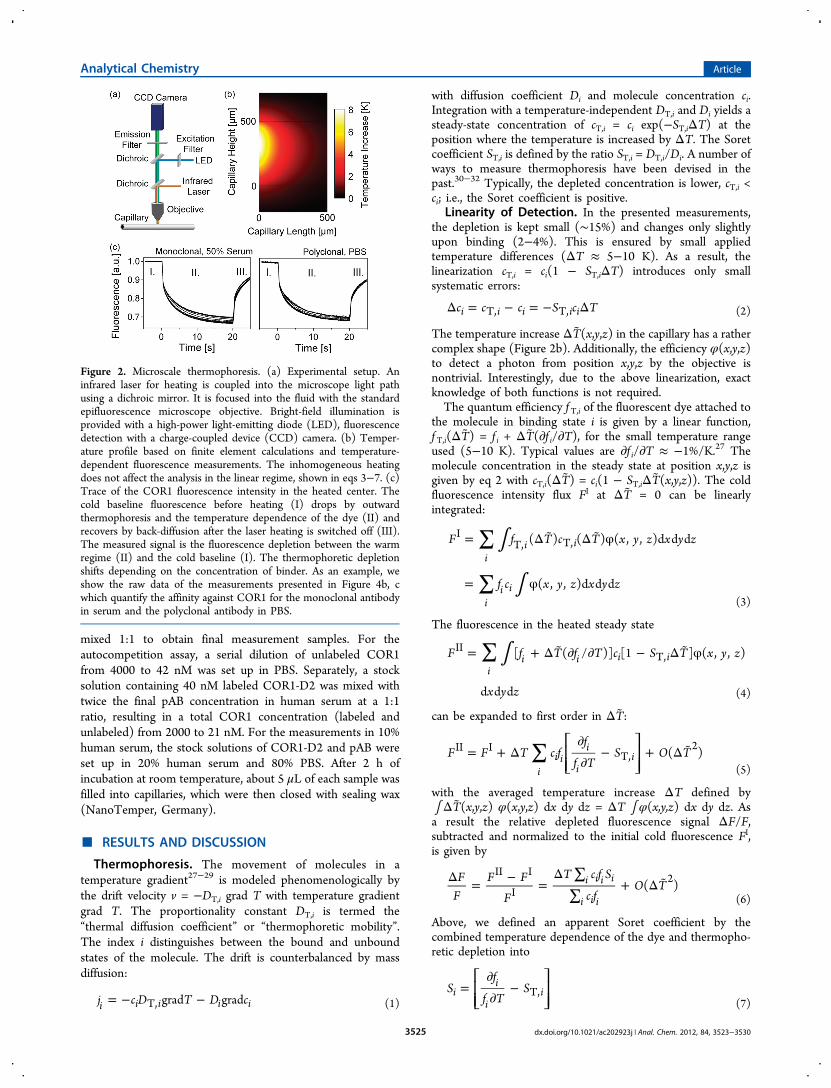
Zeiss GmbH, Germany) was modified by a 1480 nm infraredheating laser (Fibotec Fiberoptics, Germany) generating localtemperature gradients in solution (Figure 2a and SupportingInformation).1,2 Most of the laser power is absorbed by theprobe volume. Back-reflected light is absorbed by an IR filterplaced above the fluorescence emission filter, and stray light isblocked by housing the capillaries. The maximal temperatureincrease was measured to be 8 K in the beam center usingBCECF (2′-7′-bis(carboxyethyl)-5(6)-carboxyfluorescein) andfinite element calculations (Figure 2b).27,28 With the initialtemperature jump set at time t = 0 s, the cold fluorescencesignal FI was averaged from −6 to −2 s, while the warmfluorescence signal FII was between 1.2 and 3.7 s (Figure 2c).Error bars of fluorescence F are the result of at least fourmeasurements.
Peptides. The dominant epitope in the second extracellulardomain of the β1-adrenergic receptor is the sequenceARRCYND forming a disulfide bridge with the cysteine ofthe first extracellular loop.11,34 COR1, an 18-mer cyclic peptidewith the sequence ADEARRCYNDPKCSDFVQ and the N-and C-termini linked via a peptide bond, represents this secondextracellular loop. COR1 was labeled with a red dye, D2(Figure 1c, Cisbio Bioassays, France).
Sample Preparation. Measurements were conducted inphosphate-buffered saline (PBS) with 0.1% Tween 20 andhuman serum. Serum from unaffected donors was collected inS-monovettes (Sarstedt, Germany), incubated at room temper-ature (30 min), and centrifuged (10 min, 12000g). Thesupernatant was aliquoted and stored at −20 °C.
Measurement Protocols. For measurements with varyingantibody concentration, titration series of antibodies in PBSwere prepared using Quali-PCR-Tubes (Kisker, Germany). Aserial dilution was set up, starting with a concentration of 2.6μM polyclonal antibody (pAB), with a 2-fold dilution down to2.6 nM. Separately, a 40 nM COR1-D2 stock was prepared inPBS with 0.2% Tween 20 or blood serum. The monoclonalantibody concentration ranged from 4000 to 1.6 nM with 200nM COR1-D2. The antibody and COR1 dilution series were
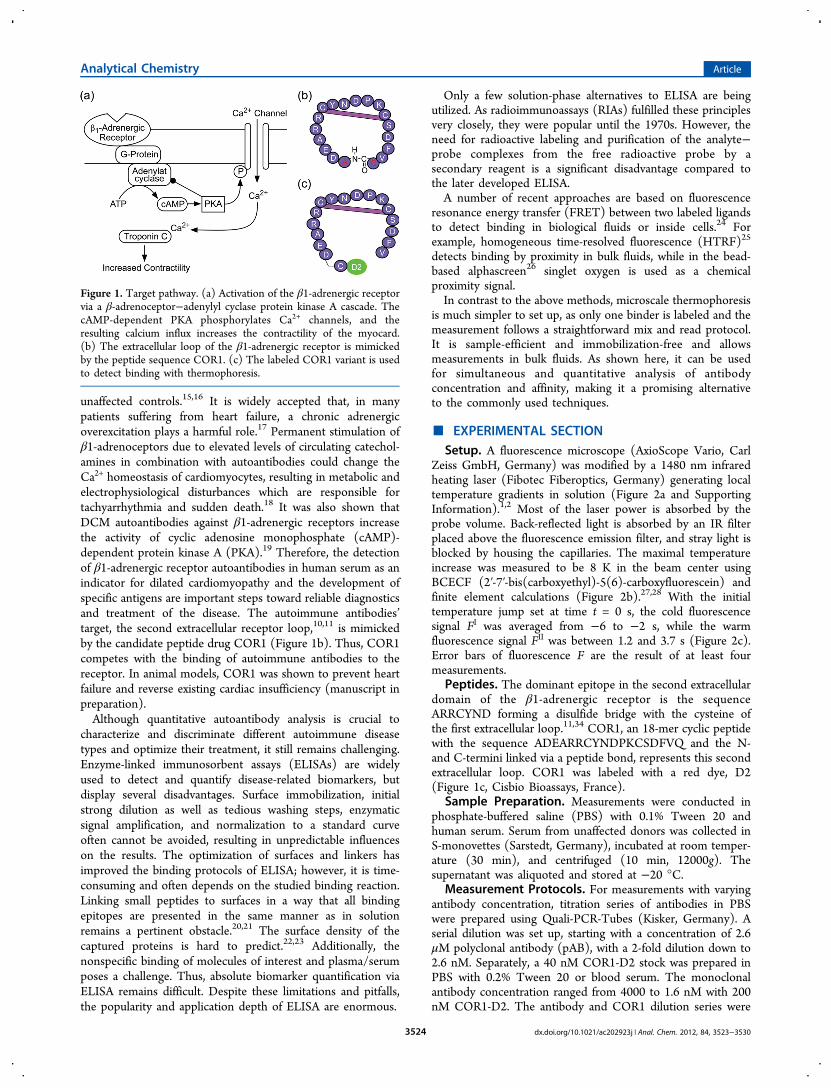
Figure 1. Target pathway. (a) Activation of the β1-adrenergic receptorvia a β-adrenoceptor−adenylyl cyclase protein kinase A cascade. ThecAMP-dependent PKA phosphorylates Ca2+ channels, and theresulting calcium influx increases the contractility of the myocard.(b) The extracellular loop of the β1-adrenergic receptor is mimickedby the peptide sequence COR1. (c) The labeled COR1 variant is usedto detect binding with thermophoresis.
Analytical Chemistry Article
dx.doi.org/10.1021/ac202923j | Anal. Chem. 2012, 84, 3523−35303524
mixed 1:1 to obtain final measurement samples. For theautocompetition assay, a serial dilution of unlabeled COR1from 4000 to 42 nM was set up in PBS. Separately, a stocksolution containing 40 nM labeled COR1-D2 was mixed withtwice the final pAB concentration in human serum at a 1:1ratio, resulting in a total COR1 concentration (labeled andunlabeled) from 2000 to 21 nM. For the measurements in 10%human serum, the stock solutions of COR1-D2 and pAB wereset up in 20% human serum and 80% PBS. After 2 h ofincubation at room temperature, about 5 μL of each sample wasfilled into capillaries, which were then closed with sealing wax(NanoTemper, Germany).
■ RESULTS AND DISCUSSION
Thermophoresis. The movement of molecules in atemperature gradient27−29 is modeled phenomenologically bythe drift velocity v = −DT,i grad T with temperature gradientgrad T. The proportionality constant DT,i is termed the“thermal diffusion coefficient” or “thermophoretic mobility”.The index i distinguishes between the bound and unboundstates of the molecule. The drift is counterbalanced by massdiffusion:
= − −j c D T D cgrad gradi i i i iT, (1)
with diffusion coefficient Di and molecule concentration ci.Integration with a temperature-independent DT,i and Di yields asteady-state concentration of cT,i = ci exp(−ST,iΔT) at theposition where the temperature is increased by ΔT. The Soretcoefficient ST,i is defined by the ratio ST,i = DT,i/Di. A number ofways to measure thermophoresis have been devised in thepast.30−32 Typically, the depleted concentration is lower, cT,i <ci; i.e., the Soret coefficient is positive.
Linearity of Detection. In the presented measurements,the depletion is kept small (∼15%) and changes only slightlyupon binding (2−4%). This is ensured by small appliedtemperature differences (ΔT ≈ 5−10 K). As a result, thelinearization cT,i = ci(1 − ST,iΔT) introduces only smallsystematic errors:
Δ = − = − Δc c c S c Ti i i i iT, T, (2)
The temperature increase ΔT(x,y,z) in the capillary has a rathercomplex shape (Figure 2b). Additionally, the efficiency φ(x,y,z)to detect a photon from position x,y,z by the objective isnontrivial. Interestingly, due to the above linearization, exactknowledge of both functions is not required.The quantum efficiency f T,i of the fluorescent dye attached to
the molecule in binding state i is given by a linear function,f T,i(ΔT) = f i + ΔT(∂f i/∂T), for the small temperature rangeused (5−10 K). Typical values are ∂f i/∂T ≈ −1%/K.27 Themolecule concentration in the steady state at position x,y,z isgiven by eq 2 with cT,i(ΔT) = ci(1 − ST,iΔT(x,y,z)). The coldfluorescence intensity flux FI at ΔT = 0 can be linearlyintegrated:
∫
∫
∑
∑
= Δ Δ φ
= φ
F f T c T x y z x y z
f c x y z x y z
( ) ( ) ( , , )d d d
( , , )d d d
ii i
ii i
IT, T,
(3)
The fluorescence in the heated steady state
∫∑= + Δ ∂ ∂ − Δ φF f T f T c S T x y z
x y z
[ ( / )] [1 ] ( , , )
d d d
ii i i i
IIT,
(4)
can be expanded to first order in ΔT:
∑= + Δ∂∂
− + Δ ⎡⎣⎢⎢
⎤⎦⎥⎥F F T c f
f
f TS O T( )
ii i
i
ii
II IT,
2
(5)
with the averaged temperature increase ΔT defined by∫ΔT(x,y,z) φ(x,y,z) dx dy dz = ΔT ∫ φ(x,y,z) dx dy dz. Asa result the relative depleted fluorescence signal ΔF/F,subtracted and normalized to the initial cold fluorescence FI,is given by
Δ = − =Δ ∑
∑+ Δ F
FF F
F
T c f S
c fO T( )i i i i
i i i
II I
I2
(6)
Above, we defined an apparent Soret coefficient by thecombined temperature dependence of the dye and thermopho-retic depletion into
=∂∂
−⎡⎣⎢⎢
⎤⎦⎥⎥S
f
f TSi
i
iiT,
(7)
Figure 2. Microscale thermophoresis. (a) Experimental setup. Aninfrared laser for heating is coupled into the microscope light pathusing a dichroic mirror. It is focused into the fluid with the standardepifluorescence microscope objective. Bright-field illumination isprovided with a high-power light-emitting diode (LED), fluorescencedetection with a charge-coupled device (CCD) camera. (b) Temper-ature profile based on finite element calculations and temperature-dependent fluorescence measurements. The inhomogeneous heatingdoes not affect the analysis in the linear regime, shown in eqs 3−7. (c)Trace of the COR1 fluorescence intensity in the heated center. Thecold baseline fluorescence before heating (I) drops by outwardthermophoresis and the temperature dependence of the dye (II) andrecovers by back-diffusion after the laser heating is switched off (III).The measured signal is the fluorescence depletion between the warmregime (II) and the cold baseline (I). The thermophoretic depletionshifts depending on the concentration of binder. As an example, weshow the raw data of the measurements presented in Figure 4b, cwhich quantify the affinity against COR1 for the monoclonal antibodyin serum and the polyclonal antibody in PBS.
Analytical Chemistry Article
dx.doi.org/10.1021/ac202923j | Anal. Chem. 2012, 84, 3523−35303525
The fluorescence signal becomes a linear function of theapparent Soret coefficient Si even for a spatially varyingtemperature increase ΔT and fluorescence detection field φ.Depletion Reports Fraction of Bound Molecules. Let
us consider the chemical binding equilibrium between ligand Land fluorescently labeled binder B:
+ ⇔B L LBfree free (8)
The binding is reported by the difference in the thermophoreticdepletion of molecule B in the free state Bfree and the boundstate LB with state index i = {Bfree, LB}. The fraction x ofbound concentration against all labeled concentrations x = cLB/(cB + cLB) is a linear function of the depleted fluorescence ΔF/F. From eq 6 follows that the fluorescence depletion is given by
Δ = Δ++
FF
Tc f S c f S
c f c fB B B LB LB LB
B B LB LB (9)
We will focus on the likely case that the fluorescence quantumefficiencies f B = f LB are equal. Otherwise the binding between Band L could be reported directly by absolute fluorescence.However, no change in absolute intensity under variation of theligand concentration was found. We find
Δ = −
= Δ− +
− += Δ + Δ
FF
F FF
Tx f S xf S
x f xfT S x S
(1 )
(1 )[ ]
II I
I
B B B LB
B LBB
(10)
with ΔS = SLB − SB the difference between the apparent Soretcoefficients of the bound and unbound states. Only the totalconcentrations of binder, cB0 = cB + cLB, and ligand, cL0 = cL +cLB, are known. The mass action law with dissociation constantKD reads
= =− −
Kc cc
c c c cc
( )( )D
L B
LB
L0 LB B0 LB
LB (11)
Solving for the fraction of occupied binder B yields
=
=+ + − + + −
xcc
c c K c c K c c
c
( ) 4
2
LB
B0
L0 B0 D L0 B0 D2
L0 B0
L0(12)
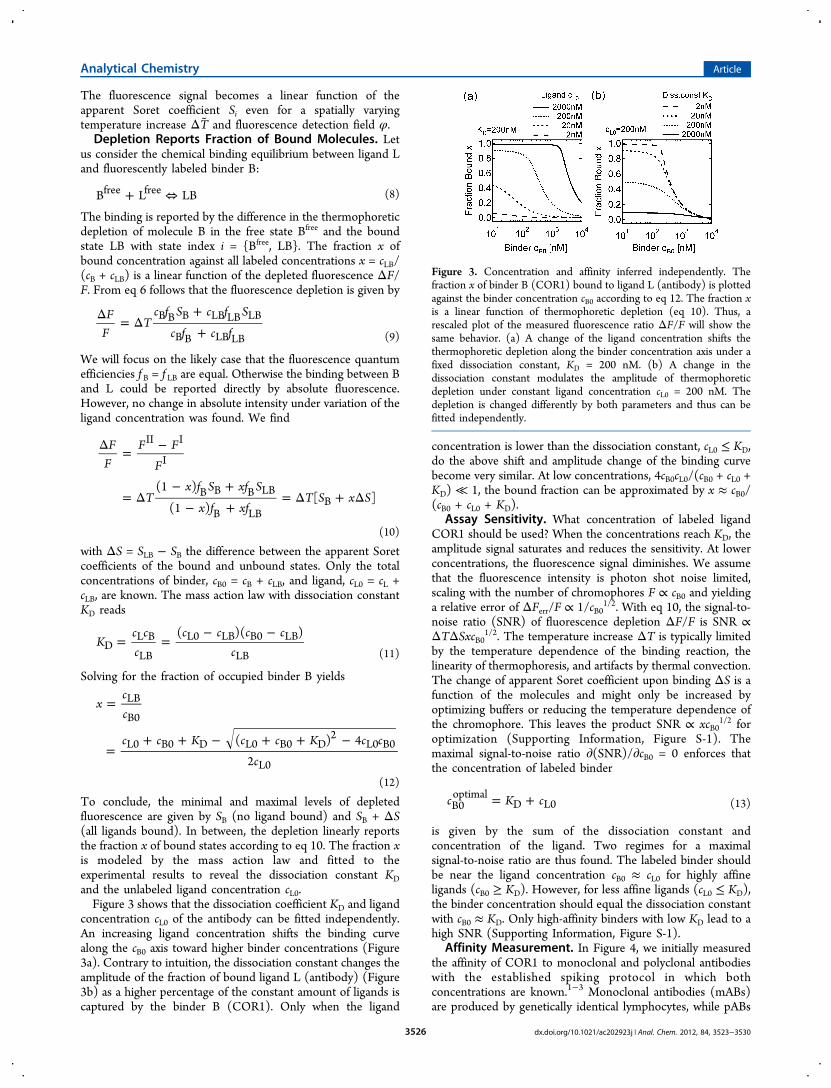
To conclude, the minimal and maximal levels of depletedfluorescence are given by SB (no ligand bound) and SB + ΔS(all ligands bound). In between, the depletion linearly reportsthe fraction x of bound states according to eq 10. The fraction xis modeled by the mass action law and fitted to theexperimental results to reveal the dissociation constant KDand the unlabeled ligand concentration cL0.Figure 3 shows that the dissociation coefficient KD and ligand
concentration cL0 of the antibody can be fitted independently.An increasing ligand concentration shifts the binding curvealong the cB0 axis toward higher binder concentrations (Figure3a). Contrary to intuition, the dissociation constant changes theamplitude of the fraction of bound ligand L (antibody) (Figure3b) as a higher percentage of the constant amount of ligands iscaptured by the binder B (COR1). Only when the ligand
concentration is lower than the dissociation constant, cL0 ≤ KD,do the above shift and amplitude change of the binding curvebecome very similar. At low concentrations, 4cB0cL0/(cB0 + cL0 +KD) ≪ 1, the bound fraction can be approximated by x ≈ cB0/(cB0 + cL0 + KD).
Assay Sensitivity. What concentration of labeled ligandCOR1 should be used? When the concentrations reach KD, theamplitude signal saturates and reduces the sensitivity. At lowerconcentrations, the fluorescence signal diminishes. We assumethat the fluorescence intensity is photon shot noise limited,scaling with the number of chromophores F ∝ cB0 and yieldinga relative error of ΔFerr/F ∝ 1/cB0
1/2. With eq 10, the signal-to-noise ratio (SNR) of fluorescence depletion ΔF/F is SNR ∝ΔTΔSxcB01/2. The temperature increase ΔT is typically limitedby the temperature dependence of the binding reaction, thelinearity of thermophoresis, and artifacts by thermal convection.The change of apparent Soret coefficient upon binding ΔS is afunction of the molecules and might only be increased byoptimizing buffers or reducing the temperature dependence ofthe chromophore. This leaves the product SNR ∝ xcB0
1/2 foroptimization (Supporting Information, Figure S-1). Themaximal signal-to-noise ratio ∂(SNR)/∂cB0 = 0 enforces thatthe concentration of labeled binder
= +c K cB0optimal
D L0 (13)
is given by the sum of the dissociation constant andconcentration of the ligand. Two regimes for a maximalsignal-to-noise ratio are thus found. The labeled binder shouldbe near the ligand concentration cB0 ≈ cL0 for highly affineligands (cB0 ≥ KD). However, for less affine ligands (cL0 ≤ KD),the binder concentration should equal the dissociation constantwith cB0 ≈ KD. Only high-affinity binders with low KD lead to ahigh SNR (Supporting Information, Figure S-1).
Affinity Measurement. In Figure 4, we initially measuredthe affinity of COR1 to monoclonal and polyclonal antibodieswith the established spiking protocol in which bothconcentrations are known.1−3 Monoclonal antibodies (mABs)are produced by genetically identical lymphocytes, while pABs
Figure 3. Concentration and affinity inferred independently. Thefraction x of binder B (COR1) bound to ligand L (antibody) is plottedagainst the binder concentration cB0 according to eq 12. The fraction xis a linear function of thermophoretic depletion (eq 10). Thus, arescaled plot of the measured fluorescence ratio ΔF/F will show thesame behavior. (a) A change of the ligand concentration shifts thethermophoretic depletion along the binder concentration axis under afixed dissociation constant, KD = 200 nM. (b) A change in thedissociation constant modulates the amplitude of thermophoreticdepletion under constant ligand concentration cL0 = 200 nM. Thedepletion is changed differently by both parameters and thus can befitted independently.
Analytical Chemistry Article
dx.doi.org/10.1021/ac202923j | Anal. Chem. 2012, 84, 3523−35303526

are produced by various lymphocyte clones and directed againstone or several epitopes of a specific antigen. The autoantibodiesfound in patients’ sera are polyclonal.We titrated either monoclonal or polyclonal antibodies (see
the Supporting Informaiton) against labeled COR1 to infer thedissociation constant in a spiked experimental setting. Theindexing for eqs 10 and 12 was i = {L, B} = {antibody, COR1}with the binder B as the labeled species. The antibody has twobinding sites, and we used the assignment cL0 = 2cL0
AB with cL0AB
denoting the antibody concentration. The experiment reportsΔF/F with varying concentration of cL0 and a constant cB0. Wefitted the thermophoretic depletion for a fixed labeled COR1concentration, cB0 = 20 nM (cB0 = 100 nM for the monoclonalantibody), and varied antibody concentration cL0. The baselinedepletion was ΔTSB = 78.8% (79.2%) for monoclonal
(polyclonal) antibodies in buffer and 82.9% (80.6%) formonoclonal (polyclonal) antibodies in 50% serum. Minordiscrepancies probably stem from differences in the heatingfocus ΔT between runs and a slightly different thermophoreticdepletion in blood serum and PBS. The depletion amplitudeupon binding was ΔTΔS = 3.72% and 3.58% (3.49% and2.39%) for mAB and pAB in PBS (and serum). With theexception of the polyclonal antibody in serum, the depletionamplitudes showed comparable values. The inverted measure-ment protocol of detecting the change in thermophoreticdepletion of the antibody (150 kDa) upon binding to the muchsmaller COR1 peptide (3 kDa) was not successful, mostprobably due to the small size change upon binding in thisconfiguration.The fitted dissociation constants KD of the COR1−antibody
binding are similar to each other and all within the range of70−140 nM. We found KD = 101 ± 17 nM for the monoclonalantibodies in PBS and KD = 136 ± 32 nM in serum. Thepolyclonal antibody preparation showed comparable affinities,KD = 70 ± 11 nM in PBS and KD = 66 ± 25 nM in serum. Errorbars are the result of the fitting procedure. Experiments wereperformed at least three times, confirming the error bars of asingle measurement. We found a slightly higher affinity for thepolyclonal antibody compared to the monoclonal antibody. Nosignificant difference between measurements in buffer andserum could be concluded from the data. It should be notedthat the depletion mostly stems from the size differencebetween COR1 and COR1 + antibody. An additional increaseof thermophoretic depletion due to binding of COR1 to thesecond arm of the antibody is not expected. Indeed, themeasurements show that a two-state model is sufficient todescribe the binding curves.The specificity of binding is checked in Figure 4e, f. We
performed measurements with an unspecific antibody forCOR1, namely a monoclonal antibody against E-cadherin.While the control shows no binding signal, the binding isreproduced for the specific antibody (Figure 4e). The 2-foldreduction in binding affinity as compared to the measurementin Figure 4b could be the result of a new serum stock. In Figure4f, COR1 was labeled with fluorescein to check for possibleinteractions of the dye D2 with the antibody. Again specificbinding is detected, and we find no thermophoretic depletionfor the E-cadherin antibody. The binding with COR1-fluorescein is slightly less affine as compared to that withCOR1. This could be due to the fluorescence correction whichwas required for fluorescein (Supporting Information, S-7).
Autocompetition Assay. To determine both affinity andconcentration, a strategy to mix labeled and unlabeled COR1was successful. Perturbations of the thermophoretic measure-ment signal are minimal if both the labeled COR1concentration and serum dilution are held constant. The totalconcentration of COR1 was changed by adding unlabeledCOR1 in a protocol we termed “autocompetition”. Theassumption that both COR1 species bind to the antibodywith equal affinity was later tested successfully by model fits.We thus assign the index i = {L, B} = {antibody, COR1labeled +COR1unlabeled} with cL0 unknown and cB0 = cB0
labeled + cB0unlabeled at a
fixed concentration of cB0labeled. Again, the concentration of
binding sites of the antibody was quantified using cL0 = 2cL0AB.
We started with cB0labeled = 20 nM to ensure maximal sensitivity
also for low antibody concentrations. We first tested theapproach by spiking polyclonal antibody with concentrationsbetween 2 and 200 nM into 50% human serum. The goal was
Figure 4. Affinity. The affinity of labeled COR1 to monoclonal andpolyclonal autoantibodies was quantified in buffer and 50% humanserum. In contrast to the autocompetition assay described in Figure 3,we first performed microscale thermophoresis without autocompeti-tion: with fixed labeled COR1 concentration cB0, the antibodyconcentration cL0 was varied. Again, eqs 10 and 12 were used forfitting, but the traditional usage of the concentrations resulted ininverted characteristics as compared to those of the autocompetitiondescribed in Figure 3. (a, b) Binding of COR1 to monoclonal antibodyyielded a dissociation constant of KD = 101 ± 17 nM in PBS bufferand KD = 136 ± 32 nM in 50% untreated human serum. (c, d)Measurements of polyclonal antibody showed KD = 70 ± 11 nM forPBS and KD = 66 ± 25 nM in 50% serum. The dissociation constant isconsidered as per antibody molecule. Affinities per antigen binding sitewould have yielded half of the above KD values. (e) The specificity ofbinding was confirmed in serum by control experiments with anunspecific monocloncal anti-E-cadherin antibody. A constantthermophoretic depletion signal was found, indicating no binding.(f) Measurements using a COR1 which was labeled with fluoresceinshow the same specific binding signal; however, they yield a slightlylower affinity.
Analytical Chemistry Article
dx.doi.org/10.1021/ac202923j | Anal. Chem. 2012, 84, 3523−35303527
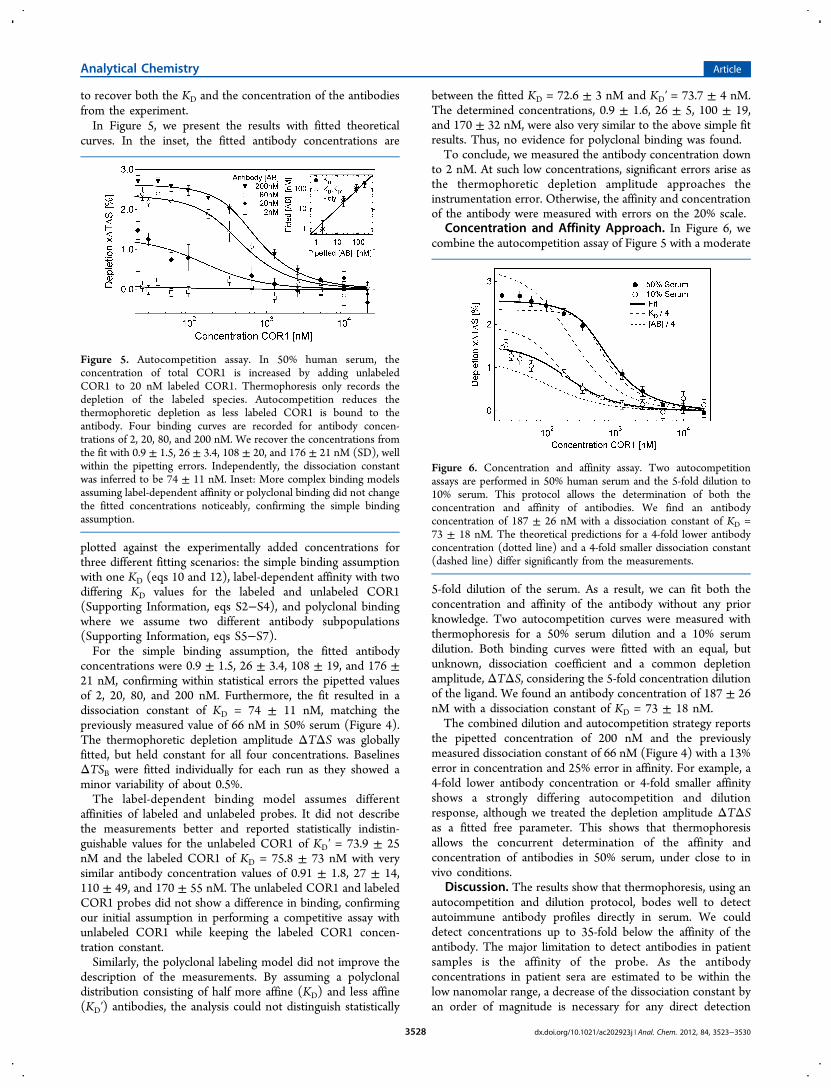
to recover both the KD and the concentration of the antibodiesfrom the experiment.In Figure 5, we present the results with fitted theoretical
curves. In the inset, the fitted antibody concentrations are
plotted against the experimentally added concentrations forthree different fitting scenarios: the simple binding assumptionwith one KD (eqs 10 and 12), label-dependent affinity with twodiffering KD values for the labeled and unlabeled COR1(Supporting Information, eqs S2−S4), and polyclonal bindingwhere we assume two different antibody subpopulations(Supporting Information, eqs S5−S7).For the simple binding assumption, the fitted antibody
concentrations were 0.9 ± 1.5, 26 ± 3.4, 108 ± 19, and 176 ±21 nM, confirming within statistical errors the pipetted valuesof 2, 20, 80, and 200 nM. Furthermore, the fit resulted in adissociation constant of KD = 74 ± 11 nM, matching thepreviously measured value of 66 nM in 50% serum (Figure 4).The thermophoretic depletion amplitude ΔTΔS was globallyfitted, but held constant for all four concentrations. BaselinesΔTSB were fitted individually for each run as they showed aminor variability of about 0.5%.The label-dependent binding model assumes different
affinities of labeled and unlabeled probes. It did not describethe measurements better and reported statistically indistin-guishable values for the unlabeled COR1 of KD′ = 73.9 ± 25nM and the labeled COR1 of KD = 75.8 ± 73 nM with verysimilar antibody concentration values of 0.91 ± 1.8, 27 ± 14,110 ± 49, and 170 ± 55 nM. The unlabeled COR1 and labeledCOR1 probes did not show a difference in binding, confirmingour initial assumption in performing a competitive assay withunlabeled COR1 while keeping the labeled COR1 concen-tration constant.Similarly, the polyclonal labeling model did not improve the
description of the measurements. By assuming a polyclonaldistribution consisting of half more affine (KD) and less affine(KD′) antibodies, the analysis could not distinguish statistically
between the fitted KD = 72.6 ± 3 nM and KD′ = 73.7 ± 4 nM.The determined concentrations, 0.9 ± 1.6, 26 ± 5, 100 ± 19,and 170 ± 32 nM, were also very similar to the above simple fitresults. Thus, no evidence for polyclonal binding was found.To conclude, we measured the antibody concentration down
to 2 nM. At such low concentrations, significant errors arise asthe thermophoretic depletion amplitude approaches theinstrumentation error. Otherwise, the affinity and concentrationof the antibody were measured with errors on the 20% scale.
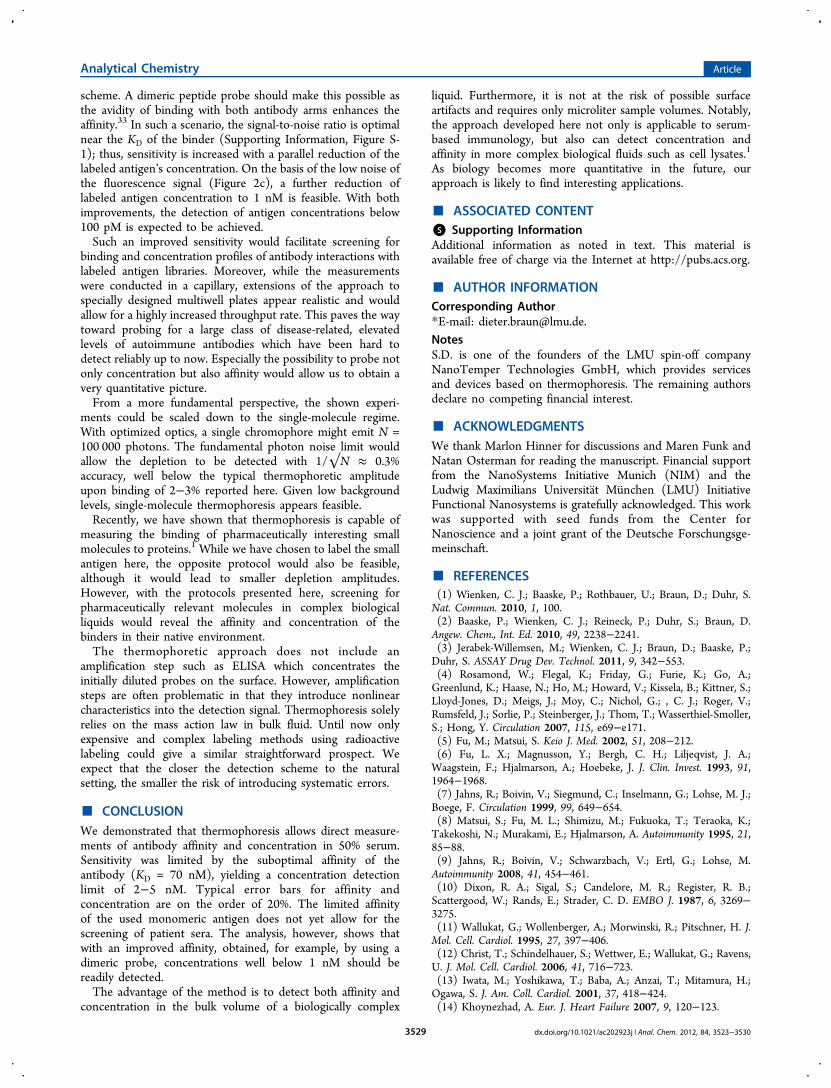
Concentration and Affinity Approach. In Figure 6, wecombine the autocompetition assay of Figure 5 with a moderate
5-fold dilution of the serum. As a result, we can fit both theconcentration and affinity of the antibody without any priorknowledge. Two autocompetition curves were measured withthermophoresis for a 50% serum dilution and a 10% serumdilution. Both binding curves were fitted with an equal, butunknown, dissociation coefficient and a common depletionamplitude, ΔTΔS, considering the 5-fold concentration dilutionof the ligand. We found an antibody concentration of 187 ± 26nM with a dissociation constant of KD = 73 ± 18 nM.The combined dilution and autocompetition strategy reports
the pipetted concentration of 200 nM and the previouslymeasured dissociation constant of 66 nM (Figure 4) with a 13%error in concentration and 25% error in affinity. For example, a4-fold lower antibody concentration or 4-fold smaller affinityshows a strongly differing autocompetition and dilutionresponse, although we treated the depletion amplitude ΔTΔSas a fitted free parameter. This shows that thermophoresisallows the concurrent determination of the affinity andconcentration of antibodies in 50% serum, under close to invivo conditions.
Discussion. The results show that thermophoresis, using anautocompetition and dilution protocol, bodes well to detectautoimmune antibody profiles directly in serum. We coulddetect concentrations up to 35-fold below the affinity of theantibody. The major limitation to detect antibodies in patientsamples is the affinity of the probe. As the antibodyconcentrations in patient sera are estimated to be within thelow nanomolar range, a decrease of the dissociation constant byan order of magnitude is necessary for any direct detection
Figure 5. Autocompetition assay. In 50% human serum, theconcentration of total COR1 is increased by adding unlabeledCOR1 to 20 nM labeled COR1. Thermophoresis only records thedepletion of the labeled species. Autocompetition reduces thethermophoretic depletion as less labeled COR1 is bound to theantibody. Four binding curves are recorded for antibody concen-trations of 2, 20, 80, and 200 nM. We recover the concentrations fromthe fit with 0.9 ± 1.5, 26 ± 3.4, 108 ± 20, and 176 ± 21 nM (SD), wellwithin the pipetting errors. Independently, the dissociation constantwas inferred to be 74 ± 11 nM. Inset: More complex binding modelsassuming label-dependent affinity or polyclonal binding did not changethe fitted concentrations noticeably, confirming the simple bindingassumption.
Figure 6. Concentration and affinity assay. Two autocompetitionassays are performed in 50% human serum and the 5-fold dilution to10% serum. This protocol allows the determination of both theconcentration and affinity of antibodies. We find an antibodyconcentration of 187 ± 26 nM with a dissociation constant of KD =73 ± 18 nM. The theoretical predictions for a 4-fold lower antibodyconcentration (dotted line) and a 4-fold smaller dissociation constant(dashed line) differ significantly from the measurements.
Analytical Chemistry Article
dx.doi.org/10.1021/ac202923j | Anal. Chem. 2012, 84, 3523−35303528
scheme. A dimeric peptide probe should make this possible asthe avidity of binding with both antibody arms enhances theaffinity.33 In such a scenario, the signal-to-noise ratio is optimalnear the KD of the binder (Supporting Information, Figure S-1); thus, sensitivity is increased with a parallel reduction of thelabeled antigen’s concentration. On the basis of the low noise ofthe fluorescence signal (Figure 2c), a further reduction oflabeled antigen concentration to 1 nM is feasible. With bothimprovements, the detection of antigen concentrations below100 pM is expected to be achieved.Such an improved sensitivity would facilitate screening for
binding and concentration profiles of antibody interactions withlabeled antigen libraries. Moreover, while the measurementswere conducted in a capillary, extensions of the approach tospecially designed multiwell plates appear realistic and wouldallow for a highly increased throughput rate. This paves the waytoward probing for a large class of disease-related, elevatedlevels of autoimmune antibodies which have been hard todetect reliably up to now. Especially the possibility to probe notonly concentration but also affinity would allow us to obtain avery quantitative picture.From a more fundamental perspective, the shown experi-
ments could be scaled down to the single-molecule regime.With optimized optics, a single chromophore might emit N =100 000 photons. The fundamental photon noise limit wouldallow the depletion to be detected with 1/√N ≈ 0.3%accuracy, well below the typical thermophoretic amplitudeupon binding of 2−3% reported here. Given low backgroundlevels, single-molecule thermophoresis appears feasible.Recently, we have shown that thermophoresis is capable of
measuring the binding of pharmaceutically interesting smallmolecules to proteins.1 While we have chosen to label the smallantigen here, the opposite protocol would also be feasible,although it would lead to smaller depletion amplitudes.However, with the protocols presented here, screening forpharmaceutically relevant molecules in complex biologicalliquids would reveal the affinity and concentration of thebinders in their native environment.The thermophoretic approach does not include an
amplification step such as ELISA which concentrates theinitially diluted probes on the surface. However, amplificationsteps are often problematic in that they introduce nonlinearcharacteristics into the detection signal. Thermophoresis solelyrelies on the mass action law in bulk fluid. Until now onlyexpensive and complex labeling methods using radioactivelabeling could give a similar straightforward prospect. Weexpect that the closer the detection scheme to the naturalsetting, the smaller the risk of introducing systematic errors.
■ CONCLUSIONWe demonstrated that thermophoresis allows direct measure-ments of antibody affinity and concentration in 50% serum.Sensitivity was limited by the suboptimal affinity of theantibody (KD = 70 nM), yielding a concentration detectionlimit of 2−5 nM. Typical error bars for affinity andconcentration are on the order of 20%. The limited affinityof the used monomeric antigen does not yet allow for thescreening of patient sera. The analysis, however, shows thatwith an improved affinity, obtained, for example, by using adimeric probe, concentrations well below 1 nM should bereadily detected.The advantage of the method is to detect both affinity and
concentration in the bulk volume of a biologically complex
liquid. Furthermore, it is not at the risk of possible surfaceartifacts and requires only microliter sample volumes. Notably,the approach developed here not only is applicable to serum-based immunology, but also can detect concentration andaffinity in more complex biological fluids such as cell lysates.1
As biology becomes more quantitative in the future, ourapproach is likely to find interesting applications.
■ ASSOCIATED CONTENT*S Supporting InformationAdditional information as noted in text. This material isavailable free of charge via the Internet at http://pubs.acs.org.
■ AUTHOR INFORMATIONCorresponding Author*E-mail: [email protected]. is one of the founders of the LMU spin-off companyNanoTemper Technologies GmbH, which provides servicesand devices based on thermophoresis. The remaining authorsdeclare no competing financial interest.
■ ACKNOWLEDGMENTSWe thank Marlon Hinner for discussions and Maren Funk andNatan Osterman for reading the manuscript. Financial supportfrom the NanoSystems Initiative Munich (NIM) and theLudwig Maximilians Universitat Munchen (LMU) InitiativeFunctional Nanosystems is gratefully acknowledged. This workwas supported with seed funds from the Center forNanoscience and a joint grant of the Deutsche Forschungsge-meinschaft.
■ REFERENCES(1) Wienken, C. J.; Baaske, P.; Rothbauer, U.; Braun, D.; Duhr, S.Nat. Commun. 2010, 1, 100.(2) Baaske, P.; Wienken, C. J.; Reineck, P.; Duhr, S.; Braun, D.Angew. Chem., Int. Ed. 2010, 49, 2238−2241.(3) Jerabek-Willemsen, M.; Wienken, C. J.; Braun, D.; Baaske, P.;Duhr, S. ASSAY Drug Dev. Technol. 2011, 9, 342−553.(4) Rosamond, W.; Flegal, K.; Friday, G.; Furie, K.; Go, A.;Greenlund, K.; Haase, N.; Ho, M.; Howard, V.; Kissela, B.; Kittner, S.;Lloyd-Jones, D.; Meigs, J.; Moy, C.; Nichol, G.; , C. J.; Roger, V.;Rumsfeld, J.; Sorlie, P.; Steinberger, J.; Thom, T.; Wasserthiel-Smoller,S.; Hong, Y. Circulation 2007, 115, e69−e171.(5) Fu, M.; Matsui, S. Keio J. Med. 2002, 51, 208−212.(6) Fu, L. X.; Magnusson, Y.; Bergh, C. H.; Liljeqvist, J. A.;Waagstein, F.; Hjalmarson, A.; Hoebeke, J. J. Clin. Invest. 1993, 91,1964−1968.(7) Jahns, R.; Boivin, V.; Siegmund, C.; Inselmann, G.; Lohse, M. J.;Boege, F. Circulation 1999, 99, 649−654.(8) Matsui, S.; Fu, M. L.; Shimizu, M.; Fukuoka, T.; Teraoka, K.;Takekoshi, N.; Murakami, E.; Hjalmarson, A. Autoimmunity 1995, 21,85−88.(9) Jahns, R.; Boivin, V.; Schwarzbach, V.; Ertl, G.; Lohse, M.Autoimmunity 2008, 41, 454−461.(10) Dixon, R. A.; Sigal, S.; Candelore, M. R.; Register, R. B.;Scattergood, W.; Rands, E.; Strader, C. D. EMBO J. 1987, 6, 3269−3275.(11) Wallukat, G.; Wollenberger, A.; Morwinski, R.; Pitschner, H. J.Mol. Cell. Cardiol. 1995, 27, 397−406.(12) Christ, T.; Schindelhauer, S.; Wettwer, E.; Wallukat, G.; Ravens,U. J. Mol. Cell. Cardiol. 2006, 41, 716−723.(13) Iwata, M.; Yoshikawa, T.; Baba, A.; Anzai, T.; Mitamura, H.;Ogawa, S. J. Am. Coll. Cardiol. 2001, 37, 418−424.(14) Khoynezhad, A. Eur. J. Heart Failure 2007, 9, 120−123.
Analytical Chemistry Article
dx.doi.org/10.1021/ac202923j | Anal. Chem. 2012, 84, 3523−35303529
(15) Limas, C.; Goldenberg, I.; Limas, C. Am. Heart J. 1992, 123,967−970.(16) Wallukat, G.; Morwinski, M.; Kowal, K.; Forster, A.; Boewer, V.;Wollenberger, A. Eur. Heart J. 1991, 12, 178−181.(17) Francis, G. Am. J. Cardiol. 1985, 55, 15A−21A.(18) Wallukat, G. Herz 2002, 27, 683−690.(19) Krause, E.; Bartel, S.; Beyerdorfer, I.; Wallukat, G. BloodPressure, Suppl. 1996, 3, 37−40.(20) Butler, J. E.; Weber, P.; Sinkora, M.; Sun, J.; Ford, S. J.;Christenson, R. K. J. Immunol. 2000, 165, 6999−7010.(21) Klinger, H. Frankf. Z. Pathol. 1931, 42, 455−480.(22) Wegener, F. Verh. Dtsch. Pathol. Ges. 1936, 29, 202−210.(23) Butler, J. E. Methods Mol. Med. 2004, 94, 333−372.(24) Pollitt, S. K.; Pallos, J.; Shao, J.; Desai, U. A.; Ma, A. A.;Thompson, L. M.; Marsh, J. L.; Diamond, M. I. Neuron 2003, 40,685−694.(25) Park, Y.-W.; Cummings, R. T.; Wu, L.; Zheng, S.; Cameron, P.M.; Woods, A.; Zaller, D. M.; Marcy, A. I.; Hermes, J. D. Anal.Biochem. 1999, 269, 94−104.(26) Beaudet, L.; Bedard, J.; Breton, B.; Mercuri, R. J.; Budarf, M. L.Genome Res. 2001, 11, 600−608.(27) Duhr, S.; Braun, D. Phys. Rev. Lett. 2006, 96, 168301.(28) Duhr, S.; Braun, D. Proc. Natl. Acad. Sci. U.S.A. 2006, 103,19678−19682.(29) Ludwig, C. Sitzungsber.-Bayer. Akad. Wiss. Wien, Math.-Naturwiss.Kl. 1856, 20, 539.(30) Kohler, W. J. Chem. Phys. 1993, 98, 660−668.(31) Wiegand, S.; Ning, H.; Kriegs, H. J. Phys. Chem. B 2007, 111,14169−14174.(32) Piazza, R.; Iacopini, S.; Triulzi, B. Phys. Chem. Chem. Phys. 2004,6, 1616−1622.(33) Randle, B. J.; Scoltock, S. J.; Scott, D. K. Biochem. Biophys. Res.Commun. 2004, 324, 504−510.(34) Wallukat, G.; Kayser, A.; Wollenberger, A. Eur. Heart J. 1995,16, 85−88.
Analytical Chemistry Article
dx.doi.org/10.1021/ac202923j | Anal. Chem. 2012, 84, 3523−35303530