digital imaging and analysis of particulate contamination · digital imaging and analysis of...
TRANSCRIPT

AEROSPACE REPORT NO.TR-2006(8565)-1 0
Digital Imaging and Analysisof Particulate Contamination
15 December 2006
Prepared by
K. T. LUEY, D. P. TAYLOR, D. J. COLEMAN,and K. A. FOLGNERSpace Materials LaboratoryLaboratory Operations
Prepared for
SPACE AND MISSILE SYSTEMS CENTERAIR FORCE SPACE COMMAND483 N. Aviation Blvd.El Segundo, CA 90245-2808
Engineering and Technology Group
THE AESP CEi APPROVED FOR PUBLIC RELEASE;
DISTRIBUTION UNLIMITED
El Seg n o Calfo ni

This report was submitted by The Aerospace Corporation, El Segundo, CA 90245-4691, under Con-tract No. FA8802-04-C-0001 with the Space and Missile Systems Center, 483 N. Aviation Blvd., ElSegundo, CA 90245. It was reviewed and approved for The Aerospace Corporation by G. F. Haw-kins Principal Director, Space Materials Laboratory; and D. C. Marvin, Principal Director, Office ofResearch & Technology Applications. Michael Zambrana was the project officer for the Mission-Oriented Investigation and Experimentation (MOLE) program.
This report has been reviewed by the Public Affairs Office (PAS) and is releasable to the NationalTechnical Information Service (NTIS). At NTIS, it will be available to the general public, includingforeign nationals.
This technical report has been reviewed and is approved for publication. Publication of this reportdoes not constitute Air Force approval of the report's findings or conclusions. It is published onlyfor the exchange and stimulation of ideas.
'MichaelASMC/EA
Form ApprovedREPORT DOCUMENTATION PAGE 0MB No. 0704-0188
Public reporting burden for this collection of infonnation is estimated to average 1 hour per response, including the time for reviewing instructions, searching existing data sources,gathering and maintaining the data needed, and completing and reviewing this collection of information. Send comments regarding this burden estimate or any other aspect of thiscollection of information, including suggestions for reducing this burden to Department of Defense, Washington Headquarters Services, Directorate for Information Operations andReports (0704-0188), 1215 Jefferson Davis Highway, Suite 1204, Arlington, VA 22202-4302. Respondents should be aware that notwithstanding any other provision of law, no personshall be subject to any penalty for failing to comply with a collection of information if it does not display a currently valid OMB control number. PLEASE DO NOT RETURN YOUR FORMTO THE ABOVE ADDRESS.
1. REPORT DATE (DD-MM-YVYY) 2. REPORT TYPE 3. DATES COVERED (From - To)15-12-2006
4. TITLE AND SUBTITLE 5a. CONTRACT NUMBERFA8802-04-C-000 l
Digital Imaging and Analysis of Particulate Contamination 5b. GRANT NUMBER
5c. PROGRAM ELEMENT NUMBER
6. AUTHOR(S) 5d. PROJECT NUMBER
K. T. Luey, D. P. Taylor, D. J. Coleman, and K. A. FoIgner 5e. TASK NUMBER
6f. WORK UNIT NUMBER
7. PERFORMING ORGANIZATION NAME(S) AND ADDRESS(ES) 8. PERFORMING ORGANIZATIONREPORT NUMBER
The Aerospace CorporationLaboratory OperationsEl Segundo, CA 90245-4691 TR-2006(8565)- 10
9. SPONSORING I MONITORING AGENCY NAME(S) AND ADDRESS(ES) 10. SPONSOR/MONITOR'S ACRONYM(S)Space and Missile Systems Center SMCAir Force Space Command483 N. Aviation Blvd. 11. SPONSORIMONITOR'S REPORT
El Segundo, CA 90245 NUMBER(S)
12. DISTRIBUTIONIAVAILABILITY STATEMENT
Approved for public release; distribution unlimited.
13. SUPPLEMENTARY NOTES
14. ABSTRACT
The use of digital cameras and digital imaging software for the measurement of particle obscuration is discussed. Novelcalibration standards are used to evaluate the sensitivity and accuracy of commercially available digital cameras fordetecting microscopic dust particles and other contaminant features on surfaces. Lighting and illumination effects are alsoillustrated and discussed. The digital image histogram of particles on a surface is shown to give good results for the per-cent area coverage.
15. SUBJECT TERMSContamination, Imaging, Particles, Obscuration
16. SECURITY CLASSIFICATION OF: 17. LIMITATION 18. NUMBER 19a. NAME OFOF ABSTRACT OF PAGES RESPONSIBLE PERSON
Ken Lueya. REPORT b. ABSTRACT c. THIS PAGE 19b. TELEPHONE NUMBER
19 (include area code)UNCLASSIFIED UNCLASSIFIED UNCLASSIFIED (310)336-5499
Standard Form 298 (Rev. 8-98)Prescribed by ANSI Std. 239.18

Acknowledgements
This work was supported under The Aerospace Corporation's Mission Oriented Investi-gation and Experimentation program, funded by the U.S. Air Force Space and MissileSystems Center under Contract No. FA8802-04-C-000 1.
111.i

Contents
. Introduction .................................................................................................................................. 1
2. Cameras ........................................................................................................................................ 3
3. Cailbration and Testing .............................................................................................................. 5
3.1 Percent Area Coverage (PAC) Target .............................................................................. 5
3.2 Platinum Standard Features ............................................................................................... 9
3.3 Airborne Particle Fallout .................................................................................................. 13
3.4 Im age Analysis ................................................................................................................... 13
4. Sum m ary ....................................................................................................................................... 17
References ............................................................................................................................................... 19
Figures
1. Digital cameras included in this study ...................................................................................... 3
2. Percent area coverage test target ............................................................................................... 5
3. Distortion grid targets available from Edmund Industrial Optics ........................................... 6
4. Precision photographic platform .............................................................................................. 6
5. Digital im age of calibrated optical target ................................................................................. 6
6. Typical histogram for 8-bit color depth digital im age ............................................................. 7
7. Schem atic 1-bit color depth histogram for PAC test target in Figure 2 ................................ 7
8. Calibrated dot target at closest focus for 100-m m m acro lens ................................................ 8
9. PAC target for closest focus point of 100-m m m acro lens ...................................................... 8
10. Aerospace particulate contam ination wafer, DPT-PT-001 ...................................................... 9
v

11. Zig-zag (left) and semi-circle (right) made from laser-assisted
chemical vapor deposition of platinum on silicon a wafer ...................................................... 10
12. Slant feature (left) and Horizontal stripe (right) ...................................................................... 10
13. Horizontal stripes have twice the designed widthbecause of sam ple shift during fabrication ............................................................................... 10
14. 72 vertical stripes from DPT-PT-001 at closest focus. Imaged area is 330 mm 2 ....... . . .. . .. . .. 11
15. 63 slants from D PT -PT -00 1 ...................................................................................................... . 12
16. 32 zig-zags and 32 semi-circles on DPT-PT-001 ................................................................... 12
17. Enlarged I-bit color depth image of platinum feature and dust particle on DPT-PT-001.... 13
18. Digital photo image of normal dust on a silicon wafer ........................................................... 14
19. "Mosaic" image of DPT-PT-001 using a microscopic image analyzer ................. 14
Tables
I. Summary of pixel counts for target shown in Figure 9 .......................................................... 9
2. Dimensions of Features on Standard DPT-PT-001 ................................................................. I I
vi
1. Introduction
Particulate contamination requirements are measured and verified using a wide variety of techniques.The most common approaches are tapelifts (described by ASTM 1216) and fallout witness plates,together with microscopic examination, either by human eye or by computer-assisted image analysis.Tapelifts can only be used on surfaces that withstand adhesive contact and pull. Additionally, thearea covered by a tapelift is small; however, tapelifts provide a sample that can be secured and trans-ported reliably and with small risk of subsequent particle loss or gain. Witness plates do not involvecontact with sensitive surfaces, but often, because of concerns about foreign object debris (FOD), aremounted considerable distances from the hardware of interest. Transport has also been shown to havean undesirable effect. Up until recently, the analysis of either sample has relied on human inspectionand counting using optical microscopes. Today, a number of optical microscopes are available withautomated stages and image analysis software. The analysis of a single witness plate can be per-formed without human interaction. The aerospace industry knows of semiconductor wafer inspectiontools that can inspect witness plates with high accuracy and throughput. However, such systems areexpensive and cannot address those cases where the actual hardware must be sampled.
This report discusses the use of digital cameras for the detection and measurement of particulate con-tamination. The use of film photography for particle detection was first described by Aline and Dow-dall.1 Abell, et al.2 have described the use of a Keyence fiber-optic microscope combined with acomputer-assisted image comparison technique to verify cleanliness of the SBIRS telescope correctorplate. Abell illustrated a case in which a flight optical component must be evaluated quantitativelyfor contamination. In such a case, witness plates cannot be used, and sensitive coatings prevent theuse of tapelifts. In these situations, where flight hardware must be evaluated in the field quantita-tively, but are too sensitive for tapelifts, digital photography could be a useful solution if the camerahas sufficient sensitivity and accuracy. This report discusses the use of a high-end "Pro-sumer" digi-tal camera and typical image analysis software for the imaging and counting of particulate contami-nation. In the following sections, digital cameras are used to image several types of calibration sam-ples in order to assess their imaging capability.

2. Cameras
The cameras examined in this study include the Canon EOS Digital Rebel (EDR) family, as well asthe Sony F-828 and the Nikon D70 (See Figure 1). These cameras are commercially available andthey are used in this study "as purchased" without specialized modification. The Canon EDR ismated with a 100-mm telephoto lens with macro focusing capability. The Canon EDR family comesin two versions. The older version has a CCD sensor with 6.3 x 106 pixels (3072 x 2048). The newerversion, shown in Figure 1, has a CCD sensor with 8 x 106 pixels (3456 x 2304). The Sony F-828 isan 8 x 106 pixel camera, and the Nikon D70 is a 6.3 x 106 pixel camera. The results discussed herewere obtained using all three cameras, which were found to be of equivalent quality.
Figure 1. Digital cameras included in this study. (from left to right) Sony F-828; Nikon D70;Canon EOS Digital Rebel with 100-mm telephoto macro lens.
3

3. Calibration and Testing
In this section, a simple testing and calibration approach for determining the percent area coverage(PAC) of objects on a surface is discussed.
3.1 Percent Area Coverage (PAC) TargetThe PAC is defined as:
Percent Area Coverage (PAC) = Object Area/Total Area x 100 (1)
Figure 2 illustrates an area containing 10 black dots, each 0.20 in. in diameter, on a white backgroundand is made using Powerpoint and a standard laser printer. By finding the total area imaged by thecamera, the ratio of the black dots to the total image area can be found, giving the PAC.
The total image area viewed by the camera is determined using a calibrated area target, such as thedistortion grid targets obtained from Edmund Industrial Optics and shown in Figure 3. These targetscontain precise arrays of dots that can be used to determine the total area (or field of view) for a par-ticular photographic arrangement. It has been photographed using a 100-mm telephoto lens at closestfocus with the camera mounted on a custom platform shown in Figure 4. This platform allows pre-cise, reproducible placement of the camera with respect to the target and illuminator.
Each dot in Figure 2 is nominally 1.0 mm in diameter, and the distance between centers is 2.0 mm.For this focusing position of the camera and lens, the total area imaged in 96 mm by 64 mm = 6144mm2 = 9.52 in 2, as shown in Figure 5. These dimensions correspond approximately to the typical 3:2aspect ratio of digital images. The PAC sample target shown in Figure 2 was then photographed atexactly this focusing point.
* 0* 0
0
0 0
Figure 2. Percent area coverage test target. Target consists of ten dots, each 0.20 in. in diameter.
5
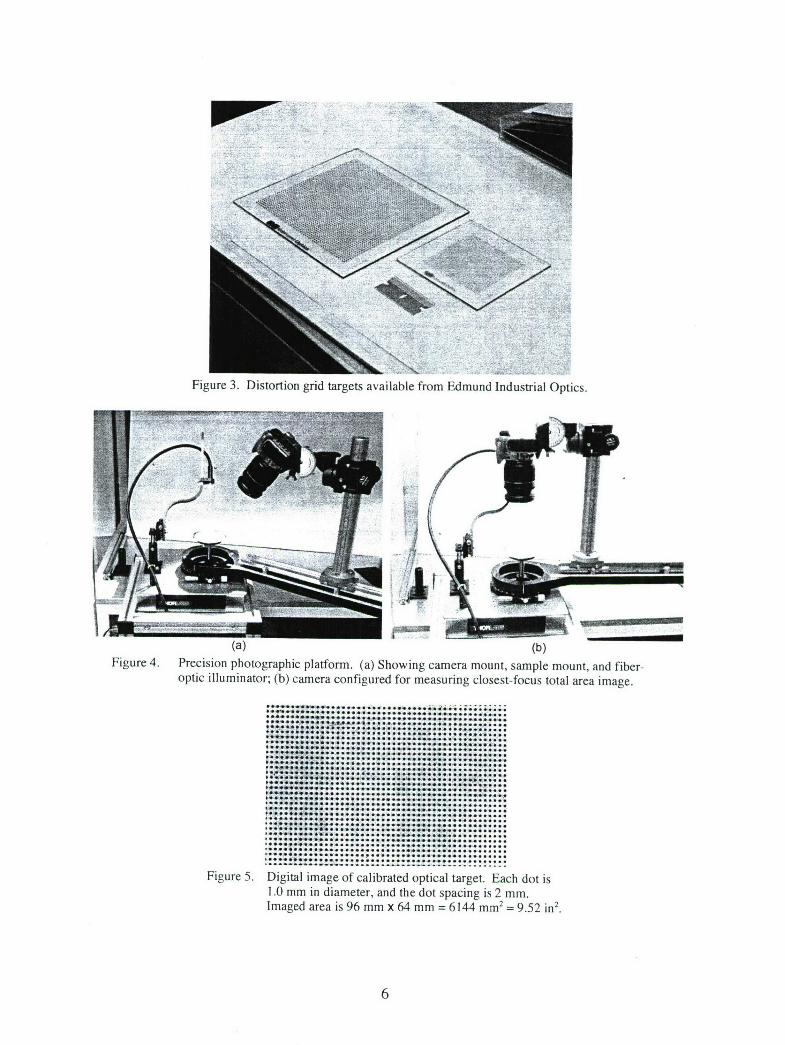
Figure 3. Distortion grid targets available from Edmund Industrial Optics.
(a)(bFigure 4. Precision photographic platform. (a) Showing camera mount, sample mount, and fiber-
optic illuminator; (b) camera configured for measuring closest-focus total area image.
............. ....... d. .
.............. ................. ..... . . .
*%fSA~t.............
.. . .......................
.................~............S..................... .. . .
.................................
............-------... ý................
Figure 5..........*f*albatd.picl age. ah oti1~. .0...............h dt pain i 2mm
Imaedara... 6.... 6.m......M2= .5 i 2
. . . . .. . t5 ~ . . .

The color distribution in a digital image is represented by its histogram. For a typical digital image,there might be 256 channels, with each channel having 256 levels. This is called 8-bit color depth, asshown in Figure 6.
However, for Figure 2, imaging software can be used to reduce the color distribution to "I-bit colordepth." In this case, each pixel has a value of either "white" or "black." A schematic representation(bar heights are not to scale) of the 1-bit color depth histogram for the PAC test target (Figure 2) isshown in Figure 7.
Ez
0
I I I I ! I I I I I ! I i t i
0 50 100 150 200 255Channel Number0-255 = 28 Channels
Figure 6. Typical histogram for 8-bit color depth digital image.
Ch. 251:187Ch. 254:27Ch. 255: 605887
Ch. 0: 216562Ch. 1:2950Ch. 2: 50
II , IChannel 0 Channel 255(All Black) (All White)
Figure 7. Schematic I-bit color depth histogram for PAC test target in Figure 2. Black pixel countsare contained in Channels 0-2. Bar heights are not to scale.
7

In Figure 7, all black pixels are to the far left in Channels 0-2, and all white pixels are to the right inChannels 253-255. Apparently, there is some "leakage" in the software conversion function since, inprinciple, all bit counts should be in Channels 0 and 255 only, according to the definition of I-bitcolor depth. Nevertheless, it can be seen that the total bit count for all 256 channels adds up to6,291,456, which is the total pixel count of the 6.3 mega-pixel sensor. The black counts divided bythe total are (216562 + 2950 + 50)/6291456, and the PAC is 3.49%. By simply finding the area of the10 black dots and dividing by the total image area, one obtains 0.314/9.52 in2. By this approach, thePAC is 3.31%. Ignoring the "leakage" in channels I and 2 only reduces the PAC determined byimaging to 3.48% from 3.49%.
A second test was performed using the closest focus distance of the 100-mm macro lens. This posi-tion takes the most advantage of the lens magnification. A smaller Edmund grid target (No. U57-983) was used consisting of 0.5-mm dots with spacing of 1.0 mm between dot centers. An image ofthe target at closest focusing distance is shown in Figure 8.
Graphics software was used to produce a black rectangle the same size as the total image area. Therectangle contained one white square 0.3 in x 0.3 in = 0.09 in2, as shown in Figure 9. The PAC of thistarget is 17.95%.
Figure 8. Calibrated dot target at closest focus for 100-mm macrolens. Area is 22 mmx 15 mm = 330 mm2 =0.511 in2.
Figure 9. PAC target for closest focus point of 100-mm macro lens.
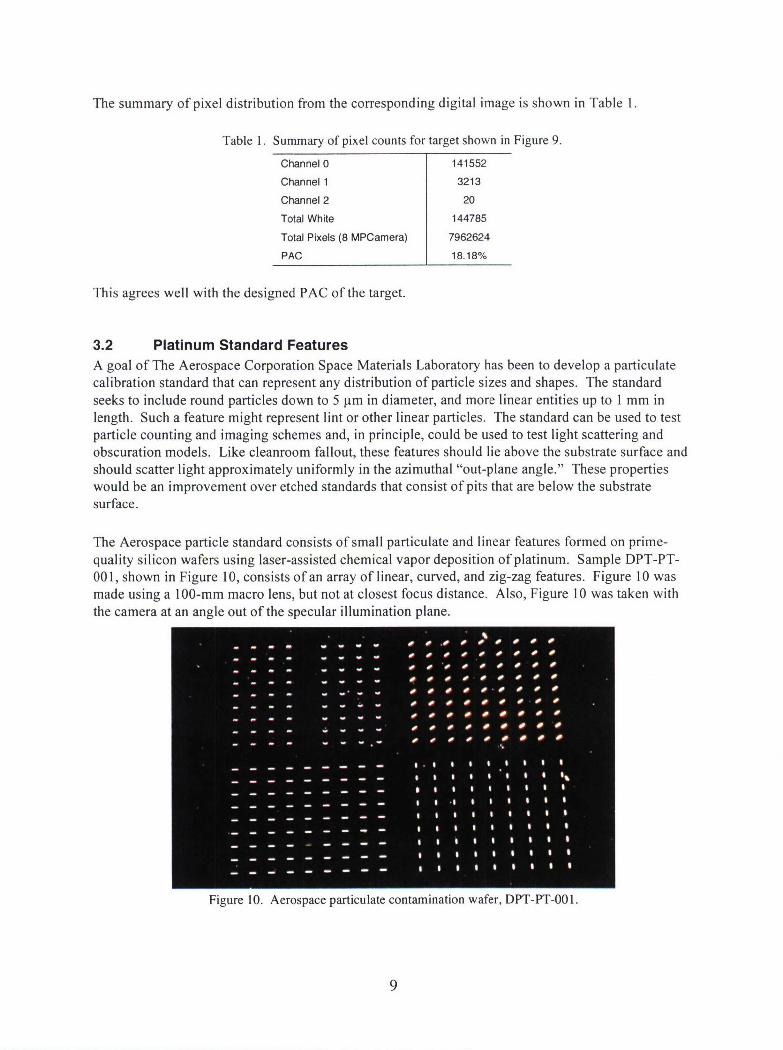
The summary of pixel distribution from the corresponding digital image is shown in Table 1.
Table 1. Summary of pixel counts for target shown in Figure 9.
ChannelO 141552
Channel 1 3213
Channel 2 20
Total White 144785
Total Pixels (8 MPCamera) 7962624
PAC 18.18%
This agrees well with the designed PAC of the target.
3.2 Platinum Standard Features
A goal of The Aerospace Corporation Space Materials Laboratory has been to develop a particulatecalibration standard that can represent any distribution of particle sizes and shapes. The standardseeks to include round particles down to 5 pim in diameter, and more linear entities up to 1 mm inlength. Such a feature might represent lint or other linear particles. The standard can be used to testparticle counting and imaging schemes and, in principle, could be used to test light scattering andobscuration models. Like cleanroom fallout, these features should lie above the substrate surface andshould scatter light approximately uniformly in the azimuthal "out-plane angle." These propertieswould be an improvement over etched standards that consist of pits that are below the substratesurface.
The Aerospace particle standard consists of small particulate and linear features formed on prime-quality silicon wafers using laser-assisted chemical vapor deposition of platinum. Sample DPT-PT-001, shown in Figure 10, consists of an array of linear, curved, and zig-zag features. Figure 10 wasmade using a 100-mm macro lens, but not at closest focus distance. Also, Figure 10 was taken withthe camera at an angle out of the specular illumination plane.
Figure 10. Aerospace particulate contamination wafer, DPT-PT-00 1.
9

There are three groups of 81 linear features and one group consisting of 36 "zig-zags" and 36 semi-circles. The distance between each feature is 1800 ptm. With the knowledge of the area of each fea-ture, and the total area imaged, the PAC of any portion, or all, of the sample can be measured.
Photomicrographs of the individual features are shown in Figures 11-13. The fine lines indicatewhere the laser has scanned or "drawn" each feature. The size, shape, and distribution of the featuresare specified through process programming.
200 pm o 0
Figure 11. Zig-zag (left) and semi-circle (right) made from laser-assisted chemical vapordeposition of platinum on silicon a wafer. Brown shadow or "halo" is residualcarbon from LA-CVD process.
2000 jim
Figure 12. Slant feature (left) and Horizontal stripe (right).
0
Figure 13. Horizontal stripes have twice the designed width because of sample shift during fabrication.
10
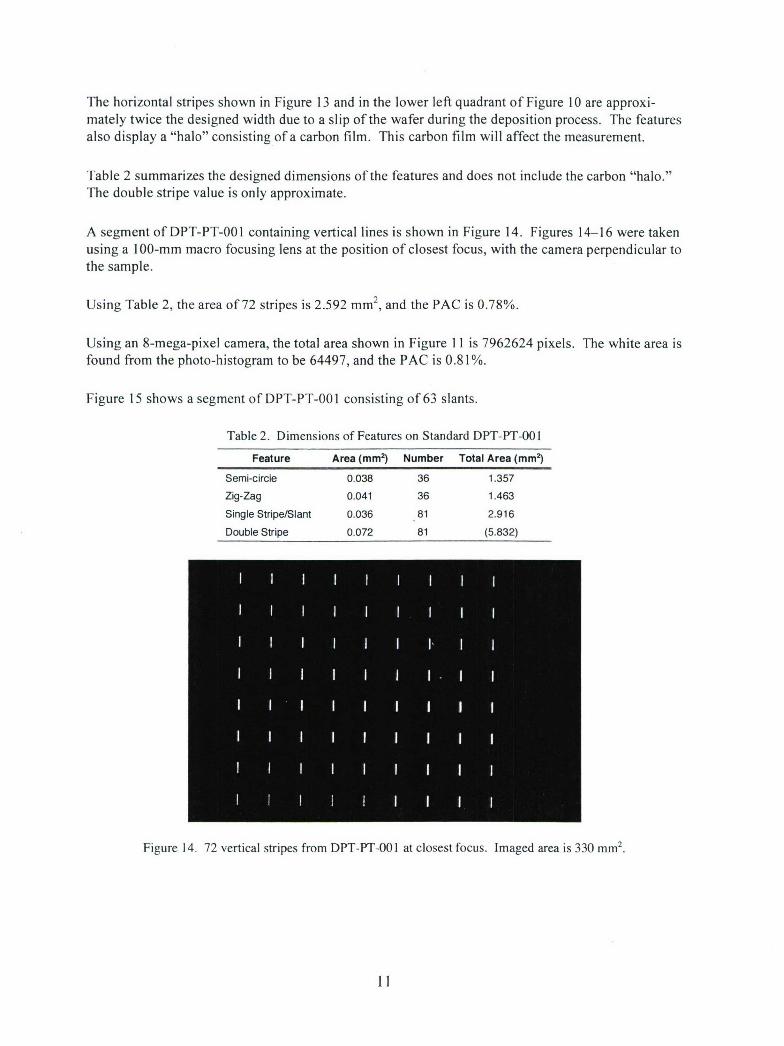
The horizontal stripes shown in Figure 13 and in the lower left quadrant of Figure 10 are approxi-mately twice the designed width due to a slip of the wafer during the deposition process. The featuresalso display a "halo" consisting of a carbon film. This carbon film will affect the measurement.
Table 2 summarizes the designed dimensions of the features and does not include the carbon "halo."The double stripe value is only approximate.
A segment of DPT-PT-001 containing vertical lines is shown in Figure 14. Figures 14-16 were takenusing a 1 00-mm macro focusing lens at the position of closest focus, with the camera perpendicular tothe sample.
2Using Table 2, the area of 72 stripes is 2.592 mm , and the PAC is 0.78%.
Using an 8-mega-pixel camera, the total area shown in Figure 11 is 7962624 pixels. The white area isfound from the photo-histogram to be 64497, and the PAC is 0.81%.
Figure 15 shows a segment of DPT-PT-001 consisting of 63 slants.
Table 2. Dimensions of Features on Standard DPT-PT-00 I
Feature Area (mm 2) Number Total Area (mm2)
Semi-circle 0.038 36 1.357
Zig-Zag 0.041 36 1.463
Single Stripe/Slant 0.036 81 2.916
Double Stripe 0.072 81 (5.832)
Figure 14. 72 vertical stripes from DPT-PT-001 at closest focus. Imaged area is 330 mm 2.
11

Figure 15. 63 slants from DPT-PT-00 1.
Figure 16. 32 zig-zags and 32 semi-circles on DPT-PT-00 1.
Using Table 2, the area of 63 slants is 2.268 mm2 , and the PAC is 0.68%. From the image histogram,the white counts are 58923, and the PAC is 0.74%.
As a final example, Figure 16 shows a segment of DPT-PT-001 containing 32 zig-zags and 32 semi-circles.
Using Table 2, 32 zig-zags have an area of 32 x 0.041 mm 2 = 1.312 mm 2. Additionally, 32 semi-circles have an area of 1.216 mm 2. The total PAC for all 64 features in 330 mm 2 is 0.77%. Using thephoto-histogram method, the white area accounts for 63808 pixels, and the PAC = 0.81%,
12

The percentage difference in areas determined by the two techniques for the cases of 72 verticalstripes and 63 slants is not quite correct. From these examples and other tests, the photo-histogrammethod for determining PAC is consistently higher by 4-8%. Note that in Figure 12, some fractionsof slants are included near the top of the image that were not included in the area calculation, butwere indeed imaged by the camera. The most important contribution, however, comes from thebrownish carbon halos shown in Figures 11-13. The halos make the slants in Figure 12 appear to bethicker than planned. These halos are detected and imaged by the camera and are counted in the his-togram, but the halo area is not included in the computation of the feature area.
As an example, Figure 17 shows an enlarged image of a typical feature on DPT-PT-001. Notice thatthe edges are rough and uneven, unlike the designed edges corresponding to the laser scan shown inFigures 8-10. A small burr indicating the true desired shape of the feature can be seen at its lowerleft end. Including the particle-like feature at the upper right of this slant, the area is about 60%greater than designed.
3.3 Airborne Particle Fallout
Figure 18 shows a I-bit photo image of normal room fallout on a silicon wafer. As before, the areaimaged is 330 mm 2 and is actually the same as that shown in Figure 6. By the photo-histogrammethod described in the previous section, the fractional area covered is 70236/7962624 = 0.0088 or0.88%.
3.4 Image AnalysisAn independent measurement of a sample similar to this one is planned using a microscopic imageanalyzer.
Currently, a microscopic image analyzer has been used to measure the PAC of DPT-PT-00 1. Theimage analyzer takes a series of magnified images covering the 4-in.-dia silicon wafer. The imagescan then be pieced together in a "mosaic" image shown below in Figure 19. Each of the smaller,individual frames can be seen.
Figure 17. Enlarged I -bit color depth image of platinumfeature and dust particle on DPT-PT-00 1.
13

Figure 18. Digital
photo image of normal dust on a silicon wafer.
Photo is at closest focus-ing distance
for 100-mm macro lens.
lbllb
Slb " lb•
lblb ~ lb
l
lb ' l
• •b
lb
• •
Fi ur 19. "Mosaic
imag ofD
T P -0 sn
m co c p ci
a ea a
lyzer. Toa
m g sm deu fs
al rfr m si d ctd
'S lb
lb14

Using the total 4-in. diameter of the silicon wafer and the feature areas in Table 2, the designed PACof DPT-PT-001 is 0.248%. Using image analysis of the mosaic, the computed PAC is 0.23 1%. Thesoftware for the microscopic image analysis includes a user input for the threshold value. The thresh-old input determines which pixels are counted as particles and which are counted as white back-ground. The photographic software does not include a user input for the threshold. Because of theuser threshold input, many users choose to include the threshold value when reporting results. Micro-scopic image analysis gives a range of 0.185-0.455% for various threshold values. The value of0.23 1% was found for a particular threshold value. In the future, standards such as DPT-PT-00 Icould be used to help set the threshold value.
15
4. Summary
Commercially available digital cameras with nominal 6.3 and 8 mega-pixel sensors havebeen used to quantitatively image a series of calibrated targets and standards. The photo-histogram method has been found to be accurate for determining the percent area coverage ofvarious targets. Digital imaging can be useful in ideal and simple circumstances. More workis needed to make digital cameras useful in more practical applications, such as for real flighthardware cleanliness verification. However, this work demonstrates that such a goal iswithin reach.
17

References
1. K. M. Aline and J. A. Dowdall, "Dark field photographic techniques for documenting opticalsurface contamination," in Scatter from Optical Components, Proceedings of the Meeting, SanDiego CA, Aug 8 -10, 1989, Society of Photo-Instrumentation Engineers, 1989, pp. 401-405.
2. George Abell, Private Communication, 2003.
19
LABORATORY OPERATIONS
The Aerospace Corporation functions as an "architect-engineer" for national security programs, specializing inadvanced military space systems. The Corporation's Laboratory Operations supports the effective and timelydevelopment and operation of national security systems through scientific research and the application ofadvanced technology. Vital to the success of the Corporation is the technical staff's wide-ranging expertise andits ability to stay abreast of new technological developments and program support issues associated with rapidlyevolving space systems. Contributing capabilities are provided by these individual organizations:
Electronics and Photonics Laboratory: Microelectronics, VLSI reliability, failure analysis,solid-state device physics, compound semiconductors, radiation effects, infrared and CCDdetector devices, data storage and display technologies; lasers and electro-optics, solid-statelaser design, micro-optics, optical communications, and fiber-optic sensors; atomic frequencystandards, applied laser spectroscopy, laser chemistry, atmospheric propagation and beamcontrol, LIDARILADAR remote sensing; solar cell and array testing and evaluation, batteryelectrochemistry, battery testing and evaluation.
Space Materials Laboratory: Evaluation and characterizations of new materials andprocessing techniques: metals, alloys, ceramics, polymers, thin films, and composites;development of advanced deposition processes; nondestructive evaluation, component failureanalysis and reliability; structural mechanics, fracture mechanics, and stress corrosion; analysisand evaluation of materials at cryogenic and elevated temperatures; launch vehicle fluidmechanics, heat transfer and flight dynamics; aerothermodynamics; chemical and electricpropulsion; environmental chemistry; combustion processes; space environment effects onmaterials, hardening and vulnerability assessment; contamination, thermal and structuralcontrol; lubrication and surface phenomena. Microelectromechanical systems (MEMS) forspace applications; laser micromachining; laser-surface physical and chemical interactions;micropropulsion; micro- and nanosatellite mission analysis; intelligent microinstruments formonitoring space and launch system environments.
Space Science Applications Laboratory: Magnetospheric, auroral and cosmic-ray physics,wave-particle interactions, magnetospheric plasma waves; atmospheric and ionospheric physics,density and composition of the upper atmosphere, remote sensing using atmospheric radiation;solar physics, infrared astronomy, infrared signature analysis; infrared surveillance, imaging andremote sensing; multispectral and hyperspectral sensor development; data analysis andalgorithm development; applications of multispectral and hyperspectral imagery to defense, civilspace, commercial, and environmental missions; effects of solar activity, magnetic storms andnuclear explosions on the Earth's atmosphere, ionosphere and magnetosphere; effects ofelectromagnetic and particulate radiations on space systems; space instrumentation, design,fabrication and test; environmental chemistry, trace detection; atmospheric chemical reactions,atmospheric optics, light scattering, state-specific chemical reactions, and radiative signatures ofmissile plumes.
THE AEROSPACECORPORATION
2350 E. El Segundo BoulevardEl Segundo, California 90245-4691
U.S.A.