digital communications and networksiranarze.ir/wp-content/uploads/2017/03/e3719.pdfdsrc protocol...
TRANSCRIPT
H O S T E D B Y Contents lists available at ScienceDirect
Digital Communications and Networks
journal homepage: www.elsevier.com/locate/dcan
An empirical study of DSRC V2V performance in truck platooningscenarios☆
Song Gaoa,c, Alvin Lima,c,⁎, David Bevlyb,c
a Department of Computer Science and Software Engineering, 3101 Shelby Center, U.S.b Department of Mechanical Engineering, 2418F Wiggins Hall, U.S.c Auburn University, Auburn, AL 36849, U.S.
A R T I C L E I N F O
Keywords:Empirical studyDSRC V2V performanceTruck platooningDelivery ratio
A B S T R A C T
Among many safety applications enabled by Dedicated Short Range Communication (DSRC), truck platooningprovides many incentives to commercial companies. This paper studies DSRC Vehicle-to-Vehicle (V2V)performance in truck platooning scenarios through real-world experiments. Commercial DSRC equipmentsand semi-trailer trucks are used in this study. We mount one DSRC antenna on each side of the truck. One set ofdynamic tests and a few sets of static tests are conducted to explore DSRC behaviors under different situations.From the test results, we verified some of our speculations. For example, hilly roads can affect delivery ratio andantennas mounted on opposite sides of a truck can suffer from low delivery ratio at curved roads. In addition, wealso found that antennas can sometimes suffer from low delivery ratio even when the trucks are on straightroads, possibly due to reflections from the nearby terrain. Fortunately, the delivery ratio can be greatlyimproved by using the two side antennas alternately.
1. Introduction
Dedicated Short Range Communication (DSRC), is a communica-tion technology designed for vehicular environments. By utilizingwireless radio, DSRC allows vehicles to communicate with nearbyvehicles and road-side units efficiently. Wireless device vendors havebeen actively developing chipsets and integrated modules that providesDSRC support. Integrated devices that not only provide DSRC, but alsosupport GPS and Controller Area Network (CAN) bus are also inmarket [1–3]. Automobile and transportation companies have alsobeen actively integrating DSRC into vehicles and developing variousDSRC-enabled applications.
Thanks to its low latency advantage, DSRC enables variousapplications that, among many other benefits, can enhance safety byaugmenting drivers' operating process. Many of such applications havebeen designed or prototyped. An intersection collision warning system,for example, can emit warning messages through DSRC when a vehicleis going too fast towards an intersection with red traffic light, so thatother vehicles and pedestrians can be notified to avoid collision. Asanother example, an emergency braking warning system enables thevehicle to “see” another vehicle in front braking hard when the line-of-sight is blocked by a large vehicle, so that the vehicle can promptly
decelerate before the driver realizes the situation.Among these safety applications, truck platooning provides many
incentives to commercial companies. In addition to safety enhance-ment, truck platooning also benefits from fuel efficiency, resulting inlower operating cost. To obtain better understanding on how wellDSRC can support platooning applications, this paper studies DSRCperformance in the context of truck operations, primarily focusing ondelivery ratio under various circumstances and with different para-meters. Tests taken in this study include a set of dynamic tests run on a2.74 km test track as a general case, and a few sets of static tests as casestudies for particular scenarios, such as when the road is not horizontalor when the front truck is turning.
The paper is structured as follows: Section 2 provides a backgroundof DSRC technology as well as truck platooning application, anddiscusses related work. Section 3 explains the motivation of this study.Section 4 describes the experimental setup, including hardware andsoftware used in tests. Section 5 presents test results and discusses thepossible reasons behind different phenomena. Section 6 concludes thestudy by summarizing the findings in this paper.
http://dx.doi.org/10.1016/j.dcan.2016.10.003Received 1 April 2016; Received in revised form 20 September 2016; Accepted 19 October 2016
Peer review under responsibility of Chongqing University of Posts and Telecommunication.⁎ Corresponding author at: Auburn University, Auburn, AL 36849, U.S.E-mail addresses: [email protected] (S. Gao), [email protected] (A. Lim), [email protected] (D. Bevly).
Digital Communications and Networks 2 (2016) 233–244
Available online 03 November 20162352-8648/ © 2016 Chongqing University of Posts and Telecommuniocations. Production and hosting by Elsevier B.V. This is an open access article under the CC BY-NC-ND license(http://creativecommons.org/licenses/BY-NC-ND/4.0/).
MARK
2. Background and related work
2.1. Dedcated short range communication
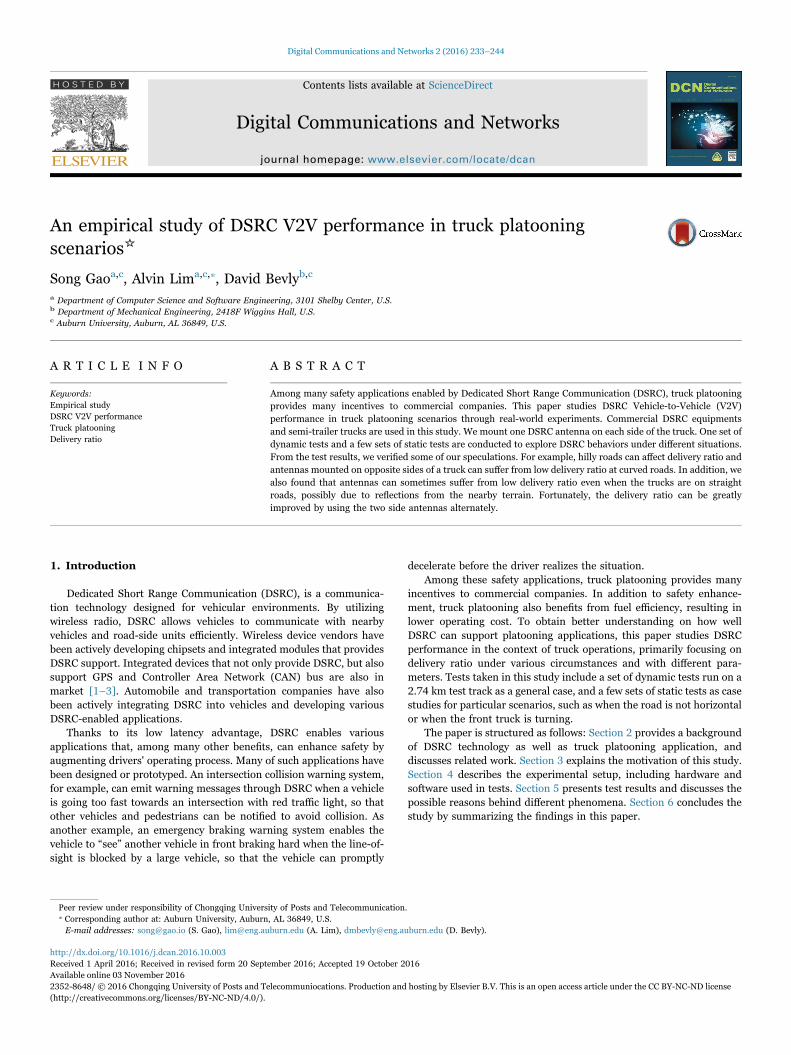
Dedicated Short Range Communication (DSRC), often used inWireless Access in Vehicular Environment (WAVE), is a protocol suitedesigned for low latency networking in vehicular environments. Theprotocol suite [4], as illustrated in Fig. 1, is similar to TCP/IP overWiFi. In fact, it supports the IPv6 stack in parallel with a network andtransport layer protocol called Wave Short Message Protocol (WSMP)that is dedicated to the DSRC suite. The WSMP branch of the protocolsuite enables faster set-up and more space-efficient transmissions.Experimental tests in this paper focus on the WSMP branch of theprotocol suite.
2.1.1. IEEE 802.11pIEEE 802.11p is derived from IEEE 802.11a, an early 5 GHz
protocol used in WiFi. FCC has allocated the spectrum from 5.850 to5.925 GHz, i.e., the “5.9 GHz band”, for DSRC operation in UnitedStates. This spectrum is divided into seven 10 MHz channels (channel172, 174, 176, 178, 180, 182, 184) with 5 MHz guard band at the lowend [4]. Chanel <174, 176> and <180, 182> can be combined into20 MHz channels. This spectrum is higher than the unlicensed 5.8 GHzspectrum used in the WiFi protocols, so DSRC applications do notsuffer from interference generated by WiFi devices. As in the IEEE802.11a protocol, the IEEE 802.11p uses Orthogonal FrequencyDivision Multiplexing (OFDM) for modulation and Carrier SenseMultiple Access/Collision Avoidance (CSMA/CA) for medium accesscontrol.
Unlike other IEEE 802.11 protocols where stations have to join aBasic Service Set (BSS) before they can transmit or receive data, IEEE802.11p defines an Outside Context of BSS (OCB) mode, which is usedin the WSMP branch of the protocol suite. In OCB mode, BSSID field ofthe frame header is set to a wildcard value FF:FF: FF: FF: FF: FF. Itallows stations to transmit and receive data without registering with aninfrastructure device or an existing ad-hoc network. As a result, thetime required to activate a wireless device is significantly reduced.
In addition, the MAC sub-layer has an extension that supportschannel switching, defined in IEEE 1609.4 [5]. One of the seven10 MHz channels is dedicated as the control channel (CCH) whileothers work as service channels (SCHs). Channel switching allowsconcurrent access of CCH and SCHs. This is achieved by dividing each100 ms into a 46 ms CCH interval and a 46 ms SCH interval, eachfollowed by a 4 ms guard interval.
2.1.2. WSMPWSMP, defined in IEEE 1609.3 [6], is the networking service in
DSRC and serves the purposes of the network layer and transport layer
from the TCP/IP stack. WSMP defines a message type that is efficientfor 1-hop transmission. The message type is called Wave ShortMessage (WSM), whose minimum header size is 5 bytes, as shown inTable 1. Compared to UDP over IPv6, which is a similar configurationin the TCP/IP protocol stack that requires a minimum of 52 bytes ofheader, WSM's overhead is much smaller and causes less congestion.Since channel congestion is a significant concern in DSRC, theefficiency of WSMP is quite valuable [4]. On the other hand, beingsuch a minimum protocol, WSMP does not provide many powerfultransport layer functionalities other than multiplexing, which isachieved through the Provider Service Identifier (PSID) field in theWSM header.
2.1.3. Message sub-layerOn the top of WSMP layer is the Message Sub-layer, which provides
direct support to applications. An important standard in this layer isthe SAE J2735 DSRC Message Set [7]. J2735 defines many messagestypes that vehicular applications can utilize. The messages are encodedusing ASN.1 format and always transmitted with WSMP. Each messageis defined as a collection of constituent data structures, called dataelements and data frames. A data element is the most basic datastructure in the J2735 standard. A data frame is a more complex datastructure, composed of one or more data elements or other data frames[4]. These data structures carry various information related to vehi-cular environment, from geometries of vehicle body to the dynamics ofa running vehicle.
2.2. Truck platooning
Truck platooning is one of safety applications that DSRC enables. Intruck platooning, Cooperative Adaptive Cruise Control (CACC) [8]plays an important role. CACC is based on Adaptive Cruise Control(ACC, also known as Autonomous/Active Cruise Control). In additionto maintaining speed like normal Cruise Control, ACC can adjustvehicle speed based on distance between the vehicle and other vehiclesin front of it, i.e., headway distances. The distance detection relies onradar sensors mounted at the front of the vehicle. Due to the latencyfrom the moment when a front vehicle brakes to the moment when theACC enabled vehicle reacts to the decreased headway, safe followingdistance is still quite high in ACC systems.
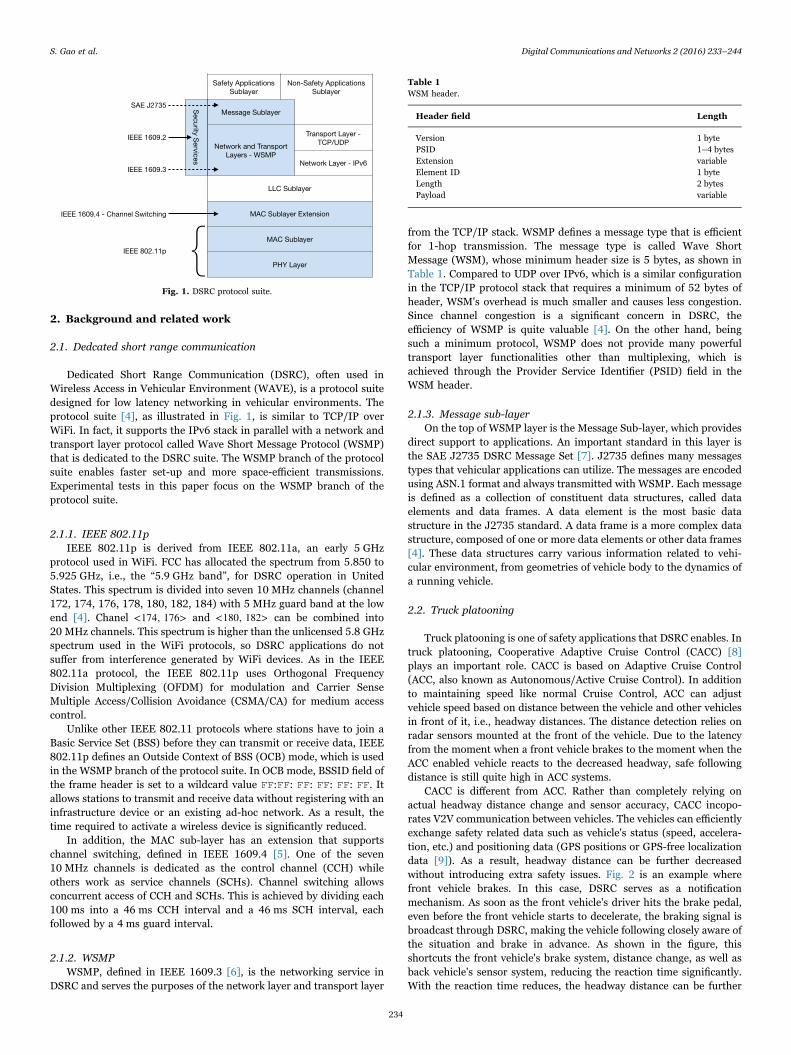
CACC is different from ACC. Rather than completely relying onactual headway distance change and sensor accuracy, CACC incopo-rates V2V communication between vehicles. The vehicles can efficientlyexchange safety related data such as vehicle's status (speed, accelera-tion, etc.) and positioning data (GPS positions or GPS-free localizationdata [9]). As a result, headway distance can be further decreasedwithout introducing extra safety issues. Fig. 2 is an example wherefront vehicle brakes. In this case, DSRC serves as a notificationmechanism. As soon as the front vehicle's driver hits the brake pedal,even before the front vehicle starts to decelerate, the braking signal isbroadcast through DSRC, making the vehicle following closely aware ofthe situation and brake in advance. As shown in the figure, thisshortcuts the front vehicle's brake system, distance change, as well asback vehicle's sensor system, reducing the reaction time significantly.With the reaction time reduces, the headway distance can be further
Fig. 1. DSRC protocol suite.
Table 1WSM header.
Header field Length
Version 1 bytePSID 1–4 bytesExtension variableElement ID 1 byteLength 2 bytesPayload variable
S. Gao et al. Digital Communications and Networks 2 (2016) 233–244
234
reduced on top of ACC, to the point where aerodynamic context canchange significantly.
A close following distance might not be very appealing to consumercars, but it brings huge benefits to commercial trucks. To be specific,short following distance can reduce air resistance (drag) for thevehicles [10], and the drag reduction results in fuel saving (up to11% in some scenarios [11]). Since the largest operating expense oftrucking is fuel, this is of great interest to transportation companies.
2.3. Related work
Bai and Krishnan [12] was the first study to characterize the
application-level reliability of DSRC communication for vehicularsafety communication applications based on real-world experimentaldata. The authors measured packet delivery ratio with varying distancein open field and freeway environment, and analyzed consecutivepacket loss.
Fig. 2. CACC shortcuts control flow of ACC thus reduces reaction time.
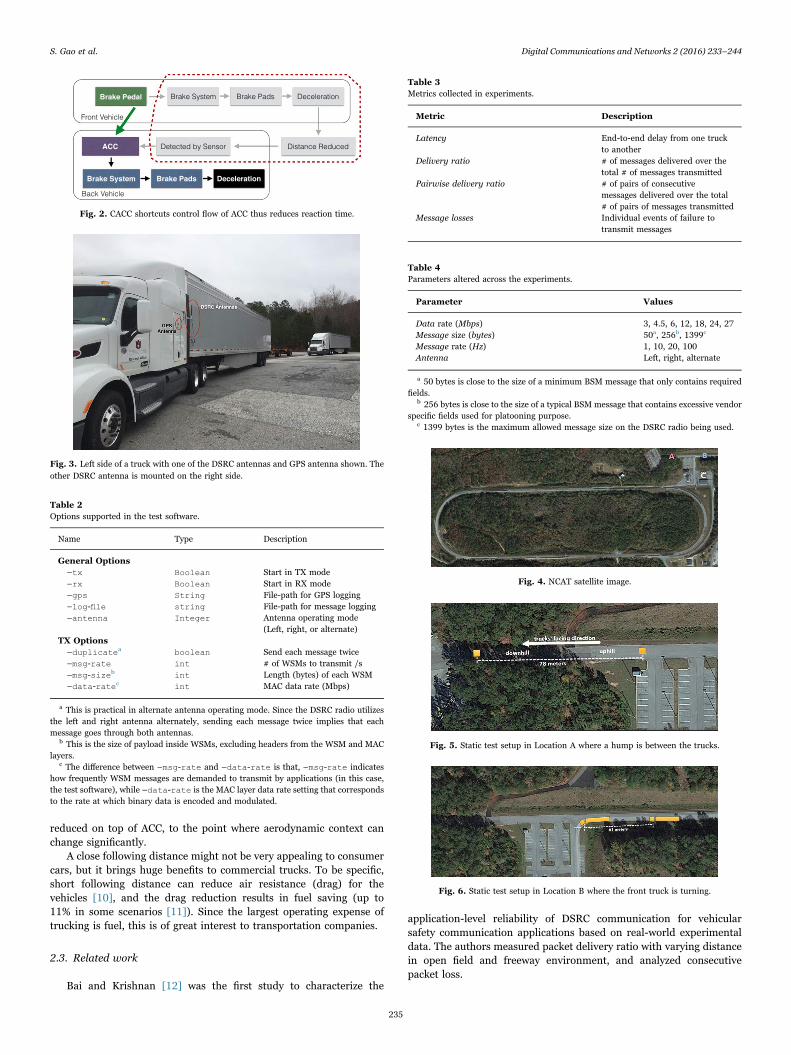
Fig. 3. Left side of a truck with one of the DSRC antennas and GPS antenna shown. Theother DSRC antenna is mounted on the right side.
Table 2Options supported in the test software.
Name Type Description
General Options–tx Boolean Start in TX mode–rx Boolean Start in RX mode–gps String File-path for GPS logging–log-file string File-path for message logging–antenna Integer Antenna operating mode
(Left, right, or alternate)TX Options
–duplicatea boolean Send each message twice–msg-rate int # of WSMs to transmit /s–msg-sizeb int Length (bytes) of each WSM–data-ratec int MAC data rate (Mbps)
a This is practical in alternate antenna operating mode. Since the DSRC radio utilizesthe left and right antenna alternately, sending each message twice implies that eachmessage goes through both antennas.
b This is the size of payload inside WSMs, excluding headers from the WSM and MAClayers.
c The difference between –msg-rate and –data-rate is that, –msg-rate indicateshow frequently WSM messages are demanded to transmit by applications (in this case,the test software), while –data-rate is the MAC layer data rate setting that correspondsto the rate at which binary data is encoded and modulated.
Table 3Metrics collected in experiments.
Metric Description
Latency End-to-end delay from one truckto another
Delivery ratio # of messages delivered over thetotal # of messages transmitted
Pairwise delivery ratio # of pairs of consecutivemessages delivered over the total# of pairs of messages transmitted
Message losses Individual events of failure totransmit messages
Table 4Parameters altered across the experiments.
Parameter Values
Data rate (Mbps) 3, 4.5, 6, 12, 18, 24, 27Message size (bytes) 50a, 256b, 1399c
Message rate (Hz) 1, 10, 20, 100Antenna Left, right, alternate
a 50 bytes is close to the size of a minimum BSM message that only contains requiredfields.
b 256 bytes is close to the size of a typical BSM message that contains excessive vendorspecific fields used for platooning purpose.
c 1399 bytes is the maximum allowed message size on the DSRC radio being used.
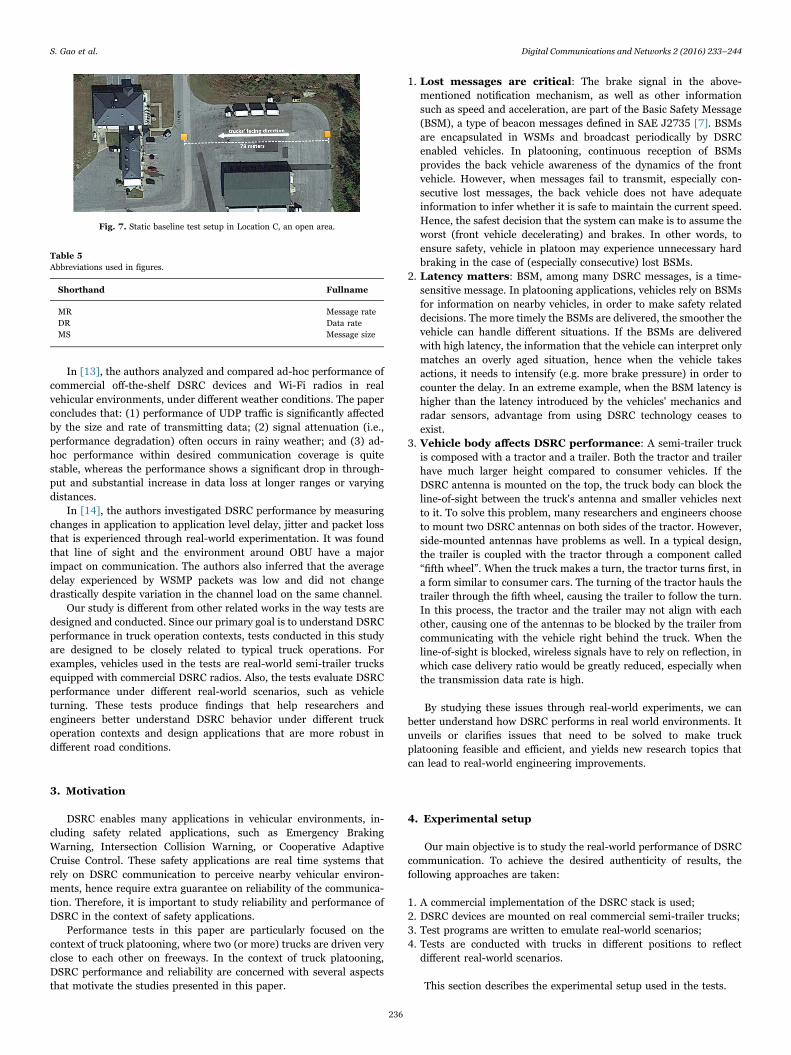
Fig. 4. NCAT satellite image.
Fig. 5. Static test setup in Location A where a hump is between the trucks.
Fig. 6. Static test setup in Location B where the front truck is turning.
S. Gao et al. Digital Communications and Networks 2 (2016) 233–244
235
In [13], the authors analyzed and compared ad-hoc performance ofcommercial off-the-shelf DSRC devices and Wi-Fi radios in realvehicular environments, under different weather conditions. The paperconcludes that: (1) performance of UDP traffic is significantly affectedby the size and rate of transmitting data; (2) signal attenuation (i.e.,performance degradation) often occurs in rainy weather; and (3) ad-hoc performance within desired communication coverage is quitestable, whereas the performance shows a significant drop in through-put and substantial increase in data loss at longer ranges or varyingdistances.
In [14], the authors investigated DSRC performance by measuringchanges in application to application level delay, jitter and packet lossthat is experienced through real-world experimentation. It was foundthat line of sight and the environment around OBU have a majorimpact on communication. The authors also inferred that the averagedelay experienced by WSMP packets was low and did not changedrastically despite variation in the channel load on the same channel.
Our study is different from other related works in the way tests aredesigned and conducted. Since our primary goal is to understand DSRCperformance in truck operation contexts, tests conducted in this studyare designed to be closely related to typical truck operations. Forexamples, vehicles used in the tests are real-world semi-trailer trucksequipped with commercial DSRC radios. Also, the tests evaluate DSRCperformance under different real-world scenarios, such as vehicleturning. These tests produce findings that help researchers andengineers better understand DSRC behavior under different truckoperation contexts and design applications that are more robust indifferent road conditions.
3. Motivation
DSRC enables many applications in vehicular environments, in-cluding safety related applications, such as Emergency BrakingWarning, Intersection Collision Warning, or Cooperative AdaptiveCruise Control. These safety applications are real time systems thatrely on DSRC communication to perceive nearby vehicular environ-ments, hence require extra guarantee on reliability of the communica-tion. Therefore, it is important to study reliability and performance ofDSRC in the context of safety applications.
Performance tests in this paper are particularly focused on thecontext of truck platooning, where two (or more) trucks are driven veryclose to each other on freeways. In the context of truck platooning,DSRC performance and reliability are concerned with several aspectsthat motivate the studies presented in this paper.
1. Lost messages are critical: The brake signal in the above-mentioned notification mechanism, as well as other informationsuch as speed and acceleration, are part of the Basic Safety Message(BSM), a type of beacon messages defined in SAE J2735 [7]. BSMsare encapsulated in WSMs and broadcast periodically by DSRCenabled vehicles. In platooning, continuous reception of BSMsprovides the back vehicle awareness of the dynamics of the frontvehicle. However, when messages fail to transmit, especially con-secutive lost messages, the back vehicle does not have adequateinformation to infer whether it is safe to maintain the current speed.Hence, the safest decision that the system can make is to assume theworst (front vehicle decelerating) and brakes. In other words, toensure safety, vehicle in platoon may experience unnecessary hardbraking in the case of (especially consecutive) lost BSMs.
2. Latency matters: BSM, among many DSRC messages, is a time-sensitive message. In platooning applications, vehicles rely on BSMsfor information on nearby vehicles, in order to make safety relateddecisions. The more timely the BSMs are delivered, the smoother thevehicle can handle different situations. If the BSMs are deliveredwith high latency, the information that the vehicle can interpret onlymatches an overly aged situation, hence when the vehicle takesactions, it needs to intensify (e.g. more brake pressure) in order tocounter the delay. In an extreme example, when the BSM latency ishigher than the latency introduced by the vehicles' mechanics andradar sensors, advantage from using DSRC technology ceases toexist.
3. Vehicle body affects DSRC performance: A semi-trailer truckis composed with a tractor and a trailer. Both the tractor and trailerhave much larger height compared to consumer vehicles. If theDSRC antenna is mounted on the top, the truck body can block theline-of-sight between the truck's antenna and smaller vehicles nextto it. To solve this problem, many researchers and engineers chooseto mount two DSRC antennas on both sides of the tractor. However,side-mounted antennas have problems as well. In a typical design,the trailer is coupled with the tractor through a component called“fifth wheel”. When the truck makes a turn, the tractor turns first, ina form similar to consumer cars. The turning of the tractor hauls thetrailer through the fifth wheel, causing the trailer to follow the turn.In this process, the tractor and the trailer may not align with eachother, causing one of the antennas to be blocked by the trailer fromcommunicating with the vehicle right behind the truck. When theline-of-sight is blocked, wireless signals have to rely on reflection, inwhich case delivery ratio would be greatly reduced, especially whenthe transmission data rate is high.
By studying these issues through real-world experiments, we canbetter understand how DSRC performs in real world environments. Itunveils or clarifies issues that need to be solved to make truckplatooning feasible and efficient, and yields new research topics thatcan lead to real-world engineering improvements.
4. Experimental setup
Our main objective is to study the real-world performance of DSRCcommunication. To achieve the desired authenticity of results, thefollowing approaches are taken:
1. A commercial implementation of the DSRC stack is used;2. DSRC devices are mounted on real commercial semi-trailer trucks;3. Test programs are written to emulate real-world scenarios;4. Tests are conducted with trucks in different positions to reflect
different real-world scenarios.
This section describes the experimental setup used in the tests.
Fig. 7. Static baseline test setup in Location C, an open area.
Table 5Abbreviations used in figures.
Shorthand Fullname
MR Message rateDR Data rateMS Message size
S. Gao et al. Digital Communications and Networks 2 (2016) 233–244
236
4.1. Test hardware setup
The DSRC protocol stack is a complex protocol suite that is difficultto emulate with existing protocols and devices, although most of it isderived from existing technologies. To ensure that the results reflectreal DSRC performance, two commercial DSRC radios are used. TheDSRC radio is an on board unit (OBU) that is commercially available
(the details of the hardware are proprietary), with full implementationof the DSRC stack. It uses two DSRC antennas to transmit and receiveDSRC traffic. Applications can choose one of the antennas, or let thedriver alternate between the two antennas automatically. The devicesupports two interfaces for applications to access the DSRC service: off-board access and on-board access. In off-board access, applications runon a separate device, and access the DSRC service through an Ethernet
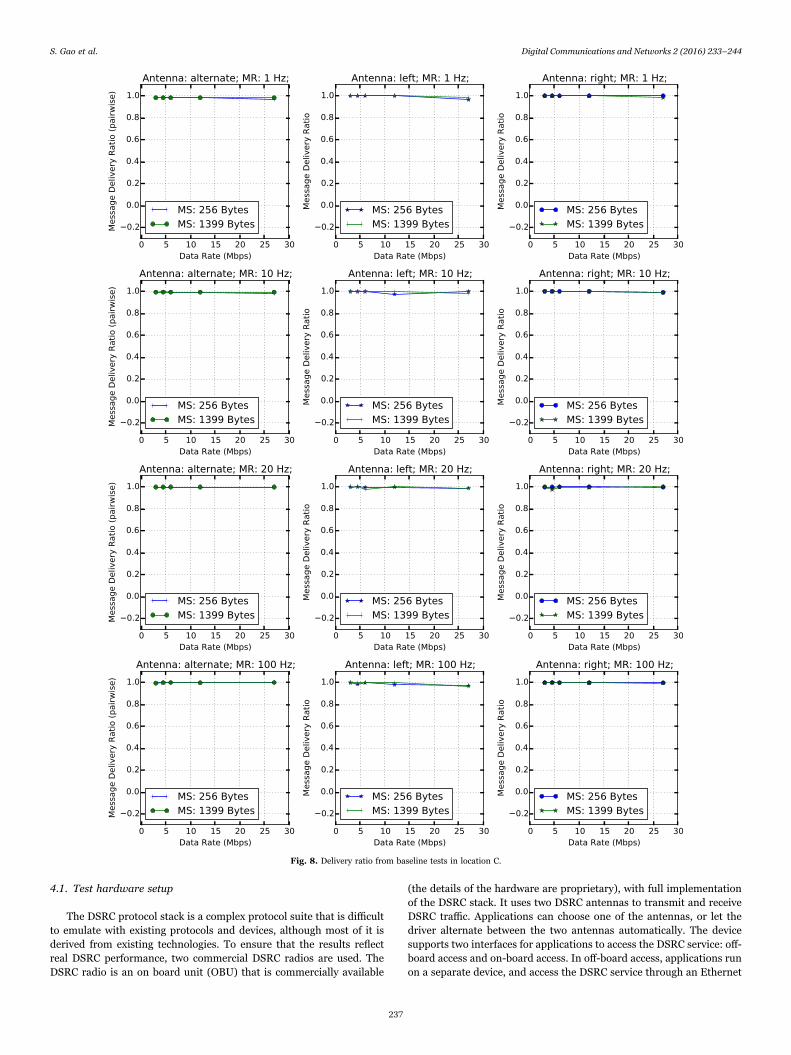
Fig. 8. Delivery ratio from baseline tests in location C.
S. Gao et al. Digital Communications and Networks 2 (2016) 233–244
237
port. This is useful for applications that require extensive processingpower and need a separate hardware unit. In on-board access,applications are built based on the radio's architecture and runs onthe DSRC radio device directly. This is useful for applications that arelight enough to run on the embedded system that may be sensitive tolatency.
To study how DSRC performance can be affected by the truck body,two commercial semi-trailer trucks are used in the tests. Truck tractorsare of model Peterbilt 579, and the trailers attached to the tractors arestandard 53 ft (16.15 m in length) models. On each truck, a pair ofDSRC antennas are mounted on each side of the tractor, located nearthe back panel of the tractor. For this paper, only the upper ones oneach side are used. Since IEEE 1609.4 needs time synchronization,time is acquired from GPS satellites through a GPS antenna that ismounted on left side of the truck and is connected to the DSRC radio.Fig. 3 shows the left side of a truck with the GPS antenna and one of theDSRC antennas.
4.2. Test software
A test software is developed to test the DSRC performance. Itaccepts a few command-line options. The ones that are relevant in thispaper are illustrated in Table 2. The test software works in either TX(transmit) or RX (receive) mode. In TX mode, the software periodicallybroadcasts messages through the WSMP stack according to thespecified parameters. It logs a time-stamp and sequence number foreach message that is being sent out. In RX mode, the software listenson the channel and PSID as configured, and logs a time-stamp and thesequence number whenever it receives a message.
There is a daemon running on the DSRC device that updates thesystem clock using the GPS time. This way, system clocks on the twoDSRC devices running on both trucks are synchronized with onlynanoseconds' error. Since the system clocks are in sync, timestampslogged by the testing software are synchronized as well. By comparing
the timestamps from both trucks, latency can be measured for eachuniquely numbered message. By comparing the sets of messagestransmitted and received, delivery ratio can be calculated as well.
To study how the surrounding environments affect DSRC perfor-mance, it is important to have the trucks' position informationrecorded with each event, e.g., packet losses. To help with this, thetest software also keeps a GPS log file that has GPS coordinates loggedwith timestamps.
As in BSMs, the test software sends messages using a broadcastaddress. This implies that no MAC layer acknowledgements areinvolved and messages are not subjected to MAC layer retransmissions.
4.3. Experiment design
As described in Section 3, the experiments in this paper aredesigned to study the performance and reliability of DSRC in the truckplatooning context. Specifically, the test software is designed to collectdifferent metrics, as illustrated in Table 3, while varying the parametersillustrated in Table 4. Channel 174, a 10 MHz channel at 5.9 GHz band,is used in all tests.
To better understand the dual-antenna configuration used ontrucks, pairwise delivery ratio is introduced in this paper. It is similarto the normal delivery ratio, except that it represents the ratio of themessages delivered from either of a pair of antennas to the total pairs ofmessages sent. In pairwise delivery ratio, delivery of any one of a pair ofduplicate messages indicates successful transmission of the pair. Sincepairwise delivery ratio considers pairs of consecutive messages, it onlymakes sense when the antenna is set to alternate mode.
Tests are conducted at Auburn University's National Center ofAsphalt Technology (NCAT) located at N3235′53.9′′ , W8517′53.8′′ . Thearea is spacious with very simple building structures and features acircular test track that is 2.74 kilometers long. Fig. 4 shows a satelliteview of the area.
Two types of tests are used in this study: dynamic tests and statictests. Dynamic tests are conducted on the trucks running in the testtrack. This gives us insights into DSRC behaviors and individual eventsin different road situations. In the static tests, the trucks are parked atfixed locations. This provides more details on DSRC performance formore specific situations. To be more specific, the following tests areconducted.
1. Dynamic Tests: Both trucks run on the inside lane of the test track,operated by professional drivers. The truck speed is within the rangefrom 70 km/s to 80 km/s, so that 135 s for each test instance wouldcover the entire 2.74 kilometers track. The distance between the twotrucks is maintained according to drivers' ability and judgment, ataround 20 m. Since the trucks are operated by humans, the actualfollowing distance has to be longer than a typical CACC distance. Asreported in [13], weather conditions can affect these results. Hence,we conducted the tests under similar weather conditions. Alldynamic tests in this paper are taken on two lightly cloudy days inApril, with very similar temperature and humidity.
2. Static Tests: The trucks are parked at some desired positions andremain stationary until all tests with different parameters arecompleted. Each test instance runs for 60 s. Positions used in statictests are labeled as A, B, and C in Fig. 4.(a) In Location A, as shown in Fig. 5, only tractors are used. The
front truck (left) is on a downhill, while the back truck (right) ison an uphill. This configuration presents a situation where thereis a small hump between the two trucks that can potentiallyblock the signal or alter ground reflection. They are 78 m awayfrom antenna to antenna.
(b) In Location B, as shown in Fig. 6, trailers are attached to thetractors. The front truck is in a position as if it is turning left,while the back truck is straight. This configuration presents asituation where the trucks are entering a curve and one of the
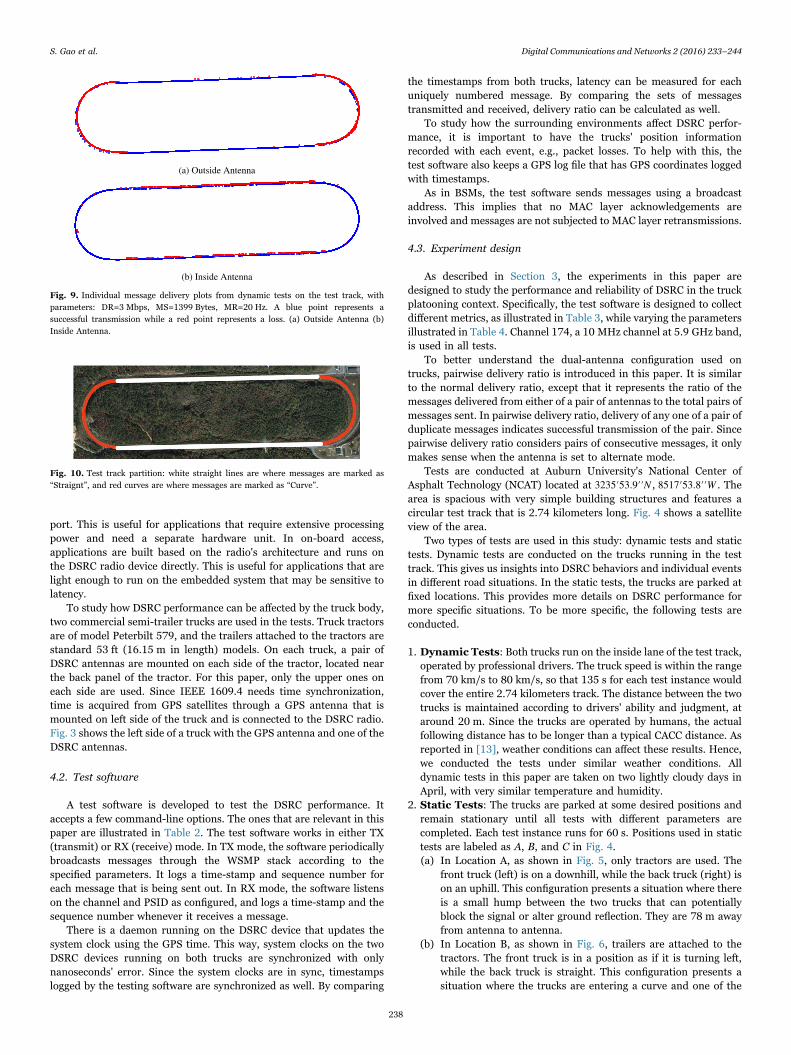
Fig. 9. Individual message delivery plots from dynamic tests on the test track, withparameters: DR=3 Mbps, MS=1399 Bytes, MR=20 Hz. A blue point represents asuccessful transmission while a red point represents a loss. (a) Outside Antenna (b)Inside Antenna.
Fig. 10. Test track partition: white straight lines are where messages are marked as“Straignt”, and red curves are where messages are marked as “Curve”.
S. Gao et al. Digital Communications and Networks 2 (2016) 233–244
238
two side antennas on the front truck may be blocked by itstrailer. In this case, the trucks are 61 m away from antenna toantenna.
(c) In Location C, as shown in Fig. 7, trailers are detached. Thetrucks are placed 78 m away antenna to antenna, in an openarea. No significant structural factors are in this setting. It isused as a baseline configuration to compare with other loca-tions.
5. Test results and discussions
For readability of plots, several abbreviations might be used infigures within this section, as shown in Table 5.
5.1. Delivery ratio and message losses
Several static tests and dynamic tests are conducted to measure thedelivery ratio. To start with, a set of baseline results are presented.
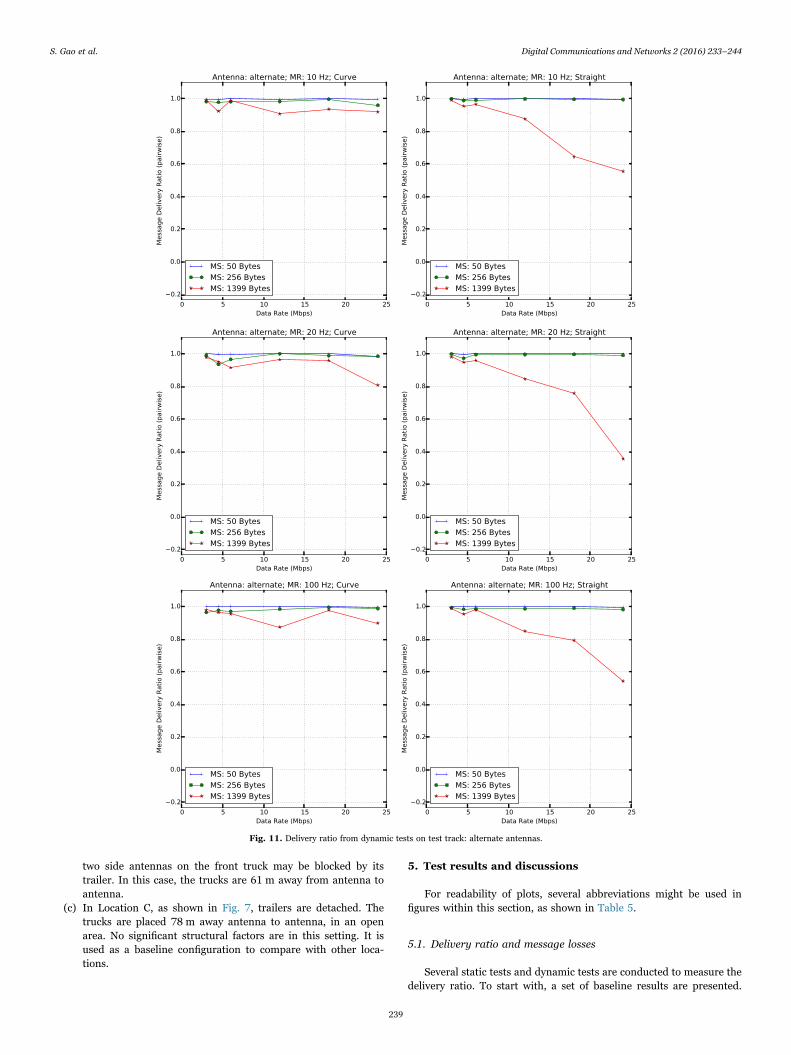
Fig. 11. Delivery ratio from dynamic tests on test track: alternate antennas.
S. Gao et al. Digital Communications and Networks 2 (2016) 233–244
239
Afterwards, dynamic tests and case studies with static tests are shown.
5.1.1. Baseline testsThe baseline tests are taken in Location C as described in Section
4.3. In these tests, as shown in Fig. 8, delivery ratio is close or equal to100% in all parameter settings, except at some data rate when usingone of the two antennas, the delivery ratio drops to about 96%. This islikely due to the reflection from subtle objects around the trucks.
The baseline tests demonstrate that the device is capable ofachieving close-to 100% delivery ratio at long distance (78 m) withoututilizing MAC layer retransmissions.
5.1.2. Dynamic testsThe dynamic tests, as described in Section 4.3, are taken on the test
track. To start with, two individual results are shown in Fig. 9.Transmission of each message is visualized as a dot in the figure.
As expected, outside antenna performs poorly when going throughthe curves. In many portions of the curves, no messages are deliveredat all. This is because the trailer of front truck blocks line-of-sight of theoutside antenna. In addition, an interesting finding from the figure isthat, on the straight parts of the track, inside antenna can suffer fromserious packet losses while outside antenna is mostly fine. A possibleexplanation is that, the woodland that sits in the center of the track canproduce reflections for signals from the inside antenna, and causefading that results in corrupted data. The woodland outside the track,however, has little effect through reflections, because trucks run ininside lane and are further away from woodland outside the truck.
To find out how delivery ratio is related to different parameters in a
comprehensive way, aggregated figures are generated as well. In orderto study how different portion of the track affect delivery ratio,messages logs are partitioned into “Straight” and “Curve” accordingto their logged GPS positions, as illustrated in Fig. 10.
Fig. 11 shows pairwise delivery ratios when the antennas are set toalternating mode. Since the pairwise delivery ratio takes two consecu-tive transmissions (one from inside antenna and the other from outsideantenna) for each message, the advantages for antennas at curves orstraight lines are eliminated. Instead, the delivery ratio is determinedby the best performing antenna at the moment. As shown in the figure,apart from the obvious phenomenon that higher data rates result inlower delivery ratio, one can also see that delivery ratio is actuallybetter at curves than straight lines by comparing the two columns inthe figure. The authors believe this is because at curves, the signals ofinside antenna is less affected by the front truck trailer or nearbyterrain, compared to either antenna on the straight lines.
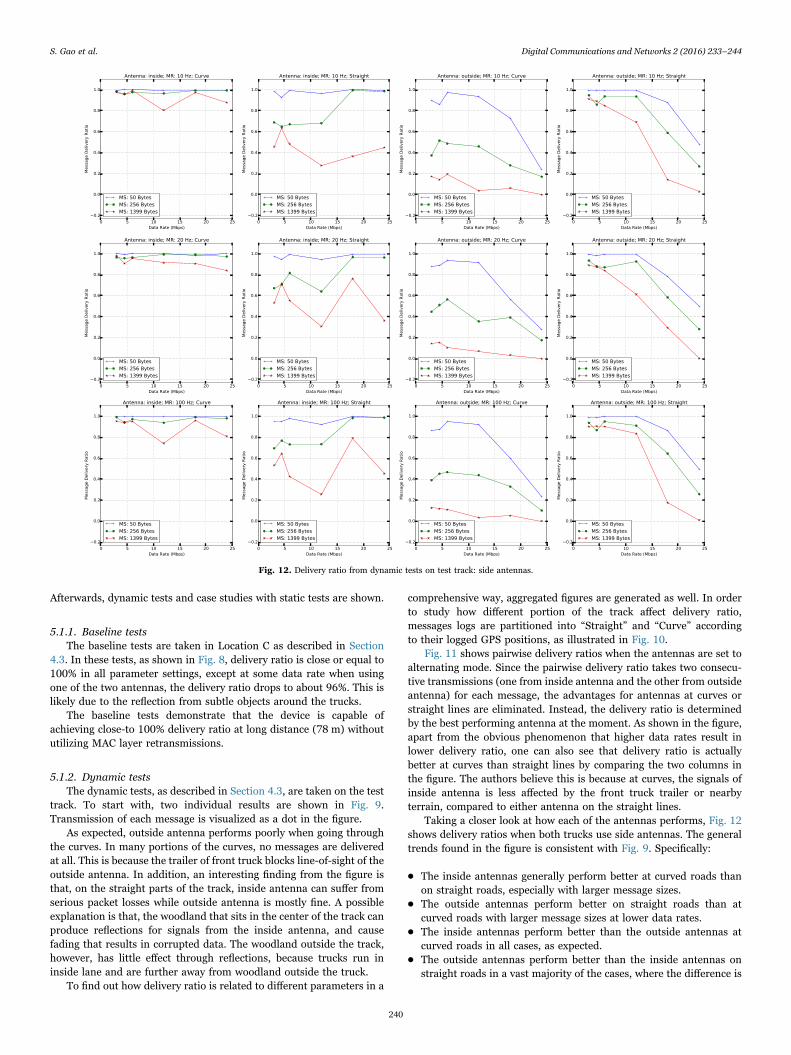
Taking a closer look at how each of the antennas performs, Fig. 12shows delivery ratios when both trucks use side antennas. The generaltrends found in the figure is consistent with Fig. 9. Specifically:
• The inside antennas generally perform better at curved roads thanon straight roads, especially with larger message sizes.
• The outside antennas perform better on straight roads than atcurved roads with larger message sizes at lower data rates.
• The inside antennas perform better than the outside antennas atcurved roads in all cases, as expected.
• The outside antennas perform better than the inside antennas onstraight roads in a vast majority of the cases, where the difference is
Fig. 12. Delivery ratio from dynamic tests on test track: side antennas.
S. Gao et al. Digital Communications and Networks 2 (2016) 233–244
240
much larger at lower data rates.
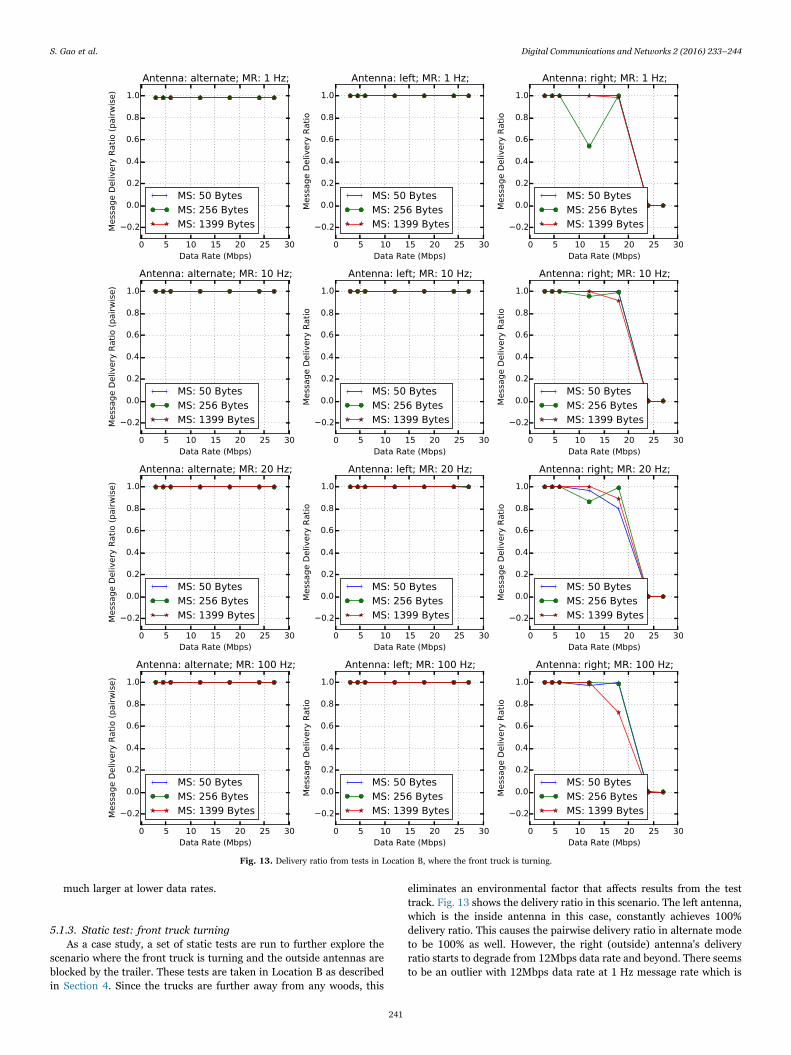
5.1.3. Static test: front truck turningAs a case study, a set of static tests are run to further explore the
scenario where the front truck is turning and the outside antennas areblocked by the trailer. These tests are taken in Location B as describedin Section 4. Since the trucks are further away from any woods, this
eliminates an environmental factor that affects results from the testtrack. Fig. 13 shows the delivery ratio in this scenario. The left antenna,which is the inside antenna in this case, constantly achieves 100%delivery ratio. This causes the pairwise delivery ratio in alternate modeto be 100% as well. However, the right (outside) antenna's deliveryratio starts to degrade from 12Mbps data rate and beyond. There seemsto be an outlier with 12Mbps data rate at 1 Hz message rate which is
Fig. 13. Delivery ratio from tests in Location B, where the front truck is turning.
S. Gao et al. Digital Communications and Networks 2 (2016) 233–244
241
probably due to the smaller sample size at low message rate.
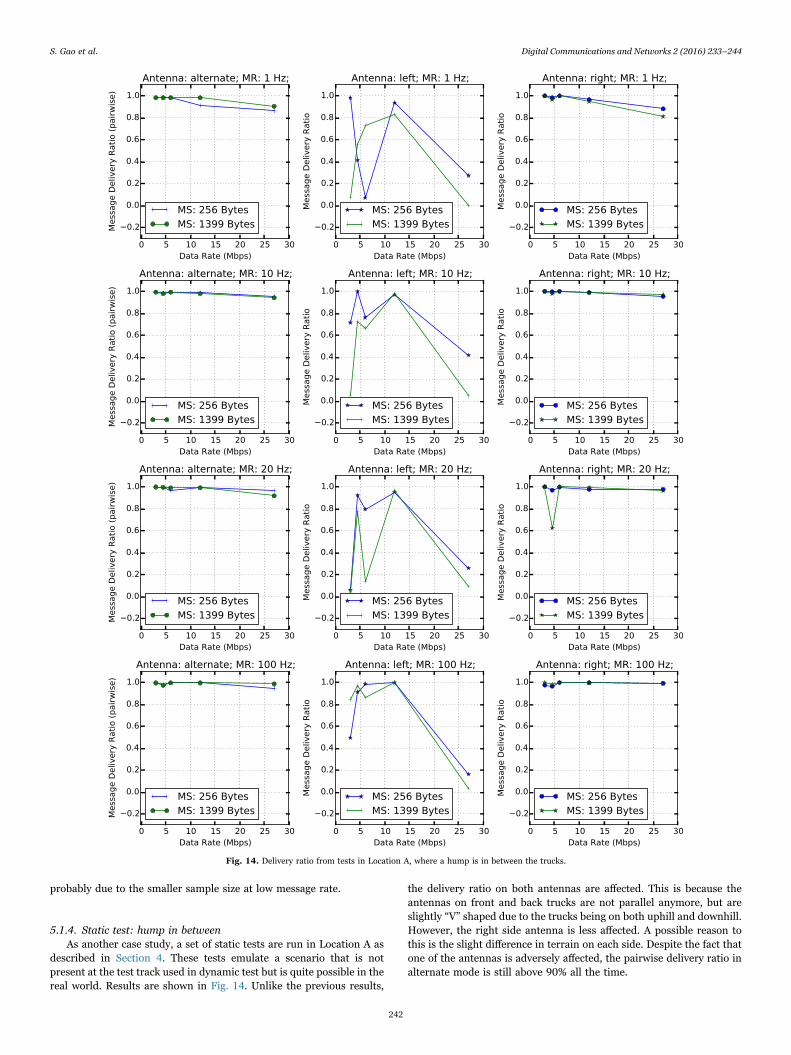
5.1.4. Static test: hump in betweenAs another case study, a set of static tests are run in Location A as
described in Section 4. These tests emulate a scenario that is notpresent at the test track used in dynamic test but is quite possible in thereal world. Results are shown in Fig. 14. Unlike the previous results,
the delivery ratio on both antennas are affected. This is because theantennas on front and back trucks are not parallel anymore, but areslightly “V” shaped due to the trucks being on both uphill and downhill.However, the right side antenna is less affected. A possible reason tothis is the slight difference in terrain on each side. Despite the fact thatone of the antennas is adversely affected, the pairwise delivery ratio inalternate mode is still above 90% all the time.
Fig. 14. Delivery ratio from tests in Location A, where a hump is in between the trucks.
S. Gao et al. Digital Communications and Networks 2 (2016) 233–244
242
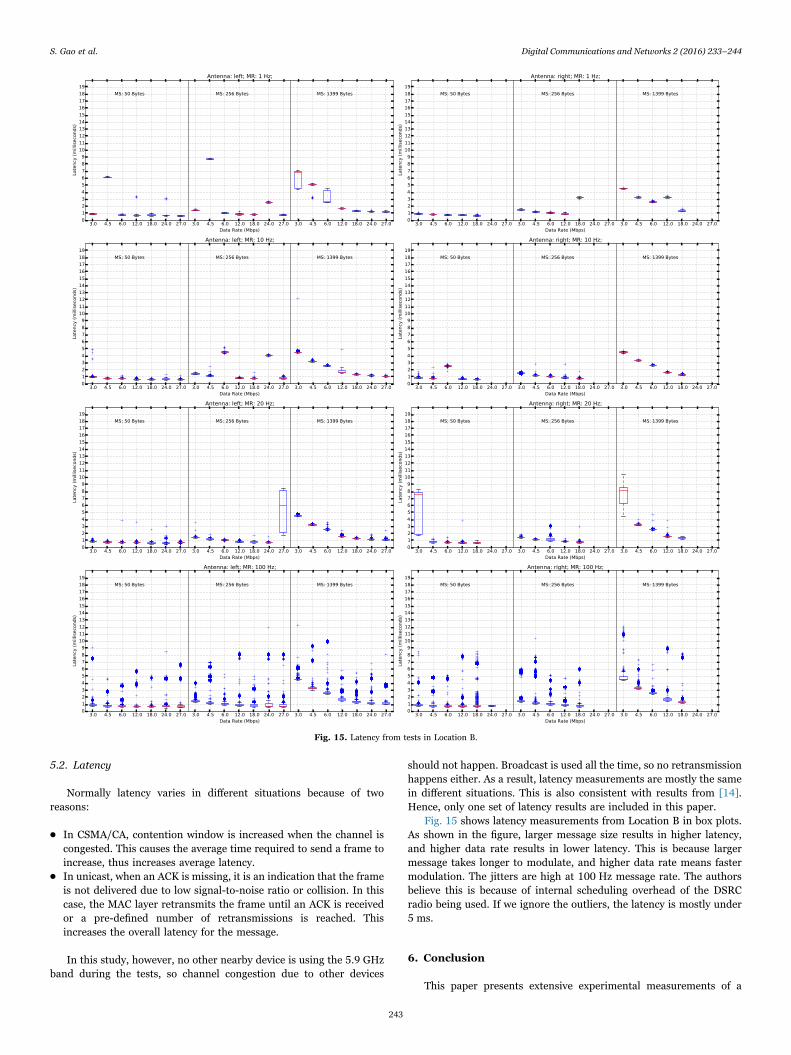
5.2. Latency
Normally latency varies in different situations because of tworeasons:
• In CSMA/CA, contention window is increased when the channel iscongested. This causes the average time required to send a frame toincrease, thus increases average latency.
• In unicast, when an ACK is missing, it is an indication that the frameis not delivered due to low signal-to-noise ratio or collision. In thiscase, the MAC layer retransmits the frame until an ACK is receivedor a pre-defined number of retransmissions is reached. Thisincreases the overall latency for the message.
In this study, however, no other nearby device is using the 5.9 GHzband during the tests, so channel congestion due to other devices
should not happen. Broadcast is used all the time, so no retransmissionhappens either. As a result, latency measurements are mostly the samein different situations. This is also consistent with results from [14].Hence, only one set of latency results are included in this paper.
Fig. 15 shows latency measurements from Location B in box plots.As shown in the figure, larger message size results in higher latency,and higher data rate results in lower latency. This is because largermessage takes longer to modulate, and higher data rate means fastermodulation. The jitters are high at 100 Hz message rate. The authorsbelieve this is because of internal scheduling overhead of the DSRCradio being used. If we ignore the outliers, the latency is mostly under5 ms.
6. Conclusion
This paper presents extensive experimental measurements of a
Fig. 15. Latency from tests in Location B.
S. Gao et al. Digital Communications and Networks 2 (2016) 233–244
243
DSRC device in the context of truck operations. Our main findings canbe summarized as follows:
• In an ideal environment, DSRC achieves nearly 100% delivery ratioat all data rates with any message sizes and rates, even at a distanceas long as 78 m.
• When a truck is turning, the outside antenna may be blocked by itstrailer, affecting delivery ratio, but the inside antenna normallyworks very well. This is more distinguishable at higher data rates.
• While on a straight line with complex terrain nearby, delivery ratiocan still be low, especially with large message size and high datarates. The delivery ratio can even be lower than at curves.
• If the road is hilly, trucks can be misaligned (not parallel) with eachother, resulting in lower delivery ratio. However, in some situations,complex terrains may generate reflections that can improve thedelivery ratio and reduce the adverse effects of hilly roads.
• Using both side antennas alternately can normally improve deliveryratio significantly since it is determined by the best performingantenna at any moment.
• In broadcast contexts, such as BSMs, the major factors that affectlatency are the lower layer components such as OS scheduler, driver,and hardware, rather than the environment.
Acknowledgement
This research is supported in part by the U.S. Federal HighwayAdministration, under Contract No. DTFH61-13-H-00019, entitledHeavy Truck Cooperative Adaptive Cruise Control: Evaluation,Testing, and Stakeholder Engagement for Near Term Deployment.
References
[1] Arada Systems, Locomate products, URL, ⟨http://www.aradasystems.com/
products/⟩.[2] DENSO INTERNATIONAL AMERICA, INC., Denso connected vehicle technology
1, 2012, URL, ⟨http://www.densomedia-na.com/press_kits/naias2012/technology/Jan_9_V2X_Brochure_final%20.pdf⟩.
[3] Unex Technology Corp., Unex: V2x and v2x fusion technology, URL, ⟨http://www.unex.com.tw/v2x⟩.
[4] J. Kenney, Dedicated short-range communications (dsrc) standards in the unitedstates, Proc. IEEE 99 (7) (2011) 1162–1182. http://dx.doi.org/10.1109/JPROC.2011.2132790.
[5] Ieee standard for wireless access in vehicular environments (wave) – multi-channeloperation, IEEE Std 1609.4-2010 (Revision of IEEE Std 1609.4–2006), 2011, pp.1–89, ⟨http://dx.doi.org/10.1109/IEEESTD.2011.5712769⟩.
[6] IEEE standard for wireless access in vehicular environments (wave) – networkingservices, IEEE Std 1609.3–2010 (Revision of IEEE Std 1609.3–2007), 2010, pp. 1–144, ⟨http://dx.doi.org/10.1109/IEEESTD.2010.5680697⟩.
[7] SAE, J2735 Dedicated Short Range Communications (DSRC) Message SetDictionary, Society of Automotive Engineers, DSRC Committee.
[8] K.C. Dey, L. Yan, X. Wang, Y. Wang, H. Shen, M. Chowdhury, L. Yu, C. Qiu,V. Soundararaj, A review of communication, driver characteristics, and controlsaspects of cooperative adaptive cruise control (cacc), IEEE Trans. Intell. Transp.Syst. 17 (2) (2016) 491–509. http://dx.doi.org/10.1109/TITS.2015.2483063.
[9] X. Wang, L. Gao, S. Mao, S. Pandey, Csi-based fingerprinting for indoor localiza-tion: a deep learning approach, IEEE Trans. Veh. Technol. 99 (2016) 1. http://dx.doi.org/10.1109/TVT.2016.2545523.
[10] A. Watts, Computational Characterization of Drag Reduction for Platooning HeavyVehicles, Master’s thesis, Auburn University, 2015.
[11] M.P. Lammert, A. Duran, J. Diez, K. Burton, A. Nicholson, Effect of platooning onfuel consumption of class 8 vehicles over a rangeof speeds, following distances, andmass, SAE Int. J. Commer. Veh. 7 (2014) 626–639. http://dx.doi.org/10.4271/2014-01-2438.
[12] F. Bai, H. Krishnan, Reliability analysis of dsrc wireless communication for vehiclesafety applications, in: Intelligent Transportation Systems Conference, 2006,ITSC'06, IEEE, IEEE, 2006, pp. 355–362.
[13] S. Lee, A. Lim, An empirical study on ad hoc performance of dsrc and wi-fivehicular communications, Int. J. Distrib. Sens. Netw. (2013).
[14] N. Vivek, S. Srikanth, P. Saurabh, T. Vamsi, K. Raju, On field performance analysisof ieee 802.11p and wave protocol stack for v2v amp; v2i communication, in:Information Communication and Embedded Systems (ICICES), 2014 InternationalConference on, 2014, pp. 1–6. ⟨http://dx.doi.org/10.1109/ICICES.2014.7033960⟩.
S. Gao et al. Digital Communications and Networks 2 (2016) 233–244
244