diet, nutrition and the prevention of chronic...
TRANSCRIPT

This report contains the collective views of an international group of experts and does not necessarily represent the decisionsor the stated policy of the World Health Organization or of the Food and Agriculture Organization of the United Nations
WHO Technical Report Series916
DIET, NUTRITION ANDTHE PREVENTION OFCHRONIC DISEASES
Report of aJoint WHO/FAO Expert Consultation
World Health OrganizationGeneva 2003

WHO Library Cataloguing-in-Publication Data
Joint WHO/FAO Expert Consultation on Diet, Nutrition and the Prevention of
Chronic Diseases (2002 : Geneva, Switzerland)
Diet, nutrition and the prevention of chronic diseases: report of a joint WHO/FAO expert
consultation, Geneva, 28 January -- 1 February 2002.
(WHO technical report series ; 916)
1.Chronic disease -- epidemiology 2.Diet -- standards
3.Feeding behavior 4.Energy metabolism 5.Motor activity
6.Cost of illness I.Title II.Series.
ISBN 92 4 120916 X (NLM classification: QU 145)
ISSN 0512-3054
qWorld Health Organization 2003
All rights reserved. Publications of the World Health Organization can be obtained from Marketing and
Dissemination, World Health Organization, 20 avenue Appia, 1211 Geneva 27, Switzerland (tel: +41 22
791 2476; fax: +41 22 791 4857; e-mail: [email protected]). Requests for permission to reproduce or
translateWHOpublications --- whether for sale or for noncommercial distribution --- should be addressed
to Publications, at the above address (fax: +41 22 791 4806; e-mail: [email protected]).
The designations employed and the presentation of the material in this publication do not imply the
expression of any opinion whatsoever on the part of theWorld Health Organization concerning the legal
status of anycountry, territory, city or areaor of its authorities, or concerning thedelimitation of its frontiers
or boundaries. Dotted lines on maps represent approximate border lines for which there may not yet be
full agreement.
The mention of specific companies or of certain manufacturers’ products does not imply that they are
endorsed or recommended by the World Health Organization in preference to others of a similar nature
that are not mentioned. Errors and omissions excepted, the names of proprietary products are
distinguished by initial capital letters.
The World Health Organization does not warrant that the information contained in this publication is
complete and correct and shall not be liable for any damages incurred as a result of its use.
This publication contains the collective views of an international group of experts and does not
necessarily represent the decisions or the stated policy of the World Health Organization or of the Food
and Agriculture Organization of the United Nations.
Typeset and printed in Switzerland

Contents
1. Introduction 1
Reference 3
2. Background 4
2.1 The global burden of chronic diseases 4
2.2 The double burden of diseases in the developing world 8
2.3 An integrated approach to diet-related and nutrition-related diseases 9
References 10
3. Global and regional food consumption patterns and trends 13
3.1 Introduction 13
3.2 Developments in the availability of dietary energy 14
3.3 Availability and changes in consumption of dietary fat 17
3.4 Availability and changes in consumption of animal products 20
3.5 Availability and consumption of fish 22
3.6 Availability and consumption of fruits and vegetables 23
3.7 Future trends in demand, food availability and consumption 25
3.8 Conclusions 27
References 29
4. Diet, nutrition and chronic diseases in context 30
4.1 Introduction 30
4.2 Diet, nutrition and the prevention of chronic diseases
through the life course 31
4.2.1 Fetal development and the maternal environment 31
4.2.2 Infancy 32
4.2.3 Childhood and adolescence 34
4.2.4 Adulthood 38
4.2.5 Ageing and older people 39
4.3 Interactions between early and later factors throughout the life course 40
4.3.1 Clustering of risk factors 41
4.3.2 Intergenerational effects 41
4.4 Gene--nutrient interactions and genetic susceptibility 41
4.5 Intervening throughout life 42
References 46
5. Population nutrient intake goals for preventing diet-related chronic diseases 54
5.1 Overall goals 54
5.1.1 Background 54
5.1.2 Strength of evidence 54
5.1.3 A summary of population nutrient intake goals 55
References 59
iii
5.2 Recommendations for preventing excess weight gain and obesity 61
5.2.1 Background 61
5.2.2 Trends 61
5.2.3 Diet, physical activity and excess weight gain and obesity 61
5.2.4 Strength of evidence 62
5.2.5 General strategies for obesity prevention 67
5.2.6 Disease-specific recommendations 68
References 70
5.3 Recommendations for preventing diabetes 72
5.3.1 Background 72
5.3.2 Trends 72
5.3.3 Diet, physical activity and diabetes 73
5.3.4 Strength of evidence 73
5.3.5 Disease-specific recommendations 77
References 78
5.4 Recommendations for preventing cardiovascular diseases 81
5.4.1 Background 81
5.4.2 Trends 81
5.4.3 Diet, physical activity and cardiovascular disease 81
5.4.4 Strength of evidence 81
5.4.5 Disease-specific recommendations 87
References 91
5.5 Recommendations for preventing cancer 95
5.5.1 Background 95
5.5.2 Trends 95
5.5.3 Diet, physical activity and cancer 95
5.5.4 Strength of evidence 95
5.5.5 Disease-specific recommendations 101
References 101
5.6 Recommendations for preventing dental diseases 105
5.6.1 Background 105
5.6.2 Trends 105
5.6.3 Diet and dental disease 107
5.6.4 Strength of evidence 116
5.6.5 Disease-specific recommendations 119
References 119
5.7 Recommendations for preventing osteoporosis 129
5.7.1 Background 129
5.7.2 Trends 129
5.7.3 Diet, physical activity and osteoporosis 129
5.7.4 Strength of evidence 130
5.7.5 Disease-specific recommendations 131
References 132
6. Strategic directions and recommendations for policy and research 134
6.1 Introduction 134
iv

6.2 Policy principles for the promotion of healthy diets
and physical activity 135
6.3 Prerequisites for effective strategies 136
6.3.1 Leadership for effective action 136
6.3.2 Effective communication 137
6.3.3 Functioning alliances and partnerships 138
6.3.4 Enabling environments 138
6.4 Strategic actions for promoting healthy diets and physical activity 142
6.4.1 Surveillance of people’s diets, physical activity
and related disease burden 142
6.4.2 Enabling people to make informed choices
and take effective action 142
6.4.3 Making the best use of standards and legislation 142
6.4.4 Ensuring that ‘‘healthy diet’’ components are available to all 143
6.4.5 Achieving success through intersectoral initiatives 143
6.4.6 Making the best use of health services and the
professionals who provide them 143
6.5 Call to action 143
Reference 144
Acknowledgements 144
Annex
Summary of the strength of evidence for obesity, type 2 diabetes,
cardiovascular disease (CVD), cancer, dental disease and osteoporosis 148
v

Joint WHO/FAO Expert Consultation on Diet, Nutritionand the Prevention of Chronic Diseases
Geneva, 28 January--1 February 2002
MembersDr E.K. Amine, Dean, High Institute of Public Health, Alexandria University,
Alexandria, Egypt
Dr N.H. Baba, Chairperson, Department of Nutrition and Food Sciences, AmericanUniversity of Beirut, Beirut, Lebanon
Dr M. Belhadj, Professor of Internal Medicine and Diabetologia, Centre HospitalierUniversitaire, Oran, Algeria
Dr M. Deurenberg-Yap, Director, Research and Information Management, HealthPromotion Board, Singapore (Co-Rapporteur)
Dr A. Djazayery, Professor of Nutrition, Department of Nutrition and Biochemistry,School of Public Health, Tehran University of Medical Sciences, Tehran, IslamicRepublic of Iran
Dr T. Forrester, Director, Tropical Medicine Research Institute, The University of theWest Indies, Kingston, Jamaica
Dr D.A. Galuska, Division of Nutrition and Physical Activity, National Center forChronic Disease, Prevention and Health Promotion, Centers for Disease Controland Prevention, Atlanta, GA, USA
Dr S. Herman, Senior Researcher, Nutrition Research and Development Centre,Ministry of Health, Bogor, Indonesia
Professor W.P.T. James, Chairman, International Obesity Task Force, London,England
Dr J.R. M’Buyamba Kabangu, Hypertension Unit, Department of Internal Medicine,University of Kinshasa Hospital, Kinshasa, Democratic Republic of the Congo
Professor M.B. Katan, Division of Human Nutrition and Epidemiology, WageningenUniversity, Wageningen, Netherlands
Dr T.J. Key, Cancer Research UK, Epidemiology Unit, University of Oxford, TheRadcliffe Infirmary, Oxford, England
Professor S. Kumanyika, Center for Clinical Epidemiology and Biostatistics, School ofMedicine, University of Pennsylvania, Philadelphia, PA, USA (Vice-Chairperson)
Professor J. Mann, Department of Human Nutrition, University of Otago, Dunedin,New Zealand
Dr P.J. Moynihan, School of Dental Sciences, University of Newcastle-upon-Tyne,Newcastle-upon-Tyne, England
Dr A.O. Musaiger, Director, Environmental and Biological Programme, BahrainCentre for Studies and Research, Manama, Bahrain
Dr G.W. Olwit, Kampala, Uganda
Dr J. Petkeviciene, Institute for Biomedical Research, Kaunas Medical University,Kaunas, Lithuania
vi

Dr A. Prentice, Director, Human Nutrition Research, Medical Research Council,Cambridge, England
Professor K.S. Reddy, Department of Cardiology, Cardiothoracic Centre, All IndiaInstitute of Medical Science, New Delhi, India
Dr A. Schatzkin, Nutritional Epidemiology Branch, National Cancer Institute, NationalInstitute of Health, Rockville, MD, USA
Professor J.C. Seidell, National Institute of Public Health and the Environment,Bilthoven, Netherlands (Co-Rapporteur)
Dr A.P. Simopoulos, President, The Center for Genetics, Nutrition and Health,Washington, DC, USA
Professor S. Srianujata, Director, Institute of Nutrition, Mahidol University, NakhonPathom, Thailand
Dr N. Steyn, Chronic Diseases of Lifestyle, Medical Research Council, Tygerberg,South Africa
Professor B. Swinburn, School of Health Sciences, Deakin University, Melbourne,Victoria, Australia
Dr R. Uauy, Institute of Nutrition and Food Technology, University of Chile, Santiago,Chile; and Department of Epidemiology and Population Health, London School ofHygiene and Tropical Medicine, London, England (Chairperson)
Dr M. Wahlqvist, Director, Asia Pacific Health and Nutrition Centre, Monash AsiaInstitute, Monash University, Melbourne, Victoria, Australia
Professor Wu Zhao-Su, Institute of Heart, Lung and Blood Vessel Diseases, Beijing,China
Dr N. Yoshiike, Division of Health and Nutrition Monitoring, National Institute of Healthand Nutrition, Tokyo, Japan
Representatives of other organizations*
UnitedNationsAdministrativeCommittee onCoordination/Subcommittee onNutrition(ACC/SCN),
Dr S. Rabenek, Technical Secretary, ACC/SCN, Geneva, Switzerland
Secretariat{
Dr K. Bagchi, Regional Adviser, Nutrition, Food Security and Safety, WHO RegionalOffice for the Eastern Mediterranean, Cairo, Egypt
Dr T. Cavalli-Sforza, Regional Adviser, Nutrition,WHORegionalOffice for theWesternPacific, Manila, Philippines
* Unable to attend: International Atomic Energy Agency, Vienna, Austria; Secretariat of the PacificCommunity, Noumea, New Caledonia; United Nations Children’s Fund, New York, NY, USA; UnitedNations University, Tokyo, Japan; World Bank, Washington, DC, USA.
{ Unable to attend: Dr H. Delgado, Director, Institute of Nutrition of Central America and Panama,Guatemala City, Guatemala; Dr F.J. Henry, Director, Caribbean Food and Nutrition Institute, TheUniversity of the West Indies, Kingston, Jamaica.
vii

Dr G.A. Clugston, Director, Department of Nutrition for Health and Development,SustainableDevelopment andHealthy Environments,WHO,Geneva, Switzerland
Dr I. Darnton-Hill, Department of Noncommunicable Disease Prevention and HealthPromotion, Noncommunicable Diseases and Mental Health, WHO, Geneva,Switzerland
Professor A. Ferro-Luzzi, National Institute for Food and Nutrition Research, Rome,Italy (Temporary Adviser)
Dr J. Leowski, Regional Adviser, Noncommunicable Diseases, WHORegional Officefor South-East Asia, New Delhi, India
Dr C. Nishida, Department of Nutrition for Health and Development, SustainableDevelopment and Healthy Environments, WHO, Geneva, Switzerland (Secretary)
Dr D. Nyamwaya, Medical Officer, Health Promotion, WHORegional Office for Africa,Harare, Zimbabwe
Dr A. Ouedraogo, Regional Officer, Nutrition, WHORegional Office for Africa, Harare,Zimbabwe
Dr P. Pietinen, Department of Noncommunicable Disease Prevention and HealthPromotion, Noncommunicable Diseases and Mental Health, WHO, Geneva,Switzerland
Dr P. Puska, Director, Department of Noncommunicable Disease Prevention andHealth Promotion, Noncommunicable Diseases and Mental Health, WHO,Geneva, Switzerland
Dr E. Riboli, International Agency for Research on Cancer, Lyon, France
Dr A. Robertson, Regional Adviser, Nutrition and Food Security Programme, WHORegional Office for Europe, Copenhagen, Denmark
Dr P. Shetty, Chief, Nutrition Planning, Assessment and Evaluation Service, Food andNutrition Division, FAO, Rome, Italy
Dr R. Weisell, Nutrition Planning, Assessment and Evaluation Service, Food andNutrition Division, FAO, Rome, Italy
Dr D. Yach, Executive Director, Noncommunicable Diseases and Mental Health,WHO, Geneva, Switzerland
viii

Abbreviations
The following abbreviations are used in this report:
ACC United Nations Administrative Committee on Coordination
AIDS acquired immunodeficiency syndrome
BMI body mass index
CARMEN Carbohydrate Ratio Management in European National diets
CHD coronary heart disease
CVD cardiovascular disease
DALY disability-adjusted life year
DASH dietary approaches to stop hypertension
DEXA dual-energy X-ray absorptiometry
DHA docosahexaenoic acid
dmf decayed, missing, filled primary (teeth)
DMF decayed, missing, filled permanent (teeth)
dmft decayed, missing, filled primary teeth
DMFT decayed, missing, filled permanent teeth
DONALD Dortmund Nutritional and Anthropometric LongitudinallyDesigned Study
ECC early childhood caries
EPA eicosapentaenoic acid
EPIC European Prospective Investigation into Cancer and Nutrition
ERGOB European Research Group for Oral Biology
FAOSTAT Food and Agricultural Organization of the United NationsStatistical Databases
FER fat to energy ratio
GDP gross domestic product
GISSI Gruppo Italiano por lo Studio della Sopravvivenza nell’InfartoMiocardico
GNP gross national product
HBP high blood pressure
HDL high-density lipoprotein
HFI hereditary fructose intolerance
HIV human immunodeficiency virus
HOPE Heart Outcomes Prevention Evaluation
IARC International Agency for Research on Cancer
IDDM insulin-dependent diabetes mellitus
IGT impaired glucose tolerance
IHD ischaemic heart disease
ix

IUGR intrauterine growth retardation
LDL low-density lipoprotein
MGRS multicentre growth reference study (i.e. the WHO MGRS study)
mRNA messenger ribonucleic acid
MSG monosodium glutamate
MUFA monounsaturated fatty acid
NCD noncommunicable disease
NGO nongovernmental organization
NIDDM non-insulin-dependent diabetes mellitus
NSP non-starch polysaccharides
PUFA polyunsaturated fatty acid
RCT randomized controlled trial
SCN ACC Subcommittee on Nutrition1
SFA saturated fatty acid
T1DM type 1 diabetes
T2DM type 2 diabetes
VLDL very low-density lipoprotein
WCRF World Cancer Research Fund
WHR waist:hip circumference ratio or waist:hip ratio
1 In April 2002 the name of the Subcommittee on Nutrition was changed to the United Nations SystemStanding Committee on Nutrition.
x

1. Introduction
A Joint WHO/FAO Expert Consultation on Diet, Nutrition and thePrevention of Chronic Diseases met in Geneva from 28 January to1 February 2002. The meeting was opened by Dr D. Yach, ExecutiveDirector, Noncommunicable Diseases and Mental Health, WHO, onbehalf of theDirectors-General of theFoodandAgricultureOrganizationof the United Nations and the World Health Organization. TheConsultation followed up the work of a WHO Study Group on Diet,Nutrition and Prevention of Noncommunicable Diseases, which had metin 1989 to make recommendations regarding the prevention of chronicdiseases and the reduction of their impact (1). The Consultationrecognized that the growing epidemic of chronic disease afflicting bothdeveloped and developing countries was related to dietary and lifestylechanges and undertook the task of reviewing the considerable scientificprogress that has beenmade in different areas. For example, there is betterepidemiological evidence for determining certain risk factors, and theresults of a number of new controlled clinical trials are now available. Themechanisms of the chronic disease process are clearer, and interventionshave been demonstrated to reduce risk.
During the past decade, rapid expansion in a number of relevantscientific fields and, in particular, in the amount of population-basedepidemiological evidence has helped to clarify the role of diet inpreventing and controllingmorbidity and prematuremortality resultingfrom noncommunicable diseases (NCDs). Some of the specific dietarycomponents that increase the probability of occurrence of these diseasesin individuals, and interventions to modify their impact, have also beenidentified.
Furthermore, rapid changes in diets and lifestyles that have occurredwith industrialization, urbanization, economic development andmarketglobalization, have accelerated over the past decade. This is having asignificant impact on the health and nutritional status of populations,particularly in developing countries and in countries in transition.Whilestandards of living have improved, food availability has expanded andbecomemore diversified, and access to services has increased, there havealso been significant negative consequences in terms of inappropriatedietary patterns, decreased physical activities and increased tobacco use,and a corresponding increase in diet-related chronic diseases, especiallyamong poor people.
Food and food products have become commodities produced andtraded in amarket that has expanded from an essentially local base to anincreasingly global one. Changes in the world food economy are
1

reflected in shifting dietary patterns, for example, increased consump-tion of energy-dense diets high in fat, particularly saturated fat, and lowin unrefined carbohydrates. These patterns are combined with a declinein energy expenditure that is associated with a sedentary lifestyle ---motorized transport, labour-saving devices in the home, the phasing outof physically demandingmanual tasks in the workplace, and leisure timethat is preponderantly devoted to physically undemanding pastimes.
Because of these changes in dietary and lifestyle patterns, chronic NCDs--- including obesity, diabetes mellitus, cardiovascular disease (CVD),hypertension and stroke, and some types of cancer --- are becomingincreasingly significant causes of disability and premature death in bothdeveloping and newly developed countries, placing additional burdenson already overtaxed national health budgets.
The Consultation provided an opportune moment for FAO and WHOto draw on the latest scientific evidence available and to updaterecommendations for action to governments, international agencies andconcerned partners in the public and private sectors. The overall aim ofthese recommendations is to implement more effective and sustainablepolicies and strategies to dealwith the increasingpublic health challengesrelated to diet and health.
The Consultation articulated a new platform, not just of dietary andnutrient targets, but of a concept of the human organism’s subtle andcomplex relationship to its environment in relation to chronic diseases.The discussions took into account ecological, societal and behaviouralaspects beyond causative mechanisms. The experts looked at diet withinthe context of the macroeconomic implications of public healthrecommendations on agriculture, and the global supply and demand forfoodstuffs, both fresh and processed. The role of diet in defining theexpression of genetic susceptibility toNCDs, the need for responsible andcreative partnerships with both traditional and non-traditional partners,andthe importanceofaddressing thewhole life course,wereall recognized.
Nutrition is coming to the fore as a major modifiable determinant ofchronic disease, with scientific evidence increasingly supporting the viewthat alterations in diet have strong effects, both positive and negative, onhealth throughout life. Most importantly, dietary adjustments may notonly influence present health, but may determine whether or not anindividual will develop such diseases as cancer, cardiovascular diseaseand diabetesmuch later in life. However, these concepts have not led to achange in policies or in practice. In many developing countries, foodpolicies remain focused only on undernutrition and are not addressingthe prevention of chronic disease.
2
Although the primary purpose of the Consultation was to examine anddevelop recommendations for diet and nutrition in the prevention ofchronic diseases, the need for sufficient physical activity was alsodiscussed and is therefore emphasized in the report. This emphasis isconsistent with the trend to consider physical activity alongside thecomplex of diet, nutrition and health. Some relevant aspects include:
. Energy expenditure through physical activity is an important part ofthe energy balance equation that determines body weight. A decreasein energy expenditure throughdecreasedphysical activity is likely to beone of the major factors contributing to the global epidemic ofoverweight and obesity.
. Physical activity has great influence on body composition --- on theamount of fat, muscle and bone tissue.
. To a large extent, physical activity and nutrients share the samemetabolic pathways and can interact in variousways that influence therisk and pathogenesis of several chronic diseases.
. Cardiovascular fitness andphysical activity have been shown to reducesignificantly the effects of overweight and obesity on health.
. Physical activity and food intake are both specific and mutuallyinteracting behaviours that are and can be influenced partly by thesame measures and policies.
. Lack of physical activity is already a global health hazard and is aprevalent and rapidly increasing problem in both developed anddeveloping countries, particularly among poor people in large cities.
In order to achieve the best results in preventing chronic diseases, thestrategies and policies that are applied must fully recognize the essentialrole of diet, nutrition and physical activity.
This report calls for a shift in the conceptual framework for developingstrategies for action, placing nutrition --- together with the otherprincipal risk factors for chronic disease, namely, tobacco use andalcohol consumption --- at the forefront of public health policies andprogrammes.
Reference
1. Diet, nutrition, and the prevention of chronic diseases. Report of a WHO StudyGroup.Geneva,WorldHealthOrganization, 1990 (WHOTechnical Report Series,No. 797).
3

2. Background
2.1 The global burden of chronic diseases
Diet and nutrition are important factors in the promotion andmaintenance of good health throughout the entire life course. Theirrole as determinants of chronic NCDs is well established and theytherefore occupy a prominent position in prevention activities (1).
The latest scientific evidence on the nature and strength of the linksbetween diet and chronic diseases is examined and discussed in detail inthe following sections of this report. This section gives an overall view ofthe current situation and trends in chronic diseases at the global level.The chronic diseases considered in this report are those that are related todiet and nutrition and present the greatest public health burden, either interms of direct cost to society and government, or in terms of disability-adjusted life years (DALYs). These include obesity, diabetes, cardio-vascular diseases, cancer, osteoporosis and dental diseases.
The burden of chronic diseases is rapidly increasing worldwide. It hasbeen calculated that, in 2001, chronic diseases contributed approxi-mately 60% of the 56.5 million total reported deaths in the world andapproximately 46% of the global burden of disease (1). The proportionof the burden of NCDs is expected to increase to 57% by 2020. Almosthalf of the total chronic disease deaths are attributable to cardiovasculardiseases; obesity and diabetes are also showingworrying trends, not onlybecause they already affect a large proportion of the population, but alsobecause they have started to appear earlier in life.
The chronic disease problem is far from being limited to the developedregions of the world. Contrary to widely held beliefs, developingcountries are increasingly suffering from high levels of public healthproblems related to chronic diseases. In five out of the six regions ofWHO, deaths caused by chronic diseases dominate the mortalitystatistics (1). Although human immunodeficiency virus/acquiredimmunodeficiency syndrome (HIV/AIDS), malaria and tuberculosis,along with other infectious diseases, still predominate in sub-SaharanAfrica and will do so for the foreseeable future, 79% of all deathsworldwide that are attributable to chronic diseases are already occurringin developing countries (2).
It is clear that the earlier labelling of chronic diseases as ‘‘diseases ofaffluence’’ is increasingly a misnomer, as they emerge both in poorercountries and in the poorer population groups in richer countries. Thisshift in the pattern of disease is taking place at an accelerating rate;furthermore, it is occurring at a faster rate in developing countries than itdid in the industrialized regions of the world half a century ago (3). This
4

rapid rate of change, together with the increasing burden of disease, iscreating a major public health threat which demands immediate andeffective action.
It has been projected that, by 2020, chronic diseases will account foralmost three-quarters of all deaths worldwide, and that 71% of deathsdue to ischaemic heart disease (IHD), 75% of deaths due to stroke, and70%of deaths due to diabetes will occur in developing countries (4). Thenumber of people in the developing world with diabetes will increase bymore than 2.5-fold, from 84million in 1995 to 228million in 2025 (5). Ona global basis, 60% of the burden of chronic diseases will occur indeveloping countries. Indeed, cardiovascular diseases are even nowmore numerous in India and China than in all the economicallydeveloped countries in the world put together (2). As for overweight andobesity, not only has the current prevalence already reached unprece-dented levels, but the rate at which it is annually increasing in mostdeveloping regions is substantial (3). The public health implications ofthis phenomenon are staggering, and are already becoming apparent.
The rapidity of the changes in developing countries is such that a doubleburden of disease may often exist. India, for example, at present faces acombination of communicable diseases and chronic diseases, with theburden of chronic diseases just exceeding that of communicable diseases.Projections nevertheless indicate that communicable diseases will stilloccupy a critically important position up to 2020 (6). Another eloquentexample is that of obesity, which is becoming a serious problemthroughout Asia, Latin America and parts of Africa, despite thewidespread presence of undernutrition. In some countries, the pre-valence of obesity has doubled or tripled over the past decade.
Chronic diseases are largely preventable diseases. Although more basicresearchmay be needed on some aspects of themechanisms that link dietto health, the currently available scientific evidence provides asufficiently strong and plausible basis to justify taking action now.Beyond the appropriatemedical treatment for those already affected, thepublic health approach of primary prevention is considered to be themost cost-effective, affordable and sustainable course of action to copewith the chronic disease epidemicworldwide.The adoptionof a commonrisk-factor approach to chronic disease prevention is a major develop-ment in the thinking behind an integrated health policy. Sometimeschronic diseases are considered communicable at the risk factor level (7).Modern dietary patterns and physical activity patterns are riskbehaviours that travel across countries and are transferable from onepopulation to another like an infectious disease, affecting diseasepatterns globally.
5

While age, sex and genetic susceptibility are non-modifiable,manyof therisks associated with age and sex are modifiable. Such risks includebehavioural factors (e.g. diet, physical inactivity, tobacco use, alcoholconsumption); biological factors (e.g. dyslipidemia, hypertension,overweight, hyperinsulinaemia); and finally societal factors, whichinclude a complex mixture of interacting socioeconomic, cultural andother environmental parameters.
Diet has been known formany years to play a key role as a risk factor forchronic diseases. What is apparent at the global level is that greatchanges have swept the entireworld since the secondhalf of the twentiethcentury, inducing major modifications in diet, first in industrial regionsand more recently in developing countries. Traditional, largely plant-based diets have been swiftly replaced by high-fat, energy-dense dietswith a substantial content of animal-based foods. But diet, while criticalto prevention, is just one risk factor. Physical inactivity, now recognizedas an increasingly important determinant of health, is the result of aprogressive shift of lifestyle towards more sedentary patterns, indeveloping countries as much as in industrialized ones. Recent datafrom Sao Paulo, Brazil, for example, indicate that 70--80% of thepopulation are remarkably inactive (8). The combination of these andother risk factors, such as tobacco use, is likely to have an additive oreven a multiplier effect, capable of accelerating the pace at which thechronic disease epidemic is emerging in the developing countries.
The need for action to strengthen control and prevention measures tocounter the spread of the chronic disease epidemic is now widelyrecognized by many countries, but the developing countries are laggingbehind in implementing suchmeasures. Encouragingly, however, effortsto counteract the rise in chronic diseases are increasingly being assignedahigher priority. This situation is reflected by the growing interest ofMemberStates, the concerned internationalandbilateral agencies aswellas nongovernmental organizations in addressing food and nutritionpolicy, health promotion, and strategy for the control and prevention ofchronicdiseases, aswell as other related topics suchaspromotinghealthyageing and tobacco control. The 1992 International Conference onNutrition specifically identified the need to prevent and control theincreasing public health problems of chronic diseases by promotingappropriate diets and healthy lifestyles (9--11). The need to addresschronic disease prevention from a broad-based perspective was alsorecognized by theWorldHealthAssembly in 1998 (12) and again in 1999(13). In 2000, theWorldHealth Assembly passed a further resolution onthe broad basis of the prevention and control of noncommunicablediseases (14), and in 2002 adopted a resolution that urgedMember Statesto collaborate with WHO to develop ‘‘...a global strategy on diet,
6

physical activity and health for the prevention and control ofnoncommunicable diseases, based on evidence and best practices, withspecial emphasis on an integrated approach...’’ (15).
Several factors have constrained progress in the prevention of chronicdiseases. These include underestimation of the effectiveness of interven-tions, the belief of there being a long delay in achieving any measurableimpact, commercial pressures, institutional inertia and inadequateresources. These aspects need to be taken seriously and combated. Oneexample is provided by Finland. In North Karelia, age-adjustedmortality rates of coronary heart disease dropped dramatically betweenthe early 1970s and 1995 (16). Analyses of the three main risk factors(smoking, high blood pressure, raised plasma cholesterol) indicate thatdiet --- operating through lowering plasma cholesterol and bloodpressure levels --- accounted for the larger part of this substantial declinein cardiovascular disease. The contribution made by medication andtreatment (antilipid and hypotensive drugs, surgery) was very small.Rather, the decline was largely achieved through community action andthe pressure of consumer demand on the food market. The Finnish andother experience indicates that interventions can be effective, thatdietary changes are important, that these changes canbe strengthenedbypublic demand, and finally that appreciable changes can take place veryrapidly. The experience of theRepublic ofKorea is also notable since thecommunity has largely maintained its traditional high-vegetable dietdespite major social and economic change (17). The Republic of Koreahas lower rates of chronic diseases and lower than expected level of fatintake and obesity prevalence than other industrialized countries withsimilar economic development (18).
There are several opportunities for new global and national actions,including strengthened interaction and partnerships; regulatory, legis-lative and fiscal approaches; and more stringent accountabilitymechanisms.
The broad parameters for a dialogue with the food industries are: lesssaturated fat; more fruits and vegetables; effective food labelling; andincentives for the marketing and production of healthier products. Inworking with advertising, media and entertainment partners, there is aneed to stress the importance of clear and unambiguous messages tochildren and youths. Global ‘‘health and nutrition literacy’’ requires avast increase in attention and resources.
Many studies show a relationship between health and income, with thepoorest sections of the population being the most vulnerable. Poorpeople are at an increased social disadvantage in termsof the incidence ofchronic diseases, as well as access to treatment. They also show lower
7

rates of acceptance of health-promoting behaviours compared withother sectors of society. Thus, policies need to favour the poor andappropriately targeted, as poor people aremost at risk and have the leastpower to effect change.
2.2 The double burden of diseases in the developing world
Hunger and malnutrition remain among the most devastating problemsfacing the majority of the world’s poor and needy people, and continueto dominate the health of the world’s poorest nations. Nearly 30% ofhumanity are currently suffering from one ormore of themultiple formsof malnutrition (19).
The tragic consequences of malnutrition include death, disability,stunted mental and physical growth, and as a result, retarded nationalsocioeconomic development. Some 60% of the 10.9 million deaths eachyear among children aged under five years in the developing world areassociated with malnutrition (20). Iodine deficiency is the greatest singlepreventable cause of brain damage and mental retardation worldwide,and is estimated to affect more than 700 million people, most of themlocated in the less developed countries (21). Over 2000 million peoplehave iron deficiency anaemia (22). Vitamin A deficiency remains thesingle greatest preventable cause of needless childhood blindness andincreased risk of premature childhood mortality from infectiousdiseases, with 250 million children under five years of age sufferingfrom subclinical deficiency (23). Intrauterine growth retardation,defined as birth weight below the 10th percentile of the birth-weight-for-gestational-age reference curve, affects 23.8% or approximately 30million newborn babies per year, profoundly influencing growth,survival, and physical and mental capacity in childhood (24). It alsohas major public health implications in view of the increased risk ofdeveloping diet-related chronic diseases later in life (25--31).
Given the rapidity with which traditional diets and lifestyles arechanging in many developing countries, it is not surprising that foodinsecurity andundernutritionpersist in the same countrieswhere chronicdiseases are emerging as amajor epidemic. The epidemic of obesity, withits attendant comorbidities --- heart disease, hypertension, stroke, anddiabetes --- is not a problem limited to industrialized countries (32).Children are in a similar situation; a disturbing increase in the prevalenceof overweight among this group has taken place over the past 20 years indeveloping countries as diverse as India, Mexico, Nigeria and Tunisia(33). The increasing prevalence of obesity in developing countries alsoindicates that physical inactivity is an increasing problem in thosecountries as well.
8

In the past, undernutrition and chronic diseases were seen as two totallyseparate problems, despite being present simultaneously. This dichoto-my has obstructed effective action to curb the advancing epidemic ofchronic diseases. For example, the prevailing approach of measuringchild undernutrition on the basis of the underweight indicator (weight-for-age) can lead to gross underestimation of the presence of obesity inpopulations that have a high prevalence of stunting.Use of this indicatorcould lead aid programmes to feed apparently underweight people, withthe undesirable outcome of further aggravating obesity. In LatinAmerica, close to 90millionpeople are beneficiaries of foodprogrammes(34) but that group actually comprises only 10million truly underweightpeople (after correcting for height). The two facets of nutrition-relatedproblems need to be brought together and treated in the context of thewhole spectrum of malnutrition.
2.3 An integrated approach to diet-related and nutrition-relateddiseases
The root causes of malnutrition include poverty and inequity.Eliminating these causes requires political and social action of whichnutritional programmes can be only one aspect. Sufficient, safe andvaried food supplies not only prevent malnutrition but also reduce therisk of chronic diseases. It is well known that nutritional deficiencyincreases the risk of common infectious diseases, notably those ofchildhood, and vice versa (35, 36). There is, therefore, complementarityin terms of public health approaches and public policy priorities,between policies and programmes designed to prevent chronic diseasesand those designed to prevent other diet-related and nutrition-relateddiseases.
The double burden of disease is most effectively lifted by a range ofintegrated policies and programmes. Such an integrated approach is thekey to action in countries where modest public health budgets willinevitably remain mostly devoted to prevention of deficiency andinfection. Indeed, there is no country, however privileged, in whichcombatingdeficiency and infection are no longer public health priorities.High-income countries accustomed to programmes designed to preventchronic diseases can amplify the effectiveness of the programmes byapplying them to the prevention of nutritional deficiency and food-related infectious diseases.
Guidelines designed to give equal priority to the prevention ofnutritional deficiency and chronic diseases, have already been estab-lished for the Latin American region (37). Recent recommendations toprevent cancer are reckoned also to reduce the risk of nutritional
9

deficiency and food-related infectious diseases (38), and dietary guide-lines for the Brazilian population give equal priority to the preventionand control of nutritional deficiency, food-related infectious diseases,and chronic diseases (39).
References
1. The world health report 2002: reducing risks, promoting healthy life. Geneva,World Health Organization, 2002.
2. Diet, physical activity and health. Geneva, World Health Organization, 2002(documents A55/16 and A55/16 Corr.1).
3. Popkin BM. The shift in stages of the nutritional transition in the developing worlddiffers from past experiences! Public Health Nutrition, 2002, 5:205--214.
4. The world health report 1998. Life in the 21st century: a vision for all. Geneva,World Health Organization, 1998.
5. Aboderin I et al. Life course perspectives on coronary heart disease, stroke anddiabetes: key issues and implications for policy and research. Geneva, WorldHealth Organization, 2001 (document WHO/NMH/NPH/01.4).
6. Murray CJL, Lopez AD, eds. The global burden of disease: a comprehensiveassessment of mortality and disability from diseases, injuries, and risk factors in1990 and projected to 2020. Cambridge, Harvard School of Public Health onbehalf of theWorldHealthOrganizationand theWorldBank, 1996 (GlobalBurdenof Disease and Injury Series, Vol. 1).
7. Choi BCK, Bonita R, McQueen DV. The need for global risk factor surveillance.Journal of Epidemiology and Community Health, 2001, 55:370.
8. Matsudo V et al. Promotion of physical activity in a developing country: the AgitaSao Paulo experience. Public Health Nutrition, 2002, 5:253--261.
9. World declaration and plan of action for nutrition. Rome, Food and AgricultureOrganization of the United Nations and Geneva, World Health Organization,1992.
10. Nutrition and development: a global assessment. Rome, Food and AgricultureOrganization of the United Nations and Geneva, World Health Organization,1992.
11. Promoting appropriate diets and healthy lifestyles. In: Major issues for nutritionstrategies. Rome, Food and Agriculture Organization of the United Nations andGeneva, World Health Organization, 1992:17--20.
12. Resolution WHA51.12. Health promotion. In: Fifty-first World Health Assembly,Geneva, 11--16 May 1998. Volume 1. Resolutions and decisions, annexes.Geneva, World--Health Organization, 1998:11--12 (document WHA51/1998/REC/1).
13. Resolution WHA52.7. Active ageing. In: Fifty-second World Health Assembly,Geneva, 17--25 May 1999. Volume 1. Resolutions and decisions, annexes.Geneva, World Health Organization, 1999:8--9 (document WHA52/1999/REC/1).
14. Resolution WHA53.17. Prevention and control of noncommunicable diseases.In: Fifty-third World Health Assembly, Geneva, 15--20 May 2000. Volume 1.Resolutions and decisions, annex. Geneva, World Health Organization,2000:22--24 (document WHA53/2000/REC/1).
10

15. Resolution WHA53.23. Diet, physical activity and health. In: Fifty-fifth WorldHealth Assembly, Geneva, 13--18 May 2002. Volume 1. Resolutions anddecisions, annexes.Geneva,WorldHealthOrganization, 2002:28--30 (documentWHA55/2002/REC/1).
16. Puska P et al. Changes in premature deaths in Finland: successful long-termprevention of cardiovascular diseases. Bulletin of theWorld Health Organization,1998, 76:419--425.
17. LeeM-J, Popkin BM, KimS. The unique aspects of the nutrition transition in SouthKorea: the retention of healthful elements in their traditional diet. Public HealthNutrition, 2002, 5:197--203.
18. Kim SW, Moon SJ, Popkin BM. The nutrition transition in South Korea. AmericanJournal of Clinical Nutrition, 2002, 71:44--53.
19. A global agenda for combating malnutrition: progress report. Geneva, WorldHealth Organization, 2000 (document WHO/NHD/00.6).
20. Childhood nutrition and progress in implementing the International Code ofMarketing of Breast-milk Substitutes. Geneva, World Health Organization, 2002(document A55/14).
21. WHO/UNICEF/International Council for the Control of Iodine Deficiency Dis-orders. Progress towards the elimination of iodine deficiency disorders (IDD).Geneva, World Health Organization, 1999 (document WHO/NHD/99.4).
22. WHO/UNICEF/United Nations University. Iron deficiency anaemia assessment,prevention and control: a guide for programmemanagers. Geneva,World HealthOrganization, 2001 (document WHO/NHD/01.3).
23. WHO/UNICEF. Global prevalence of vitamin A deficiency.MDIS Working PaperNo. 2. Geneva, World Health Organization, 1995 (document WHO/NUT/95.3).
24. de Onis M, Blossner M, Villar J. Levels and patterns of intrauterine growthretardation in developing countries. European Journal of Clinical Nutrition, 1998,52 (Suppl. 1):S5--S15.
25. Barker DJP et al. Weight in infancy and death from ischaemic heart disease.Lancet, 1989, 2:577--580.
26. Barker DJP et al. Type 2 (non-insulin-dependent) diabetesmellitus, hypertensionand hyperlipidaemia (syndrome X): relation to reduced fetal growth.Diabetologia, 1993, 36:62--67.
27. Barker DJP et al. Growth in utero and serum cholesterol concentrations in adultlife. British Medical Journal, 1993, 307:1524--1527.
28. Barker DJP. Fetal origins of coronary heart disease. British Medical Journal,1995, 311:171--174.
29. BarkerDJPet al. Growth in utero andbloodpressure levels in thenext generation.Hypertension, 2000, 18:843--846.
30. Barker DJP et al. Size at birth and resilience to effects of poor living conditions inadult life: longitudinal study. British Medical Journal, 2001, 323:1273--1276.
31. Programming of chronic disease by impaired fetal nutrition: evidence andimplications for policy and intervention strategies. Geneva, World HealthOrganization, 2002 (documents WHO/NHD/02.3 and WHO/NPH/02.1).
32. Obesity: preventing and managing the global epidemic. Report of a WHOConsultation.Geneva, World Health Organization, 2000 (WHO Technical ReportSeries, No. 894).
11

33. de Onis M, Blossner M. Prevalence and trends of overweight among preschoolchildren in developing countries. American Journal of Clinical Nutrition, 2000,72:1032--1039.
34. Pena M, Bacallao J. Obesity among the poor: an emerging problem in LatinAmerica and the Caribbean. In: Pena M, Bacallao J, eds. Obesity and poverty:a new public health challenge. Washington, DC, Pan American HealthOrganization, 2000:3--10 (Scientific Publication, No. 576).
35. Scrimshaw NS, Taylor CE, Gordon JE. Interactions of nutrition and infection.Geneva, World Health Organization, 1968.
36. Tompkins A, Watson F. Malnutrition and infection: a review. Geneva, Adminis-trative Committee on Coordination/Subcommittee on Nutrition, 1989 (ACC/SCNState-of-the-art Series Nutrition Policy Discussion Paper, No. 5).
37. Bengoa JM et al. Guias de alimentacion. [Dietary guidelines.] Caracas,Fundacion Cavendes, 1988.
38. World Cancer Research Fund/American Institute for Cancer Research. Food,nutrition and the prevention of cancer: a global perspective. Washington, DC,American Institute for Cancer Research, 1997:530--534.
39. Ministerio da Saude. Dietary guidelines for the Brazilian population. Brasılia,BrazilianMinistry of Health (available on the Internet at http://portal.saude.gov.br/alimentacao/english/index.cfm).
12

3. Global and regional food consumption patternsand trends
3.1 Introduction
Promoting healthy diets and lifestyles to reduce the global burden ofnoncommunicable diseases requires a multisectoral approach involvingthe various relevant sectors in societies. The agriculture and food sectorfigures prominently in this enterprise andmust be given due importancein any consideration of the promotion of healthy diets for individualsand population groups. Food strategies must not merely be directed atensuring food security for all, but must also achieve the consumption ofadequatequantities of safe andgoodquality foods that togethermakeupa healthy diet. Any recommendation to that effect will have implicationsfor all components in the food chain. It is therefore useful at this junctureto examine trends in consumption patterns worldwide and deliberate onthe potential of the food and agriculture sector tomeet the demands andchallenges posed by this report.
Economic development is normally accompanied by improvements in acountry’s food supply and the gradual elimination of dietary deficiencies,thus improving the overall nutritional status of the country’s population.Furthermore, it also brings about qualitative changes in the production,processing, distribution and marketing of food. Increasing urbanizationwill also have consequences for the dietary patterns and lifestyles ofindividuals, not all of which are positive. Changes in diets, patterns ofwork and leisure --- often referred to as the ‘‘nutrition transition’’ --- arealready contributing to the causal factors underlying noncommunicablediseases even in thepoorest countries.Moreover, the pace of these changesseems to be accelerating, especially in the low-income and middle-incomecountries.
The dietary changes that characterize the ‘‘nutrition transition’’ includeboth quantitative and qualitative changes in the diet. The adverse dietarychanges include shifts in the structure of the diet towards a higher energydensity diet with a greater role for fat and added sugars in foods, greatersaturated fat intake (mostly from animal sources), reduced intakes ofcomplex carbohydrates and dietary fibre, and reduced fruit and vegetableintakes (1). These dietary changes are compounded by lifestyle changesthat reflect reducedphysical activity atworkandduring leisure time (2).Atthe same time, however, poor countries continue to face food shortagesand nutrient inadequacies.
Diets evolve over time, being influenced by many factors and complexinteractions. Income, prices, individual preferences and beliefs, culturaltraditions, as well as geographical, environmental, social and economic
13
factors all interact in a complex manner to shape dietary consumptionpatterns.Data on the national availability of themain food commoditiesprovide a valuable insight into diets and their evolution over time. FAOproduces annual Food Balance Sheets which provide national data onfood availability (for almost all commodities and for nearly allcountries). Food Balance Sheets give a complete picture of supply(including production, imports, stock changes and exports) andutilization (including final demand in the formof food use and industrialnon-fooduse, intermediatedemandsuchasanimal feedand seeduse, andwaste) by commodity. From these data, the average per capita supply ofmacronutrients (i.e. energy, protein, fats) can be derived for all foodcommodities. Although such average per capita supplies are derivedfrom national data, they may not correspond to actual per capitaavailability,which is determinedbymanyother factors suchas inequalityin access to food.Likewise, thesedata refer to ‘‘average foodavailable forconsumption’’, which, for a number of reasons (for example, waste at thehousehold level), is not equal to average food intake or average foodconsumption. In the remainderof this chapter, therefore, the terms ‘‘foodconsumption’’ or ‘‘food intake’’ should be read as ‘‘food available forconsumption’’.
Actual food availability may vary by region, socioeconomic level andseason. Certain difficulties are encountered when estimating trade,production and stock changes on an annual scale. Hence three-yearaverages are calculated in order to reduce errors. The FAO statisticaldatabase (FAOSTAT), being based on national data, does not provideinformation on the distribution of food within countries, or withincommunities and households.
3.2 Developments in the availability of dietary energy
Food consumption expressed in kilocalories (kcal) per capita per day is akey variable used formeasuring and evaluating the evolution of the globaland regional food situation. A more appropriate term for this variablewould be ‘‘national average apparent food consumption’’ since the datacome from national Food Balance Sheets rather than from foodconsumption surveys. Analysis of FAOSTAT data shows that dietaryenergymeasured in kcals per capita per dayhas been steadily increasingonaworldwide basis; availability of calories per capita from themid-1960s tothe late 1990s increased globally by approximately 450 kcal per capita perday and by over 600 kcal per capita per day in developing countries (seeTable 1). This change has not, however, been equal across regions. The percapita supply of calories has remained almost stagnant in sub-SaharanAfrica and has recently fallen in the countries in economic transition. Incontrast, theper capita supplyof energyhas risendramatically inEastAsia
14

(by almost 1000 kcal per capita per day, mainly in China) and in the NearEast/North Africa region (by over 700 kcal per capita per day).
Table 1Global and regional per capita food consumption (kcal per capita per day)
Region 1964--1966 1974--1976 1984--1986 1997--1999 2015 2030
World 2358 2435 2655 2803 2940 3050
Developing countries 2054 2152 2450 2681 2850 2980
Near East and North Africa 2290 2591 2953 3006 3090 3170
Sub-Saharan Africaa 2058 2079 2057 2195 2360 2540
Latin America and
the Caribbean
2393 2546 2689 2824 2980 3140
East Asia 1957 2105 2559 2921 3060 3190
South Asia 2017 1986 2205 2403 2700 2900
Industrialized countries 2947 3065 3206 3380 3440 3500
Transition countries 3222 3385 3379 2906 3060 3180
a Excludes South Africa.
Source: reproduced, with minor editorial amendments from reference 3 with the permission of the publisher.
In short, it would appear that the world has made significant progress inraising food consumption per person. The increase in the world averageconsumption would have been higher but for the declines in the transitioneconomies that occurred in the 1990s. It is generally agreed, however, thatthose declines are likely to revert in the near future. The growth in foodconsumption has been accompanied by significant structural changes anda shift in diet away from staples such as roots and tubers towards morelivestock products and vegetable oils (4). Table 1 shows that currentenergy intakes range from 2681 kcal per capita per day in developingcountries, to 2906 kcal per capita per day in transition countries and3380 kcal per capita per day in industrialized countries. Data shown inTable 2 suggest that per capita energy supply has declined from bothanimal and vegetable sources in the countries in economic transition,while it has increased in the developing and industrialized countries.
Table 2Vegetable and animal sources of energy in the diet (kcal per capita per day)
Region 1967--1969 1977--1979 1987--1989 1997--1999
T V A T V A T V A T V A
Developing
countries
2059 1898 161 2254 2070 184 2490 2248 242 2681 2344 337
Transition
countries
3287 2507 780 3400 2507 893 3396 2455 941 2906 2235 671
Industrialized
countries
3003 2132 871 3112 2206 906 3283 2333 950 3380 2437 943
T, total kcal; V, kcal of vegetable origin; A, kcal of animal origin (including fish products).
Source: FAOSTAT, 2003.
15

Similar trends are evident for protein availability; this has increased inboth developing and industrialized countries but decreased in thetransition countries. Although the global supply of protein has beenincreasing, the distribution of the increase in the protein supply isunequal. The per capita supply of vegetable protein is slightly higher indeveloping countries, while the supply of animal protein is three timeshigher in industrialized countries.
Globally, the share of dietary energy supplied by cereals appears to haveremained relatively stable over time, representing about 50% of dietaryenergy supply. Recently, however, subtle changes appear to be takingplace (see Fig. 1). A closer analysis of the dietary energy intake shows adecrease in developing countries, where the share of energy derived fromcereals has fallen from 60% to 54% in a period of only 10 years. Muchof this downwards trend is attributable to cereals, particularly wheatand rice, becoming less preferred foods in middle-income countries suchas Brazil and China, a pattern likely to continue over the next 30 yearsor so. Fig. 2 shows the structural changes in the diet of developingcountries over the past 30--40 years and FAO’s projections to theyear 2030 (3).
16

3.3 Availability and changes in consumption of dietary fat
The increase in the quantity andquality of the fats consumed in the diet isan important feature of nutrition transition reflected in the national dietsof countries. There are large variations across the regions of the world inthe amount of total fats (i.e. fats in foods, plus added fats and oils)available for human consumption. The lowest quantities consumed arerecorded in Africa, while the highest consumption occurs in parts ofNorthAmerica andEurope. The important point is that there has been aremarkable increase in the intake of dietary fats over the past threedecades (see Table 3) and that this increase has taken place practicallyeverywhere except in Africa, where consumption levels have stagnated.The per capita supply of fat from animal foods has increased,respectively, by 14 and 4 g per capita in developing and industrializedcountries, while there has been a decrease of 9 g per capita in transitioncountries.
17

Table 3Trends in the dietary supply of fat
Region Supply of fat (g per capita per day)
1967--1969 1977--1979 1987--1989 1997--1999 Change between
1967--1969 and
1997--1999
World 53 57 67 73 20
North Africa 44 58 65 64 20
Sub-Saharan Africaa 41 43 41 45 4
North America 117 125 138 143 26
Latin America and
the Caribbean
54 65 73 79 25
China 24 27 48 79 55
East and South-East Asia 28 32 44 52 24
South Asia 29 32 39 45 16
European Community 117 128 143 148 31
Eastern Europe 90 111 116 104 14
Near East 51 62 73 70 19
Oceania 102 102 113 113 11
a Excludes South Africa
Source: FAOSTAT, 2003.
The increase in dietary fat supply worldwide exceeds the increase indietary protein supply. The average global supply of fat has increased by20 g per capita per day since 1967--1969. This increase in availability hasbeen most pronounced in the Americas, East Asia, and the EuropeanCommunity. The proportion of energy contributed by dietary fatsexceeds 30% in the industrialized regions, and in nearly all other regionsthis share is increasing.
The fat-to-energy ratio (FER) is defined as the percentage of energyderived from fat in the total supply of energy (in kcal). Country-specificanalysis of FAO data for 1988--1990 (5) found a range for the FER of7--46%.A total of 19 countries fell below theminimum recommendationof 15%dietary energy supply from fat, themajority of these being in sub-Saharan Africa and the remainder in South Asia. In contrast,24 countries were above the maximum recommendation of 35%, themajority of these countries being inNorthAmerica andWesternEurope.It is useful to note that limitations of the Food Balance Sheet data maycontribute much of this variation in the FER between countries. Forinstance, in countries such as Malaysia with abundant availability ofvegetable oils at low prices, FoodBalance Sheet datamay not reflect realconsumption at the individual household level.
Rising incomes in the developing world have also led to an increase inthe availability and consumption of energy-dense high-fat diets. Foodbalance data can be used to examine the shift in the proportion ofenergy from fat over time and its relationship to increasing incomes (6).
18

In 1961--1963, a diet providing 20% of energy from fat was associatedonly with countries having at least a per capita gross national productof US$ 1475. By 1990, however, even poor countries having a grossnational product of only US$ 750 per capita had access to a similar dietcomprising 20% of energy from fat. (Both values of gross nationalproduct are given in 1993 US$.) This change was mainly the result of anincrease in the consumption of vegetable fats by poor countries, withsmaller increases occurred in middle-income and high-income coun-tries. By 1990, vegetable fats accounted for a greater proportion ofdietary energy than animal fats for countries in the lowest per capitaincome category. Changes in edible vegetable oil supply, in prices andin consumption equally affected rich and poor countries, although thenet impact was relatively much greater in low-income countries. Anequally large and important shift in the proportion of energy fromadded sugars in the diets of low-income countries was also a feature ofthe nutrition transition (1).
Examinations of the purchasing habits of people, aimed at under-standing the relationship between level of education or income and thedifferent amounts or types of commodities purchased at different timeswere also revealing. Research conducted in China shows that there havebeen profound shifts in purchasing practices in relation to income overthe past decade. These analyses show how extra income in China affectspoor people and rich people in a differential manner, enhancing the fatintake of the poor more than that of the rich (7).
A variable proportion of these fat calories are provided by saturatedfatty acids. Only in the two of the most affluent regions (i.e. in parts ofNorth America and Europe) is the intake of saturated fat at or above10%of energy intake level. In other less affluent regions, the proportionof dietary energy contributed by saturated fatty acids is lower, rangingfrom 5% to 8%, and generally not changing much over time. Nationaldietary surveys conducted in some countries confirm these data. Theratio of dietary fat from animal sources to total fat is a key indicator,since foods from animal sources are high in saturated fat. Data sets usedto calculate country-specific FERs can also be used to calculateproportions of animal fat in total fat. Such analysis indicated that theproportion of animal fat in total fat was lower than 10% in somecountries (Democratic Republic of Congo, Mozambique, Nigeria, SaoTome and Principe, and Sierra Leone), while it is above 75% in someother countries (Denmark, Finland, Hungary, Mongolia, Poland andUruguay). These findings are not strictly divided along economic lines,as not all of the countries in the high range represent the most affluentcountries. Country-specific food availability and cultural dietarypreferences and norms to some extent determine these patterns.
19

The types of edible oils used in developing countries are also changingwith the increasing use of hardenedmargarines (rich in trans fatty acids)that do not need to be refrigerated. Palm oil is becoming an increasinglyimportant edible oil in the diets of much of South-East Asia and is likelyto be a major source in the coming years. Currently, palm oilconsumption is low and the FER ranges between 15% and 18%. Atthis low level of consumption, the saturated fatty acid content of the dietcomprises only 4% to 8%.Potential developments in the edible oil sectorcould affect all stages of the oil production process from plant breedingto processingmethods, including the blending of oils aimed at producingedible oils that have a healthy fatty acid composition.
Olive oil is an important edible oil consumed largely in the Mediterra-nean region. Its production has been driven by rising demand, which hasincreasingly shifted olive cultivation from traditional farms to moreintensive forms of cultivation. There is some concern that the intensivecultivation of olives may have adverse environmental impacts, such assoil erosion and desertification (8). However, agricultural productionmethods are being developed to ensure less harmful impacts on theenvironment.
3.4 Availability and changes in consumption of animal products
There has been an increasing pressure on the livestock sector to meet thegrowing demand for high-value animal protein. The world’s livestocksector is growingat anunprecedented rate and thedriving forcebehind thisenormous surge is a combination of population growth, rising incomesand urbanization. Annual meat production is projected to increase from218 million tonnes in 1997--1999 to 376 million tonnes by 2030.
There is a strong positive relationship between the level of income andthe consumption of animal protein, with the consumption of meat, milkand eggs increasing at the expense of staple foods. Because of the recentsteep decline in prices, developing countries are embarking on highermeat consumption at much lower levels of gross domestic product thanthe industrialized countries did some 20--30 years ago.
Urbanization is a major driving force influencing global demand forlivestock products. Urbanization stimulates improvements in infra-structure, including cold chains, which permit trade in perishable goods.Compared with the less diversified diets of the rural communities, citydwellers have a varied diet rich in animal proteins and fats, andcharacterized by higher consumption of meat, poultry, milk and otherdairy products. Table 4 shows trends in per capita consumption oflivestock products in different regions and country groups. There hasbeen a remarkable increase in the consumption of animal products in
20

countries suchasBrazil andChina, although the levels are still well belowthe levels of consumption in North American and most otherindustrialized countries.
As diets become richer and more diverse, the high-value protein that thelivestock sector offers improves the nutrition of the vast majority of theworld. Livestock products not only provide high-value protein but arealso important sources of a wide range of essential micronutrients, inparticular minerals such as iron and zinc, and vitamins such as vitamin A.For the large majority of people in the world, particularly in developingcountries, livestock products remain a desired food for nutritional valueand taste. Excessive consumption of animal products in some countriesand social classes can, however, lead to excessive intakes of fat.
Table 4Per capita consumption of livestock products
Region Meat (kg per year) Milk (kg per year)
1964--1966 1997--1999 2030 1964--1966 1997--1999 2030
World 24.2 36.4 45.3 73.9 78.1 89.5
Developing countries 10.2 25.5 36.7 28.0 44.6 65.8
Near East and
North Africa
11.9 21.2 35.0 68.6 72.3 89.9
Sub-Saharan Africaa 9.9 9.4 13.4 28.5 29.1 33.8
Latin America and
the Caribbean
31.7 53.8 76.6 80.1 110.2 139.8
East Asia 8.7 37.7 58.5 3.6 10.0 17.8
South Asia 3.9 5.3 11.7 37.0 67.5 106.9
Industrialized countries 61.5 88.2 100.1 185.5 212.2 221.0
Transition countries 42.5 46.2 60.7 156.6 159.1 178.7
a Excludes South Africa.
Source: Adapted from reference 4 with the permission of the publisher.
The growing demand for livestock products is likely to have anundesirable impact on the environment. For example, there will bemore large-scale, industrial production, often located close to urbancentres, which brings with it a range of environmental and public healthrisks. Attempts have beenmade to estimate the environmental impact ofindustrial livestock production. For instance, it has been estimated thatthe number of people fed in a year per hectare ranges from 22 forpotatoes and 19 for rice to 1 and 2, respectively, for beef and lamb (9).The low energy conversion ratio from feed to meat is another concern,since some of the cereal grain food produced is diverted to livestockproduction. Likewise, land andwater requirements for meat productionare likely to become a major concern, as the increasing demand foranimal products results in more intensive livestock productionsystems (10).
21

3.5 Availability and consumption of fish
Despite fluctuations in supply and demand caused by the changing state offisheries resources, the economic climate and environmental conditions,fisheries, including aquaculture, have traditionally been, and remain animportant source of food, employment and revenue inmany countries andcommunities (11). After the remarkable increase in bothmarine and inlandcapture of fish during the 1950s and 1960s, world fisheries production haslevelled off since the 1970s. This levelling off of the total catch follows thegeneral trend of most of the world’s fishing areas, which have apparentlyreached their maximum potential for fisheries production, with themajority of stocks being fully exploited. It is therefore very unlikely thatsubstantial increases in total catch will be obtained in the future. Incontrast, aquaculture production has followed the opposite path. Startingfrom an insignificant total production, inland and marine aquacultureproduction has been growing at a remarkable rate, offsetting part of thereduction in the ocean catch of fish.
The total food fish supply and hence consumption has been growing at arate of 3.6% per year since 1961, while the world’s population has beenexpanding at 1.8% per year. The proteins derived from fish, crustaceansand molluscs account for between 13.8% and 16.5% of the animalprotein intakeof thehumanpopulation.Theaverage apparentper capitaconsumption increased from about 9 kg per year in the early 1960s to16 kg in 1997. The per capita availability of fish and fishery products hastherefore nearly doubled in 40 years, outpacing population growth.
As well as income-related variations, the role of fish in nutrition showsmarked continental, regional and national differences. In industrializedcountries, where diets generally contain amore diversified range of animalproteins, a rise inper capitaprovision from19.7kg to27.7kg seems tohaveoccurred. This represents a growth rate close to 1%per year. In this groupof countries, fish contributed an increasing share of total protein intakeuntil 1989 (accounting for between 6.5% and 8.5%), but since then itsimportance has gradually declined and, in 1997, its percentage contribu-tion was back to the level prevailing in the mid-1980s. In the early 1960s,per capita fish supply in low-income food-deficit countries was, onaverage, only 30% of that of the richest countries. This gap has beengradually reduced, such that in 1997, average fish consumption in thesecountries was 70% of that of the more affluent economies. Despite therelatively low consumption by weight in low-income food-deficitcountries, the contribution of fish to total animal protein intake isconsiderable (nearly 20%).Over the past four decades, however, the shareof fish proteins in animal proteins has declined slightly, because of fastergrowth in the consumption of other animal products.
22

Currently, two-thirds of the total food fish supply is obtained fromcapture fisheries in marine and inland waters, while the remaining one-third is derived fromaquaculture. The contributionof inland andmarinecapture fisheries to per capita food supply has stabilized, around 10 kgper capita in the period 1984--1998. Any recent increases in per capitaavailability have, therefore, been obtained from aquaculture produc-tion, from both traditional rural aquaculture and intensive commercialaquaculture of high-value species.
Fish contributes up to 180 kcal per capita per day, but reaches such highlevels only in a few countries where there is a lack of alternative proteinfoods grown locally or where there is a strong preference for fish(examples are Iceland, Japan and some small island states). Moretypically, fish provides about 20--30kcal per capitaper day.Fishproteinsare essential in the diet of some densely populated countries where thetotal protein intake level is low, and are very important in the diets ofmany other countries. Worldwide, about a billion people rely on fish astheir main source of animal proteins. Dependence on fish is usuallyhigher in coastal than in inland areas. About 20% of the world’spopulation derives at least one-fifth of its animal protein intake fromfish, and some small island states depend almost exclusively on fish.
Recommending the increased consumption of fish is another area wherethe feasibility of dietary recommendations needs to be balanced againstconcerns for sustainability of marine stocks and the potential depletionof this important marine source of high quality nutritious food. Added tothis is the concern that a significant proportion of the world fish catch istransformed into fish meal and used as animal feed in industrial livestockproduction and thus is not available for human consumption.
3.6 Availability and consumption of fruits and vegetables
Consumption of fruits and vegetables plays a vital role in providing adiversified and nutritious diet.A low consumptionof fruits and vegetablesin many regions of the developing world is, however, a persistentphenomenon, confirmed by the findings of food consumption surveys.Nationally representative surveys in India (12), for example, indicate asteady level of consumption of only 120--140 g per capita per day, withabout another 100 g per capita coming from roots and tubers, and some 40g per capita from pulses. This may not be true for urban populations inIndia, who have rising incomes and greater access to a diverse and varieddiet. In contrast, in China, --- a country that is undergoing rapid economicgrowthand transition --- the amountof fruits andvegetables consumedhasincreased to 369 g per capita per day by 1992.
23

At present, only a small and negligible minority of the world’spopulation consumes the generally recommended high average intakeof fruits and vegetables. In 1998, only 6 of the 14 WHO regions had anavailability of fruits and vegetables equal to or greater than the earlierrecommended intake of 400 g per capita per day. The relativelyfavourable situation in 1998 appears to have evolved from a markedlyless favourable position in previous years, as evidenced by the greatincrease in vegetable availability recorded between 1990 and 1998 formost of the regions. In contrast, the availability of fruit generallydecreased between 1990 and 1998 in most regions of the world.
The increase in urbanization globally is another challenge. Increasingurbanization will distance more people from primary food production,and in turn have a negative impact on both the availability of a varied andnutritious diet with enough fruits and vegetables, and the access of theurban poor to such a diet. Nevertheless, it may facilitate the achievementof other goals, as thosewho can afford it can have better access to a diverseand varied diet. Investment in periurban horticulture may provide anopportunity to increase the availability and consumptionof a healthy diet.
Global trends in the production and supply of vegetables indicate thatthe current production and consumption vary widely among regions, asindicated in Table 5. It should be noted that the production of wild andindigenous vegetables is not taken into account in production statisticsand might therefore be underestimated in consumption statistics. In2000, the global annual average per capita vegetable supply was 102 kg,with the highest level in Asia (116 kg), and the lowest levels in SouthAmerica (48 kg) and Africa (52 kg). These figures also include the largeamount of horticultural produce that is consumed on the farm. Table 5and Figure 3 illustrate the regional and temporal variations in the percapita availability of vegetables per capita over the past few decades.
Table 5Supply of vegetables per capita, by region, 1979 and 2000 (kg per capita per year)
Region 1979 2000
World 66.1 101.9
Developed countries 107.4 112.8
Developing countries 51.1 98.8
Africa 45.4 52.1
North and Central America 88.7 98.3
South America 43.2 47.8
Asia 56.6 116.2
Europe 110.9 112.5
Oceania 71.8 98.7
Source: reproduced from reference 13 with the permission of the publisher.
24

3.7 Future trends in demand, food availability and consumption
In recent years the growth rates of world agricultural production and cropyields have slowed. This has raised fears that the world may not be able togrow enough food and other commodities to ensure that futurepopulations are adequately fed. However, the slowdown has occurrednot because of shortages of land or water but rather because demand foragricultural products has also slowed. This is mainly because worldpopulation growth rates have been declining since the late 1960s, and fairlyhigh levels of food consumption per person are now being reached inmanycountries, beyondwhich further rises will be limited. It also true that a highshare of the world’s population remains in poverty and hence lacks thenecessary income to translate its needs into effective demand. As a result,the growth in world demand for agricultural products is expected to fallfrom an average 2.2% per year over the past 30 years to an average 1.5%per year for the next 30 years. In developing countries the slowdownwill bemore dramatic, from 3.7% per year to 2% per year, partly as a result ofChina having passed the phase of rapid growth in its demand for food.Global food shortages are unlikely, but serious problems already exist atnational and local levels, and may worsen unless focused efforts are made.
The annual growth rate of world demand for cereals has declined from2.5%per year in the 1970s and 1.9%per year in the 1980s to only 1%per
25

year in the 1990s. Annual cereal use per person (including animal feeds)peaked in the mid-1980s at 334 kg and has since fallen to 317 kg. Thedecline is not a cause for alarm, it is largely the natural result of slowerpopulation growth and shifts in human diets and animal feeds. Duringthe 1990s, however, the decline was accentuated by a number oftemporary factors, including serious economic recessions in thetransition countries and in some East and South-East Asian countries.
The growth rate in the demand for cereals is expected to rise again to 1.4%per year up until 2015, slowing to 1.2% per year thereafter. In developingcountries overall, cereal production is not expected to keep pace withdemand. The net cereal deficits of these countries, which amounted to103 million tonnes or 9% of consumption in 1997--1999, could rise to265 million tonnes by 2030, when they will be 14% of consumption. Thisgap can be bridged by increased surpluses from traditional grainexporters, and by new exports from the transition countries, which areexpected to shift from being net importers to being net exporters.
Oil crops have seen the fastest increase in area of any crop sector,expanding by 75 million hectares between the mid-1970s and the end ofthe 1990s, while cereal area fell by 28 million hectares over the sameperiod. Future per capita consumption of oil crops is expected to risemore rapidly than that of cereals. These crops will account for 45 out ofevery 100 extra kilocalories added to average diets in developingcountries between now and 2030.
There are three main sources of growth in crop production: expandingthe land area, increasing the frequency at which it is cropped (oftenthrough irrigation), and boosting yields. It has been suggested thatgrowth in crop production may be approaching the ceiling of what ispossible in respect of all three sources. A detailed examination ofproduction potentials does not support this view at the global level,although in some countries, and even in whole regions, serious problemsalready exist and could deepen.
Diets in developing countries are changing as incomes rise. The share ofstaples, such as cereals, roots and tubers, is declining, while that of meat,dairy products and oil crops is rising. Between 1964--1966 and 1997--1999, per capita meat consumption in developing countries rose by150% and that of milk and dairy products by 60%. By 2030, per capitaconsumption of livestock products could rise by a further 44%. Poultryconsumption is predicted to grow the fastest. Productivity improve-ments are likely to be a major source of growth. Milk yields shouldimprove, while breeding and improved management should increaseaverage carcass weights and off-take rates. This will allow increasedproduction with lower growth in animal numbers, and a corresponding
26

slowdown in the growth of environmental damage from grazing andanimal wastes.
In developing countries, demand is predicted to grow faster thanproduction, resulting in a growing trade deficit. In meat products thisdeficit will rise steeply, from 1.2 million tonnes per year in 1997--1999 to5.9 million tonnes per year in 2030 (despite growing meat exports fromLatinAmerica), while in the case ofmilk and dairy products, the rise willbe less steep but still considerable, from 20 million tonnes per year in1997--1999 to 39 million tonnes per year in 2030. An increasing share oflivestock production will probably come from industrial enterprises. Inrecent years, production from this sector has grown twice as fast as thatfrom more traditional mixed farming systems and more than six timesfaster than that from grazing systems.
World fisheries production has kept ahead of population growth overthe past three decades. Total fish production has almost doubled, from65 million tonnes in 1970 to 125 million tonnes in 1999, when the worldaverage intake of fish, crustaceans and molluscs reached 16.3 kg perperson. By 2030, annual fish consumption is likely to rise to some 150--160 million tonnes, or between 19--20 kg per person. This amount issignificantly lower than the potential demand, as environmental factorsare expected to limit supply. During the 1990s the marine catch levelledout at 80--85 million tonnes per year, and by the turn of the century,three-quarters of ocean fish stockswere overfished, depleted or exploitedup to their maximum sustainable yield. Further growth in the marinecatch can only be modest.
Aquaculture compensated for this marine slowdown, doubling its shareof world fish production during the 1990s. It is expected to continue togrow rapidly, at rates of 5--7% per year up to 2015. In all sectors offishing it will be essential to pursue forms of management conducive tosustainable exploitation, especially for resources under common own-ership or no ownership.
3.8 Conclusions
A number of conclusions can be drawn from the preceding discussion.
. Most of the information on food consumption has hitherto beenobtained from national Food Balance Sheet data. In order to betterunderstand the relationship between food consumption patterns, dietsand the emergence of noncommunicable diseases, it is crucial to obtainmore reliable information on actual food consumption patterns andtrends based on representative consumption surveys.
27

. There is a need to monitor how the recommendations in this reportinfluence the behaviour of consumers, andwhat further action is neededto change their diets (and lifestyles) towards more healthy patterns.
. The implications for agriculture, livestock, fisheries and horticulturewill have to be assessed and action taken to deal with potential futuredemands of an increasing and more affluent population. To meet thespecified levels of consumption, new strategies may need to bedeveloped. For example, a realistic approach to the implementation ofthe recommendation concerning high average intake of fruit andvegetables, requires attention to be paid to crucial matters such aswhere would the large quantities needed be produced, how can theinfrastructure be developed to permit trade in these perishableproducts, and would large-scale production of horticultural productsbe sustainable?
. A number of more novel matters will need to be dealt with, such as:
7 the positive and negative impacts on noncommunicable diseases ofintensive production systems, not only in termsof health (e.g. nitritein vegetables, heavy metals in irrigation water and manure,pesticide use), but also in terms of dietary quality (e.g. leaner meatsin intensive poultry production);
7 the effects of longer food chains, in particular of longer storage andtransport routes, such as the higher risk of deterioration (even ifmostof this may be bacterial and hence not a factor in chronic diseases),and the use and misuse of conserving agents and contaminants;
7 the effects of changes in varietal composition and diversity ofconsumption patterns, for example, the loss of traditional cropvarieties and, perhaps even more significantly, the declining use offoods from ‘‘wild’’ sources.
. Trade aspects need to be considered in the context of improving diet,nutrition and the prevention of chronic diseases. Trade has animportant role to play in improving food andnutrition security.On theimport side, lower trade barriers reduce domestic food prices, increasethe purchasing power of consumers and afford them a greater varietyof food products. Freer trade can thus help enhance the availabilityand affordability of food and contribute to a better-balanced diet. Onthe export side, access to markets abroad creates new incomeopportunities for domestic farmers and food processors. Farmers indeveloping countries in particular stand to benefit from the removal oftrade barriers for commodities such as sugar, fruits and vegetables, aswell as tropical beverages, all these being products for which they havea comparative advantage.
. The impact that agricultural policies, particularly subsidies, have onthe structure of production, processing and marketing systems --- and
28

ultimately on the availability of foods that support healthy foodconsumption patterns --- should not be overlooked.
All these issues and challenges need to be addressed in a pragmatic andintersectoralmanner.All sectors in the food chain, from ‘‘farm to table’’,will need to be involved if the food system is to respond to the challengesposed by the need for changes in diets to cope with the burgeoningepidemic of noncommunicable diseases.
References
1. Drewnowski A, Popkin BM. The nutrition transition: new trends in the global diet.Nutrition Reviews, 1997, 55:31--43.
2. Ferro-Luzzi A, Martino L. Obesity and physical activity. Ciba FoundationSymposium, 1996, 201:207--221.
3. World agriculture: towards 2015/2030. Summary report. Rome, Food andAgriculture Organization of the United Nations, 2002.
4. Bruinsma J, ed. World agriculture: towards 2015/2030. An FAO perspective.Rome, Food and Agriculture Organization of the United Nations/London,Earthscan, 2003.
5. Fats and oils in human nutrition. Report of a Joint Expert Consultation. Rome,Food and Agriculture Organization of the United Nations, 1994 (FAO Food andNutrition Paper, No. 57).
6. Guo X et al. Structural change in the impact of income on food consumptionin China 1989--1993. Economic Development and Cultural Change, 2000,48:737--760.
7. Popkin BM. Nutrition in transition: the changing global nutrition challenge.Asia Pacific Journal of Clinical Nutrition, 2001, 10(Suppl. 1):S13--S18.
8. Beaufoy G. The environmental impact of olive oil production in the EuropeanUnion: practical options for improving the environmental impact. Brussels,Environment Directorate-General, European Commission, 2000.
9. Spedding CRW. The effect of dietary changes on agriculture. In: Lewis B,Assmann G, eds. The social and economic contexts of coronary prevention.London, Current Medical Literature, 1990.
10. Pimental D et al. Water resources: agriculture, the environment and society.Bioscience, 1997, 47:97--106.
11. The state of the world fisheries and aquaculture 2002. Rome, Food andAgriculture Organization of the United Nations, 2002.
12. India nutrition profile 1998. New Delhi, Department of Women and ChildDevelopment, Ministry of Human Resource Development, Government ofIndia, 1998.
13. Fresco LO, Baudoin WO. Food and nutrition security towards human security.In: Proceedings of the International Conference on Vegetables, (ICV-2002),11--14 November 2002, Bangalore, India. Bangalore, Dr Prem Nath AgriculturalScience Foundation (in press).
29

4. Diet, nutrition and chronic diseases in context
4.1 Introduction
The diets people eat, in all their cultural variety, define to a large extentpeople’s health, growth and development. Risk behaviours, such astobacco use and physical inactivity,modify the result for better orworse.All this takes place in a social, cultural, political and economicenvironment that can aggravate the health of populations unless activemeasures are taken to make the environment a health-promoting one.
Although this report has taken a disease approach for convenience, theExpertConsultationwasmindful in all its discussions that diet, nutritionandphysical activity donot take place in a vacuum. Since the publicationof the earlier report in 1990 (1), there have been great advances in basicresearch, considerable expansion of knowledge, and much communityand international experience in the prevention and control of chronicdiseases. At the same time, the human genome has been mapped andmust now enter any discussion of chronic disease.
Concurrently there has been a return to the concept of the basic life course,i.e. of the continuity of human lives from fetus to old age. The influences inthe wombwork differently from later influences, but clearly have a strongeffect on the subsequentmanifestation of chronic disease. The known riskfactors are now recognized as being amenable to alleviation throughoutlife, even into old age. The continuity of the life course is seen in the waythat both undernutrition and overnutrition (as well as a host of otherfactors) play a role in the development of chronic disease. The effects ofman-made and natural environments (and the interaction between thetwo) on the development of chronic diseases are increasingly recognized.Such factors are also being recognized as happening further and further‘‘upstream’’ in the chain of events predisposinghumans to chronic disease.All these broadening perceptions not only give a clearer picture of what ishappening in the current epidemic of chronic diseases, but also presentmany opportunities to address them. The identities of those affected arenow better recognized: those most disadvantaged in more affluentcountries, and --- in numerical terms far greater --- the populations of thedeveloping and transitional worlds.
There is a continuity in the influences contributing to chronic diseasedevelopment, and thus also to the opportunities for prevention. Theseinfluences include the life course; the microscopic environment of thegene to macroscopic urban and rural environments; the impact of socialand political events in one sphere affecting the health and diet ofpopulations far distant; and the way in which already stretchedagriculture and oceanic systems will affect the choices available and
30

the recommendations that canbemade.For chronic diseases, risks occurat all ages; conversely, all ages are part of the continuumof opportunitiesfor their prevention and control. Both undernutrition and overnutritionare negative influences in terms of disease development, and possibly acombination is even worse; consequently the developing world needsadditional targeting. Those with least power need different preventiveapproaches from themore affluent.Workhas to startwith the individualrisk factors, but, critically, attempts at prevention and health promotionmust also take account of the wider social, political and economicenvironment. Economics, industry, consumer groups and advertising allmust be included in the prevention equation.
4.2 Diet, nutrition and the prevention of chronic diseases throughthe life course
The rapidly increasing burden of chronic diseases is a key determinant ofglobal public health. Already 79% of deaths attributable to chronicdiseases are occurring in developing countries, predominantly inmiddle-aged men (2). There is increasing evidence that chronic disease risksbegin in fetal life and continue into old age (3--9). Adult chronic disease,therefore, reflects cumulative differential lifetime exposures to damagingphysical and social environments.
For these reasons a life-course approach that captures both thecumulative risk and the many opportunities to intervene that thisaffords, was adopted by the Expert Consultation. While accepting theimperceptible progression fromone life stage to the next, five stageswereidentified for convenience. These are: fetal development and thematernal environment; infancy; childhood and adolescence; adulthood;and ageing and older people.
4.2.1 Fetal development and the maternal environment
The four relevant factors in fetal life are: (i) intrauterine growthretardation (IUGR); (ii) premature delivery of a normal growth forgestational age fetus; (iii) overnutrition in utero; and (iv) intergenera-tional factors. There is considerable evidence, mostly from developedcountries, that IUGR is associated with an increased risk of coronaryheart disease, stroke, diabetes and raised blood pressure (9--20). It mayrather be the pattern of growth, i.e. restricted fetal growth followed byvery rapid postnatal catch-up growth, that is important in the underlyingdisease pathways. On the other hand, large size at birth (macrosomia) isalso associated with an increased risk of diabetes and cardiovasculardisease (16, 21).Among the adult population in India, an associationwasfound between impaired glucose tolerance and high ponderal index (i.e.fatness) at birth (22). In Pima Indians, a U-shaped relationship to birth
31

weight was found, whereas no such relationship was found amongstMexicanAmericans (21, 23).Higher birthweight has also been related toan increased risk of breast and other cancers (24).
In sum, the evidence suggests that optimal birth weight and lengthdistribution should be considered, not only in terms of immediatemorbidity and mortality but also in regard to long-term outcomes suchas susceptibility to diet-related chronic disease later in life.
4.2.2 Infancy
Retarded growth in infancy can be a reflected in a failure to gain weightand a failure to gain height. Both retarded growth and excessive weightor height gain (‘‘crossing the centiles’’) can be factors in later incidence ofchronic disease.Anassociationbetween lowgrowth in early infancy (lowweight at 1 year) and an increased risk of coronary heart disease (CHD)has been described, irrespective of size at birth (3, 25). Bloodpressure hasbeen found to be highest in those with retarded fetal growth and greaterweight gain in infancy (26). Short stature, a reflection of socioeconomicdeprivation in childhood (27), is also associated with an increased risk ofCHDand stroke, and to some extent, diabetes (10, 15, 28--34). The riskofstroke, and also of cancer mortality at several sites, including breast,uterus and colon, is increased if shorter children display an acceleratedgrowth in height (35, 36).
Breastfeeding
There is increasing evidence that among term and pre-term infants,breastfeeding is associatedwith significantly lower bloodpressure levels inchildhood (37, 38). Consumption of formula instead of breast milk ininfancy has also been shown to increase diastolic and mean arterial bloodpressure in later life (37). Nevertheless, studies with older cohorts (22) andthe Dutch study of famine (39) have not identified such associations.There is increasingly strong evidence suggesting that a lower risk ofdeveloping obesity (40--43) may be directly related to length of exclusivebreastfeeding although it may not become evident until later in childhood(44). Some of the discrepancy may be explained by socioeconomic andmaternal education factors confounding the findings.
Data from most, but not all, observational studies of term infants havegenerally suggested adverse effects of formula consumption on the otherrisk factors for cardiovascular disease (as well as blood pressure), butlittle information to support this finding is available from controlledclinical trials (45). Nevertheless, the weight of current evidence indicatesadverse effects of formula milk on cardiovascular disease risk factors;this is consistent with the observations of increased mortality amongolder adults whowere fed formula as infants (45--47). The risk for several
32

chronic diseases of childhood and adolescence (e.g. type 1 diabetes,coeliac disease, some childhood cancers, inflammatory bowel disease)have also been associated with infant feeding on breast-milk substitutesand short-term breastfeeding (48).
There has been great interest in the possible effect of high-cholesterolfeeding in early life. Reiser et al. (49) proposed the hypothesis that high-cholesterol feeding in early life may serve to regulate cholesterol andlipoprotein metabolism in later life. Animal data in support of thishypothesis are limited, but the idea of a possible metabolic imprintingserved to trigger several retrospective and prospective studies in whichcholesterol and lipoprotein metabolism in infants fed human milk werecompared with those fed formula. Studies in suckling rats have suggestedthat the presence of cholesterol in the early diet may serve to define ametabolic pattern for lipoproteins and plasma cholesterol that could be ofbenefit later in life. The study byMott, Lewis&McGill (50) on differentialdiets in infant baboons, however, provided evidence to the contrary interms of benefit. Nevertheless, the observation of modified responses ofadult cholesterol production rates, bile cholesterol saturation indices, andbile acid turnover, dependingonwhether the baboonswere fed breastmilkor formula, served to attract further interest. It was noted that increasedatherosclerotic lesions associated with increased levels of plasma totalcholesterol were related to increased dietary cholesterol in early life. Nolong-term human morbidity and mortality data supporting this notionhave been reported.
Short-term human studies have been in part confounded by diversity insolid food weaning regimens, as well as by the varied composition offatty acid components of the early diet. The latter are nowknown to havean impact on circulating lipoprotein cholesterol species (51). Meanplasma total cholesterol by age 4 months in infants fed breast milkreached 180 mg/dl or greater, while cholesterol values in infants fedformula tended to remain under 150 mg/dl. In a study by Carlson,DeVoe & Barness (52), infants receiving predominantly a linoleic acid-enriched oil blend exhibited a mean cholesterol concentration ofapproximately 110 mg/dl. A separate group of infants in that studywho received predominantly oleic acid had a mean cholesterolconcentration of 133 mg/dl. Moreover, infants who were fed breastmilk and oleic acid-enriched formula had higher high-density lipopro-tein (HDL) cholesterol and apoproteins A-I and A-II than thepredominantly linoleic acid-enriched oil diet group. The ratio of low-density lipoprotein (LDL) cholesterol plus very low-density lipoprotein(VLDL) cholesterol to HDL cholesterol was lowest for infants receivingthe formula in which oleic acid was predominant. Using a similar oleicacid predominant formula, Darmady, Fosbrooke&Lloyd (53) reported
33

amean value of 149mg/dl at age 4months, comparedwith 196mg/dl in aparallel breast-fed group. Most of those infants then received anuncontrolled mixed diet and cow’s milk, with no evident differences inplasma cholesterol levels by 12 months, independent of the type of earlyfeeding they had received. A more recent controlled study (54) suggeststhat the specific fatty acid intakeplays apredominant role in determiningtotal and LDL cholesterol. The significance of high dietary cholesterolassociated with exclusive human milk feeding during the first 4 monthsof life has no demonstrated adverse effect. Measurements of serumlipoprotein concentrations andLDL receptor activity in infants suggeststhat it is the fatty acid content rather than the cholesterol in the dietwhich regulates cholesterol homeostasis. The regulation of endogenouscholesterol synthesis in infants appears to be regulated in a similarmanner to that of adults (55, 56).
4.2.3 Childhood and adolescence
An association between low growth in childhood and an increased risk ofCHD has been described, irrespective of size at birth (3, 25). Althoughbased only on developed country research at this point, this finding givescredence to the importance that is currently attached to the role ofimmediate postnatal factors in shaping disease risk. Growth rates ininfants in Bangladesh, most of whom had chronic intrauterine under-nourishment andwere breastfed, were similar to growth rates of breastfedinfants in industrialized countries, but catch-up growth was limited andweight at 12 months was largely a function of weight at birth (57).
In a study of 11--12 year-old Jamaican children (26), blood pressurelevels were found to be highest in those with retarded fetal growth andgreater weight gain between the ages of 7 and 11 years. Similar resultswere found in India (58). Low birth weight Indian babies have beendescribed as having a characteristic poor muscle but high fatpreservation, so-called ‘‘thin-fat’’ babies. This phenotype persiststhroughout the postnatal period and is associated with an increasedcentral adiposity in childhood that is linked to the highest risk of raisedblood pressure and disease (59--61). In most studies, the associationbetween low birth weight and high blood pressure has been found to beparticularly strong if adjusted to current body size --- body mass index(BMI) --- suggesting the importance of weight gain after birth (62).
Relative weight in adulthood and weight gain have been found to beassociated with increased risk of cancer of the breast, colon, rectum,prostate and other sites (36). Whether there is an independent effect ofchildhood weight is difficult to determine, as childhood overweight isusually continued into adulthood. Relative weight in adolescence was
34

significantly associated with colon cancer in one retrospective cohortstudy (63). Frankel, Gunnel & Peters (64), in the follow-up to an earliersurvey by Boyd Orr in the late 1930s, found that for both sexes, afteraccounting for the confounding effects of social class, there was asignificant positive relationship between childhood energy intake andadult cancer mortality. The recent review by the International Agencyfor Research on Cancer (IARC) in Lyon, France, concluded that therewas clear evidence of a relationship between onset of obesity (both earlyand later) and cancer risk (65).
Short stature (includingmeasures of childhood leg length), a reflectionofsocioeconomic deprivation in childhood, is associated with an increasedrisk of CHD and stroke, and to some extent diabetes (10, 15, 28--34).Given that short stature, and specifically short leglength, are particularlysensitive indicators of early socioeconomic deprivation, their associationwith later disease very likely reflects an association between earlyundernutrition and infectious disease load (27, 66).
Height serves partly as an indicator of socioeconomic and nutritionalstatus in childhood. As has been seen, poor fetal development and poorgrowth during childhood have been associated with increased cardio-vascular disease risk in adulthood, as have indicators of unfavourablesocial circumstances in childhood. Conversely, a high calorie intake inchildhood may be related to an increased risk of cancer in later life (64).Height is inversely associated with mortality among men and womenfrom all causes, including coronary heart disease, stroke and respiratorydisease (67).
Height has also been used as a proxy for usual childhood energy intake,which is particularly related to bodymass and the child’s level of activity.However, it is clearly an imperfect proxy because when protein intake isadequate (energy appears to be important in this regard only in the first3 months of life), genetics will define adult height (36). Protein,particularly animal protein, has been shown to have a selective effect inpromoting height growth. It has been suggested that childhoodobesity isrelated to excess protein intake and, of course, overweight or obesechildren tend to be in the upper percentiles for height. Height has beenshown to be related to cancer mortality at several sites, including breast,uterus and colon (36). The risk of stroke is increased by acceleratedgrowth in height during childhood (35). As accelerated growth has beenlinked to development of hypertension in adult life, this may be themechanism (plus an association with low socioeconomic status).
There is a higher prevalence of raised blood pressure not only in adults oflow socioeconomic status (68--74), but also in children from lowsocioeconomic backgrounds, although the latter is not always associated
35

with higher bloodpressure later in life (10). Blood pressure has been foundto track from childhood to predict hypertension in adulthood, but withstronger tracking seen in older ages of childhood and in adolescence (75).
Higher blood pressure in childhood (in combination with other riskfactors) causes target organ and anatomical changes that are associatedwith cardiovascular risk, including reduction in artery elasticity, increasedventricular size and mass, haemodynamic increase in cardiac output andperipheral resistance (10, 76, 77). High blood pressure in children isstrongly associatedwith obesity, in particular central obesity, and clustersand trackswith anadverse serum lipidprofile (especiallyLDLcholesterol)and glucose intolerance (76, 78, 79). Theremay be some ethnic differences,although these often seem to be explained by differences in body massindex. A retrospective mortality follow-up of a survey of family diet andhealth in the United Kingdom (1937--1939) identified significant associa-tions between childhood energy intake and mortality from cancer (64).
The presence and tracking of high blood pressure in children andadolescents occurs against a background of unhealthy lifestyles,including excessive intakes of total and saturated fats, cholesterol andsalt, inadequate intakes of potassium, and reduced physical activity,often accompanied by high levels of television viewing (10). Inadolescents, habitual alcohol and tobacco use contributes to raisedblood pressure (76, 80).
There are three critical aspects of adolescence that have an impact onchronic diseases: (i) the development of risk factors during this period;(ii) the tracking of risk factors throughout life; and, in terms ofprevention, (iii) the development of healthyor unhealthyhabits that tendto stay throughout life, for example physical inactivity because oftelevision viewing. In older children and adolescents, habitual alcoholand tobaccouse contribute to raisedbloodpressure and thedevelopmentof other risk factors in early life, most of which track into adulthood.
The clustering of risk factor variables occurs as early as childhood andadolescence, and is associated with atherosclerosis in young adulthoodand thus risk of later cardiovascular disease (81, 82). This clustering hasbeen described as the metabolic --- or ‘‘syndrome X’’ --- clustering ofphysiological disturbances associated with insulin resistance, includinghyperinsulinaemia, impaired glucose tolerance, hypertension, elevatedplasma triglyceride and low HDL cholesterol (83, 84). Raised serumcholesterol both inmiddle age and in early life are known tobe associatedwith an increased risk of disease later on. The Johns Hopkins PrecursorStudy showed that serum cholesterol levels in adolescents and youngwhite males were strongly related to subsequent risk of cardiovasculardisease mortality and morbidity (85).
36

Although the risk of obesity does not apparently increase in adults whowere overweight at 1 and 3 years old, the risk rises steadily thereafter,regardless of parental weight (86). Tracking has also been reported inChina, where overweight children were 2.8 times as likely to becomeoverweight adolescents; conversely, underweight children were 3.6times as likely to remain underweight as adolescents (87). The studyfound that parental obesity and underweight, and the child’s initialbody mass index, dietary fat intake and family income helped predicttracking and changes. However, in a prospective cohort studyconducted in the United Kingdom, little tracking from childhoodoverweight to adulthood obesity was found when using a measure offatness (percentage body fat for age) that was independent of build (88).The authors also found that only children obese at 13 years of age hadan increased risk of obesity as adults, and that there was no excess adulthealth risk from childhood or adolescent overweight. Interestingly, theyfound that in the thinnest children, the more obese they became asadults, the greater was their subsequent risk of developing chronicdiseases.
The real concern about these early manifestations of chronic disease,besides the fact that they are occurring earlier and earlier, is that oncethey have developed they tend to track in that individual throughoutlife. On the more positive side, there is evidence that they can becorrected. Overweight and obesity are, however, notoriously difficult tocorrect after becoming established, and there is an established risk ofoverweight during childhood persisting into adolescence and adulthood(89). Recent analyses (90, 91) have shown that the later the weight gainin childhood and adolescence, the greater the persistence. More than60% of overweight children have at least one additional risk factor forcardiovascular disease, such as raised blood pressure, hyperlipidaemiaor hyperinsulinaemia, and more than 20% have two or more riskfactors (89).
Habits leading to noncommunicable disease development during adolescence
It seems increasingly likely that there are widespread effects of early dieton later body composition, physiology and cognition (45). Suchobservations ‘‘provide strong support for the recent shift away fromdefining nutritional needs for prevention of acute deficiency symptomstowards long-term prevention of morbidity and mortality’’ (45).
Increased birth weight increases the risk of obesity later, but childrenwith low birth weight tend to remain small into adulthood (89, 92). Inindustrialized countries there have been only modest increases in birthweight so the increased levels of obesity described earlier must reflectenvironmental changes (89).
37

The ‘‘obesogenic’’ environment appears to be largely directed at theadolescent market, making healthy choices that muchmore difficult. Atthe same time, exercise patterns have changed and considerable parts ofthe day are spent sitting at school, in a factory, or in front of a televisionor computer. Raised blood pressure, impaired glucose tolerance anddyslipidaemia are associated in children and adolescents with unhealthylifestyles, such as diets containing excessive intakes of fats (especiallysaturated), cholesterol and salt, an inadequate intake of fibre andpotassium, a lack of exercise, and increased television viewing (10).Physical inactivity and smoking have been found independently topredict CHD and stroke in later life.
It is increasingly recognized that unhealthy lifestyles do not just appear inadulthood but drive the early development of obesity, dyslipidaemia, highblood pressure, impaired glucose tolerance and associated disease risk. Inmany countries, perhaps most typified by the United States, changes infamily eating patterns, including the increased consumption of fast foods,pre-preparedmeals and carbonated drinks, have taken place over the past30 years (89). At the same time, the amount of physical activity has beengreatly reduced both at home and in school, as well as by increasing use ofmechanized transport.
4.2.4 Adulthood
The three critical questions relating to adulthoodwere identified as: (i) towhat extent do risk factors continue to be important in the developmentof chronic diseases; (ii) to what extent will modifying such risk factorsmake a difference to the emergence of disease; and (iii) what is the role ofrisk factor reduction and modification in secondary prevention and thetreatment of those with disease? Reviewing the evidence within theframework of a life-course approach highlights the importance of theadult phase of life, it being both the period during which most chronicdiseases are expressed, as well as a critical time for the preventivereduction of risk factors and for increasing effective treatment (93).
The most firmly established associations between cardiovasculardisease or diabetes and factors in the lifespan are the ones betweenthose diseases and the major known ‘‘adult’’ risk factors, such astobacco use, obesity, physical inactivity, cholesterol, high bloodpressure and alcohol consumption (94). The factors that have beenconfirmed to lead to an increased risk of CHD, stroke and diabetes are:high blood pressure for CHD or stroke (95, 96); high cholesterol (diet)for CHD (97, 98), and tobacco use for CHD (99). Other associations arerobust and consistent, although they have not necessarily been shown tobe reversible (10): obesity and physical inactivity for CHD, diabetes and
38

stroke (100--102); and heavy or binge drinking for CHD and stroke (99,103). Most of the studies are from developed countries, but supportingevidence from developing countries is beginning to emerge, for example,from India (104).
In developed countries, low socioeconomic status is associatedwith higherrisk of cardiovascular disease and diabetes (105). As in the affluentindustrialized countries, there appears to be an initial preponderance ofcardiovascular disease among the higher socioeconomic groups, forexample, as has been found in China (98). It is presumed that the diseasewill progressively shift to the more disadvantaged sectors of society (10).There is some evidence that this is already happening, especially amongwomen in low-income groups, for example in Brazil (106) and SouthAfrica (107), as well as in countries in economic transition such asMorocco (108).
Other risk factors are continually being recognized or proposed. Theseinclude the role of high levels of homocysteine, the related factor of lowfolate, and the role of iron (109). From a social sciences perspective,Losier (110) has suggested that socioeconomic level is less importantthan a certain stability in the physical and social environment. In otherwords, an individual’s sense of understanding of his or her environ-ment, coupled with control over the course and setting of his or her ownlife appears to be the most important determinant of health. Marmot(111), among others, has demonstrated the impact of the widerenvironment and societal and individual stress on the development ofchronic disease.
4.2.5 Ageing and older people
There are three critical aspects relating to chronic diseases in the laterpart of the life-cycle: (i) most chronic diseases will be manifested in thislater stage of life; (ii) there is an absolute benefit for ageing individualsandpopulations in changing risk factors andadoptinghealth-promotingbehaviours such as exercise and healthy diets; and (iii) the need tomaximize health by avoiding or delaying preventable disability. Alongwith the societal and disease transitions, there has been a majordemographic shift. Although older people are currently defined as thoseaged 60 years and above (112), this definition of older people has a verydifferent meaning from the middle of the last century, when 60 years ofage and above often exceeded the average life expectancy, especially inindustrialized countries. It is worth remembering, however, that themajority of elderly people will, in fact, be living in the developing world.
Most chronic diseases are present at this period of life --- the result ofinteractions between multiple disease processes as well as more general
39
losses in physiological functions (113, 114). Cardiovascular diseasepeaks at this period, as does type 2 diabetes and some cancers. The mainburden of chronic diseases is observed at this stage of life and, therefore,needs to be addressed.
Changing behaviours in older people
In the 1970s, it was thought that risks were not significantly increasedafter certain late ages and that there would be no benefit in changinghabits, such as dietary habits, after 80 years old (115) as there was noepidemiological evidence that changing habits would affect mortality oreven health conditions among older people. There was also a feeling thatpeople ‘‘earned’’ some unhealthy behaviours simply because of reaching‘‘old age’’. Then there was a more active intervention phase, when olderpeople were encouraged to change their diets in ways that were probablyoverly rigorous for the expectedbenefit.More recently, olderpeoplehavebeen encouraged to eat a healthy diet --- as large and as varied as possiblewhile maintaining their weight --- and particularly to continue exercise(113, 116). Liu et al. (117) have reported an observed risk ofatherosclerotic disease among older women that was approximately30% less inwomenwhoate 5--10 servings of fruits and vegetables per daythan in those who ate 2--5 servings per day. It seems that, as elderlypatients have a higher cardiovascular risk, they are more likely to gainfrom risk factor modification (118).
Although this age group has received relatively little attention as regardsprimary prevention, the acceleration in decline caused by external factorsis generally believed to be reversible at any age (119). Interventions aimedat supporting the individual and promoting healthier environments willoften lead to increased independence in older age.
4.3 Interactions between early and later factors throughout the lifecourse
Lowbirthweight, followedby subsequentadultobesity,hasbeen showntoimpart a particularly high risk of CHD (120, 121), as well as diabetes (18).Risk of impaired glucose tolerance has been found to be highest in thosewho had low birth weight, but who subsequently became obese as adults(18).Anumberof recent studies (12, 13, 25, 59--61, 120) havedemonstratedthat there is an increased risk of adult disease when IUGR is followed byrapid catch-upgrowth inweight andheight.Conversely, there is also fairlyconsistent evidence of higher risk of CHD, stroke, and probably adultonsetdiabeteswith shorter stature (122, 123).Further research isneeded todefine optimal growth in infancy in terms of prevention of chronic disease.A WHO multicentre growth reference study (124) currently under waymay serve to generate much needed information on this matter.
40
4.3.1 Clustering of risk factors
Impaired glucose tolerance and an adverse lipid profile are seen as earlyas childhood and adolescence, where they typically appear clusteredtogether with higher blood pressure and relate strongly to obesity, inparticular central obesity (76, 78, 125, 126). Raised blood pressure,impaired glucose tolerance anddyslipidaemia also tend to be clustered inchildren and adolescents with unhealthy lifestyles and diets, such asthose with excessive intakes of saturated fats, cholesterol and salt, andinadequate intake of fibre. Lack of exercise and increased televisionviewing add to the risk (10). In older children and adolescents, habitualalcohol and tobacco use also contribute to raised blood pressure and tothe development of other risk factors in early adulthood. Many of thesame factors continue to act throughout the life course. Such clusteringrepresents an opportunity to address more than one risk at a time. Theclustering of health-related behaviours is also a well describedphenomenon (127).
4.3.2 Intergenerational effects
Young girls who grow poorly become stunted women and are morelikely to give birth to low-birth-weight babies who are then likely tocontinue the cycle by being stunted in adulthood, and so on (128).Maternal birth size is a significant predictor of a child’s birth size aftercontrolling for gestational age, sex of the child, socioeconomic status,and maternal age, height and pre-pregnant weight (129). There are clearindications of intergenerational factors in obesity, such as parentalobesity, maternal gestational diabetes and maternal birth weight. Lowmaternal birth weight is associated with higher blood pressure levels inthe offspring, independent of the relation between the offspring’s ownbirth weight and blood pressure (7). Unhealthy lifestyles can also have adirect effect on the health of the next generation, for example, smokingduring pregnancy (9, 130).
4.4 Gene--nutrient interactions and genetic susceptibility
There is good evidence that nutrients andphysical activity influence geneexpression and have shaped the genome over several million years ofhuman evolution. Genes define opportunities for health and suscep-tibility to disease, while environmental factors determine whichsusceptible individuals will develop illness. In view of changing socio-economic conditions in developing countries, such added stress mayresult in exposure of underlying genetic predisposition to chronicdiseases. Gene--nutrient interactions also involve the environment. Thedynamics of the relationships are becoming better understood but thereis still a long way to go in this area, and also in other aspects, such as
41

disease prevention and control. Studies continue on the role of nutrientsin gene expression; for example, researchers are currently trying tounderstand why omega-3 fatty acids suppress or decrease the mRNA ofinterleukin, which is elevated in atherosclerosis, arthritis and otherautoimmune diseases, whereas the omega-6 fatty acids do not (131).Studies on genetic variability to dietary response indicate that specificgenotypes raise cholesterol levels more than others. The need fortargeted diets for individuals and subgroups to prevent chronic diseaseswas acknowledged as being part of an overall approach to preventionat the population level. However, the practical implications of this issue
for public health policy have only begun to be addressed. For example, arecent study of the relationship between folate and cardiovascular diseaserevealed thatacommonsinglegenemutation that reduces theactivityofanenzyme involved in folate metabolism (MTHFR) is associated with amoderate (20%) increase in serum homocysteine and higher risk of bothischaemic heart disease and deep vein thrombosis (132).
Although humans have evolved being able to feed on a variety of foodsand to adapt to them, certain genetic adaptations and limitations haveoccurred in relation to diet. Understanding the evolutionary aspects ofdiet and its composition might suggest a diet that would be consistentwith the diet towhich our geneswere programmed to respond.However,the early diet was presumably one which gave evolutionary advantage toreproduction in the early part of life, and so may be less indicative ofguidance for healthy eating, in terms of lifelong health and prevention ofchronic disease after reproduction has been achieved. Because there aregenetic variations among individuals, changes in dietary patterns have adifferential impact on a genetically heterogeneous population, althoughpopulations with a similar evolutionary background have more similargenotypes. While targeted dietary advice for susceptible populations,subgroups or individuals is desirable, it is not feasible at present for theimportant chronic diseases considered in this report.Most are polygenicin nature and rapidly escalating rates suggest the importance ofenvironmental change rather than change in genetic susceptibility.
4.5 Intervening throughout life
There is a vast volume of scientific evidence highlighting the importanceof applying a life-course approach to the prevention and control ofchronic disease. The picture is, however, still not complete, and theevidence sometimes contradictory. From the available evidence, it ispossible to state the following:
. Unhealthy diets, physical inactivity and smoking are confirmed riskbehaviours for chronic diseases.
42

. The biological risk factors of hypertension, obesity and lipidaemia arefirmly established as risk factors for coronary heart disease, stroke anddiabetes.
. Nutrients and physical activity influence gene expression and maydefine susceptibility.
. The major biological and behavioural risk factors emerge and act inearly life, and continue to have a negative impact throughout the lifecourse.
. The major biological risk factors can continue to affect the health ofthe next generation.
. An adequate and appropriate postnatal nutritional environment isimportant.
. Globally, trends in the prevalence of many risk factors are upwards,especially those for obesity, physical inactivity and, in the developingworld particularly, smoking.
. Selected interventions are effective but must extend beyond individualrisk factors and continue throughout the life course.
. Some preventive interventions early in the life course offer lifelongbenefits.
. Improving diets and increasing levels of physical activity in adults andolder people will reduce chronic disease risks for death and disability.
. Secondary prevention through diet and physical activity is a comple-mentary strategy in retarding the progression of existing chronic diseasesand decreasing mortality and the disease burden from such diseases.
From the above, it is clear that risk factorsmust be addressed throughoutthe life course. As well as preventing chronic diseases, there are clearlymany other reasons to improve the quality of life of people throughouttheir lifespan. The intention of primary prevention interventions is tomove the profile of the whole population in a healthier direction. Smallchanges in risk factors in the majority who are at moderate risk can havean enormous impact in terms of population-attributable risk of deathand disability. By preventing disease in large populations, smallreductions in blood pressure, blood cholesterol and so on candramatically reduce health costs. For example, it has been demonstratedthat improved lifestyles can reduce the risk of progression to diabetes bya striking 58% over 4 years (133, 134). Other population studies haveshown that up to 80%of cases of coronary heart disease, and up to 90%of cases of type 2 diabetes, could potentially be avoided throughchanging lifestyle factors, and about one-third of cancers could be
43

avoided by eating healthily, maintaining normal weight and exercisingthroughout life (135--137).
For interventions to have a lasting effect on the risk factor prevalenceand the health of societies, it is also essential to change or modify theenvironment in which these diseases develop. Changes in dietarypatterns, the influence of advertising and the globalization of diets,and widespread reduction in physical activity have generally hadnegative impacts in terms of risk factors, and presumably also in termsof subsequent disease (138, 139). Reversing current trends will require amultifaceted public health policy approach.
While it is important to avoid inappropriately applying nutritionalguidelines to populations that may differ genetically from those forwhom the dietary and risk data were originally determined, to date theinformation regarding genes or gene combinations is insufficient todefine specific dietary recommendations based on a populationdistribution of specific genetic polymorphisms. Guidelines should tryto ensure that the overall benefit of recommendations to the majority ofthe population substantially outweighs any potential adverse effects onselected subgroups of the population. For example, population-wideefforts to preventweight gainmay trigger a fear of fatness and, therefore,undernutrition in adolescent girls.
The population nutrient goals recommended by the Joint WHO/FAOExpert Consultation at the present meeting are based on currentscientific knowledge and evidence, and are intended to be furtheradapted and tailored to local or national diets and populations, wherediet has evolved to be appropriate for the culture and local environment.
The goals are intended to reverse or reduce the impact of unfavourabledietary changes that have occurred over the past century in theindustrialized world and more recently in many developing countries.Present nutrient intake goals also need to take into account the effects oflong-term environmental changes, i.e. those that have occurred overtime-scales of hundreds of years. For example, themetabolic response toperiodic famine and chronic food shortage may no longer represent aselective advantage but instead may increase susceptibility to chronicdiseases. An abundant stable food supply is a recent phenomenon; it wasnot a factor until the advent of the industrial revolution (or theequivalent process in more recently industrialized countries).
A combination of physical activity, food variety and extensive socialinteraction is the most likely lifestyle profile to optimize health, asreflected in increased longevity and healthy ageing. Some availableevidence suggests that, within the time frame of a week, at least 20 and
44

probably as many as 30 biologically distinct types of foods, with theemphasis on plant foods, are required for healthy diets.
The recommendations given in this report consider the wider environ-ment, of which the food supply is a major part (see Chapter 3). Theimplications of the recommendations would be to increase theconsumption of fruits and vegetables, to increase the consumption offish, and to alter the types of fats and oils, as well as the amount of sugarsand starch consumed, especially in developed countries. The currentmove towards increasing animal protein in diets in countries in economictransition is unlikely to be reversed in those countries where there areincreased consumer resources, but is unlikely to be conducive to adulthealth, at least in terms of preventing chronic diseases.
Finally, what success can be expected by developing and updating thescientific basis for national guidelines? The percentage of British adultscomplying with national dietary guidelines is discouraging; for example,only 2--4%of the population are currently consuming the recommendedlevel of saturated fat, and 5--25% are achieving the recommended levelsof fibre. The figures would not be dissimilar in many other developedcountries, where themajority of people are not aware of what exactly thedietary guidelines suggest. In using the updated and evidence-basedrecommendations in this report, national governments should aim toproduce dietary guidelines that are simple, realistic and food-based.There is an increasing need, recognized at all levels, for the widerimplications to be specifically addressed; these include the implicationsfor agriculture and fisheries, the role of international trade in aglobalized world, the impact on countries dependent on primaryproduce, the effect of macroeconomic policies, and the need forsustainability. The greatest burden of disease will be in the developingworld and, in the transitional and industrialized world, amongst themost disadvantaged socioeconomically.
In conclusion, it may be necessary to have three mutually reinforcingstrategies that will have different magnitudes of impact over differing timeframes. First, with the greatest and most immediate impact, there is theneed to address risk factors in adulthood and, increasingly, among olderpeople. Risk-factor behaviours can be modified in these groups andbenefits seen within 3--5 years. With all populations ageing, the sheernumbers andpotential cost savings are enormous and realizable. Secondly,societal changes towards health-promoting environments need to begreatly expanded as an integral part of any intervention. Ways to reducethe intake of sugars-sweetened drinks (particularly by children) and ofhigh-energy density foods that are micronutrient poor, as well as efforts tocurb cigarette smoking and to increase physical activitywill have an impact
45

throughout society. Such changes need the active participation ofcommunities, politicians, health systems, town planners and municipa-lities, as well as the food and leisure industries. Thirdly, the healthenvironment, inwhich thosewhoaremost at risk growup, needs to change.This is a more targeted and potentially costly approach, but one that hasthe potential for cost-effective returns even though they are longer term.
References
1. Diet, nutrition and the prevention of chronic diseases. Report of a WHO StudyGroup. Geneva, World Health Organization, 1990 (WHO Technical ReportSeries, No. 797).
2. Diet, physical activity and health. Geneva, World Health Organization, 2002(documents A55/16 and A55/16 Corr.1).
3. Barker DJP et al. Weight gain in infancy and death from ischaemic heartdisease. Lancet, 1989, 2:577--580.
4. Barker DJP et al. Type 2 (non-insulin-dependent) diabetes mellitus, hyperten-sion and hyperlipidaemia (syndrome X): relation to reduced fetal growth.Diabetologia, 1993, 36:62--67.
5. Barker DJP et al. Growth in utero and serum cholesterol concentrations in adultlife. British Medical Journal, 1993, 307:1524--1527.
6. Barker DJP. Fetal origins of coronary heart disease. British Medical Journal,1995, 311:171--174.
7. Barker DJP et al. Growth in utero and blood pressure levels in the nextgeneration. Journal of Hypertension, 2000, 18:843--846.
8. Barker DJPet al. Size at birth and resilience to effects of poor living conditions inadult life: longitudinal study. British Medical Journal, 2001, 323:1273--1276.
9. Programming of chronic disease by impaired fetal nutrition: evidence andimplications for policy and intervention strategies. Geneva, World HealthOrganization, 2002 (documents WHO/NHD/02.3 and WHO/NPH/02.1).
10. Aboderin I et al. Life course perspectives on coronary heart disease, stroke anddiabetes: theevidenceand implications for policy and research. Geneva,WorldHealth Organization, 2002 (document WHO/NMH/NPH/02.1).
11. Godfrey KM, Barker DJ. Fetal nutrition and adult disease. American Journal ofClinical Nutrition, 2000, 71(Suppl. 5):S1344--S1352.
12. Forsen T et al. The fetal and childhood growth of persons who develop type IIdiabetes. Annals of Internal Medicine, 2000, 33:176--182.
13. Eriksson JG et al. Catch-up growth in childhood and death from coronary heartdisease: a longitudinal study. British Medical Journal, 1999, 318:427--431.
14. Forsen T et al. Growth in utero and during childhood in women who developcoronary heart disease: a longitudinal study. British Medical Journal, 1999,319:1403--1407.
15. Rich-Edwards JW et al. Birth weight and the risk of type II diabetes mellitus inadult women. Annals of Internal Medicine, 1999, 130:278--284.
16. Leon DA et al. Reduced fetal growth rate and increased risk of death fromischaemic heart disease: cohort study of 15 000 Swedishmen andwomen born1915--29. British Medical Journal, 1998, 317:241--245.
46

17. McKeigue PM. Diabetes and insulin action. In: Kuh D, Ben-Shlomo Y, eds.A lifecourse approach to chronic disease epidemiology. Oxford, Oxford UniversityPress, 1997:78--100.
18. Lithell HO et al. Relation of size at birth to non-insulin dependent diabetes andinsulin concentrations in men aged 50--60 years. British Medical Journal, 1996,312:406--410.
19. MartynCN, BarkerDJP,OsmondC. Mother’s pelvic size, fetal growth anddeathfrom stroke and coronary heart disease in men in the UK. Lancet, 1996,348:1264--1268.
20. Martyn CN, Barker DJ. Reduced fetal growth increases risk of cardiovasculardisease. Health Reports, 1994, 6:45--53.
21. McCance DR et al. Birthweight and non-insulin dependent diabetes: thriftygenotype, thrifty phenotype or surviving small baby genotype? British MedicalJournal, 1994, 308:942--945.
22. Fall CHD et al. Size at birth, maternal weight, and type II diabetes in South India.Diabetic Medicine, 1998, 15:220--227.
23. ValdezR et al. Birthweight and adult health outcomes in a biethnic population inthe USA. Diabetologia, 1994, 35:444--446.
24. KuhD, Ben-ShlomoY.A life course approach to chronic disease epidemiology.Oxford, Oxford University Press, 1997.
25. Eriksson JG et al. Early growth and coronary heart disease in later life:longitudinal study. British Medical Journal, 2001, 322:949--953.
26. Walker SP et al. The effects of birth weight and postnatal linear growth on bloodpressure at age 11--12 years. Journal of Epidemiology and Community Health,2001, 55:394--398.
27. Gunnell DJ et al. Socio-economic anddietary influences on leg length and trunklength in childhood: a reanalysis of the Carnegie (Boyd Orr) survey of diet andhealth in prewar Britain (1937--39). Pediatric and Perinatal Epidemiology, 1998,12(Suppl. 1):96--113.
28. McCarron P et al. The relation between adult height and haemorrhagic andischaemic stroke in the Renfew/Paisley Study. Journal of Epidemiology andCommunity Health, 2001, 55:404--405.
29. Forsen T et al. Short stature and coronary heart disease: a 35-year follow-up ofthe Finnish cohorts of the seven countries study. Journal of Internal Medicine,2000, 248:326--332.
30. HartCL,HoleDJ,Davey-SmithG. Influenceof socioeconomic circumstances inearly and later life on stroke risk among men in a Scottish cohort. Stroke, 2000,31:2093--2097.
31. Jousilahti P et al. Relation of adult height to cause-specific and total mortality: aprospective follow-up study of 31,199middle-agedmen andwomen.AmericanJournal of Epidemiology, 2000, 151:1112--1120.
32. McCarronPet al. Adult height is inversely associatedwith ischaemic stroke. TheCaerphilly and Speedwell Collaborative Studies. Journal of Epidemiology andCommunity Health, 2000, 54:239--240.
33. Wannamethee SG et al. Adult height, stroke and coronary heart disease.American Journal of Epidemiology, 1998, 148:1069--1076.
47
34. Marmot MG et al. Contributions of job control and other risk factors to socialvariations in coronary heart disease incidence. Lancet, 1997, 350:235--239.
35. Eriksson JG et al. Early growth, adult income, and risk of stroke. Stroke, 2000,31:869--874.
36. MustA, LipmanRD. Childhoodenergy intake andcancermortality in adulthood.Nutrition Reviews, 1999, 57:21--24.
37. Singhal A, Cole TJ, Lucas A. Early nutrition in preterm infants and later bloodpressure: two cohorts after randomized trials. Lancet, 2001, 357:413--419.
38. Wilson AC et al. Relation of infant feeding to adult serum cholesterolconcentration and death from ischaemic heart disease. BritishMedical Journal,1998, 316:21--25.
39. Ravelli AC et al. Infant feeding and adult glucose tolerance, lipid profile, bloodpressure, and obesity. Archives of Disease in Childhood, 2000, 82:248--252.
40. GillmanMWet al. Risk of overweight amongadolescentswhowerebreastfed asinfants. Journal of the American Medical Association, 2001, 285:2461--2467.
41. von Kries R et al. Does breast-feeding protect against childhood obesity?Advances in Experimental Medicine and Biology, 2000, 478:29--39.
42. von Kries R et al. Breast feeding and obesity: cross-sectional study. BritishMedical Journal, 1999, 319:147--150.
43. Kramer MS. Do breast-feeding and delayed introduction of solid foods protectagainst subsequent obesity? Journal of Pediatrics, 1981, 98:883--887.
44. DietzWH. Breastfeedingmayhelp prevent childhoodoverweight. Journal of theAmerican Medical Association, 2001, 285:2506--2507.
45. Roberts SB. Prevention of hypertension in adulthoodby breastfeeding? Lancet,2001, 357:406--407.
46. Wingard DL et al. Is breast-feeding in infancy associated with adult longevity?American Journal of Public Health, 1994, 84:1456--1462.
47. Fall C. Nutrition in early life and later outcome. European Journal of ClinicalNutrition, 1992, 46(Suppl. 4):S57--S63.
48. Davis MK. Breastfeeding and chronic disease in childhood and adolescence.Pediatric Clinics of North America, 2001, 48:125--141.
49. Reiser RB et al. Studies on a possible function for cholesterol in milk. NutritionReports International, 1979, 19:835--849.
50. Mott GE, Lewis DS, McGill HC. Deferred effects of preweaning nutrition on lipidmetabolism. Annals of the New York Academy of Sciences, 1991, 623:70--80.
51. van Biervliet JP et al. Plasma apoprotein and lipid patterns in newborns:influence of nutritional factors. Acta Paediatrica Scandinavica, 1981,70:851--856.
52. Carlson SE, DeVoe PW, Barness LA. Effect of infant diets with differentpolyunsaturated to saturated fat ratios on circulating high density lipoproteins.Journal of Pediatric Gastroenterology and Nutrition, 1982, 1:303--309.
53. Darmady JM, Fosbrooke AS, Lloyd JK. Prospective study of serum cholesterollevels during the first year of life. British Medical Journal, 1972, 2:685--688.
54. Mize CE et al. Lipoprotein-cholesterol responses in healthy infants fed defineddiets from ages 1 to 12 months: comparison of diets predominant in oleic acid
48
versus linoleic acid,withparallel observations in infants fedahumanmilk-baseddiet. Journal of Lipid Research, 1995, 36:1178--1187.
55. Grundy SM, Denke MA. Dietary influences on serum lipids and lipoproteins.Journal of Lipid Research, 1990, 31:1149--1172.
56. Mensink RP, Katan MB. Effect of dietary fatty acids on serum lipids andlipoproteins. A meta-analysis of 27 trials. Arteriosclerosis and Thrombosis,1992, 12:911--919.
57. Arifeen SE et al. Infant growth patterns in the slums of Dhaka in relation to birthweight, intrauterine growth retardation, and prematurity. American Journal ofClinical Nutrition, 2000, 72:1010--1017.
58. Bavdekar A et al. Insulin resistance in 8-year-old Indian children. Diabetes,1999, 48:2422--2429.
59. YajnikCS. The insulin resistance epidemic in India: fetal origins, later lifestyle, orboth? Nutrition Reviews, 2001, 59:1--9.
60. YajnikCS. Interactions of perturbationsof intrauterinegrowth andgrowthduringchildhood on the risk of adult-onset disease. Proceedings of the NutritionSociety, 2000, 59:257--265.
61. Fall CHD et al. The effects of maternal body composition before pregnancy onfetal growth: the Pune Maternal Nutrition Study. In: O’Brien PMS, Wheeler T,Barker DJP, eds. Fetal programming influences on development and disease inlater life. London, Royal College of Obstetricians and Gynaecologists Press,1999:231--245.
62. Lucas A, Fewtrell MS, Cole TJ. Fetal origins of adult disease --- the hypothesisrevisited. British Medical Journal, 1999, 319:245--249.
63. Must A et al. Long-term morbidity and mortality of overweight adolescents. Afollow-up of theHarvardGrowth Study.NewEngland Journal ofMedicine, 1992,327:1350--1355.
64. Frankel S, Gunnel DJ, Peters TJ. Childhood energy intake and adult mortalityfrom cancer: the Boyd Orr Cohort Study. British Medical Journal, 1998,316:499--504.
65. Weight control and physical activity. Lyon, International Agency for Researchon Cancer, 2002 (IARC Handbooks of Cancer Prevention, Vol. 6).
66. Davey-Smith G, Shipley M, Leon DA. Height and mortality from cancer amongmen: prospective observational study. British Medical Journal, 1998,317:1351--1352.
67. Davey-Smith G et al. Height and risk of death among men and women:aetiological implications of associations with cardiorespiratory disease andcancer mortality. Journal of Epidemiology and Community Health, 2000,54:97--103.
68. BartleyMet al. Social distribution of cardiovascular disease risk factors: changeamongmen1984--1993. Journal of Epidemiology andCommunity Health, 2000,54:806--814.
69. Manhem K et al. Social gradients in cardiovascular risk factors and symptomsof Swedish men and women: the Goteborg MONICA Study. Journal ofCardiovascular Risk, 2000, 7:259--318.
49

70. Colhoun HM, Hemingway H, Poulter N. Socio-economic status and bloodpressure: an overview analysis. Journal of Human Hypertension, 1998,12:91--110.
71. Lynch JW et al. Do cardiovascular risk factors explain the relation betweensocioeconomic status, risk of all-cause mortality, cardiovascular mortality, andacute myocardial infarction? American Journal of Epidemiology, 1996,144:934--942.
72. Myllykangas M et al. Haemostatic and other cardiovascular risk factors, andsocioeconomic status among middle-aged Finnish men. International Journalof Epidemiology, 1995, 24:1110--1116.
73. Luepker RV et al. Socioeconomic status and coronary heart disease risk factortrends. The Minnesota Heart Survey. Circulation, 1993, 88:2172--2179.
74. MarmotM. Socioeconomic determinants of CHDmortality. International Journalof Epidemiology, 1989, 18(Suppl. 1):S196--S202.
75. Whincup P, Cook D. Blood pressure and hypertension. In: Kuh D, Ben-ShlomoY, eds.A life course approach to chronic disease epidemiology. Oxford, OxfordUniversity Press, 1997:121--144.
76. Berenson GS et al. Cardiovascular risk in early life: the Bogalusa Heart Study.Kalamazoo, MI, The Upjohn Company, 1991 (Current Concepts Series).
77. Bao W et al. Essential hypertension predicted by tracking of elevated bloodpressure from childhood to adulthood: the Bogalusa Heart Study. AmericanJournal of Hypertension, 1995, 8:657--665.
78. Tan F et al. Tracking of cardiovascular risk factors and a cohort study onhyperlipidemia in rural schoolchildren in Japan. Journal of Epidemiology, 2000,10:255--261.
79. Tershakovec AM et al. Age-related changes in cardiovascular disease riskfactors of hypercholesteraemic children. Journal of Pediatrics, 1998,132:414--420.
80. Okasha M et al. Determinants of adolescent blood pressure: findings from theGlasgow University student cohort. Journal of Human Hypertension, 2000,14:117--124.
81. Bao W et al. Persistence of multiple cardiovascular risk clustering related toSyndrome X from childhood to young adulthood: the Bogalusa Heart Study.Archives of Internal Medicine, 1994, 154:1842--1847.
82. Berenson GS et al. Association between multiple cardiovascular risk factorsand atherosclerosis in children and young adults. New England Journal ofMedicine, 1998, 338:1650--1656.
83. Reaven GM. Role of insulin resistance in human disease. Diabetes, 1988,37:1595--1607.
84. DeFronzo RA, Ferrannini E. Insulin resistance. A multifaceted syndromeresponsible for NIDDM, obesity, hypertension, dyslipidaemia, and athero-sclerotic cardiovascular disease. Diabetes Care, 1991, 14:173--194.
85. KlagMGet al. Serum cholesterol in youngmen and subsequent cardiovasculardisease. New England Journal of Medicine, 1993, 328:313--318.
86. Whitaker RC et al. Predicting obesity in young adulthood from childhood andparental obesity. New England Journal of Medicine, 1997, 337:869--873.
50

87. Wang Y, Ge K, Popkin BM. Tracking of body mass index from childhood toadolescence: a 6-y follow-up study in China. American Journal of ClinicalNutrition, 2000, 72:1018--1024.
88. Wright CM et al. Implications of childhood obesity for adult health: findingsfrom thousand families cohort study. British Medical Journal, 2001,323:1280--1284.
89. Dietz WH. The obesity epidemic in young children. British Medical Journal,2001, 322:313--314.
90. Parsons TJ, PowerC,ManorO. Fetal and early life growth andbodymass indexfrom birth to early adulthood in a 1958 British cohort: longitudinal study. BritishMedical Journal, 2001, 323:1331--1335.
91. Parsons TJ et al. Childhood predictors of adult obesity: a systematic review.International Journal of Obesity and Related Metabolic Disorders, 1999,23(Suppl. 8):S1--S107.
92. Strauss RS. Adult functional outcome of those born small for gestational age:twenty-six-year follow-up of the 1970 British birth cohort. Journal of theAmerican Medical Association, 2000, 283:625--632.
93. Mann JI. Diet and risk of coronary heart disease and type II diabetes. Lancet,2002, 360:783--789.
94. ElisafM. The treatment of coronaryheart disease: anupdate. Part 1: anoverviewof the risk factors for cardiovascular disease. Current Medical Research andOpinion, 2001, 17:18--26.
95. Kannel WB. Blood pressure as a cardiovascular risk factor: prevention andtreatment. Journal of the AmericanMedical Association, 1996, 275:1571--1576.
96. MacMahon S et al. Blood pressure, stroke and coronary heart disease. Part 1.Prolonged differences in blood pressure: prospective observational studiescorrected for the regression dilution bias. Lancet, 1990, 335:765--774.
97. Hooper L et al. Reduced or modified dietary fat for preventing cardiovasculardisease Cochrane Database of Systematic Reviews, 2003 (1): CD 002137.(available on the Internet at http://www.update-software.com/cochrane).
98. HuF et al. Prospective study of major dietary patterns and risk of coronary heartdisease in men. American Journal of Clinical Nutrition, 2000, 72:912--921.
99. Lopez A. Alcohol and smoking as risk factors. In: Chamie J, Cliquet L, eds.Health and mortality: issues of global concern. Proceedings of the SymposiumonHealth andMortality, Brussels, 19--22November 1997. NewYork, NY, UnitedNations Department of Economic and Social Affairs, 1999:374--411.
100. Davey-Smith G et al. Physical activity and cause specific mortality in theWhitehall Study. Public Health, 2000, 114:308--315.
101. Wannamethee SG, Shaper AG, Walker M. Changes in physical activity,mortality and incidence of coronary heart disease in older men. Lancet, 1998,351:1603--1608.
102. Jousilahti P et al. Body weight, cardiovascular risk factors, and coronarymortality: 15-year follow-up of middle-agedmen andwomen in eastern Finland.Circulation, 1996, 93:1372--1379.
103. Kauhanen J et al. Beer bingeing and mortality. Results from the Kuoipoischaemic heart disease risk factor study: a prospective population basedstudy. British Medical Journal, 1997, 315:846--851.
51

104. Gupta PC, Mehta HC. Cohort study of all-causemortality among tobacco usersin Mumbai, India. Bulletin of the World Health Organization, 2000, 78:877--883.
105. Davey-Smith G. Socioeconomic differentials. In: Kuh D, Ben-Shlomo Y, eds.A life course approach to chronic disease epidemiology. Oxford, OxfordUniversity Press, 1997:242--273.
106. Monteiro CA, Conde WL, Popkin BM. Is obesity replacing or adding toundernutrition? Evidence from different social classes of Brazil. Public HealthNutrition, 2002, 5:105--112.
107. Bourne LT, Lambert EV, Steyn K. Where does the black population of SouthAfrica standon the nutrition transition?PublicHealthNutrition, 2002,5:157--162.
108. Benjelloun S. Nutrition transition in Morocco. Public Health Nutrition, 2002,5:135--140.
109. Nelson RL. Iron and colorectal cancer risk: human studies. Nutrition Reviews,2001, 59:140--148.
110. Losier L. Ambiocontrol as a primary factor of health. Social Science andMedicine, 1993, 37:735--743.
111. Marmot M. Aetiology of coronary heart disease. Fetal and infant growth andsocioeconomic factors in adult life may act together. British Medical Journal,2001, 323:1261--1262.
112. Active ageing: a policy framework. Geneva, World Health Organization, 2002(document WHO/NMH/NPH/02.8).
113. Darnton-Hill I, Coyne ET, Wahlqvist ML. Assessment of nutritional status. In:Ratnaike R, ed. A practical guide to geriatric practice. Sydney, McGraw-Hill,2001:424--439.
114. Manton KG, Corder L, Stallard E. Chronic disability trends in elderly UnitedStates populations: 1982--1994. Proceedings of the National Academy ofSciences of the United States of America, 1997, 94:2593--2598.
115. Lasheras C, Fernandez S, Patterson AM. Mediterranean diet and age withrespect to overall survival in institutionalised, non-smoking elderly people.American Journal of Clinical Nutrition, 2000, 71:987--992.
116. World Health Organization/Tufts University School of Nutrition Science andPolicy. Keep fit for life: meeting the nutritional needs of older persons. Geneva,World Health Organization, 2002.
117. Liu S et al. Fruit and vegetable intake and risk of cardiovascular disease: theWomen’s Health Study. American Journal of Clinical Nutrition, 2000, 72:922--928.
118. Smith GD, Song F, Sheldon TA. Cholesterol lowering and mortality: theimportance of considering initial level of risk. British Medical Journal, 1993,306:1367--1373.
119. Ageing: exploding the myths. Geneva, World Health Organization, 1999(document WHO/HSL/AHE/99.1).
120. Yajnik CS. The lifecycle effects of nutrition and body size on adult obesity,diabetes and cardiovascular disease. Obesity Reviews, 2002, 3:217--224.
121. Frankel S et al. Birthweight, body mass index in middle age and incidentcoronary heart disease. Lancet, 1996, 348:1478--1480.
122. Eriksson J et al. Fetal and childhood growth and hypertension in adult life.Hypertension, 2000, 36:790--794.
52
123. Leon DA et al. Failure to realise growth potential in utero and adult obesity inrelation to blood pressure in 50-year-old Swedish men. British Medical Journal,1996, 312:401--406.
124. Garza C, de Onis M. A new international growth reference for young children.American Journal of Clinical Nutrition, 1999, 70(Suppl.):S169--S172.
125. Twisk JW et al. Clustering of biological risk factors for cardiovascular diseaseand the longitudinal relationship with lifestyle of an adolescent population: theNorthern Ireland Young Hearts Project. Journal of Cardiovascular Risk, 1999,6:355--362.
126. RaitakariOTet al. Clusteringof risk factors for coronary heart disease in childrenand adolescents. The Cardiovascular Risk in Young Finns Study. ActaPaediatrica, 1994, 83:935--940.
127. Koo LC et al. Dietary and lifestyle correlates of passive smoking in Hong Kong,Japan, Sweden, and theUSA.Social Science andMedicine, 1997,45:159--169.
128. United Nations Children’s Fund. The state of the world’s children 1998. Oxfordand New York, Oxford University Press, 1998.
129. RamakrishnanUet al. Role of intergenerational effects on linear growth. Journalof Nutrition, 1999, 129(Suppl. 2):S544--S549.
130. MontgomerySM,EkbomA. Smokingduring pregnancy anddiabetesmellitus ina British longitudinal birth cohort. British Medical Journal, 2002, 324:26--27.
131. Simopoulos AP, Pavlow KN, eds. Nutrition and fitness: diet, genes, physicalactivity and health. Proceedings of 4th International Conference on Nutritionand Fitness, Athens, May 2000. New York, NY, Karger, 2001 (World Review ofNutrition and Dietetics, Vol. 89).
132. Wald DS, Law M, Morris JK. Homocysteine and cardiovascular disease:evidence on causality from a meta-analysis. British Medical Journal, 2002,325:1202--1208.
133. Diabetes Prevention Program Research Group. Reduction in the incidence oftype II diabetes with lifestyle intervention or metformin. New England Journal ofMedicine, 2002, 346:343--403.
134. Tuomilehto J et al. Prevention of type II diabetes mellitus by changes in lifestyleamong subjects with impaired glucose tolerance. New England Journal ofMedicine, 2001, 344:1343--1350.
135. Stampfer MJ et al. Primary prevention of coronary heart disease in womenthrough diet and lifestyle. New England Journal of Medicine, 2000, 343:16--22.
136. HuFBet al. Diet, lifestyle, and the risk of type II diabetesmellitus inwomen.NewEngland Journal of Medicine, 2001, 345:790--797.
137. Key TJ. The effect of diet on risk of cancer. Lancet, 2002, 360:861--868.
138. Globalization, diets and noncommunicable diseases. Geneva, World HealthOrganization, 2002.
139. Beaglehole R, Yach D. Globalization and the prevention and control ofnoncommunicable disease: the neglected chronic diseases of adults. Lancet(in press).
53

5. Population nutrient intake goals for preventingdiet-related chronic diseases
5.1 Overall goals
5.1.1 Background
Populationnutrient intake goals represent thepopulation average intakethat is judged to be consistent with the maintenance of health in apopulation. Health, in this context, is marked by a low prevalence ofdiet-related diseases in the population.
Seldomis therea single ‘‘bestvalue’’ for suchagoal. Instead, consistentwiththeconceptofa safe rangeofnutrient intakes for individuals, there isoftenarange of population averages that would be consistent with themaintenance of health. If existing population averages fall outside thisrange, or trends in intake suggest that the population average will moveoutside the range, health concerns are likely to arise. Sometimes there is nolower limit; this implies that there is no evidence that thenutrient is requiredin thediet andhence low intakes shouldnot give rise to concern. Itwouldbeof concern if a large proportion of values were outside the defined goals.
5.1.2 Strength of evidence
Ideally the definition of an increased or a decreased risk should be basedon a relationship that has been established by multiple randomizedcontrolled trials of interventions on populations that are representativeof the target of a recommendation, but this type of evidence is often notavailable. The recommended dietary/nutrition practice should modifythe attributable risk of the undesirable exposure in that population.
The following criteria are used to describe the strength of evidence in thisreport. They are based on the criteria used by the World CancerResearch Fund (1), but have been modified by the Expert Consultationto include the results of controlled trials where relevant and available. Inaddition, consistent evidence on community and environmental factorswhich lead to behaviour changes and thereby modify risks has beentaken into account in categorizing risks. This applies particularly to thecomplex interaction between environmental factors that affect excessweight gain, a risk factor which the Consultation recognized ascontributing to many of the problems being considered.
. Convincing evidence. Evidence based on epidemiological studiesshowing consistent associations between exposure and disease, withlittle or no evidence to the contrary. The available evidence is based ona substantial number of studies including prospective observationalstudies and where relevant, randomized controlled trials of sufficient
54

size, duration and quality showing consistent effects. The associationshould be biologically plausible.
. Probable evidence.Evidence based on epidemiological studies showingfairly consistent associations between exposure and disease, but wherethere are perceived shortcomings in the available evidence or someevidence to the contrary, which precludes a more definite judgement.Shortcomings in the evidence may be any of the following: insufficientduration of trials (or studies); insufficient trials (or studies) available;inadequate sample sizes; incomplete follow-up. Laboratory evidence isusually supportive.Again, theassociation shouldbebiologicallyplausible.
. Possible evidence. Evidence based mainly on findings from case--control and cross-sectional studies. Insufficient randomized controlledtrials, observational studies or non-randomized controlled trials areavailable. Evidence based on non-epidemiological studies, such asclinical and laboratory investigations, is supportive. More trials arerequired to support the tentative associations, which should also bebiologically plausible.
. Insufficient evidence.Evidence based on findings of a few studies whichare suggestive, but are insufficient to establish an association betweenexposure and disease. Limited or no evidence is available fromrandomized controlled trials. More well designed research is requiredto support the tentative associations.
The strength of evidence linking dietary and lifestyle factors to the risk ofdeveloping obesity, type 2 diabetes, CVD, cancer, dental diseases,osteoporosis, graded according to the above categories, is summarized intabular form, and attached to this report as an Annex.
5.1.3 A summary of population nutrient intake goals
The population nutrient intake goals for consideration by national andregional bodies establishingdietary recommendations for the preventionof diet-related chronic diseases are presented in Table 6. Theserecommendations are expressed in numerical terms, rather than asincreases or decreases in intakes of specific nutrients, because thedesirable change will depend upon existing intakes in the particularpopulation, and could be in either direction.
In Table 6, attention is directed towards the energy-supplyingmacronutrients. This must not be taken to imply a lack of concern forthe other nutrients. Rather, it is a recognition of the fact that previousreports issued by FAO andWHOhave provided limited guidance on themeaningof a ‘‘balanceddiet’’ described in termsof the proportions of thevarious energy sources, and that there is an apparent consensus on thisaspect of diet in relation to effects on the chronic non-deficiency diseases.
55

This report therefore complements these existing reports on energy andnutrient requirements issued by FAO and WHO (2--4). In translatingthese goals into dietary guidelines, due consideration should be given tothe process for setting up national dietary guidelines (5).
Table 6Ranges of population nutrient intake goals
Dietary factor Goal (% of total energy,unless otherwise stated)
Total fat 15--30%
Saturated fatty acids <10%Polyunsaturated fatty acids (PUFAs) 6--10%n-6 Polyunsaturated fatty acids (PUFAs) 5--8%n-3 Polyunsaturated fatty acids (PUFAs) 1--2%Trans fatty acids <1%Monounsaturated fatty acids (MUFAs) By differencea
Total carbohydrate 55--75%b
Free sugarsc <10%
Protein 10--15%d
Cholesterol <300 mg per day
Sodium chloride (sodium)e <5 g per day (<2 g per day)
Fruits and vegetables 5400 g per day
Total dietary fibre From foodsf
Non-starch polysaccharides (NSP) From foodsf
a This is calculated as: total fat -- (saturated fatty acids + polyunsaturated fatty acids + trans fatty acids).b The percentage of total energy available after taking into account that consumed as protein and fat, hencethe wide range.
c The term ‘‘free sugars’’ refers to all monosaccharides and disaccharides added to foods by themanufacturer, cook or consumer, plus sugars naturally present in honey, syrups and fruit juices.
d The suggested range should be seen in the light of the JointWHO/FAO/UNUExpert Consultation on Proteinand Amino Acid Requirements in Human Nutrition, held in Geneva from 9 to 16 April 2002 (2).
e Salt should be iodized appropriately (6). The need to adjust salt iodization, depending on observed sodiumintake and surveillance of iodine status of the population, should be recognized.
f See page 58, under ‘‘Non-starch polysaccharides’’.
Total fat
The recommendations for total fat are formulated to include countrieswhere the usual fat intake is typically above 30% as well as those wherethe usual intake may be very low, for example less than 15%. Total fatenergy of at least 20% is consistent with good health. Highly activegroups with diets rich in vegetables, legumes, fruits and wholegraincereals may, however, sustain a total fat intake of up to 35%without therisk of unhealthy weight gain.
For countries where the usual fat intake is between 15% and 20% ofenergy, there is no direct evidence for men that raising fat intake to 20%will be beneficial (7, 8). For women of reproductive age at least 20% has
56

been recommended by the Joint FAO/WHO Expert Consultation onFats and Oils in Human Nutrition that met in 1993 (3).
Free sugars
It is recognized that higher intakes of free sugars threaten the nutrientqualityofdiets byproviding significant energywithout specific nutrients.TheConsultationconsidered that restrictionof free sugarswasalso likelyto contribute to reducing the risk of unhealthy weight gain, noting that:
. Free sugars contribute to the overall energy density of diets.
. Free sugars promote a positive energy balance. Acute and short-termstudies in human volunteers have demonstrated increased total energyintake when the energy density of the diet is increased, whether by freesugars or fat (9--11). Diets that are limited in free sugars have beenshown to reduce total energy intake and induce weight loss (12, 13).
. Drinks that are rich in free sugars increase overall energy intake byreducing appetite control. There is thus less of a compensatoryreduction of food intake after the consumption of high-sugars drinksthan when additional foods of equivalent energy content are provided(11, 14--16). A recent randomized trial showed that when soft drinksrich in free sugars are consumed there is a higher energy intake and aprogressive increase in body weight when compared with energy-freedrinks that are artificially sweetened (17). Children with a highconsumption of soft drinks rich in free sugars are more likely to beoverweight and to gain excess weight (16).
The Consultation recognized that a population goal for free sugars ofless than 10% of total energy is controversial. However, the Consulta-tion considered that the studies showing no effect of free sugars on excessweight have limitations. The CARMEN study (Carbohydrate RatioManagement in European National diets) was a multicentre, rando-mized trial that tested the effects on body weight and blood lipids inoverweight individuals of altering the ratio of fat to carbohydrate, aswellas the ratio of simple to complex carbohydrate per se. A greater weightreductionwas observedwith the high complex carbohydrate diet relativeto the simple carbohydrate one; the difference, however was notstatistically significant (18). Nevertheless, an analysis of weight changeandmetabolic indices for thosewithmetabolic syndrome revealed a clearbenefit of replacing simple by complex carbohydrates (19). TheConsultation also examined the results of studies that found an inverserelationship between free sugars intakes and total fat intake. Many ofthese studies are methodologically inappropriate for determining thecauses of excess weight gain, since the percentage of calories from fatwilldecrease as the percentage of calories from carbohydrates increases andvice versa. Furthermore, these analyses do not usually distinguish
57

between free sugars in foods and free sugars in drinks. Thus, theseanalyses are not good predictors of the responses in energy intake to aselective reduction in free sugars intake.
Non-starch polysaccharides (NSP)
Wholegrain cereals, fruits and vegetables are the preferred sources ofnon-starch polysaccharides (NSP). The best definition of dietary fibreremains to be established, given the potential health benefits of resistantstarch. The recommended intake of fruits and vegetables (see below) andconsumption of wholegrain foods is likely to provide >20 g per day ofNSP (>25 g per day of total dietary fibre).
Fruits and vegetables
The benefit of fruits and vegetables cannot be ascribed to a single or mixof nutrients and bioactive substances. Therefore, this food category wasincluded rather than the nutrients themselves.The categoryof tubers (i.e.potatoes, cassava) should not be included in fruits and vegetables.
Body mass index (BMI)
The goal for body mass index (BMI) included in this report follows therecommendations made by the WHO Expert Consultation on Obesitythat met in 1997 (20). At the population level, the goal is for an adultmedian BMI of 21--23 kg/m2. For individuals, the recommendation is tomaintain a BMI in the range 18.5--24.9 kg/m2 and to avoid aweight gaingreater than 5 kg during adult life.
Physical activity
The goal for physical activity focuses on maintaining healthy bodyweight. The recommendation is for a total of one hour per day on mostdays of the week of moderate-intensity activity, such as walking. Thislevel of physical activity is needed to maintain a healthy body weight,particularly for people with sedentary occupations. The recommenda-tion is based on calculations of energy balance and on an analysis of theextensive literature on the relationships between body weight andphysical activity. This recommendation is also presented elsewhere (21).Obviously, this quantitative goal cannot be considered as a single ‘‘bestvalue’’ by analogy with the nutrient intake goals. Furthermore, it differsfrom the following widely accepted public health recommendation (22):
For better health, people of all ages should include a minimum of30 minutes of physical activity of moderate intensity (such as briskwalking) on most, if not all, days of the week. For most peoplegreater health benefits can be obtained by engaging in physicalactivity of more vigorous intensity or of longer duration. This cardiorespiratory endurance activity should be supplemented with
58

strength-developing exercises at least twice a week for adults inorder to improve musculo skeletal health, maintain independencein performing the activities of daily life and reduce the risk of falling.
The difference between the two recommendations results from thedifference in their focus. A recent symposium on the dose--responserelationships between physical activity and health outcomes foundevidence that 30 minutes of moderate activity is sufficient forcardiovascular/metabolic health, but not for all health benefits. Becauseprevention of obesity is a central health goal, the recommendation of60 minutes a day of moderate-intensity activity is considered appro-priate. Activity of moderate intensity is found to be sufficient to have apreventive effect on most, if not all, cardiovascular and metabolicdiseases considered in this report. Higher intensity activity has a greatereffect on some, although not all, health outcomes, but is beyond thecapacity and motivation of a large majority of the population.
Both recommendations include the idea that the daily activity can beaccomplished in several short bouts. It is important to point out thatboth recommendations apply to people who are otherwise sedentary.Some occupational activities and household chores constitute sufficientdaily physical exercise.
In recommending physical activity, potential individual risks as well asbenefits need to be assessed. Inmany regions of the world, especially butnot exclusively in rural areas of developing countries, an appreciableproportion of the population is still engaged in physically demandingactivities relating to agricultural practices and domestic tasks performedwithoutmechanization or with rudimentary tools. Even childrenmay berequired to undertake physically demanding tasks at very young ages,such as collectingwater and firewood and caring for livestock. Similarly,the inhabitants of poor urban areas may still be required to walk longdistances to their jobs, which are usually of a manual nature and oftenrequire a high expenditure of energy. Clearly, the recommendation forextra physical activity is not relevant for these sectors of the population.
References
1. WorldCancerResearch Fund. Food, nutrition and the prevention of cancer: a globalperspective.Washington, DC, American Institute for Cancer Research, 1997.
2. Proteinandaminoacid requirements inhumannutrition.Report of a JointWHO/FAO/UNU Expert Consultation.Geneva, World Health Organization, 2003 (in press).
3. Fats and oils in human nutrition. Report of a Joint FAO/WHO Expert Consultation.Rome, Food andAgricultureOrganization of theUnitedNations, 1994 (FAOFoodand Nutrition Paper, No. 57).
4. Carbohydrates in human nutrition. Report of a Joint FAO/WHO ExpertConsultation. Rome, Food and Agriculture Organization of the United Nations,1998 (FAO Food and Nutrition Paper, No. 66).
59

5. Preparation and use of food-based dietary guidelines. Report of a Joint FAO/WHO Consultation. Geneva, World Health Organization, 1998 (WHO TechnicalReport Series, No. 880).
6. WHO/UNICEF/ICCIDD. Recommended iodine levels in salt and guidelines formonitoring their adequacy and effectiveness. Geneva, World Health Organiza-tion, 1996 (document WHO/NUT/96.13).
7. Campbell TC, Parpia B, Chen J. Diet, lifestyle, and the etiology of coronary arterydisease: theCornell China study.American Journal ofCardiology, 1998,82:18T--21T.
8. Campbell TC, Junshi C. Diet and chronic degenerative diseases: perspectivesfrom China. American Journal of Clinical Nutrition, 59(Suppl. 5):S1153--S1161.
9. Stubbs J, Ferres S, Horgan G. Energy density of foods: effects on energy intake.Critical Reviews in Food Science and Nutrition, 2000, 40:481--515.
10. Rolls BJ, Bell EA. Dietary approaches to the treatment of obesity.Medical Clinicsof North America, 2000, 84:401--418.
11. Rolls BJ. Fat and sugar substitutes and the control of food intake. Annals of theNew York Academy of Sciences, 1997, 819:180--193.
12. MannJI et al. Effects on serum-lipids in normalmenof reducingdietary sucroseorstarch for five months. Lancet, 1970, 1:870--872.
13. Smith JB, Niven BE, Mann JI. The effect of reduced extrinsic sucrose intake onplasma triglyceride levels.EuropeanJournal ofClinicalNutrition, 1996,50:498--504.
14. Ludwig DS. The glycemic index: physiological mechanisms relating to obesity,diabetes, and cardiovascular disease. Journal of AmericanMedical Association,2002, 287:2414--2423.
15. Ebbeling CB, Ludwig DS. Treating obesity in youth: should dietary glycemic loadbe a consideration? Advances in Pediatrics, 2001, 48:179--212.
16. Ludwig DS, Peterson KE, Gormakaer SL. Relation between consumption ofsugar-sweetened drinks and childhood obesity: a prospective, observationalanalysis. Lancet, 2001, 357:505--508.
17. Raben A et al. Sucrose compared with artificial sweeteners: different effects onad libitum food intake and body weight after 10 wk of supplementation inoverweight subjects. American Journal of Clinical Nutrition, 2002, 76:721--729.
18. Saris WH et al. Randomized controlled trial of changes in dietary carbohydrate/fat ratio and simple vs complex carbohydrates on body weight and blood lipids:the CARMEN study. The Carbohydrate Ratio Management in European Nationaldiets. International Journal of Obesity and Related Metabolic Disorders, 2000,24:1310--1318.
19. Poppitt SD et al. Long-term effects of ad libitum low-fat, high-carbohydrate dietson body weight and serum lipids in overweight subjects with metabolicsyndrome. American Journal of Clinical Nutrition, 2002, 75:11--20.
20. Obesity: preventing and managing the global epidemic. Report of a WHOConsultation.Geneva, World Health Organization, 2000 (WHO Technical ReportSeries, No. 894).
21. Weight control and physical activity. Lyon, International Agency for Research onCancer, 2002 (IARC Handbooks of Cancer Prevention, Vol. 6).
22. Physical activity and health: a report of the Surgeon General. Atlanta, GA, USDepartment of Health and Human Services, Centers for Disease Control andPrevention, National Center for Chronic Disease Prevention and HealthPromotion, 1996.
60

5.2 Recommendations for preventing excess weight gainand obesity
5.2.1 Background
Almost all countries (high-income and low-income alike) are experien-cing an obesity epidemic, although with great variation between andwithin countries. In low-income countries, obesity is more common inmiddle-aged women, people of higher socioeconomic status and thoseliving in urban communities. In more affluent countries, obesity is notonly common in themiddle-aged, but is becoming increasingly prevalentamong younger adults and children. Furthermore, it tends to beassociated with lower socioeconomic status, especially in women, andthe urban--rural differences are diminished or even reversed.
It has been estimated that the direct costs of obesity accounted for 6.8%(orUS$ 70 billion) of total health care costs, and physical inactivity for afurtherUS$24billion, in theUnitedStates in 1995.Althoughdirect costsin other industrialized countries are slightly lower, they still consume asizeable proportion of national health budgets (1). Indirect costs, whichare far greater than direct costs, include workdays lost, physician visits,disability pensions and premature mortality. Intangible costs such asimpaired quality of life are also enormous. Because the risks of diabetes,cardiovascular disease and hypertension rise continuously with increas-ing weight, there is much overlap between the prevention of obesity andthe prevention of a variety of chronic diseases, especially type 2 diabetes.Population education strategies will need a solid base of policy andenvironment-based changes to be effective in eventually reversing thesetrends.
5.2.2 Trends
The increasing industrialization, urbanization and mechanizationoccurring in most countries around the world is associated with changesin diet andbehaviour, in particular, diets are becoming richer in high-fat,high energy foods and lifestyles more sedentary. In many developingcountries undergoing economic transition, rising levels of obesity oftencoexist in the samepopulation (or even the samehousehold)with chronicundernutrition. Increases in obesity over the past 30 years have beenparalleled by a dramatic rise in the prevalence of diabetes (2).
5.2.3 Diet, physical activity and excess weight gain and obesity
Mortality rates increase with increasing degrees of overweight, asmeasured by BMI. As BMI increases, so too does the proportion ofpeople with one or more comorbid conditions. In one study in the USA(3), over half (53%) of all deaths in womenwith a BMI>29 kg/m2 could
61
be directly attributed to their obesity. Eating behaviours that have beenlinked to overweight and obesity include snacking/eating frequency,binge-eating patterns, eating out, and (protectively) exclusive breast-feeding. Nutrient factors under investigation include fat, carbohydratetype (including refined carbohydrates such as sugar), the glycaemicindex of foods, and fibre. Environmental issues are clearly important,especially as many environments become increasingly ‘‘obesogenic’’(obesity-promoting).
Physical activity is an important determinant of body weight. Inaddition, physical activity and physical fitness (which relates to theability to performphysical activity) are importantmodifiers ofmortalityand morbidity related to overweight and obesity. There is firm evidencethat moderate to high fitness levels provide a substantially reduced riskof cardiovascular disease and all-cause mortality and that these benefitsapply to all BMI levels. Furthermore, high fitness protects againstmortality at all BMI levels in men with diabetes. Low cardiovascularfitness is a serious and common comorbidity of obesity, and a sizeableproportion of deaths in overweight and obese populations are probablya result of low levels of cardio-respiratory fitness rather than obesity perse. Fitness is, in turn, influenced strongly by physical activity in additionto genetic factors. These relationships emphasize the role of physicalactivity in the prevention of overweight and obesity, independently ofthe effects of physical activity on body weight.
The potential etiological factors related to unhealthy weight gain arelisted in Table 7.
5.2.4 Strength of evidence
Convincing etiological factors
Regular physical activity (protective) and sedentary lifestyles (causative).There is convincing evidence that regular physical activity is protectiveagainst unhealthy weight gain whereas sedentary lifestyles, particularlysedentary occupations and inactive recreation such as watchingtelevision, promote it. Most epidemiological studies show smaller riskof weight gain, overweight and obesity among persons who currentlyengage regularly in moderate to large amounts of physical activity (4).Studies measuring physical activity at baseline and randomized trials ofexercise programmes show more mixed results, probably because of thelow adherence to long-term changes. Therefore, it is ongoing physicalactivity itself rather than previous physical activity or enrolment in anexercise programme that is protective against unhealthyweight gain.Therecommendation for individuals to accumulate at least 30 minutes ofmoderate-intensity physical activity on most days is largely aimed at
62

reducing cardiovascular diseases and overall mortality. The amountneeded to prevent unhealthy weight gain is uncertain but is probablysignificantly greater than this. Preventing weight gain after substantialweight loss probably requires about 60--90 minutes per day. Twomeetings recommended by consensus that about 45--60 minutes ofmoderate-intensity physical activity is needed onmost days or every dayto prevent unhealthy weight gain (5, 6). Studies aimed at reducingsedentary behaviours have focused primarily on reducing televisionviewing in children.Reducing viewing times by about 30minutes a day inchildren in the United States appears feasible and is associated withreductions in BMI.
Table 7Summary of strength of evidence on factors that might promote or protect againstweight gain and obesitya
Evidence Decreased risk No relationship Increased risk
Convincing Regular physical activity
High dietary intake of
NSP (dietary fibre)b
Sedentary lifestyles
High intake of energy-dense
micronutrient-poor foodsc
Probable Home and school
environments that
support healthy food
choices for childrend
Breastfeeding
Heavymarketing of energy-dense foodsd
and fast-food outletsd
High intake of sugars-sweetened soft
drinks and fruit juices
Adverse socioeconomic conditionsd
(in developed countries, especially
for women)
Possible Low glycaemic index
foods
Protein content
of the diet
Large portion sizes
High proportion of food prepared outside
the home (developed countries)
‘‘Rigid restraint/periodic disinhibition’’
eating patterns
Insufficient Increased eating
frequency
Alcohol
a Strength of evidence: the totality of the evidencewas taken into account. TheWorldCancer Research Fund schemawas taken as the starting point but was modified in the following manner: randomized controlled trials were givenprominence as the highest ranking study design (randomized controlled trials were not a major source of cancerevidence); associated evidence and expert opinion was also taken into account in relation to environmentaldeterminants (direct trials were usually not available).
b Specific amounts will depend on the analytical methodologies used to measure fibre.c Energy-dense and micronutrient-poor foods tend to be processed foods that are high in fat and/or sugars. Low
energy-dense (or energy-dilute) foods, such as fruit, legumes, vegetables and whole grain cereals, are high indietary fibre and water.
d Associated evidence and expert opinion included.
A high dietary intake of non-starch polysaccharides (NSP)/dietary fibre(protective). The nomenclature and definitions of NSP (dietary fibre)have changedwith time, andmany of the available studies used previousdefinitions, such as soluble and insoluble fibre. Nevertheless, two recentreviews of randomized trials have concluded that the majority of studiesshow that a high intake of NSP (dietary fibre) promotes weight loss.
63

Pereira & Ludwig (7) found that 12 out of 19 trials showed beneficialobjective effects (including weight loss). In their review of 11 studies ofmore than 4 weeks duration, involving ad libitum eating HowarthSaltzman & Roberts (8) reported a mean weight loss of 1.9 kg over 3.8months. There were no differences between fibre type or between fibreconsumed in food or as supplements.
High intake of energy-dense micronutrient-poor foods (causative).There is convincing evidence that a high intake of energy-dense foodspromotes weight gain. In high-income countries (and increasingly in low-income countries) these energy-dense foods are not only highly processed(low NSP) but also micronutrient-poor, further diminishing theirnutritional value. Energy-dense foods tend to be high in fat (e.g. butter,oils, fried foods), sugars or starch, while energy-dilute foods have a highwater content (e.g. fruits and vegetables). Several trials have covertlymanipulated the fat content and the energy density of diets, the results ofwhich support the view that so-called ‘‘passive over consumption’’ of totalenergy occurs when the energy density of the diet is high and that this isalmost always the case in high-fat diets. A meta-analysis of 16 trials of adlibitum high-fat versus low-fat diets of at least 2 months durationsuggested that a reduction in fat content by 10% corresponds to about a1 MJ reduction in energy intake and about 3 kg in body weight (9). Ata population level, 3 kg equates to about one BMI unit or about a 5%difference in obesity prevalence. However, it is difficult to blind suchstudies and other non-physiological effects may influence these findings(10). While energy from fat is no more fattening than the same amount ofenergy from carbohydrate or protein, diets that are high in fat tend to beenergy-dense.An important exception to this is diets basedpredominantlyon energy-dilute foods (e.g. vegetables, legumes, fruits) but which have areasonably high percentage of energy as fat from added oils.
The effectiveness over the long term ofmost dietary strategies for weightloss, including low-fat diets, remains uncertain unless accompanied bychanges in behaviour affecting physical activity and food habits. Theselatter changes at a public health level require an environment supportiveof healthy food choices and an active life. High quality trials to addressthese issues are urgently needed. A variety of popular weight-loss dietsthat restrict food choices may result in reduced energy intake and short-term weight loss in individuals but most do not have trial evidence oflong-term effectiveness and nutritional adequacy and therefore cannotbe recommended for populations.
Probable etiological factors
Home and school environments that promote healthy food and activitychoices for children (protective). Despite the obvious importance of the
64

roles that parents and home environments play on children’s eating andphysical activity behaviours, there is very little hard evidence available tosupport this view. It appears that access and exposure to a range of fruitsand vegetables in the home is important for the development ofpreferences for these foods and that parental knowledge, attitudes andbehaviours related to healthy diet and physical activity are important increating role models (11). More data are available on the impact of theschool environment on nutrition knowledge, on eating patterns andphysical activity at school, and on sedentary behaviours at home. Somestudies (12), but not all, have shown an effect of school-basedinterventions on obesity prevention. While more research is clearlyneeded to increase the evidence base in both these areas, supportivehome and school environments were rated as a probable etiologicalinfluence on obesity.
Heavy marketing of fast-food outlets and energy-dense, micronutrient-poor foods and beverages (causative). Part of the consistent, strongrelationships between television viewing and obesity in children mayrelate to the food advertising to which they are exposed (13--15). Fast-food restaurants, and foods and beverages that are usually classifiedunder the ‘‘eat least’’ category in dietary guidelines are among the mostheavily marketed products, especially on television. Young children areoften the target group for the advertising of these products because theyhave a significant influence on the foods bought by parents (16). Thehuge expenditure on marketing fast-foods and other ‘‘eat least’’ choices(US$ 11 billion in theUnited States alone in 1997) was considered to be akey factor in the increased consumption of food prepared outside thehome in general and of energy-dense, micronutrient-poor foods inparticular.Young children are unable to distinguish programme contentfrom the persuasive intent of advertisements. The evidence that theheavy marketing of these foods and beverages to young children causesobesity is not unequivocal. Nevertheless, the Consultation consideredthat there is sufficient indirect evidence to warrant this practice beingplaced in the ‘‘probable’’ category and thus becoming a potential targetfor interventions (15--18).
A high intake of sugars-sweetened beverages (causative). Diets that areproportionally low in fat will be proportionally higher in carbohydrate(including a variable amount of sugars) and are associated withprotection against unhealthy weight gain, although a high intake offree sugars in beverages probably promotes weight gain. The physiolo-gical effects of energy intake on satiation and satiety appear to be quitedifferent for energy in solid foods as opposed to energy in fluids. Possiblybecause of reduced gastric distension and faster transit times, the energycontained in fluids is less well ‘‘detected’’ by the body and subsequent
65

food intake is poorly adjusted to account for the energy taken in throughbeverages (19). This is supported by data from cross-sectional,longitudinal, and cross-over studies (20--22). The high and increasingconsumption of sugars-sweetened drinks by children in many countriesis of serious concern. It has been estimated that each additional can orglass of sugars-sweetened drink that they consume every day increasesthe risk of becoming obese by 60% (19). Most of the evidence relates tosoda drinks but many fruit drinks and cordials are equally energy-denseand may promote weight gain if drunk in large quantities. Overall, theevidence implicating a high intake of sugars-sweetened drinks inpromoting weight gain was considered moderately strong.
Adverse socioeconomic conditions, especially for women in high-incomecountries (causative).Classically the pattern of the progressionof obesitythrough a population starts with middle-aged women in high-incomegroups but as the epidemic progresses, obesity becomesmore common inpeople (especially women) in lower socioeconomic status groups. Therelationship may even be bi-directional, setting up a vicious cycle (i.e.lower socioeconomic status promotes obesity, and obese people aremore likely to end up in groups with low socioeconomic status). Themechanisms by which socioeconomic status influences food and activitypatterns are probably multiple and need elucidation. However, peopleliving in circumstances of low socioeconomic status may be more at themercy of the obesogenic environment because their eating and activitybehaviours are more likely to be the ‘‘default choices’’ on offer. Theevidence for an effect of low socioeconomic status on predisposingpeople to obesity is consistent (in higher income countries) across anumber of cross-sectional and longitudinal studies (23), and was thusrated as a ‘‘probable’’ cause of increased risk of obesity.
Breastfeeding (protective). Breastfeeding as a protective factor againstweight gain has been examined in at least 20 studies involving nearly40 000 subjects. Five studies (including the two largest) found aprotective effect, two found that breastfeeding predicted obesity, andthe remainder found no relationships. There are probably multipleeffects of confounding in these studies; however, the reduction in the riskof developing obesity observed in the two largest studies was substantial(20--37%). Promoting breastfeeding has many benefits, the preventionof childhood obesity probably being one of them.
Possible etiological factors
Several other factors were defined as ‘‘possible’’ protective or causativein the etiology of unhealthy weight gain.
Low-glycaemic foods have been proposed as a potential protectivefactor against weight gain and there are some early studies that support
66

this hypothesis.More clinical trials are, however, needed to establish theassociation with greater certainty.
Large portion sizes are a possible causative factor for unhealthy weightgain (24). The marketing of ‘‘supersize’’ portions, particularly in fast-food outlets, is now common practice in many countries. There is someevidence that people poorly estimate portion sizes and that subsequentenergy compensation for a large meal is incomplete and therefore islikely to lead to overconsumption.
In many countries, there has been a steady increase in the proportion offood eaten that is prepared outside the home. In the United States, theenergy, total fat, saturated fat, cholesterol and sodium content of foodsprepared outside the home is significantly higher than that of home-prepared food. People in theUnited States who tend to eat in restaurantshave a higher BMI than those who tend to eat at home (25).
Certain psychological parameters of eating patterns may influence therisk of obesity. The ‘‘flexible restraint’’ pattern is associated with lowerrisk of weight gain, whereas the ‘‘rigid restraint/periodic disinhibition’’pattern is associated with a higher risk.
Several other factors were also considered but the evidence was notthought to be strong enough to warrant defining them as protective orcausative. Studies have not shown consistent associations betweenalcohol intake and obesity despite the high energy density of the nutrient(7 kcal/g). There are probably many confounding factors that influencethe association. While a high eating frequency has been shown in somestudies to have a negative relationship with energy intake and weightgain, the types of foods readily available as snack foods are often high infat and a high consumption of foods of this typemight predispose peopleto weight gain. The evidence regarding the impact of early nutrition onsubsequent obesity is also mixed, with some studies showing relation-ships for high and low birth weights.
5.2.5 General strategies for obesity prevention
The prevention of obesity in infants and young children should beconsidered of high priority. For infants and young children, the mainpreventive strategies are:
7 the promotion of exclusive breastfeeding;
7 avoiding the use of added sugars and starches when feeding formula;
7 instructing mothers to accept their child’s ability to regulate energyintake rather than feeding until the plate is empty;
7 assuring the appropriate micronutrient intake needed to promoteoptimal linear growth.
67

For children and adolescents, prevention of obesity implies the need to:
7 promote an active lifestyle;
7 limit television viewing;
7 promote the intake of fruits and vegetables;
7 restrict the intake of energy-dense, micronutrient-poor foods (e.g.packaged snacks);
7 restrict the intake of sugars-sweetened soft drinks.
Additional measures include modifying the environment to enhancephysical activity in schools and communities, creating more opportu-nities for family interaction (e.g. eating family meals), limiting theexposure of young children to heavy marketing practices of energy-dense, micronutrient-poor foods, and providing the necessary informa-tion and skills to make healthy food choices.
In developing countries, special attention should be given to avoidanceof overfeeding stunted population groups. Nutrition programmesdesigned to control or prevent undernutrition need to assess stature incombination with weight to prevent providing excess energy to childrenof low weight-for-age but normal weight-for-height. In countries ineconomic transition, as populations becomemore sedentary and able toaccess energy-dense foods, there is a need to maintain the healthycomponents of traditional diets (e.g. high intake of vegetables, fruits andNSP). Education provided to mothers and low socioeconomic statuscommunities that are food insecure should stress that overweight andobesity do not represent good health.
Low-income groups globally and populations in countries in economictransition often replace traditional micronutrient-rich foods by heavilymarketed, sugars-sweetened beverages (i.e. soft drinks) and energy-dense fatty, salty and sugary foods. These trends, coupled with reducedphysical activity, are associated with the rising prevalence of obesity.Strategies are needed to improve the quality of diets by increasingconsumption of fruits and vegetables, in addition to increasing physicalactivity, in order to stem the epidemic of obesity and associateddiseases.
5.2.6 Disease-specific recommendations
Body mass index (BMI)
BMI canbeused to estimate, albeit crudely, the prevalence of overweightand obesity within a population and the risks associated with it. It doesnot, however, account for the wide variations in obesity betweendifferent individuals and populations. The classification of overweightand obesity, according to BMI, is shown in Table 8.
68

Table 8Classification of overweight in adults according to BMIa
Classification BMI (kg/m2) Risk of comorbidities
Underweight <18.5 Low (but risk of other clinical problemsincreased)
Normal range 18.5--24.9 Average
Overweight 525.0
Pre-obese 25.0--29.9 IncreasedObese class I 30.0--34.9 ModerateObese class II 35.0--39.9 SevereObese class III 540.0 Very severe
a These BMI values are age-independent and the same for both sexes. However, BMI may not correspond to thesame degree of fatness in different populations due, in part, to differences in body proportions. The table shows asimplistic relationship between BMI and the risk of comorbidity, which can be affected by a range of factors,including the nature and the risk of comorbidity, which can be affected by a range of factors, including the nature ofthe diet, ethnic group and activity level. The risks associated with increasing BMI are continuous and graded andbegin at a BMI below 25. The interpretation of BMI gradings in relation to risk may differ for different populations.Both BMI and a measure of fat distribution (waist circumference or waist : hip ratio (WHR)) are important incalculating the risk of obesity comorbidities.
Source: reference 26.
In recent years, different ranges of BMI cut-off points for overweightand obesity have been proposed, in particular for theAsia-Pacific region(27). At present available data on which to base definitive recommenda-tions are sparse.1 Nevertheless, the consultation considered that, toachieve optimum health, the median BMI for the adult populationshould be in the range 21--23 kg/m2, while the goal for individuals shouldbe to maintain BMI in the range 18.5--24.9 kg/m2.
Waist circumference
Waist circumference is a convenient and simple measure which isunrelated to height, correlates closelywithBMIand the ratio ofwaist-to-hip circumference, and is an approximate index of intra-abdominal fatmass and total body fat. Furthermore, changes in waist circumferencereflect changes in risk factors for cardiovascular disease and other formsof chronic diseases, even though the risks seem to vary in differentpopulations. There is an increased risk of metabolic complications formen with a waist circumference 5102 cm, and women with a waistcircumference 588 cm.
1 AWHO Expert Consultation on Appropriate BMI for Asian Populations and its Implications for Policyand Intervention Strategies was held in Singapore from 8 to 11 July 2002 in order to: (i) review thescientific evidence on the relationship between BMI, body composition and risk factors in Asianpopulations; (ii) examine if population specific BMI cut-off points for overweight and obesity arenecessary for Asian populations; (iii) examine the purpose and basis of ethnic-specific definitions;and iv) examine further research needs in this area. As one of its recommendations, the Consultationformed aWorkingGroup to examine available data on the relationship betweenwaist circumferenceand morbidity, and the interaction between BMI, waist circumference and health risk in order todefine future research needs and develop recommendations for the use of additional waistmeasurements to further define risks.
69

Physical activity
A total of one hour per day ofmoderate-intensity activity, such aswalkingon most days of the week, is probably needed to maintain a healthy bodyweight, particularly for people with sedentary occupations.2
Total energy intake
The fat and water content of foods are the main determinants of theenergy density of the diet. A lower consumption of energy-dense (i.e.high-fat, high-sugars and high-starch) foods and energy-dense (i.e. highfree sugars) drinks contributes to a reduction in total energy intake.Conversely, a higher intake of energy-dilute foods (i.e. vegetables andfruits) and foods high in NSP (i.e. wholegrain cereals) contributes to areduction in total energy intake and an improvement in micronutrientintake. It should be noted, however, that very active groups who havediets high in vegetables, legumes, fruits and wholegrain cereals, maysustain a total fat intake of up to 35% without the risk of unhealthyweight gain.
References
1. Colditz G. Economic costs of obesity and inactivity. Medicine and Science inSport and Exercise, 1999, 31(Suppl. 11):S663--S667.
2. The world health report 2002: reducing risks, promoting healthy life. Geneva,World Health Organization, 2002.
3. Manson JEet al.Bodyweight andmortality amongwomen.NewEngland Journalof Medicine, 1995, 333:677--685.
4. FogelholmM,Kukkonen-HarjulaK. Doesphysical activity preventweight gain --- asystematic review. Obesity Reviews, 2000, 1:95--111.
5. Weight control and physical activity. Lyon, International Agency for Research onCancer, 2002 (IARC Handbooks of Cancer Prevention, Vol. 6).
6. Saris WHM. Dose--response of physical activity in the treatment of obesity---Howmuch is enough to prevent unhealthy weight gain. Outcome of the First MikeStock Conference. International Journal of Obesity, 2002, 26(Suppl. 1):S108.
7. Pereira MA, Ludwig DS. Dietary fiber and body-weight regulation. Observationsand mechanisms. Pediatric Clinics of North America, 2001, 48:969--980.
8. Howarth NC, Saltzman E, Roberts SB. Dietary fiber and weight regulation.Nutrition Reviews, 2001, 59:129--139.
9. Astrup A et al. The role of low-fat diets in body weight control: a meta-analysis ofad libitum dietary intervention studies. International Journal of Obesity, 2000,24:1545--1552.
10. Willett WC. Dietary fat plays a major role in obesity: no. Obesity Reviews, 2000,3:59--68.
2 See also reference 5.
70

11. Campbell K, Crawford D. Family food environments as determinants ofpreschool-aged children’s eating behaviours: implications for obesity preventionpolicy. A review. Australian Journal of Nutrition and Dietetics, 2001, 58:19--25.
12. Gortmaker S et al. Reducing obesity via a school-based interdisciplinaryintervention among youth: Planet Health. Archives of Pediatrics and AdolescentMedicine, 1999, 153:409--418.
13. Nestle M. Food politics. Berkeley, CA, University of California Press, 2002.
14. Nestle M. The ironic politics of obesity. Science, 2003, 299:781.
15. Robinson TN. Does television cause childhood obesity? Journal of AmericanMedical Association, 1998, 279:959--960.
16. Borzekowski DL, Robinson TN. The 30-second effect: an experiment revealingthe impact of television commercials on food preferences of preschoolers.Journal of the American Dietetic Association, 2001, 101:42--46.
17. Lewis MK, Hill AJ. Food advertising on British children’s television: a contentanalysis and experimental study with nine-year olds. International Journal ofObesity, 1998, 22:206--214.
18. Taras HL, Gage M. Advertised foods on children’s television. Archives ofPediatrics and Adolescent Medicine, 1995, 149:649--652.
19. Mattes RD. Dietary compensation by humans for supplemental energy providedas ethanol or carbohydrate in fluids. Physiology and Behaviour, 1996,59:179--187.
20. Tordoff MG, Alleva AM. Effect of drinking soda sweetened with aspartame orhigh-fructose corn syrup on food intake and body weight. American Journal ofClinical Nutrition, 1990, 51:963--969.
21. Harnack L, Stang J, Story M. Soft drink consumption among US children andadolescents: nutritional consequences. Journal of the American DieteticAssociation, 1999, 99:436--441.
22. Ludwig DS, Peterson KE, Gortmaker SL. Relation between consumption ofsugar-sweetened drinks and childhood obesity: a prospective, observationalanalysis. Lancet, 2001, 357:505--508.
23. Pena M, Bacallao J. Obesity and poverty: a new public health challenge.Washington, DC, Pan American Health Organization, 2000 (Scientific Publica-tion, No. 576).
24. Nielsen SJ, Popkin BM. Patterns and trends in food portion sizes, 1977--1998.Journal of the American Medical Association, 2003, 289:450--453.
25. Jeffery RW, French SA. Epidemic obesity in the United States: are fast foods andtelevision viewing contributing? American Journal of Public Health, 1998,88:277--280.
26. Obesity: preventing and managing the global epidemic. Report of a WHOConsultation.Geneva, World Health Organization, 2000 (WHO Technical ReportSeries, No. 894).
27. WHO Regional Office for the Western Pacific/International Association for theStudy of Obesity/International Obesity Task Force. The Asia-Pacific perspective:redefining obesity and its treatment. Sydney, Health Communications Australia,2000.
71
5.3 Recommendations for preventing diabetes
5.3.1 Background
Type 2 diabetes, formerly known as non-insulin-dependent diabetes(NIDDM), accounts for most cases of diabetes worldwide. Type 2diabetes develops when the production of insulin is insufficient toovercome the underlying abnormality of increased resistance to itsaction. The early stages of type 2 diabetes are characterized byoverproduction of insulin. As the disease progresses, process insulinlevels may fall as a result of partial failure of the insulin producing b cellsof the pancreas. Complications of type 2 diabetes include blindness,kidney failure, foot ulceration which may lead to gangrene andsubsequent amputation, and appreciably increased risk of infections,coronary heart disease and stroke. The enormous and escalatingeconomic and social costs of type 2 diabetes make a compelling casefor attempts to reduce the risk of developing the condition as well as forenergetic management of the established disease (1, 2).
Lifestyle modification is the cornerstone of both treatment and attemptsto prevent type 2 diabetes (3). The changes required to reduce the risk ofdeveloping type 2diabetes at the population level are, however, unlikely tobe achieved without major environmental changes to facilitate appro-priate choices by individuals. Criteria for the diagnosis of type 2 diabetesand for the earlier stages in the disease process --- impaired glucosetolerance and impaired fasting glucose --- have recently been revised (4, 5).
Type 1 diabetes, previously known as insulin-dependent diabetes, occursmuch less frequently and is associated with an absolute deficiency ofinsulin, usually resulting from autoimmune destruction of the b cells ofthe pancreas. Environmental as well as genetic factors appear to beinvolved but there is no convincing evidence of a role for lifestyle factorswhich can be modified to reduce the risk.
5.3.2 Trends
Although increases in both the prevalence and incidence of type 2 diabeteshave occurred globally, they have been especially dramatic in societies ineconomic transition in much of the newly industrialized world and indeveloping countries (1, 6--9).Worldwide, the number of cases of diabetesis currently estimated tobearound150million.Thisnumber ispredicted todouble by 2025, with the greatest number of cases being expected inChinaand India. These numbers may represent an underestimate and there arelikely to be many undiagnosed cases. Previously a disease of the middle-aged and elderly, type 2 diabetes has recently escalated in all age groupsand is now being identified in younger and younger age groups, includingadolescents and children, especially in high-risk populations.
72

Age-adjustedmortality rates amongpeoplewithdiabetes are 1.5--2.5 timeshigher than in the general population (10). In Caucasian populations,much of the excess mortality is attributable to cardiovascular disease,especially coronary heart disease (11, 12); amongst Asian and AmericanIndian populations, renal disease is a major contributor (13, 14), whereasin some developing nations, infections are an important cause of death(15). It is conceivable that the decline in mortality due to coronary heartdiseasewhichhasoccurred inmanyaffluent societiesmaybehaltedor evenreversed if rates of type 2 diabetes continue to increase. This may occur ifthe coronary risk factors associated with diabetes increase to the extentthat the risk they mediate outweighs the benefit accrued from improve-ments in conventional cardiovascular risk factors and the improvedcareofpatients with established cardiovascular disease (3).
5.3.3 Diet, physical activity and diabetes
Type 2 diabetes results from an interaction between genetic andenvironmental factors. The rapidly changing incidence rates, however,suggest a particularly important role for the latter as well as a potential forstemming the tide of the global epidemic of the disease. Themost dramaticincreases in type 2 diabetes are occurring in societies in which there havebeen major changes in the type of diet consumed, reductions in physicalactivity, and increases in overweight and obesity. The diets concerned aretypically energy-dense, high in saturated fatty acids and depleted in NSP.
In all societies, overweight and obesity are associated with an increasedrisk of type 2 diabetes, especially when the excess adiposity is centrallydistributed. Conventional (BMI) categories may not be an appropriatemeans of determining the risk of developing type 2 diabetes in individualsof all population groupsbecause of ethnic differences inbody compositionand because of the importance of the distribution of excess adiposity.While all lifestyle-related and environmental factors which contribute toexcess weight gain may be regarded as contributing to type 2 diabetes, theevidence that individual dietary factors have an effect which isindependent of their obesity promoting effect, is inconclusive. Evidencethat saturated fatty acids increase risk of type 2 diabetes and that NSP areprotective is more convincing than the evidence for several other nutrientswhich have been implicated. The presence of maternal diabetes, includinggestational diabetes and intrauterine growth retardation, especially whenassociatedwith later rapid catch-up growth, appears to increase the risk ofsubsequently developing diabetes.
5.3.4 Strength of evidence
The association between excessive weight gain, central adiposity and thedevelopment of type 2 diabetes is convincing. The association has been
73

repeatedly demonstrated in longitudinal studies in different populations,with a striking gradient of risk apparent with increasing levels of BMI,adult weight gain, waist circumference or waist-to-hip ratio. Indeedwaist circumference or waist-to-hip ratio (reflecting abdominal orvisceral adiposity) aremore powerful determinants of subsequent risk oftype 2 diabetes thanBMI (16--20). Central adiposity is also an importantdeterminant of insulin resistance, the underlying abnormality in mostcases of type 2 diabetes (20). Voluntary weight loss improves insulinsensitivity (21) and in several randomized controlled trials has beenshown to reduce the risk of progression from impaired glucose toleranceto type 2 diabetes (22, 23).
Longitudinal studies have clearly indicated that increased physicalactivity reduces the risk of developing type 2 diabetes regardless of thedegree of adiposity (24--26). Vigorous exercise (i.e. training to anintensity of 80--90% of age-predictedmaximum heart rate for at least 20minutes, at least five times per week) has the potential to substantiallyenhance insulin sensitivity (21). The minimum intensity and duration ofphysical activity required to improve insulin sensitivity has not beenestablished.
Offspring of diabetic pregnancies (including gestational diabetes) areoften large and heavy at birth, tend to develop obesity in childhood andare at high risk of developing type 2 diabetes at an early age (27). Thoseborn to mothers after they have developed diabetes have a three-foldhigher risk of developing diabetes than those born before (28).
In observational epidemiological studies, a high saturated fat intake hasbeen associated with a higher risk of impaired glucose tolerance, andhigher fasting glucose and insulin levels (29--32). Higher proportions ofsaturated fatty acids in serum lipid or muscle phospholipid have beenassociatedwithhigher fasting insulin, lower insulin sensitivity andahigherrisk of type 2 diabetes (33--35). Higher unsaturated fatty acids fromvegetable sources and polyunsaturated fatty acids have been associatedwith a reduced risk of type 2 diabetes (36, 37) and lower fasting and 2-hourglucose concentrations (32, 38). Furthermore, higher proportions of long-chain polyunsaturated fatty acids in skeletal muscle phospholipids havebeen associated with increased insulin sensitivity (39).
In human intervention studies, replacement of saturated by unsaturatedfatty acids leads to improved glucose tolerance (40, 41) and enhancedinsulin sensitivity (42). Long-chain polyunsaturated fatty acids do not,however, appear to confer additional benefit over monounsaturatedfatty acids in intervention studies (42). Furthermore, when total fatintake is high (greater than 37% of total energy), altering the quality ofdietary fat appears to have little effect (42), a finding which is not
74

surprising given that in observational studies a high intake of total fathas been shown to predict development of impaired glucose toleranceand the progression of impaired glucose tolerance to type 2 diabetes (29,43). A high total fat intake has also been associated with higher fastinginsulin concentrations and a lower insulin sensitivity index (44, 45).
Considered in aggregate these findings are deemed to indicate a probablecausal link between saturated fatty acids and type 2 diabetes, and apossible causal association between total fat intake and type 2 diabetes.The two randomized controlled trials which showed a potential forlifestyle modification to reduce the risk of progression from impairedglucose tolerance to type 2 diabetes included advice to reduce total andsaturated fat (22, 23), but in both trials it is impossible to disentangle theeffects of individual dietary manipulation.
Research relating to the association between NSP intake and type2 diabetes is complicated by ambiguity with regard to the definitionsused (the term dietary fibre and NSP are often incorrectly usedinterchangeably), different methods of analysis and, consequently,inconsistencies in food composition tables. Observations by Trowell inUganda more than 30 years ago suggested that the infrequency ofdiabetes in rural Africa may be the result of a protective effect ofsubstantial amounts of NSP in the diet (referred to as dietary fibre)associated with a high consumption of minimally-processed orunprocessed carbohydrate. The author also hypothesized that through-out the world, increasing intakes of highly-processed carbohydrate,depleted in NSP, had promoted the development of diabetes (46). Threecohort studies (the Health Professionals Follow-up Study of men aged40--75 years, the Nurses’ Health Study of women aged 40--65 years, andthe Iowa Women’s Health Study in women aged 55--69 years) haveshown a protective effect of NSP (dietary fibre) (47--49) which wasindependent of age, BMI, smoking and physical activity. In manycontrolled experimental studies, high intakes ofNSP (dietary fibre) haverepeatedly been shown to result in reduced blood glucose and insulinlevels in people with type 2 diabetes and impaired glucose tolerance (50).Moreover an increased intake of wholegrain cereals, vegetables andfruits (all rich inNSP)was a feature of the diets associatedwith a reducedrisk of progression of impaired glucose tolerance to type 2 diabetes in thetwo randomized controlled trials previously described (22, 23). Thus theevidence for a potential protective effect of NSP (dietary fibre) appearsstrong. However, the fact that the experimental studies suggest thatsoluble forms of NSP exert benefit (50--53) whereas the prospectivecohort studies suggest that it is the cereal-derived insoluble forms thatare protective (47, 48) explain the ‘‘probable’’ rather ‘‘convincing’’grading of the level of evidence.
75

Many foods which are rich in NSP (especially soluble forms), such aspulses, have a low glycaemic index.1 Other carbohydrate-containingfoods (e.g. certain types of pasta), which are not especially high in NSP,also have a low glycaemic index. Low glycaemic index foods, regardlessof their NSP content, are not only associated with a reduced glycaemicresponse after ingestion when compared with foods of higher glycaemicindex, but are also associated with an overall improvement in glycaemiccontrol (as measured by haemoglobin A1c) in people with diabetes (54--57). A low glycaemic index does not, however, per se, confer overallhealth benefits, since a high fat or fructose content of a food may alsoresult in a reduced glycaemic index and such foods may also be energy-dense. Thus while this property of carbohydrate-containing foods maywell influence the risk of developing type 2 diabetes, the evidence isaccorded a lower level of strength than the evidence relating to the NSPcontent. Similarly, the level of evidence for the protective effect of n-3fatty acids is regarded as ‘‘possible’’ because the results of epidemiolo-gical studies are inconsistent and the experimental data inconclusive.There is insufficient evidence to confirm or refute the suggestions thatchromium,magnesium,vitaminEandmoderate intakesofalcoholmightprotect against the development of type 2 diabetes.
Anumber of studies,mostly in developing countries, have suggested thatintrauterine growth retardation and low birthweight are associatedwithsubsequent development of insulin resistance (58). In those countrieswhere there has been chronic undernutrition, insulin resistancemayhavebeen selectively advantageous in terms of surviving famine. Inpopulations where energy intake has increased and lifestyles havebecome more sedentary, however, insulin resistance and the consequentrisk of type 2 diabetes have been enhanced. In particular, rapid postnatalcatch-up growth appears to further increase the risk of type 2 diabetes inlater life. Appropriate strategies which may help to reduce type2 diabetes risk in this situation include improving the nutrition ofyoung children, promoting linear growth and preventing energy excessby limiting intake of energy-dense foods, controlling the quality of fatsupply, and facilitating physical activity. At a population level, fetalgrowth may remain restricted until maternal height improves. This maytake several generations to correct. The prevention of type 2 diabetes ininfants and young children may be facilitated by the promotion ofexclusive breastfeeding, avoiding overweight and obesity, and promot-ing optimum linear growth. The strength of evidence on lifestyle factorsis summarized in Table 9.
1 The glycaemic index is calculated as the glycaemic response to a quantity of food containing a setamount, usually 50 g, of carbohydrate, expressed as a percentage of the glycaemic responsefollowing ingestion of a similar quantity of glucose or of carbohydrate in white bread.
76

Table 9Summary of strength of evidence on lifestyle factors and risk of developingtype 2 diabetes
Evidence Decreased risk No relationship Increased risk
Convincing Voluntary weight loss in
overweight and obese people
Physical activity
Overweight and obesity
Abdominal obesity
Physical inactivity
Maternal diabetesa
Probable NSP Saturated fats
Intrauterine growth retardation
Possible n-3 fatty acids
Low glycaemic index foods
Exclusive breastfeedingb
Total fat intake
Trans fatty acids
Insufficient Vitamin E
Chromium
Magnesium
Moderate alcohol
Excess alcohol
1 NSP, non-starch polysaccharides.a Includes gestational diabetes.b As a global public health recommendation, infants should be exclusively breastfed for the first six months of life to
achieve optimal growth, development and health (59).
5.3.5 Disease-specific recommendations
Measures aimed at reducing overweight and obesity, and cardiovasculardisease are likely to also reduce the risk of developing type 2 diabetes andits complications. Some measures are particularly relevant to reducingthe risk for diabetes; these are listed below:
. Prevention/treatment of overweight and obesity, particularly in high-risk groups.
. Maintaining an optimum BMI, i.e. at the lower end of the normalrange.For theadultpopulation, thismeansmaintainingameanBMI inthe range 21--23 kg/m2 and avoiding weight gain (>5 kg) in adult life.
. Voluntary weight reduction in overweight or obese individuals withimpaired glucose tolerance (although screening for such individualsmay not be cost-effective in many countries).
. Practising an endurance activity at moderate or greater level ofintensity (e.g. brisk walking) for one hour or more per day on mostdays per week.
. Ensuring that saturated fat intake does not exceed 10%of total energyand for high-risk groups, fat intake should be <7% of total energy.
. Achieving adequate intakes of NSP through regular consumption ofwholegrain cereals, legumes, fruits and vegetables. A minimum dailyintake of 20 g is recommended.
77

References
1. King H, Aubert RE, Herman WH.Global burden of diabetes, 1995--2025: preva-lence, numerical estimates, and projections.Diabetes Care, 1998, 21:1414--1431.
2. Amos AF, McCarty DJ, Zimmet P. The rising global burden of diabetes and itscomplications: estimates and projections to the year 2010. Diabetic Medicine,1997, 14(Suppl. 5):S1--S85.
3. Mann J. Stemming the tide of diabetes mellitus. Lancet, 2000, 356:1454--1455.
4. Report of the Expert Committee on the Diagnosis and Classification of DiabetesMellitus. Diabetes Care, 1997, 20:1183--1197.
5. Definition, diagnosis and classification of diabetes mellitus and its complications.Report of a WHO Consultation. Part 1. Diagnosis and classification of diabetesmellitus.Geneva,WorldHealthOrganization,1999(documentWHO/NCD/NCS/99.2).
6. Harris MI et al. Prevalence of diabetes, impaired fasting glucose, and impairedglucose tolerance in U.S. adults. The Third National Health and NutritionExamination Survey, 1988--1994. Diabetes Care, 1998, 21:518--524.
7. Flegal KM et al. Prevalence of diabetes in Mexican Americans, Cubans, andPuerto Ricans from the Hispanic Health and Nutrition Examination Survey, 1982--1984. Diabetes Care, 1991, 14:628--638.
8. Mokdad AH et al. Diabetes trends among American Indians and Alaska natives:1990--1998. Diabetes Care, 2001, 24:1508--1509.
9. Mokdad AH et al. The continuing epidemics of obesity and diabetes in the UnitedStates. Journal of the American Medical Association, 2001, 286:1195--1200.
10. Kleinman JC et al. Mortality among diabetics in a national sample. AmericanJournal of Epidemiology, 1988, 128:389--401.
11. Gu K, Cowie CC, Harris MI. Mortality in adults with and without diabetes in anational cohort of the US population, 1971--1993. Diabetes Care, 1998,21:1138--1145.
12. Roper NA et al. Excess mortality in a population with diabetes and the impact ofmaterial deprivation: longitudinal, population-based study. British MedicalJournal, 2001, 322:1389--1393.
13. Morrish et al. Mortality and causes of death in the WHO Multinational Study ofVascular Disease in Diabetes. Diabetologia, 2001, 44(Suppl. 2):S14--S21.
14. Sievers ML et al. Impact of NIDDM on mortality and causes of death in PimaIndians. Diabetes Care, 1992, 15:1541--1549.
15. McLarty DG, Kinabo L, Swai AB. Diabetes in tropical Africa: a prospective study,1981--7. II. Course andprognosis.BritishMedical Journal, 1990,300:1107--1110.
16. Colditz GA et al. Weight as a risk factor for clinical diabetes in women. AmericanJournal of Epidemiology, 1990, 132:501--513.
17. Despres JP et al. Treatment of obesity: need to focus on high-risk abdominallyobese patients. British Medical Journal, 2001, 322:716-720.
18. Chan JM et al.Obesity, fat distribution, and weight gain as risk factors for clinicaldiabetes in men. Diabetes Care, 1994, 17:961--969.
19. Boyko EJ et al. Visceral adiposity and risk of type 2 diabetes: a prospective studyamong Japanese Americans. Diabetes Care, 2000, 23:465--471.
20. Despres JP. Health consequences of visceral obesity.Annals ofMedicine, 2001,33:534--541.
78

21. McAuley KA et al. Intensive lifestyle changes are necessary to improve insulinsensitivity. Diabetes Care, 2002, 25:445--452.
22. Tuomilehto J et al. Prevention of type 2 diabetes mellitus by changes in lifestyleamong subjects with impaired glucose tolerance. New England Journal ofMedicine, 2002, 344:1343--1350.
23. Knowler WC et al. Reduction in the incidence of type 2 diabetes with lifestyleintervention of metformin. New England Journal of Medicine, 2002,346:393--403.
24. Manson JE et al. A prospective study of exercise and incidence of diabetesamong USmale physicians. Journal of the American Medical Association, 1992,268:63--67.
25. Kriska AM et al. The association of physical activity with obesity, fat distributionand glucose intolerance in Pima Indians. Diabetologia, 1993, 36:863--869.
26. Helmrich SP et al. Physical activity and reduced occurrence of non-insulin-dependent diabetes mellitus. New England Journal of Medicine, 1991,325:147--152.
27. Pettitt DJ et al. Congenital susceptibility to NIDDM. Role of intrauterineenvironment. Diabetes, 1988, 37:622--628.
28. Dabelea D et al. Intrauterine exposure to diabetes conveys risks for type 2diabetes and obesity: a study of discordant sibships. Diabetes, 2000,49:2208--2211.
29. Feskens EJM et al. Dietary factors determining diabetes and impaired glucosetolerance. A 20-year follow-up of the Finnish and Dutch cohorts of the SevenCountries Study. Diabetes Care, 1995, 18:1104--1112.
30. Bo S et al. Dietary fat and gestational hyperglycaemia. Diabetologia, 2001,44:972--978.
31. Feskens EJM, Kromhout D. Habitual dietary intake and glucose tolerance ineuglycaemic men: the Zutphen Study. International Journal of Epidemiology,1990, 19:953--959.
32. Parker DR et al. Relationship of dietary saturated fatty acids and body habitus toserum insulin concentrations: the Normative Aging Study. American Journal ofClinical Nutrition, 1993, 58:129--136.
33. FolsomARet al.Relationbetweenplasmaphospholipid saturated fatty acidsandhyperinsulinemia. Metabolism, 1996, 45:223--228.
34. Vessby B, Tengblad S, Lithell H. Insulin sensitivity is related to the fatty acidcomposition of serum lipids and skeletal muscle phospholipids in 70-year-oldmen. Diabetologia, 1994, 37:1044--1050.
35. Vessby B et al. The risk to develop NIDDM is related to the fatty acid compositionof the serum cholesterol esters. Diabetes, 1994, 43:1353--1357.
36. Salmeron Jet al. Dietary fat intake and risk of type 2diabetes inwomen.AmericanJournal of Clinical Nutrition, 2001, 73:1019--1026.
37. Meyer KA et al. Dietary fat and incidence of type 2 diabetes in older Iowawomen.Diabetes Care, 2001, 24:1528--1535.
38. Mooy JM et al. Prevalence and determinants of glucose intolerance in a DutchCaucasian population. The Hoorn Study. Diabetes Care, 1995, 18:1270--1273.
39. Pan DA et al. Skeletal muscle membrane lipid composition is related to adiposityand insulin action. Journal of Clinical Investigation, 1995, 96:2802--2808.
79

40. UusitupaMet al.Effects of two high-fat dietswith different fatty acid compositionson glucose and lipid metabolism in healthy young women. American Journal ofClinical Nutrition, 1994, 59:1310--1316.
41. Vessby B et al. Substituting polyunsaturated for saturated fat as a single changein a Swedishdiet: effects on serum lipoproteinmetabolismandglucose tolerancein patients with hyperlipoproteinaemia. European Journal of Clinical Investiga-tion, 1980, 10:193--202.
42. Vessby B et al. Substituting dietary saturated for monounsaturated fat impairsinsulin sensitivity in healthy men and women: the KANWU Study. Diabetologia,2001, 44:312--319.
43. Marshall JAet al. Dietary fat predicts conversion from impairedglucose toleranceto NIDDM. The San Luis Valley Diabetes Study. Diabetes Care, 1994, 17:50--56.
44. Mayer EJ et al. Usual dietary fat intake and insulin concentrations in healthywomen twins. Diabetes Care, 1993, 16:1459--1469.
45. Lovejoy J, DiGirolamoM. Habitual dietary intake and insulin sensitivity in lean andobese adults. American Journal of Clinical Nutrition, 1992, 55:1174--1179.
46. Trowell HC. Dietary-fiber hypothesis of the etiology of diabetes mellitus.Diabetes, 1975, 24:762--765.
47. Salmeron J et al. Dietary fiber, glycemic load and risk of NIDDM inmen.DiabetesCare, 1997, 20:545--550.
48. Salmeron J et al. Dietary fiber, glycemic load, and risk of non-insulin-dependentdiabetes mellitus in women. Journal of the American Medical Association, 1997,277:472--477.
49. MeyerKAet al. Carbohydrates, dietary fiber, and incident type2diabetes in olderwomen. American Journal of Clinical Nutrition, 2000, 71:921--930.
50. Mann J. Dietary fibre and diabetes revisited. European Journal of ClinicalNutrition, 2001, 55:919--921.
51. Simpson HRC et al. A high carbohydrate leguminous fibre diet improves allaspects of diabetic control. Lancet, 1981, 1:1--5.
52. Mann J. Lawrence lecture. Lines to legumes: changing concepts of diabeticdiets. Diabetic Medicine, 1984, 1:191--198.
53. ChandaliaM et al. Beneficial effects of high dietary fiber intake in patients with type2 diabetes mellitus. New England Journal of Medicine, 2000, 342:1392--1398.
54. Frost G, Wilding J, Beecham J. Dietary advice based on the glycaemic indeximproves dietary profile and metabolic control in type 2 diabetic patients.Diabetic Medicine, 1994, 11:397--401.
55. Brand JC et al. Low-glycemic index foods improve long-term glycemic control inNIDDM. Diabetes Care, 1991, 14:95--101.
56. Fontvieille AM et al. The use of low glycaemic index foods improves metaboliccontrol of diabetic patients over five weeks.Diabetic Medicine, 1992, 9:444--450.
57. Wolever TMS et al. Beneficial effect of a low glycaemic index diet in type 2diabetes. Diabetic Medicine, 1992, 9:451--458.
58. Stern MP et al. Birth weight and the metabolic syndrome: thrifty phenotype orthrifty genotype? Diabetes/Metabolism Research and Reviews, 2000, 16:88--93.
59. Infant and young child nutrition. Geneva, World Health Organization, 2001(document A54/2).
80

5.4 Recommendations for preventing cardiovascular diseases
5.4.1 Background
The second half of the 20th century has witnessed major shifts in thepattern of disease, in addition tomarked improvements in life expectancy,this period is characterized by profound changes in diet and lifestyleswhich in turn have contributed to an epidemic of noncommunicablediseases. This epidemic is now emerging, and even accelerating, in mostdeveloping countries, while infections and nutritional deficiencies arereceding as leading contributors to death and disability (1).
In developing countries, the effect of the nutrition transition and theconcomitant rise in the prevalence of cardiovascular diseases will be towiden the mismatch between health care needs and resources, andalready scarce resources will be stretched ever more thinly. Becauseunbalanced diets, obesity and physical inactivity all contribute to heartdisease, addressing these, along with tobacco use, can help to stem theepidemic. A large measure of success in this area has already beendemonstrated in many industrialized countries.
5.4.2 Trends
Cardiovascular diseases are the major contributor to the global burden ofdisease among the noncommunicable diseases. WHO currently attributesone-third of all global deaths (15.3 million) to CVD, with developingcountries, low-income and middle-income countries accounting for 86%of theDALYs lost to CVDworldwide in 1998. In the next two decades theincreasing burden of CVD will be borne mostly by developing countries.
5.4.3 Diet, physical activity and cardiovascular disease
The ‘‘lag-time’’ effect of risk factors for CVD means that presentmortality rates are the consequence of previous exposure to behaviouralrisk factors such as inappropriate nutrition, insufficient physical activityand increased tobacco consumption. Overweight, central obesity, highblood pressure, dyslipidaemia, diabetes and low cardio-respiratoryfitness are among the biological factors contributing principally toincreased risk. Unhealthy dietary practices include the high consump-tion of saturated fats, salt and refined carbohydrates, as well as lowconsumption of fruits and vegetables, and these tend to cluster together.
5.4.4 Strength of evidence
Convincing associations for reduced risk of CVD include consumption offruits (including berries) and vegetables, fish and fish oils (eicosapentae-noic acid (EPA) and docosahexaenoic acid (DHA)), foods high in linoleicacid and potassium, as well as physical activity and low to moderate
81

alcohol intake. While vitamin E intake appears to have no relationship torisk of CVD, there is convincing evidence thatmyristic and palmitic acids,trans fatty acids, high sodium intake, overweight and high alcohol intakecontribute to an increase in risk. A ‘‘probable’’ level of evidencedemonstrates a decreased risk for a-linolenic acid, oleic acid, NSP,wholegrain cereals, nuts (unsalted), folate, plant sterols and stanols, andno relationship for stearic acid. There is a probable increase in risk fromdietary cholesterol and unfiltered boiled coffee. Possible associations forreduced risk include intake of flavonoids and consumption of soyproducts, while possible associations for increased risk include fats rich inlauric acid, b-carotene supplements and impaired fetal nutrition. Theevidence supporting these conclusions is summarized below.
Fatty acids and dietary cholesterol
The relationship between dietary fats and CVD, especially coronaryheart disease, has been extensively investigated, with strong andconsistent associations emerging from a wide body of evidence accruedfrom animal experiments, as well as observational studies, clinical trialsand metabolic studies conducted in diverse human populations (2).
Saturated fatty acids raise total and low-density lipoprotein (LDL)cholesterol, but individual fatty acids within this group, have differenteffects (3--5). Myristic and palmitic acids have the greatest effect and areabundant in diets rich in dairy products and meat. Stearic acid has notbeen shown to elevate blood cholesterol and is rapidly converted to oleicacid in vivo. The most effective replacement for saturated fatty acids intermsof coronaryheart disease outcomearepolyunsaturated fatty acids,especially linoleic acid. This finding is supported by the results of severallarge randomized clinical trials, in which replacement of saturated andtrans fatty acids by polyunsaturated vegetable oils lowered coronaryheart disease risk (6).
Trans fatty acids are geometrical isomers of cis-unsaturated fatty acidsthat adapt a saturated fatty acid-like configuration. Partial hydrogena-tion, the process used to increase shelf-life of polyunsaturated fattyacids (PUFAs) creates trans fatty acids and also removes the criticaldouble bonds in essential fatty acids necessary for the action.Metabolicstudies have demonstrated that trans fatty acids render the plasma lipidprofile even more atherogenic than saturated fatty acids, by not onlyelevating LDL cholesterol to similar levels but also by decreasing high-density lipoprotein (HDL) cholesterol (7). Several large cohort studieshave found that intake of trans fatty acids increases the risk of coronaryheart disease (8, 9). Most trans fatty acids are contributed byindustrially hardened oils. Even though trans fatty acids have beenreduced or eliminated from retail fats and spreads in many parts of the
82

world, deep-fried fast foods and baked goods are amajor and increasingsource (7).
When substituted for saturated fatty acids in metabolic studies, bothmonounsaturated fatty acids and n-6 polyunsaturated fatty acids lowerplasma total and LDL cholesterol concentrations (10); PUFAs aresomewhatmore effective thanmonounsaturates in this respect. The onlynutritionally important monounsaturated fatty acids is oleic acid, whichis abundant in olive and canola oils and also in nuts. Themost importantpolyunsaturated fatty acid is linoleic acid, which is abundant especiallyin soybean and sunflower oils. The most important n-3 PUFAs areeicosapentaenoic acid and docosahexaenoic acid found in fatty fish, anda-linolenic acid found in plant foods. The biological effects of n-3PUFAs are wide ranging, involving lipids and lipoproteins, bloodpressure, cardiac function, arterial compliance, endothelial function,vascular reactivity and cardiac electrophysiology, as well as potent anti-platelet and anti-inflammatory effects (11). The very long chain n-3PUFAs (eicosapentaenoic acid and docosahexaenoic acid) powerfullylower serum triglycerides but they raise serum LDL cholesterol.Therefore, their effect on coronary heart disease is probably mediatedthrough pathways other than serum cholesterol.
Most of the epidemiological evidence related to n-3 PUFAs is derivedfrom studies of fish consumption in populations or interventionsinvolving fish diets in clinical trials (evidence on fish consumption isdiscussed further below). Fish oils have been used in the GruppoItaliano per lo Studio della Sopravvivenza nell’Infarto Miocardico(GISSI) trial involving survivors of myocardial infarction (12). After 3.5years of follow-up, the group that received fish oil had a 20% reductionin total mortality, a 30% reduction in cardiovascular death and a 45%decrease in sudden death. Several prospective studies have found aninverse association between the intake of a-linolenic acid, (high inflaxseed, canola and soybean oils), and risk of fatal coronary heartdisease (13, 14).
Cholesterol in the blood and tissues is derived from two sources: diet andendogenous synthesis.Dairy fat andmeat aremajor dietary sources. Eggyolk is particularly rich in cholesterol but unlike dairy products andmeatdoes not provide saturated fatty acids. Although dietary cholesterolraises plasma cholesterol levels (15), observational evidence for anassociation of dietary cholesterol intake with CVD is contradictory (16).There is no requirement for dietary cholesterol and it is advisable to keepthe intake as low as possible (2). If intake of dairy fat and meat arecontrolled, there is no need to severely restrict egg yolk intake, althoughsome limitation remains prudent.
83

Dietary plant sterols, especially sitostanol, reduce serum cholesterol byinhibiting cholesterol absorption (17). The cholesterol-lowering effectsof plant sterols has also been well documented (18) and commercialproducts made of these compounds are widely available, but their long-term effects remain to be seen.
NSP (dietary fibre)
Dietary fibre is a heterogeneous mixture of polysaccharides and ligninthat cannot be degraded by the endogenous enzymes of vertebrateanimals.Water-soluble fibres include pectins, gums,mucilages and somehemicelluloses. Insoluble fibres include cellulose and other hemicellu-loses. Most fibres reduce plasma total and LDL cholesterol, as reportedby several trials (19). Several large cohort studies carried out in differentcountries have reported that a high fibre diet as well as a diet high inwholegrain cereals lowers the risk of coronary heart disease (20--23).
Antioxidants, folate, and flavonoids
Even though antioxidants could, in theory, be protective against CVDand there is observational data supporting this theory, controlled trialsemploying supplements have been disappointing. The Heart OutcomesPrevention Evaluation trial (HOPE), a definitive clinical trial relatingvitamin E supplementation to CVD outcomes, revealed no effect ofvitamin E supplementation on myocardial infarction, stroke or deathfromcardiovascular causes inmenorwomen (24).Also, the results of theHeart Protection Study indicated that no significant benefits of dailysupplementation of vitamin E, vitamin C and b-carotene were observedamong the high-risk individuals thatwere the subject of the study (25). Inseveral studieswheredietaryvitaminCreduced the riskof coronaryheartdisease, supplemental vitaminChad little effect. Clinical trial evidence islacking at present. Observational cohort studies have suggested aprotective role for carotenoids but a meta-analysis of four randomizedtrials, in contrast, reportedan increased riskof cardiovasculardeath (26).
The relationship of folate to CVD has been mostly explored through itseffect on homocysteine, whichmay itself be an independent risk factor forcoronary heart disease and probably also for stroke. Folic acid is requiredfor the methylation of homocysteine to methionine. Reduced plasmafolate has been strongly associated with elevated plasma homocysteinelevels and folate supplementation has been demonstrated to decreasethose levels (27). However, the role of homocysteine as an independentrisk factor for CVD has been subject to much debate, since severalprospective studies have not found this association to be independent ofother risk factors (28, 29). It has also been suggested that elevation ofplasma homocysteine is a consequence and not a cause of atherosclerosis,wherein impaired renal function resulting from atherosclerosis raises
84

plasma homocysteine levels (30, 31). Data from the Nurses’ Health Studyshowed that folate and vitamin B6, from diet and supplements, conferredprotection against coronary heart disease (32). A recently publishedmeta-analysis concluded that a higher intake of folate (0.8 mg folic acid) wouldreduce the risk of ischaemic heart disease by 16%and stroke by 24% (33).
Flavonoids are polyphenolic compounds that occur in a variety of foods ofvegetable origin, such as tea, onions and apples. Data from severalprospective studies indicate an inverse association of dietary flavonoidswithcoronaryheartdisease (34,35).However, confoundingmaybeamajorproblem and may explain the conflicting results of observational studies.
Sodium and potassium
High blood pressure is a major risk factor for coronary heart diseaseand both forms of stroke (ischaemic and haemorrhagic). Of the manyrisk factors associated with high blood pressure, the dietary exposurethat has been most investigated is daily sodium intake. It has beenstudied extensively in animal experimental models, in epidemiologicalstudies, controlled clinical trials and in population studies on restrictedsodium intake (36, 37).
All these data show convincingly that sodium intake is directly associatedwith blood pressure. An overview of observational data obtained frompopulation studies suggested that a difference in sodium intake of 100mmol per day was associated with average differences in systolic bloodpressure of 5 mmHg at age 15--19 years and 10 mmHg at age 60--69 years(37). Diastolic blood pressures are reduced by about half as much, but theassociation increases with age andmagnitude of the initial blood pressure.It was estimated that a universal reduction in dietary intake of sodium by50 mmol per day would lead to a 50% reduction in the number of peoplerequiring antihypertensive therapy, a 22% reduction in the number ofdeaths resulting fromstrokes anda16%reduction in thenumber of deathsfrom coronary heart disease. The first prospective study using 24-hoururine collections for measuring sodium intake, which is the only reliablemeasure, demonstrated a positive relationship between an increased riskof acute coronary events, but not stroke events, and increased sodiumexcretion (38). The association was strongest among overweight men.
Several clinical intervention trials, conducted to evaluate the effects ofdietary salt reduction on blood pressure levels, have been systematicallyreviewed (39, 40). Based on an overview of 32 methodologically adequatetrials, Cutler, Follmann & Allender (39) concluded that a daily reductionof sodium intake by 70--80 mmol was associated with a lowering of bloodpressure both in hypertensive and normotensive individuals, with systolicand diastolic blood pressure reductions of 4.8/1.9 mmHg in the formerand 2.5/1.1 mmHg in the latter. Clinical trials have also demonstrated the
85

sustainable blood pressure lowering effects of sodium restriction ininfancy (41, 42), as well as in the elderly in whom it provides a useful non-pharmacological therapy (43). The results of a low-sodium diet trial (44)showed that low-sodium diets, with 24-hour sodium excretion levelsaround 70 mmol, are effective and safe. Two population studies, in Chinaand in Portugal, have also revealed significant reductions in bloodpressure in the intervention groups (45, 46).
A meta-analysis of randomized controlled trials showed that potassiumsupplements reducedmeanbloodpressures (systolic/diastolic) by 1.8/1.0mmHg in normotensive subjects and 4.4/2.5 mmHg in hypertensivesubjects (47). Several large cohort studies have found an inverseassociation between potassium intake and risk of stroke (48, 49). Whilepotassium supplements have been shown to have protective effects onblood pressure and cardiovascular diseases, there is no evidence tosuggest that long-term potassium supplements should be administeredto reduce the risk for CVD. The recommended levels of fruit andvegetable consumption assure an adequate intake of potassium.
Food items and food groups
While the consumption of fruits and vegetables has been widely believedto promote good health, evidence related to their protective effectagainst CVD has only been presented in recent years (50). Numerousecological and prospective studies have reported a significant protectiveassociation for coronary heart disease and stroke with consumption offruits and vegetables (50--53). The effects of increased fruit and vegetableconsumption on blood pressure alone and in combinationwith a low-fatdiet, were assessed in the Dietary Approaches to Stop Hypertension(DASH) trial (54). While the combination diet was more effective inlowering blood pressure, the fruit and vegetable diet also lowered bloodpressure (by 2.8 mmHg systolic and 1.1 mmHg diastolic) in comparisonto the control diet. Such reductions, while seeming modest at theindividual level, would result in a substantial reduction in population-wide risk of CVD by shifting the blood pressure distribution.
Most, but not all, population studies have shown that fish consumption isassociated with a reduced risk of coronary heart disease. A systematicreview concluded that the discrepancy in the findings may be a result ofdifferences in the populations studied, with only high-risk individualsbenefiting from increasing their fish consumption (55). It was estimatedthat inhigh-riskpopulations, anoptimumfish consumptionof40--60 g perday would lead to approximately a 50% reduction in death from coronaryheart disease. In a diet and reinfarction trial, 2-year mortality was reducedby 29% in survivors of a first myocardial infarction in persons receivingadvice to consume fatty fish at least twice aweek (56). A recent study based
86

on data from 36 countries, reported that fish consumption is associatedwith a reduced risk of death from all causes as well as CVDmortality (57).
Several large epidemiological studies have demonstrated that frequentconsumption of nuts was associated with decreased risk of coronaryheart disease (58, 59). Most of these studies considered nuts as a group,combining many different types of nuts. Nuts are high in unsaturatedfatty acids and low in saturated fats, and contribute to cholesterollowering by altering the fatty acid profile of the diet as awhole.However,because of the high energy content of nuts, advice to include them in thediet must be tempered in accordance with the desired energy balance.
Several trials indicate that soy has a beneficial effect on plasma lipids (60,61). A composite analysis of 38 clinical trials found that an averageconsumption of 47 g of soy protein a day led to a 9% decline in totalcholesterol and a 13% decline in LDL cholesterol in subjects free ofcoronary heart disease (62). Soy is rich in isoflavones, compounds thatare structurally and functionally similar to estrogen. Several animalexperiments suggest that the intake of these isoflavones may provideprotection against coronary heart disease, but human data on efficacyand safety are still awaited.
There is convincing evidence that low to moderate alcohol consumptionlowers the risk of coronary heart disease. In a systematic review ofecological, case--control and cohort studies in which specific associationswere available between risk of coronary heart-disease and consumption ofbeer, wine and spirits, it was found that all alcoholic drinks are linkedwithlower risk (63). However, other cardiovascular and health risks associatedwith alcohol do not favour a general recommendation for its use.
Boiled, unfiltered coffee raises total and LDL cholesterol because coffeebeans contain a terpenoid lipid called cafestol. The amount of cafestol inthe cup depends on the brewing method: it is zero for paper-filtered dripcoffee, andhigh in the unfiltered coffee still widely drunk in, for example,in Greece, the Middle East and Turkey. Intake of large amounts ofunfiltered coffee markedly raises serum cholesterol and has beenassociated with coronary heart disease in Norway (64). A shift fromunfiltered, boiled coffee to filtered coffee has contributed significantly tothe decline in serum cholesterol in Finland (65).
5.4.5 Disease-specific recommendations
Measures aimed at reducing the risk of CVD are outlined below. Thestrength of evidence on lifestyle factors is summarized in Table 10.
Fats
Dietary intake of fats strongly influences the risk of cardiovasculardiseases such as coronary heart disease and stroke, through effects on
87

blood lipids, thrombosis, blood pressure, arterial (endothelial) function,arrythmogenesis and inflammation. However, the qualitative composi-tion of fats in the diet has a significant role to play inmodifying this risk.
Table 10Summary of strength of evidence on lifestyle factors and risk of developingcardiovascular diseases
Evidence Decreased risk No relationship Increased risk
Convincing Regular physical activity
Linoleic acid
Fish and fish oils (EHA and DHA)
Vegetables and fruits (including
berries)
Potassium
Low to moderate alcohol intake
(for coronary heart disease)
Vitamin E
supplements
Myristic and palmitic acids
Trans fatty acids
High sodium intake
Overweight
High alcohol intake (for stroke)
Probable a-Linolenic acid
Oleic acid
NSP
Wholegrain cereals
Nuts (unsalted)
Plant sterols/stanols
Folate
Stearic acid Dietary cholesterol
Unfiltered boiled coffee
Possible Flavonoids
Soy products
Fats rich in lauric acid
Impaired fetal nutrition
Beta-carotene supplements
Inufficient Calcium
Magnesium
Vitamin C
Carbohydrates
Iron
EPA, eicosapentaenoic acid; DHA, docosahexaenoic acid; NSP, non-starch polysaccharides.
The evidence shows that intake of saturated fatty acids is directly relatedto cardiovascular risk. The traditional target is to restrict the intake ofsaturated fatty acids to less than 10%, of daily energy intake and lessthan 7% for high-risk groups. If populations are consuming less than10%, they should not increase that level of intake. Within these limits,intake of foods rich in myristic and palmitic acids should be replaced byfats with a lower content of these particular fatty acids. In developingcountries, however, where energy intake for some population groupsmay be inadequate, energy expenditure is high and body fat stores arelow (BMI<18.5 kg/m2). The amount and quality of fat supply has to beconsidered keeping in mind the need to meet energy requirements.Specific sources of saturated fat, such as coconut and palm oil, providelow-cost energy and may be an important source of energy for the poor.
Not all saturated fats have similar metabolic effects; those with 12--16carbons in the fatty acid chain have a greater effect on raising LDLcholesterol. This implies that the fatty acid composition of the fat source
88
shouldbeexamined.Aspopulationsprogress in thenutritiontransitionandenergy excess becomes a potential problem, restricting certain fatty acidsbecomes progressively more relevant to ensuring cardiovascular health.
To promote cardiovascular health, diets should provide a very lowintake of trans fatty acids (hydrogenated oils and fats). In practice, thisimplies an intake of less than 1% of daily energy intake. Thisrecommendation is especially relevant in developing countries wherelow-cost hydrogenated fat is frequently consumed. The potential effectof human consumption of hydrogenated oils of unknown physiologicaleffects (e.g. marine oils) is of great concern.
Diets should provide an adequate intake of PUFAs, i.e. in the range 6--10% of daily energy intake. There should also be an optimal balancebetween intake of n-6 PUFAs and n-3 PUFAs, i.e. 5--8% and 1--2% ofdaily energy intake, respectively.
Intake of oleic acid, amonounsaturated fatty acid, shouldmake up the restof the daily energy intake from fats, to give a daily total fat intake rangingfrom15%up to30%ofdaily energy intake.Recommendations for total fatintake may be based on current levels of population consumption indifferent regions and modified to take account of age, activity and idealbodyweight.Whereobesity is prevalent, for example, an intake in the lowerpart of the range is preferable in order to achieve a lower energy intake.While there is no evidence to directly link the quantity of daily fat intake toan increased riskofCVD, total fat consumption shouldbe limited to enablethegoalsof reduced intakeof saturatedand trans fattyacids tobemet easilyin most populations and to avoid the potential problems of undesirableweight gain that may arise from unrestricted fat intake. It should be notedthat highly active groups with diets rich in vegetables, legumes, fruits andwholegrain cereals will limit the risk of unhealthy weight gain on a dietcomprising a total fat intake of up to 35%.
Thesedietarygoals canbemetby limiting the intakeof fat fromdairyandmeat sources, avoiding the use of hydrogenated oils and fats in cookingand manufacture of food products, using appropriate edible vegetableoils in small amounts, and ensuring a regular intake of fish (one to twotimes per week) or plant sources of a-linolenic acid. Preference should begiven to food preparation practices that employ non-frying methods.
Fruits and vegetables
Fruits and vegetables contribute to cardiovascular health through thevariety of phytonutrients, potassium and fibre that they contain. Dailyintake of fresh fruit and vegetables (including berries, green leafy andcruciferous vegetables and legumes), in an adequate quantity (400--500 g per day), is recommended to reduce the risk of coronary heartdisease, stroke and high blood pressure.
89

Sodium
Dietary intake of sodium, from all sources, influences blood pressurelevels in populations and should be limited so as to reduce the risk ofcoronary heart disease and both forms of stroke. Current evidencesuggests that an intake of no more than 70 mmol or 1.7 g of sodium perday is beneficial in reducing blood pressure. The special situation ofindividuals (i.e. pregnant women and non-acclimated people whoperform strenuous physical activity in hot environments) who may beadversely affected by sodium reduction needs to be kept in mind.
Limitation of dietary sodium intake to meet these goals should beachieved by restricting daily salt (sodium chloride) intake to less than5 g per day. This should take into account total sodium intake from alldietary sources, for example additives such as monosodium glutamateand preservatives. Use of potassium-enriched low-sodium substitutes isone way to reduce sodium intake. The need to adjust salt iodization,depending on observed sodium intake and surveillance of iodine statusof the population, should be recognized.
Potassium
Adequate dietary intake of potassium lowers blood pressure and isprotective against stroke and cardiac arrythmias. Potassium intake shouldbeat a levelwhichwill keep the sodiumtopotassiumratio close to 1.0, i.e. adaily potassium intake level of 70--80mmol per day. Thismay be achievedthrough adequate daily consumption of fruits and vegetables.
NSP (dietary fibre)1
Fibre is protective against coronary heart disease and has also been usedin diets to lower blood pressure. Adequate intake may be achievedthrough fruits, vegetables and wholegrain cereals.
Fish
Regular fish consumption (1--2 servings per week) is protective againstcoronary heart disease and ischaemic stroke and is recommended. Theserving should provide an equivalent of 200--500 mg of eicosapentaenoicand docosahexaenoic acid. People who are vegetarians are recommendedto ensure adequate intake of plant sources of a-linolenic acid.
Alcohol
Although regular low to moderate consumption of alcohol is protectiveagainst coronary heart disease, other cardiovascular and health risksassociatedwithalcoholdonot favourageneral recommendation for its use.
1 Specific amounts will depend on the analytical methodologies used to measure fibre.
90

Physical activity
Physical activity is related to the risk of cardiovascular diseases, especiallycoronaryheartdisease, ina consistent inversedose--response fashionwheneither volume or intensity are used for assessment. These relationshipsapply to both incidence and mortality rates from all cardiovasculardiseases and from coronary heart disease. At present, no consistent dose--response relationship can be found between risk of stroke and physicalactivity. The lower limits of volume or intensity of the protective dose ofphysical activity have not been defined with certainty, but the currentrecommendation of at least 30 minutes of at least moderate-intensityphysical activityonmostdaysof theweek is considered sufficient.Ahighervolumeor intensity of activitywould confer a greaterprotective effect. Therecommended amount of physical activity is sufficient to raise cardio-respiratory fitness to the level that has been shown to be related todecreased risk of cardiovascular disease. Individuals who are unaccus-tomed to regular exercise or have a high-risk profile forCVDshould avoidsudden and high-intensity bursts of physical activity.
References
1. Reddy KS. Cardiovascular diseases in the developing countries: dimensions,determinants, dynamics and directions for public health action. Public HealthNutrition, 2002, 5:231--237.
2. Kris-EthertonPMet al.Summary of the scientific conferenceondietary fatty acidsand cardiovascular health: conference summary from the nutrition committee ofthe American Heart Association. Circulation, 2001, 103:1034--1039.
3. Grundy SM, Vega GL. Plasma cholesterol responsiveness to saturated fattyacids. American Journal of Clinical Nutrition, 1988, 47:822--824.
4. KatanMJ,ZockPL,MensinkRP.Dietaryoils, serum lipoproteinsandcoronaryheartdisease. American Journal of Clinical Nutrition, 1995, 61(Suppl. 6):1368--1373.
5. MensinkRP,KatanMB.Effectofdietary fattyacidsonserum lipidsand lipoproteins.A meta-analysis of 27 trials. Arteriosclerosis and Thrombosis, 1992, 12:911--919.
6. Hu FB et al. Dietary fat intake and the risk of coronary heart disease in women.New England Journal of Medicine, 1997, 337:1491--1499.
7. Katan MB. Trans fatty acids and plasma lipoproteins. Nutrition Reviews, 2000,58:188--191.
8. Oomen CM et al. Association between trans fatty acid intake and 10-year riskof coronary heart disease in the ZutphenElderly Study: a prospective population-based study. Lancet, 2001, 357:746--751.
9. Willett WC et al. Intake of trans fatty acids and risk of coronary heart diseaseamong women. Lancet, 1993, 341:581--585.
10. Kris-Etherton PM.Monosaturated fatty acids and risk of cardiovascular disease.Circulation, 1999, 100:1253--1258.
11. Mori TA, Beilin LJ. Long-chain omega 3 fatty acids, blood lipids andcardiovascular risk reduction. Current Opinion in Lipidology, 2001, 12:11--17.
12. GISSI-Prevenzione investigators. Dietary supplementation with n-3 polyunsatu-rated fatty acids and vitamin E after myocardial infarction: results of the
91

GISSI-Prevenzione trial. Gruppo Italiano per lo Studio della Sopravvivenzanell’Infarto Miocardico. Lancet, 1999, 354:447--455.
13. HuFB et al. Fish and omega-3 fatty acid intake and risk of coronary heart diseasein women. American Journal of Clinical Nutrition, 1999, 69:890--897.
14. Ascherio A et al. Dietary fat and risk of coronary heart disease in men: cohortfollow-up study in the United States. British Medical Journal, 1996, 313:84--90.
15. Hopkins PN. Effects of dietary cholesterol on serum cholesterol: a meta-analysisand review. American Journal of Clinical Nutrition, 1992, 55:1060--1070.
16. Hu FB et al. A prospective study of egg consumption and risk of cardiovasculardisease in men and women. Journal of the American Medical Association, 1999,281:1387--1394.
17. Miettinen TAet al.Reduction of serumcholesterol with sitostanol-estermargarinein a mildly hypercholesterolemic population. New England Journal of Medicine,1995, 333:1308--1312.
18. Law M. Plant sterols and stanol margarines and health. British Medical Journal,2000, 320:861--864.
19. Anderson JW, Hanna TJ. Impact of nondigestible carbohydrates on serumlipoproteins and risk for cardiovascular disease. Journal of Nutrition, 1999,129:1457--1466.
20. Truswell AS. Cereal grains and coronary heart disease. European Journal ofClinical Nutrition, 2002, 56:1--14.
21. Liu S et al. Whole-grain consumption and risk of coronary heart disease: resultsfrom the Nurses’ Health Study. American Journal of Clinical Nutrition, 1999,70:412--419.
22. Pietinen P et al. Intake of dietary fiber and risk of coronary heart disease ina cohort of Finnish men. The Alpha-Tocopherol, Beta-Carotene CancerPrevention Study. Circulation, 1996, 94:2720--2727.
23. Rimm EB et al. Vegetable, fruit, and cereal fiber intake and risk of coronary heartdisease among men. Journal of the American Medical Association, 1996,275:447--451.
24. Yusuf S et al. Vitamin E supplementation and cardiovascular events in high-riskpatients. The Heart Outcomes Prevention Evaluation Study Investigators. NewEngland Journal of Medicine, 2000, 342:154--160.
25. Heart Protection Study Collaborative Group. MRC/BHF Heart Protection Study ofantioxidant vitamin supplementation in 20 536 high-risk individuals: a rando-mised placebo-controlled trial. Lancet, 2002, 360:23--33.
26. Egger M, Schneider M, Davey-Smith G. Spurious precision? Meta-analysis ofobservational studies. British Medical Journal, 1998, 316:140--144.
27. Brouwer IA et al. Low dose folic acid supplementation decreases plasmahomocysteine concentrations: a randomized trial. American Journal of ClinicalNutrition, 1999, 69:99--104.
28. Ueland PM et al. The controversy over homocysteine and cardiovascular risk.American Journal of Clinical Nutrition, 2000, 72:324--332.
29. Nygard O et al. Total plasma homocysteine and cardiovascular risk profile. TheHordaland Homocysteine Study. Journal of the American Medical Association,1995, 274:1526--1533.
30. Brattstrom L,Wilcken DEL.Homocysteine and cardiovascular disease: cause oreffect? American Journal of Clinical Nutrition, 2000, 72:315--323.
92
31. Guttormsen AB et al. Kinetic basis of hyperhomocysteinemia in patients withchronic renal failure. Kidney International, 1997, 52:495--502.
32. RimmEB et al. Folate and vitamin B6 from diet and supplements in relation to riskof coronary heart disease among women. Journal of the American MedicalAssociation, 1998, 279:359--364.
33. Wald DS, Law M, Morris JK. Homocysteine and cardiovascular disease:evidence on causality from a meta-analysis. British Medical Journal, 325:1202--1208.
34. Keli SOet al.Dietary flavonoids, antioxidant vitamins, and incidenceof stroke: theZutphen study. Archives of Internal Medicine, 1996. 156:637--642.
35. Hertog MGL et al. Dietary antioxidant flavonoids and risk of coronary heartdisease: the Zutphen Elderly Study. Lancet, 1993, 342:1007--1011.
36. Gibbs CR, Lip GY, Beevers DG. Salt and cardiovascular disease: clinical andepidemiological evidence. Journal of Cardiovascular Risk, 2000, 7:9--13.
37. Law MR, Frost CD, Wald NJ. By how much does salt reduction lower bloodpressure? III--Analysis of data from trials of salt reduction.BritishMedical Journal,1991, 302:819--824.
38. Tuomilehto J et al. Urinary sodium excretion and cardiovascular mortality inFinland: a prospective study. Lancet, 2001, 357:848--851.
39. Cutler JA, Follmann D, Allender PS. Randomized trials of sodium reduction: anoverview. American Journal of Clinical Nutrition, 1997, 65:643--651.
40. Midgley JP et al. Effect of reduced dietary sodium on blood pressure: ameta-analysis of randomized controlled trials. Journal of the American MedicalAssociation, 1996, 275:1590--1597.
41. Geleijnse JM et al. Long-term effects of neonatal sodium restriction on bloodpressure. Hypertension, 1997, 29:913--917 (erratum appears in Hypertension,1997, 29:1211).
42. HofmanA,HazebroekA, ValkenburgHA.A randomized trial of sodium intake andblood pressure in newborn infants. Journal of the AmericanMedical Association,1983, 250:370--373.
43. Whelton PK et al. Sodium reduction and weight loss in the treatment ofhypertension in older persons. Journal of the American Medical Association,1998, 279:839--846 (erratum appears in Journal of the American MedicalAssociation, 1998, 279:1954).
44. Sacks FM et al. Effects on blood pressure of reduced dietary sodium and theDietary Approaches to Stop Hypertension (DASH) diet. New England Journalof Medicine, 2001, 344:3--10.
45. Forte JG et al. Salt and blood pressure: a community trial. Journal of HumanHypertension, 1989, 3:179--184.
46. Tian HG et al. Changes in sodium intake and blood pressure in a community-based intervention project in China. Journal of Human Hypertension, 1995,9:959--968.
47. Whelton PK et al. Effects of oral potassium on blood pressure. Meta-analysis ofrandomized controlled clinical trials. Journal of the American Medical Associa-tion, 1997, 277:1624--1632.
48. Ascherio A et al. Intake of potassium, magnesium, and fiber and risk of strokeamong US men. Circulation, 1998, 98:1198--1204.
93

49. Khaw KT, Barrett-Connor E. Dietary potassium and stroke-associated mortality.A12-year prospectivepopulation study.NewEnglandJournal ofMedicine, 1987,316:235--240.
50. Ness AR, Powles JW. Fruit and vegetables, and cardiovascular disease: areview. International Journal of Epidemiology, 1997, 26:1--13.
51. Liu S et al. Fruit and vegetable intake and risk of cardiovascular disease:the Women’s Health Study. American Journal of Clinical Nutrition, 2000,72:922--928.
52. Joshipura KJ et al. Fruit and vegetable intake in relation to risk of ischemic stroke.Journal of the American Medical Association, 1999, 282:1233--1239.
53. Gilman MW et al. Protective effect of fruits and vegetables on developmentof stroke in men. Journal of the American Medical Association, 1995,273:1113--1117.
54. Appel LJ et al. A clinical trial of the effects of dietary patterns on blood pressure.DASH Collaborative Research Group. New England Journal of Medicine, 1998,336:1117--1124.
55. Marckmann P, Gronbaek M. Fish consumption and coronary heart diseasemortality. A systematic review of prospective cohort studies. European Journal ofClinical Nutrition, 1999, 53:585--590.
56. Burr ML et al. Effects of changes in fat, fish and fibre intakes on death andmyocardial reinfarction: diet and reinfarction trial (DART). Lancet, 1989,2:757--761.
57. Zhang J et al. Fish consumption and mortality from all causes, ischemicheart disease, and stroke: an ecological study. Preventive Medicine, 1999,28:520--529.
58. Kris-EthertonPMet al.Theeffects of nuts oncoronary heart disease risk.NutritionReviews, 2001, 59:103--111.
59. Hu FB, Stampfer MJ. Nut consumption and risk of coronary heart disease: areview of epidemiologic evidence. Current Atherosclerosis Reports, 1999,1:204--209.
60. Third International Symposium on the Role of Soy in Preventing and TreatingChronic Disease. Journal of Nutrition, 2000, 130(Suppl.):653--711.
61. Crouse JR et al. Randomized trial comparing the effect of casein with that of soyprotein containing varying amounts of isoflavones on plasma concentrations oflipids and lipoproteins. Archives of Internal Medicine, 1999, 159:2070--2076.
62. Anderson JW, Smith BM, Washnok CS. Cardiovascular and renal benefits ofdry bean and soybean intake. American Journal of Clinical Nutrition, 1999,70:464--474.
63. RimmEB et al.Moderate alcohol intake and lower risk of coronary heart disease:meta-analysis of effects on lipids and haemostatic factors. British MedicalJournal, 1999, 319:1523--1528.
64. Tverdal A et al. Coffee consumption and death from coronary heart diseasein middle-aged Norwegian men and women. British Medical Journal, 1990,300:566--569.
65. Pietinen P et al.Changes in diet in Finland from 1972 to 1992: impact on coronaryheart disease risk. Preventive Medicine, 1996, 25:243--250.
94

5.5 Recommendations for preventing cancer
5.5.1 Background
Cancer is caused by a variety of identified and unidentified factors. Themost important established cause of cancer is tobacco smoking. Otherimportant determinants of cancer risk include diet, alcohol and physicalactivity, infections, hormonal factors and radiation. The relativeimportance of cancers as a cause of death is increasing, mostly becauseof the increasingproportionofpeoplewhoareold, andalso inpartbecauseof reductions in mortality from some other causes, especially infectiousdiseases.The incidenceof cancersof the lung, colonandrectum,breast andprostate generally increases in parallel with economic development, whilethe incidence of stomach cancer usually declines with development.
5.5.2 Trends
Cancer is now amajor cause ofmortality throughout the world and, in thedeveloped world, is generally exceeded only by cardiovascular diseases.An estimated 10 million new cases and over 6 million deaths from canceroccurred in 2000 (1). As developing countries become urbanized, patternsof cancer, including those most strongly associated with diet, tend to shifttowards those of economically developed countries. Between 2000 and2020, the total number of cases of cancer in the developing world ispredicted to increase by 73% and, in the developed world, to increase by29%, largely as a result of an increase in the number of old people (1).
5.5.3 Diet, physical activity and cancer
Dietary factors are estimated to account for approximately 30% ofcancers in industrialized countries (2), making diet second only totobacco as a theoretically preventable cause of cancer. This proportion isthought to be about 20% in developing countries (3), butmay growwithdietary change, particularly if the importance of other causes, especiallyinfections, declines. Cancer rates change as populations move betweencountries and adopt different dietary (and other) behaviours, furtherimplicating dietary factors in the etiology of cancer.
Body weight and physical inactivity together are estimated to accountfor approximately one-fifth to one-third of several of the most commoncancers, specifically cancers of the breast (postmenopausal), colon,endometrium, kidney and oesophagus (adenocarcinoma) (4).
5.5.4 Strength of evidence
Research todatehasuncovered fewdefinite relationshipsbetweendiet andcancer risk. Dietary factors for which there is convincing evidence for anincrease in risk are overweight and obesity, and a high consumption ofalcoholic beverages, aflatoxins, and some forms of salting and fermenting
95

fish. There is also convincing evidence to indicate that physical activitydecreases the risk of colon cancer. Factors which probably increase riskinclude high dietary intake of preserved meats, salt-preserved foods andsalt, and very hot (thermally) drinks and food. Probable protective factorsare consumption of fruits and vegetables, and physical activity (for breastcancer). After tobacco, overweight and obesity appear to be the mostimportant known avoidable causes of cancer.
The role of diet in the etiology of the major cancers
Cancers of the oral cavity, pharynx and oesophagus. In developedcountries themain risk factors for cancers of the oral cavity, pharynxandoesophagus are alcohol and tobacco, and up to 75% of such cancers areattributable to these two lifestyle factors (5). Overweight and obesity areestablished risk factors specifically for adenocarcinoma (but notsquamous cell carcinoma) of the oesophagus (6--8). In developingcountries, around 60% of cancers of the oral cavity, pharynx andoesophagus are thought to be a result of micronutrient deficienciesrelated to a restricted diet that is low in fruits and vegetables and animalproducts (5, 9). The relative roles of various micronutrients are not yetclear (5, 9). There is also consistent evidence that consuming drinks andfoods at a very high temperature increases the risk for these cancers (10).Nasopharyngeal cancer is particularly common in South-East Asia (11),and has been clearly associated with a high intake of Chinese-style saltedfish, especially during early childhood (12, 13), as well as with infectionwith the Epstein-Barr virus (2).
Stomach cancer. Until about 20 years ago stomach cancer was the mostcommon cancer in the world, but mortality rates have been falling in allindustrialized countries (14) and stomach cancer is currently much morecommon inAsia than inNorthAmerica or Europe (11). Infectionwith thebacterium Helicobacter pylori is an established risk factor, but not asufficient cause, for the development of stomach cancer (15). Diet isthought tobe important in the etiologyof this disease; substantial evidencesuggests that risk is increased by high intakes of some traditionallypreserved salted foods, especially meats and pickles, and with salt per se,and that risk is decreased by high intakes of fruits and vegetables (16),perhaps because of their vitamin C content. Further prospective data areneeded, in particular to examine whether some of the dietary associationsmay be partly confounded by Helicobacter pylori infection and whetherdietary factorsmaymodify the associationofHelicobacter pyloriwith risk.
Colorectal cancer. Colorectal cancer incidence rates are approximatelyten-fold higher in developed than in developing countries (11), and it hasbeen suggested that diet-related factorsmayaccount for up to 80%of thedifferences in rates between countries (17). The best established diet-
96

related risk factor is overweight/obesity (8) and physical activity hasbeen consistently associated with a reduced risk of colon cancer (but notof rectal cancer) (8, 18). These factors together, however, do not explainthe large variation between populations in colorectal cancer rates. Thereis almost universal agreement that some aspects of the ‘‘westernized’’diet are a major determinant of risk; for instance, there is some evidencethat risk is increased by high intakes of meat and fat, and that risk isdecreased by high intakes of fruits and vegetables, dietary fibre, folateand calcium, but none of these hypotheses has been firmly established.
International correlation studies have showna strong association betweenper capita consumptionofmeat andcolorectal cancermortality (19), andarecent systematic review concluded that preserved meat is associated withan increased risk for colorectal cancer but that fresh meat is not (20).However, most studies have not observed positive associations withpoultry or fish (9).Overall, the evidence suggests that high consumption ofpreserved and red meat probably increases the risk for colorectal cancer.
As with meat, international correlation studies show a strong associationbetweenper capita consumptionof fat and colorectal cancermortality (19).However, the results of observational studies of fat and colorectal cancerhave, overall, not been supportive of an association with fat intake (9, 21).
Many case--control studies have observed a weak association betweenthe risk of colorectal cancer and high consumption of fruits andvegetables and/or dietary fibre (22, 23), but the results of recent largeprospective studies have been inconsistent (24--26). Furthermore, resultsfrom randomized controlled trials have not shown that interventionovera 3--4 year period with supplemental fibre or a diet low in fat and high infibre and fruits and vegetables can reduce the recurrence of colorectaladenomas (27--29). It is possible that some of the inconsistencies are aresult of differences between studies in the types of fibre eaten and in themethods for classifying fibre in food tables, or that the association withfruits and vegetables arises principally from an increase in risk at verylow levels of consumption (30). Onbalance, the evidence that is currentlyavailable suggests that intake of fruits and vegetables probably reducesthe risk for colorectal cancer.
Recent studies have suggested that vitamins andminerals might influencethe risk for colorectal cancer.Someprospective studieshave suggested thatahigh intakeof folate fromdietorvitamin supplements is associatedwithareduced risk for colon cancer (31--33). Another promising hypothesis isthat relatively high intakes of calcium may reduce the risk for colorectalcancer; several observational studies have supported this hypothesis (9,34), and two trials have indicated that supplemental calcium may have amodest protective effect on the recurrence of colorectal adenomas (29, 35).
97

Liver cancer. Approximately 75% of cases of liver cancer occur indeveloping countries, and liver cancer rates vary over 20-fold betweencountries, being much higher in sub-Saharan Africa and South-East Asiathan in North America and Europe (11). The major risk factor forhepatocellular carcinoma, the main type of liver cancer, is chronicinfection with hepatitis B, and to a lesser extent, hepatitis C virus (36).Ingestion of foods contaminated with the mycotoxin, aflatoxin is animportant risk factor amongpeople in developing countries, togetherwithactive hepatitis virus infection (13, 37). Excessive alcohol consumption isthemaindiet-related risk factor for liver cancer in industrialized countries,probably via the development of cirrhosis and alcoholic hepatitis (5).
Pancreatic cancer. Cancer of the pancreas is more common inindustrialized countries than in developing countries (11, 38). Over-weight and obesity possibly increase the risk (9, 39). Some studies havesuggested that risk is increased by high intakes of meat, and reduced byhigh intakes of vegetables, but these data are not consistent (9).
Lung cancer. Lung cancer is the most common cancer in the world (11).Heavy smoking increases the risk by around30-fold, and smoking causesover 80% of lung cancers in developed countries (5). Numerousobservational studies have found that lung cancer patients typicallyreport a lower intake of fruits, vegetables and related nutrients (such asb-carotene) than controls (9, 34). The only one of these factors to havebeen tested in controlled trials, namely b-carotene, has, however, failedto produce any benefit when given as a supplement for up to 12 years(40--42). The possible effect of diet on lung cancer risk remainscontroversial, and the apparent protective effect of fruits and vegetablesmay be largely the result of residual confounding by smoking, sincesmokers generally consume less fruit and vegetables than non-smokers.In public health terms, the overriding priority for preventing lung canceris to reduce the prevalence of smoking.
Breast cancer. Breast cancer is the second most common cancer in theworld and the most common cancer among women. Incidence rates areabout five times higher in industrialized countries than in less developedcountries and Japan (11). Much of this international variation is a resultof differences in established reproductive risk factors such as age atmenarche, parity and age at births, and breastfeeding (43, 44), butdifferences in dietary habits and physical activitymay also contribute. Infact, age at menarche is partly determined by dietary factors, in thatrestricted dietary intake during childhood and adolescence leads todelayed menarche. Adult height, also, is weakly positively associatedwith risk, and is partly determined by dietary factors during childhoodand adolescence (43). Estradiol and perhaps other hormones play a key
98

role in the etiologyof breast cancer (43), and it is possible that any furtherdietary effects on risk are mediated by hormonal mechanisms.
The only dietary factors which have been shown to increase the risk forbreast cancer are obesity and alcohol. Obesity increases breast cancerrisk in postmenopausal women by around 50%, probably by increasingserum concentrations of free estradiol (43). Obesity does not increaserisk among premenopausal women, but obesity in premenopausalwomen is likely to lead to obesity throughout life and therefore to aneventual increase in breast cancer risk. For alcohol, there is now a largebodyof data fromwell-designed studieswhich consistently showsa smallincrease in risk with increasing consumption, with about a 10% increasein risk for an average of one alcoholic drink every day (45). Themechanism for this association is not known, but may involve increasesin estrogen levels (46).
The results of studies of other dietary factors including fat, meat, dairyproducts, fruits and vegetables, fibre and phyto-estrogens are incon-clusive (9, 34, 47, 48).
Endometrial cancer. Endometrial cancer risk is about three-fold higher inobesewomen than in leanwomen (8, 49), probablybecauseof the effects ofobesity on hormone levels (50). Some case--control studies have suggestedthatdietshigh in fruitsandvegetablesmayreduce riskandthatdietshigh insaturated or total fatmay increase risk, but the amount of available data islimited (9).
Prostate cancer. Prostate cancer incidence rates are strongly affected bydiagnostic practices and therefore difficult to interpret, but mortalityrates show that death from prostate cancer is about 10 times morecommon in North America and Europe than in Asia (11).
Little is knownabout the etiologyofprostate cancer, although ecologicalstudies suggest that it is positively associated with a ‘‘westernized’’ diet(19). The data from prospective studies have not established causal orprotective associations for specific nutrients or dietary factors (9, 34).Diets high in red meat, dairy products and animal fat have frequentlybeen implicated in the development of prostate cancer, although the dataare not entirely consistent (9, 51--53). Randomized controlled trials haveprovided substantial, consistent evidence that supplements ofb-carotenedo not alter the risk for prostate cancer (40, 41, 54) but have suggestedthat vitamin E (54) and selenium (55) might have a protective effect.Lycopene, primarily from tomatoes, has been associated with a reducedrisk in some observational studies, but the data are not consistent (56).Hormones control the growth of the prostate, and diet might influenceprostate cancer risk by affecting hormone levels.
99
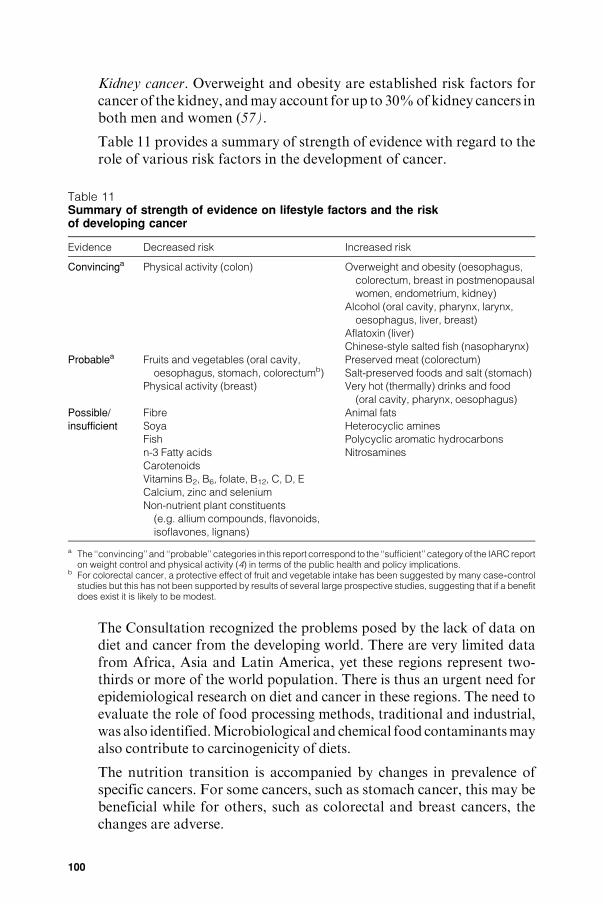
Kidney cancer. Overweight and obesity are established risk factors forcancer of the kidney, andmayaccount for up to 30%ofkidney cancers inboth men and women (57).
Table 11 provides a summary of strength of evidence with regard to therole of various risk factors in the development of cancer.
Table 11Summary of strength of evidence on lifestyle factors and the riskof developing cancer
Evidence Decreased risk Increased risk
Convincinga Physical activity (colon) Overweight and obesity (oesophagus,
colorectum, breast in postmenopausal
women, endometrium, kidney)
Alcohol (oral cavity, pharynx, larynx,
oesophagus, liver, breast)
Aflatoxin (liver)
Chinese-style salted fish (nasopharynx)
Probablea Fruits and vegetables (oral cavity,
oesophagus, stomach, colorectumb)
Physical activity (breast)
Preserved meat (colorectum)
Salt-preserved foods and salt (stomach)
Very hot (thermally) drinks and food
(oral cavity, pharynx, oesophagus)
Possible/
insufficient
Fibre
Soya
Fish
n-3 Fatty acids
Carotenoids
Vitamins B2, B6, folate, B12, C, D, E
Calcium, zinc and selenium
Non-nutrient plant constituents
(e.g. allium compounds, flavonoids,
isoflavones, lignans)
Animal fats
Heterocyclic amines
Polycyclic aromatic hydrocarbons
Nitrosamines
a The ‘‘convincing’’ and ‘‘probable’’ categories in this report correspond to the ‘‘sufficient’’ category of the IARC reporton weight control and physical activity (4) in terms of the public health and policy implications.
b For colorectal cancer, a protective effect of fruit and vegetable intake has been suggested by many case--controlstudies but this has not been supported by results of several large prospective studies, suggesting that if a benefitdoes exist it is likely to be modest.
The Consultation recognized the problems posed by the lack of data ondiet and cancer from the developing world. There are very limited datafrom Africa, Asia and Latin America, yet these regions represent two-thirds or more of the world population. There is thus an urgent need forepidemiological research on diet and cancer in these regions. The need toevaluate the role of food processing methods, traditional and industrial,was also identified.Microbiological and chemical food contaminantsmayalso contribute to carcinogenicity of diets.
The nutrition transition is accompanied by changes in prevalence ofspecific cancers. For some cancers, such as stomach cancer, this may bebeneficial while for others, such as colorectal and breast cancers, thechanges are adverse.
100
5.5.5 Disease-specific recommendations
The main recommendations for reducing the risk of developing cancerare as follows:
. Maintain weight (among adults) such that BMI is in the range of 18.5--24.9 kg/m2 and avoid weight gain (>5 kg) during adult life (58).
. Maintain regular physical activity. The primary goal should be toperformphysical activity onmost days of the week; 60minutes per dayof moderate-intensity activity, such as walking, may be needed tomaintain healthy body weight in otherwise sedentary people. Morevigorous activity, such as fast walking, may give some additionalbenefits for cancer prevention (4).
. Consumption of alcoholic beverages is not recommended: if con-sumed, do not exceed two units1 per day.
. Chinese-style fermented salted fish should only be consumed inmoderation, especially during childhood.Overall consumption of salt-preserved foods and salt should be moderate.
. Minimize exposure to aflatoxin in foods.
. Have a diet which includes at least 400 g per day of total fruits andvegetables.
. Thosewho are not vegetarian are advised tomoderate consumption ofpreserved meat (e.g. sausages, salami, bacon, ham).2
. Do not consume foods or drinks when they are at a very hot (scaldinghot) temperature.
References
1. Parkin DM. Global cancer statistics in the year 2000. Lancet Oncology, 2001,2:533--543.
2. Doll R, Peto R. Epidemiology of cancer. In: Weatherall DJ, Ledingham JGG,Warrell DA, eds. Oxford textbook of medicine. Oxford, Oxford University Press,1996:197--221.
3. Willet MC. Diet, nutrition, and avoidable cancer. Environmental HealthPerspectives, 1995, 103(Suppl. 8):S165--S170.
4. Weight control and physical activity. Lyon, International Agency for Research onCancer, 2002 (IARC Handbooks of Cancer Prevention, Vol. 6).
5. Cancer: causes, occurrence and control. Lyon, International Agency forResearch on Cancer, 1990 (IARC Scientific Publications, No. 100).
6. Brown LM et al. Adenocarcinoma of the esophagus: role of obesity and diet.Journal of the National Cancer Institute, 1995, 87:104--109.
7. Cheng KK et al. A case--control study of oesophageal adenocarcinoma inwomen: a preventable disease. British Journal of Cancer, 2000, 83:127--132.
1 One unit is equivalent to approximately 10 g of alcohol and is provided by one glass of beer, wine orspirits.
2 Poultry and fish (except Chinese-style salted fish) have been studied and found not to be associatedwith increased risk for cancer.
101

8. Overweight and lack of exercise linked to increased cancer risk. In:Weightcontrol andphysical activity. Lyon, International Agency for Research onCancer,2002 (IARC Handbooks of Cancer Prevention, Vol. 6).
9. Food, nutrition and the prevention of cancer: a global perspective. Washington,DC,WorldCancerResearchFund/American Institute forCancerResearch, 1997.
10. Sharp L et al. Risk factors for squamous cell carcinoma of the oesophagus inwomen: a case--control study. British Journal of Cancer, 2001, 85:1667--1670.
11. Ferlay J et al. Globocan 2000: cancer incidence, mortality and prevalenceworldwide. Version 1.0. Lyon, International Agency for Research onCancer, 2001 (IARC CancerBase No. 5; available on the Internet athttp://www-dep.iarc.fr/globocan/globocan.html).
12. YuMC.Nasopharyngeal carcinoma: epidemiology anddietary factors. In:O’NeillIK, Chen J, BartschH, eds.Relevance to humancancer of N-nitroso compounds,tobacco smoke and mycotoxins. Lyon, International Agency for Research onCancer, 1991:39--47 (IARC Scientific Publications, No. 105).
13. Some naturally occurring substances: food items and constituents,heterocyclic aromatic amines and mycotoxins. Lyon, International Agencyfor Research on Cancer, 1993 (IARC Monographs on the Evaluation ofCarcinogenic Risks to Humans, Vol. 56).
14. World health statistics annual. Geneva, World Health Organization, 2001(available on the Internet at http://www.who.int/whosis/).
15. Helicobacter and Cancer Collaborative Group. Gastric cancer and Helicobacterpylori: a combined analysis of 12 case--control studies nested within prospectivecohorts. Gut, 2001, 49:347--353.
16. Palli D. Epidemiology of gastric cancer: an evaluation of available evidence.Journal of Gastroenterology, 2000, 35(Suppl. 12):S84--S89.
17. Cummings JH, Bingham SA. Diet and the prevention of cancer. British MedicalJournal, 1998, 317:1636--1640.
18. Hardman AE. Physical activity and cancer risk. Proceedings of the NutritionSociety, 2001, 60:107--113.
19. ArmstrongB, Doll R. Environmental factors and cancer incidence andmortality indifferent countries, with special reference to dietary practices. InternationalJournal of Cancer, 1975, 15:617--631.
20. Norat T et al. Meat consumption and colorectal cancer risk: a dose--responsemeta-analysis of epidemiological studies. International Journal of Cancer, 2002,98:241--256.
21. Howe GR et al. The relationship between dietary fat intake and risk of colorectalcancer: evidence from the combinedanalysis of 13 case--control studies.CancerCauses and Control, 1997, 8:215--228.
22. Potter JD, Steinmetz K. Vegetables, fruit and phytoestrogens as preventiveagents. In: Stewart BW, McGregor D, Kleihues P, eds. Principles ofchemoprevention. Lyon, International Agency for Research on Cancer,1996:61--90 (IARC Scientific Publications, No. 139).
23. Jacobs DR Jr et al. Whole-grain intake and cancer: an expanded review andmeta-analysis. Nutrition and Cancer, 1998, 30:85--96.
24. Bueno de Mesquita HB, Ferrari P, Riboli E (on behalf of EPIC Working Group onDietary Patterns). Plant foods and the risk of colorectal cancer in Europe:preliminary findings. In: Riboli E, Lambert R, eds. Nutrition and lifestyle:
102

opportunities for cancer prevention. Lyon, International Agency for Research onCancer, 2002:89--95 (IARC Scientific Publications, No. 156).
25. Fuchs CS et al. Dietary fiber and the risk of colorectal cancer and adenoma inwomen. New England Journal of Medicine, 1999, 340:169--176.
26. Michels KB et al. Prospective study of fruit and vegetable consumption andincidence of colon and rectal cancers. Journal of the National Cancer Institute,2000, 92:1740--1752.
27. Schatzkin A et al. Lack of effect of a low-fat, high-fiber diet on the recurrence ofcolorectal adenomas. Polyp Prevention Trial Study Group. New England Journalof Medicine, 2000, 342:1149--1155.
28. AlbertsDSet al.Lackof effect of ahigh-fiber cereal supplement on the recurrenceof colorectal adenomas. Phoenix Colon Cancer Prevention Physicians’ Network.New England Journal of Medicine, 2000, 342:1156--1162.
29. Bonithon-Kopp C et al. Calcium and fibre supplementation in prevention ofcolorectal adenoma recurrence: a randomised intervention trial. EuropeanCancer Prevention Organisation Study Group. Lancet, 2000, 356:1300--1306.
30. Terry P et al. Fruit, vegetables, dietary fiber, and risk of colorectal cancer. Journalof the National Cancer Institute, 2001, 93:525--533.
31. Giovannucci E et al. Alcohol, low-methionine, low-folate diets, and risk of coloncancer in men. Journal of the National Cancer Institute, 1995, 87:265--273.
32. Glynn SA et al. Alcohol consumption and risk of colorectal cancer in a cohort ofFinnish men. Cancer Causes and Control, 1996, 7:214--223.
33. Giovannucci E et al. Multivitamin use, folate, and colon cancer in women in theNurses’ Health Study. Annals of Internal Medicine, 1998, 129:517--524.
34. Nutritional Aspects of the Development of Cancer. Report of the Working Groupon Diet and Cancer of the Committee on Medical Aspects of Food and NutritionPolicy. London, The Stationery Office, 1998 (Report on Health and SocialSubjects, No. 48).
35. Baron JAet al.Calciumsupplements andcolorectal adenomas. PolypPreventionTrial Study Group. Annals of the New York Academy of Sciences,1999,889:138--145.
36. Hepatitis viruses. Lyon, International Agency for Research on Cancer, 1994(IARC Monographs on the Evaluation of Carcinogenic Risks to Humans,Vol. 59).
37. Saracco G. Primary liver cancer is of multifactorial origin: importance of hepatitisB virus infection and dietary aflatoxin. Journal of Gastroenterology andHepatology, 1995, 10:604--608.
38. Parkin DM et al. Estimating the world cancer burden: globocan 2000.International Journal of Cancer, 2001, 94:153--156.
39. Michaud DS et al. Physical activity, obesity, height, and the risk of pancreaticcancer. Journal of the American Medical Association, 2001, 286:921--929.
40. Hennekens CH et al. Lack of effect of long-term supplementation with beta-carotene on the incidence of malignant neoplasms and cardiovascular disease.New England Journal of Medicine, 1996, 334:1145--1149.
41. Omenn GS et al. Effects of a combination of beta carotene and vitamin A on lungcancer and cardiovascular disease. New England Journal of Medicine, 1996,334:1150--1155.
103

42. Beta Carotene Cancer Prevention Study Group The Alpha-Tocopherol.The effect of vitamin E and beta carotene on the incidence of lung cancer andother cancers in male smokers. New England Journal of Medicine, 1994,330:1029--1035.
43. Key TJ, Verkasalo PK, Banks E. Epidemiology of breast cancer. LancetOncology, 2001, 2:133--140.
44. Collaborative Group on Hormonal Factors in Breast Cancer. Breast cancerand breastfeeding: collaborative reanalysis of individual data from 47 epide-miological studies in 30 countries, including 50 302 women with breast cancerand 96 973 women without the disease. Lancet, 2002, 360:187--195.
45. Smith-Warner SA et al.Alcohol and breast cancer in women: a pooled analysis ofcohort studies. Journal of theAmericanMedical Association,1998,279:535--540.
46. Dorgan JF et al. Serum hormones and the alcohol--breast cancer associationin postmenopausal women. Journal of the National Cancer Institute, 2001,93:710--715.
47. Key TJ, Allen NE. Nutrition and breast cancer. Breast, 2001, 10(Suppl. 3):S9--S13.
48. Smith-Warner SAet al. Intake of fruits and vegetables and risk of breast cancer: apooled analysis of cohort studies. Journal of the American Medical Association,2001, 285:769--776.
49. Bergstrom A et al. Overweight as an avoidable cause of cancer in Europe.International Journal of Cancer, 2001, 91:421--430.
50. Key TJ, Pike MC. The dose--effect relationship between ‘‘unopposed’’oestrogens and endometrial mitotic rate: its central role in explaining andpredicting endometrial cancer risk. British Journal of Cancer, 1988, 57:205--212.
51. Schuurman AG et al. Animal products, calcium and protein and prostatecancer risk in The Netherlands Cohort Study. British Journal of Cancer, 1999,80:1107--1113.
52. Chan JM et al. Dairy products, calcium, and prostate cancer risk in thePhysicians’ Health Study. American Journal of Clinical Nutrition, 2001,74:549--554.
53. Michaud DS et al. A prospective study on intake of animal products and riskof prostate cancer. Cancer Causes and Control, 2001, 12:557--567.
54. Heinonen OP et al. Prostate cancer and supplementation with alpha-tocopheroland beta-carotene: incidence and mortality in a controlled trial. Journal of theNational Cancer Institute, 1998, 90:440--446.
55. Clark LC et al. Decreased incidence of prostate cancer with seleniumsupplementation: results of a double-blind cancer prevention trial.British Journalof Urology, 1998, 81:730--734.
56. Kristal AR, Cohen JH. Invited commentary: tomatoes, lycopene, and prostatecancer. How strong is the evidence? American Journal of Epidemiology, 2000,151:124--127.
57. Bergstrom A et al. Obesity and renal cell cancer---a quantitative review. BritishJournal of Cancer, 2001, 85:984--990.
58. Obesity: preventing and managing the global epidemic. Report of a WHOConsultation. Geneva, World Health Organization, 2000 (WHO Technical ReportSeries, No. 894).
104

5.6 Recommendations for preventing dental diseases
5.6.1 Background
Oral health is related to diet in many ways, for example, throughnutritional influences on cranio-facial development, oral cancer and oralinfectious diseases. The purpose of this review, however, is to focus on thenutritional aspectsofdentaldiseases.Dentaldiseases includedental caries,developmental defects of enamel, dental erosion and periodontal disease.Dental diseases are a costly burden to health care services, accounting forbetween 5% and 10% of total health care expenditures and exceeding thecost of treating cardiovascular disease, cancer and osteoporosis inindustrialized countries (1). In low-income countries, the cost oftraditional restorative treatment of dental disease would probably exceedthe available resources for health care. Dental health promotion andpreventive strategies are clearly more affordable and sustainable.
Although not life-threatening, dental diseases have a detrimental effecton quality of life in childhood through to old age, having an impact onself-esteem, eating ability, nutrition and health. In modern society, asignificant role of teeth is to enhance appearance; facial appearance isvery important in determining an individual’s integration into society,and teeth also play an essential role in speech and communication. Oraldiseases are associated with considerable pain, anxiety and impairedsocial functioning (2, 3). Dental decay may result in tooth loss, whichreduces the ability to eat a nutritious diet, the enjoyment of food, theconfidence to socialize and the quality of life (4--6).
5.6.2 Trends
The amount of dental decay is measured using the dmf/DMF index, acount of the number of teeth or surfaces in a person’s mouth that aredecayed, missing or filled as a result of caries in primary dentition/permanent dentition. An additional dental status indicator is theproportion of the population who are edentulous (have no natural teeth).
In most low-income countries, the prevalence rate of dental caries isrelatively low andmore than 90%of caries are untreated.Available data(7) show that the mean number of decayed, missing or filled permanentteeth (DMFT) at age 12 years in low-income countries is 1.9, 3.3 inmiddle-income countries and 2.1 in high-income countries (Table 12).
Data on the level of dental caries in the permanent dentition of 12-year-olds show two distinct trends. First, a fall in the prevalence of dentalcaries in developed countries, and second an increase in the prevalence ofthe disease in some developing countries that have increased theirconsumption of sugars and have not yet been introduced to the presence
105

of adequate amounts of fluoride. Despite the marked overall decline indental caries over the past 30 years, the prevalence of dental cariesremains unacceptably high in many developed countries. Even incountries with low average DMFT scores, a significant proportion ofchildren have relatively high levels of dental caries. Moreover, there issome indication that the favourable trends in levels of dental caries inpermanent teeth have come to a halt (8).
Table 12Trends in levels of dental caries in 12-year-olds (mean DMFT per person aged 12 years)
Country or area Year DMFT Year DMFT Year DMFT
Industrialized countries
Australia 1956 9.3 1982 2.1 1998 0.8
Finland 1975 7.5 1982 4.0 1997 1.1
Japan 1975 5.9 1993 3.6 1999 2.4
Norway 1940 12.0 1979 4.5 1999 1.5
Romania 1985 5.0 1991 4.3 1996 3.8
Switzerland 1961--1963 9.6 1980 1.7 1996 0.8
United Kingdom 1983 3.1 1993 1.4 1996--1997 1.1
United States 1946 7.6 1980 2.6 1998 1.4
Developing countries
Chile 1960 2.8 1978 6.6 1996 4.1
Democratic Republic
of the Congo
1971 0.1 1982 0.3 1987 0.4--1.1
French Polynesia 1966 6.5 1986 3.2 1994 3.2
Islamic Republic of Iran 1974 2.4 1976 4.9 1995 2.0
Jordan 1962 0.2 1981 2.7 1995 3.3
Mexico 1975 5.3 1991 2.5--5.1 1997 2.5
Morocco 1970 2.6 1980 4.5 1999 2.5
Philippines 1967 1.4 1981 2.9 1998 4.6
Uganda 1966 0.4 1987 0.5 1993 0.4
DMFT, decayed, missing, filled permanent teeth.Source: reference 7.
Many developing countries have low decayed, missing, filled primaryteeth (dmft) values but a high prevalence of dental caries in the primarydentition. Data on 5-year-old children in Europe suggest that the trendtowards reduced prevalence of dental decay has halted (9--11). Inchildren aged 5--7 years, average dmft values of below 2.0 have beenreported for Denmark, England, Finland, Italy, Netherlands andNorway (12). Higher dmft values were reported recently for Belarus(4.7) (13), Hungary (4.5) (14), Romania (4.3) (15) and the RussianFederation (4.7) (16).
Being free from caries at age 12 years does not imply being caries-free forlife. The mean DMFT in countries of the European Union after 1988varied between 13.4 and 20.8 at 35--44 years (17). TheWHO guidelines onoral health state that at age 35--44 years a DMFT score of 14 or above is
106

considered high. In most developing countries, the level of caries in adultsof this age group is lower, for example, 2.1 in China (18) and 5.7 in Niger(19). Fewdata are available on the prevalence and severity of root caries inolder adults, but with the increasingly ageing population and greaterretention of teeth, the problem of root caries is likely to become asignificant public health concern in the future.
Thenumberof edentulouspersonshas declinedover the past 20--30 yearsin several industrialized countries (3). Despite overall gains however,there is still a large proportion of older adults who are edentulous orpartially dentate and as the population continues to age tooth loss willaffect a growing number of persons worldwide. Table 13 summarizes theavailable information on the prevalence of edentulousness in old-agepopulations throughout the world.
Dental erosion is a relatively new dental problem in many countriesthroughout the world, and is related to diet. There is anecdotal evidencethat prevalence is increasing in industrialized countries, but there are nodata over time to indicate patterns of this disease. There are insufficientdata available to comment on worldwide trends; in some populations,however, it is thought that approximately 50%of childrenare affected (20).
5.6.3 Diet and dental disease
Nutritional status affects the teeth pre-eruptively, although thisinfluence is much less important than the post-eruptive local effect ofdiet on the teeth (21). Deficiencies of vitamins D and A and protein--energy malnutrition have been associated with enamel hypoplasia andsalivary gland atrophy (which reduces the mouth’s ability to bufferplaque acids), which render the teeth more susceptible to decay. Indeveloping countries, in the absence of dietary sugars, undernutrition isnot associated with dental caries. Undernutrition coupled with a highintake of sugars may exacerbate the risk of caries.
There is some evidence to suggest that periodontal disease progressesmore rapidly in undernourished populations (22); the important role ofnutrition inmaintaining an adequate host immune responsemay explainthis observation. Apart from severe vitamin C deficiency, which mayresult in scurvy-related periodontitis, there is little evidence at present foran association between diet and periodontal disease. Current research isinvestigating the potential role of the antioxidant nutrients in period-ontal disease. Poor oral hygiene is the most important risk factor in thedevelopmentof periodontal disease (21).Undernutrition exacerbates theseverity of oral infections (e.g. acute necrotizingulcerative gingivitis) andmay eventually lead to their evolution into life-threatening diseases suchas noma, a dehumanizing oro-facial gangrene (23).
107

Table 13Prevalence of edentulousness in older people throughout the world
Country or area Prevalence of
edentulousness (%)
Age group
(years)
African RegionGambia 6 65 +
Madagascar 25 65--74
Region of the Americas
Canada 58 65 +
United Sates 26 65--69
South-East Asian Region
India 19 65--74
Indonesia 24 65 +
Sri Lanka 37 65--74
Thailand 16 65 +
European Region
Albania 69 65 +
Austria 15 65--74
Bosnia and Herzegovina 78 65 +
Bulgaria 53 65 +
Denmark 27 65--74
Finland 41 65 +
Hungary 27 65--74
Iceland 15 65--74
Italy 19 65--74
Lithuania 14 65--74
Poland 25 65--74
Romania 26 65--74
Slovakia 44 65--74
Slovenia 16 65 +
United Kingdom 46 65 +
Eastern Mediterranean Region
Egypt 7 65 +
Lebanon 20 64--75
Saudi Arabia 31--46 65 +
Western Pacific RegionCambodia 13 65--74
China 11 65--74
Malaysia 57 65 +
Singapore 21 65 +
Source: reference 7.
Dental caries occur because of demineralization of enamel and dentine byorganic acids formed by bacteria in dental plaque through the anaerobicmetabolismof sugars derived from the diet (24).Organic acids increase thesolubility of calcium hydroxyapatite in the dental hard tissues anddemineralization occurs. Saliva is super-saturated with calcium andphosphate at pH 7 which promotes remineralization. If the oral pHremains high enough for sufficient time then complete remineralization of
108

enamel may occur. If the acid challenge is too great, however,demineralization dominates and the enamel becomes more porous untilfinally a carious lesion forms (25). The development of caries requires thepresence of sugars and bacteria, but is influenced by the susceptibility ofthe tooth, the bacterial profile, and the quantity and quality of the saliva.
Dietary sugars and dental caries
There is a wealth of evidence from many different types of investigation,including human studies, animal experiments and experimental studies invivo and in vitro to show the role of dietary sugars in the etiology of dentalcaries (21). Collectively, data from these studies provide an overall pictureof the cariogenic potential of carbohydrates. Sugars are undoubtedly themost important dietary factor in the development of dental caries. Here,the term ‘‘sugars’’ refers to all monosaccharides and disaccharides, whilethe term ‘‘sugar’’ refers only to sucrose. The term ‘‘free sugars’’ refers to allmonosaccharides and disaccharides added to foods by the manufacturer,cook or consumer, plus sugars naturally present in honey, fruit juices andsyrups. The term ‘‘fermentable carbohydrate’’ refers to free sugars,glucose polymers, oligosaccharides andhighly refined starches; it excludesnon-starch polysaccharides and raw starches.
Worldwide epidemiological studies have compared sugar consumptionand levels of dental caries at the between-country level. Sreebny (26, 27)correlated the dental caries experience (DMFT) of 12-year-olds withdata on sugar supplies of 47 countries and found a significant correlation(+0.7); 52% of the variation in the level of caries was explained by theper capita availability of sugar. In countries with a consumption level ofsugar <18 kg per person per year caries experience was consistently<DMFT 3. A later analysis byWoodward &Walker (28) did not find asimilar association for developed countries. Sugar availability never-theless accounted for 28% of the variation in levels of dental caries; 23out of 26 countries with a per capita sugar availability<50 g per day hada mean DMFT score for 12-year olds of <3, whereas only half of thecountries with sugar availability above this level had achieved a DMFTscore that was<3.
Miyazaki & Morimoto (29) reported a significant correlation (r=+0.91) between sugar availability in Japan and DMFT at age 12 yearsbetween 1957 and 1987. Populations that had experienced a reducedsugar availability during the Second World War showed a reduction indental caries which subsequently increased again when the restrictionwas lifted (30--32). Although the data pre-date the widespread use offluoride dentifrice, Weaver (33) observed a reduction in dental cariesbetween 1943 and 1949 in areas of northern England with both high andlow concentrations of fluoride in drinking-water.
109

Isolated communitieswith a traditionalwayof life and a consistently lowintake of sugars have very low levels of dental caries. As economic levelsin such societies rise, the amount of sugar and other fermentablecarbohydrates in the diet increases and this is often associated with amarked increase in dental caries. Examples of this trend have beenreported among the Inuit in Alaska, USA (34), as well as in populationsin Ethiopia (35), Ghana (36), Nigeria (37), Sudan (38), and on the Islandof Tristan da Cunha, St Helena (39).
There is evidence to show thatmany groups of peoplewith high exposureto sugars have levels of caries higher than the population average.Examples include children with chronic diseases requiring long-termsugar-containing medicines (40), and confectionery workers (41--44).Likewise, experience of dental caries has seldombeen reported in groupsof people who have a habitually low intake of sugars, for example,children of dentists (45, 46) and children in institutions where strictdietary regimens are inflicted (47, 48). A weakness of population studiesof this type is that changes in intake of sugars often occur concurrentlywith changes in the intake of refined starches, making it impossible toattribute changes in dental caries solely to changes in the intake ofsugars. An exception to this are the data from studies of children withhereditary fructose intolerance (HFI). Studies have shown that peoplewithHFI have a low intake of sugars and a higher than average intake ofstarch, but have a low dental caries experience (49).
Human intervention studies are rare, and those that have been reportedare now decades old andwere conducted in the pre-fluoride era before thestrong link between sugars intake and dental caries levels was established.It would not be possible to repeat such studies today because of ethicalconstraints. TheVipeholm study, conducted in an adultmental institutionin Sweden between 1945 and 1953 (50), investigated the effects ofconsuming sugary foods of varying stickiness and at different timesthroughout the day on the development of caries. It was found that sugar,evenwhen consumed in large amounts, had little effect on caries incrementif it was ingested up to a maximum of four times a day at mealtimes only.Increased frequency of consumption of sugar between meals was,however, associated with a marked increase in dental caries. It was alsofound that the increase in dental caries activity disappears on withdrawalof sugar-rich foods. Despite the complicated nature of the study theconclusions are valid, although they apply to the pre-fluoride era. TheTurku study was a controlled dietary intervention study carried out onadults in Finland in the 1970s which showed that almost total substitutionof sucrose in the diet with xylitol (a non-cariogenic sweetener) resulted inan 85% reduction in dental caries over a 2-year period (51).
110

Numerous cross-sectional epidemiological studies have compared sugarsintake with dental caries levels in many countries of the world. Thoseconducted before the early 1990s have been summarized by Rugg-Gunn(21). Nine out of 21 studies that compared amount of sugars consumedwith caries increment found significant associations,while the other 12 didnot. Moreover, 23 out of 37 studies that investigated the associationbetween frequency of sugars consumption and caries levels foundsignificant relationships, while 14 failed to find any such associations.
A cross-sectional study in the United States of 2514 people aged 9--29 years conducted between 1968 and 1970 found that the dental cariesexperience of adolescents eating the highest amounts of sugars (upper15% of the sample) was twice that of those eating the lowest amounts(lower 15%of the sample) (52). Granath et al. (53) showed that intake ofsugars was the most important factor associated with caries in theprimary dentition of preschool children in Sweden. When the effects oforal hygiene and fluoride were kept constant, the children with a lowintake of sugars betweenmeals had up to 86% less caries than those withhigh intakes of sugars. Other studies have found fluoride exposure andoral hygiene to be more strongly associated with caries than sugarsconsumption (54, 55). A recent study in the United Kingdom of arepresentative sample of children aged 4--18 years showed no significantrelationship between caries experience and level of intake of free sugars;in the age group 15--18 years, however, the upper band of free sugarsconsumers were more likely to have decay than the lower band (70%compared with 52%) (20).
Many other cross-sectional studies have shown a relationship betweensugars consumption and levels of caries in the primary and/or permanentdentitions in countries or areas throughout the world, including China(56), Denmark (57), Madagascar (58, 59), Saudi Arabia (60), Sweden(61, 62), Thailand (63) and the United Kingdom (64).
When investigating the association between diet and the development ofdental caries it is more appropriate to use a longitudinal study design inwhich sugars consumption habits over time are related to changes in dentalcaries experience. Such studies have shown a significant relationshipbetween caries development and sugars intake (65--67). In a comprehensivestudy of over 400 children in England aged 11---12 years, a small butsignificant relationshipwas foundbetween intake of total sugars and cariesincrement over 2 years (r=+0.2) (67). TheMichigan Study in theUnitedStates investigated the relationship between sugars intake anddental cariesincrement over 3 years in children initially aged 10---15 years (66). A weakrelationship was found between the amount of dietary sugars consumedand dental caries experience.
111

In a review of longitudinal studies, Marthaler (68) analysed therelationship between dietary sugars and caries activity in countrieswhere the availability of sugars is high and theuse of fluoride is extensive.He concluded that in modern societies that make use of prevention, therelationship between sugars consumption and dental caries was stillevident (68). He also concluded that many older studies had failed toshow a relationship between sugars intake and development of dentalcaries because they were of poormethodological design, used unsuitablemethods of dietary analysis or were of insufficient power (68).Correlations between individuals’ sugars consumption and dental cariesincrements may be weak if the range of sugars intake in the studypopulation is small. That is to say, that if all people within a populationare exposed to the disease risk factor, the relationship between the riskfactor and the disease will not be apparent (69).
Frequencyandamountof sugars consumption.Several studies, including theabove-mentioned Vipeholm study in Sweden, have indicated that cariesexperience increasesmarkedlywhen the frequencyof sugars intakeexceedsfour times a day (50, 70--72). The importance of frequency versus the totalamount of sugars is difficult to evaluate as the two variables are hard todistinguish from each other. Data from animal studies have indicated theimportance of frequency of sugars intake in the development of dentalcaries (73, 74). Some human studies have also shown that the frequency ofsugars intake is an important etiological factor for caries development(75).Many studies have related the frequencyof intakeof sugarsor sugars-rich food to caries development but have not simultaneously investigatedthe relationship between amount of sugars consumed and dental caries,and therefore no conclusion regarding the relative importanceof these twovariables can be drawn from these studies (76--78).
Animal studies have also showna relationshipbetweenamountof sugarsconsumed and the development of dental caries (79--82). Severallongitudinal studies in humans have indicated that the amount of sugarsconsumed is more important than the frequency (66, 67, 83, 84), whileJamel et al. (85) found that both the frequency and the amount of sugarsintake are important.
The strong correlationbetweenboth the amount and frequencyof sugarsconsumption has been demonstrated by several investigators in differentcountries (67, 86--88). It is therefore highly likely that, in terms of cariesdevelopment, both variables are potentially important.
Relative cariogenicityof different sugarsand foodconsistency.Therelativeacidogenicity of different monosaccharides and disaccharides has beeninvestigated in plaque pH studies, which have shown that lactose is lessacidogenic than other sugars (89). Animal studies have provided no clear
112

evidence that, with the exception of lactose, the cariogenicity ofmonosaccharides and disaccharides differs. The above-mentioned studyin Turku, Finland, found no difference in caries development betweensubjects on diets sweetenedwith sucrose comparedwith thosewhose diethad been sweetened with fructose (51). Invert sugar (50% fructose +50% glucose) is less cariogenic than sucrose (90).
The adhesiveness or stickiness of a food is not necessarily related toeither oral retention time or cariogenic potential. For example,consumption of sugars-containing drinks (i.e. non-sticky) is associatedwith increased risk of dental caries (85, 88)
Potential impact of sugars reduction on other dietary components. It isimportant to consider the potential impact of a reduction in free sugars onother components of the diet. Simple, cross-sectional analysis of dietarydata from populations has shown an inverse relationship between theintake of free sugars and the intake of fat (91), suggesting that reducingfree sugars might lead to an increase in fat intake. There is, however, agrowing body of evidence from studies over time that shows that changesin intake of fat and free sugars are not inversely related, and thatreductions in intake of fat are offset by increases in intakes of starch ratherthan free sugars (92, 93). Cole-Hamilton et al. (94) found that the intake ofboth fat and added sugars simultaneously decreased as fibre intakeincreased. Overall dietary goals that promote increased intake ofwholegrain staple foods, fruits and vegetables and a reduced consumptionof free sugars are thus unlikely to lead to an increased consumption of fat.
Influence of fluoride.Fluoride undoubtedly protects against dental caries(95). The inverse relationship between fluoride in drinking-water anddental caries, for instance, is well established. Fluoride reduces caries inchildren by between 20% and 40%, but does not eliminate dental cariesaltogether.
Over 800 controlled trials of the effect of fluoride administration ondental caries have been conducted; collectively these studies demonstratethat fluoride is the most effective preventive agent against caries (95).Several studies have that indicated that a relationship between sugarsintake and caries still exists in the presence of adequate fluoride exposure(33, 71, 96, 97). In two major longitudinal studies in children, theobserved relationships between sugars intake and development of dentalcaries remained even after controlling for use of fluoride and oralhygiene practices (66, 67). As mentioned earlier, following a review ofavailable longitudinal studies,Marthaler (68) concluded that, evenwhenpreventive measures such as use of fluoride are employed, a relationshipbetween sugars intake and caries still exists. He also stated that inindustrialized countries where there is adequate exposure to fluoride, no
113

further reduction in the prevalence and severity of dental caries will beachieved unless the intake of sugars is reduced.
A recent systematic review that investigated the importance of sugarsintake in caries etiology in populations exposed to fluoride concludedthat where there is adequate exposure to fluoride, sugars consumption isa moderate risk factor for caries in most people; moreover sugarsconsumption is likely to be amore powerful indicator for risk of caries inpersons who do not have regular exposure to fluoride. Thus, restrictingsugars consumption still has a role to play in the prevention of caries insituations where there is widespread use of fluoride but this role is not asstrong as it is without exposure to fluoride (98). Despite the indisputablepreventive role of fluoride, there is no strong evidence of a clearrelationship between oral cleanliness and levels of dental caries (99--100).
Excess ingestion of fluoride during enamel formation can lead to dentalfluorosis. This condition is observed particularly in countries that havehigh levels of fluoride in water supplies (95).
Starches and dental caries
Epidemiological studies have shown that starch is of low risk to dentalcaries. People who consume high-starch/low-sugars diets generally havelow levels of caries, whereas people who consume low-starch/high-sugars diets have high levels of caries (39, 48, 49, 51, 67, 101, 102). InNorway and Japan the intake of starch increased during the SecondWorld War, yet the occurrence of caries was reduced.
The heterogeneous nature of starch (i.e. degree of refinement, botanicalorigin, raw or cooked) is of particular relevance when assessing itspotential cariogenicity. Several types of experiment have shown that rawstarch is of low cariogenicity (103--105). Cooked starch is about one-third to one-half as cariogenic as sucrose (106, 107). Mixtures of starchand sucrose are, however, potentially more cariogenic than starch alone(108). Plaque pH studies, using an indwelling oral electrode, have shownstarch-containing foods reduce plaque pH to below 5.5, but starches areless acidogenic than sucrose. Plaque pH studiesmeasure acid productionfrom a substrate rather than caries development, and take no account ofthe protective factors found in some starch-containing foods or of theeffect of foods on stimulation of salivary flow.
Glucose polymers and pre-biotics are increasingly being added to foods inindustrialized countries. Evidence on the cariogenicity of these carbohy-drates is sparse and comes from animal studies, plaque pH studies andstudies in vitro which suggest that maltodextrins and glucose syrups arecariogenic (109--111). Plaque pH studies and experiments in vitro suggestthat isomalto-oligosaccharides and gluco-oligosaccharides may be less
114

acidogenic than sucrose (112--114). There is, however, evidence thatfructo-oligosaccharides are as acidogenic as sucrose (115, 116).
Fruit and dental caries
As habitually consumed, there is little evidence to show that fruit is animportant factor in the development of dental caries (67, 117--119). Anumber of plaque pH studies have found fruit to be acidogenic, althoughless so than sucrose (120--122). Animal studies have shown that whenfruit is consumed in very high frequencies (e.g. 17 times a day) it mayinduce caries (123, 124), but less so than sucrose. In the onlyepidemiological study in which an association between fruit consump-tion and DMFT was found (125), fruit intakes were very high (e.g. 8apples or 3 bunches of grapes per day) and the higher DMFT in fruitfarm workers compared with grain farm workers arose solely fromdifferences in the numbers of missing teeth.
Dietary factors which protect against dental caries
Some dietary components protect against dental caries. The cariostaticnature of cheese has been demonstrated in several experimental studies(126, 127), and in human observational studies (67) and interventionstudies (128). Cow’smilk contains calcium, phosphorus and casein, all ofwhich are thought to inhibit caries. Several studies have shown that thefall in plaque pH following milk consumption is negligible (129, 130).The cariostatic nature of milk has been demonstrated in animal studies(131, 132). Rugg-Gunn et al. (67) found an inverse relationship betweenthe consumptionofmilk and caries increment in a studyof adolescents inEngland. Wholegrain foods have protective properties; they requiremoremastication thereby stimulating increased saliva flow. Other foodsthat are good gustatory and/or mechanical stimulants to salivary flowinclude peanuts, hard cheeses and chewing gum. Both organic andinorganic phosphates (found in unrefined plant foods) have been foundto be cariostatic in animal studies, but studies in humans have producedinconclusive results (133, 134). Both animal studies and experimentalinvestigations in humans have shown that black tea extract increasesplaque fluoride concentration and reduces the cariogenicity of a sugars-rich diet (135, 136).
Breastfeeding and dental caries
In line with the positive health effects of breastfeeding, epidemiologicalstudies have associated breastfeeding with low levels of dental caries(137, 138). A few specific case studies have linked prolonged ad libitumand nocturnal breastfeeding to early childhood caries. Breastfeeding hasthe advantage that it does not necessitate the use of a feeder bottle, whichhas been associated with early childhood caries. A breastfed infant will
115

also receive milk of a controlled composition to which additional freesugars have not been added. There are no benefits to dental health offeeding using a formula feed.
Dental erosion
Dental erosion is the progressive irreversible loss of dental hard tissuethat is chemically etched away from the tooth surface by extrinsic and/orintrinsic acids by a process that does not involve bacteria. Extrinsicdietary acids include citric acid, phosphoric acid, ascorbic acid, malicacid, tartaricacidandcarbonicacid found, for example, in fruits and fruitjuices, soft drinks andvinegar.Erosion in severe cases leads to total toothdestruction (139). Human observational studies have shown anassociation between dental erosion and the consumption of a numberof acidic foods anddrinks, including frequent consumption of fruit juice,soft drinks (including sports drinks), pickles (containing vinegar), citrusfruits and berries (140--144). Age-related increases in dental erosion havebeen shown to be greater in those with the highest intake of soft drinks(20). Experimental clinical studies have shown that consumption of, orrinsingwith, acidicbeverages significantly lowers thepHof theoral fluids(121).Enamel is softenedwithinonehourof exposure tocolabut thismaybe reversed by exposure tomilk or cheese (145, 146). Animal studies haveshown that fruit and soft drinks cause erosion (124, 147), although fruitjuices are significantly more destructive than whole fruits (148, 149).
5.6.4 Strength of evidence
The strength of the evidence linking dietary sugars to the risk of dentalcaries is in the multiplicity of the studies rather than the power of anyindividual study. Strong evidence is provided by the intervention studies(50, 51) but the weakness of these studies is that they were conducted inthe pre-fluoride era. More recent studies also show an associationbetween sugars intake and dental caries albeit not as strong as in the pre-fluoride era. However, in many developing countries people are not yetexposed to the benefits of fluoride.
Cross-sectional studies should be interpreted with caution because dentalcaries develop over time and therefore simultaneous measurements ofdisease levels and dietmay not give a true reflection of the role of diet in thedevelopment of the disease. It is the diet several years earlier that may beresponsible for current caries levels. Longitudinal studies (66, 67) that havemonitored a change in caries experience and related this to dietary factorsprovide stronger evidence. Such studies have been conducted on popula-tions with an overall high sugars intake but a low interindividual variation;this may account for the weak associations that have been reported.
The studies that overcome the problemof lowvariation in consumption ofsugars are studies that have monitored dental caries following a marked
116

change in diet, for example, those conducted on populations during theSecond World War and studies of populations before and after theintroduction of sugars into the diet. Such studies have shown clearly thatchanges in dental cariesmirror changes in economic growth and increasedconsumption of free sugars. Sometimes changes in sugars consumptionwere accompanied by an increase in other refined carbohydrates. Thereare, however, examples where sugars consumption decreased and starchconsumption increased yet levels of dental caries declined.
Strong evidence of the relationship between sugar availability anddentalcaries levels comes from worldwide ecological studies (26, 28). Thelimitations of these studies are that they use data on sugar availabilityand not actual intake, they do not measure frequency of sugars intake,and they assume that level of intake is equal throughout the population.Also, the values are for sucrose, yetmany countries obtain a considerableamount of their total sugars from other sugars. These studies have onlyconsidered DMFT of 12-year-olds, not always from a representativesample of the population.
Caution needs to be applied when extrapolating the results of animalstudies to humans because of differences in tooth morphology, plaquebacterial ecology, salivary flow and composition, and the form in whichthe diet is provided (usually powdered form in animal experiments).Nonetheless, animal studies have enabled the effect on caries of definedtypes, frequencies and amounts of carbohydrates to be studied.
Plaque pH studies measure plaque acid production, but the acidogeni-city of a foodstuff cannot be taken as a direct measurement of itscariogenic potential. Plaque pH studies take no account of protectivefactors in foods, salivary flow and the effects of other components of thediet. Many of the plaque pH studies that show falls in pH below thecritical value of 5.5 with fruits and cooked starchy foods have beenconducted using the indwelling electrode technique. This electrode isrecognized as being hypersensitive and non-discriminating, tending togive an ‘‘all or nothing’’ response to all carbohydrates (150).
Research has consistently shown that when annual sugar consumptionexceeds 15 kg per person per year (or 40 g per person per day) dentalcaries increase with increasing sugar intake.When sugar consumption isbelow 10 kg per person per year (around 27 g per person per day), levelsof dental caries are very low (26, 28, 29, 51, 151--158). Exposure tofluoride (i.e. where the proportion of fluoride in drinking-water is 0.7--1.0 ppm, or where over 90% of toothpastes available contain fluoride)increases the safe level of sugars consumption.
Tables 14--17 summarize the evidence relating to diet, nutrition anddental diseases.
117

Table 14Summary of strength of evidence linking diet to dental caries
Evidence Decreased risk No relationship Increased risk
Convincing Fluoride exposure
(local and
systematic)
Starch intake (cooked and raw
starch foods, such as rice,
potatoes and bread; excludes
cakes, biscuits and snacks
with added sugars)
Amount of free sugars
Frequency of free sugars
Probable Hard cheese
Sugars-free
chewing gum
Whole fresh fruit
Possible Xylitol
Milk
Dietary fibre
Undernutrition
Insufficient Whole fresh fruit Dried fruits
Table 15Summary of strength of evidence linking diet to dental erosion
Evidence Decreased risk No relationship Increased risk
Convincing
Probable Soft drinks and fruit juices
Possible Hard cheese
Fluoride
Insufficient Whole fresh fruit
Table 16Summary of strength of evidence linking diet to enamel developmental defects
Evidence Decreased risk No relationship Increased risk
Convincing Vitamin D Excess fluoride
Probable Hypocalcaemia
Table 17Summary of strength of evidence linking diet to periodontal disease
Evidence Decreased risk No relationship Increased risk
Convincing Good oral hygiene Deficiency of vitamin C
Probable
Possible Undernutrition
Insufficient Antioxidant nutrients Vitamin E supplementation Sucrose
118

5.6.5 Disease-specific recommendations
It is important to set a recommended maximum level for theconsumption of free sugars; a low free sugars consumption by apopulation will translate into a low level of dental caries. Populationgoals enable the oral health risks of populations to be assessed andhealthpromotion goals monitored.
The best available evidence indicates that the level of dental caries is lowin countries where the consumption of free sugars is below 15--20 kg perperson per year. This is equivalent to a daily intake of 40--55 g per personand the values equate to 6--10% of energy intake. It is of particularimportance that countries which currently have low consumption of freesugars (<15--20 kg per person per year) do not increase consumptionlevels. For countries with high consumption levels it is recommendedthat national health authorities and decision-makers formulate country-specific and community-specific goals for reduction in the amountof freesugars, aiming towards the recommended maximum of no more than10% of energy intake.
In addition to population targets given in terms of the amount of freesugars, targets for the frequency of free sugars consumption are alsoimportant. The frequency of consumption of foods and/or drinkscontaining free sugars should be limited to a maximum of four times perday.
Many countries that are currently undergoingnutrition transitiondonothave adequate exposure to fluoride. There should be promotion ofadequate fluoride exposure via appropriate vehicles, for example,affordable toothpaste, water, salt and milk. It is the responsibility ofnational health authorities to ensure implementation of feasible fluorideprogrammes for their country. Research into the outcome of alternativecommunity fluoride programmes should be encouraged.
In order to minimize the occurrence of dental erosion, the amount andfrequency of intake of soft drinks and juices should be limited.Elimination of undernutrition prevents enamel hypoplasia and theother potential effects of undernutrition on oral health (e.g. salivarygland atrophy, periodontal disease, oral infectious diseases).
References
1. Sheiham A. Dietary effects on dental diseases. Public Health Nutrition, 2001,4:569--591.
2. KellyMet al.Adult dental health survey: oral health in theUnitedKingdom1998.London, The Stationery Office, 2000.
3. Chen M et al. Comparing oral health systems: a second internationalcollaborative study. Geneva, World Health Organization, 1997.
119

4. Steele JG et al. National Diet and Nutrition Survey: people aged 65 years andover. Vol. 2. Report of the oral health survey. London, The Stationery Office,1998.
5. Joshipura KJ,Willett WC, Douglass CW. The impact of edentulousness on foodand nutrient intake. Journal of the American Dental Association, 1996,127:459--467.
6. Moynihan PJ et al. Intake of non-starch polysaccharide (dietary fibre) inedentulous anddentatepersons: an observational study.BritishDental Journal,1994, 177:243--247.
7. Global Oral Health Data Bank. Geneva, World Health Organization, 2001.
8. Fejerskov O, Baelum V.Changes in prevalence and incidence of themajor oraldiseases. In: Guggenheim B, Shapiro H, eds. Oral biology at the turn of thecentury. Truth, misconcepts and challenges. Zurich, Karger, 1998:1--9.
9. Pitts NB, Evans DJ. The dental caries experience of 5-year-old children inthe United Kingdom. Surveys coordinated by the British Association for theStudy of Community Dentistry in 1995/96. Community Dental Health, 1997,14:47--52.
10. Poulsen S. Dental caries in Danish children and adolescents 1988--94.Community Dentistry and Oral Epidemiology, 1996, 24:282--285.
11. Frencken JE, Kalsbeek H, Verrips GH. Has the decline in dental cariesbeen halted? Changes in caries prevalence amongst 6- and 12-year-oldchildren in Friesland, 1973--1988. International Dental Journal, 1990,40:225--230.
12. Marthaler TM,O’MullaneDM,VrbicV. Theprevalence of dental caries in Europe1990--1995. ORCA Saturday Afternoon Symposium 1995. Caries Research,1996, 30:237--255.
13. LeousP,PetersenPE.Oral health status andoral health behaviour of children inBelarus. Copenhagen, WHO Regional Office for Europe, 2000.
14. Szoke J, Petersen PE. Evidence of dental caries decline among children inan East European country (Hungary). Community Dentistry and OralEpidemiology, 2000, 28:155--160.
15. Petersen PE, Rusu M. Oral health status of children in Romania, 2000.Copenhagen, WHO Regional Office for Europe, 2001.
16. KuzminaEM.Oral health status of childrenandadults in theRussianFederation.Moscow, Ministry of Health and WHO Collaborating Centre for PreventiveOral Care, 1999.
17. O’Mullane DM, ed.Oral health systems in European Union Countries --- Biomedproject. Cork, University of Cork, 1996.
18. Wang HY et al. The second national survey of oral health status of children andadults in China. International Dental Journal, 2002, 52:283--290.
19. PetersenPE,KakaM.Oral health status of children andadults in theRepublic ofNiger, Africa. International Dental Journal, 1999, 49:159--164.
20. Walker A et al. National Diet and Nutrition Survey: young people aged 4 to18 years. Vol. 2. Report of the oral health survey. London, The StationeryOffice, 2000.
21. Rugg-Gunn AJ. Nutrition and dental health. Oxford, Oxford MedicalPublications, 1993.
120

22. Enwonwu CO. Interface of malnutrition and periodontal diseases. AmericanJournal of Clinical Nutrition, 1995, 61(Suppl.):430--436.
23. Enwonwu CO, Phillips RS, Falkler WA. Nutrition and oral infectious diseases:state of the science. Compendium of Continuing Education in Dentistry,2002, 23:431--436.
24. Arens U, ed. Oral health --- diet and other factors: the Report of the BritishNutrition Foundation’s Task Force. Amsterdam, Elsevier Science PublishingCompany, 1999.
25. Arends J, ten Bosch JJ. In vivo de- and remineralisation of dental enamel.In: Leach SA, ed. Factors relating to demineralisation and remineralisation ofthe teeth. Oxford, IRL Press, 1986:1--11.
26. Sreebny LM. Sugar availability, sugar consumption and dental caries.Community Dentistry and Oral Epidemiology, 1982, 10:1--7.
27. Sreebny LM. Sugar and human dental caries. World Review of Nutrition andDietetics, 1982, 40:19--65.
28. WoodwardM,Walker AR.Sugar consumption anddental caries: evidence from90 countries. British Dental Journal, 1994, 176:297--302.
29. Miyazaki H, Morimoto M. Changes in caries prevalence in Japan. EuropeanJournal of Oral Sciences, 1996, 104:452--458.
30. Marthaler TM. Epidemiological andclinical dental findings in relation to intake ofcarbohydrates. Caries Research, 1967, 1:222--238.
31. Takeuchi M. Epidemiological study on dental caries in Japanese childrenbefore, during and after World War II. International Dental Journal, 1961,11:443--457.
32. Sognnaes RF. Analysis of wartime reduction of dental caries in Europeanchildren. American Journal of Diseases of Childhood, 1948, 75:792--821.
33. Weaver R. Fluorine and wartime diet. British Dental Journal, 1950,88:231--239.
34. BangG,KristoffersenT.Dental caries anddiet in anAlaskanEskimopopulation.Scandinavian Journal of Dental Research, 1972, 80:440--444.
35. OlssonB.Dental health situation inprivilegedchildren inAddisAbaba, Ethiopia.Community Dentistry and Oral Epidemiology, 1979, 7:37--41.
36. MacGregor AB. Increasing caries incidence and changing diet in Ghana.International Dental Journal, 1963, 13:516--522.
37. Sheiham A. The prevalence of dental caries in Nigerian populations. BritishDental Journal, 1967, 123:144--148.
38. Emslie RD. A dental health survey in the Republic of the Sudan. British DentalJournal, 1966, 120:167--178.
39. Fisher FJ. A field study of dental caries, periodontal disease and enameldefects in Tristan da Cunha. British Dental Journal, 1968, 125:447--453.
40. Roberts IF, Roberts GJ. Relation between medicines sweetened with sucroseand dental disease. British Medical Journal, 1979, 2:14--16.
41. Masalin K, Murtamaa H, Meurman JH. Oral health of workers in the modernFinnish confectionery industry. Community Dentistry and Oral Epidemiology,1990, 18:126--130.
121

42. Petersen PE. Dental health among workers at a Danish chocolate factory.Community Dentistry and Oral Epidemiology, 1983, 11:337--341.
43. Katayama T et al. Incidence and distribution of Strep mutans in plaque fromconfectionery workers. Journal of Dental Research, 1979, 58:2251.
44. Anaise JZ. Prevalence of dental caries among workers in the sweets industry inIsrael. Community Dentistry and Oral Epidemiology, 1978, 6:286--289.
45. Bradford EW, Crabb HSM. Carbohydrates and the incidence of caries in thedeciduous dentition. In: Hardwick JL, Dustin A, Held HR, eds. Advancesin fluoride research and dental caries prevention. London, Pergamon,1963:319--323.
46. Bradford EW, Crabb HSM. Carbohydrate restriction and caries incidence: apilot study. British Dental Journal, 1961, 111:273--279.
47. SilversteinSJet al.Dental cariesprevalence in childrenwith adiet freeof refinedsugar. American Journal of Public Health, 1983, 73:1196--1199.
48. Harris R. Biology of the children of Hopewood House, Bowral, Australia.IV.Observations ondental caries experienceextendingover 5 years (1957--61).Journal of Dental Research, 1963, 42:1387--1399.
49. Newbrun E et al. Comparison of dietary habits and dental health of subjectswith hereditary fructose intolerance and control subjects. Journal of theAmerican Dental Association, 1980, 101:619--626.
50. Gustafsson BE et al. The Vipeholm dental caries study. The effect of differentlevels of carbohydrate intake on caries activity in 436 individuals observed for5 years. Acta Odontologica Scandinavica, 1954, 11:232--364.
51. Scheinin A, Makinen KK, Ylitalo K. Turku sugar studies. V. Final report onthe effect of sucrose, fructose and xylitol diets on the caries incidence in man.Acta Odontologica Scandinavica, 1976, 34:179--198.
52. Garn SM et al. Relationships between sugar-foods and DMFT in 1968--1970.Ecology of Food and Nutrition, 1980, 9:135--138.
53. Granath LE et al. Variation in caries prevalence related to combinations ofdietary and oral hygiene habits and chewing fluoride tablets in 4-year-oldchildren. Caries Research, 1978, 12:83--92.
54. Schroder U, Granath LE.Dietary habits and oral hygiene as predictors of cariesin 3-year-old children. Community Dentistry and Oral Epidemiology, 1983,11:308--311.
55. HausenH,HeinonenOP,Paunio I.Modificationof occurrenceof caries inchildrenby toothbrushing and sugar exposure in fluoridated and non-fluoridated area.Community Dentistry and Oral Epidemiology, 1981, 9:103--107.
56. Peng B et al. Oral health status and oral health behaviour of 12-year-old urbanschoolchildren in the People’s Republic of China. Community Dental Health,1997, 14:238--244.
57. Petersen PE. Oral health behaviour of 6-year-old Danish children. ActaOdontologica Scandinavica, 1992, 50:57--64.
58. Petersen PE, Razanamihaja N. Oral health status of children and adults inMadagascar. International Dental Journal, 1996, 46:41--47.
59. Petersen PE et al. Dental caries and dental health behaviour situation among6- and 12-year-old urban schoolchildren in Madagascar. African DentalJournal, 1991, 5:1--7.
122

60. Al-Tamimi S, Petersen PE. Oral health situation of schoolchildren, mothersand schoolteachers in Saudi Arabia. International Dental Journal, 1998,48:180--186.
61. Persson LA et al. Infant feeding and dental caries --- a longitudinal study ofSwedish children. Swedish Dental Journal, 1985, 9:201--206.
62. Stecksen-BlicksC,HolmAK. Dental caries, tooth trauma,malocclusion, fluorideusage, toothbrushing and dietary habits in 4-year-old Swedish children:changes between 1967 and 1992. International Journal of Paediatric Dentistry,1995, 5:143--148.
63. Petersen PE et al. Oral health status and oral health behaviour of urban andrural schoolchildren in Southern Thailand. International Dental Journal, 2001,51:95--102.
64. Hinds K, Gregory J. National Diet and Nutrition Survey: children aged 1.5--4.5years. Vol. 2. Report of the dental survey. London, Her Majesty’s StationeryOffice, 1995.
65. Stecksen-Blicks C, Gustafsson L. Impact of oral hygiene and use of fluorides oncaries increment in children during one year. Community Dentistry and OralEpidemiology, 1986,14:185--189.
66. Burt BA et al. The effects of sugars intake and frequency of ingestion ondental caries increment in a three-year longitudinal study. Journal of DentalResearch, 1988, 67:1422--1429.
67. Rugg-Gunn AJ et al. Relationship between dietary habits and caries incrementassessed over two years in 405 English adolescent schoolchildren. Archivesof Oral Biology, 1984, 29:983--992.
68. Marthaler T. Changes in the prevalence of dental caries: how much can beattributed to changes in diet? Caries Research, 1990, 24(Suppl.):3--15.
69. Rose G. The strategy of preventive medicine. Oxford, Oxford UniversityPress, 1993.
70. Holbrook WP et al. Longitudinal study of caries, cariogenic bacteria and diet inchildren just before and after starting school. European Journal of OralSciences, 1995, 103:42--45.
71. Holt RD. Foods and drinks at four daily time intervals in a group of youngchildren. British Dental Journal, 1991, 170:137--143.
72. HolbrookWP et al.Caries prevalence, Streptococcus mutans and sugar intakeamong 4-year-old urban children in Iceland. Community Dentistry and OralEpidemiology, 1989, 17:292--295.
73. Firestone AR, Schmid R, Muhlemann HR. Effect of the length and numberof intervals between meals on caries in rats. Caries Research, 1984,18:128--133.
74. Konig KG, Schmid P, Schmid R. An apparatus for frequency-controlled feedingof small rodents and its use in dental caries experiments. Archives of OralBiology, 1968, 13:13--26.
75. Karlsbeek H, Verrips GH.Consumption of sweet snacks and caries experienceof primary school children. Caries Research, 1994, 28:477--483.
76. Sundin B, Granath L, Birkhed D. Variation of posterior approximal cariesincidence with consumption of sweets with regard to other caries-related
123
factors in 15--18-year-olds.Community Dentistry and Oral Epidemiology, 1992,20:76--80.
77. Bjarnason S, Finnbogason SY, Noren JG. Sugar consumption and cariesexperience in 12- and 13-year-old Icelandic children. Acta OdontologicaScandinavica, 1989, 47:315--321.
78. Hankin JH, Chung CS, Kau MC. Genetic and epidemiological studies of oralcharacteristics in Hawaii’s school children: dietary patterns and cariesprevalence. Journal of Dental Research, 1973, 52:1079--1086.
79. Hefti A, Schmid R. Effect on caries incidence in rats of increasing dietarysucrose levels. Caries Research, 1979, 13:298--300.
80. Mikx FH et al. Effect of Actinomyces viscosus on the establishment andsymbiosis of Streptococcus mutans and Streptococcus sanguis on SPF rats ondifferent sucrose diets. Caries Research, 1975, 9:1--20.
81. Guggenheim B et al. The cariogenicity of different dietary carbohydrates testedon rats in relative gnotobiosis with a Streptococcus producing extracellularpolysaccharide. Helvetica Odontologica Acta, 1966, 10:101--113.
82. GustafssonGet al.Experimental dental caries in golden hamsters.OdontolgiskTidskrift, 1953, 61:386--399.
83. Szpunar SM, Eklund SA, Burt BA. Sugar consumption and caries risk inschoolchildren with low caries experience. Community Dentistry and OralEpidemiology, 1995, 23:142--146.
84. Kleemola-Kujala E, Rasanen L. Relationship of oral hygiene and sugarconsumption to risk of caries in children. Community Dentistry and OralEpidemiology, 1982, 10:224--233.
85. Jamel HA et al. Sweet preference, consumption of sweet tea and dental caries:studies in urban and rural Iraqi populations. International Dental Journal, 1997,47:213--217.
86. Rodrigues C, Watt RG, Sheiham A. The effects of dietary guidelines on sugarintake and dental caries in 3-year-olds attending nurseries. Health PromotionInternational, 1999, 14:329--335.
87. Cleaton-Jones P et al. Dental caries and sucrose intake in five South Africanpre-school groups. Community Dentistry and Oral Epidemiology, 1984,12:381--385.
88. Ismail AI, Burt BA, Eklund SA. The cariogenicity of soft drinks in the UnitedStates. Journal of the American Dental Association, 1984, 109:241--245.
89. Jenkins GN, Ferguson DB.Milk and dental caries. British Dental Journal, 1966,120:472--477.
90. Frostell G et al. Effect of partial substitution of invert sugar for sucrose incombination with Duraphat treatment on caries development in pre-schoolchildren: the Malmo Study. Caries Research, 1991, 25:304--310.
91. Gibney M et al. Consumption of sugars. American Journal of Clinical Nutrition,1995, 62(Suppl.1):178--194 (erratum appears in American Journal of ClinicalNutrition, 1997, 65:1572--1574).
92. Alexy U, Sichert-Hellert W, Kersting M. Fifteen-year time trends in energy andmacronutrient intake in German children and adolescents: results of theDONALD study. British Journal of Nutrition, 2002, 87:595--604.
124

93. FletcherES,AdamsonAJ,Rugg-GunnAJ.Twenty years of change in thedietaryintake and BMI of Northumbrian adolescents. Proceedings of the NutritionSociety, 2001, 60:171A--237A.
94. Cole-Hamilton I et al. A study among dietitians and adult members of theirhouseholds of the practicalities and implications of following proposeddietary guidelines for the UK. British Dietetic Association Community NutritionGroup Nutrition Guidelines Project. Human Nutrition --- Applied Nutrition, 1986,40:365--389.
95. Fluorides and oral health. Report of a WHO Expert Committee on Oral HealthStatus and Fluoride Use. Geneva, World Health Organization, 1994 (WHOTechnical Report Series, No. 846).
96. Kunzel W, Fischer T. Rise and fall of caries prevalence in German townswith different F concentrations in drinking water. Caries Research, 1997,31:166--173.
97. Beighton D, Adamson A, Rugg-Gunn A. Associations between dietary intake,dental caries experience and salivary bacterial levels in 12-year-old Englishschoolchildren. Archives of Oral Biology, 1996, 41:271--280.
98. Burt BA, Pai S.Sugar consumption and caries risk: a systematic review. Journalof Dental Education, 2001, 65: 1017--1023.
99. Sutcliffe P.Oral cleanliness and dental caries. In: Murray JJ, ed. The preventionof oral disease. Oxford, Oxford University Press, 1996:68--77.
100. Bellini HT, Arneberg P, von der Fehr FR. Oral hygiene and caries. A review.Acta Odontologica Scandinavica, 1981, 39:257--265.
101. Russell AL et al. Dental surveys in relation to nutrition. Public Health Reports,1960, 75:717--723.
102. Afonsky D. Some observations on dental caries in central China. Journal ofDental Research, 1951, 30:53--61.
103. Brudevold F et al. Intraoral demineralisation and maltose clearance from wheatstarch. Caries Research, 1985, 19:136--144.
104. Grenby TH. Effects of starch and sugar diets on dental caries. A comparisonof two different methods of assessing caries in rodents. British DentalJournal, 1970, 128:575--578.
105. Grenby TH. The effects of some carbohydrates on experimental dental cariesin the rat. Archives of Oral Biology, 1963, 8:27--30.
106. BowenWH et al. Amethod to assess cariogenic potential of foodstuffs. Journalof the American Dental Association, 1980, 100:677--681.
107. KoulouridesTet al.Cariogenicity of ninesugars testedwith an intraoral device inman. Caries Research, 1976, 10:427--441.
108. Firestone AR, Schmid R, Muhlemann HR. Cariogenic effects of cookedwheat starch alone or with sucrose and frequency-controlled feeding in rats.Archives of Oral Biology, 1982, 27:759--763.
109. Grenby TH, Mistry M. Properties of maltodextrins and glucose syrups inexperiments in vitro and in the diets of laboratory animals, relating to dentalhealth. British Journal of Nutrition, 2000, 84:565--574.
110. MoynihanPJ et al.Effect of glucosepolymers inwater,milk and amilk substituteon plaque pH in vitro. International Journal of Paediatric Dentistry, 1996,6:19--24.
125

111. Grenby TH. The effect of glucose syrup on dental caries in the rat. CariesResearch, 1972, 6:52--69.
112. Koga T et al. Effects of panose on glucan synthesis and cellular adherenceby Streptococcus mutans. Microbiology and Immunology, 1988,32:25--31.
113. Ooshima T et al. The caries inhibitory effect of GOS-sugar in vitro and ratexperiments. Microbiology and Immunology, 1988, 32:1093--1105.
114. Roberts KR, Hayes ML. Effects of 2-deoxy-D-glucose and other sugaranalogues on acid production from sugars by human dental plaque bacteria.Scandinavian Journal of Dental Research, 1980, 88:201--209.
115. Moynihan PJ et al. Acidogenic potential of fructo-oligosaccharides: incubationstudies and plaque pH studies. Caries Research, 2001, 35:265--316.
116. Hartemink R et al. Degradation and fermentation of fructo-oligosaccharidesby oral streptococci. Journal of Applied Bacteriology, 1995,79:551--557.
117. Clancy KL et al. Snack food intake of adolescents and caries development.Journal of Dental Research, 1977, 56:568--573.
118. MartinssonT.Socio-economic investigation of school childrenwith highand lowcaries frequency. 3. A dietary study based on information given by the children.Odontologisk Revy, 1972, 23:93--113.
119. Savara BS, Suher T.Dental caries in children one to six years of age as relatedto socio-economic level, food habits and toothbrushing. Journal of DentalResearch, 1955, 34:870--875.
120. Hussein I, PollardMA,CurzonME.Acomparison of the effects of someextrinsicand intrinsic sugars on dental plaque pH. International Journal of PaediatricDentistry, 1996, 6:81--86.
121. Imfeld TN. Identification of low caries risk dietary components. Zurich, Karger,1983 (Monographs in Oral Science, Vol. 11).
122. Ludwig TG, Bibby BG. Acid production from different carbohydrate foods inplaque and saliva. Journal of Dental Research, 1957, 36:56--60.
123. Imfeld T et al. Cariogenicity of Milchschnitte (Ferrero-GmbH) and apple inprogram-fed rats. Caries Research, 1991, 25:352--358.
124. Stephan RM. Effects of different types of human foods on dental health inexperimental animals. Journal of Dental Research, 1966, 45:1551--1561.
125. Grobler SR, Blignaut JB. The effect of a high consumption of apples or grapeson dental caries and periodontal disease in humans. Clinical PreventiveDentistry, 1989,11:8--12.
126. MoynihanPJ, Ferrier S, JenkinsGN.Thecariostatic potential of cheese: cookedcheese-containing meals increase plaque calcium concentration. BritishDental Journal, 1999, 187:664--667.
127. Rugg-Gunn AJ et al. The effect of different meal patterns upon plaque pH inhuman subjects. British Dental Journal, 1975, 139:351--356.
128. Gedalia I et al. Dental caries protection with hard cheese consumption.American Journal of Dentistry, 1994, 7:331--332.
129. Rugg-Gunn AJ, Roberts GJ, Wright WG. Effect of human milk on plaque pH insitu and enamel dissolution in vitro compared with bovine milk, lactose andsucrose. Caries Research, 1985, 19:327--334.
126

130. Frostell G. Effects of milk, fruit juices and sweetened beverages on the pH ofdental plaques. Acta Odontologica Scandinavica, 1970, 28:609--622.
131. BowenWH et al. Influence of milk, lactose-reduced milk, and lactose on cariesin desalivated rats. Caries Research, 1991, 25:283--286.
132. Reynolds EC, Johnson IH. Effect of milk on caries incidence and bacterialcomposition of dental plaque in the rat. Archives of Oral Biology, 1981,26:445--451.
133. Nizel AE, Harris RS. The effects of phosphates on experimental dental caries:a literature review. Journal of Dental Research, 43(Suppl. 6):1123--1136.
134. Craig GC. The use of a calcium sucrose phosphates--calcium orthophosphatecomplex as a cariostatic agent. British Dental Journal, 1975, 138:25--28.
135. Lingstrom P, Wu CD, Wefel JS. In vivo effects of black tea infusion on dentalplaque. Journal of Dental Research, 2000, 79:594.
136. Linke HAB et al. Effect of black tea on caries formation in hamsters. Journalof Dental Research, 2000, 79:594.
137. Silver DH. A longitudinal study of infant feeding practice, diet and caries,related to social class in children aged 3 and 8--10 years.British Dental Journal,1987, 163:296--300.
138. Holt RD, Joels D, Winter GB.Caries in pre-school children. The Camden study.British Dental Journal, 1982, 153:107--109.
139. Meurman JH, ten Cate JM. Pathogenesis and modifying factors of dentalerosion. European Journal of Oral Sciences, 1996, 104:199--206.
140. Millward A et al. The distribution and severity of tooth wear and therelationship between erosion and dietary constituents in a group of children.International Journal of Paediatric Dentistry, 1994, 4:151--157.
141. Jarvinen VK, Rytomaa II, Heinonen OP. Risk factors in dental erosion. Journalof Dental Research, 1991, 70:942--947.
142. Linkosalo E, Markkanen H. Dental erosions in relation to lactovegetarian diet.Scandinavian Journal of Dental Research, 1985, 93:436--441.
143. Stabholz A et al. Tooth enamel dissolution from erosion or etching andsubsequent caries development. Journal of Pedodontics, 1983, 7:100--108.
144. ThomasAE. Further observations on the influence of citrus fruit juices on humanteeth. New York State Dental Journal, 1957, 23:424--430.
145. Gedalia I et al. Enamel softening with Coca-Cola and rehardening with milk orsaliva. American Journal of Dentistry, 1991, 4:120--122.
146. Gedalia I et al. Tooth enamel softening with a cola type drink and rehardeningwith hardcheeseor stimulated saliva in situ. Journal ofOral Rehabilitation,1991,18:501--506.
147. Holloway PJ, Mellanby M, Stewart RJC. Fruit drinks and tooth erosion. BritishDental Journal, 1958, 104:305--309.
148. Grenby TH, Mistry M, Desai T. Potential dental effects of infants fruit drinksstudied in vitro. British Journal of Nutrition, 1990, 64:273--283.
149. Miller CD. Erosion of molar teeth by acid beverages. Journal of Nutrition, 1950,41:63--71.
150. Edgar WM. Prediction of the cariogenicity of various foods. International DentalJournal, 1985, 35:190--194.
127

151. Ruxton CH, Garceau FJ, Cottrell RC. Guidelines for sugar consumption inEurope. Is a quantitative approach justified? European Journal of ClinicalNutrition, 1999, 53:503--513.
152. Rodrigues CS. Dietary guidelines, sugar intake and caries increment. A studyin Brazilian nursery school children [Thesis]. London, University of London,1997.
153. Sheiham A. Sugars and dental decay. Lancet, 1983, 1:282--284.
154. Buttner.ZuckeraufnahmeundKaries. [Sugar intake and caries.] In: CremerHD,ed. Grundfragen der Ernahrungswissenschaft. [Basics of nutrition.]Freiburg im Breisgau, Rombach, 1971:175--191. [Cited by Marthaler TM.In: Guggenheim B, ed. Health and sugar substitutes. Proceedings of theEuropean Research Group for Oral Biology Conference on Sugar Substitutes,Geneva, Switzerland, 30 October --- 1 November, 1978. Basel, Karger,1979:27--34.]
155. TakeuchiM.On theepidemiological principles indental caries attack.Bulletin ofthe Tokyo Dental College, 1962, 3:96--111.
156. Takahashi K. Statistical study on caries incidence in the first molar in relation tothe amount of sugar consumption. Bulletin of the Tokyo Dental College, 1961,2:44--57.
157. Schulerud A. Dental caries and nutrition during wartime in Norway. Oslo,Fabritius og Snners Trykkeri, 1950.
158. Knowles EM. The effects of enemy occupation on the dental condition ofchildren in theChannel Islands.MonthlyBulletin of theMinistry of Health and thePublic Health Laboratory Service, 1946:161--172.
128

5.7 Recommendations for preventing osteoporosis
5.7.1 Background
Osteoporosis is a disease affecting many millions of people around theworld. It is characterized by low bone mass and micro-architecturaldeterioration of bone tissue, leading to bone fragility and a consequentincrease in risk of fracture (1, 2).
The incidence of vertebral and hip fractures increases exponentially withadvancing age (while that of wrist fractures levels off after the age of60 years) (3). Osteoporosis fractures are a major cause of morbidity anddisability in older people and, in the case of hip fractures, can lead topremature death. Such fractures impose a considerable economicburden on health services worldwide (4).
5.7.2 Trends
Worldwide variation in the incidence and prevalence of osteoporosis isdifficult to determine because of problemswith definition and diagnosis.The most useful way of comparing osteoporosis prevalence betweenpopulations is to use fracture rates in older people. However, becauseosteoporosis is usually not life-threatening, quantitative data fromdeveloping countries are scarce. Despite this, the current consensus isthat approximately 1.66millionhip fractures occur each yearworldwide,that the incidence is set to increase four-fold by 2050 because of theincreasing numbers of older people, and that the age-adjusted incidencerates are many times higher in affluent developed countries than in sub-Saharan Africa and Asia (5--7).
In countries with a high fracture incidence, rates are greater amongwomen (by three- to four-fold). Thus, although widely regarded in thesecountries as a disease that affects women, 20% of symptomatic spinefractures and 30% of hip fractures occur in men (8). In countries wherefracture rates are low, men and women are more equally affected (7, 9--11). The incidence of vertebral and hip fractures in both sexes increasesexponentially with age. Hip-fracture rates are highest in Caucasianwomen living in temperate climates, are somewhat lower in women fromMediterranean and Asian countries, and are lowest in women in Africa(9, 10, 12). Countries in economic transition, such asHongKong SpecialAdministrative Region (SAR) of China, have seen significant increasesin age-adjusted fracture rates in recent decades, while the rates inindustrialized countries appear to have reached a plateau (13, 14).
5.7.3 Diet, physical activity and osteoporosis
Diet appears to have only a moderate relationship to osteoporosis, butcalcium and vitaminD are both important, at least in older populations.
129

Calcium is one of the main bone-forming minerals and an appropriatesupply to bone is essential at all stages of life. In estimating calciumrequirements, most committees have used either a factorial approach,where calculations of skeletal accretion and turnover rates are combinedwith typical values for calcium absorption and excretion, or a variety ofmethods based on experimentally-derived balance data (15, 16). There hasbeen considerable debate aboutwhether current recommended intakes areadequate to maximize peak bone mass and to minimize bone loss andfracture risk in later life, and the controversies continue (2, 12, 15--17).
Vitamin D is obtained either from the diet or by synthesis in the skinunder the action of sunlight. Overt vitaminDdeficiency causes rickets inchildren and osteomalacia in adults, conditions where the ratio ofmineral toosteoid inbone is reduced.PoorvitaminDstatus in theelderly,at plasma levels of 25-hydroxyvitamin D above those associated withosteomalacia, has been linked to age-related bone loss and osteoporoticfracture, where the ratio of mineral to osteoid remains normal.
Many other nutrients and dietary factors may be important for long-termbone health and the prevention of osteoporosis. Among the essentialnutrients, plausible hypotheses for involvement with skeletal health, basedon biochemical and metabolic evidence, can be made for zinc, copper,manganese, boron, vitamin A, vitamin C, vitamin K, the B vitamins,potassium and sodium (15). Evidence from physiological and clinicalstudies is largely lacking,and thedataareoftendifficult to interpretbecauseof potential size-confounding or bone remodelling transient effects.
5.7.4 Strength of evidence
For older people, there is convincing evidence for a reduction in risk forosteoporosis with sufficient intake of vitamin D and calcium together,and for an increase in risk with high consumption of alcohol and lowbodyweight. Evidence suggesting a probable relationship, again in olderpeople, supports a role for calcium and vitamin D separately, but nonewith fluoride.
Strength of evidence with fracture as outcome
There is considerable geographical variation in the incidence offractures, and cultural variation in the intakes of nutrients associatedwith osteoporosis and the clinical outcome of fracture. In Table 18,where the evidence on risk factors for osteoporosis is summarized, it isimportant to note that the level of certainty is given in relation to fractureas the outcome, rather than apparent bone mineral density as measuredby dual-energy X-ray absorptiometry or other indirect methods. Sincethe Consultation addressed health in terms of burden of disease,fractures were considered the more relevant end-point.
130

Table 18Summary of strength of evidence linking diet to osteoporotic fractures
Evidence Decreased risk No relationship Increased risk
Convincing
Older peopleaVitamin D
Calcium
Physical activity
High alcohol intake
Low body weight
Probable
Older peopleaFluorideb
Possible Fruits and vegetablesc
Moderate alcohol intake
Soy products
Phosphorus High sodium intake
Low protein intake (in older
people)
High protein intake
a In populations with high fracture incidence only. Applies to men and women older than 50--60 years, with a lowcalcium intake and/or poor vitamin D status.
b At levels used to fluoridate water supplies. High fluoride intake causes fluorosis and may also alter bone matrix.c Several components of fruits and vegetables are associated with a decreased risk at levels of intake within the
normal range of consumption (e.g. alkalinity, vitamin K, phytoestrogens, potassium, magnesium, boron). Vitamin Cdeficiency (scurvy) results in osteopenic bone disease.
5.7.5 Disease-specific recommendations
In countries with a high fracture incidence, a minimum of 400--500 mg ofcalcium intake is required to prevent osteoporosis. When consumption ofdairy products is limited, other sources of calcium include fish with ediblebones, tortillas processed with lime, green vegetables high in calcium (e.g.broccoli, kale), legumes and by-products of legumes (e.g. tofu). Theinteraction between calcium intake and physical activity, sun exposure,and intake of other dietary components (e.g. vitamin D, vitamin K,sodium, protein) and protective phytonutrients (e.g. soy compounds),needs to be considered before recommending increased calcium intake incountries with low fracture incidence in order to be in line withrecommendations for industrialized countries (18).
With regard to calcium intakes to prevent osteoporosis, the Consultationreferred to the recommendations of the Joint FAO/WHO ExpertConsultation onVitamin andMineral Requirements inHumanNutrition(18) which highlighted the calcium paradox. The paradox (that hipfracture rates are higher in developed countries where calcium intake ishigher than in developing countries where calcium intake is lower) clearlycalls for an explanation. To date, the accumulated data indicate that theadverse effect of protein, in particular animal (but not vegetable) protein,might outweigh the positive effect of calcium intake on calcium balance.
The report of the Joint FAO/WHOExpertConsultation onVitamin andMineral Requirements in Human Nutrition made it clear that therecommendations for calcium intakeswere based on long-term (90 days)calcium balance data for adults derived from Australia, Canada, theEuropean Union, the United Kingdom and the United States, and were
131

not necessarily applicable to all countries worldwide. The report alsoacknowledged that strong evidence was emerging that the requirementsfor calcium might vary from culture to culture for dietary, genetic,lifestyle and geographical reasons. Therefore, two sets of allowanceswere recommended: one for countries with low consumption of animalprotein, and another based on data from North America and WesternEuropes (18).
The following conclusions were reached:
. There is no case for global, population-based approaches. A case canbemade for targeted approacheswith respect to calciumandvitaminDin high-risk subgroups of populations, i.e. those with a high fractureincidence.
. In countries with high osteoporotic fracture incidence, a low calciumintake (i.e. below 400--500 mg per day) (15) among older men andwomen is associated with increased fracture risk.
. In countries with high fracture incidence, increases in dietaryvitamin D and calcium in the older populations can decrease fracturerisk. Therefore, an adequate vitamin D status should be ensured. Ifvitamin D is obtained predominantly from dietary sources, forexample, when sunshine exposure is limited, an intake of 5--10 mg perday is recommended.
. Although firm evidence is lacking, prudent dietary and some lifestylerecommendations developed in respect of other chronic diseases mayprove helpful in terms of reducing fracture risk. These include:
7 increase physical activity;
7 reduce sodium intake;
7 increase consumption of fruits and vegetables;
7 maintain a healthy body weight;
7 avoid smoking;
7 limit alcohol intake.. Convincing evidence indicates that physical activity, particularlyactivity that maintains or increases muscle strength, coordination andbalance as important determinants of propensity for falling, isbeneficial in prevention of osteoporotic fractures. In addition, regularlifetime weight-bearing activities, especially in modes that includeimpacts on bones and are done in vigorous fashion, increase peak bonemass in youth and help to maintain bone mass in later life.
References
1. Consensus Development Conference. Diagnosis, prophylaxis, and treatment ofosteoporosis. American Journal of Medicine, 1993, 94:646--650.
2. Prentice A. Is nutrition important in osteoporosis? Proceedings of the NutritionSociety, 1997, 56:357--367.
132

3. Compston JE. Osteoporosis. In: Campbell GA, Compston JE, Crisp AJ, eds. Themanagement of common metabolic bone disorders. Cambridge,Cambridge University Press, 1993:29--62.
4. Johnell O. The socioeconomic burden of fractures: today and in the 21st century.American Journal of Medicine, 1997, 103(Suppl. 2A):S20--S25.
5. Royal College of Physicians. Fractured neck of femur. Prevention and manage-ment. Summary and recommendations of a report of the Royal College ofPhysicians. Journal of the Royal College of Physicians, 1989, 23:8--12.
6. Cooper C, Campion G, Melton LJ. Hip fractures in the elderly: a world-wideprojection. Osteoporosis International, 1992, 2:285--289.
7. Melton LJ III. Epidemiology of fractures. In: Riggs BL, Melton LJ III, eds.Osteoporosis: etiology, diagnosis, and management, 2nd ed. Philadelphia,Lippincott-Raven, 1995: 225--247.
8. Eastell R et al. Management of male osteoporosis: report of the UK ConsensusGroup. Quarterly Journal of Medicine, 1998, 91:71--92.
9. Yan L et al. Epidemiological study of hip fracture in Shenyang, People’s Republicof China. Bone, 1999, 24:151--155.
10. Elffors L et al. The variable incidence of hip fracture in southern Europe: theMEDOS Study. Osteoporosis International, 1994, 4:253--263.
11. Maggi S et al. Incidence of hip fracture in the elderly: a cross-national analysis.Osteoporosis International, 1991, 1:232--241.
12. Osteoporosis: clinical guidelines for prevention and treatment. London, RoyalCollege of Physicians, 1999.
13. Kannus P et al. Epidemiology of hip fractures. Bone, 1996, 18(Suppl.1):57S--63S.
14. Lau EM, Cooper C. The epidemiology of osteoporosis: the oriental perspective ina world context. Clinical Orthopaedics and Related Research, 1996,323:65--74.
15. Department of Health. Nutrition and bone health: with particular reference tocalcium and vitamin D. Report of the Subgroup on Bone Health, Working Groupon theNutritional Status of thePopulation of theCommittee onMedical Aspects ofFood and Nutrition Policy. London, The Stationery Office, 1998 (Report on Healthand Social Subjects, No. 49).
16. Standing Committee on the Scientific Evaluation of Dietary Reference Intakes,Food and Nutrition Board, Institute of Medicine. Dietary reference intakes forcalcium, phosphorus, magnesium, vitamin D, and fluoride. Washington, DC,National Academy Press, 1997.
17. NIHConsensus Development Panel on Optimal Calcium Intake. Optimal calciumintake. NIH Consensus Conference. Journal of the American Medical Associa-tion, 1994, 272:1942--1948.
18. Vitamin and mineral requirements in human nutrition. Report of the Joint FAO/WHO Expert Consultation. Geneva, World Health Organization, (in press).
133

6. Strategic directions and recommendations forpolicy and research
6.1 Introduction
Theprincipal goal of public healthpolicy is to give people the best chanceto enjoy many years of healthy and active life. Public health action toprevent the adverse consequences of inappropriate dietary patterns andphysical inactivity is now urgently needed. To this end, the Consultationdiscussed how nutrient/food intake and physical activity goals could beused by policy-makers to increase the proportion of people who makehealthier choices about food andundertake sufficient physical activity tomaintain appropriate body weights and adequate health status. Thischapter discusses ways to catalyse the long-term changes that are neededto place people in a better position to make healthy choices about dietand physical activity. Such processes require long-term changes inthinking and action at the individual and societal levels; demandconcerted action by national governments, international bodies, civilsociety and private entities and will need insights and energiescontributed by multiple sectors of society.
New scientific information will be essential to permit adjustment notonly of the policy levers, but also of the strategic processes to introducechange. This constitutes an important focus for applied research thatshould yield useful evidence to guide effective interventions.
Three key elements need to be analysed. The first is the range of possiblepolicy principles that would help people achieve and maintain healthydietary and activity patterns in a simple and rewarding manner. Thesecond is the prerequisites for possible strategies to introduce thesepolicies in different settings. These include the need for leadership,effective communication of problems and possible solutions, function-ing alliances, and ways of encouraging enabling environments tofacilitate change. The third is the possible strategic actions to promotehealthy diets and physical activity.
134

6.2 Policy principles for the promotion of healthy diets and
physical activity1, 2
The Consultation recommended the consideration of the followingpolicy principles when developing national strategies to reduce theburden of chronic diseases that are related to diet and physical inactivity.
. Strategies should be comprehensive and address all major dietary andphysical activity risks for chronic diseases together, alongside otherrisks --- such as tobacco use --- from a multisectoral perspective.
. Each country should select what will constitute the optimal mix ofactions that are in accordwith national capabilities, laws and economicrealities.
. Governments have a central steering role in developing strategies,ensuring that actions are implemented and monitoring their impactover the long term.
. Ministries of health have a crucial convening role --- bringing togetherotherministries needed for effective policy design and implementation.
. Governments need to work together with the private sector, healthprofessional bodies, consumer groups, academics, the researchcommunity and other nongovernmental bodies if sustained progressis to occur.
. A life-course perspective on chronic disease prevention and control iscritical. This starts with maternal and child health, nutrition and carepractices, and carries through to school and workplace environments,access to preventive health and primary care, as well as community-based care for the elderly and disabled people.
. Strategies should explicitly address equality and diminish disparities;they should focus on the needs of the poorest communities andpopulation groups --- this requires a strong role for government.Furthermore, since women generally make decisions about householdnutrition, strategies should be gender sensitive.
1 During the preparation of this report, by resolution WHA55.23 (1) in May 2002, the World HealthAssembly calledupon theDirector-General to developaglobal strategy ondiet, physical activity andhealth (WHA55.23). The process for developing the WHO global strategy will involve formalconsultationwithMemberStates,UnitedNationsagencies, civil society, and theprivate sector over aperiod of a year, prior to drafting a proposed global strategy for presentation to the Fifty-seventhWorld Health Assembly in 2004.
2 Ensuring that people haveaccess to adequate foodwhich is safe andat the same timeof appropriatenutritional quality is important. One of the commitments adopted by the World Food Summitconvened by FAO in 1996, and reiterated in 2002 at the World Food Summit: Five Years Later,specifically endorses the implementation of policies aimed at ‘‘improving access by all, at all times tosufficient, nutritionally adequate and safe food’’.
135

. There are limits to what individual countries can do alone to promoteoptimal diets and healthy living. Strategies need to draw substantiallyon existing international standards that provide a reference ininternational trade. Member States may wish to see additionalstandards that address, for example, the marketing of unhealthy food(particularly those high in energy, saturated fat, salt and free sugars,and poor in essential nutrients) to children across national boundaries.Countriesmay alsowish to considermeans of ensuring the accessibilityof healthier choices (such as fruits and vegetables) to all socioeconomicgroups. WHO’s international leadership role in pushing forward theagenda on diet, physical activity and health is crucial. FAO also has animportant role in this process since it deals with issues relating to theproduction, trade, marketing of food and agricultural commoditiesand provides guidelines ensuring the safety and nutritional adequacyof food and food products.
6.3 Prerequisites for effective strategies
Drawing on experience with the implementation of local and nationalstrategies for public health matters in different settings, the ExpertConsultation concluded that there are a number of prerequisites forsuccess. These include leadership, effective communication, functioningalliances and an enabling environment.
6.3.1 Leadership for effective action
Leadership is essential for introducing long-term changes. Withinnations, governments have the primary responsibility for providing thisleadership. In some cases leadership may be initiated by civil societyorganizations prior to government action. It is unlikely that there will bejust one correct path to improved health: each country will need todetermine the optimal mix of policies that its particular circumstancesbest fit. Each country will need to select measures within the reality of itseconomic and social resources. Within a given country, effective actionmay call for regional strategies.
More proactive leadership is needed, worldwide, to portray a holisticvision of food and nutritional issues as they affect overall health. Wherethis leadership has existed, it has been possible to make governmentstake notice and introduce the necessary changes. The question remainsof how to develop and strengthen leadership capacity to reach a criticalmass.TheWHOcollaborating centres in nutritionand theFAOnetworkof centres of excellence are possible routes, although there is a clear needto strengthen existing capabilities.
Governments throughout the world have developed strategies toeradicate malnutrition, a term traditionally used synonymously with
136

undernutrition. However, the growing problems of nutritional imbal-ance, overweight and obesity, together with their implications for thedevelopmentof diabetes, cardiovascular problems andother diet-relatednoncommunicable diseases, are now at least as pressing. This appliesespecially to developing countries undergoing the nutrition transition;such countries bear a double burden of both overnutrition, as well asundernutrition and infectious diseases. Unless there is political commit-ment to spur governments on to achieve results, strategies cannotsucceed. Setting population goals for nutrient intake and physicalactivity is necessary but insufficient. Giving people the best chance toenjoy many years of healthy and active life requires action at thecommunity, family and individual levels.
6.3.2 Effective communication
Change can only be initiated through effective communication. The corerole of health communication is to bridge the gap between technicalexperts, policy-makers and the general public. The proof of effectivecommunications is its capacity to create awareness, improve knowledgeand induce long-term changes in individual and social behaviours --- inthis case consumption of healthy diets and incorporating physicalactivity for health.
An effective health communication plan seeks to act on theopportunities at all stages of policy formulation and implementation,in order to positively influence public health. Sustained and welltargeted communication will enable consumers to be better informedand make healthier choices. Informed consumers are better able toinfluence policy-makers; this was learned fromwork to limit the damageto health from tobacco use. Consumers can serve as advocates or maygo on to lobby and influence their societies to bring about changes insupply and access to goods and services that support physical activityand nutritional goals.
The cost to the world of the current and projected epidemic of chronicdisease related to diet and physical inactivity dwarfs all other healthcosts. If society can bemobilized to recognize those costs, policy-makerswill eventually start confronting the issue and themselves becomeadvocates of change. Experience shows that politicians can also beinfluenced by the positions taken by the United Nations agencies, andthemessages that they promote.Medical networks have also been foundto be effective advocates of change in the presence of a government thatis responsive to the health needs of society. Consumer nongovernmentalorganizations and a wide variety of civil society organizations will alsobe critical in raising consumer consciousness and supporting the climate
137

for constructive collaboration with the food industry and the privatesector.
6.3.3 Functioning alliances and partnerships
Change can be accelerated if all groups in favour establish alliances toreach the common objective. Ideally, the effort should include a range ofdifferent parties whose actions influence people’s options and choicesabout diet and physical activity. Alliances for action are likely to extendfrom communities to national and regional levels, involving formal focalpoints for nutrition within different public, private and voluntary bodies.The involvement of consumers associations is also important to facilitatehealth and nutrition education. International organizations with nutri-tion-relatedmandates, such asFAOandWHO, are expected to encouragethe routing of reliable information through these networks.Allianceswithother members of the United Nations family are also important --- forexample, with the United Nations Children’s Fund on maternal --- childnutritionand life-courseapproaches tohealth.Private sector industrywithinterests in foodproduction, packaging, logistics, retailing andmarketing,and other private entities concerned with lifestyles, sports, tourism,recreation, and health and life insurance, have a key role to play.Sometimes it is best to work with groups of industries rather than withindividual industries that may wish to capitalize on change for their ownbenefit. All should be invited; those who share the health promotionobjective will usually opt to participate in joint activities.
6.3.4 Enabling environments
Individual change is more likely to be facilitated and sustained if themacroenvironment and microenvironment within which choices aremade support options perceived to be both healthy and rewarding. Foodsystems, marketing patterns and personal lifestyles should evolve inways that make it easier for people to live healthier lives, and to choosethe kinds of food that bring them the greatest health benefits. Anenabling environment encompasses a wide frame of reference, from theenvironment at school, in the workplace and in the community, totransport policies, urban design policies, and the availability of a healthydiet. Furthermore, it requires supportive legislative, regulatory andfiscal policies to be in place. Unless there is an enabling context, thepotential for change will be minimal. The ideal is an environment thatnot only promotes but also supports and protects healthy living, makingit possible, for example, to bicycle orwalk towork or school, to buy freshfruits and vegetables, and eat and work in smoke-free rooms.
Specific actions to create enabling environments are outlined in greaterdetail below.
138

Supporting the availability and selection of nutrient-dense foods (fruits,vegetables, legumes, whole grains, lean meats and low-fat dairy products)
Within this overall concept, the issue of nutrient-dense foods versusenergy-dense/nutrient-poor foods is critical as it concerns the balancebetween providing essential nourishment and maintaining a healthyweight. The quality of the fat and carbohydrate supplied also plays a keyrole. The following are all important: increasing access --- especially oflow-income communities --- to a supply of nutrient-dense fresh foods;regulations that support this; facilitating access to high-quality dietsthrough food pricing policies; nutrition labels to inform consumers, inparticular about the appropriate use of health/nutrition claims. Theprovision of safe and nutritious food is now recognized not only as ahuman need but also as a basic right.
Assessing trends in changing consumption patterns and their implicationsfor the food (agriculture, livestock, fisheries and horticulture) economy
Recommendations, which result in changes in dietary patterns, will haveimplications for all components of the food economy. Hence it isappropriate to examine trends in consumption patterns worldwide anddeliberate on the potential of the food and agriculture sector to meet thedemands and challenges posed by this report. All sectors in the foodchain, from farm to the table, will have to be involved if the foodeconomy is to respond to the need for changes in diets that will benecessary to cope with the burgeoning epidemic of noncommunicablediseases.
Hitherto most of the information on food consumption has beenobtained from national Food Balance data. In order to understandbetter the relationship between food consumption patterns, diets and theemergence of noncommunicable diseases, it is crucial to obtain morereliable information on actual food consumption patterns and changingtrends based on representative consumption surveys.
There is a need to monitor whether the guidelines developed in thisreport, and strategies based on them, will influence the behaviour ofconsumers and to what extent consumers will change their diets (andlifestyles) towards more healthy patterns.
The next step will be to assess the implications that these guidelines willhave for agriculture, livestock, fisheries and horticulture. To meet thespecified levels and patterns of consumption, new strategies may need tobe developed. This assessment will need to include all stages in the foodchain --- fromproduction andprocessing tomarketing and consumption.The effects that these changes in the food economy could have on thesustainability of natural resource use would also need to be taken intoaccount.
139

Likewise, international trade issues would need to be considered in thecontext of improving diets. Trade has an important role to play inimproving food and nutrition security. Factors to consider include theimpact of lower trade barriers on the purchasing power of consumersand variety of products available, while on the export side, questions ofmarket access, competitiveness and income opportunities for domesticfarmers and processors would merit attention. The impact thatagricultural policy, particularly subsidies, has on the structure ofproduction, processing and marketing systems and, ultimately, on theavailability of foods that support healthy food consumption patternswill need to be examined.
Finally, assessments of the above issues, and more, will certainly havepolicy implications at both the national and international levels. Theseimplications would need to be taken up in the appropriate forum andconsidered by the stakeholders concerned.
Sustainable development
The rapid increase in the consumption of animal-based foods, many ofwhich are produced by intensive methods is likely to have a number ofprofound consequences. On the health side, increased consumption ofanimal products has led to higher intakes of saturated fats, which inconjunction with tobacco use, threatens to undermine the health gainsmade by reducing infectious diseases, in particular in the countriesundergoing rapid economic and nutrition transition. Intensive cattleproduction also threatens the world’s ability to feed its poorest people,who typically have very limited access to even basic foods. Environ-mental concerns abound too; intensive methods of animal rearing exertgreater environmental pressures than traditional animal husbandry,largely because of the low efficiency in feed conversion and high waterneeds of cattle.
Intensive methods of livestock production may well provide muchneeded income opportunities, but this is often at the expense of thefarmers’ capacity to produce their own food. In contrast, the productionof more diverse foods, in particular fruits, vegetables and legumes, mayhave a dual benefit in not only improving access to healthy foods but alsoin providing an alternative source of income for the farmer. This isfurther promoted if farmers can market their products directly toconsumers, and thereby receive a greater proportion of final price. Thismodel of food production can yield potent health benefits to bothproducers and consumers, and simultaneously reduce environmentalpressures on water and land resources.
Agricultural policies in several countries often respond primarily toshort-termcommercial farming concerns rather thanbe guidedbyhealth
140

and environmental considerations. For example, farm subsidies for beefand dairy production had good justification in the past --- they providedimproved access to high quality proteins but today contribute to humanconsumption patterns that may aggravate the burden of nutritionrelated chronic disease. This apparent disregard for the healthconsequences and environmental sustainability of present agriculturalproduction, limits the potential for change in agricultural policies andfood production, and at some point may lead to a conflict betweenmeeting population nutrient intake goals and sustaining the demand forbeef associated with the existing patterns of consumption. For example,if we project the consumption of beef in industrialized countries to thepopulation of developing countries, the supply of grains for humanconsumption may be limited, specially for low-income groups.
Changes in agricultural policies which give producers an opportunity toadapt to new demands, increase awareness and empower communites tobetter address health and environmental consequences of presentconsumption patterns will be needed in the future. Integrated strategiesaimed at increasing the responsiveness of governments to health andenvironmental concerns of the community will also be required. Thequestion of how the world’s food supply can bemanaged so as to sustainthe demands made by population-size adjustments in diet is a topic forcontinued dialogue by multiple stake-holders that has major con-sequences for agricultural and environmental policies, as well as forworld food trade.
Physical activity
A large proportion of the world’s population currently takes aninadequate amount of physical activity to sustain physical and mentalhealth. The heavy reliance on the motor car and other forms of labour-saving machinery has had much to do with this. Cities throughout theworld have dedicated space for motor cars but little space forrecreation. Changes in the nature of employment have meant thatmore time is spent travelling to and from work, thereby limiting thetime available for the purchase and preparation of food. Cars are alsocontributors to growing urban problems, such as traffic congestion andair pollution.
Urban and workplace planners need to be more aware of the potentialconsequences of the progressive decline in occupational energyexpenditure, and should be encouraged to develop transport andrecreation policies that promote, support and protect physical activity.For example, urban planning, transportation and building designshould give priority to the safety and transit of pedestrians and safebicycle use.
141

Traditional diets
Modern marketing practices commonly displace local or ethnic dietarypatterns. Global marketing, in particular, has wide-ranging effects onboth consumer appetite for goods and perceptions of their value. Whilesome traditional diets could benefit from thoughtful modification,research has shown that many are protective of health, and clearlyenvironmentally sustainable. Much can be learned from these.
6.4 Strategic actions for promoting healthy diets and physicalactivity
The strategies for promoting healthy diets and physical activity need toreflect local andnational realities aswell as global determinants of diet andphysical activity. Theymust be based on scientific evidence on the ways inwhich people’s dietary and physical activity patterns have positive oradverse effects onhealth. In practice, strategies are likely to include at leastsome of the following practical actions.
6.4.1 Surveillance of people’s diets, physical activity and related diseaseburden
A surveillance system for monitoring diet, physical activity and relatedhealth problems is essential to enable all interested stakeholders totrack progress towards each country’s diet-related health targets, and toguide the choice, intensity and timing of measures to accelerateachievement. The data required for implementing effective policies needto be specific for age, sex and social group, and indicate changing trendsover time.
6.4.2 Enabling people to make informed choices and take effective action
Information about fat quality, salt and sugars content, and energydensity should be incorporated into nutrition and health promotionmessages, and as required in food labelling tailored to differentpopulation groups --- including disadvantaged population groups ---through the wide reach of modern media. The ultimate goal ofinformation and communication strategies is to assure availability andchoice of better quality food, access to physical activity and a better-informed global community.
6.4.3 Making the best use of standards and legislation
TheCodexAlimentarius --- the intergovernmental standard-setting bodythrough which nations agree on standards for food --- is currently beingreviewed. Its work in the area of nutrition and labelling could be furtherstrengthened to cover diet-related aspects of health. The feasibility ofcodes of practice in food advertising should also be explored.
142

6.4.4 Ensuring that ‘‘healthy diet’’ components are available to all
As consumers increase their preference for healthy diets, producers andsuppliers will wish to orient their products and marketing to respond tothis emerging demand.Governments couldmake it easier for consumersto exercise healthier choices, in accordance with the population nutrientintake goals given in this report by, for example, promoting the wideravailability of food which is less processed and low in trans fatty acids,encouraging the use of vegetable oil for domestic consumers, andensuring an adequate and sustainable supply of fish, fruits, vegetablesand nuts in domestic markets.
In the case of meals prepared outside the home (i.e. in restaurants andfast-food outlets), information about their nutritional quality should bemade available to consumers in a simple manner so that they can selecthealthier choices. For example, consumers should be able to ascertainnot only the amount of fat or oil in the meals they have chosen, but alsowhether they are high in saturated fat or trans fatty acids.
6.4.5 Achieving success through intersectoral initiatives
Approaches to promoting healthy diets call for comprehensive strategiesthat cut across many sectors and involve the different groups withincountries concerned with food, nutrition, agriculture, education,transport and other relevant policies. They should involve alliances thatencourage the effective implementation of national and local strategiesfor healthy diets and physical activity. Intersectoral initiatives shouldencourage the adequate production and domestic supply of fruits,vegetables andwholegrain cereals, at affordable prices to all segments ofthe population, opportunities for all to access them regularly, andindividuals to undertake appropriate levels of physical activity.
6.4.6 Making the best of health services and the professionalswho provide them
The training of all health professionals (including physicians, nurses,dentists and nutritionists) should include diet, nutrition and physicalactivity as key determinants of medical and dental health. The social,economic, cultural and psychological determinants of dietary andphysical activity choice should be included as integral elements of publichealth action. There is an urgent need to develop and strengthen existingtraining programmes to implement these actions successfully.
6.5 Call to action
There is now a large, convincing body of evidence that dietary patternsand the level of physical activity can not only influence existing healthlevels, but also determine whether an individual will develop chronic
143

diseases such as cancer, cardiovascular disease and diabetes. Thesechronic diseases remain the main causes of premature death anddisability in industrialized countries and in most developing countries.Developing countries are demonstrably increasingly at risk, as are thepoorer populations of industrialized countries.
In communities, districts and countries where widespread, integratedinterventions have been implemented, dramatic decreases in risk factorshave occurred. Successes have come about where the public hasacknowledged that the unnecessary premature deaths that occur intheir community are largely preventable and have empowered them-selves and their civic representatives to create health-supportingenvironments. This has been achieved most successfully by establishinga working relationship between communities and governments; throughenabling legislation and local initiatives affecting schools and theworkplace; by involving consumers’ associations; and by involving foodproducers and the food-processing industry.
There is a need for data on current and changing trends in foodconsumption in developing countries, including research on whatinfluences people’s eating behaviour and physical activity and whatcan be done to address this. There is also a need, on a continuing basis, todevelop strategies to change people’s behaviour towards adoptinghealthy diets and lifestyles, including research on the supply and demandside related to this changing consumer behaviour.
Beyond the rhetoric, this epidemic can be halted --- the demand for actionmust come from those affected. The solution is in our hands.
Reference
1. Resolution WHA55.23. Diet, physical activity and health. In: Fifty-fifth WorldHealth Assembly, Geneva, 13--18 May 2002. Volume 1. Resolutions anddecisions, annexes. Geneva, World Health Organization, 2002 (documentWHA55/2002/REC/1):28--30.
Acknowledgements
Special acknowledgement was made by the Consultation to the following individualswho were instrumental in the preparation and proceedings of the meeting:Dr C. Nishida, Department of Nutrition for Health and Development, WHO, Geneva,Switzerland; Dr P. Puska, Director, Department of Noncommunicable DiseasePrevention and Health Promotion, WHO, Geneva, Switzerland; Dr P. Shetty, Chief,FoodandNutritionDivision, Rome, Italy; andDrR.Weisel, FoodandNutritionDivision,FAO, Rome, Italy.
144

The Consultation also expressed deep appreciation to the following individuals fortheir contributions to the running of the meeting and the finalizing of the report:Dr M. Deurenberg-Yap, Health Promotion Board, Singapore, Professor S. Kumanyika,University of Pennsylvania, Philadelphia, PA, USA; Professor J. C. Seidell, FreeUniversity of Amsterdam, Amsterdam, the Netherlands; and Dr R. Uauy, LondonSchool of Hygiene and Tropical Medicine, London, England and Institute of Nutritionof the University of Chile, Santiago, Chile.
The Consultation also thanked the authors of the background papers for theConsultation: Dr N. Allen, University of Oxford, Oxford, England; Dr P. Bennett,National Institute of Diabetes and Digestive and Kidney Diseases, Phoenix, AZ, USA;Professor I. Caterson, University of Sydney, Sydney, Australia; Dr I. Darnton-Hill,Columbia University, New York, NY, USA; Professor W.P.T. James, InternationalObesity Task Force, London, England; ProfessorM.B. Katan,WageningenUniversity,Wageningen, Netherlands; Dr T.J. Key, University of Oxford, Oxford, England;Dr J. Lindstromn,National PublicHealth Institute, Helsinki, Finland;Dr A. Louheranta,National Public Health Institute, Helsinki, Finland; Professor J. Mann, University ofOtago, Dunedin, New Zealand; Dr P. Moynihan, University of Newcastle, Newcastle-upon-Tyne, England; Dr P.E. Petersen, Noncommunicable Disease and HealthPromotion, WHO, Geneva, Switzerland; Dr A. Prentice, Medical Research CouncilHuman Nutrition Research, Cambridge, England; Professor K.S. Reddy, All IndiaInstitute of Medical Science, New Delhi, India; Dr A. Schatzkin, National Institutes ofHealth, Bethesda, MD, USA; Dr A.P. Simopoulos, The Centre for Genetics, Nutritionand Health, Washington, DC, USA; Ms E. Spencer, University of Oxford, Oxford,England; Dr N. Steyn, Medical Research Council, Tygerberg, South Africa; ProfessorB. Swinburn, Deakin University, Melbourne, Victoria, Australia; Professor N. Temple,Athabasca University, Athabasca, Alberta, Canada; Ms R.Travis, University ofOxford, Oxford, England; Dr J.Tuomilehto, National Public Health Institute, Helsinki,Finland; Dr W. Willett, Harvard School of Public Health, Boston, MA, USA; andProfessor P. Zimmet, International Diabetes Institute, Caulfield, Victoria, Australia.
The Consultation also recognized the valuable contributions made by the followingindividuals who provided comments on the background documents: Dr FrancaBianchini, Unit of Chemoprevention, International Agency for Research on Cancer,Lyon, France; Mr G. Boedeker, Economic and Social Department, FAO, Rome, Italy;Professor G.A. Bray, Pennington Biomedical Research Center, Louisiana StateUniversity, BatonRouge, LA,USA;Mr J. Bruinsma, Economic andSocial Department,FAO, Rome, Italy; Dr L.K. Cohen, National Institutes of Health, Bethesda, MD, USA;Professor A. Ferro-Luzzi, National Institute for Food and Nutrition Research, Rome,Italy; Dr R. Francis, Freeman Hospital, Newcastle-upon-Tyne, England; Dr Ghafoor-unissa, Indian Council of Medical Research, New Delhi, India; Dr K. Hardwick,National Institutes of Health, Bethesda, MD, USA; Dr H. King, Department ofManagement ofNoncommunicableDiseases,WHO,Geneva, Switzerland;Dr J.King,University of California, Davis, CA, USA; Dr L.N. Kolonel, University of Hawaii, Manoa,HI, USA; Professor N.S. Levitt, University of Cape Town, Cape Town, South Africa;Dr P. Lingstrom, University of Gothenburg, Gothenburg, Sweden; ProfessorA. McMichael, Australian National University, Canberra, Australian Capital Territory,Australia; Professor S. Moss, Oral Health Promotion Committee, New York, NY, USA;Professor K. O’Dea, Menzies School of Health Research, Alice Springs, NorthernTerritory, Australia; Professor D. O’Mullane, University of Cork, Cork, Ireland;Dr P. Pietinen, National Public Health Institute, Helsinki, Finland; Dr J. Powles,University of Cambridge, Cambridge, England; Dr E. Riboli, International Agency forResearch on Cancer, Lyon, France; Dr S. Rosnner, Huddinge University Hospital,
145

Huddinge, Sweden; Professor A. Rugg-Gunn, University of Newcastle, Newcastle-upon-Tyne, England; Mr J. Schmidhuber, Economic and Social Department, FAO,Rome, Italy; Professor A. Sheiham, University College London Medical School,London, England; Professor S. Truswell, University of Sydney, Sydney, New SouthWales, Australia; Dr S. Tsugane, National Cancer Center Research Institute East,Tsukiji, Tokyo, Japan; Dr Ilkka Vuori, UKK Institute for Health Promotion Research,Tampere, Finland; Dr A.R.P. Walker, South African Institute for Medical Research,Johannesburg, SouthAfrica; Dr S. Watanabe, TokyoUniversity of Agriculture, Tokyo,Japan;DrC. Yajnik, KingEdwardMemorial Hospital ResearchCentre,Mumbai, India;and Dr S. Yusaf, McMaster University, Hamilton, Ontario, Canada.
Acknowledgement wasmade by the Consultation to the following individuals for theircontinual guidance:DrD. Yach,ExecutiveDirector,NoncommunicableDiseasesandMental Health, WHO, Geneva, Switzerland; Dr D. Nabarro, Executive Director,Sustainable Development and Healthy Environments, WHO, Geneva, Switzerland;Mr H. De Haen, Assistant Director-General, Economic and Social Department, FAO,Rome, Italy; Dr G.A. Clugston, Director, Department of Nutrition for Health andDevelopment, WHO, Geneva, Switzerland; and Dr K. Tontisirin, Director, Food andNutrition Division, FAO, Rome, Italy.
The Consultation expressed special appreciation to Ms P. Robertson for her valuablecontribution to the preparation and running of the meeting, to Mrs A. Haden andMrs A. Rowe for their editorial assistance, and to Mrs R. Imperial Laue, Ms S. Nalty,Ms T. Mutru, Mrs R. Bourne, Mrs A. Manus, Mrs A. Ryan-Rohrich and Ms C. Melin fortheir assistance in checking, typing and finalizing the manuscript.
146

Annex
Summary of the strength of evidence for obesity, type2 diabetes, cardiovascular disease (CVD), cancer,dental disease and osteoporosisa
Obesity Type 2
diabetes
CVD Cancer Dental
disease
Osteoporosis
Energy and fats
High intake of
energy-dense foods
C:
Saturated fatty acids P: C:b
Trans fatty acids C:Dietary cholesterol P:Myristic and
palmitic acid
C:
Linoleic acid C;Fish and fish oils
(EPA and DHA)
C;
Plant sterols and stanols P;a-Linolenic acid P;Oleic acid P;Stearic acid P-NR
Nuts (unsalted) P;
CarbohydrateHigh intake of NSP
(dietary fibre)
C; P; P;
Free sugars (frequency
and amount)
C:c
Sugar-free chewing gum P;c
Starchd C-NR
Wholegrain cereals P;
Vitamins
Vitamin C deficiency C:e
Vitamin D C;f C;g
Vitamin E supplements C-NR
Folate P;
Minerals
High sodium intake C:Salt-preserved foods
and salt
P:h
Potassium C;Calcium C;g
Fluoride, local C;c
Fluoride, systemic C;c P-NRg
Fluoride, excess C:f
Hypocalcaemia P:f
Meat and fish
Preserved meat P:i
Chinese-style salted fish C:j
147

Obesity Type 2
diabetes
CVD Cancer Dental
disease
Osteoporosis
Fruits (including berries)
and vegetablesFruits (including berries)
and vegetables
C;k P;k C; P;l
Whole fresh fruits P-NRc
Beverages, non-alcoholic
Sugars-sweetened soft drinks
and fruit juices
P: P:m
Very hot (thermally) drinks
(and food)
P:n
Unfiltered boiled coffee P:
Beverages, alcoholic
High alcohol intake C:o C:p C:g
Low to moderate alcohol intake C;q
Other food-borne
Aflatoxins C:r
Weight and physical activity
Abdominal obesity C:Overweight and obesity C: C: C:s
Voluntary weight loss in
overweight and
obese people
C;
Low body weight C:g
Physical activity, regular C; C; C; C;i
P;tC;g
Physical inactivity/sedentary
lifestyle
C: C:
Other factors
Exclusive breastfeeding P;Maternal diabetes C:Intrauterine growth retardation P:Good oral hygiene/absence
of plaque
C;e
Hard cheese P;c
Environmental variables
Home and school
environments
that support
healthy food choices
for children
P;
Heavy marketing of energy-
dense foods, and fast-food
outlets
P:
Adverse socioeconomic
conditions
P:
C:: Convincing increasing risk; C;: Convincing decreasing risk; C-NR: Convincing, no relationship; P:: Probableincreasing risk; P;: Probable decreasing risk; P-NR: Probable, no relationship; EPA: eicosapentaenoic acid;DHA: docosahexaenoic acid; NSP: non-starch polysaccharides.
148

a Only convincing (C) and probable (P) evidence are included in this summary table.b Evidence also summarized for selected specific fatty acids, see myristic and palmitic acid.c For dental caries.d Includes cookedand rawstarch foods, such as rice, potatoes andbread. Excludes cakes, biscuits and snackswith
added sugar.e For periodontal disease.f For enamel developmental defects.g In populations with high fracture incidence only; applies to men and women more than 50--60 years old.h For stomach cancer.i For colorectal cancer.j For nasopharyngeal cancer.k Based on the contributions of fruits and vegetables to non-starch polysaccharides.l For cancer of the oral cavity, oesophagus, stomach and colorectum.m For dental erosion.n For cancer of the oral cavity, pharynx and oesophagus.o For stroke.p For cancer of the oral cavity, pharynx, larynx, oesophagus, liver and breast.q For coronary heart disease.r For liver cancer.s For cancer of the oesophagus, colorectum, breast (in postmenopausal women), endometrium and kidney.t For breast cancer.
149
