diamond exploration and regional prospectivity of western
TRANSCRIPT
ORIGINAL PAPER
Diamond exploration and regional prospectivity of Western Australia
Mark T. Hutchison1,2
Received: 15 November 2017 /Accepted: 20 April 2018# Springer-Verlag GmbH Austria, part of Springer Nature 2018
AbstractPre-1.6 Ga rocks comprise around 45% of the onshore area of Western Australia (WA), constituting the West Australian Craton(WAC) (including the Archean Yilgarn and Pilbara Cratons) and the western part of the North Australian Craton (NAC). Theseareas provide the conditions suitable for diamond formation at depth, and numerous diamondiferous lamproite and kimberlitefields are known. As emplacement ages span close to 2500 Ma, there are significant opportunities for diamond-affinity rocksbeing present near-surface in much of the State, including amongst Phanerozoic rocks. WA’s size, terrain, infrastructure andclimate, mean that many areas remain underexplored. However, continuous diamond exploration since the 1970s has resulted inabundant data. In order to advance future exploration, a comprehensive database of results of diamond exploration sampling(Geological Survey ofWestern Australia 2018) has been assessed. The Yilgarn and Pilbara Cratons have spinel indicators almostexclusively dominated by chromite (>90% of grains), whereas (Mg,Fe,Ti)-bearingAl-chromites account for more of the indicatorspinels in the NAC, up to 50% of grains at the Northern Territory (NT) border. Increasing dominance of Al in chromites isinterpreted as a sign of weathering or a shallower source than Al-depleted Mg-chromites. Garnet compositions across the Statealso correlate with geological subdivisions, with lherzolitic garnets showing more prospective compositions (Ca-depleted) inWAC samples compared to the NAC. WAC samples also show a much broader scatter into strongly diamond-prospective G10and G10D compositions. Ilmenites from the NAC showMg-enriched compositions (consistent with kimberlites), over and abovethose present in NT data. However, ilmenites from the WAC again show the most diamond-prospective trends. Numerousindicator mineral concentrations throughout the State have unknown sources. Due in part to the presence of diamondiferouslamproites, it is cautioned that some accepted indicator mineral criteria do not apply in parts of WA. For example Ca-depletedgarnets, Mg-depleted ilmenites and Cr-depleted and Al-absent clinopyroxenes are all sometimes associated with strongly dia-mondiferous localities. Quantitative prospectivity analysis has also been carried out based on the extent and results of sampling,age of surface rocks relative to ages of diamond-prospective rocks, and the underlying mantle structure. Results show thatlocations within the NAC and with proximity to WA’s diamond mines score well. However, results point to parts of the WACbeing more prospective, consistent with mineral chemical data. Most notable are the Hamersley Basin, Eastern GoldfieldsSuperterrane and the Goodin Inlier of the Yilgarn Craton. Despite prolific diamond exploration, WA is considerablyunderexplored and the ageing Argyle mine and recent closure of operations at Ellendale warrant a re-evaluation of diamondpotential. Results of mineral chemistry and prospectivity analysis make a compelling case for renewed exploration.
Keywords Western Australia . Diamond exploration . Kimberlite . Lamproite . Indicator minerals
Introduction
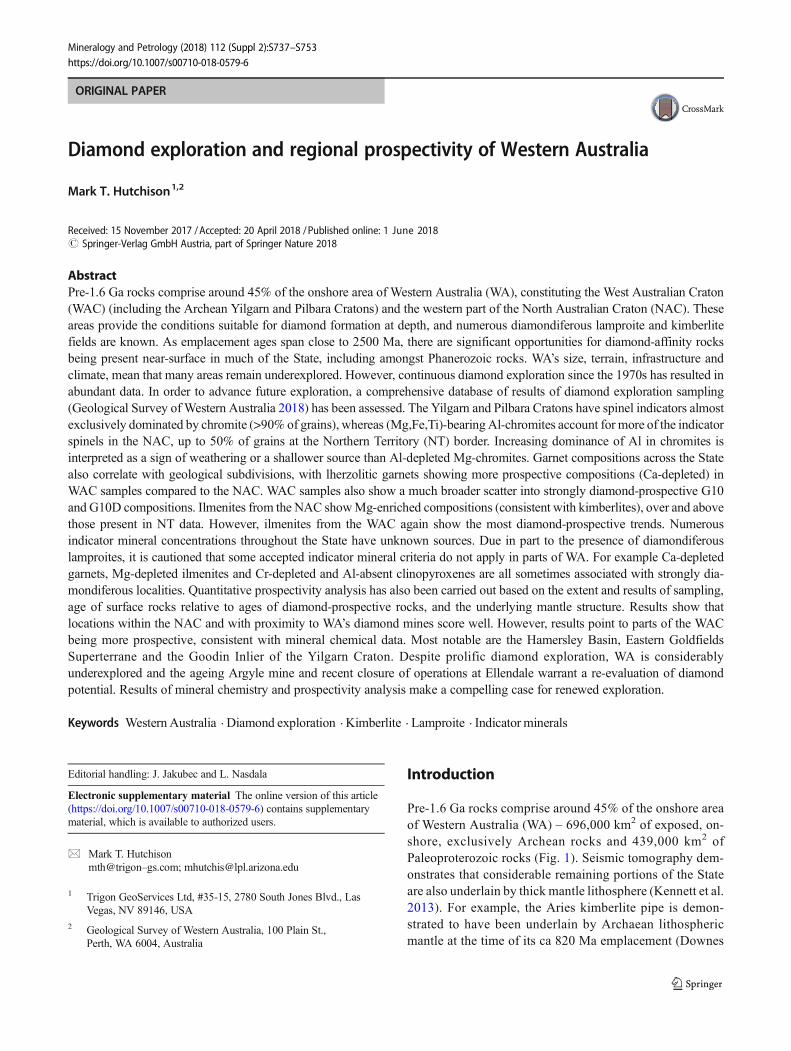
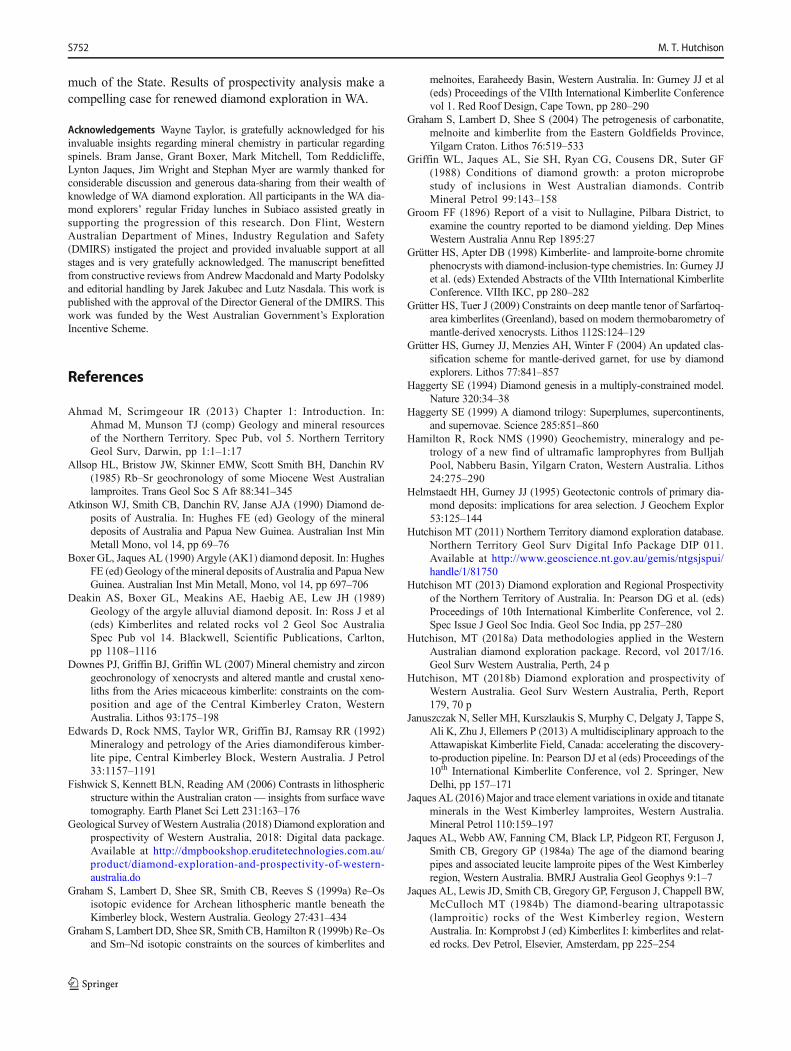
Pre-1.6 Ga rocks comprise around 45% of the onshore areaof Western Australia (WA) – 696,000 km2 of exposed, on-shore, exclusively Archean rocks and 439,000 km2 ofPaleoproterozoic rocks (Fig. 1). Seismic tomography dem-onstrates that considerable remaining portions of the Stateare also underlain by thick mantle lithosphere (Kennett et al.2013). For example, the Aries kimberlite pipe is demon-strated to have been underlain by Archaean lithosphericmantle at the time of its ca 820 Ma emplacement (Downes
Editorial handling: J. Jakubec and L. Nasdala
Electronic supplementary material The online version of this article(https://doi.org/10.1007/s00710-018-0579-6) contains supplementarymaterial, which is available to authorized users.
* Mark T. Hutchisonmth@trigon–gs.com; [email protected]
1 Trigon GeoServices Ltd, #35-15, 2780 South Jones Blvd., LasVegas, NV 89146, USA
2 Geological Survey of Western Australia, 100 Plain St.,Perth, WA 6004, Australia
Mineralogy and Petrologyhttps://doi.org/10.1007/s00710-018-0579-6
(2018) 112 (Suppl 2):S737–S753
/Published online: 1 018June 2
et al. 2007). The same conclusions are drawn for the Seppeltkimberlite, approximately concurrent with Aries, and theProterozoic (1177 Ma; Pidgeon et al. 1989) Argylelamproite, based on Re–Os systematics (Graham et al.1999a). Combined, these old and deep-rooted regions makeup the western part of the North Australian Craton (NAC)and the West Australian Craton (WAC; Yilgarn and thePilbara Cratons). Cratons host the conditions under which
diamonds form (Haggerty 1994) and numerous diamondif-erous lamproite and kimberlite fields are known in WA. Atits peak in 2015, Australia is estimated to have producedapproximately 11% of global rough diamond productionby weight, ranking it fourth in the world. These productionfigures are accounted for by two mines, both in WA.However, due to the closure of the Ellendale mine in 2015,responsible for a large proportion of the world’s fancy
McArthurBasin
WESTERN AUSTRALIA
NORTHERNTERRITORY QUEENSLAND
SOUTH AUSTRALIA
NEW SOUTH WALES
VICTORIA
TASMANIA
Principal lamproite, kimberlite orultramafic lamprophyre occurrenceCurrent or previous diamond- mining operation
Paleo–Mesoproterozoic basins
Paleo–Mesoproterozoic orogens
Archean
18°
12°
117° 123° 129° 135° 141°
24°
30°
42°
36°
500 km
Wandagee
Edel 1Turkey Creek
Brockman Creek 01BlacktopCarnarvon
Basin
GeorgetownInlier
Coen Inlier
Yilgarn Craton
Pilbara Craton
Earaheedy, Bryah,Yerrida Basins
KimberleyBasin
GawlerCraton
MusgraveProvince
Tennant region
Tanamiregion
BirrinduduBasin
Mount IsaInlier
Aileron Province
Pine CreekOrogen
Bulljah Pool
Webb
Ellendale
Skerring
Aries ArgyleTimberCreek
Roper Field
Abner Range
Coanjula
Merlin
Eurelia
Approximate craton boundaries
State boundary
NORTH AUSTRALIAN CRATON
WEST AUSTRALIANCRATON SOUTH AUSTRALIAN
CRATON
Walgidee Hills
Fohn
NULLAGINE
WA East
WAWest
N
Fig. 1 Generalised map of cratonic Australia showing approximatecraton boundaries and principal regions of Archean and Paleo–Mesoproterozoic rocks. Modified from Hutchison (2013). Theboundaries of the North Australian Craton are adapted from Atkinsonet al. (1990) and Kennett et al. (2011). Geological region boundariesfollow current GeoScience Australia downloadable data, Kennett et al.(2011) and, for the NT, Ahmad and Scrimgeour (2013). The Ellendale
lamproites reside within the King Leopold Mobile Zone and the Argylepipe within the Halls CreekMobile Zone. TheMerlin kimberlite field lieswithin the McArthur Basin. Some of the lamproites in the vicinity ofFohn lie within the Joint Petroleum Development Area with PapuaNew Guinea. All occurrences are in-situ bodies with the exception ofCoanjula which is a microdiamond paleoplacer
M. T. HutchisonS738
yellow production, only one currently producing mine re-mains in Australia (the AK1 olivine lamproite at Argyle,NAC; Boxer and Jaques 1990).
The 1976 discovery, in WA, that lamproites can host dia-monds, and in commercial quantities, was one of two WA dis-coveries which resulted in a very considerable widening of therange of rocks known to host diamonds world-wide. The sec-ond important WA contribution was the discovery that ultra-mafic lamprophyres can also carry diamonds (Bulljah Pool;Hamilton and Rock 1990) extending the field of potentiallydiamondiferous rocks beyond kimberlites and lamproites.
Emplacement of diamond-bearing rocks spans much ofgeological time, from the ca 1868 Ma Brockman Creekkimberlite in the Pilbara Craton (White 2000) to the ca17 Ma Walgidee Hills lamproite, Noonkanbah field, WestKimberley (Phillips et al. 2012). Hence, even withinPhanerozoic Basins overlying cratonic roots there is scopefor undiscovered diamond-bearing rocks to be youngenough to be found at or near-surface.
Despite successful finds, given WA’s size, terrain, infra-structure and climate, many areas remain underexplored.For example, diamonds were first discovered in WesternAustralia in the Nullagine (Fig. 1) where they were identi-fied during processing of the Proterozoic Beatons CreekConglomerates for gold (Groom 1896). Diamonds contin-ue to be discovered in this area but the sources are as yetunidentified. Numerous gaps in exploration coverage, anddocumentations of unexplained indicator minerals can befound. However, there exists a considerable legacy of pub-lic documents, including abundant company reports lodgedwith the government authorities dating back to the 1970srecording the methods and results of WA diamond explo-ration. These data have been recently compiled in a largedataset (Geological Survey of Western Australia 2018)drawing from ~ 4200 company reports and resulting inover 88,000 sample descriptions and over 30,000 good-quality mineral chemical analyses. Included are recordsof 523 in-situ occurrences of rocks with diamond potential,of which 63 have associated age determinations. Thestructure and methods for populating the database aredescribed in Hutchison (2018a) and a detailed interpreta-tion is provided by Hutchison (2018b).
In order to assess the effectiveness of prior explorationand draw attention to under-explored prospective areas,data from Geological Survey of Western Australia(2018) have been combined with literature data to modeldiamond prospectivity. This has been carried out usingtwo approaches; a detailed critique of mantle mineralchemistry based on six small-scale subdivisions of theState, and a modelling based on 67 regional geologicalsubdivisions based on quantifiable criteria and followingmodifications to the methodology applied to Australia’sNorthern Territory (NT) (Hutchison 2011 and 2013).
Methodology
State subdivisions
For the purpose of mantle mineral chemical subdivi-sions, the State has been divided into six geographicareas (Fig. 1). These comprise the Kimberley Basinand Paleo-Mesoproterozoic orogens constituting the ex-posed parts of the North Australian Craton (NAC), thePilbara Craton (WAC Pilbara), the Yilgarn Craton (WACYilgarn), the remaining portions of the West AustralianCraton (WAC), the rocks to the west and south of theWest Australian Craton (WA West), and the remainingrocks south and east of the exposed parts of the NAC(WA East). The State has been further subdivided into67 non-overlapping geological regions covering thewhole of on-shore WA modified from Martin et al.(2016). Exclusively off-shore regions have been ignored,as have orogenic subdivisions in cases where they havebeen superimposed on more tightly constrained litholog-ical regions. Each region constitutes a reasonably tightspan of geological time, with a consistent geology, andthe average size is suitable to incorporate statisticallymeaningful instances of diamond exploration data.
Regional diamond prospectivity modelling
Three quantifiable criteria have been identified as criticalto diamond prospectivity. These are the extent and suc-cess of prior diamond exploration, the age range of sur-face rocks relative to the age of known diamondiferousand diamond-potential volcanic rocks, and the thicknessand other physical characteristics of the mantle litho-sphere. Each of the 67 WA regions has been assessedon the basis of these three criteria with scores assignedfollowing the procedures described in Table 1.
Prospectivity based on sampling history
The number of onshore samples taken for the purpose of dia-mond indicator testing (including diamond-only) was countedfor each prospectivity region with results lodged in the sup-plementary data appendix (Supplementary Table 1). Samplesthat contained diamond-indicator minerals were also counted.The scoring method (Table 1a; illustrated in Fig. 2) is based onthe principle that under-sampled areas provide more opportu-nity for new discoveries and are therefore favoured overheavily sampled regions. However, regions which have seenno diamond exploration sampling whatsoever score least be-cause it is assumed that there are good geological reasons for aregion to have been completely discounted. Furthermore, re-gions where a high proportion of samples return positivevisually-identified indicator minerals are favoured over those
Diamond exploration and regional prospectivity of Western Australia S739

with low recovery success. The definitions of sample density– reconnaissance, regional and local-scale – followMcMartinand McClenaghan (2001).
Prospectivity based on geological age
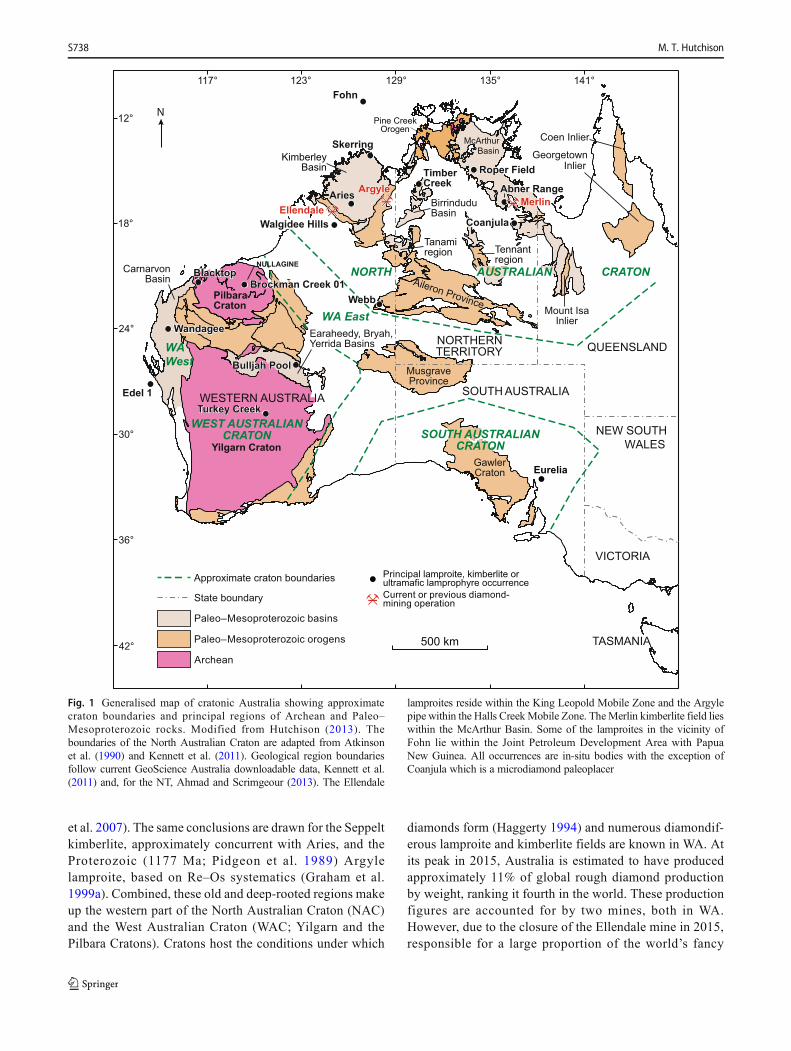
In order to be exploited economically, diamondiferousbodies must be close to surface. Hence to assess thelikelihood that this is the case, it is important to under-stand both the likely age of intrusion (derived fromknown ages of diamondiferous rocks elsewhere) and theages of country rocks in the area of interest. Both criteriaare known, from Geological Survey of Western Australia(2018) and Martin et al. (2016) respectively. Hence attri-bution of WA regions with relative prospectivity scoresbased on age can be achieved. The criteria used are de-scribed in Table 1b and illustrated in Fig. 3. The methodcompares the ages of all-diamond prospective rocks inWA to ages of rocks in particular regions. However,the full range of emplacement ages are not representedin all six large geographic areas. For example, the youn-gest lamproites (ca 20 Ma) are largely restricted to theEllendale field (Fig. 1) whereas Cenozoic ages are
unknown among diamond-prospective rocks in theWAC. As the number of known emplacement ages in-creases, future iterations of the current methodology maybenefit from restricting comparison of regional rock ageranges with known emplacement ages from within a ~500 km buffer zone.
Prospectivity based on lithosphere characteristics
Understanding mantle structure is a critical component inregional-scale diamond exploration. The thickness of mantlelithosphere provides the strongest control on the formation ofdiamonds (Haggerty 1994). However, its morphology andoverlying crustal features imposes the greatest influence ondiamond emplacement at surface (Helmstaedt and Gurney1995; White et al. 1995; Haggerty 1999). Australia’s knowndiamond deposits often occur at step-changes in lithospherethickness, due to the concurrence of conditions appropriate todiamond stability and volcanism (O’Neill et al. 2005). Oncemantle weaknesses or strong contrasts in mantle architecturearise, they can give rise to melt generation and volcanism overextended periods of time. Examples include the considerablerange of ages – and compositions – of volcanism associated
Table 1 Prospectivity scoring criteria based on sampling history (a), age of exposed rocks (b) and mantle lithosphere characteristics (c)
Ranking Description n
(a) Sampling history scoring criteria
1 Reconaissance-scale sampling (< 1 sample per 100 km2) with good recovery (> 1/3rd of samples are indicator positive) 8
2 Regional-scale sampling (between 1 sample per 4 km2 and 1 sample per 100 km2) with good recovery, or reconaissance-scalewith reasonable recovery (1/20th to 1/3rd of samples are indicator-positive)
10
3 Local-scale sampling (> 1 sample per 4 km2) with good recovery or regional with reasonable recovery 18
4 Local-scale sampling with reasonable recovery or reconaissance-scale with poor recovery (< 1/20th of samples are indicator positive) 7
5 Poor recovery from regional or local sampling density 4
6 No sampling conducted 20
(b) Regional age range scoring criteria
1 All rocks pre-date oldest kimberlite (Turkey Creek; 2128 Ma) 10
2 All rocks pre-date oldest lamproite (Yanyare-02; 1724 Ma) 7
3 All rocks pre-date mined diamondiferous bodies (Argyle, 1177 Ma and Ellendale 9, 24 Ma) 19
4 At least some rocks are older than the youngest kimberlite (Skerring; 800 Ma) but are not all older than Argyle (1177 Ma) 19
5 All rocks are younger than the youngest kimberlite (Skerring, 800 Ma) but are also older than S.W. Kimberley lamproites(Ellendale 11; 25.2 Ma)
4
6 Some rocks are younger than the youngest of the S.W. Kimberley lamproites (Mt Gytha; 17 Ma) 8
(c) Lithosphere thickness and density scoring criteria
1 On or near craton, edge of thickest lithosphere 16
2 On-craton, thickest lithosphere 24
3 Off-craton, thickest lithosphere 10
4 On or near craton, thinnest lithosphere 11
5 Far off-craton, medium lithosphere thickness 4
6 Off-craton, thinnest lithosphere 2
n number of regions assigned to each ranking
M. T. HutchisonS740

with the peripheries of the Yilgarn Craton (Fig. 4) illustratedby ca 1324 Ma kimberlites at Jewill (Phillips et al. 1997), ca849 Ma melilitite volcanics at Norseman (Robey et al. 1989)and ca 305 Ma melnoites at Bulljah Pool (Hamilton and Rock1990). Yet longer-lived diamond-hostingmagmatism is appar-ent around the NAC, with intrusions spanning from ca1177 Ma at Argyle (Pidgeon et al. 1989) to ca 17 Ma at Mt.Gytha, Ellendale (Jaques et al. 1984a).
Australia benefits from an extensive array of seismologicalrecording stations fromwhich shear wave velocity profiles aremeasured (Fishwick et al. 2006) and current mantle thickness(Fig. 5) is derived (lithosphere/asthenosphere boundary;Kennett et al. 2013). The shear wave velocity profile at200 km depth (Fishwick et al. 2006) and the topography ofthe base of the mantle lithosphere have been used to subdividethe State following a methodology (Table 1c) favouring thicklithospheric mantle and in particular, the edges of thick blocksof lithospheric mantle (Fig. 5). In cases where a region lieswithin more than one lithosphere polygon, the average scoreby area has been used.
For each geological region the scores (from 1 to 6) for eachof the three criteria; sampling history, age and underlying
mantle lithosphere architecture, were added (Table 2). Theregions were ordered (ranked; 1st, 2nd equal, 4th equal etc.)resulting in thirteen groups of equally-ranked regions whichwere assigned a category (from one – most prospective, tothirteen – least prospective).
Mantle mineral modelling
Mineral chemical characteristics are the single most importantcriteria, where available, for identifying diamondprospectivity of the deep Earth below any given near-surfacelocation. However, in the WA diamond exploration database(Geological Survey of Western Australia 2018) only 25% ofsamples reported to have visually-identified indicator minerals(Fig. 4) have corresponding mineral chemistry (3411 of13,659 sub-samples). Consequently, insufficient data exist toallow mineral chemistry to be a statistically robust criteria atthe resolution of 67-regions for the study described previous-ly. Notwithstanding this shortcoming, abundant mineralchemical data do exist for locations withinWA and inspectionof this data provides useful insights into where mineral chem-ical techniques yielded exploration dividends and where
0
20
40
60
80
100
0 1 10 100 1 000 10 000 100 000
Sam
ple
succ
ess
(indi
cato
r pos
itive
per
cent
age)
Sample density (samples per 100 km × 100 km)
1 2
2
3
3 4
4 5 5
Sampling density poorer than 1 per 10 × 10 km –Reconnaissance
Sampling density less than 1 per 2 × 2 km –
RegionalSampling density better than
1 per 2 × 2 km – Local
Biranup Zonen = 1
Rudall Provincen = 6
Eastern Goldfieldsn = 3101
Wolfe Basinn = 4
Northern Bonaparte Basinn = 64
Marymia Inlier, Yilgarnn = 6825
Musgrave Provincen = 49 Canning Basin
n = 3420
Aileron Provincen = 30
Ord Basinn = 138
Roebuck Basinn = 27
Hamersley Basinn = 449
Pilbara Cratonn = 7094
Fig. 2 Sampling success versus sampling density for diamondexploration samples from WA geological regions. Calculations arebased on data derived from Geological Survey of Western Australia(2018). Selected regions are labelled. Sampling success is measured asthe percentage of samples collected for diamond indicator minerals thatreturned a positive recovery (i.e. at least one visually determined indicatormineral, including diamond). Sampling density is the number of samples(n) taken per 10,000 km2 area within each region. Bold black numbers
represent prospectivity scores assigned to regions plotting within shadedareas of the chart and following the methodology in Table 1. A score of 1is assigned to the most prospective regions. Completely unsampled areas,not represented in the figure, score lowest (6) based on the assumptionthat they have been neglected for sound geological reasons. NT data(black dots) are provided for comparison (Hutchison 2013) showingthat NT diamond exploration has covered a similar sampling densityrange but with fewer high success regions
Diamond exploration and regional prospectivity of Western Australia S741
shortcomings in approaches useful elsewhere may exist. Themineral chemical approach has the advantage that it can bequeried in a more sophisticated and varied manner than visualindicator mineral identification and the window provided into
the lithosphere relates to the time of emplacement rather thanthe present-day picture provided by geophysics. Therefore,the two approaches to understanding diamond prospectivityapplied herein complement each other.
00 500 1000 1500 2000 2500 3000
Aileron Province
Amadeus Basin (Phase 1)
Amadeus Basin (Phase 2)
Arid Basin
Ashburton Basin
Badgeradda Basin
Barren Basin
Bastion Basin
Biranup Zone
Birrindudu Basin
Bresnahan Basin
Bryah Basin
Canning Basin
Carr Boyd Basin
Collier Basin
Earaheedy Basin
Eastern Goldfields Superterrane
Edmund Basin
Eucla Basin
Fortescue Basin
Fraser Zone
Gascoyne Province
Granites–Tanami Orogen
Gunbarrel Basin
Hamersley Basin
Kimberley Basin
Lamboo Province
Louisa Basin
Moora Basin
Murraba Basin
Musgrave Province
Narryer Terrane
Nornalup Zone
Northern Bonaparte Basin
Northern Carnarvon Basin
Northern Foreland, Albany–Fraser
Officer Basin (Phase 1)
Officer Basin (Phase 2)Ord Basin
Osmond Basin
Perth Basin
Pilbara Craton
Pinjarra Orogen
Ragged Basin
Recherche Supersuite
Red Rock Basin
Roebuck Basin
Rudall Province
Salvation Basin
Scorpion Basin
South West Terrane
Southern Bonaparte Basin
Southern Carnarvon Basin
Speewah BasinTanami Basin
Texas Downs Basin
Tropicana Zone
Turee Creek Basin
Victoria Basin
Wolfe Basin
Woodline Sub-basin
Yandanooka Basin
Yeneena Basin
Yerrida Basin
Yilgarn Craton, Goodin InlierYilgarn Craton, Marymia Inlier
Youanmi Terrane
Age (Ma)
Mt.
Gyt
ha
(17
Ma)
Wan
dag
ee (
161
Ma)
Ed
el 1
(26
1 M
a)
Ske
rrin
g(8
00 M
a)
Arg
yle
AK
1(1
177
Ma)
Yany
are-
02(1
724
Ma)
Turk
ey W
ell
(212
8 M
a)
Po
nto
n C
reek
(235
0 M
a)
WA
Eas
tN
AC
WA
CW
A W
est
M. T. HutchisonS742
Results
Regional prospectivity modelling
The results for sampling success (Table 2) are illustrated inFig. 2. The Biranup Zone distinguishes itself by having a100% sampling success rate. This result derives from the factthat the region only reports one sample from which 100picroilmenites were recovered. The small number of samplesrecovered from some regions, particularly those with highindicator-positive proportions (Aileron Province, BiranupZone, Musgrave Province, Roebuck Basin, Rudall Provinceand Wolfe Basin) should be treated with caution. However, avery small number of indicator minerals can be extremelysignificant (as evidenced by the discovery of Argyle basedon very few indicators; Muggeridge 1995) and the two othermodelling variables serve to buffer any shortcomings of sam-pling data for regions with low sample numbers. The moststatistically significant top sampling score (value of one) de-rives from the Canning Basin (Fig. 4) from which 3420 sam-ples were taken and with a success rate of 58%.
For age-related prospectivity (Table 2), the Yilgarn Cratonscored particularly well with all six Yilgarn Craton regionsreceiving a top score. The Pilbara Craton also received a scoreof one in addition to the Fortescue, Hamersley and TureeCreek Basins elsewhere in the WAC. No NAC regions re-ceived top scores for prospectivity based on age.
Based on lithosphere thickness (Table 2), regions in easternWA received numerous top scores (Osmond, Red Rock, TexasDowns and Victoria Basins) as a consequence of the NAC andits margins extending into the NT (Kennett et al. 2013). Both ofthe regions at the margins of the Yilgarn Craton (Goodin andMarymia Inliers) received top scores as did four regions in theNAC (Bastion, Birrindudu and Tanami Basins and theGranites–Tanami Orogen) and six regions in the WAC (Bresnahan,Bryah, Collier, Hamersley, Turee Creek and Yerida Basins).
Combined, no region achieved a perfect score of three(Table 2). However, the single most prospective region,the Hamersley Basin of the WAC scored four. Equal sec-ond were the Eastern Goldfields Superterrane and GoodinInlier, both parts of the Yilgarn Craton. Category three-ranked regions are the WAC’s Ashburton Basin, BiranupZone, Bryah and Fortescue Basins and the NarryerTerrane, the Lamboo Province of the NAC, the PilbaraCraton, and Marymia Inlier and the Youanmi Terrane ofthe Yilgarn Craton. Poorest scoring areas lie the farthestfrom craton margins and with the youngest rocks, such asthe Eucla Basin. The 13 discrete prospectivity categories(Table 2) have been used to colour-code the prospectivitymap of the State (Fig. 4). Inspection of the map showsthat as might be expected, most prospective areas are as-sociated with the cratons. However, perhaps surprisingly,the established diamond producing areas of the NAC loseout to the WAC and its sub-cratons. Parts of these areasare under-explored, and yet with extremely attractive in-dicator mineral recoveries and mantle architecture.Furthermore, as will be discussed below, mineral chemicalresults lend further credence to the concept that future WAdiamond exploration would benefit from particular focusbeing applied towards the WAC.
Indicator minerals
The overwhelming majority (~ 90%) of surface and drill-holeexploration samples for diamond in WA (Geological Surveyof Western Australia 2018) have been taken for separation ofdiamonds or other minerals indicating diamond potential.Sampled material has more or less been evenly split betweenalluvial and loam samples with a sample weight mode of45 kg. Themost common range of sizes inspected for mineralshas been 0.3 to 1.5 mm. Median heavy mineral recovery is0.03% by weight (equivalent to 8 g from a 25 kg sample)although alluvial samples typically yield higher proportions.Non-diamond indicators were identified by visual inspectionin 28% of samples and 80% of good-quality mineral compo-sitional analyses are classified as genuine indicators.Diamonds occurred in 3.5% of indicator mineral samples.The large majority of non-diamond indicators are spinels,and typically double the number of spinels are found withsizes under 0.4 mm. Spinels are relatively durable in the harshWestern Australian weathering environment compared to oth-er typically sought indicator minerals (aside from diamond).Garnet xenolith samples from Argyle studied by Jaques et al.(1990) showed that garnet had in all cases been replaced bykelyphite-like symplectite growth of Al-rich pyroxenes, Al-spinel and secondary silicates. In this case, garnet was alreadysignificantly compromised before release into the surface sed-iment environment. In the alluvial diamond deposits associat-ed with Argyle, picroilmenite and Cr-diopside are found to be
�Fig. 3 Ranges of ages of rocks present in geological regions ofWA in thecontext of diamond-prospective rocks. Regions are arranged according tocraton or off-craton association and youngest, followed by oldest rockspresent. Known kimberlite ages (Turkey Well, Jourdan et al. 2012 toSkerring, Pidgeon et al. 1989) lie between the green bars, andlamproites (Yanyare-02, Matchan et al. 2009 to Mt. Gytha, Jaques et al.1984a) lie between the purple bars. The oldest potentially diamond-associated volcanic rock, at Ponton Creek (Graham et al. 2004) isshown in grey. The most diamondiferous body known, the Argyle AK1lamproite (Pidgeon et al. 1989) is represented by a dark blue line. Agedata for the ultramafic lamprophyre at Edel 1, brown, and WandageeM142, red, derive from Killar (1972) and Pidgeon et al. (1989)respectively. The following WAC regions contain rocks extending toages greater than the 3000 Ma displayed on the figure: Goodin andMarymia Inliers of the Yilgarn Craton (3131 Ma), Narryer Terrane(4000 Ma), South West Terrane (3100 Ma), Youanmi Terrane(3131 Ma) and the Pilbara Craton (3800 Ma)
Diamond exploration and regional prospectivity of Western Australia S743

absent (Deakin et al. 1989). However, indicator minerals otherthan spinel and diamond do occasionally survive (Fig. 4), anddiopside, garnet, ilmenite, monticellite, orthopyroxene, oliv-ine, perovskite, phlogopite, pseudobrookite and tourmaline
with indicator chemistries have all been recovered from ex-ploration samples. Mineral chemical data for clinopyroxenes,garnets, ilmenites and spinels have been scrutinised and re-sults are discussed below.
Prospectivitycategory
1 (high)2345678910111213 (low)
Und
erd
expl
ore
Visually identified indicators
Chromite
Percentage
Pyrope-almandine garnetIlmeniteCr diopsideOtherDiamond
OccurrenceCarbonatiteKimberliteKimberlite or lamproiteLamproiteLamprophyreLamprophyre, ultramaficUnknown
125°120°115°
15°
20°
25°
30°
35°
250 km
CanningBasin
Youanmi Terrane
Eucla Basin
South WestTerrane
KimberleyBasin
EasternGoldfields
Superterrane
GunbarrelBasin
OfficerBasin
PerthBasin
SouthernCarnarvon
Basin
Hamersley Basin
Edmund Basin
OrdBasin
NorthernCarnarvon
Basin
OfficerBasin
Norseman
Clear Streak Well
Akbar
CueMileura
Turkey Well
Bulljah PoolJewill
Nabberu
Barlee
Wandagee
UL1
Eerstelling
Blacktop
Brockman Creek
Edel 1
JYP58
Webb
Avocado
BHPM-2
Ellendale
Mt Gytha Walgidee Hills
AriesArgyle
AK1
BeagleAshmore
Pteropus
N
M. T. HutchisonS744

Clinopyroxene chemistry
WA clinopyroxene chemistries vary considerably. However,significant overlap amongst different geographic areas is ap-parent (Fig. 6).
The majority of WAC clinopyroxenes fall within therelatively Al-poor garnet peridotite field (after Ramsayand Tompkins 1994). Al-depletion is particularly evidentamongst Pilbara and Yilgarn Craton samples although thelatter show concurrent Cr-depletion such that much of thecompositional range is consistent with an association witheclogites. The Yilgarn Craton clinopyroxenes also show aseparate Al-enriched field consistent with derivation fromspinel peridotite which forms at shallower depths than thediamond stability field.
WA East samples show an overlap into lower Cr composi-tions (under 1.5 wt% Cr2O3) similar to samples immediatelyacross the border in the NT (Fig. 6). They also coincide withCr-diopside compositions to the eastern extent of the NAC(also in the NT). An incremental decrease in Al-content,reflecting an association with garnet instead of spinel, is evi-dent from samples from Ellendale 7 to Ellendale 4 and BowHill – Argyle has extremely Al-depleted clinopyroxenes(Jaques et al. 1990). Elsewhere in the NAC, samples fromthe Skerring kimberlite are relatively Cr-poor, overlappingwith regional samples of eclogitic composition. Skerring isunusual within NAC kimberlites because it contains a discretenodule (megacryst) suite, and samples are sub-calcic. Theseobservations indicate high equilibrium temperatures (over1400 °C) and depths relating to magmatic precursors to theultimate kimberlite host (Nixon et al. 1987). None of theclinopyroxenes from Skerring reported by Ramsay (1992)which are classed as indicators following Ramsay andTompkins (1994) would be classified as Cr-diopsides basedon the Cr2O3 composition (they have <1 wt%). Some Argyleclinopyroxenes would also fail the Cr2O3 threshold. Suchgrains may also fail the test of being sufficiently vivid green
in colour to be considered for chemical classification in thefirst place. Hence false-negatives among clinopyroxenes inprior WA exploration samples may be expected.
Garnet chemistry
Pyrope–almandine garnets have been classified following themethodology of Grütter et al. (2004). The broad geographicalsubdivisions of Western Australia reveal different distribu-tions of garnet chemistry. The lherzolite trends are increasing-ly Ca-depleted from the NAC in WA (including Ellendale,Argyle and Bow River), through the WAC, to the Merlin field(NT) samples (Fig. 7). However, WAC samples also show amuch higher proportion of G10 garnets with an intermediate-Ca lherzolite trend. Following the world-wide trend favouringharzburgitic garnet-bearing host rocks as more indicative ofdiamonds than those dominated by lherzolite, theWACwouldbe more prospective than the NAC. However, throughout theKimberley region and the surrounds of the NAC, no clear
125°120°115°
15°
20°
25°
30°
35°500 km
Mantle lithosphere thickness (km)70
240
NorthAustralian
Craton
PilbaraCraton
Yilgarn Craton
WestAustralian
Craton
2
3
5
1
2
6
4
4
6
1
2
1
5
4
4
1
4
66
N
Fig. 5 Map of lithosphere thickness. Boundaries of WA cratonic regionsat surface, followingMartin et al. (2016), are indicated as described in thekey. White-bordered polygons describe areas of differing diamondprospectivity based on lithosphere characteristics with 1 being mostfavourable and 6 being the least. Blue colouration denotes mantlelithosphere thickness – depth to the lithosphere/asthenosphere boundary–adapted from Kennett et al. (2013)
�Fig. 4 Prospectivity map of Western Australia. Geological regions areranked for prospectivity following the methodology described in the text,in the context of mantle structure, the age of surface rocks, the extent ofsample coverage and recovery of visually-determined indicators. Rankingfollows the key, with 1 being the most prospective area and 13 the least.In-situ bodies with diamond potential (tested or otherwise) are shown bystars colour-coded according to the key with representative locationslabelled. Sample site areas are indicated by shading where unshadedareas lie within 20 km from an exploration sample location. Pie chartsymbols indicate sites of recovery of visually-determined indicatorminerals with colours following the key. For clarity, indicator mineralrecoveries from all samples within blocks of 0.2 degrees of longitudeand latitude are summed, and contribute proportionally to each pie chartsymbol. This method of displaying the data results in the artificialregularity of sampling locations displayed. Diamond and chromitedistinguish themselves as the most robust and hence commonly-recovered indicator minerals. Much of WA is under-explored withprospective areas evident in the NAC and particularly the WAC
Diamond exploration and regional prospectivity of Western Australia S745

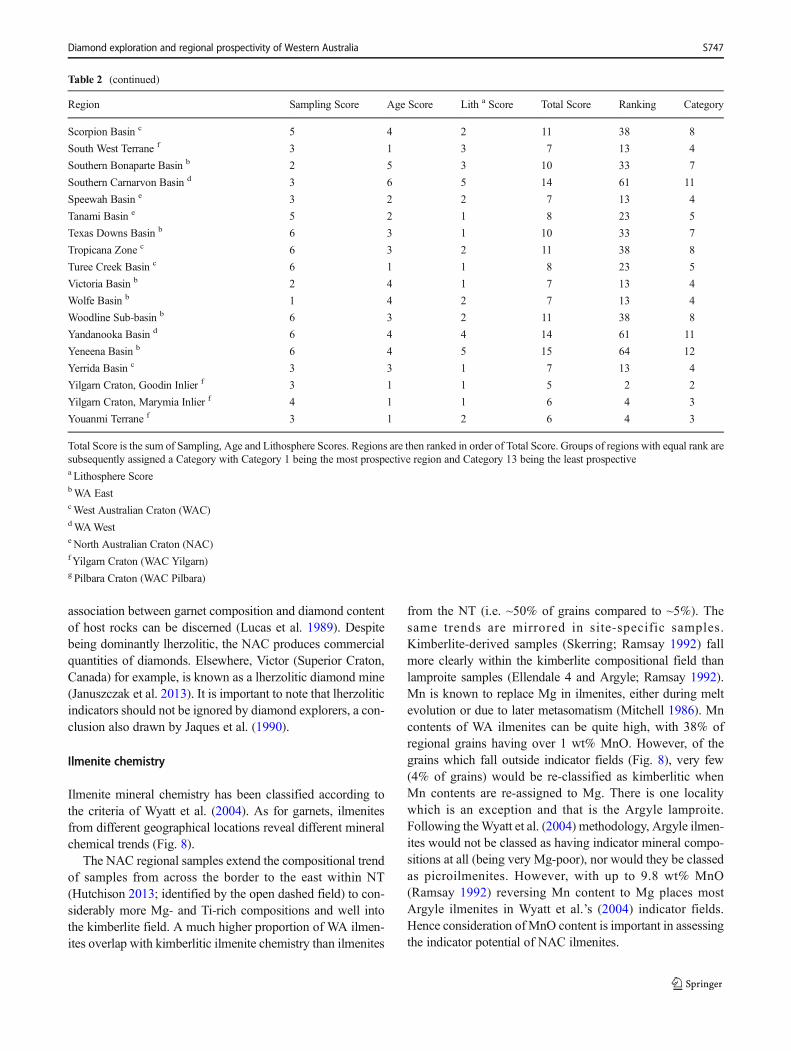
Table 2 Prospectivity scores and rankings of WA geological regions
Region Sampling Score Age Score Lith a Score Total Score Ranking Category
Aileron Province b 1 3 4 8 23 5
Amadeus Basin (Phase 1) b 3 4 4 11 38 8
Amadeus Basin (Phase 2) b 6 5 5 16 65 13
Arid Basin c 6 3 2 11 38 8
Ashburton Basin c 2 2 2 6 4 3
Badgeradda Basin d 3 4 3 10 33 7
Barren Basin c 6 3 4 13 53 10
Bastion Basin e 6 4 1 11 38 8
Biranup Zone c 1 3 2 6 4 3
Birrindudu Basin e 4 3 1 8 23 5
Bresnahan Basin c 6 3 1 10 33 7
Bryah Basin c 3 2 1 6 4 3
Canning Basin b 1 6 4 11 38 8
Carr Boyd Basin b 3 4 4 11 38 8
Collier Basin c 5 4 1 10 33 7
Earaheedy Basin c 3 3 2 8 23 5
Eastern Goldfields Superterrane f 2 1 2 5 2 2
Edmund Basin c 2 3 2 7 13 4
Eucla Basin b 6 6 4 16 65 13
Fortescue Basin c 3 1 2 6 4 3
Fraser Zone c 6 3 2 11 38 8
Gascoyne Province c 2 3 2 7 13 4
Granites–Tanami Orogen e 5 2 1 8 23 5
Gunbarrel Basin b 4 6 3 13 53 10
Hamersley Basin c 2 1 1 4 1 1
Kimberley Basin e 3 2 2 7 13 4
Lamboo Province e 2 2 2 6 4 3
Louisa Basin b 3 4 2 9 31 6
Moora Basin d 6 4 3 13 53 10
Murraba Basin b 4 4 3 11 38 8
Musgrave Province b 1 4 3 8 23 5
Narryer Terrane f 3 1 2 6 4 3
Nornalup Zone c 6 3 4 13 53 10
Northern Bonaparte Basin b 2 6 4 12 51 9
Northern Carnarvon Basin d 4 6 6 16 65 13
Northern Foreland, Albany–Fraser Orogen c 6 4 2 12 51 9
Officer Basin (Phase 1) b 4 4 3 11 38 8
Officer Basin (Phase 2) b 6 5 3 14 61 11
Ord Basin b 1 5 2 8 23 5
Osmond Basin b 6 4 1 11 38 8
Perth Basin d 2 6 4 12 51 9
Pilbara Craton g 3 1 2 6 4 3
Pinjarra Orogen d 4 4 5 13 53 10
Ragged Basin c 6 3 4 13 53 10
Recherche Supersuite c 6 3 2 11 38 8
Red Rock Basin b 3 3 1 7 13 4
Roebuck Basin b 1 6 6 13 53 10
Rudall Province b 1 3 3 7 13 4
Salvation Basin c 3 4 2 9 31 6
M. T. HutchisonS746
association between garnet composition and diamond contentof host rocks can be discerned (Lucas et al. 1989). Despitebeing dominantly lherzolitic, the NAC produces commercialquantities of diamonds. Elsewhere, Victor (Superior Craton,Canada) for example, is known as a lherzolitic diamond mine(Januszczak et al. 2013). It is important to note that lherzoliticindicators should not be ignored by diamond explorers, a con-clusion also drawn by Jaques et al. (1990).
Ilmenite chemistry
Ilmenite mineral chemistry has been classified according tothe criteria of Wyatt et al. (2004). As for garnets, ilmenitesfrom different geographical locations reveal different mineralchemical trends (Fig. 8).
The NAC regional samples extend the compositional trendof samples from across the border to the east within NT(Hutchison 2013; identified by the open dashed field) to con-siderably more Mg- and Ti-rich compositions and well intothe kimberlite field. A much higher proportion of WA ilmen-ites overlap with kimberlitic ilmenite chemistry than ilmenites
from the NT (i.e. ~50% of grains compared to ~5%). Thesame trends are mirrored in site-specific samples.Kimberlite-derived samples (Skerring; Ramsay 1992) fallmore clearly within the kimberlite compositional field thanlamproite samples (Ellendale 4 and Argyle; Ramsay 1992).Mn is known to replace Mg in ilmenites, either during meltevolution or due to later metasomatism (Mitchell 1986). Mncontents of WA ilmenites can be quite high, with 38% ofregional grains having over 1 wt% MnO. However, of thegrains which fall outside indicator fields (Fig. 8), very few(4% of grains) would be re-classified as kimberlitic whenMn contents are re-assigned to Mg. There is one localitywhich is an exception and that is the Argyle lamproite.Following theWyatt et al. (2004) methodology, Argyle ilmen-ites would not be classed as having indicator mineral compo-sitions at all (being very Mg-poor), nor would they be classedas picroilmenites. However, with up to 9.8 wt% MnO(Ramsay 1992) reversing Mn content to Mg places mostArgyle ilmenites in Wyatt et al.’s (2004) indicator fields.Hence consideration ofMnO content is important in assessingthe indicator potential of NAC ilmenites.
Table 2 (continued)
Region Sampling Score Age Score Lith a Score Total Score Ranking Category
Scorpion Basin c 5 4 2 11 38 8
South West Terrane f 3 1 3 7 13 4
Southern Bonaparte Basin b 2 5 3 10 33 7
Southern Carnarvon Basin d 3 6 5 14 61 11
Speewah Basin e 3 2 2 7 13 4
Tanami Basin e 5 2 1 8 23 5
Texas Downs Basin b 6 3 1 10 33 7
Tropicana Zone c 6 3 2 11 38 8
Turee Creek Basin c 6 1 1 8 23 5
Victoria Basin b 2 4 1 7 13 4
Wolfe Basin b 1 4 2 7 13 4
Woodline Sub-basin b 6 3 2 11 38 8
Yandanooka Basin d 6 4 4 14 61 11
Yeneena Basin b 6 4 5 15 64 12
Yerrida Basin c 3 3 1 7 13 4
Yilgarn Craton, Goodin Inlier f 3 1 1 5 2 2
Yilgarn Craton, Marymia Inlier f 4 1 1 6 4 3
Youanmi Terrane f 3 1 2 6 4 3
Total Score is the sum of Sampling, Age and Lithosphere Scores. Regions are then ranked in order of Total Score. Groups of regions with equal rank aresubsequently assigned a Category with Category 1 being the most prospective region and Category 13 being the least prospectivea Lithosphere ScorebWA EastcWest Australian Craton (WAC)dWAWeste North Australian Craton (NAC)f Yilgarn Craton (WAC Yilgarn)g Pilbara Craton (WAC Pilbara)
Diamond exploration and regional prospectivity of Western Australia S747

Ilmenites from the WAC show similar compositional vari-ations for indicator composition grains as WA samples fromthe NAC (Fig. 8). However, samples from the EasternGoldfields Superterrane of the Yilgarn Craton distinguish
themselves as having the most abundant high Ti and highMg kimberlite-field ilmenites of any WA samples.Incrementally, Hamersley Basin, Marymia Inlier and SouthWest Terrane ilmenites, followed by off-craton examples to
Earaheedy / Hamersely BasinsPilbara CratonYilgarn Craton
Kimberley BasinArgyle (Ramsay 1992)Bow Hill (Ramsay 1992)Ellendale 4 (E7 - ) (Ramsay 1992)Skerring (Ramsay 1992)
NT East (Hutchison 2013)NT West (Hutchison 2013)
West Australian Craton
North Australian Craton
CGPClinopyroxene from garnet peridotite
0 1 2 3 4 5 6 7 80
1
2
3
4
5
CrO 2
3(w
t%)
Al O2 3 (wt%)
CPP
CLS Clinopyroxene from spinel peridotite
Eclogitic, megacrystic and cognate clinopyroxene
WA EastOff-craton
Fig. 6 Chemical compositions of clinopyroxenes in terms of Cr2O3 andAl2O3. IndividualWA data points are fromGeological Survey ofWesternAustralia (2018) and are augmented by locality-specific data fromRamsay (1992) which are emphasised by unfilled polygons. Ellendale 7
(E7) samples are discriminated from Ellendale 4 samples by the additionof a black dot within the red triangle symbol. The extension of the NACeast of WA is represented by NT data (Hutchison 2013)
0 2 4 6 8 10 12 14CaO (wt%)
0
2
4
6
8
10
12
CrO 2
3
Off-craton WA East
West Australian CratonNorth Australian Craton
Argyle / Bow Hill Lamproites
Ellendale Lamproites
G10 (D)
G4 (D)G0 G3 (D)
G10
G12G9
Merlin Kimberlites (NT)
Skerring Kimberlite
(wt%
)
Fig. 7 Chemical compositions of pyrope–almandine–grossular garnets in terms of CaO and Cr2O3. Point data from allWA andNTsamples with Argyle,Bow Hill and Skerring data from Ramsay (1992) and Merlin (NT) data from Reddicliffe (1999)
M. T. HutchisonS748
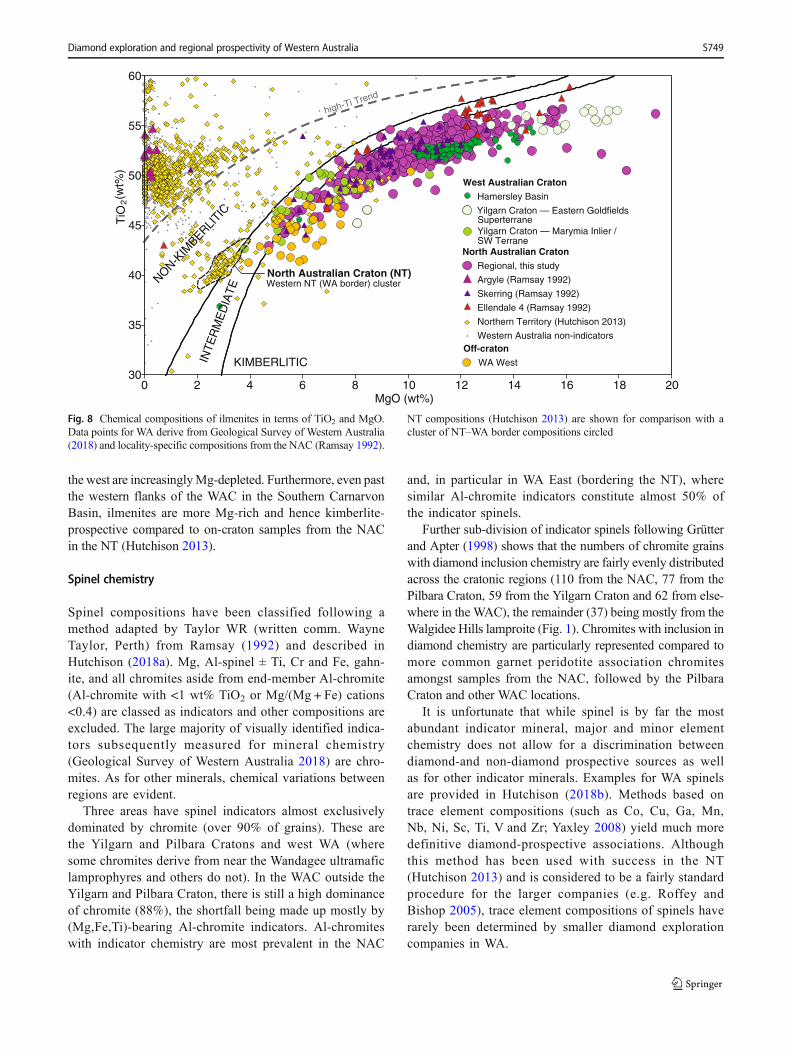
the west are increasinglyMg-depleted. Furthermore, even pastthe western flanks of the WAC in the Southern CarnarvonBasin, ilmenites are more Mg-rich and hence kimberlite-prospective compared to on-craton samples from the NACin the NT (Hutchison 2013).
Spinel chemistry
Spinel compositions have been classified following amethod adapted by Taylor WR (written comm. WayneTaylor, Perth) from Ramsay (1992) and described inHutchison (2018a). Mg, Al-spinel ± Ti, Cr and Fe, gahn-ite, and all chromites aside from end-member Al-chromite(Al-chromite with <1 wt% TiO2 or Mg/(Mg + Fe) cations<0.4) are classed as indicators and other compositions areexcluded. The large majority of visually identified indica-tors subsequently measured for mineral chemistry(Geological Survey of Western Australia 2018) are chro-mites. As for other minerals, chemical variations betweenregions are evident.
Three areas have spinel indicators almost exclusivelydominated by chromite (over 90% of grains). These arethe Yilgarn and Pilbara Cratons and west WA (wheresome chromites derive from near the Wandagee ultramaficlamprophyres and others do not). In the WAC outside theYilgarn and Pilbara Craton, there is still a high dominanceof chromite (88%), the shortfall being made up mostly by(Mg,Fe,Ti)-bearing Al-chromite indicators. Al-chromiteswith indicator chemistry are most prevalent in the NAC
and, in particular in WA East (bordering the NT), wheresimilar Al-chromite indicators constitute almost 50% ofthe indicator spinels.
Further sub-division of indicator spinels following Grütterand Apter (1998) shows that the numbers of chromite grainswith diamond inclusion chemistry are fairly evenly distributedacross the cratonic regions (110 from the NAC, 77 from thePilbara Craton, 59 from the Yilgarn Craton and 62 from else-where in the WAC), the remainder (37) being mostly from theWalgidee Hills lamproite (Fig. 1). Chromites with inclusion indiamond chemistry are particularly represented compared tomore common garnet peridotite association chromitesamongst samples from the NAC, followed by the PilbaraCraton and other WAC locations.
It is unfortunate that while spinel is by far the mostabundant indicator mineral, major and minor elementchemistry does not allow for a discrimination betweendiamond-and non-diamond prospective sources as wellas for other indicator minerals. Examples for WA spinelsare provided in Hutchison (2018b). Methods based ontrace element compositions (such as Co, Cu, Ga, Mn,Nb, Ni, Sc, Ti, V and Zr; Yaxley 2008) yield much moredefinitive diamond-prospective associations. Althoughthis method has been used with success in the NT(Hutchison 2013) and is considered to be a fairly standardprocedure for the larger companies (e.g. Roffey andBishop 2005), trace element compositions of spinels haverarely been determined by smaller diamond explorationcompanies in WA.
KIMBERLITIC
high-Ti Trend
North Australian Craton (NT)Western NT (WA border) cluster
West Australian Craton
Hamersley Basin
Yilgarn Craton — Eastern GoldfieldsSuperterraneYilgarn Craton — Marymia Inlier /SW Terrane
North Australian Craton
Regional, this study
Argyle (Ramsay 1992)
Skerring (Ramsay 1992)
Ellendale 4 (Ramsay 1992)
Northern Territory (Hutchison 2013)
Western Australia non-indicators
NON-KIM
BERLITIC
INTE
RM
ED
IATE
0 2 4 6 8 10 12 14 16 18 20MgO (wt%)
30
35
40
45
50
55
60
TiO
2.(w
t%)
Off-craton
WA West
Fig. 8 Chemical compositions of ilmenites in terms of TiO2 and MgO.Data points for WA derive from Geological Survey of Western Australia(2018) and locality-specific compositions from the NAC (Ramsay 1992).
NT compositions (Hutchison 2013) are shown for comparison with acluster of NT–WA border compositions circled
Diamond exploration and regional prospectivity of Western Australia S749

Discussion
Quantitative prospectivity modelling based on subdivision ofthe State into 67 regions, and mineral chemical scrutiny at asmaller scale, both draw attention to parts of the NAC andWAC and their extensions under cover as diamond prospec-tive. Subtle differences between neighbouring regions andvariations in mineral chemistry both regionally, and betweenand within known diamondiferous bodies, reflect complexgeological histories and ranges of sampled depth, both to thedetriment and benefit of diamond prospectivity. These providemarkers which diamond explorers would benefit from beingaware of in interpreting future exploration results.
The North Australian Craton
The diamondiferous character of the lamproites ofWA, whichare all associatedwith the NAC, separate them frommany nondiamond-bearing lamproite provinces elsewhere (Nixon et al.1984). This characteristic is evidenced by bulk rock chemistrywhich show more similarities with kimberlites than non-diamondiferous lamproites from other locations (Nixon et al.1984). On this basis, WA lamproites are postulated to havederived from unusually deep and it is a consequence of thisthat they have had the opportunity to incorporate diamondsamongst their mantle xenocrysts.
Variations in depth of origin
The increasing Al-content of clinopyroxenes from Argyle, toBow Hill, Ellendale 4, and Ellendale 7, and in regional sam-ples between the NAC and WA East (Fig. 6), is interpreted tobe due to a general decrease in sampling depth moving westand south through the NAC of WA. A detailed study fromindividual pipes supports this trend and also indicates changesin mantle geotherms. Garnet–clinopyroxene geothermometryof Argyle samples supports equilibrium conditions at 1050–1300 °C and 4.9–5.9 GPa, equivalent to 160–190 km in depthon a 41.5 mWm−2 geotherm (Luguet et al. 2009).Furthermore, some diamonds from Argyle are calculated tohave formed as deep as 280 km (9.3 GPa, 1500 °C; Liu et al.1990) – Taylor et al. (1990) favour a relatively hot equilibra-tion temperature (~1255 °C) for Argyle diamond formation.For Argyle, Griffin et al. (1988) also measured a temperaturerange of 400 °C over which Argyle diamonds grew, attribut-ing this to either spatial or temporal variations. A slightlycooler geotherm (40 mWm−2) is calculated from the consid-erably younger Neoproterozoic kimberlites at Seppelt andPteropus using Ni and Cr in garnet (Wyatt et al. 1999).Relatively cool temperatures (~ 1066 °C for Ellendale 4) arealso indicated at the ca 20 Ma Ellendale field from nitrogenaggregation measurements of diamonds (Taylor et al. 1990).Geothermobarometry based on Cr and Ni in pyropes from the
Aries kimberlite pipe in the Kimberley Basin place the equi-librium conditions of mantle material at 885–1025 °C, ~4–5 GPa along a cooler still 35–40 mWm−2 geotherm(Downes et al. 2007). In these cases, mantle temperaturemay be a function of diamond formation processes and/orage of volcanism. In any case, mineral chemistry data indicatecooler temperatures in southern and central NAC and greaterdepth in eastern NAC – both desirable characteristics for dia-mond formation and both borne out by diamond recovery incommercial or near-commercial quantities from each location.In other words, diamonds are evident in the Ellendale field,North Kimberley and Aries fields, compared to Argyle, fordifferent reasons.
Mantle lithosphere thickness is important but it should alsobe borne in mind that even in close proximity, different pipescan have considerably different diamond concentrations be-cause their melts derive from different depth, irrespective oflocal lithosphere thickness. For example, a large range in sam-pling depth between Seppelt 01 and Pteropus 02 only 20 kmapa r t i n t h e No r t h K imbe r l e y i s r e f l e c t e d i ngeothermobarometry from mantle mineral chemistry and var-iations in diamond grades between the two bodies (Wyatt et al.1999). Given enough samples, inspection of mineral chemis-try on a local-scale should be able to discriminate such bodiesusing diamond prospecting methods akin to those of Grütterand Tuer (2009).
Variations in mantle bulk chemistry
Considerable variation in mineral chemistry regionally (suchas evidenced by parallel lherzolitic trends in garnets; Fig. 7),and between and within NAC pipes also reflects complexity inmantle lithosphere compositions. A complex mantle history,including an enrichment event prior to magmatism is pro-posed for the Ellendale field based on Sr isotopic measure-ments (Jaques et al. 1984b). Initial Sr ratios are unusually highand variability within pipes (Allsop et al. 1985) suggests thatdifferent magma pulses derived from a mantle source whichwas heterogeneous on a local scale. Jaques et al. (1984a) in-terpret the Ellendale field to have derived from partial meltingof phlogopite-rich, metasomatised, garnet and diopside-poor,lherzolite and harzburgite, under CO2-poor conditions. Thepaucity of ilmenite and garnet indicator minerals is interpretedto evidence the depleted (garnet and clinopyroxene-poor)mantle chemistry, which at the same time had experienced along-term large-ion lithophile element (LILE)-enriched com-ponent. Ellendale samples demonstrate a large range in spinelchemistry with early Ti–Al–Mg chromite, through Ti–Mgchromite to Ti–chromite, also interpreted to be metasomaticin origin (Jaques 2016).
Edwards et al. (1992) note that Aries also possesses acomplicated range of textural, compositional and morpho-logical variations in spinels. They interpret these to be due
M. T. HutchisonS750
to a combination of factors relating to weathering, and re-equilibration during ascent and emplacement. However,they also attribute some variation to a complex interplayof magmatic reservoirs consistent with the observationthat the Aries pipes are multiply intruded. Similarly,Reddicliffe et al. (2003) propose that Ti-enrichment onSkerring chromites is a consequence of mantle metasoma-tism. Skerring also distinguishes itself by revealing aneclogitic component in low-Cr clinopyroxenes.
Jaques et al. (1990) report extremely Cr-rich chromite fromaltered spinel peridotite from Argyle. On the other hand, Al-rich spinel has also been observed to derive from weatheringof garnet at Argyle (Jaques et al. 1990) contributing to therange of spinel compositions in surface-derived explorationsamples. Based on significant potassium in Argyle peridotiticdiopsides, a metasomatic enrichment of the subcontinentallithospheric mantle is evidenced (Jaques et al. 1990). Thecomplexity of the mantle lithosphere below Argyle iscompounded by the fact that the abundant diamonds areinterpreted to be derived from eclogitic material accreted tothe craton root in the Proterozoic (Luguet et al. 2009).
The West Australian Craton
Similar variations to the NAC in both depth of origin andmantle composition are concluded from WAC in-situ bodies.By inference, these explain variations in mineral chemistry ofregional exploration samples, for example the variations in thechemistry of garnets, and clinopyroxenes (evidencingeclogite, spinel and garnet lherzolite). Using whole-rockSm–Nd and Re–Os systematics, Graham et al. (1999b) con-cluded that the kimberlites and melnoites north of the YilgarnCraton within the West Australian Craton’s Earaheedy Basinderive from a single mantle event. Although with differentages, isotope systematics indicate episodes of LREE enrich-ment associated with orogenesis, back-arc basin developmentand rift related magmatism to the west. This enrichmentcreated the mantle lithosphere conditions appropriate forthe generation and emplacement of the Nabberu and Jewillkimberlites and the Bulljah Pool ultramafic lamprophyres,triggered by suitable heating or de-pressuring events.Furthermore, rare low MgO and high ZnO and MnO chro-mites occur in the Nabberu kimberlites evidencing lowtemperature metamorphic re-equilibration (Shee et al. 1999).Spinel lherzolite xenoliths were identified in Bulljah Pool ul-tramafic lamprophyres, consistent with the array of mantle-derived minerals present in surrounding loams (Hamiltonand Rock 1990). The presence of these bodies, and atNabberu and Jewill raised the possibility that the YilgarnCraton, like other cratonic regions, has the potential for spo-radic arrays of diamondiferous rocks including around its mar-gins. These postulated bodies are incrementally being identi-fied (Fig. 4). However, given the expanse of under-explored
areas in the Yilgarn and other parts of the WAC, potentialexists for future discoveries.
Concluding remarks
The prospectivity model presented is based on an approachusing variables which are both regionally quantifiable andconsidered most insightful to diamond exploration, whilenot constrained by traditional mineral chemical discrimina-tory criteria. The WAC, and particularly the HamersleyBasin stand out as being of highest diamond prospectivityusing this approach. Numerous other factors have an influ-ence on the attractiveness of specific areas. Much of WA isremote and the cost/benefit considerations of explorationcan be heavily influenced by locality. The nature of countryrock in terms of its influence on remote sensing (such as theprevalence of Fe-rich rocks in the Hamersley Basin; Towie2004) can have significant negative effects. In contrast, theidentification of diamondiferous bodies, favourable miner-al chemistry and unconstrained indicator occurrences insurface samples are all positive unquantified variableswhich should be considered in exploration.
The WAC shows all mineral chemical criteria consistentwith a highly diamond-prospective area following traditionalexploration models targeting kimberlite –Al-depleted, Cr-richdiopsides, abundant harzburgitic (G10) garnets, high-Mgpicroilmenites, and chromites with compositions similar toinclusions in diamonds. However, strongly diamondiferousbodies from the NAC (the Argyle mine returns grades of ~680 carats per hundred tonnes; Boxer and Jaques 1990) revealmineral chemistry which would not be considered prospectivefollowing accepted criteria – low-Cr clinopyroxene,lherzolitic (G9) garnets, low-Mg ilmenite (due at Argyle toreplacement of Mg by Mn) and some Al-chromite composi-tions. These features are not confined to lamproites, as thelow-Cr clinopyroxene, diamondiferous Skerring kimberlitedemonstrates and emphasises the importance of applying ob-servations from mineralogies of known diamondiferous bod-ies to regional exploration strategies.
Despite prolific diamond exploration, Western Australia isconsiderably under-explored and the ageing Argyle mine andrecent closure of operations at Ellendale warrant a re-evaluation of diamond potential. Indicator mineral chemistriesreflect mantle sources respectably within the diamond stabilityfield, consistent with diamond and visually-determined indi-cator recovery, known diamondiferous source rocks and min-ing in parts of the State. However, analysis of exploration dataalso draws attention to under-explored areas. As kimberliteand lamproite emplacements span 2500 Ma, there are signif-icant opportunities for diamond-affinity rocks being presentnear surface even within the large, under-explored sedimenta-ry basins overlying thick mantle lithosphere evident through
Diamond exploration and regional prospectivity of Western Australia S751
much of the State. Results of prospectivity analysis make acompelling case for renewed diamond exploration in WA.
Acknowledgements Wayne Taylor, is gratefully acknowledged for hisinvaluable insights regarding mineral chemistry in particular regardingspinels. Bram Janse, Grant Boxer, Mark Mitchell, Tom Reddicliffe,Lynton Jaques, Jim Wright and Stephan Myer are warmly thanked forconsiderable discussion and generous data-sharing from their wealth ofknowledge of WA diamond exploration. All participants in the WA dia-mond explorers’ regular Friday lunches in Subiaco assisted greatly insupporting the progression of this research. Don Flint, WesternAustralian Department of Mines, Industry Regulation and Safety(DMIRS) instigated the project and provided invaluable support at allstages and is very gratefully acknowledged. The manuscript benefittedfrom constructive reviews from AndrewMacdonald andMarty Podolskyand editorial handling by Jarek Jakubec and Lutz Nasdala. This work ispublished with the approval of the Director General of the DMIRS. Thiswork was funded by the West Australian Government’s ExplorationIncentive Scheme.
References
Ahmad M, Scrimgeour IR (2013) Chapter 1: Introduction. In:Ahmad M, Munson TJ (comp) Geology and mineral resourcesof the Northern Territory. Spec Pub, vol 5. Northern TerritoryGeol Surv, Darwin, pp 1:1–1:17
Allsop HL, Bristow JW, Skinner EMW, Scott Smith BH, Danchin RV(1985) Rb–Sr geochronology of some Miocene West Australianlamproites. Trans Geol Soc S Afr 88:341–345
Atkinson WJ, Smith CB, Danchin RV, Janse AJA (1990) Diamond de-posits of Australia. In: Hughes FE (ed) Geology of the mineraldeposits of Australia and Papua New Guinea. Australian Inst MinMetall Mono, vol 14, pp 69–76
Boxer GL, Jaques AL (1990) Argyle (AK1) diamond deposit. In: HughesFE (ed) Geology of themineral deposits of Australia and Papua NewGuinea. Australian Inst Min Metall, Mono, vol 14, pp 697–706
Deakin AS, Boxer GL, Meakins AE, Haebig AE, Lew JH (1989)Geology of the argyle alluvial diamond deposit. In: Ross J et al(eds) Kimberlites and related rocks vol 2 Geol Soc AustraliaSpec Pub vol 14. Blackwell, Scientific Publications, Carlton,pp 1108–1116
Downes PJ, Griffin BJ, Griffin WL (2007) Mineral chemistry and zircongeochronology of xenocrysts and altered mantle and crustal xeno-liths from the Aries micaceous kimberlite: constraints on the com-position and age of the Central Kimberley Craton, WesternAustralia. Lithos 93:175–198
Edwards D, Rock NMS, Taylor WR, Griffin BJ, Ramsay RR (1992)Mineralogy and petrology of the Aries diamondiferous kimber-lite pipe, Central Kimberley Block, Western Australia. J Petrol33:1157–1191
Fishwick S, Kennett BLN, Reading AM (2006) Contrasts in lithosphericstructure within the Australian craton— insights from surface wavetomography. Earth Planet Sci Lett 231:163–176
Geological Survey ofWestern Australia (2018) Diamond exploration andprospectivity of Western Australia, 2018: Digital data package.Available at http://dmpbookshop.eruditetechnologies.com.au/product/diamond-exploration-and-prospectivity-of-western-australia.do
Graham S, Lambert D, Shee SR, Smith CB, Reeves S (1999a) Re–Osisotopic evidence for Archean lithospheric mantle beneath theKimberley block, Western Australia. Geology 27:431–434
Graham S, Lambert DD, Shee SR, Smith CB, Hamilton R (1999b) Re–Osand Sm–Nd isotopic constraints on the sources of kimberlites and
melnoites, Earaheedy Basin, Western Australia. In: Gurney JJ et al(eds) Proceedings of the VIIth International Kimberlite Conferencevol 1. Red Roof Design, Cape Town, pp 280–290
Graham S, Lambert D, Shee S (2004) The petrogenesis of carbonatite,melnoite and kimberlite from the Eastern Goldfields Province,Yilgarn Craton. Lithos 76:519–533
Griffin WL, Jaques AL, Sie SH, Ryan CG, Cousens DR, Suter GF(1988) Conditions of diamond growth: a proton microprobestudy of inclusions in West Australian diamonds. ContribMineral Petrol 99:143–158
Groom FF (1896) Report of a visit to Nullagine, Pilbara District, toexamine the country reported to be diamond yielding. Dep MinesWestern Australia Annu Rep 1895:27
Grütter HS, Apter DB (1998) Kimberlite- and lamproite-borne chromitephenocrysts with diamond-inclusion-type chemistries. In: Gurney JJet al. (eds) Extended Abstracts of the VIIth International KimberliteConference. VIIth IKC, pp 280–282
Grütter HS, Tuer J (2009) Constraints on deep mantle tenor of Sarfartoq-area kimberlites (Greenland), based on modern thermobarometry ofmantle-derived xenocrysts. Lithos 112S:124–129
Grütter HS, Gurney JJ, Menzies AH, Winter F (2004) An updated clas-sification scheme for mantle-derived garnet, for use by diamondexplorers. Lithos 77:841–857
Haggerty SE (1994) Diamond genesis in a multiply-constrained model.Nature 320:34–38
Haggerty SE (1999) A diamond trilogy: Superplumes, supercontinents,and supernovae. Science 285:851–860
Hamilton R, Rock NMS (1990) Geochemistry, mineralogy and pe-trology of a new find of ultramafic lamprophyres from BulljahPool, Nabberu Basin, Yilgarn Craton, Western Australia. Lithos24:275–290
Helmstaedt HH, Gurney JJ (1995) Geotectonic controls of primary dia-mond deposits: implications for area selection. J Geochem Explor53:125–144
Hutchison MT (2011) Northern Territory diamond exploration database.Northern Territory Geol Surv Digital Info Package DIP 011.Available at http://www.geoscience.nt.gov.au/gemis/ntgsjspui/handle/1/81750
Hutchison MT (2013) Diamond exploration and Regional Prospectivityof the Northern Territory of Australia. In: Pearson DG et al. (eds)Proceedings of 10th International Kimberlite Conference, vol 2.Spec Issue J Geol Soc India. Geol Soc India, pp 257–280
Hutchison, MT (2018a) Data methodologies applied in the WesternAustralian diamond exploration package. Record, vol 2017/16.Geol Surv Western Australia, Perth, 24 p
Hutchison, MT (2018b) Diamond exploration and prospectivity ofWestern Australia. Geol Surv Western Australia, Perth, Report179, 70 p
Januszczak N, Seller MH, Kurszlaukis S, Murphy C, Delgaty J, Tappe S,Ali K, Zhu J, Ellemers P (2013) A multidisciplinary approach to theAttawapiskat Kimberlite Field, Canada: accelerating the discovery-to-production pipeline. In: Pearson DJ et al (eds) Proceedings of the10th International Kimberlite Conference, vol 2. Springer, NewDelhi, pp 157–171
Jaques AL (2016)Major and trace element variations in oxide and titanateminerals in the West Kimberley lamproites, Western Australia.Mineral Petrol 110:159–197
Jaques AL, Webb AW, Fanning CM, Black LP, Pidgeon RT, Ferguson J,Smith CB, Gregory GP (1984a) The age of the diamond bearingpipes and associated leucite lamproite pipes of the West Kimberleyregion, Western Australia. BMRJ Australia Geol Geophys 9:1–7
Jaques AL, Lewis JD, Smith CB, Gregory GP, Ferguson J, Chappell BW,McCulloch MT (1984b) The diamond-bearing ultrapotassic(lamproitic) rocks of the West Kimberley region, WesternAustralia. In: Kornprobst J (ed) Kimberlites I: kimberlites and relat-ed rocks. Dev Petrol, Elsevier, Amsterdam, pp 225–254
M. T. HutchisonS752

Jaques AL, O’Neill HS-C, Smith CB, Moon J, Chappell BW (1990)Diamondiferous peridotite xenoliths from the Argyle (AK1)lamproite pipe, Western Australia. Contrib Mineral Petrol 104:255–276
Jourdan F, Thern E, Wilde SA, Frewer L (2012) 40Ar/39Ar dating ofunusual minerals (tourmaline, K-richterite, yimengite, wadeite andpriderite) and applicability to the geological record. Geophys ResAbstr 14:EGU2012–EGU6858
Kennett BLN, Salmon M, Saygin E, AusMoho Working Group (2011)AusMoho: the variation of Moho depth. Australia Geophys J Int187:946–958
Kennett BLN, Fichtner A, Fishwick S, Yoshizawa K (2013) AustralianSeismological Refence Model (AuSREM): mantle component.Geophys J Int 192:871–887
Killar J (1972) Ocean Ventures Pty Limited, Edel No. 1,Well CompletionReport; Basic & Interpretive Data. Geol SurvWestern Australia StatPetroleum Exploration Rep, Petroleum Archive ID W 727 A1 —Primary Relation W000834 (unpublished report)
Liu L-g, Mernagh TP, Jaques AL (1990) A mineralogical Raman spec-troscopy study of eclogitic garnet inclusions in diamonds fromArgyle. Contrib Mineral Petrol 105:156–161
Lucas H, Ramsay RR, Hall AE, Smith CB, Sobolev NV (1989) Garnetsfrom West Australian kimberlites and related rocks. In: Ross J et al(eds) Kimberlites and related rocks vol 2 Geol Soc Australia SpecPub vol 14. Blackwell, Scientific Publications, Carlton, pp 809–819
Luguet A, Jaques AL, Pearson DG, Smith CB, Bulanova GP, Roffey SL,RaynerMJ, Lorand J-P (2009) An integrated petrological, geochem-ical and Re–Os isotope study of peridotite xenoliths from the Argylelamproite, Western Australia and implications for cratonic diamondoccurrences. Lithos 112S:1096–1108
Martin, DMcB, Hocking, RM, Riganti, A, Tyler, IM (2016) 1:10 000 000tectonic units of Western Australia, 2016. Geol Surv WesternAustralia, digital data layer. http://www.dmp.wa.gov.au/geoview.Accessed 15 November 2017
Matchan E, Hergt J, Phillips D, Shee S (2009) The geochemistry, petro-genesis and age of an unusual alkaline intrusion in the westernPilbara craton, Western Australia. Lithos 112S:419–428
McMartin I, McClenaghan MB (2001) Till geochemistry and samplingtechniques in glaciated shield terrain: a review. In: McClenaghanMB, Bobrowsky PT, Hall GEM, Cook SJ (eds) Drift explorationin glaciated terrain. Geol Soc Spec Publ, vol 185, pp 19–83
Mitchell RH (1986) Kimberlites mineralogy, geochemistry and petrology.Plenum Press, New York 441 p
Muggeridge MT (1995) Pathfinder sampling techniques for locating pri-mary sources of diamond: recovery of indicator minerals, diamondsand geochemical signatures. J Geochem Explor 53:183–204
Nixon PH, Thirwall MF, Buckley F, Davies CJ (1984) Spanish andWestern Australian lamproites: aspects of whole rock chemistry.In: Kornprobst J (ed) Kimberlites I: kimberlites and related rocks.Dev Petrol, Elsevier, Amsterdam, pp 285–296
Nixon PH, Boyd FR, Lee DC (1987) Western Australia – xenoliths fromkimberlites and lamproites. In: Nixon PH (ed) Mantle xenoliths.Wiley, Chichester, pp 283–286
O’Neill CJ, Moresi L, Jaques AL (2005) Geodynamic controls on dia-mond deposits: implications for Australian occurrences.Tectonophysics 404:217–236
Phillips D, Fourie LF, Kiviets, GB (1997) 40Ar/39Ar laser probe analysisof groundmass phlogopite grains from the Jewill kimberlite YilgarnCraton, Western Australia. Anglo American Research Laboratories(unpublished report)
Phillips D, Clarke W, Jaques AL (2012) New 40Ar/39Ar ages for theWestKimberley lamproites and implications for Australian plate
geodynamics. In: Extended Abstracts of the 10th InternationalKimberlite Conference. 10IKC, Bangalore, India, pp 104
Pidgeon RT, Smith CB, Fanning CM (1989) Kimberlite and lamproiteemplacement ages in Western Australia. In: Ross J et al (eds)Kimberlite and related rocks. Volume 1. Their composition, occur-rence, origin and emplacement, vol. 14. Geol Soc Australia SpecPubl, pp 369–381
Ramsay RR (1992) Geochemistry of diamond indicator minerals.Department of Geology and Geophysics, University of WesternAustralia PhD thesis (unpublished)
Ramsay RR, Tompkins LA (1994) The geology, heavy mineral concen-trate mineralogy, and diamond prospectivity of the Boa Eperançaand Cana Verde Pipes, Corrego D'Anta, Minas Gerais, Brazil.Companhia de Pesquisa de Recursos Minerais–CPRM Spec Publ1B Jan/94:329–345
Reddicliffe TH (1999)Merlin Kimberlite Field Batten Province, NorthernTerritory. Department of Geology and Geophysics, University ofWestern Australia, Perth, MSc thesis (unpublished) 221 pp and 3appendices
Reddicliffe TH, Jakimowicz J, Hell A, Robins J (2003) The geology,mineralogy and near-surface characteristics of the Ashmore andSeppelt kimberlite clusters, North Kimberley Province, Australia.Ext Abs 8th Int Kimberlite Conf FLA_0139
Robey JVA, Bristow JW, Marx MR, Joyce J, Danchin RV, Arnott F(1989) Alkaline ultrabasic dikes near Norseman. In: Ross J et al.(eds) Kimberlite and related rocks. Volume 1. Their composition,occurrence, origin and emplacement, vol. 14. Geol Soc AustraliaSpec Publ, pp 382–391
Roffey S, Bishop S (2005) First annual report for the period ending 26May 2005, E80/3166 Kurrajong, Argyle Orbit Programme,Lissadell SE52–02, Western Australia, Kimberley Mineral FieldGeol Surv Western Australia, Stat Min Expl Rep A71011 (unpub-lished report), 14 pp
Shee SR, Vercoe SC, Wyatt BA, Hwang PH, Campbell AN, Colgan EA(1999) Discovery and geology of the Nabberu Kimberlite Province,Western Australia. In: Gurney JJ et al. (eds) Proceedings of the VIIthInternational Kimberlite Conference vol 2. Red Roof Design, CapeTown, pp 764–772
TaylorWR, Jaques AL, RiddM (1990) Nitrogen-defect aggregation char-acteristics of some Australasian diamonds: time-temperature con-straints on the source regions of pipe and alluvial diamonds. AmMineral 75:1290–1310
Towie NJ (2004) Hamersley Project Annual Mineral Exploration Report.Geol Surv Western Australia, Stat Min Expl Rep, A68110 (unpub-lished report), 120 p
White B (2000) The geochronology and thermochronology of theBrockman Creek 01, Melita and Melita 02 kimberlites, WesternAustralia. Hons. Research Report, University ofMelbourne (unpub-lished report)
White SH, de Boorder H, Smith CB (1995) Structural controls of kim-berlite and lamproite emplacement. J Geochem Explor 53:245–264
Wyatt BA, Sumpton JDH, Stiefenhofer J, Shee SR, Smith TW (1999)Kimberlites in the Forrest River area, Kimberley Region, WesternAustralia. In: Gurney JJ et al. (eds) Proceedings of the VIIthInternational Kimberlite Conference vol 1. Red Roof Design, CapeTown, 912–922
Wyatt BA, Baumgartner M, Anckar E, Grütter H (2004) Compositionalclassification of "kimberlitic" and "nonkimberlitic" ilmenite. Lithos77:819–840
Yaxley G (2008) Technique for the discrimination of diamond indicatorchromites from those of other provenance, based on major, minorand trace element analysis. Northern Territory Geol Surv, Open FileCompany Rep, CR2008-0177 (unpublished report), Appendix 1
Diamond exploration and regional prospectivity of Western Australia S753